Neural dynamics of envelope coding - … · Low noise and peri-threshold stimulation are necessary...
13
Neural dynamics of envelope coding Andre ´ Longtin a,b,c, * , Jason W. Middleton a,b,c , Jakub Cieniak a,b , Leonard Maler a,c a Center for Neural Dynamics, University of Ottawa, Ottawa, Canada b Physics Department, University of Ottawa, MacDonald Hall, 150 Louis-Pasteur, Ottawa, Ont., Canada K1N 6N5 c Department of Cellular and Molecular Medicine, University of Ottawa, 451 Smyth Road, Ottawa, Canada Received 5 December 2007; received in revised form 20 January 2008; accepted 25 January 2008 Available online 14 February 2008 Abstract We consider the processing of narrowband signals that modulate carrier waveforms in sensory systems. The tuning of sensory neurons to the carrier frequency results in a high sensitivity to the amplitude modulations of the carrier. Recent work has revealed how specialized circuitry can extract the lower-frequency modulation associated with the slow envelope of a narrowband signal, and send it to higher brain along with the full signal. This paper first summarizes the experimental evidence for this processing in the context of electrorecep- tion, where the narrowband signals arise in the context of social communication between the animals. It then examines the mechanism of this extraction by single neurons and neural populations, using intracellular recordings and new modeling results contrasting envelope extraction and stochastic resonance. Low noise and peri-threshold stimulation are necessary to obtain a firing pattern that shows high coherence with the envelope of the input. Further, the output must be fed through a slow synapse. Averaging networks are then con- sidered for their ability to detect, using additional noise, signals with power in the envelope bandwidth. The circuitry that does support envelope extraction beyond the primary receptors is available in many areas of the brain including cortex. The mechanism of envelope extraction and its gating by noise and bias currents is thus accessible to non-carrier-based coding as well, as long as the input to the circuit is a narrowband signal. Novel results are also presented on a more biophysical model of the receptor population, showing that it can encode a narrowband signal, but not its envelope, as observed experimentally. The model is modified from previous models by reducing stimulus contrast in order to make it sufficiently linear to agree with the experimental data. Ó 2008 Elsevier Inc. All rights reserved. Keywords: Neural coding; Integrate-and-fire model; Hilbert transform; Coherence; Electroreceptors; Stochastic resonance 1. Introduction Many senses receive input in the form of amplitude or phase modulated carrier signals. This is the case for audi- tory systems throughout the animal kingdom. It is also the case for primary receptors in the electric sense of weakly electric fish [27]. The close similarity of coding prin- ciples between the electrosensory and auditory systems has been discussed in the literature [6]. For example, in the auditory system, the primary auditory receptors are tuned to specific carrier frequencies. Information about stimuli is relayed to higher brain via both the frequency content, i.e. which carriers are present, and the time-varying modula- tions of the amplitude and phase of these carriers. The elec- trosensory system is essentially a simplified version of the auditory system when the fish is alone, since the receptors are driven by only one carrier. However, in the presence of other fish, the situation resembles the auditory system even more, in that different carriers are present along with their respective modulations. While we focus herein on processing in the electrosenso- ry system, the principles and mechanisms outlined below are applicable to other sensory systems where carriers are involved, as well as systems without carriers. These electric fish have a specialized organ in the tail that generates a 0025-5564/$ - see front matter Ó 2008 Elsevier Inc. All rights reserved. doi:10.1016/j.mbs.2008.01.008 * Corresponding author. Address: Physics Department, University of Ottawa, MacDonald Hall, 150 Louis-Pasteur, Ottawa, Ont., Canada K1N 6N5. E-mail address: [email protected] (A. Longtin). www.elsevier.com/locate/mbs Available online at www.sciencedirect.com Mathematical Biosciences 214 (2008) 87–99
-
Upload
nguyenkhue -
Category
Documents
-
view
213 -
download
0
Transcript of Neural dynamics of envelope coding - … · Low noise and peri-threshold stimulation are necessary...

Available online at www.sciencedirect.com
www.elsevier.com/locate/mbs
Mathematical Biosciences 214 (2008) 87–99
Neural dynamics of envelope coding
Andre Longtin a,b,c,*, Jason W. Middleton a,b,c, Jakub Cieniak a,b, Leonard Maler a,c
a Center for Neural Dynamics, University of Ottawa, Ottawa, Canadab Physics Department, University of Ottawa, MacDonald Hall, 150 Louis-Pasteur, Ottawa, Ont., Canada K1N 6N5
c Department of Cellular and Molecular Medicine, University of Ottawa, 451 Smyth Road, Ottawa, Canada
Received 5 December 2007; received in revised form 20 January 2008; accepted 25 January 2008Available online 14 February 2008
Abstract
We consider the processing of narrowband signals that modulate carrier waveforms in sensory systems. The tuning of sensory neuronsto the carrier frequency results in a high sensitivity to the amplitude modulations of the carrier. Recent work has revealed how specializedcircuitry can extract the lower-frequency modulation associated with the slow envelope of a narrowband signal, and send it to higherbrain along with the full signal. This paper first summarizes the experimental evidence for this processing in the context of electrorecep-tion, where the narrowband signals arise in the context of social communication between the animals. It then examines the mechanism ofthis extraction by single neurons and neural populations, using intracellular recordings and new modeling results contrasting envelopeextraction and stochastic resonance. Low noise and peri-threshold stimulation are necessary to obtain a firing pattern that shows highcoherence with the envelope of the input. Further, the output must be fed through a slow synapse. Averaging networks are then con-sidered for their ability to detect, using additional noise, signals with power in the envelope bandwidth. The circuitry that does supportenvelope extraction beyond the primary receptors is available in many areas of the brain including cortex. The mechanism of envelopeextraction and its gating by noise and bias currents is thus accessible to non-carrier-based coding as well, as long as the input to thecircuit is a narrowband signal. Novel results are also presented on a more biophysical model of the receptor population, showing thatit can encode a narrowband signal, but not its envelope, as observed experimentally. The model is modified from previous models byreducing stimulus contrast in order to make it sufficiently linear to agree with the experimental data.� 2008 Elsevier Inc. All rights reserved.
Keywords: Neural coding; Integrate-and-fire model; Hilbert transform; Coherence; Electroreceptors; Stochastic resonance
1. Introduction
Many senses receive input in the form of amplitude orphase modulated carrier signals. This is the case for audi-tory systems throughout the animal kingdom. It is alsothe case for primary receptors in the electric sense ofweakly electric fish [27]. The close similarity of coding prin-ciples between the electrosensory and auditory systems hasbeen discussed in the literature [6]. For example, in theauditory system, the primary auditory receptors are tuned
0025-5564/$ - see front matter � 2008 Elsevier Inc. All rights reserved.
doi:10.1016/j.mbs.2008.01.008
* Corresponding author. Address: Physics Department, University ofOttawa, MacDonald Hall, 150 Louis-Pasteur, Ottawa, Ont., Canada K1N6N5.
E-mail address: [email protected] (A. Longtin).
to specific carrier frequencies. Information about stimuli isrelayed to higher brain via both the frequency content, i.e.which carriers are present, and the time-varying modula-tions of the amplitude and phase of these carriers. The elec-trosensory system is essentially a simplified version of theauditory system when the fish is alone, since the receptorsare driven by only one carrier. However, in the presenceof other fish, the situation resembles the auditory systemeven more, in that different carriers are present along withtheir respective modulations.
While we focus herein on processing in the electrosenso-ry system, the principles and mechanisms outlined beloware applicable to other sensory systems where carriers areinvolved, as well as systems without carriers. These electricfish have a specialized organ in the tail that generates a

88 A. Longtin et al. / Mathematical Biosciences 214 (2008) 87–99
quasi-sinusoidal discharge throughout the life of the ani-mal. The frequency of this electric organ discharge, orEOD, is very stable. The resulting oscillating field causesan oscillating voltage drop across the apical membrane ofthe specialized cutaneous ‘‘tuberous” receptors, which inturn drives neurotransmitter release onto afferent nerves.The resulting discharge pattern in these nerves is calledthe spontaneous (or baseline) activity because this situationcorresponds to baseline conditions.
Distorsions of the amplitude and/or phase of this fieldcaused by stimuli alter the baseline voltage oscillations,which in turn perturb the spontaneous discharge of thereceptors [3,18]. This is ‘‘active” electrolocation, in contrastto passive electroreception that relies on ampullary recep-tors which many fish possess (including extraordinary sen-sitive ones as in the shark). The challenge is to understandhow this basic active mode of sensation can allow a ner-vous system to encode and respond to a range of differentstimuli, all of which must go through the electroreceptors.The eyes are of little use since they are nocturnal and live inturbid waters, and they can perform these tasks withoutvision. In other words, these receptors are the front end,and must deal with all incoming signals. The next layerof cells, known as pyramidal cells, then do the triage onthese inputs, sending the appropriate features to the appro-priate structures, with the help of interneurons as we willsee.
This paper focusses on one mechanism that rises to thetask of deciphering mixtures of signals: envelope extractionfrom narrowband signals. We discuss the biophysicalmechanisms that underlie this extraction, and how it relatesto single cell properties such as mean firing-vs-input bias(f–I) characteristics and noise level. We show how circuitrycan convey a narrowband signal from one station to thenext along with its associated low frequency envelope.The relation between this mechanism and suprathreshold/subthreshold firing, and ghost stochastic resonance in par-ticular [10], is examined. The circuitry needs a cell thatresponds to the frequencies in the narrowband, but funnelsits output through a lowpass inhibitory synapse. Such cir-cuitry is found in many areas of cortex, and may explainour ability to extract, and thus perceive, higher order fea-tures from narrowband signals, such as those associatedwith superposition of gratings in the visual system [2,19]or speech recognition [15,23].
We further discuss how this envelope extraction andtransmission can be gated by the noise and the bias. Sincethe extraction leads to power at low frequency, the ques-tion arises as to whether this power acts as a baseline noisethat masks another signal – such as a prey – that has powerin the same band as the extracted envelope. The analysis ofthis situation, carried out in detail here, leads to an interest-ing effect of signal-to-noise enhancement by noise in thecontext of an averaging network of such cells. This effectis different from stochastic resonance, since it is seen fora range of values around threshold. Finally we considerextraction in an even more biophysically realistic context,
namely by simulating the behavior of the afferents. As wewill see, these spike trains have special noise-reducing prop-erties at low frequencies, due to correlated firing seen ineach cell.
The paper is organized as follows. Section 2 explainshow different time scales of signals can arise using the elec-trosensory system, and provides background on the cir-cuitry of this sensory system and its response to thesesignals of different time scales. Section 3 summarizes exper-iments and analyses of envelope extraction in this sense,after defining input-output coherence and Hilbert trans-forms. Section 4 discusses this mechanism in the contextof a leaky integrate-and-fire model (LIF) with narrowbandinput, and shows the ranges of important parameters thatallow extraction (‘‘envelope gating”). Gating is didacticallyreviewed and further analyzed in the context of an averag-ing network of cells. It is important to realize that our anal-yses go beyond calculating transmission or extraction ofsignals using spectral measures, since they rely on coher-ence calculations, which can be used to provide a lowerbound on rates of mutual information transmission.Finally, we present more biophysically realistic computa-tional results of stimulus and envelope coding in the affer-ents, a first step in modeling the process up to thepyramidal cells and beyond.
2. Multiple time scales of stimuli
It is possible to illustrate the challenges that face sensorysystems with carriers by focussing on electroreception. Fur-ther, understanding how the different signals are extractedin a carrier-based sense can yield principles for non-carrier-based senses too, such as vision [19,20]. In the electrosenso-ry context there are different classes of stimuli. Prey andnavigational cues such as rocks and plants provide low fre-quency (<20 Hz) input to the receptors. Tail bending, fin,gill and other body motions also fall in that range. Thenthere are social cues. When two fish are in the vicinity ofone another, they each perceive a beat pattern that resultsfrom the superposition of the EOD’s. The beat frequency isequal to the difference of the two EOD frequencies. In thebrown ghost knife fish (Apteronotus Leptorhynchus) theEOD is in the range of 500–750 Hz for females, and 800–1000 Hz for males. The presence of a beat signifies to eachfish that another fish is present, and its frequency informsabout the gender. This can lead to a change in the EOD fre-quencies according to a protocol known as the jammingavoidance response (JAR) which varies across the multi-tude of weakly electric fish species [14].
The next level of complexity involves active communica-tion signals, in which the fish briefly modulate their EODfrequency. Same-gender interactions lead to so-called small
chirps in the brown ghost, which are 20 ms increases inEOD frequency with little changes in EOD amplitude.Cross-gender interactions produce large chirps, of similarduration, but which are large increases in EOD frequencywith a concomitant collapse in EOD amplitude [4].

A. Longtin et al. / Mathematical Biosciences 214 (2008) 87–99 89
Finally, there is the situation where many fish swim inthe same area. It has been shown that they prefer to swimaround in small groups of 6–8 individuals under naturalconditions (Eric S. Fortune, personal communication).This leads to a superposition of 6–8 EOD’s with time-vary-ing amplitudes at the surface of each fish. Spectrograms ofthese signals show that they are narrowband, i.e. possessspectral power at all the differences of frequencies presentin the mix. Strictly speaking, this power appears as side-bands of the EOD’s, but we will neglect the EOD’s forthe sake of discussion and concentrate on these lower dif-ference-frequencies. In fact, the high frequency EOD’sare not transmitted, but leave their imprint in phase lock-ing in the afferents and a certain subset of their projectioncells (the deep basilar pyramidal cells).
The combination of difference-frequencies is an exampleof a narrowband signal, and it represents the basic ‘‘cock-tail party” that the fish must decipher (see Fig. 1) –although it seemingly is further complicated by chirps,which we do not address here. Further, such narrowbandmixtures have even slower amplitude-modulation compo-nents, which as we will see can be extracted by the Hilberttransform. For example, a 40–60 Hz narrowband Gaussiannoise will display amplitude modulations in the 0–20 Hzrange. This is a property of any narrowband signal, inde-pendent of whether this signal arose from beats betweenhigh frequency components (such as EOD’s in the electro-sensory context). In contrast, the singular narrowband caseof a single harmonic signal (e.g. a fish alone) does not showthis amplitude modulation (instead it has constant ampli-tude), while a broadband signal does not have a well-defined slower modulation either.
Of course, the natural environment where fish are navi-gating, eating and interacting with other fish provides anatural mixture of all the cases above. Not only are the fishsubjected to a cocktail party effect due to their proximity,but they also see other confounding signals that presum-ably limit their ability to separate out stimuli. Understand-ing the neural circuitry that implements this separation iswithin reach, and holds great promise for helping humansfaced with similar challenges when they have sensoryimpairments.
Fig. 1. A sample realization of 40–60 Hz Gaussian noise (blue) will give an envare shown on the right in the bottom and top panels, respectively. (For interpreto the web version of this article.)
3. Experimental envelope extraction
3.1. Methods
The signals we are interested in coding are narrowband(e.g. 40–60 Hz) amplitude modulation of the EOD. Ourapproach [20,21] consists in quantifying the linearity ofthe encoding of (1) the direct narrowband power into thespike train, and (2) the envelope of this waveform(extracted using the Hilbert transform) into the spike train.The coherence CXY(f) between an input signal X and anoutput signal Y is used to quantify this encoding. It is afunction of frequency and varies between 0 for no linearencoding and 1 for perfect linear encoding:
CXY ðf Þ ¼j SXY ðf Þj2
SXX ðf ÞSYY ðf Þ; ð1Þ
where SXY is the cross-spectral density between X and Y,and SXX and SYY is the autospectral density of X and Y,respectively. In our context, the input is an analog narrow-band stimulus S(t) and the output is the spike train of thecell or model,
RðtÞ ¼X
i
dðt � tiÞ; ð2Þ
where the sum is over all the spike times. This leads to thestimulus–response (S–R) coherence CSR. We will also con-sider the envelope–response (E–R) coherence CER betweenthe envelope of the stimulus E(t) and the spike train re-sponse, R(t). We note that the cross-spectrum is relatedto the perhaps more familiar transfer function. However,the coherence further divides by the power of the outputand thus is similar to a signal-to-noise ratio. It can be re-lated simply to a lower bound measure of mutualinformation.
The envelope of the stimulus is extracted via the analyticsignal technique, which associates with a real signal x(t) animaginary part y(t); this latter part contains componentsphase shifted by 90� using the Hilbert transform H[x(t)][23,20,13]:
elope (red) with power in the 0–20 Hz range. Their power spectral densitiestation of the references to colour in this figure legend, the reader is referred

90 A. Longtin et al. / Mathematical Biosciences 214 (2008) 87–99
yðtÞ � H ½xðtÞ� ¼ 1
pPZ 1
�1
xðsÞt � s
ds; ð3Þ
where P means the Cauchy principal value. In the case ofthe narrowband signals that we use, the radial componentof the corresponding analytic signal has an intuitive inter-
pretation. This component is AðtÞ ¼ffiffiffiffiffiffiffiffiffiffiffiffiffiffiffiffiffiffiffiffiffiffiffiffiffix2ðtÞ þ y2ðtÞ
p, and
represents the instantaneous amplitude or ‘‘signal enve-lope” that arises from the interference of spectral compo-nents with similar frequencies. It is this amplitude thatforms the envelope signal.
3.2. Direct and indirect pathways
The first stages of the electrosensory pathway are orga-nized as follows. The electrorereptors are spread all overthe body of the fish; homology to the sense of touch is obvi-ous. They are more concentrated in the head region, whichhas been designated as the electrosensory fovea, althoughfrom measurements and modeling of the electric field linesaround the body it is not clear whether the resolution isactually higher there than in the midbody region [1]. Theafferents that innervate the receptor cells excite pyramidalcells in the electrosensory lateral line lobe (ELL). Fromthere these excite the torus semi-circularis (TS), as well asthe nucleus pre-eminentialis (Np) [5]. The latter feeds backto ELL (direct feedback) via both excitatory and inhibitorypathways. The torus massively feeds back to Np (the polar-ity of this connection is not fully established), which feedsback to ELL as we have just mentioned. Np also excites thecerebellar structure known as the EGP, which feeds back toELL (indirect feedback) again via both excitatory andinhibitory pathways. The projections from receptors toELL are spatially topographic. A local stimulus such as aprey affects a small part of the skin by causing field line dis-torsions (if its impedance differs from that of the water);this in turn affects a few pyramidal cells. A global stimulussuch as a beat and other communication signals affects allreceptors and thus pyramidal cells, though not equally.
Fig. 2. A sample of the 40–60 Hz amplitude modulation given to an electric fiELL.
These receptor-to-ELL feedforward projections will bereferred to as direct projections.
The receptors also excite interneurons know as ovoidcells. These cells have very large receptive fields, meaningthat their firing rate changes only when global stimulichange. These ovoid cells display very good S–R coherenceCSR(f) up to high frequencies (200 Hz or so when 0–200 Hzmodulations are given), which suggests that they are madeto process broadband input. Fig. 2 shows a spike trainmeasured in vivo from an ovoid cell in response to a nar-rowband 40–60 Hz modulation of the EOD. As mentionedearlier in relation to Fig. 1, we see here that such inputactually has a well-defined mean frequency, and a slowerrandom ‘‘envelope” modulation. Spikes tend to occur onthe crests of this input, as well as on crests of the envelope.
When given narrowband input such as 40–60 Hz, itshows very good S–R coherence in this range (and ofcourse approximately zero coherence outside this range).It turns out that this cell also has excellent E–R coherenceCER under the same conditions. The data, not shown, aresimilar to those shown for a pyramidal cell in Fig. 3. Pyra-midal cells thus show, like ovoids, good S–R and E–Rcoherence, at least for global signals. Interestingly, this isnot the case for the P-unit receptor that projects to boththe ovoid and the pyramidal cell (not shown). These recep-tors behave too linearly (a fact demonstrated in [26,24]) tobe able to extract any envelope, as we will see that thisrequires nonlinearity [20,10].
Where do the pyramidal cells get the ability to respondto the low-frequency envelope of the signal? Not from thereceptor cells, since they do not have this property.Another clue comes from Fig. 4: if the stimulus is local,they lose their ability to respond to the envelope. Andanother clue still: the ovoids project to the pyramidal cells,although through a slow GABAB inhibitory synapse. Sucha projection has been considered paradoxical, since theovoids can respond to very high frequencies, but certainlycan not transmit high-frequency information through sucha slow bottleneck. The conclusion is that the ovoids actu-ally extract the envelope, which allows them to have goodE–R coherence. They further pass on the slow envelope to
sh (bottom) and the spike train response of an ovoid cell recorded in the
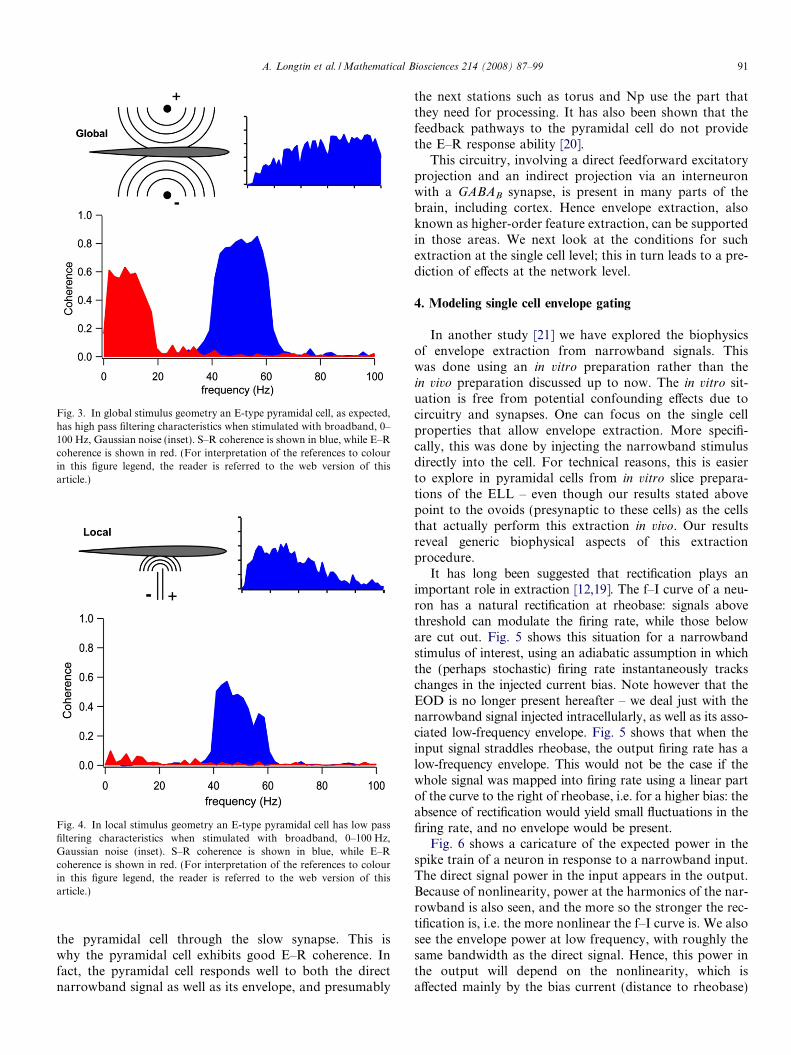
Fig. 3. In global stimulus geometry an E-type pyramidal cell, as expected,has high pass filtering characteristics when stimulated with broadband, 0–100 Hz, Gaussian noise (inset). S–R coherence is shown in blue, while E–Rcoherence is shown in red. (For interpretation of the references to colourin this figure legend, the reader is referred to the web version of thisarticle.)
Fig. 4. In local stimulus geometry an E-type pyramidal cell has low passfiltering characteristics when stimulated with broadband, 0–100 Hz,Gaussian noise (inset). S–R coherence is shown in blue, while E–Rcoherence is shown in red. (For interpretation of the references to colourin this figure legend, the reader is referred to the web version of thisarticle.)
A. Longtin et al. / Mathematical Biosciences 214 (2008) 87–99 91
the pyramidal cell through the slow synapse. This iswhy the pyramidal cell exhibits good E–R coherence. Infact, the pyramidal cell responds well to both the directnarrowband signal as well as its envelope, and presumably
the next stations such as torus and Np use the part thatthey need for processing. It has also been shown that thefeedback pathways to the pyramidal cell do not providethe E–R response ability [20].
This circuitry, involving a direct feedforward excitatoryprojection and an indirect projection via an interneuronwith a GABAB synapse, is present in many parts of thebrain, including cortex. Hence envelope extraction, alsoknown as higher-order feature extraction, can be supportedin those areas. We next look at the conditions for suchextraction at the single cell level; this in turn leads to a pre-diction of effects at the network level.
4. Modeling single cell envelope gating
In another study [21] we have explored the biophysicsof envelope extraction from narrowband signals. Thiswas done using an in vitro preparation rather than thein vivo preparation discussed up to now. The in vitro sit-uation is free from potential confounding effects due tocircuitry and synapses. One can focus on the single cellproperties that allow envelope extraction. More specifi-cally, this was done by injecting the narrowband stimulusdirectly into the cell. For technical reasons, this is easierto explore in pyramidal cells from in vitro slice prepara-tions of the ELL – even though our results stated abovepoint to the ovoids (presynaptic to these cells) as the cellsthat actually perform this extraction in vivo. Our resultsreveal generic biophysical aspects of this extractionprocedure.
It has long been suggested that rectification plays animportant role in extraction [12,19]. The f–I curve of a neu-ron has a natural rectification at rheobase: signals abovethreshold can modulate the firing rate, while those beloware cut out. Fig. 5 shows this situation for a narrowbandstimulus of interest, using an adiabatic assumption in whichthe (perhaps stochastic) firing rate instantaneously trackschanges in the injected current bias. Note however that theEOD is no longer present hereafter – we deal just with thenarrowband signal injected intracellularly, as well as its asso-ciated low-frequency envelope. Fig. 5 shows that when theinput signal straddles rheobase, the output firing rate has alow-frequency envelope. This would not be the case if thewhole signal was mapped into firing rate using a linear partof the curve to the right of rheobase, i.e. for a higher bias: theabsence of rectification would yield small fluctuations in thefiring rate, and no envelope would be present.
Fig. 6 shows a caricature of the expected power in thespike train of a neuron in response to a narrowband input.The direct signal power in the input appears in the output.Because of nonlinearity, power at the harmonics of the nar-rowband is also seen, and the more so the stronger the rec-tification is, i.e. the more nonlinear the f–I curve is. We alsosee the envelope power at low frequency, with roughly thesame bandwidth as the direct signal. Hence, this power inthe output will depend on the nonlinearity, which isaffected mainly by the bias current (distance to rheobase)

Fig. 5. A narrowband signal drives the input bias to a neuron nearrheobase. The F–I curve acts as a static transfer function, mapping thesignal to a time-varying firing rate. Under these conditions, the outputfiring rate (top right) is a rectified version of the input (bottom left). Thisenvelope is seen here using a running average of the output rate over thefast time scale (thick line).
Fig. 6. The spectral power of the rate in Fig. 5 contains the samenarrowband frequencies as the input, as well as the low frequencies of theslow time-varying envelope of this input.
Fig. 8. The averaged values of envelope-response (E–R) coherence CER
over the frequency range of the narrowband signal as a function of inputcurrent for D = 0.001 and 0.05. The effect of stochastic resonance (SR) canbe seen for small input bias values, i.e. additional noise increases input–output coherence. Otherwise, additional noise decreases E–R coherence.
92 A. Longtin et al. / Mathematical Biosciences 214 (2008) 87–99
and the noise which linearizes the f–I curve (see e.g. [11]). Alinear system would not produce any output at frequenciesnot present in the input.
Fig. 7. A sample of the 40–60 Hz amplitude given to a LIF neural model (top) aand in the suprathreshold regime (bottom).
We now show how S–R and E–R coherence depend onthese parameters using the leaky integrate-and-fire neuronmodel. This analysis has been shown to explain the exper-imental data from the pyramidal cells with in vitro currentinjection [21]. The model is
sdVdt¼ �V þ I þ
ffiffiffiffiffiffi2Ds
rnðtÞ þ SðtÞ; ð4Þ
where S(t) is the injected narrowband signal and n(t) isGaussian white noise. The S–R coherence averaged overthe frequency range of the narrowband signal for this mod-el follows a sigmoidal shape, increasing from zero to one asthe bias is increased, as expected (see [11,21] and referencestherein). It can be greater than zero even for subthresholdstimuli via noise-induced firing (stochastic resonance oc-curs in this range as we show below).
However, this sigmoidal behavior is not seen for the E–R coherence. Fig. 7 shows two examples of spike trainsfrom this model, one for a bias near threshold, and theother above threshold. In this latter case many firings areseen, but not necessarily in a manner that encodes theamplitude of the envelope into an instantaneous firing rate
nd the spike train responses when the input bias is set at rheobase (middle)

A. Longtin et al. / Mathematical Biosciences 214 (2008) 87–99 93
(i.e. not clearly in a rate-coding manner). Fig. 8 showsrather a unimodal shape of CER as a function of the biascurrent, i.e. as a function of the parameter that sets theoperating point of the neuron (the mean rate). The bestCER occurs near rheobase, where rectification is strong.Below rheobase, there is not much firing to represent anenvelope; above it, the system behaves more linearly, soCER is low. Further, Fig. 8 shows that as the noiseincreases, there is a drop in the quality of the linear encod-ing of the envelope (CER) for suprathreshold biases. On theother hand, an increase is seen for subthreshold biases.This latter effect where coherence increases with noise isstochastic resonance [11]. Together these two effects ofnoise and bias could have been predicted from the resultson ghost stochastic resonance in the context of superposi-tion of two or more harmonics of a signal (but withoutthe fundamental) [10].
Fig. 9 plots CER versus the intensity of the internalnoise, for both a subthreshold and suprathreshold bias.The external stimulus strength is held fixed. In the sub-threshold case, the E–R coherence is insensitive to noisefor lower noise intensities. A resonance is seen for moder-ate noise intensities, and the curve joins up with the one forthe suprathreshold case at higher noise intensities. This sto-chastic resonance seen here for a narrow band of frequen-cies [11] is a consequence of noise-induced firing in thesystem for subthreshold stimuli, such that the noise assistsin coding the input – without noise there would be spikesonly for large positive excursions of the narrowband stim-ulus, and consequently poor representation of this signaland low coherence. We also see a simple monotonic decayof coherence in the suprathreshold bias case, starting fromCER values that are higher than for the subthreshold case.Increasing noise thus removes E–R coherence. The reso-nance reflects what is seen below threshold (leftmost part)
Fig. 9. Coherence between the spiking output and the envelope of thenarrowband input averaged over the frequency range of the band as afunction of noise intensity. The open triangles show the E–R coherencewhen the input of the LIF is set at rheobase (I = 0.1). The monotonicdecreasing property of the ER-coherence in this firing regime shows thatthere is no conventional stochastic resonance (SR). The open circles showthe E–R coherence when the neuron is in the subthreshold regime. Thepeak of ER-coherence between D = 0.01 and D = 0.1 indicates that, asexpected, the system exhibits stochastic resonance in the deep subthresh-old regime.
in Fig. 8, while the monotonic decay reflects the supra-threshold case in Fig. 8.
5. Modeling network envelope gating
5.1. Summing or averaging?
The motivation for this section comes from the observa-tion that the power in the envelope, resulting from theproximity of other fish, lies in the same low frequencyrange as that associated with prey and navigational cues.Consequently, in the presence of other fish, any envelopepower will lower the detectability of such prey and cues.How can these fish detect them when they live alongsideother fish? More generally, one can also ask whether anynew features appear when summing networks are process-ing narrowband input.
Perhaps if the noise level increases, the envelope detec-tion will diminish, lowering the noise floor at low frequen-cies; other signals in that range could then be detectedbetter. This is indeed the case, but only relative to the otherspectral features such as the direct power in the narrow-band range (not shown; see [21]); in absolute terms, thenoise has gone up everywhere because there is just more fir-ings, many of which are uncorrelated with the input. Inother words, adding noise causes the whole spectrum toshift upward. Intuitively, this can be understood by the factthat the high-frequency limit of the spike train power spec-trum is given by the mean firing rate (see e.g. [17]). A stim-ulus of constant strength, such as a 10 Hz sinusoidal signal,would still be hard to detect given the increase in the noisefloor, and thus decrease in the signal-to-noise ratio.
An averaging network would normalize this summedinput by a 1/N factor:
RavgðtÞ ¼1
N
XN
j
Xi
dðt � tjiÞ ð5Þ
where tji is the i-th firing time of the j-th neuron. Such aver-
aging is often assumed in neural network theory (see e.g.[25]). The common assumption is one of synaptic normal-ization, where the strength of a synapse onto a postsynap-tic neuron goes as the inverse of the total number ofsynapses onto this neuron. What then happens to the noisefloor when the spiking outputs are summed and divided byN? Fig. 10 shows the resulting power spectrum of such anaveraged response Ravg(t), obtained using N LIF neuronsin parallel. Each LIF has the same parameters as usedabove, shares the same narrowband input, but has itsown internal noise source nj(t). Spectra are shown fortwo intensities of the intrinsic noise. Note that the bias isat rheobase. For both cases, the spectra show power inthe narrowband, as well as at harmonics of that band,and at the envelope frequencies. This is similar to Fig. 6using the spectral power of the rate of firing (from a singleneuron), rather than the spike train as is used here. But forhigher noise, the envelope power is much reduced, as are

Fig. 10. The power spectral density of the average spike train, Ravg(t),with N = 50 identical LIF neurons with independent uncorrelated noisefor D = 0.005 (dashed line) and D = 0.5 (solid line). The noise floor at lowfrequencies is paradoxically reduced with the addition of intrinsic noise, sothat the power of a small amplitude, low frequency harmonic input (as inFig. 12) is more visible.
Fig. 12. The SNR of the averaged spike train, Ravg(t), measured at thefrequency of the sinusoidal input signal (10 Hz), shows a non-monotonicbehavior as a function of noise intensity, D (solid line). This effect is due tothe noise shaping that results from an increased intrinsic (and uncorre-lated) noise followed by network averaging. This phenomenon is differentthan stochastic resonance, as demonstrated by the SNR curve for thesingle unit with the same parameters (dashed line). There is no strong non-monotonic behaviour of the SNR as a function of noise intensity.
94 A. Longtin et al. / Mathematical Biosciences 214 (2008) 87–99
the harmonics of the narrowband. The stronger noise haslinearized the f–I curve of each cell; these cells are no longerable to produce information at the envelope frequencies.
5.2. Suprathreshold gating resonance
Let us now insert a low frequency signal that falls in theband associated with envelope power. Fig. 11 shows thatthe signal rises above a higher noise floor (lower SNR)when the noise is weak than when it is strong (note thatthe signal peak is the same in both cases). This leads usto vary the noise intensity to see how the SNR behaves.Results are shown for a single neuron and for an averagingnetwork of N = 50 neurons in Fig. 12. Apart from statisti-cal fluctuations, the result for the single cell show a mono-tonically decreasing SNR. This is consistent with Fig. 9,where at rheobase, the increased noise decreases the E–Rcoherence. However, the whole spectrum shifts upwardbecause of the increased firing rate; the net result is anincreased noise floor, and decreasing SNR. However, for
Fig. 11. The power spectral density of the average spike train, Ravg(t),with N = 50 identical LIF neurons with independent uncorrelated noisefor D = 0.005 (solid line) and D = 0.5 (dashed line), in the presence of anadditional low frequency harmonic input at 10 Hz. The noise floor isindicated by the arrow in both cases.
the averaging network, the SNR is non-monotonic as afunction of noise intensity, and there is in fact an optimalnoise to detect the 10 Hz signal. The increased noise washesout the nonlinearity in the f–I curve, reducing envelopepower. Yet the total power of the summed spike trainsincreases because all cells are firing more. Then the averag-ing brings the noise floor back down, and we see a goodsignal detection.
For the single cell, we discussed how noise and bias cur-rent can determine the strength of the envelope power, i.e.how they can gate the presence of the envelope in the out-put. Here, for an averaging network, one finds an optimalnoise to detect a signal in the same band as the envelope.Noise can then gate the strength of this signal componentby getting rid of the competing envelope. This effect isnot stochastic resonance, as it is not limited to subthresh-old inputs, neither for the narrowband nor the harmonicsignal. Rather, it is seen in the neighborhood of rheobasewhere envelopes can be encoded in the first place, i.e. whereE–R coherence is good (Fig. 8).
6. Gating in the presence of realistic synaptic input
Here we begin an investigation into a biophysically morerealistic analysis of envelope gating. Ultimately we wouldlike a model of the whole sensory periphery with the rele-vant circuitry and spiking dynamics. The precise detailsto include should be dictated by the problem under inves-tigation. For envelope gating, it seems important to under-stand how the spiking of the receptor afferents can supportthe envelope extraction, as they are the main vehicle forinformation about the input that is used by the ovoid cells.Specifically, as discussed in Section 3.2, it has been shown[20] that the spike trains from the receptor afferents showgood coherence with the narrowband signal, but not withits envelope.

A. Longtin et al. / Mathematical Biosciences 214 (2008) 87–99 95
The model for a single p-unit electroreceptor afferent isbased on our earlier modeling studies [7] based in part onthe earlier probabilistic model in [22]. The more recentimplementation in [9] was first used because parametersare adjusted in a way that the threshold recovery after spik-ing produces negative correlations between successiveinterspike intervals, and the model displays the properhighpass filtering, without explicitly putting in this filteringas in [22]. The equations read
I iðtÞ ¼ ½SðtÞ þ A0� sinð2pfEODtÞH½ðSðtÞ þ A0Þ sinð2pfEODtÞ�� ½1þ rniðtÞ� ð6Þ
sVdV i
dt¼ �V i þ I i ð7Þ
shdhi
dt¼ h0 � hi ð8Þ
Fig. 13. Simulation (for 100 s) of baseline P-unit membrane potential using a lsampling rate of 20 kHz. Baseline means that there is no input signal other thanSame as in (A–C) but with r = 0.002. (A and D) Membrane potential, V(t), and1 realization and (E) 20 realizations, with time measured in EOD cycles. (C ashuffled ISIs (circles). Parameters used: sV = 1 ms; sh = 14.5 ms; fEOD = 700 H
where Ii(t) is the input to the i-th receptor, Vi is its trans-membrane potential, and hi its time varying threshold forfiring. A firing event occurs when the voltage meets thethreshold. After each spike, the voltage is reset to zero,and the threshold is incremented by a fixed amount Dh.So the memory of past firings is conveyed via the threshold,which allows for non-renewal firing. A long interval willtend to be followed by a short and vice-versa. This is adeterministic property of the system [8], which is expressedby the noise. r controls the intensity of the intrinsic neuro-nal white noise n. S(t) is the narrowband signal, and fEOD isthe frequency of the EOD. The parameters chosen producea spike on 20 percent of the cycles.
While this model provides good baseline statistics, wehave found that it does not reproduce the experimentalresults on envelope coding. We have found (not shown)that it produces both good S–R and E–R coherence. Wehypothesized that the reason for this is that it is operating
eaky integrate-and-fire model with dynamic threshold producing data at athe constant-amplitude EOD. (A–C) Internal noise intensity r = 0. (D–F)threshold, h(t). (B and E) Interspike interval histogram obtained from (B)
nd F) Interspike interval autocorrelation (squares) and autocorrelation ofz; A0 = 0.2613 mV; h0 = 0.03 mV; Dh = 0.05 mV.

96 A. Longtin et al. / Mathematical Biosciences 214 (2008) 87–99
too much in a nonlinear regime. Our results thus predictthat parameters that produce the baseline statistics andenvelope coding (i.e. lack thereof) require a more linearP-unit. This can be achieved by increasing the noise andbias (into the suprathreshold regime) and decreasing thestimulus contrast (in comparison to [8]). Other propertiesstill agree with experimental results (interval histogramand interval correlation – Fig. 13E and F). We presentour results in the following Figures. In the last one(Fig. 15) we contrast results from a more linear and a lesslinear model, to show that nonlinearity can bring on goodenvelope coding.
In the absence of intrinsic noise this model exhibits acomplex phase locking pattern made mostly of 6–7 inter-vals of 5 EOD cycles followed by an interval of 4 EODcycles, as shown in Fig. 13A. Such phase locking patternsare expected from such models [7], and the interval distri-bution and the correlation between successive interspike
Fig. 14. Simulation with EOD amplitude-modulating stimulus, S(t), taken aswith standard deviation at 15% of EOD amplitude. (A) Stimulus, S(t). (B) Loanalytic signal via the Hilbert transform. (C) Input, I(t), to a P-unit. (D) Rrealization of one single model P-unit. (F) Interspike interval histogram fromsignal on the EOD.
intervals is highly structured (Fig. 13B and C). Fig. 13D–F shows the same model but with intrinsic noise with alevel that produces stochastic phase locking with realisticinterval distributions and interval correlation [7], in partic-ular, the negative correlation at lag one (long and shortintervals alternate statistically).
Fig. 14 shows the response of the afferent model to anarrowband signal and to its envelope. The firing rate ofthe P-unit is increased slightly (spikes on 22 percent ofthe cycles as opposed to 20 without the modulation), asexpected [24], and the interval histogram is broader. Onealso sees Fig. 15 plots the S–R and E–R coherence for asingle cell, averaged over many presentations of the samefrozen-narrowband-noise stimulus, for two different stimu-lus contrasts (stimulus standard deviation divided by EODamplitude). The averaging is possible because the P-unitdoes not respond the same way to the same signal, dueto its intrinsic noise which differs across realizations. It is
a narrowband Gaussian noise process with power in the 40–60 Hz rangew-frequency envelope, E(t), of the stimulus, taken as the amplitude of theaster plot of spike trains from 20 realizations. (E) Spike train from onethe P-unit firing in the presence of the amplitude-modulating narrowband

Fig. 15. Coherence estimates, averaged over 20 realizations, between the spike train response, R(t), and (A and B) the stimulus, S(t), leading to CSR(f), and(C and D) the envelope, E(t), leading to CER(f). Standard deviation of S(t) at (A and C) 15% and (B and D) 30% of EOD amplitude.
A. Longtin et al. / Mathematical Biosciences 214 (2008) 87–99 97
clear from the spike times in Fig. 14 that firings occurmainly on the crests of the narrowband signal; they arenot correlated so much with the envelope (a longer dataset would make this point clearer). This point is obviousfrom Fig. 15A and C, where the P-unit codes for the nar-rowband signal (good S–R coherence in Fig. 15A), butnot its envelope (poor E–R coherence in Fig. 15C). Thevalues of coherence are very similar to the ones foundexperimentally. Fig. 15B and D are obtained for the samesystem except the stimulus contrast is twice as strong.Interestingly, E–R coherence now becomes appreciable,as seen from the increase in the 0–20 Hz band. This illus-trates that nonlinearity in the f–I characteristic can beexpressed by a larger stimulus which explores more of thisf–I curve. In summary, the novel analysis presented hereshows that this model reproduces experimental results onbaseline firing statistics and envelope coding qualitativelyand quantitatively.
7. Conclusion
We have presented an analysis of envelope encoding in asensory pathway. The mechanism we have exposed [20,21],and detailed herein, is based on low-noise peri-threshold
processing. If the cell doing the extraction is furtherexpected to transmit information only about the slow enve-lope, then it can do so using a slow synapse. This is whatthe ovoid cell does via its slow GABAB connection to thepyramidal cell in the electrosensory system. It could alsosend the narrowband signal with good linear encodingqualities through a fast synapse, but this requires that itbehave linearly, which is not the case under the low-noiseperi-threshold conditions for envelope transmission. So insome sense the transmission of direct signal or envelopeare at odds with one another. The electrosensory system
solves this problem by sending the narrowband signal directly
to the pyramidal cells, and the envelope comes via the ovoid
cells.This coding is naturally applicable to carrier-based sen-
sory systems, where the lower-frequency envelope can beextracted. In the case of the electrosensory system, we pre-sented an even more elaborate context in which the mixtureof high-frequency EOD’s of interacting fish produces a nar-rowband mixture of moderate beat frequencies which aretransmitted by the electroreceptors (and the EOD’s them-selves are not transmitted); this narrowband mixture hasa higher-order feature in the form of a low-frequency enve-lope. It is clear however that the mechanism does not

98 A. Longtin et al. / Mathematical Biosciences 214 (2008) 87–99
require a carrier to begin with: any narrowband signal willhave an envelope that could be extracted by this mecha-nism. The results are thus applicable to non-carrier-basedsenses as well, and to other parts of the brain, sensory orother, remotely located with respect to primary receptors.
The single LIF model can be made to extract envelopesof narrowband signals if the noise is low and the signal isperi-threshold. In this case it behaves similarly to the singlepyramidal cells in vitro (not shown: see [21]) used to studyenvelope extraction. These cells were used to study thedynamics of the firing mechanism that lead to envelopeextraction, even though in the real fish, this extractionhas been shown to occur in the ovoid cells which connectto the pyramidal cells via a slow interneuron. This isbecause it is simpler to record from these pyramidal cellsin vitro, without the confounding effects of realistic synap-tic input. In particular, such input will add much noise, andconsequently will make it difficult for such a cell to extractenvelopes in vivo. This is why the pyramidal cells are notable to extract envelopes on their own in vivo, but rely onan indirect feedforward pathway via the ovoids. Thisenables them to respond to the direct signal as well, andwith good coherence.
We have also shown results for an LIF model withdynamic threshold for the P-unit afferents (i.e. the electro-receptors). This model requires noise to produce the sto-chastic phase-locked firing characteristic of the baselineactivity. This model has a smooth f–I curve (not shown)due to the noise, and furthermore, it processes signals inits suprathreshold regime – in fact Fig. 13 shows thatwithout any input the cell fires periodically in a phaselocked manner. Consequently, this cell is not expectedto do envelope extraction, but is expected to respond tothe direct narrowband input. This is indeed whatFig. 15 reveals. This is also manifest in Fig. 14, wherethe spike train is seen to care more about (i.e. to do betterrate-coding of) the narrowband modulations rather thanthe slow modulations of the envelope. This qualitativeand quantitative agreement with experiment for bothbaseline firing statistics and S–R/E–R coherence requiredthat the model be put into a more linear regime, by suffi-ciently reducing the stimulus contrast, or by increasingnoise intensity and/ or current bias beyond threshold(data not shown).
Many species of weakly electric fish exhibit a jammingavoidance response, in which interacting fish move theirrespective EOD frequencies until a more comfortable sep-aration is reached. What is the measure used by the fishto stop changing their frequencies, beyond the obviousdesire to achieve a higher frequency beat? Does this haveto do with the envelope power being somehow minimized?Is there an optimal modulation depth for the beat? Is it inthe precise way that beats interfere with communicationsignals such as small and large chirps? Answers to thesequestions may also depend on the naturalistic amplitudeand phase stimulation on the fishes’ bodies, which is cur-rently under closer scrutiny [16].
Further, what underlies the maximal sensitivity of theJAR? In Eigenmannia for example, the maximal responseof the JAR occurs for frequency differences of 5 Hz orso. The reasons for this maximal sensitivity are not known.It would be interesting to correlate the ability to extractenvelopes with the features of the jamming avoidanceresponse. Likewise future work could also explore howthe fish can actually behave in the detection experimentbased on the set-up of Figs. 10 and 11. How is the responseto a simple low-frequency stimulus impaired by envelopepower? Hopefully we will obtain behavioral and electro-physiological answers to this question. Finally it will becrucial to build more realistic models of the electrorecep-tors coupled to the pyramidal and ovoid cells, to under-stand how more realistic features, such as intrinsicinterval correlations in the receptor firing activity or thesynaptic input and its plasticity, can reveal more surprisesabout parallel coding of signals and their envelopes andother multiscale spatiotemporal inputs.
References
[1] D. Babineau, J.E. Lewis, A. Longtin, Spatial acuity and preydetection in weakly electric fish, PLoS Comp. Biol. 3 (2006) e38.
[2] C.L. Baker Jr., Current Opin. Neurobiol. 9 (1999) 461.[3] J. Bastian, Electrolocation 1. How the electroreceptors of Apteron-
otus Leptorynchus code for moving objects and other externalstimuli., J. Comp. Physiol. 144 (1981) 465.
[4] J. Benda, A. Longtin, L. Maler, A synchronization–desynchroni-zation code for natural communication signals, Neuron 52 (2006)347.
[5] N.J. Berman, L. Maler, Neural architecture of the electrosensorylateral line lobe: adaptations for coincidence detection, a sensorysearchlight and frequency-dependent adaptive filtering, J. Exp. Biol.202 (1999) 1243.
[6] C.E. Carr, M.A. Friedman, Evolution of time coding systems, NeuralComput. 11 (1999) 1.
[7] M.J. Chacron, A. Longtin, M. St-Hilaire, L. Maler, Suprathresholdstochastic firing dynamics with memory in P-type electroreceptors,Phys. Rev. Lett. 85 (2000) 1576.
[8] M.J. Chacron, K. Pakdaman, A. Longtin, Interspike interval corre-lations, phase locking and chaotic dynamics in a leaky integrate-and-fire model with dynamic threshold, Neural Comput. 15 (2003) 253.
[9] M.J. Chacron, Nonlinear information processing in a model sensorysystem, J. Neurophysiol. 95 (2006) 2933.
[10] D.R. Chialvo, How we hear what is not there: a neural mechanism forthe missing fundamental illusion, Chaos 13 (2003) 1226.
[11] D. Chialvo, A. Longtin, J. Mueller-Gerkin, Stochastic resonance inmodels of neuronal ensembles, Phys. Rev. E 55 (1997) 1798.
[12] F. Gabbiani, Coding of time-varying signals in spike trains of linearand half-wave rectifying neurons, Network Comp. Neural Syst. 7(1996) 61.
[13] T.J. Gardner, M.O. Magnasco, Sparse time–frequency representa-tions, Proc. Nat. Acad. Sci. USA 103 (2006) 6094.
[14] W. Heiligenberg, Neural Nets in Electric Fish, MIT Press, Cam-bridge, MA, 1991.
[15] P.X. Joris, C.E. Schreiner, A. Rees, Neural processing of amplitudemodulated sounds, Physiol. Rev. 84 (2004) 541.
[16] M. Kelly, A. Longtin, J.E. Lewis, Electric field interactions in pairs ofelectric fish: implications for conspecific localization, Biol. Cybern.(2008) in press.
[17] B. Lindner, L. Schimansky-Geier, A. Longtin, Maximizing spike traincoherence and incoherence in the leaky integrate-and-fire model,Phys. Rev. E 66 (2002) 031916.

A. Longtin et al. / Mathematical Biosciences 214 (2008) 87–99 99
[18] A. Longtin, M. St-Hilaire, Encoding carrier amplitude modulationsvia stochastic phase synchronization, Intern. J. Bifurc. Chaos 10(2000) 2447.
[19] I. Mareschal, C.L. Baker Jr., Nat. Neurosci. 1 (1998) 150.[20] J.W. Middleton, A. Longtin, J. Benda, L. Maler, The cellular basis
for parallel neural transmission of a high-frequency stimulus and itslow-frequency envelope, Proc. Nat. Acad. Sci. USA 103 (2006)14596.
[21] J.W. Middleton, E. Harvey-Girard, L. Maler, A. Longtin, Envelopegating and noise shaping in populations of noisy neurons, Phys. Rev.E 75 (2007) 021918.
[22] M.E. Nelson, Z. Xu, J.R. Payne, Characterization and modeling of P-type electrosensory afferent responses to amplitude modulations in awave-type electric fish, J. Comp. Physiol. A 181 (1997) 532.
[23] Z.M. Smith, B. Delgutte, A.J. Oxenham, Chimaeric sounds revealdichotomies in auditory perception, Nature 416 (2002) 87.
[24] M. St-Hilaire, A. Longtin, Coding of information in models oftuberous electroreceptors, Math. Biosci. 188 (2004) 157.
[25] C. van Vreeswijk, in: C. Chow, B. Gutkin, D. Hansel, C. Meunier, J.Dalibard (Eds.), Methods and models in neurophysics, Lecture Notesof the Les Houches Summer School 2003, Vol. LXXX, Elsevier,Amsterdam, 2005, p. 345.
[26] R. Wessel, C. Koch, F. Gabbiani, Coding of time-varying electricfield amplitude modulations in a wave-type electric fish, J. Neuro-physiol. 75 (1996) 2280.
[27] H.H. Zakon, The electroreceptive periphery, in: T.H. Bullock, W.Heilingenberg (Eds.), Electroreception, John Wiley and Sons, NewYork, 1986, p. 103.