NestléFull Year Results 2007 Full Year Results Roadsho · 16 2007 full year results roadshow –...
66
2007 full year results roadshow – February 2008 Full Year Results Roadshow
Transcript of NestléFull Year Results 2007 Full Year Results Roadsho · 16 2007 full year results roadshow –...

2007 full year results roadshow – February 2008
Nestlé Full Year Results 2007
Name of chairman
Full Year Results Roadshow
2 2007 full year results roadshow – February 2008
Disclaimer
This presentation contains forward looking statements which reflect Management’s current views and estimates. The forward looking statements involve certain risks and uncertainties that could cause actual results to differ materially from those contained in the forward looking statements. Potential risks and uncertainties include such factors as general economic conditions, foreign exchange fluctuations, competitive product and pricing pressures and regulatory developments.
3 2007 full year results roadshow – February 2008
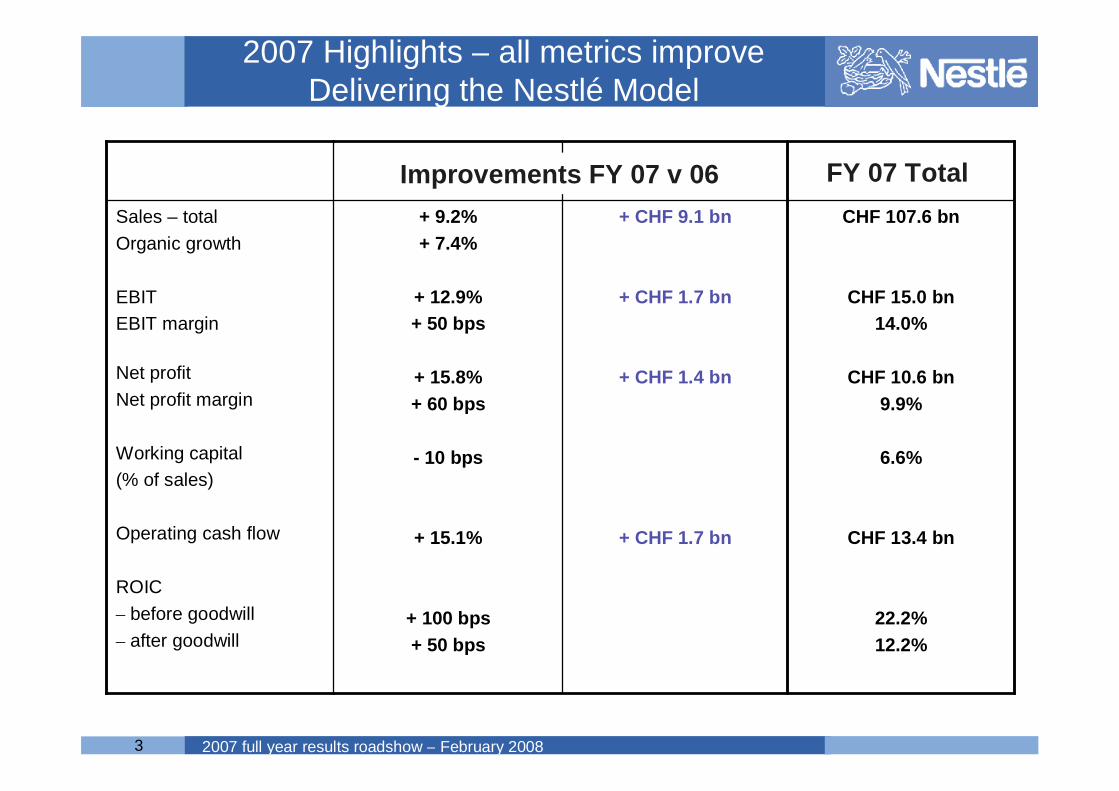
+ 9.2%+ 7.4%
+ 12.9%+ 50 bps
+ 15.8%+ 60 bps
- 10 bps
+ 15.1%
+ 100 bps+ 50 bps
CHF 107.6 bn
CHF 15.0 bn14.0%
CHF 10.6 bn9.9%
6.6%
CHF 13.4 bn
22.2%12.2%
+ CHF 9.1 bn
+ CHF 1.7 bn
+ CHF 1.4 bn
+ CHF 1.7 bn
Sales – totalOrganic growth
EBITEBIT margin
Net profitNet profit margin
Working capital (% of sales)
Operating cash flow
ROIC– before goodwill– after goodwill
Improvements FY 07 v 06 FY 07 Total
2007 Highlights – all metrics improveDelivering the Nestlé Model
4 2007 full year results roadshow – February 2008
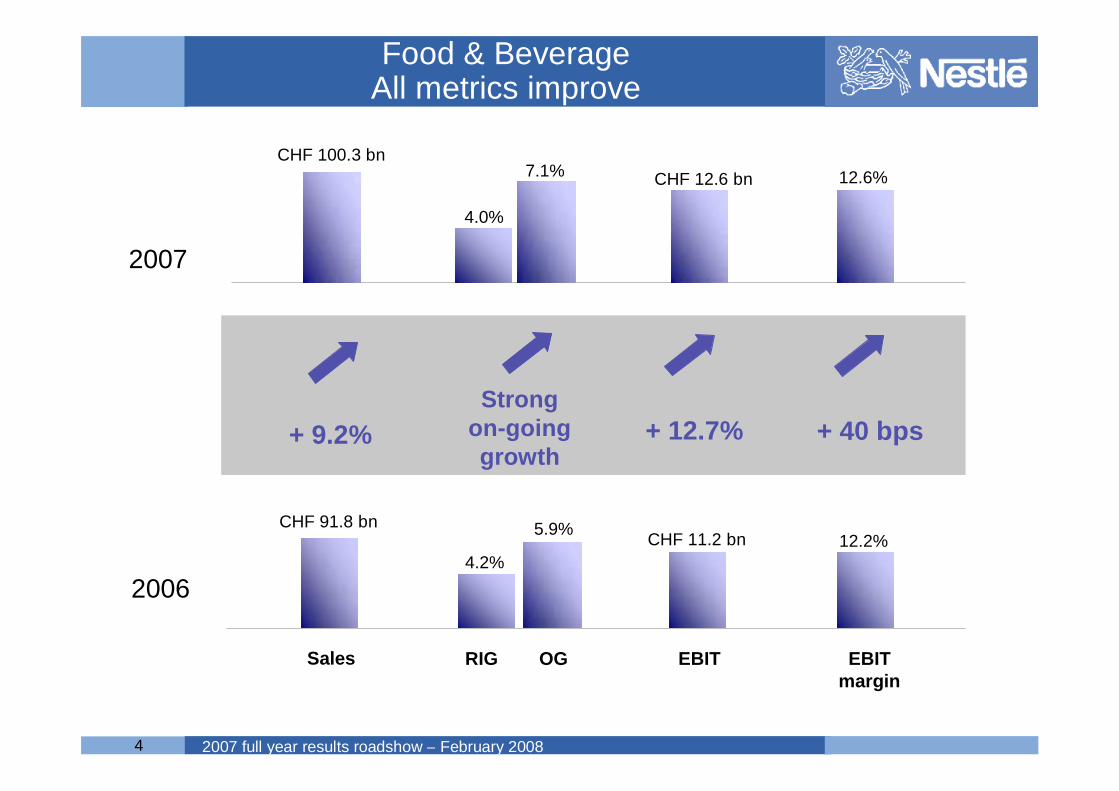
Food & BeverageAll metrics improve
2007
2006
RIG OG EBIT margin
Sales
CHF 100.3 bn
CHF 91.8 bn
+ 9.2% + 40 bps
12.6%
12.2%
Strongon-goinggrowth
4.0%
7.1%
5.9%
4.2%
EBIT
+ 12.7%
CHF 12.6 bn
CHF 11.2 bn
5 2007 full year results roadshow – February 2008
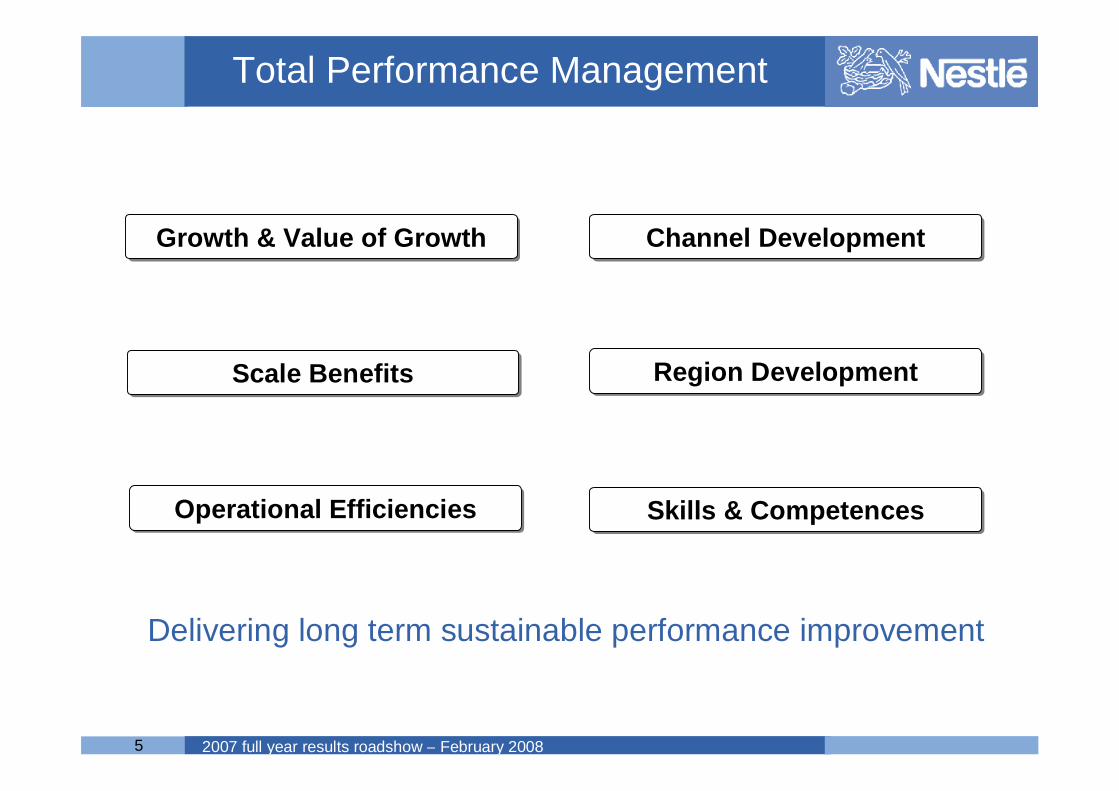
Total Performance Management
Growth & Value of GrowthGrowth & Value of Growth
Scale BenefitsScale Benefits
Operational EfficienciesOperational Efficiencies
Channel DevelopmentChannel Development
Region DevelopmentRegion Development
Skills & CompetencesSkills & Competences
Delivering long term sustainable performance improvement

6 2007 full year results roadshow – February 2008
The Nestlé Model
EBIT margins correspond to published figures – not restated for accounting changes
% Organic Growth1996 1997 1998 1999 2001 2002 20032000 2004 2005 2006 2007
5.2%
6.4%
5.1% 4.5%
6.2% 6.2%
7.4%
5.1%
6.9%
3.8%
5.4%4.9%
EBIT margin
10.2% 10.3% 10.3%11.1%
11.8% 11.8%12.3% 12.5% 12.6% 12.9%
13.5%14.0%
7 2007 full year results roadshow – February 2008
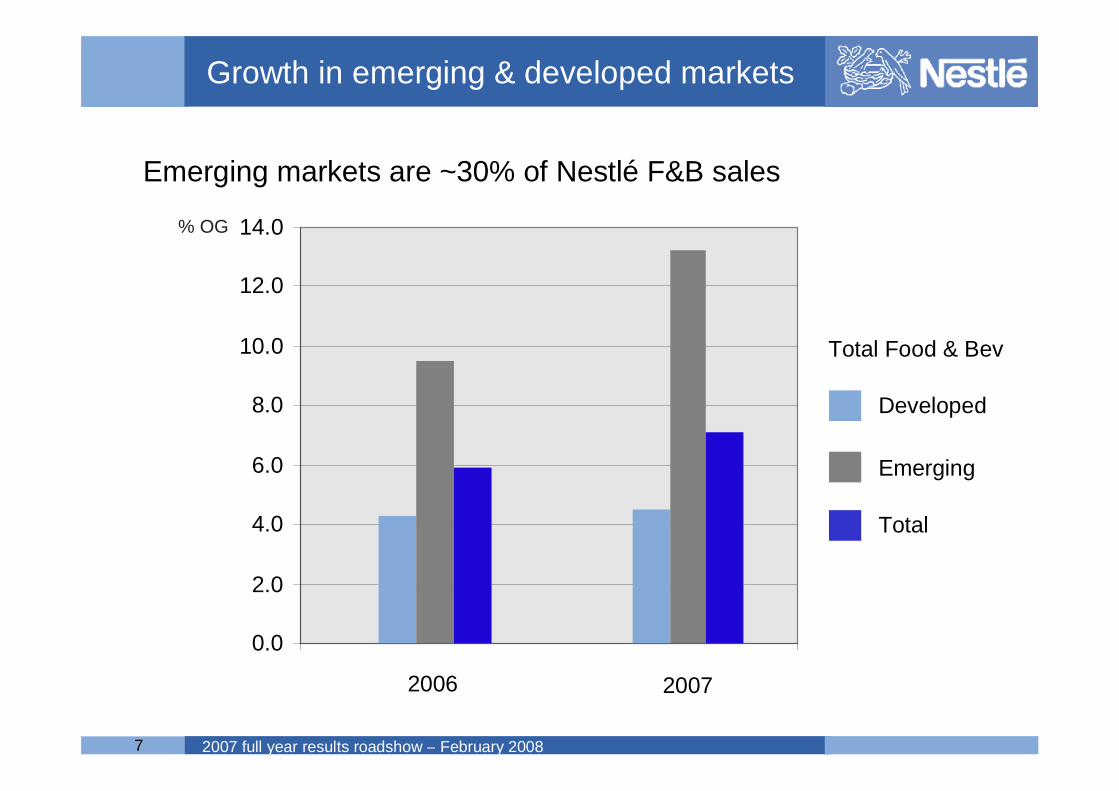
Growth in emerging & developed markets
2006 2007
0.0
2.0
4.0
6.0
8.0
10.0
12.0
14.0
Developed
Emerging
Total
Emerging markets are ~30% of Nestlé F&B sales
Total Food & Bev
% OG
8 2007 full year results roadshow – February 2008
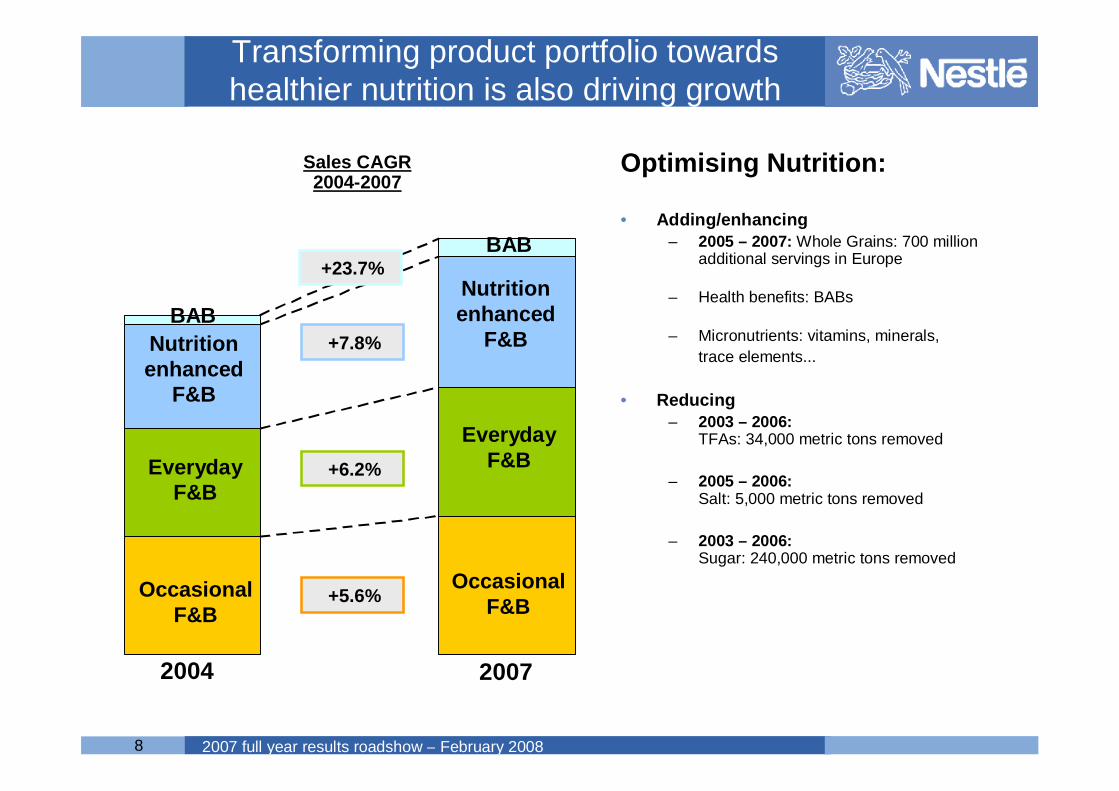
Transforming product portfolio towards healthier nutrition is also driving growth
Optimising Nutrition:
• Adding/enhancing– 2005 – 2007: Whole Grains: 700 million
additional servings in Europe
– Health benefits: BABs
– Micronutrients: vitamins, minerals,trace elements...
• Reducing– 2003 – 2006:
TFAs: 34,000 metric tons removed
– 2005 – 2006:Salt: 5,000 metric tons removed
– 2003 – 2006:Sugar: 240,000 metric tons removed
2004 2007
Sales CAGR 2004-2007
+23.7%
+7.8%
+6.2%
+5.6%Occasional F&B
Everyday F&B
Nutrition enhanced
F&B
BAB
Occasional F&B
Everyday F&B
Nutrition enhanced
F&B
BAB
9 2007 full year results roadshow – February 2008
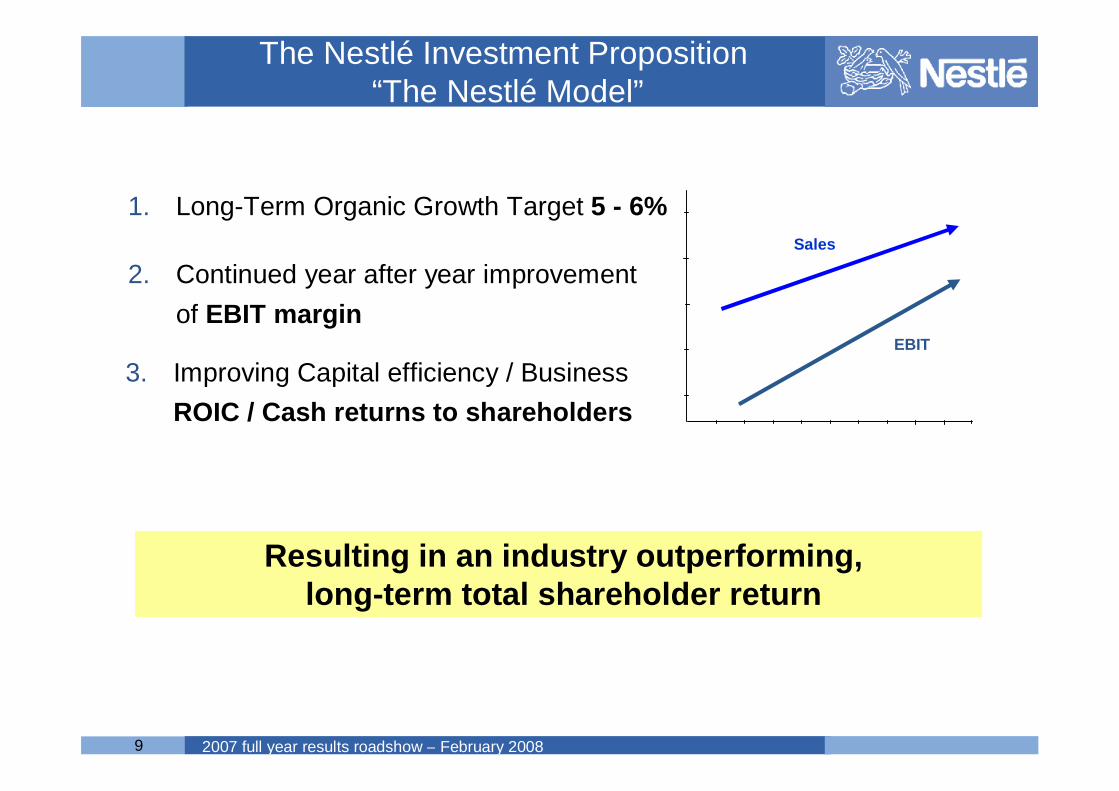
The Nestlé Investment Proposition“The Nestlé Model”
1. Long-Term Organic Growth Target 5 - 6%
Resulting in an industry outperforming, long-term total shareholder return
2. Continued year after year improvement of EBIT margin
3. Improving Capital efficiency / Business ROIC / Cash returns to shareholders
EBIT
Sales
10 2007 full year results roadshow – February 2008
• Discipline driving performance
• Operational control
• Leveraging scale and skills
• Strategy and performance
Focus areas
11 2007 full year results roadshow – February 2008
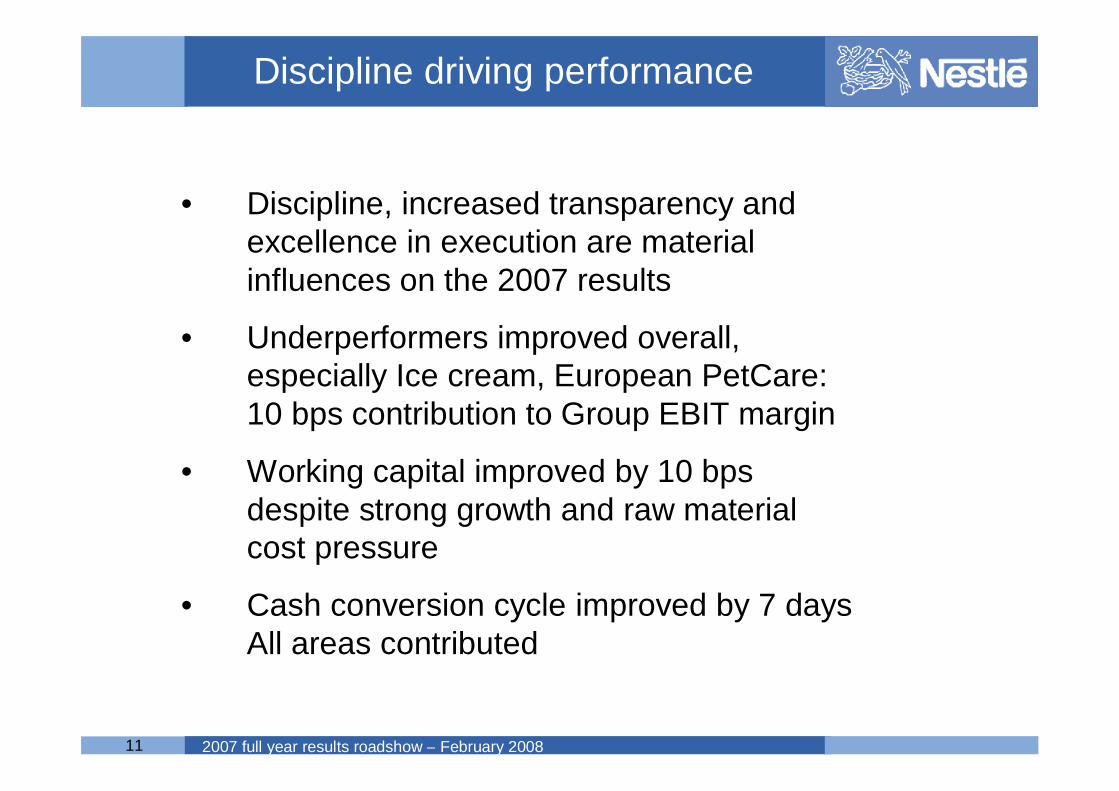
Discipline driving performance
• Discipline, increased transparency and excellence in execution are material influences on the 2007 results
• Underperformers improved overall, especially Ice cream, European PetCare: 10 bps contribution to Group EBIT margin
• Working capital improved by 10 bps despite strong growth and raw material cost pressure
• Cash conversion cycle improved by 7 daysAll areas contributed

12 2007 full year results roadshow – February 2008
Discipline driving performance
• 10% reduction in SKUs in 2007
• 10% improvement in bad goods
• Simplifying structures (200 fewer legal entities)
• CHF700mn excess real estate disposed over 3 years
Focus areas for 2008 include
• Leverage scale & skills – overheads
• Reduced working capital as % of sales
• Underperformers and SKU reduction

13 2007 full year results roadshow – February 2008
Leveraging scale
Industrial Performance TeamIndustrial Performance Team
European PurchasingEuropean Purchasing
Regional Treasury CentresRegional Treasury Centres
Supply Chain Optimisation TeamSupply Chain Optimisation Team
Strategic Generating Demand UnitStrategic Generating Demand Unit
Global Media BuyingGlobal Media BuyingStrategic Business UnitsStrategic Business Units
Innovation Acceleration TeamInnovation Acceleration Team
Global Nestlé Business ServicesGlobal Nestlé Business Services
Enabled by GLOBE Leveraging best practices, efficiencies, skills & know-how
Global Business Excellence TeamGlobal Business Excellence Team

14 2007 full year results roadshow – February 2008
GNBS contributing to profitable growth
Expand
Standardize & Streamline
Get-in
§ Transition "as-is" activities to NBS
§ Full accountability for service delivery with NBS
§ One global best-in-class end-to-end solution
§ Optimized retained organizations
§ New Markets
§ New Services
§ Scale...
§ ...resulting in consolidation savings
§ Process improvement...
§ ...resulting in lower cost
§ Business focus on demand generation...
§ ...resulting in profitable growth
Stage
Focus
Outcome

15 2007 full year results roadshow – February 2008
Update on GLOBE
• GLOBE Objectives changed from:
• Implementation of harmonized NestléBusiness Excellence Best Practice
• Implementation of Data Standards and Data Management –"Managing Data as a Corporate Asset"
• Implementation of standardized information systems & technology
To:
• Move from "Best in Nestlé" to "Best in Class" best practices confirmed with external benchmarking
• Move from historical/explanatory reporting to forward looking/real time/predictive information with a greater focus on customers and consumers
• Enable a fast, focused and flexible "front line" with a slim, cost efficient "back-line"

16 2007 full year results roadshow – February 2008
Operational control
• Balance sheet optimisation within "Gold Standard" parameters –minimise cost of capital
• Controls – oversight of Nestlé marketsDevolved responsibility balanced by controls
• Guardian of shareholders' interests –Use of funds, returns hurdles, risk policies, etc
• GLOBE brings improved transparency, greater speed, and enhanced benchmarking
• The opportunity is to leverage best in class practices, to share excellence in execution and to enhance discipline – continuous improvement

17 2007 full year results roadshow – February 2008
The role of Finance
• Finance is central to value creationby identifying opportunities for performance improvement
• Finance is central to value protectionthrough controls, systems, governance
• Focus on maximising long term total shareholder return

18 2007 full year results roadshow – February 2008
Differentiating strategies
Benchmark & Fix Benchmark & Fix ObjectivesObjectives
Focus & ImplementFocus & ImplementMeasure & TrackMeasure & Track
Responsibility, Responsibility, LeadershipLeadership
to get Resultsto get Results PerformancePerformanceManagementManagement
CycleCycle
Differentiating Differentiating StrategiesStrategies

2007 full year results roadshow – February 2008
Nestlé Full Year Results 2007
Name of chairman
Full Year Results Roadshow
Name of chairman2007 full year results roadshow – February 2008
Nestlé Full Year Results 2007
Name of chairman
2007 full year results roadshow
Delivering the NestléModel in 2008
Driving performance longer term

Name of chairman2007 full year results roadshow – February 200821
Agenda
Ø The last decade
Ø 2008 – another year of the Nestlé Model
Ø Beyond 2008 – opportunity rich

Name of chairman2007 full year results roadshow – February 2008
Creating...
Transforming...
Delivering...
Rewarding...
Nestlé – The Last Ten Years

Name of chairman2007 full year results roadshow – February 200823
The transformational opportunity
Organisational• Creating an agile fleet of
businesses/markets• Efficient support
structure • Increased focus on
demand generation
Strategic• Towards Nutrition,
Health& Wellness
The "What" The "How"

Name of chairman2007 full year results roadshow – February 2008
Creating…
Nestlé has evolved from Food & Beverage
to create
the global leader in Nutrition, Health and Wellness
60/40+

Name of chairman2007 full year results roadshow – February 200825
...independently strong and flexible, following their own rules for success,
with business specific knowledgeable management.
...an agile fleet of businessesFrom super-tanker to…
Transforming…

Name of chairman2007 full year results roadshow – February 200826
Delivering... (The Nestlé Model)
Ø Sustainable Organic Growth of 5 - 6% 12 year average = 5.9%CHF 60bn to CHF 107.6bn
Ø Annual improvement of EBIT margin 12 year average = 35 basis points to 14%CHF 6.2bn to CHF 15bn
Ø Total cash returned to shareholdersCHF 36bn in 12 years

Name of chairman2007 full year results roadshow – February 200827
Rewarding...
CHF
TSR of 408%
Over CHF 150bn of incremental value
since 1996
Name of chairman2007 full year results roadshow – February 2008
• The right strategy• Performance is trending higher
Creating...Transforming...Delivering...Rewarding...
Our mission is to build on that success– Deliver the strategy– Enhance financial performance
We intend to make Nestlé the referencefor both Nutrition, Health & Wellness
and for Financial Performance
Name of chairman2007 full year results roadshow – February 200829
Agenda
Ø The last decade
Ø 2008 – another year of the Nestlé Model
Ø Beyond 2008 – opportunity rich
Name of chairman2007 full year results roadshow – February 2008
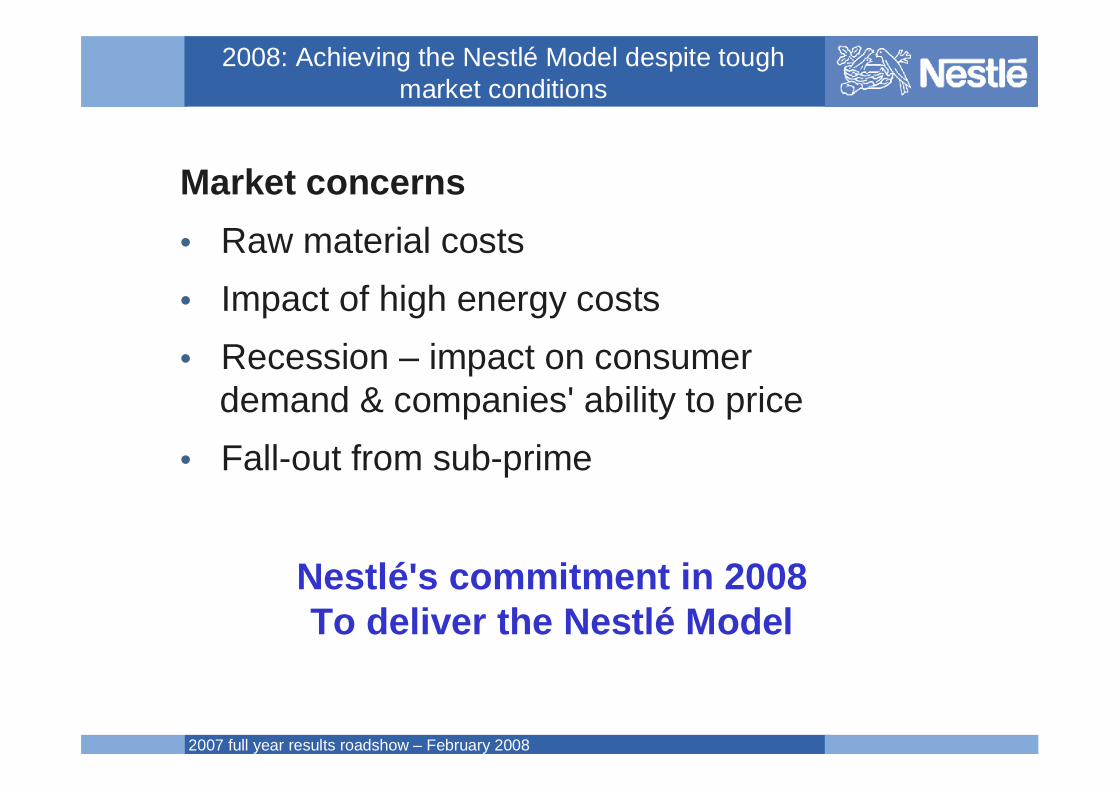
Market concerns• Raw material costs• Impact of high energy costs• Recession – impact on consumer
demand & companies' ability to price• Fall-out from sub-prime
2008: Achieving the Nestlé Model despite tough market conditions
Nestlé's commitment in 2008 To deliver the Nestlé Model

Name of chairman2007 full year results roadshow – February 2008
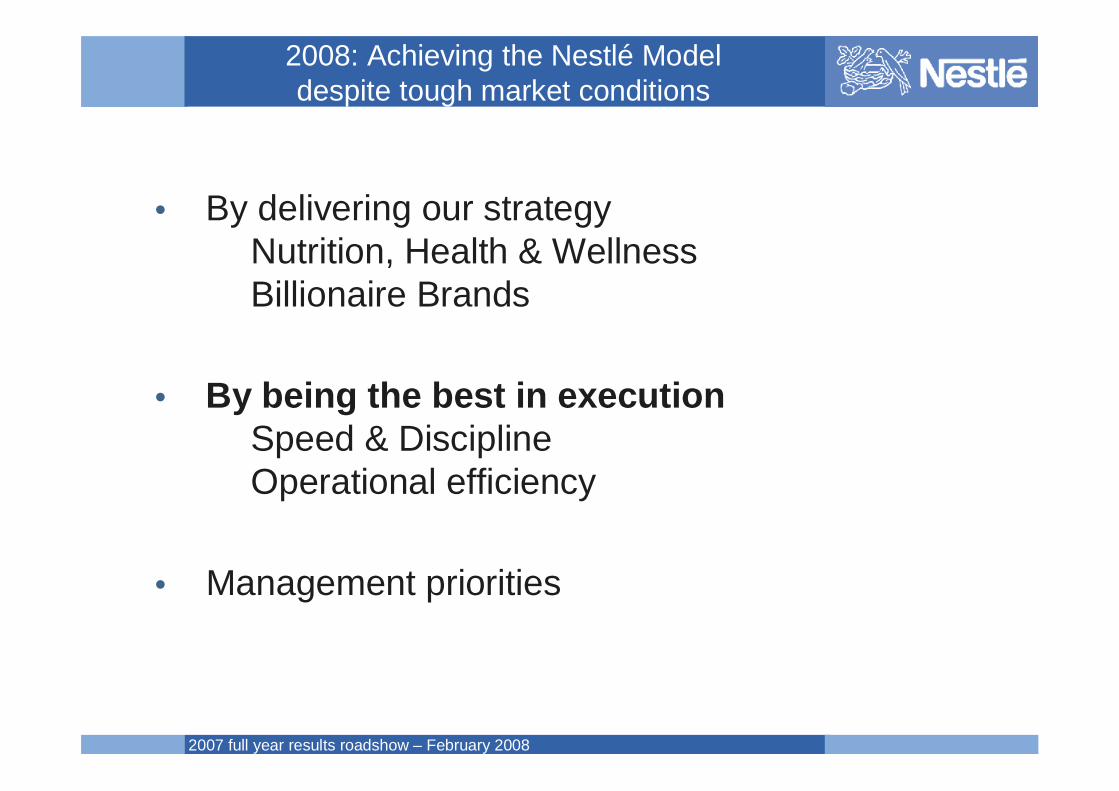
• By delivering our strategyNutrition, Health & WellnessBillionaire Brands
• By being the best in executionSpeed & DisciplineOperational efficiency
• Management priorities
2008: Achieving the Nestlé Model despite tough market conditions

Name of chairman2007 full year results roadshow – February 200832
F&B “Billionaire Brands” representabout 70% of F&B sales
Name of chairman2007 full year results roadshow – February 2008
• By delivering our strategyNutrition, Health & WellnessBillionaire Brands
• By being the best in executionSpeed & DisciplineOperational efficiency
• Management priorities
2008: Achieving the Nestlé Model despite tough market conditions

Name of chairman2007 full year results roadshow – February 200834
• Businesses need to "earn the right" to belong – underperformers, lower performing or commoditised categories and SKUs
• Overheads, total delivered costs, trade spend, etc
• Focus on bigger brands – spend, R&D, resource
• Rewards structure
Speed & Disciplinedriving financial performance
Name of chairman2007 full year results roadshow – February 200835
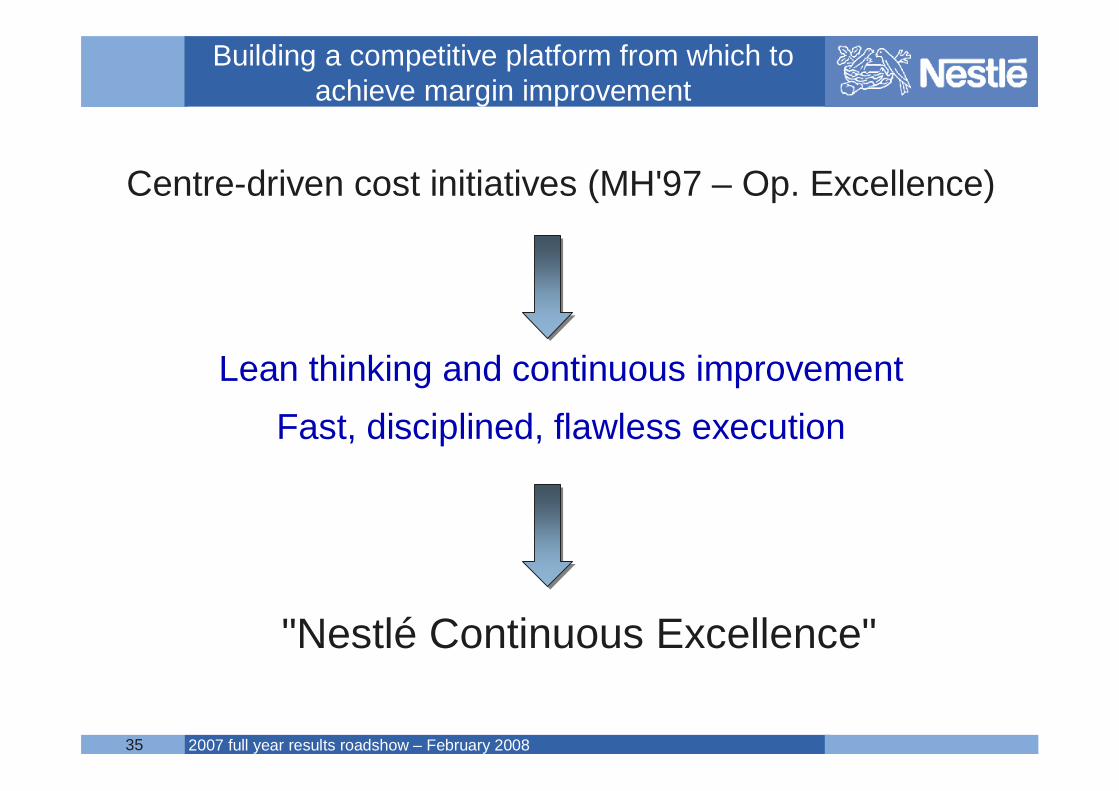
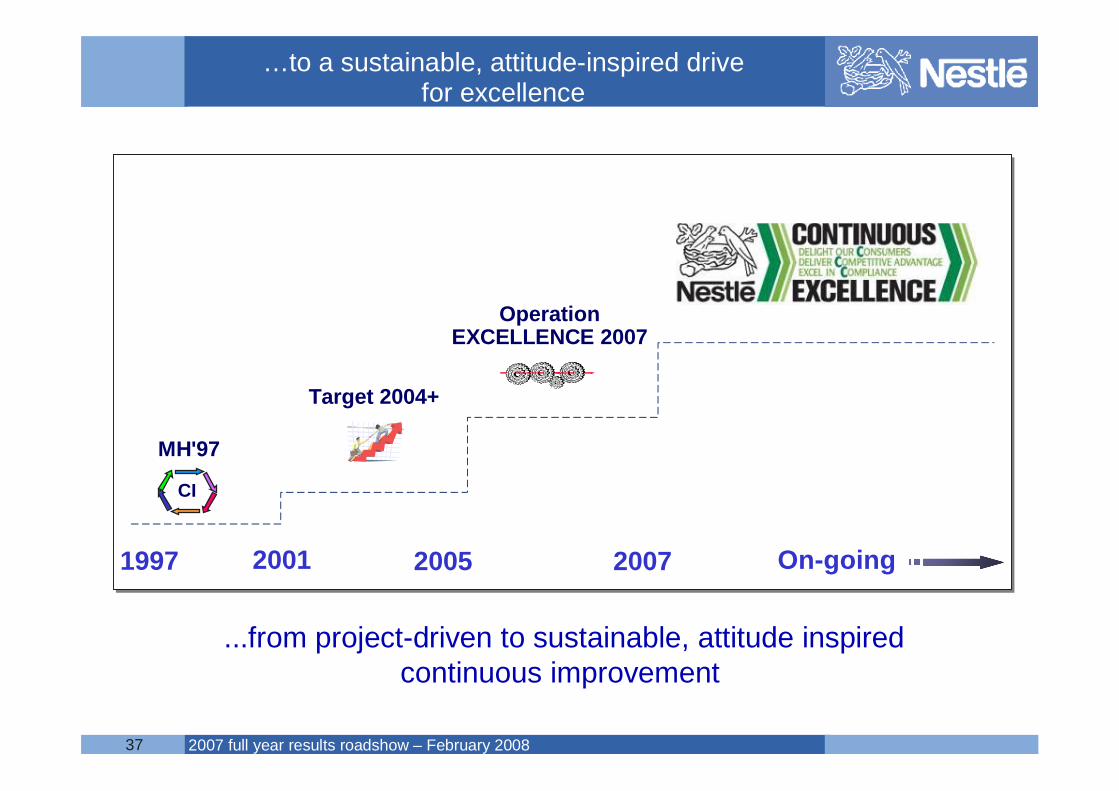
Centre-driven cost initiatives (MH'97 – Op. Excellence)
Lean thinking and continuous improvementFast, disciplined, flawless execution
"Nestlé Continuous Excellence"
Building a competitive platform from which to achieve margin improvement

Name of chairman2007 full year results roadshow – February 200836
CI
MH'97
• Continuous Improvements
Target 2004+
• Functional Targets out of Best Practice
• Restructuring the Industrial Network
Optimizing Total Delivered Cost by...
• Aligned targets across the Supply Chain
• Integrated Distribution and Industrial Networks
• Continuous Improvement culture
OperationEXCELLENCE 2007
An average CHF1 billion a year savings
From centre-driven initiatives
Name of chairman2007 full year results roadshow – February 200837
...from project-driven to sustainable, attitude inspired continuous improvement
CI
MH'97
Target 2004+
OperationEXCELLENCE 2007
1997 2001 2005 2007 On-going
…to a sustainable, attitude-inspired drivefor excellence

Name of chairman2007 full year results roadshow – February 200838
Deliver CCompetitive Advantage
Delight our CConsumers
Excel in CCompliance
...and create a sustainable attitude inspired approach
Eliminate Supply Chain
Losses
Eliminate Factory Losses
Engage 160’000 people
Outstanding Leadership Capability
FullOperationsCompliance
Value Stream Optimization (VSO)
Total Performance Management (TPM)
Organization Alignment
Leadership
Foundation Building Blocks
Performance Improvements
One Nestlé operating model:Nestlé Continuous Excellence

Name of chairman2007 full year results roadshow – February 200839
Raw MaterialConsumer Customer Distribution Centres Manufacturing Packaging Material
VSO : Consumer focused flow optimization across the full value chain (including R&D)
TPM
Zero Error
Zero Loss
Zero Waste
... ensures high performance equipment
Upstream Input...Downstream Input...
~85% of our people in Operations work in factories. ~82% of our delivered costs are linked to factories.
Continuous Excellence across the wholevalue chain

Name of chairman2007 full year results roadshow – February 200840
• 55% reduction in absenteeism
• 33% reduction in consumer complaints
• 50% reduction in waste
• 20% reduction in change-over time
• 70% reduction in unplanned stoppages
• 15% increase in line efficiency
• 15% reduction in rework
Pilot results show scale of opportunity

Name of chairman2007 full year results roadshow – February 200841
• Nestlé has a proven ability to drive efficiencies
• Nestlé Continuous Excellence takes us to a new level:
– combines best practices from different industries
– reaches from supplier to customer; service focused
– goes beyond cost to working capital & other KPIs
• GLOBE provides transparency, discipline,
measurement, faster decision making
Operational efficiencies provide a competitive base for margin improvement

Name of chairman2007 full year results roadshow – February 200842
• An enhanced demand-focused organisationNetwork structure, rapid decision making, leveraging scale, complexity with efficiency
• A flexible network structureImprove agility/service levels in marketsContinuous excellence to drive out costs
• A mentality of continuous improvementPride in "flawless" executionPerformance culture & rewards
Discipline enhanced by GLOBE
Name of chairman2007 full year results roadshow – February 2008
• By delivering our strategyNutrition, Health & WellnessBillionaire Brands
• By being the best in executionSpeed & DisciplineOperational efficiency
• Management priorities
2008: Achieving the Nestlé Modeldespite tough marketing conditions

Name of chairman2007 full year results roadshow – February 200844
Four objectives• RIG & organic growth (5-6%)• Increased EBIT margin
(constant currency)
• Reduce working capital• Improve ROICOperational priorities – with internal targets• Improve returns on trade spend• Operational efficiency & reduced overheads
The Nestlé Model
2008: Management prioritiesDriving financial performance

Name of chairman2007 full year results roadshow – February 200845
Agenda
Ø The last decade
Ø 2008 – another year of the Nestlé Model
Ø Beyond 2008 – opportunity rich
Name of chairman2007 full year results roadshow – February 200846
• Four competitive advantages
• Four growth areas
• Four Pillar strategy
Beyond 2008:Nestlé is opportunity rich
Name of chairman2007 full year results roadshow – February 200847
• Product and brand portfolio
• The industry's leading R&D capability
• Unmatched geographic presence
• People, culture, values, attitude
Beyond 2008:Four competitive advantages

Name of chairman2007 full year results roadshow – February 200848
Food, Nestlé Nutrition,Dairy, CPW, BPW, Chocolate, Confectionery & Biscuits, Ice cream, Nestlé Waters, NestléPurina PetCare
Protection
WeightManagement
Skin Health &Beauty
Healthy Recovery
Growth &Development
Digestive Comfort
Performance
Healthy Ageing
Relevant categoriesNestlé Nutrition, Coffee & Beverages, Dairy, CPW, Ice cream
innéov, Coffee & Beverages, Dairy, BPW, Nestlé Waters
Nestlé Nutrition
Nestlé Nutrition, NestléPurina PetCare, Coffee &
Beverages,Dairy, Ice cream
Dairy, Nestlé Nutrition,Nestlé Purina PetCare
Nestlé Nutrition, Ice cream, Chocolate, Confectionery &
Biscuits, Coffee & Beverages, Nestlé Waters
Nestlé Nutrition,Chocolate,
Confectionery & Biscuits, Dairy, Food,Coffee & Beverages,
Nestlé Purina PetCare
Consumer Benefit Areas
Name of chairman2007 full year results roadshow – February 200849
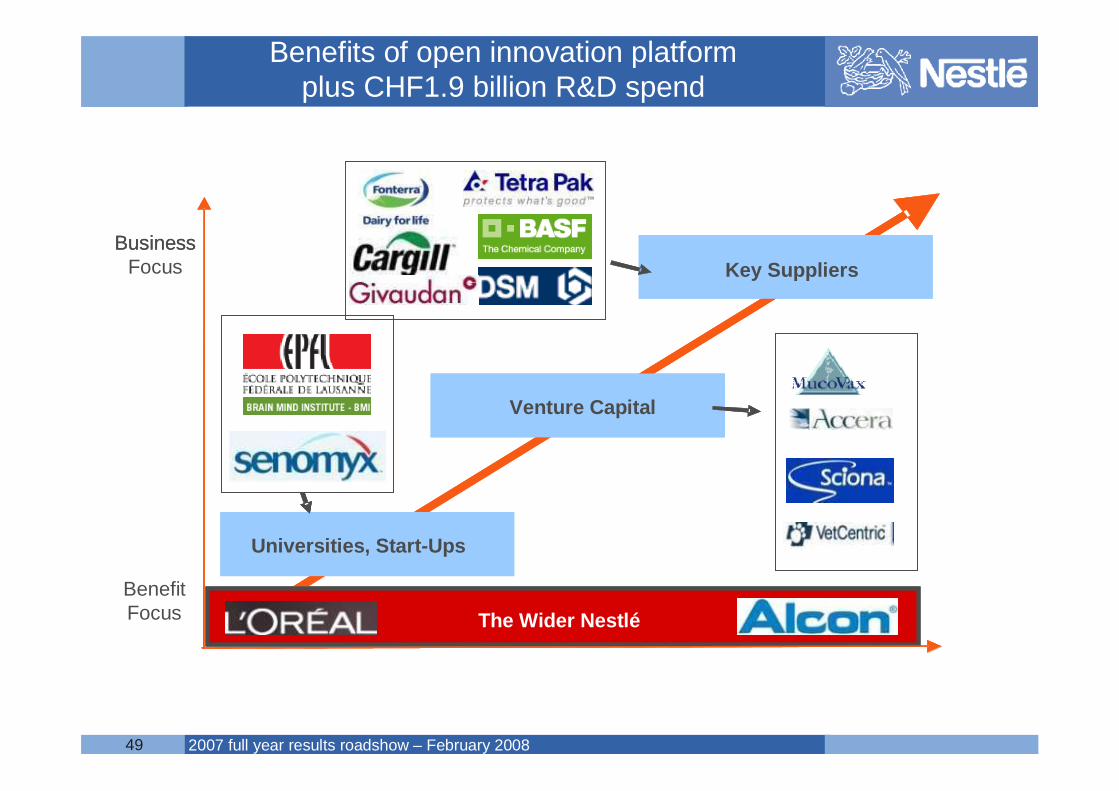
BenefitFocus
Business
Universities, Start
Venture Capital
Key Suppliers
The “ wider Nestl é”…
BusinessFocus
Universities, Start-Ups
Venture Capital
Key Suppliers
The Wider Nestlé
Benefits of open innovation platformplus CHF1.9 billion R&D spend

Name of chairman2007 full year results roadshow – February 200850
Population growth 2000-2050
Developing world* +3.3bn
North America +0.15bn
Europe -0.05bn
NestléF&B sales (CHF)
34 billion
29 billion
38 billion
Source for population growth: http://www.census.gov*Developing does not include Eastern Europe.
Unmatched geographic presence

Name of chairman2007 full year results roadshow – February 200851
• Nutrition, Health & Wellness
• Emerging markets & PPP
• Leadership in "out of home"Nestlé Professional
• Premiumisation
Beyond 2008:The Four growth areas
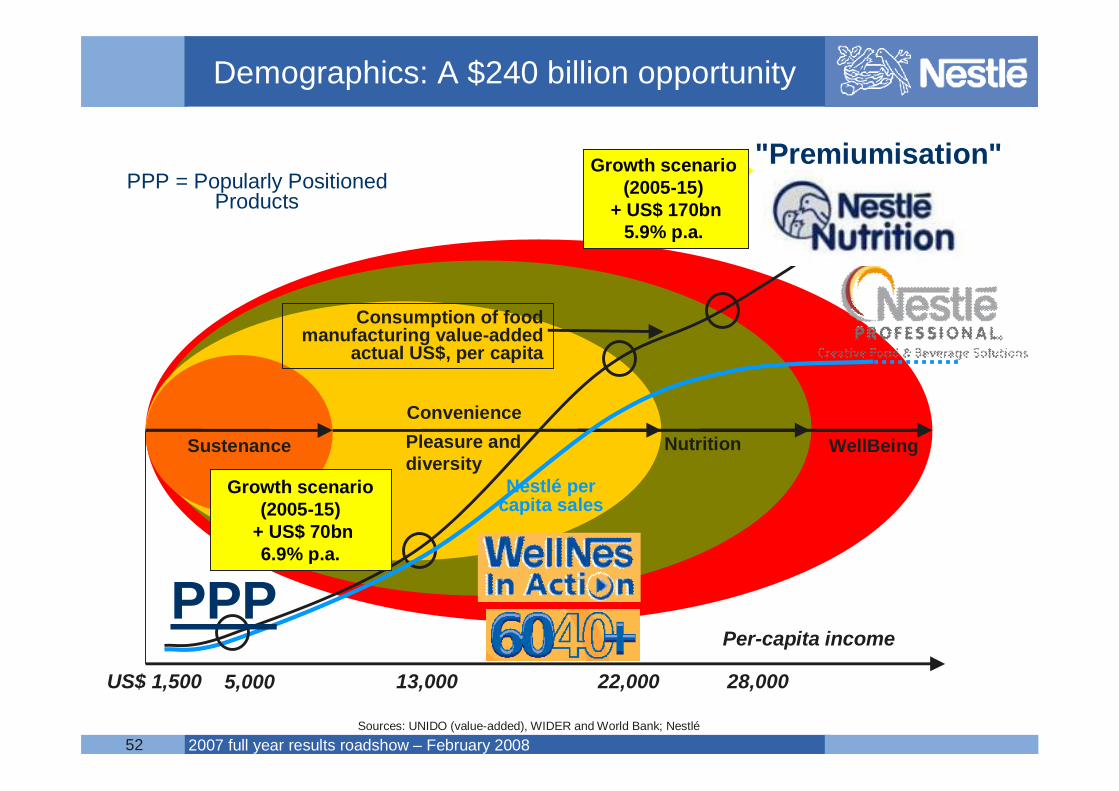
Name of chairman2007 full year results roadshow – February 200852Sources: UNIDO (value-added), WIDER and World Bank; Nestlé
Demographics: A $240 billion opportunity
US$ 1,500
Sustenance Pleasure anddiversity
Convenience
5,000 13,000 22,000
Per-capita income
28,000
"Premiumisation"Growth scenario (2005-15)
+ US$ 170bn5.9% p.a.
Growth scenario (2005-15)
+ US$ 70bn6.9% p.a.
PPP
Consumption of food manufacturing value-added
actual US$, per capita
Nutrition WellBeing
Nestlé per capita sales
PPP = Popularly PositionedProducts
Name of chairman2007 full year results roadshow – February 200853
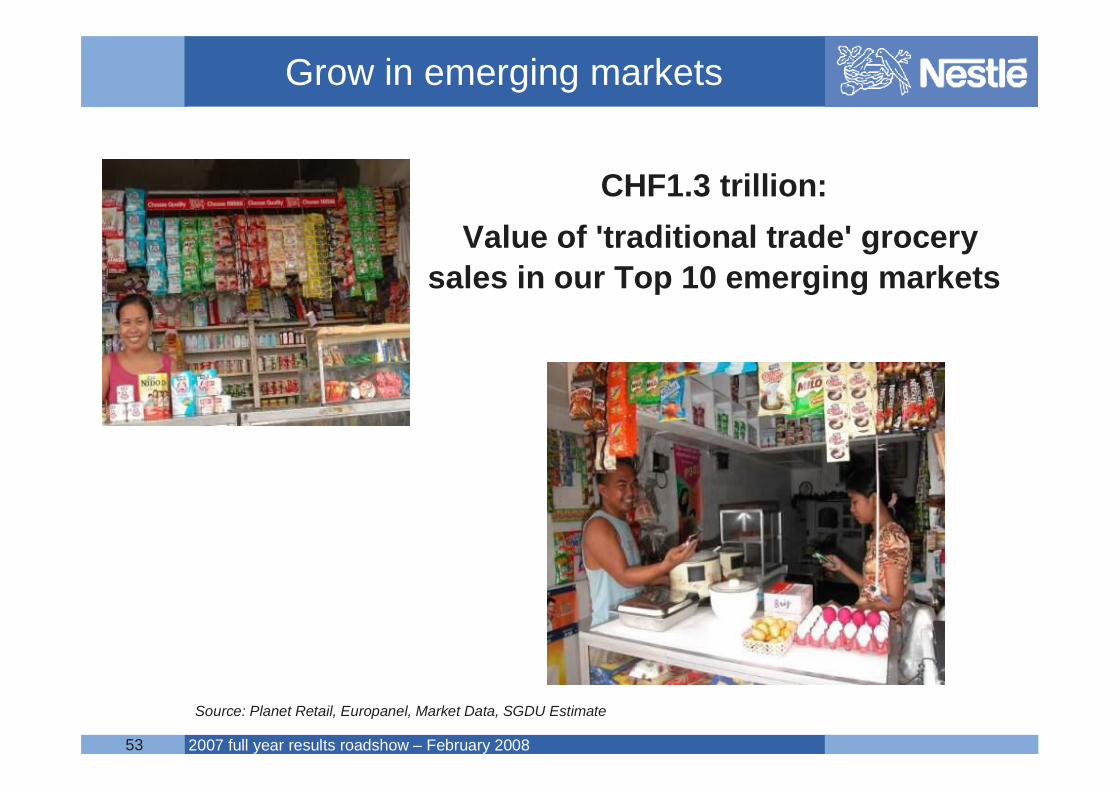
CHF1.3 trillion:Value of 'traditional trade' grocery
sales in our Top 10 emerging markets
Grow in emerging markets
Source: Planet Retail, Europanel, Market Data, SGDU Estimate

Name of chairman2007 full year results roadshow – February 200854
Emerging markets and PPP –A $70 billion opportunity

Name of chairman2007 full year results roadshow – February 200855
People, mn
Sources: UN WIDER and World Bank (also for outlook on economic growth 2005-2015);
+ 355
+ 885+ 133
+ 230
+ 448
+ 199
1970 1653 1429
2153 26012354
710940 1825
389522
443175
235286
295
494
849
0
1'000
2'000
3'000
4'000
5'000
6'000
7'000
1995 2005 2015
> 28'000
22'000-28'000PPP$
13'000-22'000PPP$
5'000-13'000PPP$
1500-5000 PPP$
< 1500 PPP$
Moving up on the escalator: World population by income bracket – 1995-2005-2015

Name of chairman2007 full year results roadshow – February 200856
Premiumisation
3. Own Retail Outlets
2. Strong Emotional Affiliation
Boutiques & BarsGift boxes
4. Own the Expert Client Community1. True Product
Differentiation
Name of chairman2007 full year results roadshow – February 200857
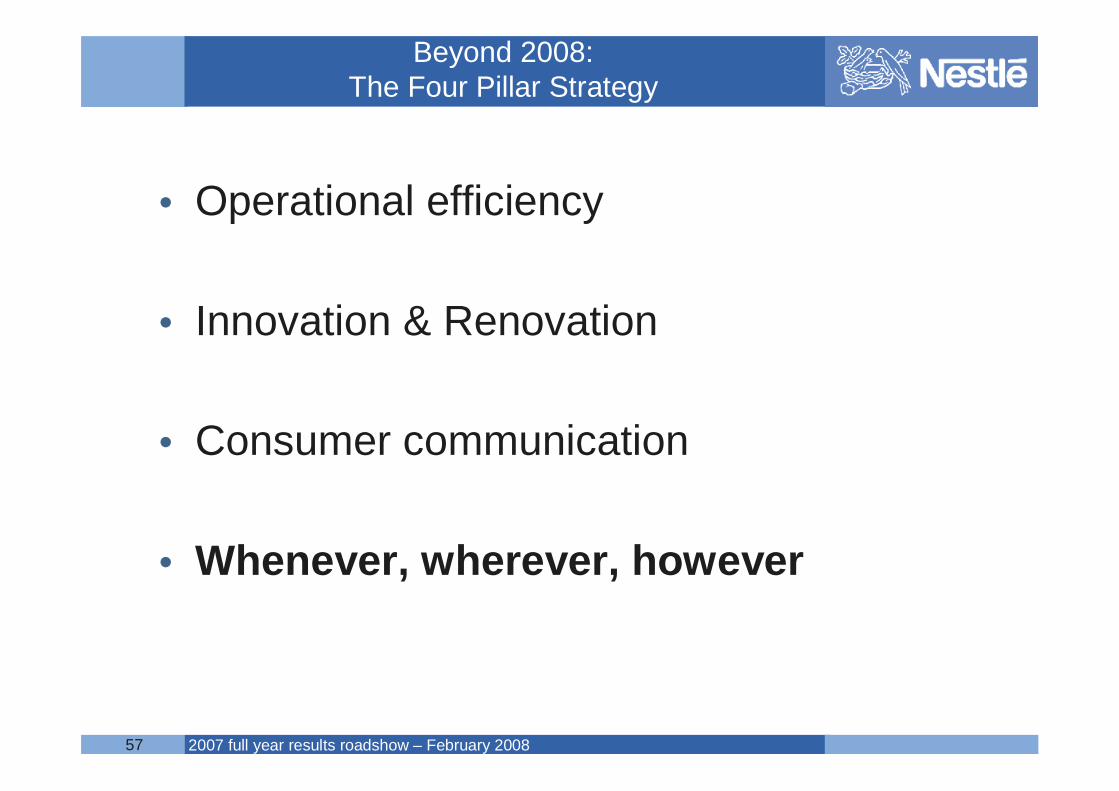
• Operational efficiency
• Innovation & Renovation
• Consumer communication
• Whenever, wherever, however
Beyond 2008:The Four Pillar Strategy

Name of chairman2007 full year results roadshow – February 200858
• Due to shifts in demographics and socio-economic factors foodservice represents an increasingly important consumer option
• Consumer demand for convenience, taste & nutrition is driving foodservice growth in all markets
• In mature economies, OOH spend today accounts for 30-50% of consumer food & beverage purchases
• The trend is for further long term growth in OOH consumption
Out of home (OOH)A growing trend & a $400 billion market

Name of chairman2007 full year results roadshow – February 200859
“The global leader in branded hot and cold
non-carbonated Beverage solutions”
“The local and regional leader in strategic food
product solutions”
Name of chairman2007 full year results roadshow – February 200860
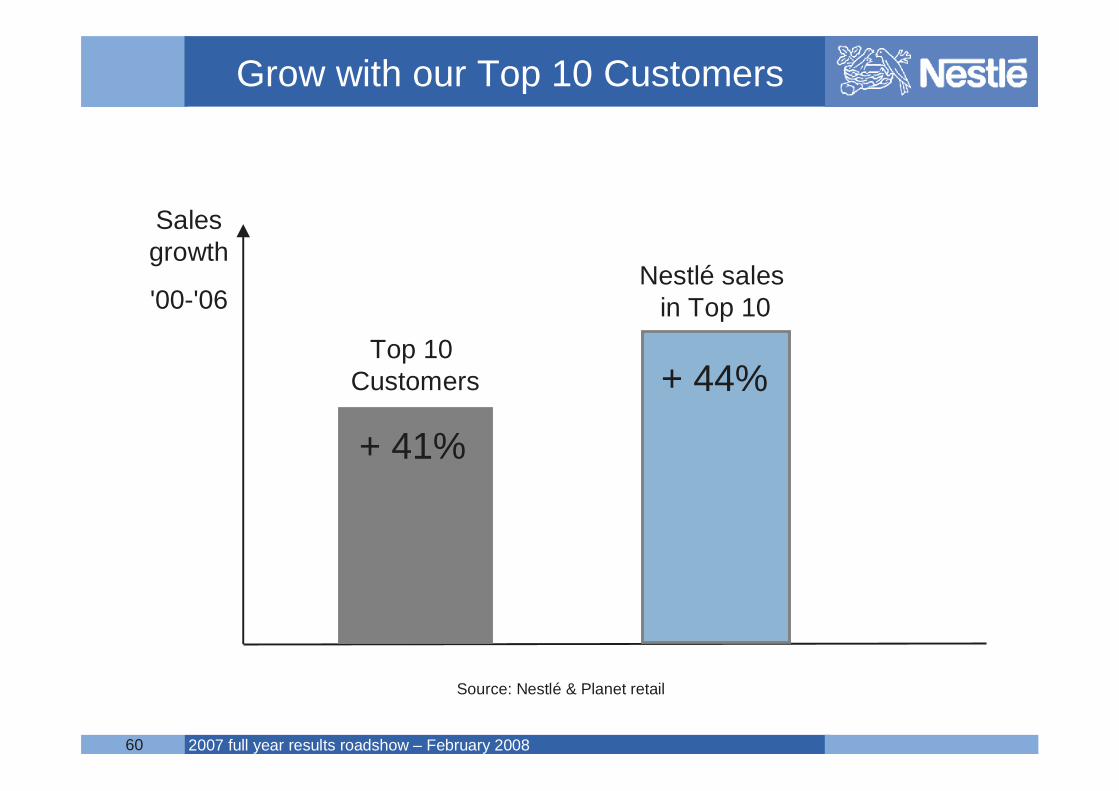
Sales growth
'00-'06
Top 10 Customers
Grow with our Top 10 Customers
Source: Nestlé & Planet retail
+ 41%
+ 44%
Nestlé sales in Top 10

Name of chairman2007 full year results roadshow – February 200861
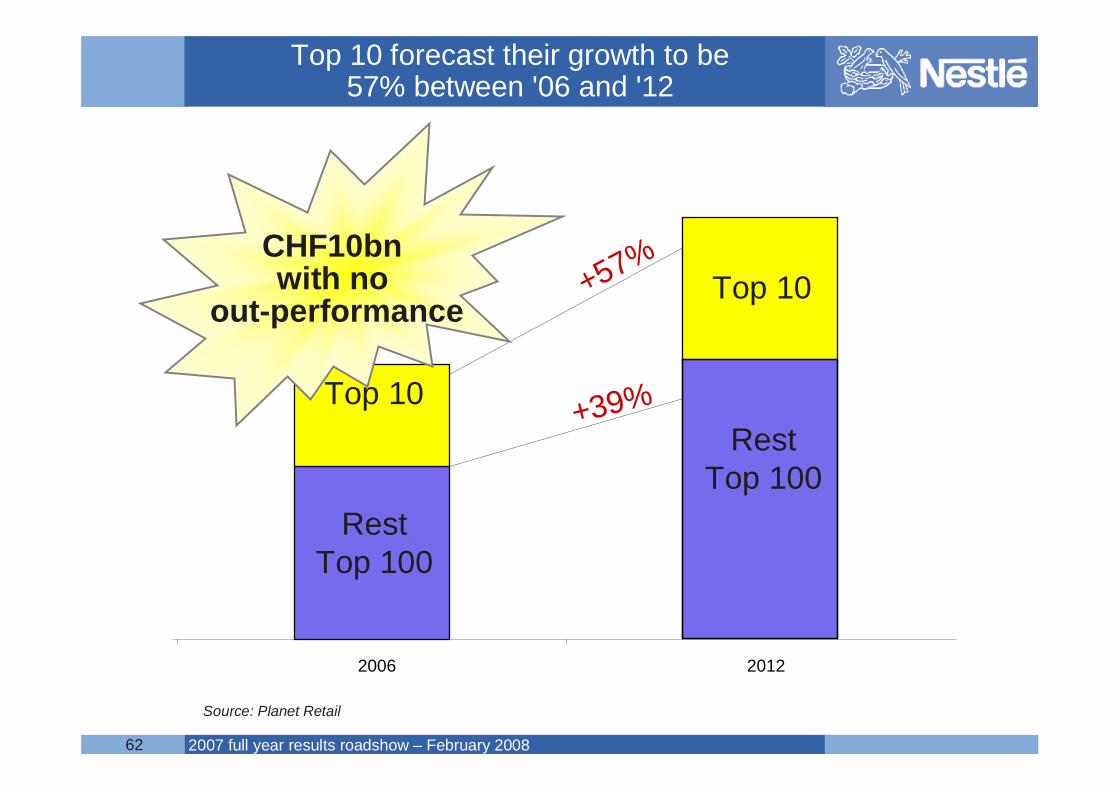
2006 2012
RestTop 100
Top 10
Top 10
+39%
+57%
RestTop 100
Source: Planet Retail
Top 10 forecast their growth to be57% between '06 and '12
Name of chairman2007 full year results roadshow – February 200862
2006 2012
RestTop 100
Top 10
Top 10
+39%
+57%
RestTop 100
Source: Planet Retail
Top 10 forecast their growth to be57% between '06 and '12
CHF10bn with no
out-performance

Name of chairman2007 full year results roadshow – February 2008
We intend to make Nestlé the referencefor both Nutrition, Health & Wellness
and for Financial Performance
Summary

Name of chairman2007 full year results roadshow – February 200864
Deliver the strategy – continuity• Nutrition, Health & Wellness higher margin/growth categories• Organisational Transformation structural efficiencies & growth• Key growth opportunities above market growth
Build on the Competitive advantages – to higher levels• Brand, presence, people, R&D Profitable growth• Leverage GLOBE, GNBS Nestlé Continuous Excellence• Discipline & accountability swift, flawless execution
"The Result" – enhanced financial performance• Achieve "the Nestlé Model" with greater capital efficiency
Beyond 2008:Building on momentum to drive performance

Name of chairman2007 full year results roadshow – February 200865
The Nestlé Investment Proposition“The Nestlé Model”
1. Long-Term Organic Growth Target 5 - 6%
Resulting in an industry outperforming, long-term total shareholder return
2. Continued year after year improvement of EBIT margin
3. Improving Capital efficiency / Business ROIC / Cash returns to shareholders
EBIT
Sales
Name of chairman2007 full year results roadshow – February 200866