FloBoss 107 Flow Manager Instruction Manual -...FloBoss™ 107 ...

NEAH BAY SECTION 107 NAVIGATION IMPROVEMENT PROJECT
NEAH BAY, WASHINGTON
APPENDIX A
ECONOMICS

NEAH BAY SECTION 107 NAVIGATION IMPROVEMENT PROJECT,
WASHINGTON ECONOMIC APPENDIX A
June 2020

Page left blank intentionally

Neah Bay Economic Appendix A – June 2020 Page 3
Table of Contents
1 INTRODUCTION ..................................................................................................................................... 6
1.1 Federal Study Authority ................................................................................................................ 6
1.2 Purpose and Scope of Study ......................................................................................................... 6
1.3 Location and Description .............................................................................................................. 6
1.4 Problem Statement ....................................................................................................................... 7
2 SOCIO-ECONOMIC ENVIRONMENT & DEMOGRAPHIC PROFILE OF STUDY AREA ................................ 8
2.1 Demographics ............................................................................................................................... 8
2.2 Economic Activities ....................................................................................................................... 9
3 EXISTING AND HISTORICAL CONDITIONS ............................................................................................ 11
3.1 Vessel Operations ....................................................................................................................... 12
3.2 Vessel Fleet ................................................................................................................................. 13
3.3 Harbor of Refuge ......................................................................................................................... 17
4 WITHOUT-PROJECT CONDITIONS AND FLEET PROJECTION ................................................................ 18
4.1 Design Fleet ................................................................................................................................. 18
4.2 Other Considerations .................................................................................................................. 21
5 ALTERNATIVES FOR EVALUATION ....................................................................................................... 22
5.1 Non-structural Measures ............................................................................................................ 22
5.2 Structural Measures .................................................................................................................... 23
6 ALTERNATIVES EVALUATION .............................................................................................................. 24
6.1 Methodology and Selection Criteria ........................................................................................... 24
6.2 Benefit Cost Analysis ................................................................................................................... 26
7 Depth Optimization ............................................................................................................................. 27
8 Sensitivity Analysis .............................................................................................................................. 28
8.1 Fuel and Draft Sensitivity ............................................................................................................ 28
8.2 Vessel Draft Sensitivity ................................................................................................................ 29
8.3 Vessel Fleet Sensitivity ................................................................................................................ 30
9 Multiport Analysis ............................................................................................................................... 32
10 NED Employment Benefits .............................................................................................................. 32
11 References ...................................................................................................................................... 33

Neah Bay Economic Appendix A – June 2020 Page 4
Table of Tables
Table 3-1: Emergency Response Towing Vessel Dimensions...................................................................... 15 Table 3-2: Emergency Response Vessel Dimensions .................................................................................. 17 Table 3-3: Fishing Vessel Dimensions ......................................................................................................... 17 Table 3-4: Harbor of Refuge Vessel Specifications ..................................................................................... 17 Table 4-1: Vessel DWT Transiting the Strait of Juan de Fuca, 2004-2016 .................................................. 19 Table 4-2: Vessels with Operations in the Puget Sound Region ................................................................. 19 Table 4-3: Foss and Crowley Vessel Specifications ..................................................................................... 20 Table 4-4: Future Oil Spill Response Vessel Dimensions ............................................................................ 21 Table 4-5: Fishing Vessel Dimensions ......................................................................................................... 21 Table 4-6: Fish Processing Vessel Dimensions ............................................................................................ 22 Table 5-1: Channel Modifications by Alternative ....................................................................................... 23 Table 6-1: Estimated Annual Tide-Related Movements ............................................................................. 25 Table 6-2: Tide-Related Transportation Cost by Channel Depth (2018 Price Level) .................................. 26 Table 6-3: Tide-Related Movements Cost Benefit Analysis Summary, 2.875% discount rate .................... 26 Table 6-4: Cost Summary (October 2018 Price Level, FY18 2.875 Percent Discount Rate) ........................ 26 Table 6-5: Benefit Cost Analysis .................................................................................................................. 27 Table 7-1: Channel Depth Optimization ..................................................................................................... 27 Table 8-1: Fuel Price Regression Statistics .................................................................................................. 28 Table 8-2: Net Excess Benefits by Vessel Draft ........................................................................................... 29 Table 8-3: World ERTV Fleet with 100+ Short Tons Bollard Pull ................................................................. 30 Table 8-4: Fleet Distribution ....................................................................................................................... 31 Table 8-5: Sensitivity Fleet Distribution Benefit Cost Summary ................................................................. 31

Neah Bay Economic Appendix A – June 2020 Page 5
Table of Figures
Figure 1-1: Neah Bay Project Location .......................................................................................................... 7 Figure 2-1: Map of Neah Bay Study Area ...................................................................................................... 8 Figure 2-2: Race and Ethnicity ...................................................................................................................... 9 Figure 2-5: Median Household Income ....................................................................................................... 10 Figure 2-6: Occupation as Percentage Civilian Population 16 and Older ................................................... 11 Figure 3-1: Channel Reliability .................................................................................................................... 12 Figure 3-3: ERTV Deployments (1999-2016) ............................................................................................... 15 Figure 3-4: Denise Foss ............................................................................................................................... 16 Figure 5-1: Graphical representation of ERTV Emergency Coverage in the VTRA Model .......................... 23 Figure 6-1: Channel Reliability by Project Depth ........................................................................................ 24 Figure 8-1: Net Excess Benefits by Scenario ............................................................................................... 29
Attachments
Attachment 1 ………………………………………………………………………………………………………………………………………35 Attachment 2 ………………………………………………………………………………………………………………………………………37

Neah Bay Economic Appendix A – June 2020 Page 6
1 INTRODUCTION “The role of the U. S. Army Corps of Engineers with respect to navigation is to provide safe, reliable, and efficient waterborne transportation systems (channels, harbors, and waterways) for movement of commerce, national security needs, and recreation. The Corps accomplishes this mission through a combination of capital improvements and the operation and maintenance of existing projects.” (U.S. Army Corps of Engineers, 2000)
1.1 Federal Study Authority Section 107 of the River and Harbor Act of 1960, as amended, provides authority for the Corps of Engineers to plan and construct small navigation projects that have not already been specifically authorized by Congress. A project is accepted for construction only after detailed investigation shows its engineering feasibility, environmental acceptability, and economic justification. Each project must be complete within itself, not part of a larger project. The maximum federal expenditure per project is $10 million, which includes both planning and construction costs. Any additional costs must be paid by the non-federal sponsor. Costs of lands, easements, and operation and maintenance of the project (other than certain maintenance dredging) must be non-federal.
1.2 Purpose and Scope of Study The purpose of the proposed Federal action is to achieve transportation cost savings resulting in National Economic Development (NED) benefits. Channel depth and width constraints can lead to tide delays, light loading, or other operational inefficiencies resulting in economic inefficiencies and additional costs to the national economy.
The purpose of this Economic Appendix is to help identify, describe, and compare the list of alternatives with respect to benefits and costs. This analysis allows for a risk-informed selection of a recommended plan. The economic analysis is prepared in a level of detail commensurate with the complexity of the project. The analysis is not intended to be exhaustive, but to provide sufficient data to document the steps used in formulating and identifying the recommended plan.
1.3 Location and Description The project is located at the entrance channel to the Port of Neah Bay. Neah Bay is an isolated community at the northwest tip of the Olympic Peninsula in Washington State, 170 miles northwest of Seattle, Washington (Figure 1-1). Neah Bay is located at the entrance of the Strait of Jaun de Fuca, which connects the Pacific Ocean to the internal waters of Puget Sound and British Columbia (the Salish Sea).

Neah Bay Economic Appendix A – June 2020 Page 7
Figure 1-1: Neah Bay Project Location
1.4 Problem Statement The current controlling depth of -19ft MLLW and entrance channel width of 200ft, along with navigation challenges such as weather, wave action, turbulent seas, and rock obstacles, restrict the size of vessels that can safely and efficiently transit the channel at Neah Bay. Current conditions allow vessels with a maximum draft of 15 feet or less to safely enter the bay with no tide restrictions. Commercial and rescue vessels tend to draft greater than 15 feet, causing face significant operating challenges and costs related to the current channel depth at Neah Bay.
Neah Bay
Seattle
Vicinity Map
Location Map
N
N

Neah Bay Economic Appendix A – June 2020 Page 8
2 SOCIO-ECONOMIC ENVIRONMENT & DEMOGRAPHIC PROFILE OF STUDY AREA
2.1 Demographics Neah Bay is in Clallam County, Washington (ZIP 98357) inside of the Makah Reservation lands. The Makah Reservation1 is relatively isolated from other communities within Clallam County, the Olympic Peninsula and Washington State. Clallam County’s major commercial center and county seat, Port Angeles, is 75 miles from Neah Bay. Seattle is 150 miles away, and Forks, the closest town, is 60 miles away. A map of Neah Bay is provided by Figure 2-1.
Figure 2-1: Map of Neah Bay Study Area
2.1.1 Age Distribution and Population Neah Bay is a small rural town within the Makah Indian Reservation with a population less than one thousand. The 2010 census marked the population at 865 with 9% population growth from the previous census in 2000. The median age in Neah Bay is approximately 36.7 years old with 55% of the population male to 45% female.
2.1.2 Race and Ethnicity Neah Bay is located within the Makah Reservation. Approximately 70 percent of the population identifies as Native American (Races in Neah Bay, 2016). Figure 2-2 summarizes race and ethnicity statistics for Neah Bay.
1 Neah Bay and the Makah Reservation, for the purpose of this document, are synonymous and may be used interchangeably throughout this document.

Neah Bay Economic Appendix A – June 2020 Page 9
Figure 2-2: Race and Ethnicity
2.2 Economic Activities
2.2.1 Income and Employment The median annual household income of Neah Bay is approximately $32k—roughly half of the median household income for the State of Washington (Figure 2-3). According to City-Data.com, the 2017 unemployment rate for Neah Bay is 7 percent, nearly 2.2 percent higher than Washington State2.
2 http://www.city-data.com/city/Neah-Bay-Washington.html

Neah Bay Economic Appendix A – June 2020 Page 10
Figure 2-3: Median Household Income
Agriculture (general farming, forestry, fishing, and hunting) and Public Administration account for 18% and 15% of employment at Neah Bay, respectively (Population of Neah Bay, Washington, 2016). Figure 2-4 summarizes estimated occupation statistics for Neah Bay.

Neah Bay Economic Appendix A – June 2020 Page 11
Figure 2-4: Occupation as Percentage Civilian Population 16 and Older
3 EXISTING AND HISTORICAL CONDITIONS The existing conditions are defined as the project conditions that exist as of 2019. Currently, the Neah Bay Harbor entrance channel is -19ft MLLW. A 1,450ft rubble mound and 350ft grounded bridge pontoon combine to form a Federal breakwater at the north end of the harbor to provide wave protection. Neah Bay includes the Makah Marina, which consists of over 200 slips for vessels from 30 to 70 feet as well as some accommodations for vessels over 100 feet. Makah Marina has depths up to -26 feet MLLW. There is also a US Coast Guard station and dock located to the east of Makah Marina.

Neah Bay Economic Appendix A – June 2020 Page 12
3.1 Vessel Operations Vessels frequently calling Neah Bay include permanently-stationed Emergency Response Towing Vessels (ERTVs), Emergency Oil Response Tugs, fishing vessels, and pleasure crafts. Makah Marina is 1.2 nautical miles from the channel entrance between Waadah Island to the north and Baada Point to the South. Transit to the Strait of Juan de Fuca takes approximately 15 minutes with a main channel speed between 5 and 9 knots. Given the average size of vessels at Neah Bay, the channel is predominantly two-way.
3.1.1 Underkeel Clearance The measure of underkeel clearance (UKC) for economic studies is applied according to planning guidance. According to this guidance, UKC is evaluated based on actual vessel operator and pilot practice within a harbor and subject to present conditions, with adjustment as appropriate for with-project conditions. Generally, practices for UKC are determined through review of written pilotage rules and guidelines, interviews with pilots and vessel operators, and analysis of actual past and present practices based on relevant data for vessel movements.
Discussion with the Port of Neah Bay and Foss Maritime indicates a standard UKC of approximately 2 feet in the channel. This estimate is based on historical channel use as well as expectations of future channel use and is consistent with engineering safety recommendations in EM 1110-2-1613.
3.1.2 Tidal Range Neah Bay experiences a 13-foot tidal range. With 19 feet of channel depth and two feet of UKC, current channel depth allows 100 percent access for vessels drafting 15 feet and less. As larger vessels with deeper sailing drafts call at Neah Bay, channel depth availability will continue to be a constraint on vessel operations. Figure 3-1 presents annual channel reliability. The existing, 19-foot depth is available 89 percent of the year, or approximately 21 of every 24 hours in an aggregate tidal cycle.
Figure 3-1: Channel Reliability
0%
10%
20%
30%
40%
50%
60%
70%
80%
90%
100%
16 17 18 19 19.5 20 21 22 23 24 25 26 27 28 29 30
AVER
AGE
ANN
UAL
% R
ELIA
BILI
TY
DEPTH (MLLW)

Neah Bay Economic Appendix A – June 2020 Page 13
3.2 Vessel Fleet This section discusses four vessel types which use the harbor and could be impacted by channel improvements: emergency response towing vessels (ERTVs), oil spill response vessels, fishing vessels, and harbor of refuge vessels currently operating at Neah Bay.
3.2.1 Emergency Response Towing Vessel (ERTV) The National Oil and Hazardous Substances Pollution Contingency Plan, more commonly called the National Contingency Plan (NCP), is the federal government's blueprint for responding to both oil spills and hazardous substance releases. The National Contingency Plan is the result of the country's efforts to develop a national response capability and promote overall coordination among the hierarchy of responders and contingency plans. Several of the worst oil spills in the State of Washington waters have occurred at the entrance of the Straits of Juan de Fuca. The marine waters and coast contain natural resources that are critical to the Makah Tribe. There is also 2,408 square miles of protected habitat on the west coast of the Olympic Peninsula which is part of NOAA’s Olympic Coast National Marine Sanctuary. The region contains numerous protected or listed species and their critical habitat, including orca, salmon, rockfish, migrating birds, and seals.
The mission of the Northwest Area Committee is to ensure efficient and coordinated support of federal, state, tribal and local responses to oil spills as mandated by the National Contingency Plan. As part of this, the state of Washington requires a permanently-station ocean going rescue tug at Neah Bay in addition to oil spill response vessels and equipment at Neah Bay. The State of Washington’s Department of Ecology funded an ERTV at Neah Bay from 1999 to 2010. As of July 1, 2010 and per RCW 88.46.130, “the owner or operator of a covered vessel transiting to or from a Washington port through the Strait of Juan de Fuca, except for transits extending no further west than Race Rocks light, shall establish and fund an emergency response system that provides for an emergency response towing vessel to be stationed at Neah Bay” (Legislature, RCW 88.46.130, 2009). As a result, the Marine Exchange of Puget Sound created the Emergency Response Towing Vessel Compliance group to fund and manage the permanently-stationed ERTV at Neah Bay. The following are the legal requirements established by RCW 88.46.135 (Legislature, RCW 88.46.135, 2009):
(1) Covered vessels that are subject to requirements specified in RCW 88.46.130 must provide at least one emergency response towing vessel that must be:
a. Stationed at Neah Bay; and b. Continuously available and capable of responding to any vessel emergency, including
but not limited to: i. Loss or serious degradation of propulsion, steering, means of navigation,
primary electrical generating capability, or sea keeping capability; ii. Uncontrolled fire;
iii. Hull breach; or iv. Oil spill
(2) An emergency response towing vessel must be capable of: a. Deploying at any hour of any day to provide emergency assistance;

Neah Bay Economic Appendix A – June 2020 Page 14
b. Being underway within twenty minutes of a decision to deploy, with adequate crew to safely remain underway for at least forty-eight hours;
c. Effectively employing a ship anchor chain recovery hook and line throwing gun; d. A bollard pull of at least seventy short tons; and e. Effectively operating in severe weather conditions with sustained winds measured at
forty knots and wave heights of twelve to eighteen feet, including: i. Holding position within one hundred feet of another vessel; and
ii. Making up to, stopping, holding, and towing a drifting or disabled vessel of one hundred eighty thousand metric dead weight tons
(3) An emergency response towing vessel must be equipped with: a. A ship anchor chain recovery hook b. A line throwing gun; and c. Appropriate equipment for:
i. Damage control patching; ii. Vessel dewatering;
iii. Air safety monitoring; and iv. Digital photography
(4) The requirements of this section may be fulfilled by a private organization or nonprofit cooperative providing umbrella coverage under contract to a single or multiple covered vessels. If a nonprofit cooperative is formed or used to meet the requirements of this section, it shall equitably apportion costs to each participating covered vessel based on risk associated with particular classes of covered vessels, navigational and structural characteristics of covered vessels, and the number of covered vessel transits in state waters in the Strait of Juan de Fuca, as defined in RCW 88.46.130(6).
(5) The department is authorized to contract with an emergency response towing vessel provided under this section. Any use by the department must be paid by the department.
(6) Covered vessels that are required to provide an emergency response towing vessel may not restrict the emergency response towing vessel from responding to noncovered vessels in distress.
(7) Nothing in this section prohibits a covered vessel, private organization, or nonprofit cooperative from contracting with an emergency response towing vessel with capabilities exceeding requirements specified in this section.
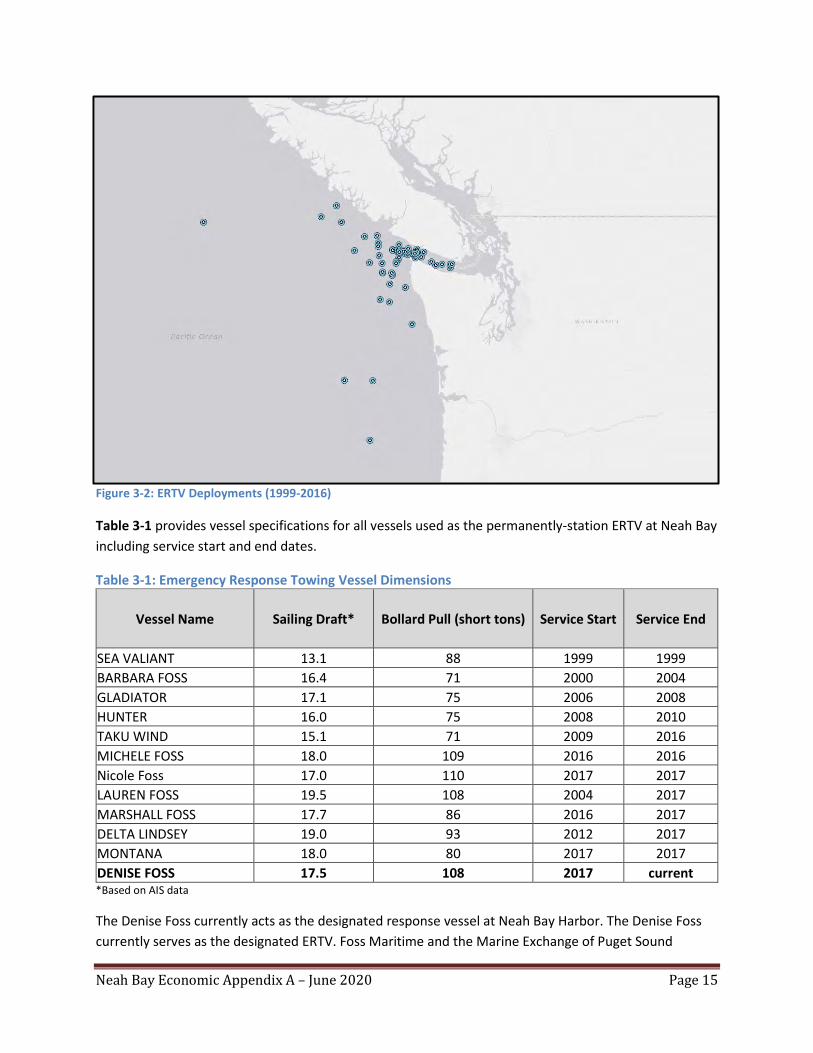
From 1999 to 2016, the dedicated rescue tug at Neah Bay has deployed to stand by or directly assist 57 vessels that were disabled or had reduced maneuvering ability. The Department of Ecology of the State of Washington estimates that this prevented as much as 18.7 million gallons of spilled fuel. Figure 3-2 provides a map of all ERTV deployments from 1999 to 2016 (Ecology, 2016).
Neah Bay Economic Appendix A – June 2020 Page 15
Figure 3-2: ERTV Deployments (1999-2016)
Table 3-1 provides vessel specifications for all vessels used as the permanently-station ERTV at Neah Bay including service start and end dates.
Table 3-1: Emergency Response Towing Vessel Dimensions
Vessel Name Sailing Draft* Bollard Pull (short tons) Service Start Service End
SEA VALIANT 13.1 88 1999 1999 BARBARA FOSS 16.4 71 2000 2004 GLADIATOR 17.1 75 2006 2008 HUNTER 16.0 75 2008 2010 TAKU WIND 15.1 71 2009 2016 MICHELE FOSS 18.0 109 2016 2016 Nicole Foss 17.0 110 2017 2017 LAUREN FOSS 19.5 108 2004 2017 MARSHALL FOSS 17.7 86 2016 2017 DELTA LINDSEY 19.0 93 2012 2017 MONTANA 18.0 80 2017 2017 DENISE FOSS 17.5 108 2017 current *Based on AIS data The Denise Foss currently acts as the designated response vessel at Neah Bay Harbor. The Denise Foss currently serves as the designated ERTV. Foss Maritime and the Marine Exchange of Puget Sound

Neah Bay Economic Appendix A – June 2020 Page 16
anticipate that the Denise Foss will continue to serve as the designated ERTV into 2020.The Denise Foss meets or exceeds all requirements of RCW 88.46.135 and is expected to remain at Neah Bay as the permanently stationed ERTV at least through 2020. Figure 3-3 provides a picture of the Denise Foss.
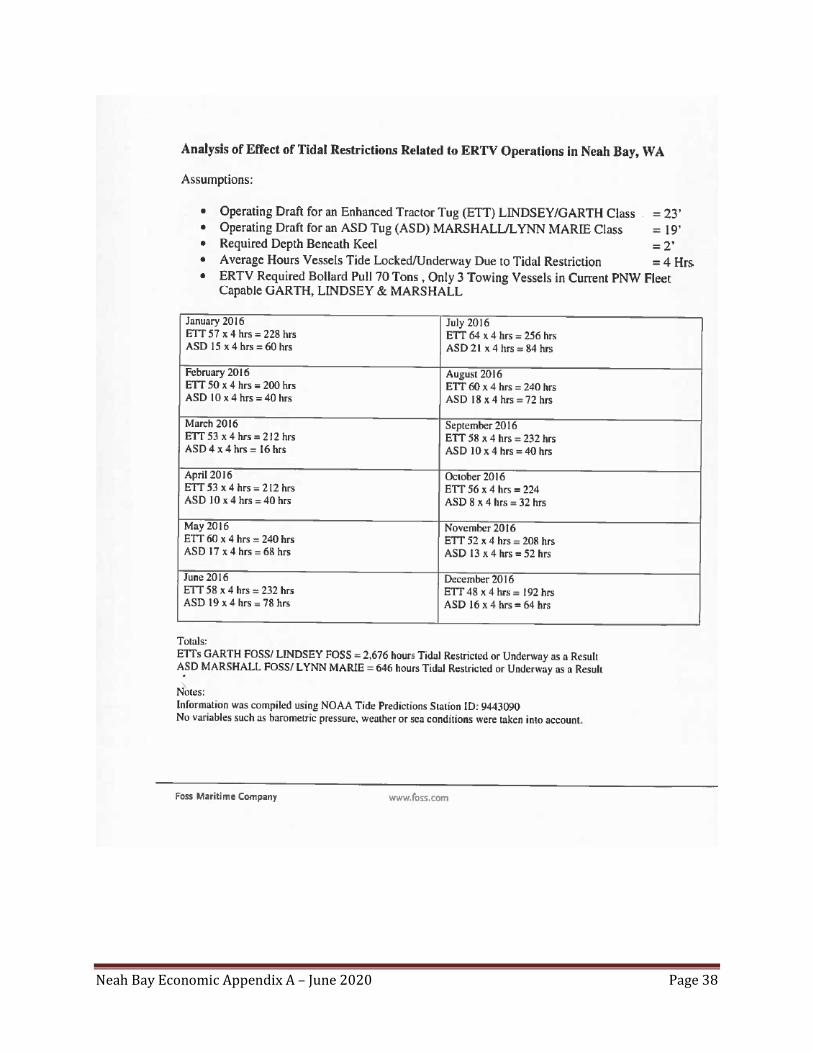
Figure 3-3: Denise Foss Per RCW 88.46.130, the ERTV must be able to immediately respond to an emergency. Currently, the entrance channel depth prevents 24-hour accessibility for the design ERTV. In order for the emergency tugs to maintain their response capability, they must leave Neah Bay Harbor for deeper water during low tide events. Depending on the draft of the emergency response vessel, these tide-induced transits can take place as often as once per day. From the time the vessel leaves berth to the time it returns to dock, these transits last an average of 4 hours (Attachment 2). The sensitivity analysis (Section 1) tests the impact of these assumptions.
3.2.2 Oil Spill Response Vessel The entrance of the Strait of Juan de Fuca frequently experience severe coastal weather conditions. Combined with high volumes of traffic in the area, there is a high risk of vessel accidents. Neah Bay is the primary location for ocean going emergency tugs that rescue/aid vessels along this route. Both the for-profit National Response Corporation (NRC) and the not-for-profit Marine Spill Response Corporation (MSRC) maintain vessels (NRC Cape Flattery and the Arctic Tern, respectively) at or near Neah Bay to respond to oil spills. Table 3-2 provides deadweight tonnage (DWT) and dimensions for vessels currently operated out of Neah Bay by NRC and MSRC. The barge Kenny can be integrated with a tow to respond to an oil spill.

Neah Bay Economic Appendix A – June 2020 Page 17
Table 3-2: Emergency Response Vessel Dimensions
Name DWT LOA (ft) Beam (ft)
Operating Draft (ft) UKC (ft) Horsepower
NRC Cape Flattery 170 110 26 9.8 2 1,132 Kenny 4,500 248 56 17.5* 2 0 Arctic Tern N/A N/A N/A 9.5 2 N/A
*fully loaded draft
3.2.3 Fishing Vessels It is estimated that the fishing industry in Neah Bay alone is comprised of 90 small business enterprises representing more than 400 jobs (Council, 2015). The Makah Marina handles roughly 9 million pounds of fish and shellfish annual valued at over $6.5 million (Council, 2015). There are five large commercial fishing vessels owned by Tribal members. These boats fish out of Neah Bay during the Whiting fishery and fish a portion of the year in the Gulf of Alaska. The approximate dimensions of the largest of these vessels is listed in Table 3-3.
Table 3-3: Fishing Vessel Dimensions LOA Beam Draft 59 20 8
3.3 Harbor of Refuge Neah Bay is the nearest Harbor of Refuge to a large part of the Pacific Ocean. Port Angeles (approximately 10 hours away by sea) is the next closest Harbor of Refuge for many vessels. Neah Bay is also used by small vessels as a Harbor of Refuge in dangerous weather conditions. Its proximity to the Straits of Juan de Fuca makes the anchorage essential to small vessels. Fishing vessels operate out of Neah Bay. These vessels fish during the fall when the weather can be especially dangerous. The combination of rough seas and heavily loaded vessels can create delays and safety hazards.
There is no data available on the number of vessels that use Neah Bay as a Harbor of Refuge under their own power; however, the Washington State Department of Ecology maintains records on vessels requiring emergency tug assistance from the emergency tugs kept at Neah Bay. While not an exhaustive list, Table 3-4 provides insight into the size and quantity of vessels that potentially benefit from the use of Neah Bay under emergency conditions. Of the 57 vessels listed, 26 were taken to Port Angeles, 5 were taken to Neah Bay, and 26 either did not require a Harbor of Refuge or were taken to another location.
Table 3-4: Harbor of Refuge Vessel Specifications Vessel Type Vessel Count Avg. DWT Avg LOA (ft) Avg. Breadth (ft) Avg. Draft (ft)
ATB/Tug/Tow/Barge 11 526 124 38 17 Bulk Carrier 11 57,376 618 94 35 Chemical Tanker 1 33,000 599 97 33 Containership 17 35,226 728 97 37 Fish Processing Vessel 1 1,719 295 44 19 Fishing Vessel 6 692 145 31 14

Neah Bay Economic Appendix A – June 2020 Page 18
Vessel Type Vessel Count Avg. DWT Avg LOA (ft) Avg. Breadth (ft) Avg. Draft (ft) General Cargo 4 79,297 710 106 41 Grain Ship 1 28,646 564 89 31 Reefer 2 8,106 437 65 27 Tanker 3 136,841 865 154 52
Additionally, the US Coast Guard operates a station under District 13 at Neah Bay. This station primarily conducts emergency response, environmental protection, and maritime law enforcement operations.
4 WITHOUT-PROJECT CONDITIONS AND FLEET PROJECTION The Without-Project Condition refers to the prevailing conditions over the study period in the absence of a federal project. At Neah Bay the channel configuration will continue to have an effective limiting depth of -19 feet MLLW based on the low shoaling rate.
4.1 Design Fleet EM 1110-2-1613 states "…the design ship or ships are selected on the basis of economic studies of the types and sizes of the ship fleet expected to use the proposed navigation channel over the project life…" The design ship is defined in EM 1110-2-1613 as "…the largest ship of the major commodity movers expected to use the project improvements on a frequent and continuing basis…" The study uses expert elicitation from the Port of Neah Bay and industry in addition to analysis of world fleet and order book data to determine what vessels will most likely use the channel over the project life.
4.1.1 Emergency Response Towing Vessel (ERTV) The analysis determined the ERTV design class dimensions using (1) past vessel deployment, (2) analysis of the world fleet of towing vessels able to meet the legal requirements of RCW 88.46.135, and (3) vessel availability at Neah Bay’s remote location.
Consultation with industry and the port revealed that the current vessel will remain as the primary ERTV stationed at Neah Bay through the end of the current contract in 2020. While the vessel could change once the contract ends, it is likely that a vessel similar to the current vessel will be deployed.
Average DWT of vessels calling the Puget Sound region increased from 48,000 DWTs to 60,000 DWTs from 2004 to 2016, and the region has continued to receive 180,000 DWT vessel calls and larger since 2004 (Table 4-1). New-build tanker and containership sizes continue to increase, putting additional pressure on the ERTV’s emergency response capability, especially given the extreme weather conditions near the Strait of Juan de Fuca. In addition, the pending approval of the Canadian Trans Mountain Expansion Project will likely add to total tanker traffic through the Strait of Juan de Fuca (Trans Mountain Expansion Project Reconsideration Report). While the ERTV Assessment does not apply to vessels calling only on Canadian ports, the ERTV at Neah Bay would be the closest responder to any incident at the mouth of the Strait of Juan de Fuca for U.S. and Canadian traffic and could be hired in an emergency.
RCW 88.46.135 requires the ERTV to “in severe weather conditions, be capable of making up to, stopping, holding, and towing a drifting or disabled vessel of 180,000 metric deadweight tons” (Section 3.2.1). The Washington State Office of Marine Safety Emergency Towing System Task Force recommended that a towing vessel would need at least 100 ton bollard pull and up to 150 bollard pull to effectively respond to

Neah Bay Economic Appendix A – June 2020 Page 19
99 percent of vessels adrift in severe weather conditions3. To meet the legal requirements of RCW 88.46.135, it is most likely that a vessel of at least 100 bollard pull will be necessary.
Table 4-1: Vessel DWT Transiting the Strait of Juan de Fuca, 2004-2016 Year Average DWT Max DWT 2004 48,000 165,000 2005 51,000 193,000 2006 54,000 166,000 2007 54,000 215,000 2008 53,000 167,000 2009 55,000 193,000 2010 57,000 193,000 2011 57,000 193,000 2012 57,000 162,000 2013 56,000 165,000 2014 58,000 193,000 2015 59,000 193,000 2016 60,000 185,000
Source: NNOMPEAS
IHS Sea-web vessel data reveals 1,317 U.S.-flagged, ocean towing vessels that could be used as ERTVs. Of these vessels, 151 met the minimum 70 short ton bollard pull requirement for use at Neah Bay. The average sailing draft of all vessels with at least 70 bollard pull was 17.8 feet. The average of vessels with at least 100 ton bollard pull was 20.3 feet, but roughly 20 percent of these vessels have a sailing draft between 16.5 feet and 18.5 feet. Of all legally acceptable vessels, 17 have operated near the study area (Puget Sound or Strait of Juan de Fuca). These 17 vessels have an average sailing draft of 18 feet, and 30 percent (5 vessels) have a sailing draft between 16.5 feet and 18.5 feet (Table 4-2).
Table 4-2: Vessels with Operations in the Puget Sound Region Vessel Name Constructed Bollard Pull (Short Tons) Draft (ft)
MARS 1970 88 14.7 TAKU WIND 1970 71 15.09 HUNTER 1977 76 16.4 BARBARA FOSS 1976 71 16.5 GUARDSMAN 1976 86 17 DENISE FOSS 2016 108 17.5 MARSHALL FOSS 2001 86 17.7 MONTANA 2014 80 17.9 GUARDIAN 1970 88 19 CORBIN FOSS 2003 106 19.5 LAUREN FOSS 2003 108 19.5 SEA VICTORY 1974 120 19.7
3 https://web.wpi.edu/Pubs/E-project/Available/E-project-011012-222729/unrestricted/Final_Report.pdf

Neah Bay Economic Appendix A – June 2020 Page 20
Vessel Name Constructed Bollard Pull (Short Tons) Draft (ft) ALASKA TITAN 2008 80 20 GULF TITAN 2001 71 20 LINDSEY FOSS 1993 87 20 OCEAN TITAN 2004 80 20 GARTH FOSS 1994 87 20.5
Table 4-3 provides a summary of vessels operated by Foss Maritime, which currently operates the ERTV, and Crowley Maritime Corporation, which operates harbor assist and tanker escort vessels in the Puget Sound region. These firms represent a likely sample of potential contractors in the region capable of fulfilling the requirements of the ERTV. The table includes each vessels’ bollard pull rating, draft, and whether or not they meet the legal requirements to serve as the permanently-stationed ERTV at Neah Bay (Bollard Pull Compliant). From this analysis, there are five vessels within the 16.5-foot to 18.5-foot draft range, the most common draft range.
Table 4-3: Foss and Crowley Vessel Specifications Owner Vessel Name Age Bollard Pull (short tons) Draft (ft) Bollard Pull Compliant
Foss Emmett Foss 2013 13 5 No Foss Iver Foss 1977 33 11.5 No Foss Sandra Foss 1976 46 11.6 No Foss Stacey Foss 1976 46 11.6 No Foss Drew Foss 1977 32 14.6 No Foss Sidney Foss 1976 33 14.6 No Foss Justine Foss 1976 54 14.6 No Crowley Guide 1998 56 17 No Crowley Chief 1999 56 17 No Crowley Protector 1996 60 18 No Crowley Guard 1997 60 18 No Foss Taku Wind 1970 71 12.7 Yes Foss Barbara Foss 1976 71 14.6 Yes Crowley Guardsman 1967 86 17 Yes Foss Denise Foss* 2016 108 17.5 Yes Foss Montana* 2014 80 18 Yes Foss Michele Foss 2015 111 18 Yes Foss Lindsey Foss 1993 87 18.5 Yes Crowley Vigilant* 2008 91 18.7 Yes Foss Corbin Foss 2003 106 19.5 Yes Foss Lauren Foss 2003 108 19.5 Yes Crowley Response 2002 77 20 Yes Foss Nicole Foss 2017 108 20 Yes Crowley Tan'erliq 1999 110 23 Yes Crowley Nanuq 1999 110 24 Yes
*Draft based on AIS data

Neah Bay Economic Appendix A – June 2020 Page 21
The analysis considers the class of vessels with a 16.5-foot to 18.5-foot draft range as the design class and bases the transportation cost savings on a 17.5-foot average draft given that (1) the Denise Foss currently serves as the permanently-stationed ERTV and will continue to serve into 2020, (2) the class of vessels with similar sailing draft as the Denise Foss typically meet both the 70 bollard pull legal requirement and the recommended 100 bollard pull, and (3) the Denise Foss or a vessel of similar dimensions in the Pacific Northwest is reasonably available to serve as the ERTV at Neah Bay.
Over the study period, many vessels will likely serve as the designated ERTV. Many of these vessels may have a shallower draft and many may have a deeper sailing draft than the chosen design fleet. This analysis attempts to select the most likely class of vessels to operate at Neah Bay over the study period. Section 8 addresses the risk and uncertainty around ERTV sailing drafts.
4.1.2 Oil Spill Response Vessels Future Oil Spill Response Vessels will likely remain similar in size to the existing fleet (Table 4-4). Channel width is based on the integrated oil response vessel and barge. While the maximum draft for the oil spill response barge is 17.5 feet, it is typically not loaded deep enough to be constrained by current channel depths. Deeper loading of the oil spill response barge could be an important consideration in the event of an oil spill. A fully loaded barge could be required to transit to Port Angeles or Seattle. The width of the barge is used to determine the design width of the channel.
Table 4-4: Future Oil Spill Response Vessel Dimensions Vessel DWT LOA (ft) Beam (ft) Draft (ft) UKC (ft)
Oil Spill Response Vessel (Large) N/A 210 44 14 2 Oil Spill Response Vessel (Small) N/A 72 30 9.5 2 Oil Spill Response Barge N/A 250 76 17 2
4.1.3 Fishing Vessels Fishing practices at Neah Bay are not expected to change significantly over the study period; consequently, no changes are made to the existing fishing vessel fleet (Table 4-6).
Table 4-5: Fishing Vessel Dimensions LOA (ft) Beam (ft) Draft (ft)
59 20 8
4.2 Other Considerations
4.2.1 Fish Processing Vessels A substantial whiting fishery exists just off the coast from the Makah Reservation. The Makah Tribe has a quota in this fishery that is caught by Tribal members. Current entrance channel dimensions prevent the transit of most fish processing ships requiring the tribe to contract with Seattle processors, which significantly increases the processing costs through increased transportation costs. Processing companies have expressed a desire to bring processing vessels to Neah Bay instead of remaining at sea to service fishing fleets during the fishing season. This could significantly reduce transportation costs as fish processing vessels could use dock power instead of burning fuel at-sea. Table 4-6 provides vessel specifications for potentially benefitting fish processing vessels.

Neah Bay Economic Appendix A – June 2020 Page 22
Table 4-6: Fish Processing Vessel Dimensions Vessel Type Vessel Name Length (ft) Breadth (ft) Draft (ft)
Trawler Island Enterprise 304 46 23 Trawler Kodiak Enterprise 277 83 16 Trawler Seattle Enterprise 294 46 18
4.2.2 Self-Loading Log Vessels The timber industry is a significant employer and significant economic contributor to Neah Bay. Channel modification has the potential to benefit self-loading log vessels. These vessels could be used to transit lumber to destinations such as Seattle, Vancouver, and Tacoma. The timber industry at Neah Bay began in the 1920s (Collins, 1996). Typically, logs were bundled, and formed into rafts drawing up to 20 feet of water and towed to Port Angeles (Thomas, 1949). Today, logs are hauled overland by truck.
4.2.3 Harbor of Refuge Vessels Neah Bay will continue to be used as an important Harbor of Refuge due to its strategic location at the mouth of the Strait of Juan de Fuca. Channel modification could potentially allow large, deeper drafting vessels to enter Neah Bay in emergency situations.
5 ALTERNATIVES FOR EVALUATION Proposed project measures potentially benefit up to six vessel types (Emergency Response Towing Vessels, Oil Spill Response Vessels, fishing vessels, fish processing vessels, logging vessels, and Harbor of Refuge Vessels). While all vessel types could benefit from channel improvements, delay cost reductions for Emergency Response Towing Vessels are currently the only benefits that can be quantified in sufficient detail to count toward NED benefits.
5.1 Non-structural Measures No non-structural measures met the planning objectives of this study. Tide timing is already occurring at Neah Bay; light-loading and lightering do not meet the study objectives. Use of alternative mode and ports was considered but also removed from screening given that RCW 88.46.130 requires the Emergency Response Towing Vessel be located at Neah Bay given its proximity to the entrance of the Strait of Juan de Fuca. Additionally, research confirms the importance of the use of Neah Bay over other ports as the station for an emergency response vessel. “A potential Oil Loss Comparison of Scenario Analysis by four Spill Size Categories” (January 2017) prepared for the Washington State Department of Ecology identified Neah Bay as a critical part of a portfolio of risk management measures recommended to prevent oil spills and significant environmental pollution. Figure 5-1, taken from the report, provides a graphic overview of the risk reduction benefit calculated as part of a larger traffic flow model. Green data points on the map represent vessels’ risk reduction benefit from the Neah Bay “escort” tug (Van Dorp & Merrick, 2017).

Neah Bay Economic Appendix A – June 2020 Page 23
Figure 5-1: Graphical representation of ERTV Emergency Coverage in the VTRA Model
The analysis also considered dedicated use of a shallower drafting ERTV as a non-structural measure. As discussed in Section 4.1.1, this recommendation does not fully consider the requirements of future traffic at the Strait of Juan de Fuca, which will include more transits of large tankers. Additionally, imposing restrictions on The Marine Exchange of Puget Sound’s contract for the ERTV is not operationally practical and limits their ability to meet the ERTV’s legal requirements.
5.2 Structural Measures Channel deepening best addresses the problems and opportunities at Neah Bay Harbor. The following alternatives were developed to address the problems and opportunities persisting in the future without-project condition. Table 5-1 summarizes the proposed channel modifications by alternative. The study evaluates deepening in two-foot increments beyond the existing 19-foot channel depth.
Table 5-1: Channel Modifications by Alternative Alternative Segment Station Length Width Limiting Depth
Alternative 1 (No Action)
Entrance Channel Sta. 0+00 to 45+00 4,500' 300' -19' MLLW Turning Basin Sta. 45+00 to 54+00 600' 600' -19' MLLW
Alternative 2 Entrance Channel Sta. 0+00 to 45+00 4,500' 300' -21’ MLLW Turning Basin Sta. 45+00 to 54+00 600' 600' -21' MLLW
Alternative 3 Entrance Channel Sta. 0+00 to 45+00 4,500' 300' -23' MLLW Turning Basin Sta. 45+00 to 54+00 600' 600' -23' MLLW
Alternative 4 Entrance Channel Sta. 0+00 to 45+00 4,500' 300' -25’ MLLW Turning Basin Sta. 45+00 to 54+00 600' 600' -25’ MLLW

Neah Bay Economic Appendix A – June 2020 Page 24
6 ALTERNATIVES EVALUATION
6.1 Methodology and Selection Criteria NED deep-draft navigation benefits as defined in USACE navigation studies per ER 1105-2-100 and 91-R-13, generally fall into 3 major groups: 1) Reduced cost of transportation 2) Shift in origin or destination and 3) Increased net return to producers from access to new sources of lower cost materials, or access to new and more profitable markets. Reductions in transportation costs are the most significant source of benefits to channel modification at Neah Bay. Transportation cost reduction benefits include the elimination or reduction in transit times, use of larger more efficient vessel loadings, and/or use of alternative mode (e.g. shipping versus truck or rail).
Transportation cost reduction benefits at Neah Bay are evaluated in detail for ERTVs. These vessels accrue the most significant benefits of channel deepening. The results of this analysis are presented in Section 6.1.1.
6.1.1 Tide restrictions The most significant cost savings benefits of project implementation is related to the reduction in costs associated with ERTV tide constraints at Neah Bay. Figure 6-1 depicts channel reliability by proposed project depth with a black line representing required water depth (MLLW) for design vessel transit (including UKC).
Figure 6-1: Channel Reliability by Project Depth
6.1.1.1 Methodology To estimate the total cost savings benefits of the reduction in tide constraints, the total annual cost of tide constraints was estimated for the future without-project condition. The future without-project cost is equal to the annual fuel cost of all tide-related movements. Benefits are defined as the average
16 17 18 19 19.5 20 21 22 23 24 25 26 27 28 29 30 31 32 33 34 35
19 100% 99% 96% 89% 84% 80% 71% 63% 54% 49% 42% 28% 11% 3% 0% 0% 0% 0% 0% 0% 0%
21 100% 100% 100% 99% 98% 96% 89% 80% 71% 63% 54% 49% 42% 28% 11% 3% 0% 0% 0% 0% 0%
23 100% 100% 100% 100% 100% 100% 99% 96% 89% 80% 71% 63% 54% 49% 42% 28% 11% 3% 0% 0% 0%
25 100% 100% 100% 100% 100% 100% 100% 100% 99% 96% 89% 80% 71% 63% 54% 49% 42% 28% 11% 3% 0%
0%
10%
20%
30%
40%
50%
60%
70%
80%
90%
100%
Aver
age
Annu
al R
elia
bilit
y
Depth (MLLW)
Desi
gn V
esse
l Dra
ft +
UKC

Neah Bay Economic Appendix A – June 2020 Page 25
annual fuel cost reduction resulting from fewer overall tide-induced movements. Other vessel operating costs, such as crew, maintenance, and store costs are not impacted by any alternative because the crew and vessel must be maintained whether at-dock or at-sea given the requirements of RCW 88.46.130.
Estimates of annual tide-induced movements are supported by evidence of historical movements of the ERTV vessels provided by Foss Maritime in Attachment 2. The Maritime Exchange of Puget Sound, who contracts Foss Maritime and pays for ERTV expenses, provided an average annual fuel cost per month for tide-related movements, supporting the results of this analysis (see Attachment 1).
6.1.1.2 National Economic Development (NED) Benefit Determination The project considers cost savings for ERTV vessels as NED benefits given the resulting fee reduction for commercial vessels associated with a reduction in ERTV costs. The attached letter from Marine Exchange of Puget Sound explains that ERTV fees charged to “covered” vessels (mainly tankers) as required by RCW 88.46.130 in protecting natural resources of the Washington Coast including Olympic Coast National Marine Sanctuary, US Fish and Wildlife Service Refuges at Flattery Rocks, Dungeness, and San Juan Islands, and state Marine Protected Areas in the Puget Sound would drop given cost savings at Neah Bay (Attachment 1).
6.1.1.3 Transportation Cost Savings Benefit Analysis Table 6-1 estimates total annual movements required by the ERTV to avoid tide constraints by alternative depth. This total was calculated using the average of NOAA’s Annual Tide Predictions for 2015 through 2017. The study assumes that the ERTV will need to leave the channel for approximately 4 hours any time usable channel depth falls below 19.5 feet (ERTV design draft plus 2-foot UKC). From 2015 through 2017, the channel depth fell below 19.5 feet an average of 217 times per year4. Pilot consultation and AIS data analysis confirm that the ERTV is likely to need to leave the channel for roughly 4 hours anytime available depth falls below 19.5 feet. Recognizing that over the 50-year study period, different weather conditions, pilots, and vessels will lead to variation around this controlling depth, 19.5 feet is meant to be an estimate of the average depth for which the ERTV will leave port.
Table 6-1: Estimated Annual Tide-Related Movements
Year Channel Depth 19’ 21’ 23’ 25’
2015 218 30 0 0 2016 213 29 0 0 2017 220 30 0 0
2015-2017 Average 217 30 0 0 The study assigned an average cost to each tide-related movement based on the vessels’ average fuel consumption during tide-related movements (120 gallons per typical trip) and average fuel costs for the Seattle area (from the beginning of 2013 to the end of 2017) to determine an average annual cost for tide-related movements by channel depth. The design vessel typically refuels at docks in the Seattle 4 Note: the vessel must leave channel each time the channel depth is below the required sailing draft plus underkeel clearance. An 89 percent channel reliability (Section 3.1.2) corresponds to roughly 217 required vessel movements.

Neah Bay Economic Appendix A – June 2020 Page 26
area. The average price of marine fuel over the past five years plus use-tax equals $3.18 (Puget Sound Marine Fuel Cost Survey). Marine Fuel is not subject to 9.6 percent local percent fuel tax. Per ER 1110-2-1404, fuel price is not escalated. Table 6-2 provides the annual cost of tide-related movements by channel depth at the current price level.
Table 6-2: Tide-Related Transportation Cost by Channel Depth (FY2020 price level)
Year Transportation Cost by Channel Depth 19’ 21’ 23’ 25’
2018 $153,00 $70,000 $- $- Table 6-3 presents the estimated average annual equivalent (AAEQ) transportation cost savings benefits for tide-related movements for each study depth discounted at the Fiscal Year 2020 Federal Discount Rate. Analysis shows that net average annual economic benefits are maximized at a project depth of -21 feet MLLW.
Table 6-3: Tide-Related Movements Benefit Summary, 2.75% discount rate Channel Depth AAEQ Benefits
19' $- 21' $45,000 23’ $71,000 25’ $83,000
6.1.2 Other Benefits At this time, there is insufficient evidence to quantify benefits related to fishing vessels, fish processing vessels, logging vessels, and Harbor of Refuge vessels. As such, these benefits are not included in the project benefit cost analysis. Benefits presented in Table 6-3 are the only NED benefits used in project justification. Future analysis may be aided with additional data for other vessel classes.
6.2 Benefit Cost Analysis Total project costs include all project first costs (dredging, construction management, preconstruction engineering and design, and contingency) for each alternative were developed and annualized to compare against the transportation cost savings presented in Table 6-3. The study assumes no operations and maintenance costs. Table 6-4 presents the costs for each alternative. Table 6-4: Cost Summary (October 2019 Price Level, FY20 2.75 Percent Discount Rate)
Alt. Depth Project Costs IDC Total
Investment AAEQ Total Investment
AAEQ O&M Total AAEQ
Alt. 1 -19' MLLW $- $- $- $- $- $- Alt. 2 -21' MLLW $1,774,000 $2,000 $1,776,000 $66,000 $- $66,000 Alt. 3 -23' MLLW $3,718,000 $4,000 $3,722,000 $138,000 $- $138,000
The final benefit cost analysis is presented in Table 6-5. The plan that maximizes net benefits is Alternative 2, -21 feet MLLW. The plan is economically justified with a BCR of 1.09.

Neah Bay Economic Appendix A – June 2020 Page 27
Table 6-5: Benefit Cost Analysis (FY20 discount rate, Oct 2019 Price Level) Channel Depth AAEQ Cost AAEQ Benefits AAEQ Net
Benefits BCR
19' $- $- $- - 21' $66,000 $71,000 $6,000 1.09 23’ $138,000 $83,000 $(55,000) 0.60
6.3 Depth Optimization The previous analysis evaluated channel depths in 2-foot increments. This section presents results of channel depth optimization considering net excess benefits for every possible channel depth. The results of the optimization confirm -21 feet MLLW to be the plan that maximizes net excess benefits. Table 6-6 presents the results of the optimization analysis.
Table 6-6: Channel Depth Optimization (FY20 discount rate, Oct 2019 Price Level) Channel Depth AAEQ Costs AAEQ Benefits Net Benefits BCR
20' MLLW $54,000 $45,000 $(9,000) 0.83
21' MLLW $66,000 $71,000 $6,000 1.09 22' MLLW $79,000 $82,000 $3,000 1.03 23' MLLW $138,000 $83,000 $(55,000) 0.60 24' MLLW $167,700 $83,000 $(84,700) 0.49

Neah Bay Economic Appendix A – June 2020 Page 28
7 Sensitivity Analysis The Principle & Guidelines and subsequent ER1105-2-100 recognize the inherent variability to water resources planning. Navigation projects in particular involve uncertainty about future conditions. This sensitivity analysis adjusts the most consequential assumptions pertaining to economic benefits to test the robustness of the final benefit evaluation. Fuel cost and design vessel draft.
7.1 Fuel and Draft Sensitivity A simple linear regression between the Annual WTI Spot Price and the marine fuel price for Seattle-area docks from 1986 through 2016 confirms a strong, positive relationship between changes in the WTI price and changes in the Seattle-area marine fuel price with a correlation coefficient of .98. The summary of regression statistics for this analysis are presented in Table 8-1. The U.S. Department of Energy forecasts an average annual growth rate of the West Texas Intermediate (WTI) spot price of 2.8 percent through 2050 (Administration).
Table 8-1: Fuel Price Regression Statistics Regression Statistics
Multiple R 0.98 R Square 0.96 Adjusted R Square 0.95 Standard Error 0.23 Observations 18.00
The analysis uses 12.5 feet as the minimum possible draft of any vessel that still meets the 70 bollard pull requirement. This provides a “low draft” scenario for the sensitivity analysis. Given the growing size of the world tanker fleet and vessels available in the Pacific Northwest (e.g. the Garth Foss and Lindsey Foss), the maximum possible design draft for an ERTV at Neah Bay is likely 20 feet. The study uses this as the “high draft” scenario for the sensitivity analysis.
Figure 8-1 summarizes the cost benefit analysis completed for nine sensitivities. The maximum possible benefits are represented by the “High Draft – High Fuel” scenario. This scenario uses the highest fuel price at Seattle docks over the past 5 years and the highest likely sailing draft of all ERTVs capable of operating at Neah Bay (20 feet). The minimum possible benefits are represented by the “Low Draft – Low Fuel” scenario. This scenario uses the lowest fuel prices at Seattle docks over the past 5 years and the lowest likely sailing draft of all ERTVs capable of operating at Neah Bay (12.5). The reference case presents the results of the assumptions made in the main analysis.

Neah Bay Economic Appendix A – June 2020 Page 29
Figure 8-1: Net Excess Benefits by Scenario (FY20 discount rate, Oct 2019 Price Level)
7.2 Vessel Draft Sensitivity The sensitivity analysis shows the impact of each assumption. Lower design vessel drafts and low fuel costs have a strong, negative impact on net excess benefits leading to an unjustified project in most “low-draft”, “low-fuel” scenarios. Design vessel draft is positively related to net excess benefits. To estimate the impact of the vessel draft, Table 8-2 provides AAEQ net benefits by vessel draft. The chosen design vessel draft (17.5 feet) is the lowest draft where project benefits exceed costs. Net benefits increase as design drafts increase. The cells displaying maximum net excess benefits for each vessel draft is bold.
Table 8-2: Net Excess Benefits by Vessel Draft Vessel
Draft (ft) Channel Depth (ft MLLW)
20' MLLW 21' MLLW 22' MLLW 23' MLLW 24' MLLW 25' MLLW 15' $ (50,000) $ (62,000) $ (76,000) $ (134,000) $ (164,000) $ (190,000) 16' $ (36,000) $ (44,000) $ (57,000) $ (116,000) $ (146,000) $ (171,000) 17' $ (17,000) $ (10,000) $ (20,000) $ (79,000) $ (109,000) $ (134,000)
17.5' $ (9,000) $ 6,000 $ 2,000 $ (55,000) $ (85,000) $ (111,000) 18' $ (6,000) $ 20,000 $ 24,000 $ (30,000) $ (60,000) $ (86,000) 19' $ (6,000) $ 31,000 $ 54,000 $ 14,000 $ (12,000) $ (38,000) 20' $ (9,000) $ 28,000 $ 62,000 $ 41,000 $ 29,000 $ 7,000 21' $ (3,000) $ 30,000 $ 65,000 $ 55,000 $ 62,000 $ 54,000 22' $ (31,000) $ 8,000 $ 40,000 $ 30,000 $ 48,000 $ 60,000 23' $ (20,000) $ (8,000) $ 29,000 $ 16,000 $ 34,000 $ 57,000
-20 FTMLLW
-21 FTMLLW
-22 FTMLLW
-23 FTMLLW
-24 FTMLLW
-25 FTMLLW
High Fuel - High Draft $3,000 $53,000 $98,000 $86,000 $79,300 $57,600Reference Fuel - High Draft $(9,000) $27,000 $63,000 $41,000 $29,300 $7,600Low Fuel - High Draft $(14,000) $16,000 $45,000 $19,000 $4,300 $(17,400)High Fuel - Reference Draft $2,000 $24,000 $24,000 $(34,000) $(63,700) $(89,400)Reference Fuel - Reference Draft $(9,000) $6,000 $3,000 $(55,000) $(84,700) $(110,400)Low Fuel - Reference Draft $(15,000) $(4,000) $(7,000) $(66,000) $(95,700) $(121,400)High Fuel - Low Draft $(54,000) $(66,000) $(79,000) $(138,000) $(167,700) $(193,400)Reference Fuel - Low Draft $(54,000) $(66,000) $(79,000) $(138,000) $(167,700) $(193,400)Low Fuel - Low Draft $(54,000) $(66,000) $(79,000) $(138,000) $(167,700) $(193,400)
$(250,000) $(200,000) $(150,000) $(100,000)
$(50,000) $-
$50,000 $100,000 $150,000

Neah Bay Economic Appendix A – June 2020 Page 30
This analysis provides confidence that project benefits will exceed costs. Over the study period vessels of higher and lower draft may be used, but the most likely vessel is the 17.5 foot draft class. If the sailing draft assumption changes and a larger draft vessels is deployed to Neah Bay, -22 feet MLLW would be the NED plan. Where -21 feet is not the NED plan, environmental considerations might still limit the selected plan to -21 feet.
7.3 Vessel Fleet Sensitivity To evaluate the impact of changes in the vessel fleet through the study period the following analysis uses a fleet distribution based on the world fleet of vessels. Evidence from 2017 vessel deployment shows that an alternate vessel, which in the past has typically been smaller, replaces the assigned vessel at Neah Bay for as much as three months per year. This takes place as the permanent vessel travels to Seattle for repairs, fuel, or other reasons. The following analysis incorporates this practice into the sensitivity analysis and using the world fleet of vessels with bollard pull above 100 short tons. Table 8-3 presents all ocean-going vessels in the available database which meet the 100 bollard pull short ton capability pulled from IHS Sea-Web. This is likely not the full list, but it is the most complete list of vessels available.
Table 8-3: World ERTV Fleet with 100+ Short Tons Bollard Pull IMO Number Ship Name Operator Bollard Pull (Short Tons) Sailing Draft
9097604 TIGER 7 N/A 110 11.8 9253569 SIGNET INTRUDER Signet 132 16.4 9253571 SIGNET THUNDER Signet 132 16.4 9748588 NICOLE FOSS Foss 110 17.0 9748576 DENISE FOSS Foss 116 17.5 7397660 EXPLORER Crowley 110 17.7 7726536 ENSIGN Crowley 110 17.7 9748564 MICHELE FOSS Foss 109 18.0 7420467 DELTA POWER BayDelta 105 18.0 9562207 DELTA BILLIE BayDelta 104 18.0 9409924 VALOR Crowley 101 18.0 9139830 GUARD Crowley 109 18.7 9409948 VIGILANT BayDelta 101 18.7 7501118 CROSBY ENDEAVOR Crosby 106 18.7 8218938 LAUREN FOSS Foss 108 19.5 8218926 CORBIN FOSS Foss 106 19.7 7420455 NATOMA Sause Bros 105 19.7 7626267 CROSBY COURAGE Crosby 108 19.7 9562219 DELTA CATHRYN BayDelta 104 19.7 7390765 FINN FALGOUT Crowley 120 19.7 9833979 CADEN FOSS Foss 101 20.0 9097563 ASD NEIL ABERCROMBIE BAE 110 21.0

Neah Bay Economic Appendix A – June 2020 Page 31
IMO Number Ship Name Operator Bollard Pull (Short Tons) Sailing Draft 9554016 OCEAN WIND Crowley 165 21.0 9597862 OCEAN SUN Crowley 160 22.0 9597850 OCEAN SKY Crowley 165 22.0 9214393 ATTENTIVE Crowley 121 22.3 9554004 OCEAN WAVE Crowley 162 22.3 9178379 NANUQ Crowley 106 22.6 9178381 TAN'ERLIQ Crowley 106 22.6 7417317 SEA VOYAGER Crowley 120 23.0 9214381 ALERT VMS 121 23.0 9214408 AWARE VMS 121 23.0 9529982 FORTE NS, LLC 103 23.3
Analysis showed a low probability for vessels with sailing drafts above 20 feet to be used at Neah Bay given that qualified vessels in this category are either owned by one firm (Crowley) which operates vessels with shallower drafts and equivalent pull capacity or are operated by firms that do not have operations in the Pacific Northwest.
Table 8-4 provide the assumed fleet distribution using the world fleet distribution as a proxy for utilization probability.
Table 8-4: Fleet Distribution Draft Class Annual Utilization
<17ft 35.7% 17ft-18ft 28.6% 18ft-19ft 10.7% 19ft-20ft 25.0%
Incorporating the fleet distribution from Table 8-4 into the cost savings analysis yields the following benefit cost summary table. In this case, 22 feet is the NED plan; however, -21 feet MLLW remains justified with net benefits of $13,000.
Table 8-5: Sensitivity Fleet Distribution Benefit Cost Summary Channel Depth AAEQ Costs AAEQ Benefits Net Benefits BCR
20' MLLW $54,000 $43,000 $(11,000) 0.79
21' MLLW $66,000 $79,000 $13,000 1.20
22' MLLW $79,000 $104,000 $24,000 1.30 23' MLLW $138,000 $116,000 $(22,000) 0.84 24' MLLW $168,000 $120,000 $(47,000) 0.72 25' MLLW $193,000 $121,000 $(73,000) 0.62

Neah Bay Economic Appendix A – June 2020 Page 32
8 Multiport Analysis Given that the ERTV is required to be permanently stationed at Neah Bay and no significant commodity movements exist for Neah Bay, the deepening project will not impact any ongoing or future operations at other ports in the region. No traffic diversion is expected to take place.
9 NED Employment Benefits Per ER 1105-2-100, NED unemployment benefits are to be incorporated following project alternative formulation and NED plan determination, and cannot be used to justify a project where the Benefit-to-Cost Ration (BCR) is less than unity.
Clallam County and Neah Bay meet the requisite unemployment thresholds for inclusion of labor resource benefits; however, analysis of labor requirements for similar studies in the area shows limited opportunity for employment benefits. The estimated construction timeframe is less than three months and work will likely be completed by relatively few, non-local workers. Given the limited opportunity for benefits and negligible impact to the overall net benefit calculation, labor resource benefits are not included in the final benefit-cost ratio.

Neah Bay Economic Appendix A – June 2020 Page 33
10 References (2016, Jan 26). Retrieved from Office of Superintendent of Public Instruction:
http://reportcard.ospi.k12.wa.us/summary.aspx?schoolId=486&reportLevel=School&orgLinkId=486&yrs=2014-15&year=2014-15
Administration, U. E. (n.d.). Total Energy Supply, Disposition, and Price Summary. Retrieved from https://www.eia.gov/outlooks/aeo/data/browser/#/?id=1-AEO2017®ion=0-0&cases=ref2017~ref_no_cpp&start=2015&end=2050&f=A&linechart=~~ref2017-d120816a.41-1-AEO2017~ref_no_cpp-d120816a.41-1-AEO2017~ref2017-d120816a.42-1-AEO2017~ref_no_cpp-d120816a.42-1-AEO
Age and Sex in Neah Bay, Washington. (2016, Jan 22). Retrieved from Statistical Atlas: http://statisticalatlas.com/place/Washington/Neah-Bay/Age-and-Sex
American Community Survey. (2016, Jan 28). Retrieved from United States Census: http://thedataweb.rm.census.gov/TheDataWeb_HotReport2/profile/2014/5yr/np01.hrml?SUMLEV=250&aianhh=2085
Bureau, U. S. (2000). Census 2000 American Indiana nd Alaska Native Summary File. Retrieved from https://factfinder.census.gov/faces/tableservices/jsf/pages/productview.xhtml?src=CF
Center, N. F. (2007). Neah Bay. Seattle, Washington, USA. Retrieved from https://www.nwfsc.noaa.gov/research/divisions/cb/ecosystem/humandim/communityprofiles/Washington/Neah_Bay_WA.pdf
Collins, C. C. (1996). Subsistence and Survival: The Makah Indian Reservation, 1855-1933. Pacific Northwest Quarterly, pp. 180-193. Retrieved from http://www.washington.edu/uwired/outreach/cspn/Website/PNQ/Articles/Collins.html
Council, N. D. (2015). Makah Commercial Fishing Dock. Neah Bay, Washington, USA. Retrieved from https://ndcacademy.org/wp-content/uploads/2017/01/Makah-Commercial-Fishing-Dock_JC1.pdf
Ecology, S. o. (2016, 5 11). Tug Call Outs. Olympia, Washington, USA. Retrieved from http://www.ecy.wa.gov/programs/spills/response_tug/TugResponseMainPage.htm
Indian Health Board. (2016, Jan 27). Retrieved from Northwest Portland Area Indian Health Board: http://www.npaihb.org/member_tribes/tribe/makah_tribe1
Industries, W. S. (2017). Initiative 1433. Retrieved from http://www.lni.wa.gov/WorkplaceRights/Wages/Minimum/1443.asp
Legislature, W. S. (2009). RCW 88.46.130. Olympia, WA. Retrieved from http://app.leg.wa.gov/RCW/default.aspx?cite=88.46.130

Neah Bay Economic Appendix A – June 2020 Page 34
Legislature, W. S. (2009). RCW 88.46.135. Olympia, WA, USA. Retrieved from http://app.leg.wa.gov/RCW/default.aspx?cite=88.46.135
Neah Bay Washington. (2015, Jan 21). Retrieved from City-Data: http://www.city-data.com/city/Neah-Bay-Washington.html
Population of Neah Bay, Washington. (2016, Jan 22). Retrieved from Statistical Atlas: http://statisticalatlas.com/place/Washington/Neah-Bay/Population
Races in Neah Bay. (2016, Jan 26). Retrieved from City-Data: http://www.city-data.com/races/races-Neah-Bay-Washington.html
Senate Committe on Environment, W. &. (2009, February 20). Senate Bill Report: SB 5344. Olympia, Washington, USA: Washington State Senate. Retrieved from http://apps.leg.wa.gov/documents/billdocs/2009-10/Pdf/Bill%20Reports/Senate/5344%20SBR%20EWE%2009.pdf
Senate Committe on Environment, W. &. (2009, February 20). Senate Bill Report: SB 5344. Olympia, Washington, USA. Retrieved from http://apps.leg.wa.gov/documents/billdocs/2009-10/Pdf/Bill%20Reports/Senate/5344%20SBR%20EWE%2009.pdf
Thomas, E. (1949, November). Logging "Cowboys" Ride the Sea Dozer. Popular Mechanics, pp. 89-92. Retrieved from https://books.google.com/books?id=WdkDAAAAMBAJ&pg=PA89&lpg=PA89&dq=log+barge+neah+bay&source=bl&ots=YeClwBJNEp&sig=osmIdnJ8x3vEuIaWQ7_qmll7_c4&hl=en&sa=X&ved=0ahUKEwij_ob94crWAhUIwFQKHUKLAeA4ChDoAQglMAA#v=onepage&q&f=false
(2019). Trans Mountain Expansion Project Reconsideration Report. Government of Canada, National Energy Board.
U.S. Army Corps of Engineers. (2000). ER 1105-2-100. Washington, D.C.: USACE.
Van Dorp, J. R., & Merrick, J. (2017). VTRA 2015 Final Report Updating the VTRA 2010: A Potential Oil Loss Comparison of Scenario Analyses by four Spill Size Categories. Washington, D.C.: The George Washington University.
Washington State Report Card. (2016, Jan 26). Retrieved from Office of Superintendent of Public Instruction: http://reportcard.ospi.k12.wa.us/summary.aspx?schoolId=486&reportLevel=School&orgLinkId=486&yrs=2014-15&year=2014-15

Neah Bay Economic Appendix A – June 2020 Page 35
Attachment 1

Neah Bay Economic Appendix A – June 2020 Page 36

Neah Bay Economic Appendix A – June 2020 Page 37
Attachment 2
Neah Bay Economic Appendix A – June 2020 Page 38