NBER WORKING PAPER SERIES EVIDENCE FROM A … · We thank Farasat Iqbal ... First, doctors with...
81
NBER WORKING PAPER SERIES PERSONALITIES AND PUBLIC SECTOR PERFORMANCE: EVIDENCE FROM A HEALTH EXPERIMENT IN PAKISTAN Michael Callen Saad Gulzar Ali Hasanain Yasir Khan Arman Rezaee Working Paper 21180 http://www.nber.org/papers/w21180 NATIONAL BUREAU OF ECONOMIC RESEARCH 1050 Massachusetts Avenue Cambridge MA 02138 May 2015, Revised April 2018 We thank Farasat Iqbal (Punjab Health Sector Reforms Project) for championing and implementing the project and Asim Fayaz and Zubair Bhatti (World Bank) for designing the smartphone monitoring program. Support is provided by the International Growth Centre (IGC) state capabilities program, the IGC Pakistan country office, and the University of California Office of the President Lab Fees Research Program Grant #235855. Callen was supported by grant #FA9550-09-1- 0314 from the Air Force Office of Scientific Research. We thank Tahir Andrabi, Eli Berman, Ali Cheema, Julie Cullen, Clark Gibson, Naved Hamid, Gordon Hanson, Asim Khwaja, Jennifer Lerner, Jane Mansbridge, Edward Miguel, Craig McIntosh, Ijaz Nabi, Rohini Pande, ChristopherWoodruff, and seminar participants at UC Berkeley, UC Los Angeles Anderson, UC San Diego, Paris School of Economics, New York University, University of Washington, Harvard Kennedy School, and participants at the IGC Political Economy Group, Development and Conflict Research (DACOR), Pacific Development (PacDev), New England Universities Development Consortium (NEUDC), Southern California Conference in Applied Microeconomics (SoCCAM), Bay Area Behavioral and Experimental Economics Workshop (BABEEW), Symposium on Economic Experiments in Developing Countries (SEEDEEC), and the Bureau for Research and Economic Analysis of Development (BREAD) conferences for insightful comments. Excellent research assistance was provided by Muhammad Zia Mehmood. The views expressed herein are those of the authors and do not necessarily reflect the views of the National Bureau of Economic Research. NBER working papers are circulated for discussion and comment purposes. They have not been peer- reviewed or been subject to the review by the NBER Board of Directors that accompanies official NBER publications. © 2015 by Michael Callen, Saad Gulzar, Ali Hasanain, Yasir Khan, and Arman Rezaee. All rights reserved. Short sections of text, not to exceed two paragraphs, may be quoted without explicit permission provided that full credit, including © notice, is given to the source.
-
Upload
trinhduong -
Category
Documents
-
view
216 -
download
0
Transcript of NBER WORKING PAPER SERIES EVIDENCE FROM A … · We thank Farasat Iqbal ... First, doctors with...

NBER WORKING PAPER SERIES
PERSONALITIES AND PUBLIC SECTOR PERFORMANCE: EVIDENCE FROM A HEALTH EXPERIMENT IN PAKISTAN
Michael CallenSaad GulzarAli HasanainYasir Khan
Arman Rezaee
Working Paper 21180http://www.nber.org/papers/w21180
NATIONAL BUREAU OF ECONOMIC RESEARCH1050 Massachusetts Avenue
Cambridge MA 02138May 2015, Revised April 2018
We thank Farasat Iqbal (Punjab Health Sector Reforms Project) for championing and implementing the project and Asim Fayaz and Zubair Bhatti (World Bank) for designing the smartphone monitoring program. Support is provided by the International Growth Centre (IGC) state capabilities program, the IGC Pakistan country office, and the University of California Office of the President Lab Fees Research Program Grant #235855. Callen was supported by grant #FA9550-09-1- 0314 from the Air Force Office of Scientific Research. We thank Tahir Andrabi, Eli Berman, Ali Cheema, Julie Cullen, Clark Gibson, Naved Hamid, Gordon Hanson, Asim Khwaja, Jennifer Lerner, Jane Mansbridge, Edward Miguel, Craig McIntosh, Ijaz Nabi, Rohini Pande, ChristopherWoodruff, and seminar participants at UC Berkeley, UC Los Angeles Anderson, UC San Diego, Paris School of Economics, New York University, University of Washington, Harvard Kennedy School, and participants at the IGC Political Economy Group, Development and Conflict Research (DACOR), Pacific Development (PacDev), New England Universities Development Consortium (NEUDC), Southern California Conference in Applied Microeconomics (SoCCAM), Bay Area Behavioral and Experimental Economics Workshop (BABEEW), Symposium on Economic Experiments in Developing Countries (SEEDEEC), and the Bureau for Research and Economic Analysis of Development (BREAD) conferences for insightful comments. Excellent research assistance was provided by Muhammad Zia Mehmood. The views expressed herein are those of the authors and do not necessarily reflect the views of the National Bureau of Economic Research.
NBER working papers are circulated for discussion and comment purposes. They have not been peer-reviewed or been subject to the review by the NBER Board of Directors that accompanies official NBER publications.
© 2015 by Michael Callen, Saad Gulzar, Ali Hasanain, Yasir Khan, and Arman Rezaee. All rights reserved. Short sections of text, not to exceed two paragraphs, may be quoted without explicit permission provided that full credit, including © notice, is given to the source.

Personalities and Public Sector Performance: Evidence from a Health Experiment in Pakistan Michael Callen, Saad Gulzar, Ali Hasanain, Yasir Khan, and Arman RezaeeNBER Working Paper No. 21180May 2015, Revised April 2018JEL No. C93,D02,D73,H11,O31
ABSTRACT
This paper provides evidence that the personalities of policymakers matter for policy. Three results support the relevance of personalities for policy. First, doctors with higher Big Five and Perry Public Sector Motivation scores attend work more and falsify inspection reports less. Second, health inspectors who score higher on these measures exhibit larger treatment responses to increased monitoring. Last, senior health officials with higher personality scores respond more to data on staff absence by compelling better subsequent attendance. These results suggest that interpersonal differences matter are consequential for state performance.
Michael CallenRady School of ManagementUniversity of California, San DiegoWells Fargo Hall, Room 4W1049500 Gilman Drive #0553La Jolla, CA 92093-0553and [email protected]
Saad GulzarStanford University616 Serra StreetEncina Hall West, Room 100Stanford, CA [email protected]
Ali HasanainLahore University of Management Sciences Sector U, DHALahore [email protected]
Yasir KhanUniversity of California, Berkeley Haas School of Business [email protected]
Arman RezaeeUniversity of California, Davis1149 Social Sciences & Humanities Building One Shields AvenueDavis, CA [email protected]
2
1 Introduction
Governments are the primary provider of services for the poor in developing countries. Yet,
government employees, from front-line providers such as teachers and doctors to senior offi-
cials, commonly face weak incentives to perform (World Bank, 2004; Reinikka and Svensson,
2004; Chaudhury et al., 2006; Bandiera et al., 2009; Wild et al., 2012). A principal focus
of many reforms aimed at improving service delivery is, therefore, to strengthen incentives.1
Evidence supports the view that, in addition to incentives, personality traits play a key role
in determining performance (Borghans et al., 2008; Almlund et al., 2011; Heckman, 2011),
can be changed (Kautz et al., 2014; Blattman et al., 2015), and that better recruitment
policy can improve the personality profile of individuals selecting into public service (Dal Bo
et al., 2013; Ashraf et al., 2014).2 This suggests the possibility of strengthening services in
developing countries through the separate avenue of personality traits.3 This paper examines
whether such non-cognitive traits matter for public service delivery outcomes.
We consider three questions in the context of a large-scale field experiment designed to
improve health worker performance in Punjab, Pakistan.4 First, do personality measures
predict performance under weak status quo incentives? Second, do these measures predict
1Olken and Pande (2012) provide an overview of incentive reforms designed to reduce corruption andimprove public sector performance more generally.
2Guided by insights from the field of industrial and organizational (I-O) psychology, firms, militaries, andgovernments in developed countries have long used psychometric measures to inform hiring, training, andpromotion decisions. In a widely-cited meta-analysis of 85 years of data, for example, Schmidt and Hunter(1998) find that conscientiousness tests such as those in this paper not only predict job performance but doso while being much less correlated with general mental aptitude than years of education or job knowledgetests. Many others have stressed the predictive validity of these non-cognitive traits (Kaplan and Saccuzzo,1997; Bowles et al., 2001; Heckman et al., 2006; Borghans et al., 2008; Groth-Marnat, 2009; Gatewood etal., 2010; Bazerman and Moore, 2012).
3Rasul and Rogger (2014) provide evidence that management practices are also an important determinantof public sector performance. In Nigeria, they find a strong positive relationship between a measure ofmanagerial autonomy for bureaucrats and project completion, suggesting an additional means of improvingservice delivery beyond standard incentives.
4According to 2008 population estimates, Punjab is the ninth largest sub-national unit in the world withapproximately 85 million citizens, of which 70 percent are rural. According to a 2011 report, the PunjabDepartment of Health provides outpatient services 90 percent of this total population per year, making itone of the largest health systems in existence. Despite the far reach of this system, Punjab performs poorlyon major health indicators, with an infant mortality rate of 88 per 1000 live births, for example (NationalInstitute of Population Studies, 2013).

3
responses to a reform that changes incentives? Third, do these measures predict who will
respond to salient information on subordinate absence? We answer each of these questions in
the affirmative, thus demonstrating the strength of the relationship between the personalities
of officials in government and public sector performance.
The behavior of government bureaucrats is shaped by many forces beyond their control,
including political considerations, institutional incentives, and so on. This may be acutely
true in low capacity settings. Our findings indicate that these forces do not have complete
primacy; the specific identity of individuals in government matters. Indeed, it appears to
matter a tremendous amount. The people who comprise government play a fundamental
role in shaping its performance. Politics and institutions are likely much less mutable than
are the people who work in government. We therefore view the core contribution of this
paper as providing a broad and substantial empirical endorsement of the value of studying
government personnel for development economics (Finan et al., 2015).
Returning to our specific research questions, we find that the Big Five and Perry Public
Service Motivation (PSM) measures systematically predict doctor and, to a lesser extent,
inspector performance.5 Doctors who score one standard deviation higher on the measured
Big Five trait of conscientiousness, for example, are 5.8 percentage points more likely to be
present at work during an unannounced visit. Similarly, health inspectors that score one
standard deviation higher on the measured PSM trait of commitment to policymaking are
five percentage points less likely to be found colluding with doctors to falsify inspection
reports. In addition, health inspectors that score one standard deviation better on a proxy
measure of the tendency to procrastinate are six percentage points more likely to complete
each of their assigned inspections in a two month period.6 Overall, we find significant positive
5The Big Five personality traits, according to the Five Factor Model of personalities, are five separatedimensions of human personality that were designed to be descriptive and non-overlapping. These traitsare agreeableness, emotional stability, extroversion, conscientiousness, and openness. The PSM measureis argued to capture attributes of individual personality relevant to the desire to provide public service.PSM has six traits—attraction to policymaking, commitment to policymaking, social justice, civic duty,compassion, and self-sacrifice.
6We obtain a proxy measure of an inspector’s tendency to procrastinate by examining the degree to whichthe inspector tends to get his monthly quota of inspections done later in the month. Our approach is similar
4
correlations for four of eleven measured doctor personality traits and one of two personality
trait summary indices (Big Five) and doctor attendance, and seven of the remaining eight
coefficients are also positive.7 A similar, though weaker, pattern holds with health inspectors,
which we discuss in detail below.
Importantly, these personality measures also predict performance better than other mea-
sured covariates, such as work experience and travel distance from a doctor’s health clinic
to home. We conduct this analysis using the least absolute shrinkage and selection opera-
tor (LASSO) estimator. One advantage of this estimator is that it identifies the subset of
regressors that are most predictive. For doctors, we find that the Big Five index remains
predictive of attendance when the cross-validated error is minimized, while other measured
covariates do not. The same is true with the PSM index.
To provide evidence on the second question, we designed and implemented a smartphone
technology that verifies whether officials are performing regular facility inspections across
Punjab. We evaluated this using a randomized control trial spanning the province.8 We find
that a one standard deviation increase in our measured aggregate Big Five index for a gov-
ernment inspector is associated with a 35 percentage point differential increase in inspections
in response to treatment.9
On the final question, a one standard deviation increase above the mean in our mea-
sured aggregate Big Five index of a senior health official is associated with an additional 40
percentage point reduction in doctor absence at a facility managed by the official when the
to that of Shapiro (2005) and Kuhn (2013), who use the steepness of the biweekly consumption profile tomeasure time preferences.
7Throughout the paper, we will scale our personality measures such that higher values are normativelybetter from the perspective of worker performance. We will report results both on individual traits andon summary indices of the Big Five and Public Sector Motivation traits. We discuss the rationale for thisapproach in Section 3.1.1 below.
8Considering the distribution of personality types of agents most affected by an intervention can also helpus understand what treatment effects might look like in other settings. On an intuitive level, if a bureaucracyis staffed with workers whose personalities are well-suited to the job, increasing incentives to perform maymake very little difference. Conversely, if workers are highly incompatible with their jobs, reforms mayinduce little additional effort. In line with this intuition, we find suggestive evidence that treatment effectsfrom the monitoring technology are localized to the middle of the personality distribution.
9When compared to other measured inspector covariates in a single model, we find the Big Five indexpredicts as well as if the inspector has received a higher education degree.

5
facility’s performance is experimentally flagged for the official’s attention.10 These officials
oversee health systems responsible for several million citizens. The magnitude of our result
suggests that improvements at this level of the bureaucracy might be particularly impactful.
The relationship between personality traits and policy outcomes in our data supports
the recent focus on the selection and motivation of policy actors (Dal Bo et al., 2013; Ashraf
et al., 2014, Forthcoming; Finan et al., 2015; Deserranno, 2016), the relationship between
personalities and performance in other domains (Barrick and Mount, 1991; Salgado, 1997;
Nyhus and Pons, 2005; Heckman et al., 2006; Ramey et al., Forthcoming), and the potential
malleability of personality traits (Kautz et al., 2014; Blattman et al., 2015). On selection
into public service, Ashraf et al. (Forthcoming) find that both financial and non-financial
incentives are more effective for more intrinsically motivated public health workers in Zam-
bia and Ashraf et al. (2014), in the same context, find that health workers recruited by
making career incentives salient perform better on the job than those recruited by making
social incentives salient, despite being no less pro-social. Dal Bo et al. (2013) find that
increasing wages substantially improves the pool of applicants to public jobs, as measured
by IQ, Big Five, and Perry Public Sector Motivation.11 The literature in psychology and
in economics also consistently points to a relationship between personality measures and
economic success. For example, Heckman et al. (2006) find that measures of locus of control
10Both the results relating to the second and the third question are based on comparisons of treatmenteffects across different subgroups and so are not, themselves, experimentally identified (Deaton, 2010). How-ever, because personality is not randomly assigned, we can only argue that personalities strongly predictthe types of individuals who will respond to changes in incentives. Relatedly, because we could potentiallyconsider a number of different dimensions of heterogeneity, our statistical tests may not be of proper size(Miguel et al., 2014). We argue this should not be a major concern for three reasons. First, we designedthe study expressly to understand the relevance of personality for performance. Other than checking staffattendance, we only collected data on the personalities and political connections of doctors, a dimension ofheterogeneity we analyze in Callen et al. (2016). As evidence of this, we added an extra survey wave in whichwe tracked down doctors that we never found present in a clinic and in which we only measured personalitytraits at considerable effort and expense. Second, we composed a pre-analysis plan for this project in Marchof 2012, prior to the collection of any data on personalities. Finally, our results are similarly strong evenafter we account for multiple hypothesis testing through both the use of indices and also through controllingfor the False Discovery and Family-Wise Error Rates across hypotheses. This is described in Section 3.4.
11Our results directly complement this paper as we find that workers with higher scores on the Big Fiveand Public Sector Motivation measures work more often and more effectively in a similar context with weakextrinsic incentives. Taken together, this suggests that increasing wages can improve service delivery bycausing more effective workers to select into public service.
6
and self-esteem (traits related to emotional stability, one of the Big Five personality traits)
from adolescence predict adult earnings to the same degree as cognitive ability. Similarly,
Kautz et al. (2014) summarize a body of research finding that non-cognitive characteris-
tics are often as predictive as cognitive skills in predicting economic success. Nyhus and
Pons (2005) find using Dutch household data that wages are correlated with two of the Big
Five personality traits, emotional stability and conscientiousness.12 Other meta-analyses
find conscientiousness to be consistently predictive of earnings (Barrick and Mount, 1991;
Salgado, 1997). For instance, Hogan and Holland (2003) find in a meta-analysis that all
five Big Five measures positively predict performance on specific job criteria, and that the
predictions become stronger as the job criteria become more specific.13 Regarding whether
traits are fixed, Kautz et al. (2014), in a comprehensive review of the literature, argue that
the evidence so consistently supports malleability that non-cognitive attributes should be
called “skills”, rather than “traits”, partly to re-orient policy toward the value of investing
in these dimensions of human capital.14
These three literatures, combined with the positive relationship between better traits and
better performance in our data, suggest three ways that taking non-cognitive attributes into
consideration might improve service delivery. First, the finding that the psychological profile
of applicants to public jobs can be affected by the recruitment process suggests delivery out-
12These two traits are also the most consistently predictive of performance in our data.13There is also more general evidence that the traits of senior executives are important in determining the
performance of the entities that they manage. At the firm level, Johnson et al. (1985) find that shareholderwealth is positively correlated with measures of a firm’s executive’s ‘talents’ and ‘decision-making responsi-bility.’ Bertrand and Schoar (2003) find that a significant extent of the heterogeneity in investment, financial,and organizational practices of firms can be explained by the presence of manager fixed effects. Malmendieret al. (2011) find that overconfidence affects management decisions. At the cross-national level, Jones andOlken (2005) find, using deaths of leaders as exogenous variation, that leaders matter for a country’s growth,especially when constraints on the executive are weak.
14Similarly, Roberts et al. (2006) examine 92 studies for patterns in the mean-level of Big Five personalitytraits. The authors find that people increase in measures of social dominance (a facet of extroversion),conscientiousness, and emotional stability as they age, especially over ages 20 to 40. Blattman et al. (2015)find in an experiment that providing Cognitive Behavioral Therapy (CBT) to high-risk Liberian men causedtheir conscientiousness scores and other measures of self-control to improve after just eight weeks. It isimportant to note that the psychological literature is in agreement, however, that these measured personalitytraits are more than situational specific, and thus are worthwhile to use for explanatory purposes as we doin this paper (Roberts, 2009).

7
comes can be improved via selection. Second, given broad evidence that traits are malleable,
delivery could be improved by measures that strengthen non-cognitive attributes. Third,
psychometric measures might be useful as diagnostics in hiring or promotion decisions.15
The degree of correlation between personality measures, doctor attendance, health inspec-
tions, and the responsiveness of senior officials complements these literatures by showing
that public sector employees with greater levels of specific non-cognitive skills deliver better
public service outcomes.
While our data allow us to make some progress on relating personalities to performance,
they also face some limitations. First, because our sample includes officials in positions of
power, obtaining measures of cognitive ability was thought to be potentially demeaning.
We therefore are unable to directly compare the relevance of cognitive and non-cognitive at-
tributes for service delivery. Second, as in much of the literature, no component of the person-
ality traits we measure is exogenously determined, limiting our ability to identify the causal
relationship between personalities and performance. To address this, in our information
experiment with senior officials, we aimed to manipulate a factor affecting performance—
information about the performance of their subordinates—that most plausibly should be
mediated through the mechanism of personalities.
The paper proceeds as follows: Section 2 provides the institutional details necessary to
understand our results. Section 3 outlines our research design and reports results. Section 4
concludes.
2 Public Health Services in Punjab
This section describes the main institutional details relevant to our experiment and our
empirical results.
In Punjab, the provision of health care services is managed by the Department of Health.
15Klinger et al. (2013) discuss the merits and disadvantages of using psychometrics to screen for loanprovision. A major concern, which applies equally in the public sector, is the potential for strategic misrep-resentation of personality type.

8
Authority in the department is highly centralized in the upper echelons of the bureaucratic
hierarchy. Senior actors described in this section play a central role in determining the
quality of delivery. They are also responsible for a substantial number of facilities spread, in
many cases, across vast geographic distances. This presents a major challenge for monitoring
that we aim to address with our smartphone monitoring system.
The main performance outcomes in this paper are measured at primary front-line public
health clinics, called Basic Health Units (BHUs).16 BHUs are designed to be the first stop for
rural patients seeking medical treatment in government facilities, providing mainly primary
services, including out-patient services, neo-natal and reproductive health care, and vacci-
nations against diseases. Hereafter in this paper, we use the word ‘clinic’ interchangeably to
describe BHUs. There are 2,496 BHUs in Punjab.17 Almost all BHUs are located in rural
and peri-urban areas. Each facility is headed by a doctor, known as the Medical Officer,
who is supported by a Dispenser, a Lady Health Visitor, a School Health and Nutrition
Supervisor, a Health/Medical Technician, a Mid-wife and other ancillary staff. Officially,
clinics are open, and all staff are supposed to be present, from 8AM to 2PM and patients
seen in these clinics are required to pay a nominal fee of around $0.01 USD per visit.
Do Clinics Matter for Health Outcomes? A key question is whether clinics matter for
health outcomes, given low levels of health worker attendance and other administrative
issues. The data we can assemble to address this question suggests that they do. Merging
the 2006 Demographic and Health Survey (DHS) in Pakistan with BHU locations using GPS
coordinates, we find that, for households in the bottom quarter of wealth, distance to the
nearest BHU is positively correlated with male child mortality and negatively correlated
with children being vaccinated and with mothers’ use of prenatal and antenatal care and
16There are five major types of facilities: (i) Basic Health Unit (BHU); (ii) Rural Health Center (RHC); (iii)Tehsil Headquarter Hospital (THQ); (iv) District Headquarter Hospital (DHQ); and (v) Teaching Hospital.In Punjab, a tehsil is the largest administrative sub-division of a district. There are 121 tehsils across 37districts.
17Each Basic Health Unit serves approximately one Union Council (Union Councils are smallest adminis-trative units in Pakistan).

9
Health Secretary
Senior Health Officials (EDOs)(1 per district)
Health Inspectors (DDOs)(1 per subdistrict)
Doctors (MOs)(1 per health clinic)
Figure 1: Health Sector Administration in Punjab
save delivery toolkits.18
2.1 Health Sector Administration
Figure 1 depicts a simplified version of the health administration hierarchy in Punjab. Dis-
trict governments are responsible for managing local health facilities. Each District Depart-
ment of Health is headed by an Executive District Officer (EDO) who reports both to the
official in charge of the district and to two provincial health officials.19 EDOs are directly
supported by several Deputy District Officers (DDOs). DDOs primarily inspect and manage
health facilities.20 DDOs are required to inspect every clinic in their jurisdiction at least
once a month and record information collected during the visit on a standard form. DDOs
have the authority to punish a clinic’s absent staff by issuing a formal reprimand, suspend-
18Results available upon request. While a newer wave of the DHS is available for Pakistan, GPS coordinatesof household clusters are not available for this wave. We expect correlations from 2006 to still be relevantas nearly all current BHUs were built through one large project in the 1990s.
19The senior official in charge of the district is the District Coordinating Officer (DCO). The provincialhealth officials are the Director General of Health Services and the Secretary of the Department of Health.
20While inspections are the primary official functions of the DDO, our time use data indicate that, onaverage, DDOs spend 38.9 percent of their time on inspections and management, with the remainder of theirtime principally spent managing immunization drives. For full details please see Callen et al. (2016).

10
ing staff, and/or withholding pay (in the case of contract staff). Each Medical Officer is
similarly responsible for their own clinic, with proportional duties. Throughout the paper,
we will refer to Executive District Officers as senior health officials, Deputy District Officers
as inspectors, and Medical Officers as doctors, focusing on their role rather than their title.
As is true in many developing countries, low health worker attendance is a major issue in
Punjab. From unannounced visits to clinics in 2011, we find that only 56 percent of clinics
were inspected in the prior two months, and that doctors were only present 43 percent of
the time when one was posted.21 This points to a lack of enforcement that allows health
inspectors and doctors to shirk. In the next section, we provide results related to the role of
personality traits in the performance of senior officials, inspectors, and doctors.
3 Results
In this section, we present three sets of results, each corresponding to one of the three
questions laid out in the introduction. First, we study correlations between the measured
personality traits of doctors and health inspectors, their job performance (attendance and
inspections respectively), and their propensity to collude with one another. Second, we use
these measures to predict health inspectors’ response to an experimental intervention which
increases the probability of detecting shirking. Finally, we examine whether traits identify
which senior health officials react to information about the absence of their subordinates.
This analysis relies on manipulating the information provided to senior officials about the
absence of their subordinates.
21Doctors were not posted at 35 percent of clinics, which means unconditional doctor presence was only32 percent.

11
3.1 Do personality measures predict performance under status
quo incentives?
We first examine whether personality measures predict bureaucratic performance under sta-
tus quo incentives, for doctors and then for health inspectors. We measured personality for
doctors in Punjab posted to a representative sample of 850 of the 2,496 rural health clinics
in the province. Of the 850 facilities in this sample, 306 facilities had no doctor posted. We
omit these clinics from our analysis of doctor performance. To reach the remaining doctors,
we interviewed doctors in two unannounced independent inspections, and then followed up
with pre-scheduled interviews, facilitated by the department of health. Doctors were strongly
encouraged to attend the pre-scheduled interviews by the department of health. This pro-
cess resulted in interviews of 389 out of 544 posted doctors, or 72 percent of our sample
population.
We recognize that these doctors may be potentially unrepresentative of the overall sample
of posted doctors. However, we believe that this select sample is highly relevant for two
reasons. First, there are very likely a number of ghost workers—names on government
payrolls that do not correspond to an actual person, allowing other corrupt actors to capture
their salary. In this setting, there is no way for us to know how many of the doctors we did not
reach actually exist. Given the substantial lengths we went to, including involving the active
collaboration of the Department of Health in scheduling interviews, it is possible that many
of them are indeed ghost workers and so are not part of the relevant sample of interest.
Second, our pre-scheduled interviews were facilitated by doctors’ supervisors via multiple
phone calls and clear orders. If a doctor is not at work when we visit twice independently
and refuses direct orders from their superior, clearly the doctor is underperforming. We
are less interested in understanding how the individual characteristics of such intractably
resistant individuals relate to performance.
We also measured personality for the universe of health inspectors and senior health
officials in Punjab, or a total of 102 inspectors and 33 senior health officials. We interviewed

12
inspectors and officials through pre-arranged office visits.
For all 850 clinics in our sample, we also measured attendance during unannounced visits
in November 2011, June 2012, and October 2012.
3.1.1 Measuring Personality
The personality measurement batteries in this paper are from personality psychology and
are used broadly, including recently in economics. We use two measures: the Big Five
personality traits and the Perry Public Service Motivation (PSM) traits.
Developed by psychologists in the 1980s, the Five Factor Model is now one of the most
widely used personality taxonomies in the field.22 We measure the Big Five traits using a
60 question survey developed specifically in Urdu and validated for use in Pakistan by the
National Institute of Psychology at Quaid-i-Azam University, Islamabad. Each of the 60
questions offers the respondent a statement such as “I see myself as someone who does a
thorough job” and asks them to agree or disagree with the statement on a five point Likert
scale (Disagree strongly, Disagree a little, Neutral, Agree a little, or Agree strongly).23
In addition to measuring Big Five traits separately as the mean response to twelve ques-
tions (where disagree strongly is assigned a 1, disagree a little a 2, etc.), all traits are
normalized into z-scores and averaged to form a single Big Five index.24 This approach
is consistent with research in psychology that finds high degrees of of correlation between
the five personality traits in many different studies and suggests that the traits can be col-
lapsed into a General Factor of Personality, which can be interpreted “as a basic personality
disposition that integrates the most general non-cognitive dimensions of personality. It is
associated with social desirability, emotionality, motivation, well-being, satisfaction with life,
and self-esteem. It also may have deep biological roots, evolutionary, genetic, and neuro-
22See John et al. (2008) for a summary of the measures and its history. Borghans et al. (2008) provide asummary of empirical results in psychology and economics.
23John et al. (2008) provide the mapping between questions and traits.24The results presented in the following sections are robust to a ‘naive’ personality index in which each
of the 60 questions is individually normalized and then one average z-score is formed. These results areavailable on request.

13
physiological” Musek (2007, pg. 1213).25 We also document a high degree of correlation
between Big Five traits in four different populations in Pakistan in Appendix Figure A.4.26
The Perry Public Service Motivation (PSM) battery is designed to measure intrinsic mo-
tivation for public service. Also developed in the 1980s, it comprises a total of 40 questions
measuring six traits—attraction to policymaking, commitment to policymaking, social jus-
tice, civic duty, compassion, and self-sacrifice.27 We reproduce both the Big Five and PSM
batteries we used in the appendix.28
Table 2 reports summary statistics for these measures separately for doctors and health
inspectors in treatment and control districts in our randomized control evaluation of a new
monitoring technology.29 There is substantial variation in personality traits across individu-
als consistent with the original intention of the battery: to capture substantial and important
differences in personality types.30 It is this heterogeneity that allows for the possibility of
linking differences in personality to variation in performance.
We capture these measures after treatment is administered. This raises the possibil-
ity that treatment could impact traits, confounding our analysis. However, if treatment
impacted traits then there would be differences between treatment and control workers in
personality measures. We find no evidenced that treatment affected personality traits. This
increases our confidence that they are stable over the horizon of the study. This is consis-
tent with previously cited literature that suggests malleability over the course of years, not
25See Digman (1997) and Van der Linden et al. (2010) for two additional meta-analyses with similarresults.
26These populations include (i) public sector polio vaccinators in Punjab (N = 420); (ii) residents ofslums near Islamabad, Peshawar, and Dera Ghazi Khan, often care migrants from areas close to Pakistan’sborder with Afghanistan (N = 1152); (iii) all politicians from 240 electoral constituencies of Haripur andAbbotabad districts located in the province of Khyber-Pakhtunkhwa who contested the first village councilelections in 2015 (N = 3628); and (iv) students at the Lahore University of Management Science, an eliteprivate sector university in Punjab (N = 227).
27Perry and Wise (1990) and Perry (1996) introduce the battery and Petrovsky (2009) provides a summaryof studies using this measure.
28Though the survey included is for doctors (Medical Officers), we used the same instrument for healthinspectors and senior health officials. We include both the Urdu version that was fielded, as well as atranslation of the instrument to English for reference.
29We describe the experiment in Subsection 3.1.4 below. The full distributions for these measures arereported in Table A.1. Summary statistics for senior health officials are reported in Table A.2.
30Borghans et al. (2008) explain the development of the Big Five.
14
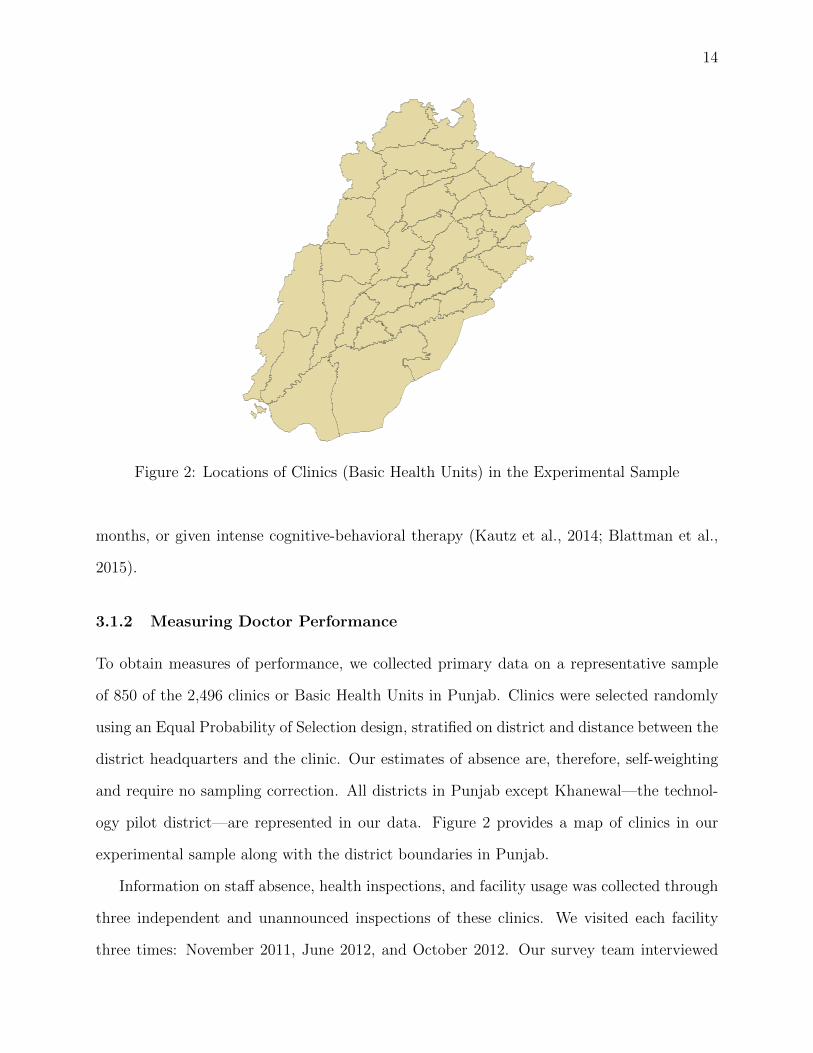
Figure 2: Locations of Clinics (Basic Health Units) in the Experimental Sample
months, or given intense cognitive-behavioral therapy (Kautz et al., 2014; Blattman et al.,
2015).
3.1.2 Measuring Doctor Performance
To obtain measures of performance, we collected primary data on a representative sample
of 850 of the 2,496 clinics or Basic Health Units in Punjab. Clinics were selected randomly
using an Equal Probability of Selection design, stratified on district and distance between the
district headquarters and the clinic. Our estimates of absence are, therefore, self-weighting
and require no sampling correction. All districts in Punjab except Khanewal—the technol-
ogy pilot district—are represented in our data. Figure 2 provides a map of clinics in our
experimental sample along with the district boundaries in Punjab.
Information on staff absence, health inspections, and facility usage was collected through
three independent and unannounced inspections of these clinics. We visited each facility
three times: November 2011, June 2012, and October 2012. Our survey team interviewed

15
and physically verified the presence of the Medical Officer, or doctor, and verified the last
health inspection that occurred through written records stored at the facility.31
We have two measures of doctor job performance: (i) whether doctors were present during
our unannounced visits, and (ii) a proxy measure of collusion between doctors and health
inspectors to falsify reports. We define collusion as a dummy variable coded as one when
the doctor is absent during both of our post-treatment unannounced visits and is marked
present during every single health inspection during the treatment period.32. We find doctors
to be present during forty three percent of the unannounced visits and predict collusion with
health inspectors thirteen percent of the time. These baseline performance measures for
doctors are reported in Table A.1.
3.1.3 Personality and Doctor Performance
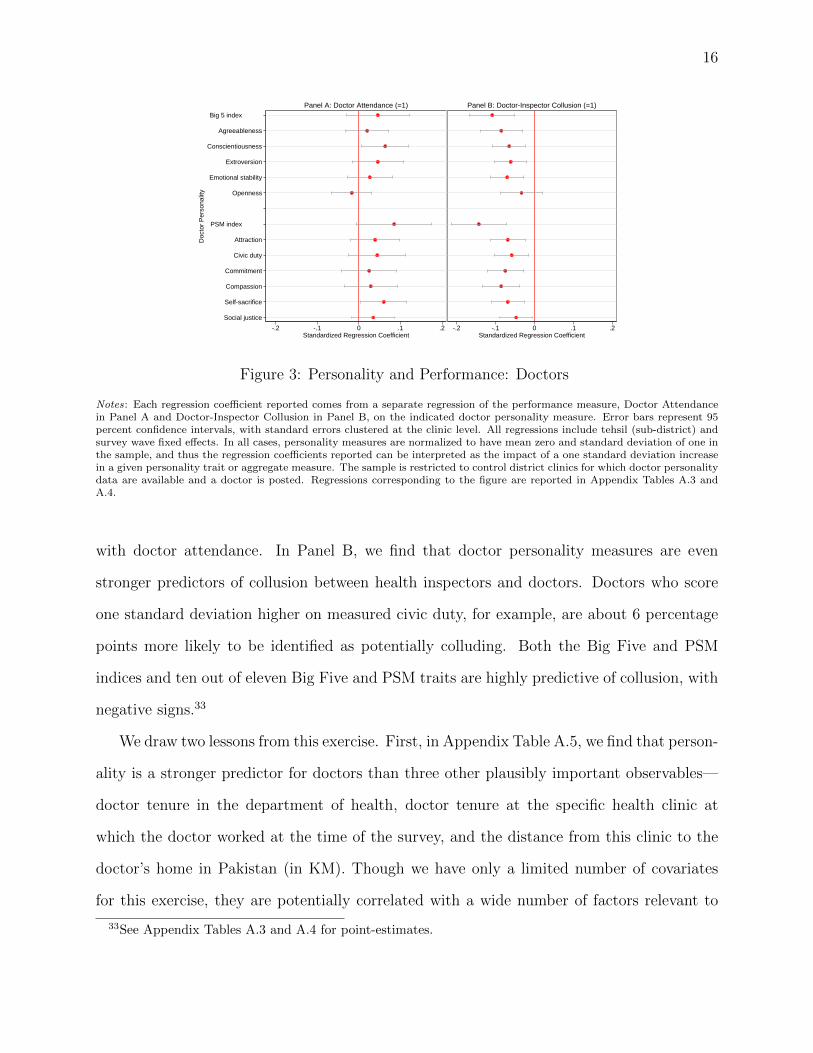
Figure 3, Panel A shows that doctors that score one standard deviation above the mean on
the Big Five measure of conscientiousness are about five percentage points more likely to be
present at work during an unannounced visit. Similarly, two measures of PSM, civic duty
and self-sacrifice, are also significantly predictive, and the aggregate PSM index is nearly
significantly predictive at 95%. Finally, all but one coefficient are positively correlated
31In addition, the attendance of Dispensers, Health/Medical Technicians, Lady Health Visitors, Midwives,and School Health and Nutrition Specialists were also recorded. Survey teams were trained at regional hubs(four in total) by senior enumerator trainers and our team members. Following these trainings, the teamsmade visits to clinics in their assigned districts and remained in regular contact with their team leadersand our research team. Surveys took three weeks to field for each wave. The attendance sheet for thestaff was filled out at the end of the interviews and in private. Inspectors record visits by signing paperregisters maintained at the health facility. We measure whether an inspection occurred by interviewingfacility staff and verifying the register record. Data collection and entry followed back-checks and othervalidation processes consistent with academic best practice.
32The median number of health inspections for each facility in our treatment sample is 12, with a maxof 50. The collusion we have in mind occurs when a health inspector calls a doctor before an inspection toalert him to be in attendance. Then, after the health inspector records his presence, the doctor is undervery little pressure to attend until he gets another similar phone call from the inspector. Of course, suchpatterns in the data could arise by chance, though the chance decreases with the number of inspections. Assuch, we have run all of our collusion analysis using weighted least squares and we find results very similar tothose OLS results presented below. Results provided upon request. The strong correlation we find betweenthese measures and personality types also suggests that the proxy is successfully capturing malfeasance. Animmediate problem with this proxy is that it partly reflects attendance. We deal with this by also reportingp-values adjusted to reflect multiple hypotheses.
16
Social justice
Self-sacrifice
Compassion
Commitment
Civic duty
Attraction
PSM index
Openness
Emotional stability
Extroversion
Conscientiousness
Agreeableness
Big 5 index
Doc
tor
Per
sona
lity
-.2 -.1 0 .1 .2Standardized Regression Coefficient
Panel A: Doctor Attendance (=1)
-.2 -.1 0 .1 .2Standardized Regression Coefficient
Panel B: Doctor-Inspector Collusion (=1)
Figure 3: Personality and Performance: Doctors
Notes: Each regression coefficient reported comes from a separate regression of the performance measure, Doctor Attendancein Panel A and Doctor-Inspector Collusion in Panel B, on the indicated doctor personality measure. Error bars represent 95percent confidence intervals, with standard errors clustered at the clinic level. All regressions include tehsil (sub-district) andsurvey wave fixed effects. In all cases, personality measures are normalized to have mean zero and standard deviation of one inthe sample, and thus the regression coefficients reported can be interpreted as the impact of a one standard deviation increasein a given personality trait or aggregate measure. The sample is restricted to control district clinics for which doctor personalitydata are available and a doctor is posted. Regressions corresponding to the figure are reported in Appendix Tables A.3 andA.4.
with doctor attendance. In Panel B, we find that doctor personality measures are even
stronger predictors of collusion between health inspectors and doctors. Doctors who score
one standard deviation higher on measured civic duty, for example, are about 6 percentage
points more likely to be identified as potentially colluding. Both the Big Five and PSM
indices and ten out of eleven Big Five and PSM traits are highly predictive of collusion, with
negative signs.33
We draw two lessons from this exercise. First, in Appendix Table A.5, we find that person-
ality is a stronger predictor for doctors than three other plausibly important observables—
doctor tenure in the department of health, doctor tenure at the specific health clinic at
which the doctor worked at the time of the survey, and the distance from this clinic to the
doctor’s home in Pakistan (in KM). Though we have only a limited number of covariates
for this exercise, they are potentially correlated with a wide number of factors relevant to
33See Appendix Tables A.3 and A.4 for point-estimates.
17
the relationship between personality and performance. Overall tenure, for example, will be
correlated with age, experience, and the number of relationships with others in the health
department. Tenure at a specific facility will be correlated with how much influence a doctor
has in the Department of Health as transfers are frequent and often undesirable. Distance
to home might proxy for the desirability of a posting as in interviews doctors frequently
expressed a strong desire to work near their home and family.
We also more thoroughly investigate the power of personality traits and other doctor
characteristics in predicting attendance through the use of a LASSO estimator in Section
3.1.9 below.
Second, the degree of the estimated coefficients is meaningful. While ideally we would
have measures of health outcomes to correlate with doctor performance, we are able to
correlate this performance with the number of out-patients seen at a clinic in a given month.
We document a strong positive correlation between doctor presence at their clinic during one
of our unannounced visits and reported out-patients seen at that clinic in Appendix Table
A.6.
3.1.4 Monitoring Intervention
We collected personality data during a larger experimental policy reform that considered
audits by government monitors as a solution to the problem of bureaucratic absence. The
“Monitoring the Monitors” program replaced the traditional paper-based monitoring sys-
tem for clinic utilization, resource availability, and worker absence with an android-based
smartphone application. In the new system, data generated by health inspections are trans-
mitted to a central database using General Packet Radio Service (GPRS). Data are then
aggregated and summary statistics, charts, and graphs are presented in a format designed
in collaboration with senior health officials to effectively communicate information on health
facility performance. These data are also: (i) geo-tagged, time-stamped, and complemented
with facility staff photos to check for reliability; and (ii) available in real time to district and

18
provincial officials through an online dashboard. The objective of this monitoring system
is to make the activities of health inspectors available to their senior officials in real time.
Figure 4 shows one view of the online dashboard.34
We can think of this monitoring system as increasing the probability that a health inspec-
tor will be caught if he is failing to do his inspections. Prior to Monitoring the Monitors, and
in control districts, the paper-based monitoring system severely limits a senior officials abil-
ity to monitor inspectors. In treatment districts, on the other hand, reports are immediately
and automatically sent up the chain of command, and the required geo-tags, time stamps,
and photos serve as instant verification that the inspector and all reported staff are present
at the clinic being inspected.35 We present a theoretical framework to help understand the
potential impacts of this discrete increase in this probability on health workers’ decision to
work or shirk in Appendix Section A.1.
3.1.5 Measuring the Tendency to Procrastinate
A nascent literature uses intertemporal consumption and effort profiles to measure time
preference and time inconsistency.36 Inspectors in Punjab are required to inspect every
facility in their jurisdiction once a month. The intertemporal inspection allocations captured
by our smartphone monitoring system reveal patterns indicating a tendency to procrastinate
for a majority of our inspectors.
Panel A of Figure 5 depicts the average number of inspections on each day of the month
conditional on the number of facilities in each inspector’s jurisdiction. On the first day of
the month, inspectors perform an average of about 0.31 inspections. After the first ten
34Application development started in August 2011. After developing the application and linking it to a betaversion of the online dashboard, the system was piloted in the district of Khanewal. We remove Khanewaldistrict from the experimental sample. Health administration staff were provided with smartphones andtrained to use the application.
35See Callen et al. (2016) for the core results from the broad Monitoring the Monitors experiment.36Augenblick et al. (Forthcoming) elicit time preferences based on the intertemporal allocation of non-
monetary tasks in the lab. Shapiro (2005) and Kuhn (2013) provide evidence that the intra-month con-sumption profile of food stamp recipients reflects dynamically-inconsistent planning and better fits a quasi-hyperbolic model than a standard exponential discounting model.

19
Figure 4: Online Dashboard - Summary of Inspection Compliance by District
days of the month, average inspections on a given day are roughly 0.8. The time profile
of inspections over a month has a positive slope. Several months of data allow estimation
of the slope of the intertemporal profile of inspections, providing a proxy measure of each
inspector’s tendency to procrastinate. We estimate
Inspectionsd,m = α + η Day of Monthd,m + δm + εd,m (1)
where inspectionsd,m is the number of inspections on a given day d in a month m, δm are
fixed effects for each month, and Day of Month runs from one to 28 depending on the
calendar day of the month.37 Inspectors with a positive η estimate do fewer inspections at
37The effective deadline for inspections is the 28th of the month as senior officials and inspectors meetduring the final days of the month to review the month’s inspections. We only include months for which wehave complete information for a health inspector and drop holidays. We retain data for 36 health inspectorsand have an average of 8.75 months of inspection-level data per inspector. The median number of inspectionsin a month is 25 and inspectors are responsible for between 4 and 46 facilities with a median of fifteen. Twofactors limit our sample. First, we only have daily inspection data for treatment districts, which includeroughly 50 health inspectors. Of these inspectors, we drop fourteen who transferred into treatment districts

20
Panel A: Inspections by Day of Month Panel B: Histogram of Slope Parameters
.2.4
.6.8
11.
2P
redi
cted
Num
ber
of In
spec
tions
1 5 10 15 20 24 28Day of the Month
05
1015
20P
erce
nt
-.02 0 .02 .04 .06Slope coefficient
Figure 5: The Temporal Allocation of Inspections
Notes: Panel A plots the predicted number of inspections from a regression of inspections on dummies for each day of themonth, and for each month, as well as a control for the number of facilities in the inspector’s jurisdiction. Panel B is a histogramof slope parameters obtained from estimating Equation (1) separately for each of the 36 inspectors in our sample.
the beginning of the month and more at the end as they approach the deadline for their
quota, suggesting a tendency to procrastinate.
Panel B of Figure 5 provides a histogram of the estimates of η for 36 inspectors. 29 of
these 36 inspectors have positive slope coefficients. The average slope coefficient is 0.014,
which indicates that over the course of the month the number of inspections per day increases
by about 0.4.
3.1.6 Measuring Inspector Performance
We have two measures of job performance for health inspectors: (i) a dummy equal to one if
the facility records an inspection in the two months prior to an unannounced visit; and (ii)
the same proxy measure of collusion between doctors and health inspectors to falsify reports
as described in Section 3.1.2. These measures were obtained during the same three inde-
pendent and unannounced inspections of health clinics described in Section 3.1.2. Baseline
performance measures for health inspectors are reported in Table A.1.
taking over the phone of the previous inspector. Transfer records do not indicate the date of transfer, makingit impossible to identify the period of smartphone data that correctly corresponds to these 14 inspectors.

21
3.1.7 Procrastination and Inspector Performance
As with our personality measures, we can correlate our proxy measure of the tendency to pro-
crastinate with health inspector performance. In Table 1, we present results of a regression
of health inspections on our estimated time slope coefficient. We see that health inspectors
with larger time slope coefficients (reflecting a larger tendency to procrastinate) conduct
fewer inspections, once you limit the sample to those inspectors with at least nine facilities
in their jurisdiction (the 10th percentile in terms of health facilities per district across the
sample). Specifically, we see that a one standard deviation increase in the procrastination
measure is associated with a 6.7 percentage point decrease in the probability that an inspec-
tion was carried out in the last two months at a health clinic. This relationship may reflect
a limitation on the number of inspections that can be carried out in a fixed period of time.
Those who delay all of their inspections until the end of the month are not able to complete
their monthly assignment.
3.1.8 Personality and Inspector Performance
We examine how much the personalities of health inspectors predict their job performance in
control districts (i.e., those under status quo incentives) in Figure 6. In Panel A, we consider
the relation between personalities and whether an inspection was carried out in the last two
months. In Panel B, we see that PSM traits are associated with less collusion, enough to
distinguish the coefficient on the aggregate index from zero. In this case, health inspectors
that score one standard deviation higher on aggregate PSM are about seven percentage

22
Table 1: Procrastination and Inspector Performance
Health Inspection in Last Two Months (=1)(1) (2) (3) (4) (5)
Time Slope Coef. (Standardized) -0.001 -0.060* -0.067* -0.079** -0.060*(0.041) (0.024) (0.027) (0.027) (0.022)
Mean of dependent variable 0.708 0.695 0.723 0.723 0.723# Observations 456 420 357 357 357# Tehsils 32 28 25 25 25R-Squared 0.221 0.242 0.241 0.249 0.256
Inspector Jurisdiction Size Percentile: 0 10 25 25 25Controls for Big Five Traits NO NO NO YES NOControls for PSM Traits NO NO NO NO YES
Notes: This table reports on the correlation between an inspectors tendency to procrastinate and theirinspection performance. Column 1 provides estimates from an OLS regression of a dummy equal to oneif a facility was inspected in the last two months on the time slope coefficient. The time slope coefficientis estimated for each inspector using a regression of the number of inspections done on a given day ofthe month on a day of the month variable, with month fixed effects. We then standardize the variableacross inspectors. Higher time slope coefficients indicate a larger tendency to procrastinate. Standarderrors clustered at the tehsil (sub-district) level—the jurisdiction of a given inspector—are reported inparentheses. All regressions include district and survey wave fixed effects. The sample is limited tohealth inspectors in treatment districts for which we have daily inspection data. The 10th percentile# Health Clinics in an inspectors tehsil corresponds to nine clinics, the 25th percentile to 12 clinics.The median number of health clinics in a tehsil is 19 and the max is 46. Controls for Big Five Traitsinclude agreeableness, conscientiousness, extroversion, emotional stability, and openness. Controls forPSM traits include attraction to policymaking, commitment to policymaking, social justice, civic duty,compassion, and self-sacrifice. Levels of Significance: *p < 0.1, **p < 0.05, ***p < 0.01.
points less likely to be identified as potentially colluding.38,39
In Appendix Table A.11, we examine how health inspector personality predicts job per-
formance relative to six other plausibly important observables—age, whether the inspector
has completed higher education, the inspector’s tenure in the department of health, the in-
spector’s tenure as an inspector, the distance from the inspector’s office to his hometown (in
38See Appendix Tables A.7 and A.8 for complete details on the results summarized in Figure 6. Theestimates in Figure 6 indicate a negative relationship between both conscientiousness and emotional stabilityand the number of inspections. These coefficients both reflect p < 0.10 and suggest that better traits areassociated with worse performance. These coefficients are estimated only on the subsample of 298 clinics incontrol districts which have a doctor posted. In Appendix Tables A.9 and A.10, we find no evidence of acorrelation on the full sample of 424 control facilities, indicating that inspectors with better traits are morelikely to have inspected facilities without doctors posted. There is therefore some weak evidence that betterinspectors substitute away from better facilities with a doctor posted toward more rural facilities without adoctor.
39Since our collusion outcome is defined at the doctor-inspector level, we can also examine how doctor andinspector traits simultaneously predict collusion; i.e., whether good doctors and inspectors are substitutesor compliments or neither for performance. While we have no theory for how traits should interact, we findno evidence that they do. That is that individual traits remain predictive and their interaction is not in allcases. Results available upon request.

23
Social justice
Self-sacrifice
Compassion
Commitment
Civic duty
Attraction
PSM index
Openness
Emotional stability
Extroversion
Conscientiousness
Agreeableness
Big 5 index
Hea
lth In
spec
tor
Per
sona
lity
-.15 -.1 -.05 0 .05Standardized Regression Coef.
Panel A: Inspection Last 2 Months (=1)
-.2 -.1 0 .1 .2Standardized Regression Coef.
Panel B: Doctor-Insp. Collusion (=1)
Figure 6: Personality and Performance: Health Inspectors
Notes: Each regression coefficient reported comes from a separate regression of the displayed performance measure on theindicated standardized health inspector personality measure. Error bars represent 95 percent confidence intervals. Standarderrors are clustered at the clinic level. All regressions include tehsil (sub-district) and survey wave fixed effects. In all cases,personality measures are normalized to have mean zero and standard deviation of one in the sample, and thus the regressioncoefficients reported can be interpreted as the impact of a one standard deviation increase in a given personality trait oraggregate measure. The sample is restricted to control district clinics for which doctor personality data are available and adoctor is posted. Appendix Tables A.7 and A.8 provide corresponding regression tables.
KM), and a dummy for whether the inspector reports liking his current post. We do not
find that any of these six observables are systematically better predictors than personality.
In fact, the PSM index is clearly the strongest predictor in this exercise.
We also more thoroughly investigate the power of personality traits and other health
inspector characteristics in predicting performance through the use of a LASSO estimator
in the following Section.
3.1.9 How well does personality predict relative to other traits?
If one’s goal is simply to predict doctor and inspector performance using measurable, fixed
characteristics, and if measuring each characteristic is costly, we might ask whether (i)
personality traits are the best predictors for the job, and, regardless, (ii) how much we might
gain by combining personality and other characteristics in one model. We address both of

24
these questions simultaneously using the least absolute shrinkage and selection operator
(LASSO) estimator (Tibshirani, 1996). This method minimizes the sum of squares subject
to the sum of absolute value of the standardized coefficients being less than a chosen value
(λ). In equation form, this is
(α, β) = arg minN∑i=1
(yi − α−∑j
βjxij)2 subject to
∑j
|βj| ≤ λ. (2)
In this equation, λ is called the tuning paramater. It leads to trimming of estimated coeffi-
cients, and it often leads to coefficients of zero, and hence allows for variable selection. To
select the proper tuning parameter, we implement k-fold cross-validation and select the λ
that minimizes mean cross-validated error (that is the λ that leads to coefficients on average
that do the best job across many simulations at predicting in a 10% sample of our data after
the model is fit in 90%).
We present the results of this analysis in Appendix Figures A.5, A.6, for doctors, and
Appendix Figures A.7, and A.8 for health inspectors. For doctors, we see that the Big Five
index coefficient remains positive and near to that from our OLS estimates at the value of λ
that minimizes the cross-validated error, while our other covariates’ coefficients drop to zero.
The same is true with the PSM index. This suggests not only that these personality measures
better predict doctor attendance than experience and distance to home but that there is
no gain to prediction, in the mean squared error sense, from these additional covariates.
We see a consistent story when we look at the Big Five and PSM traits individually, with
conscientiousness being most predictive of the Big Five traits and civic duty and self sacrifice
of the PSM traits.
Consistent with health inspector personality measures being less predictive of inspections,
we find that, at the λ that minimizes the cross-validated error in each of the sets of models, all
or nearly all covariates remain non-zero and have meaningful coefficients. In other words, for
health inspectors personality characteristics are not clearly better at predicting inspections

25
than other characteristics, but to best predict inspections we should use a combination of
personality and other characteristics. While less stark than the doctor predictions, these
nonetheless support the importance of personality traits in understanding the performance
of health inspectors.
3.2 Do personality measures predict responses to a reform that
changes incentives?
We now consider whether personality traits, including the tendency to procrastinate, predict
health inspectors’ response to a reform that increased incentives to complete inspections.
3.2.1 Evaluating the Smartphone Monitoring
Our experimental sample comprises all health facilities in the district of Punjab, which
has a population of at least 85 million citizens. Tens of millions of public sector health
users therefore were potentially affected by the program. As described above, we monitored
a subsample of 850 clinics, drawn to be representative of facilities in the province, using
independent and unannounced inspections.40 We randomly implemented the program in
18 of the 35 districts in our experimental sample. In assigning treatment, we stratified on
baseline attendance and the number of clinics in a district to ensure a roughly even number
of treatments and controls. Figure 7 depicts control and treatment districts.41
40These are the same clinics and inspections from the correlations presented in the previous section.41Treatment is randomized at the district level. The intervention channels information about inspections
to district health officials; a design randomizing treatment at an administrative unit beneath the district,say the tehsil, would very like result in treatment affecting control units. The Department of Health alsoviewed sub-district randomization as not administratively feasible. Cluster randomization also allays someconcerns about externalities generated by interactions between inspectors in the same district. All inspectorsin a district are required to attend monthly meetings. While they typically have frequent interactions withindistricts, these relations are almost non-existent across districts.

26
Figure 7: Treatment and Control Districts
3.2.2 Personality and Treatment Response
We investigate whether impacts of the monitoring program are heterogeneous by the per-
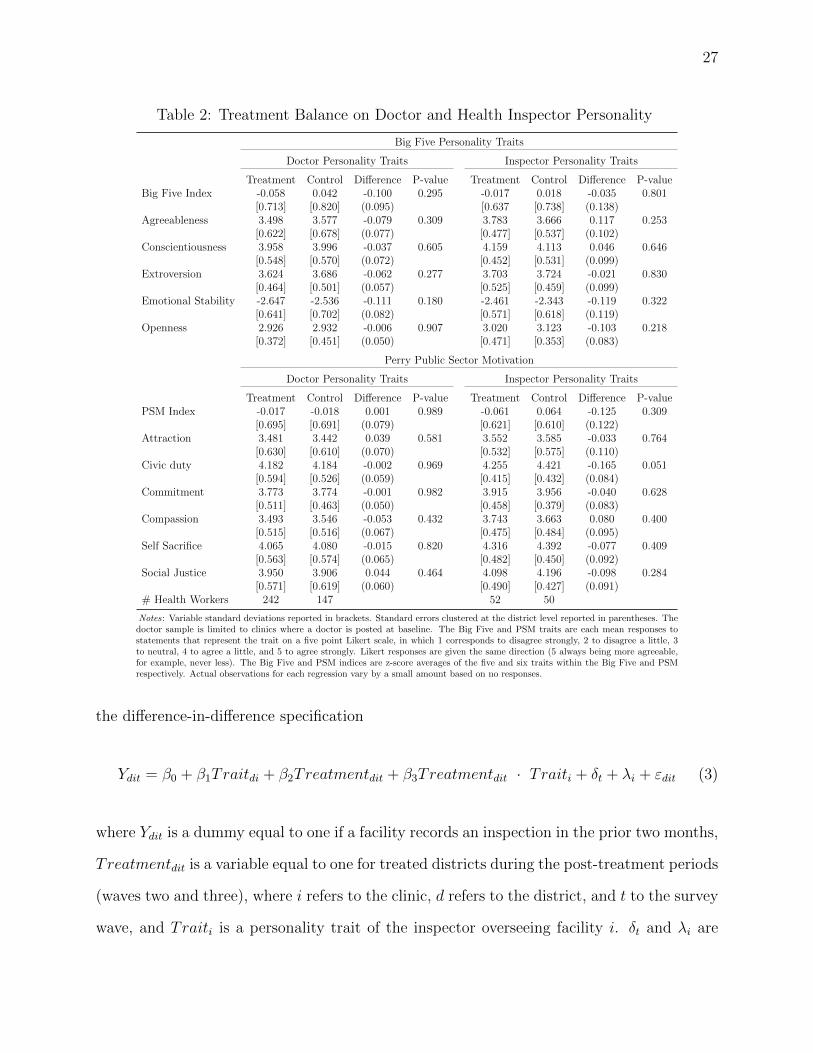
sonality type of the inspector. Table 2 presents personality measures by treatment status
for doctors and health inspectors. There is one significant difference in the balance table—
treated health inspectors have slightly lower civic duty scores than those in control groups
on average. This is plausibly due to sampling fluctuation as it is a fairly small difference and
the only one among the 27 differences estimated.
We consider the effects of an increase in health inspector monitoring on their performance
by inspector personality. Results are presented in Table 3.42 We estimate regressions using
42Our other previous measure of performance, collusion between inspectors and doctors, cannot be studiedin this context because the construction of collusion relies on data from our treatment districts’ smartphoneapp. We have no information on health inspector-reported doctor attendance in the control districts of theMonitoring the Monitors experiment.
27
Table 2: Treatment Balance on Doctor and Health Inspector Personality
Big Five Personality Traits
Doctor Personality Traits Inspector Personality Traits
Treatment Control Difference P-value Treatment Control Difference P-valueBig Five Index -0.058 0.042 -0.100 0.295 -0.017 0.018 -0.035 0.801
[0.713] [0.820] (0.095) [0.637 [0.738] (0.138)Agreeableness 3.498 3.577 -0.079 0.309 3.783 3.666 0.117 0.253
[0.622] [0.678] (0.077) [0.477] [0.537] (0.102)Conscientiousness 3.958 3.996 -0.037 0.605 4.159 4.113 0.046 0.646
[0.548] [0.570] (0.072) [0.452] [0.531] (0.099)Extroversion 3.624 3.686 -0.062 0.277 3.703 3.724 -0.021 0.830
[0.464] [0.501] (0.057) [0.525] [0.459] (0.099)Emotional Stability -2.647 -2.536 -0.111 0.180 -2.461 -2.343 -0.119 0.322
[0.641] [0.702] (0.082) [0.571] [0.618] (0.119)Openness 2.926 2.932 -0.006 0.907 3.020 3.123 -0.103 0.218
[0.372] [0.451] (0.050) [0.471] [0.353] (0.083)
Perry Public Sector Motivation
Doctor Personality Traits Inspector Personality Traits
Treatment Control Difference P-value Treatment Control Difference P-valuePSM Index -0.017 -0.018 0.001 0.989 -0.061 0.064 -0.125 0.309
[0.695] [0.691] (0.079) [0.621] [0.610] (0.122)Attraction 3.481 3.442 0.039 0.581 3.552 3.585 -0.033 0.764
[0.630] [0.610] (0.070) [0.532] [0.575] (0.110)Civic duty 4.182 4.184 -0.002 0.969 4.255 4.421 -0.165 0.051
[0.594] [0.526] (0.059) [0.415] [0.432] (0.084)Commitment 3.773 3.774 -0.001 0.982 3.915 3.956 -0.040 0.628
[0.511] [0.463] (0.050) [0.458] [0.379] (0.083)Compassion 3.493 3.546 -0.053 0.432 3.743 3.663 0.080 0.400
[0.515] [0.516] (0.067) [0.475] [0.484] (0.095)Self Sacrifice 4.065 4.080 -0.015 0.820 4.316 4.392 -0.077 0.409
[0.563] [0.574] (0.065) [0.482] [0.450] (0.092)Social Justice 3.950 3.906 0.044 0.464 4.098 4.196 -0.098 0.284
[0.571] [0.619] (0.060) [0.490] [0.427] (0.091)# Health Workers 242 147 52 50
Notes: Variable standard deviations reported in brackets. Standard errors clustered at the district level reported in parentheses. Thedoctor sample is limited to clinics where a doctor is posted at baseline. The Big Five and PSM traits are each mean responses tostatements that represent the trait on a five point Likert scale, in which 1 corresponds to disagree strongly, 2 to disagree a little, 3to neutral, 4 to agree a little, and 5 to agree strongly. Likert responses are given the same direction (5 always being more agreeable,for example, never less). The Big Five and PSM indices are z-score averages of the five and six traits within the Big Five and PSMrespectively. Actual observations for each regression vary by a small amount based on no responses.
the difference-in-difference specification
Ydit = β0 + β1Traitdi + β2Treatmentdit + β3Treatmentdit · Traiti + δt + λi + εdit (3)
where Ydit is a dummy equal to one if a facility records an inspection in the prior two months,
Treatmentdit is a variable equal to one for treated districts during the post-treatment periods
(waves two and three), where i refers to the clinic, d refers to the district, and t to the survey
wave, and Traiti is a personality trait of the inspector overseeing facility i. δt and λi are

28
Table 3: Testing for Heterogeneous Impacts of Monitoring by Personality Type
Health Inspection in Last Two Months (=1)(1) (2) (3) (4) (5) (6) (7) (8) (9)
PANEL A: Big Five Personality TraitsMonitoring (=1) 0.178 0.022 -0.006 0.010 0.003 0.030 -0.033 0.023
(0.154) (0.129) (0.114) (0.109) (0.115) (0.124) (0.118) (0.129)Monitoring x Big Five Index 0.351**
(0.133)Monitoring x Agreeableness 0.170*
(0.094)Monitoring x Conscientiousness 0.186*
(0.102)Monitoring x Extroversion 0.116
(0.098)Monitoring x Emotional Stability 0.210**
(0.083)Monitoring x Openness 0.195
(0.126)Mean of dependent variable 0.641 0.655 0.655 0.655 0.655 0.655 0.655 0.655# Observations 1332 1146 1146 1146 1146 1146 1146 1146# Clinics 645 548 548 548 548 548 548 548R-Squared 0.048 0.048 0.069 0.069 0.062 0.053 0.064 0.063P-value 0.256 0.867 0.013 0.078 0.078 0.245 0.017 0.133Adjusted P-value 0.083 0.214 0.214 0.274 0.101 0.249
PANEL B: Public Service MotivationMonitoring (=1) 0.178 0.022 0.023 0.026 0.039 0.024 0.012 0.041 0.021
(0.154) (0.129) (0.120) (0.111) (0.127) (0.111) (0.119) (0.130) (0.122)Monitoring x PSM Index 0.202
(0.140)Monitoring x Attraction 0.211**
(0.078)Monitoring x Civic Duty -0.029
(0.066)Monitoring x Commitment 0.103
(0.082)Monitoring x Compassion 0.184
(0.115)Monitoring x Self Sacrifice 0.016
(0.090)Monitoring x Social Justice 0.014
(0.102)Mean of dependent variable 0.641 0.655 0.648 0.648 0.648 0.648 0.648 0.648 0.648# Observations 1332 1146 1165 1165 1165 1165 1165 1165 1165# Clinics 645 548 556 556 556 556 556 556 556R-Squared 0.048 0.048 0.057 0.076 0.051 0.062 0.062 0.054 0.053P-value 0.256 0.867 0.159 0.011 0.661 0.218 0.119 0.863 0.892Adjusted P-value 0.250 0.101 0.508 0.274 0.249 0.508 0.508
Notes: This table reports heterogeneous impacts of our smartphone monitoring treatment by personality type. Column (1) reports averagetreatment effects on treatment and control district clinics. Columns (2) - (10) are limited to clinics in tehsils for which health inspectorpersonality data is available. The difference in observations between Panels A and B is due to one inspector answering the PSM but not theBig Five survey. The Big Five and PSM traits are each mean responses to statements that represent the trait on a five point Likert scale, inwhich 1 corresponds to disagree strongly, 2 to disagree a little, 3 to neutral, 4 to agree a little, and 5 to agree strongly. Likert responses aregiven the same direction (5 always being more agreeable, for example, never less). All personality traits are then normalized across inspectors.The Big Five and PSM indices are z-score averages of the five and six traits within the Big Five and PSM respectively. P-values reported arefrom a two-sided hypothesis test that the null effect is zero. Adjusted P-values are corrected for multiple hypothesis testing. One correctionis done across the Big Five and PSM indices P-values using the Family-Wise Error Rate procedure. A second is done across the eleven BigFive and PSM traits using False Discover Rate procedure. Both procedures are reported in Anderson (2008). Levels of Significance: *p < 0.1,**p < 0.05, ***p < 0.01.
29
survey wave and clinic fixed effects, respectively. We cluster all standard errors at the district
level.
For health inspectors, there are heterogeneous effects of our experiment on the rate of
health inspections. Health inspectors with a Big Five index one standard deviation above
the mean, for example, exhibit a 35 percentage point higher treatment effect in terms of
health inspections. With an unconditional mean inspection rate of 66 percent, inspectors
with a z-score one standard deviation above the mean come very close to completing all of
their inspections as a result of treatment. We decompose this effect in columns (5)-(9) and
find that that it is being driven most strongly by emotional stability—the trait of being able
to capably respond to new stressors and demands. Besides openness, all Big Five traits have
positive and large coefficients. We also see some positive and similarly large effects of the
PSM index, attraction, and compassion within the PSM traits, though only attraction is
significant.43
Figure 8 presents nonparametric treatment effects of health inspector Big Five index
across the distribution of inspectors according to the Big Five index. We can see that the
effect in Table 3 is primarily being driven by those health inspectors in the middle of the Big
Five distribution. This fits the extended model presented in Appendix Section A.1 in which
it is plausible that the effects of this intervention are localized to those inspectors in the
middle of the distribution. See Appendix Figures A.9 and A.10 for nonparametric treatment
effects trait-by-trait. While the location of the treatment effect peaks varies by trait, the
overall shape is similar for specific traits.44
There are two more points to make about these experimental results. First, as you can see
43Note that to test for robustness in our effects to the small number of district clusters in our analysis,we have conducted Fisher exact tests (randomization inference) for all heterogeneous treatment results asa separate exercise to adjusting for multiple hypothesis testing. In all cases, the estimated p-value is as atleast as significant as from un-adjusted OLS. We have also separated the differential effects into our twopost-treatment survey waves and find that the results sustain over time for as long as we were able to followhealth clinics (roughly one year after treatment began). This is important because in Callen et al. (2016),we document that the overall treatment effects on health inspections do in fact fade by the second surveywave. Results available upon request.
44Note that the point estimates in Figure 8 do not match those from Table 3. This is due to the fact thatthe regressions in the table include survey wave and clinic fixed effects.

30
-.2
0.2
.4.6
.8H
ealth
insp
ectio
n in
the
last
two
mon
ths
(=1)
0 .2 .4 .6 .8 1Baseline Inspector Big5 percentile
Control Treatment Difference 95% CI
Figure 8: Nonparametric treatment effects
Notes: This figure plots a kernel-weighted local polynomial regression of whether a clinic had a health inspection in the lasttwo months on every 5th percentile of baseline Big Five index separately for treatment and control districts, as well as thedifference at each 5th percentile of baseline scores. The confidence intervals of the treatment effects are constructed by drawing1,000 bootstrap samples of data that preserve the within-district correlation structure in the original data and plotting the 95percent range for the treatment effect at each 5th percentile of baseline scores.
in Appendix Table A.13, personality does at least as much to predict the response to increased
monitoring as all of the other covariates that we record for health inspectors. Completion
of higher education is slightly higher and more significant predictor, but it predicts more-or-
less separately from personality. Second, these correlations are of a meaningful magnitude.
Increased inspections may not lead to an overall increase in doctor attendance, but they
generate information that is helpful in the case that a health inspector or more likely a
senior health official is interested in enforcing attendance. We will see this directly in the
next subsection.

31
3.3 Do personality measures predict who will respond to salient
information on subordinate absence?
In this section, we examine whether personality identifies the senior health officials who
will react to information about the absence of their subordinates. To do this we study
the response of senior officials, as measured by doctor absenteeism in clinics under their
supervision, to a second policy intervention in which we manipulated the presentation of
information to these officials.
3.3.1 Information Experiment
The Monitoring the Monitors system aggregates data from health inspections and presents
them to senior health officials in each district of Punjab on an online dashboard. This
dashboard is only visible to these senior health officials as well as to the Secretary of Health
for Punjab and the Director General of Health for Punjab. Figure 9 provides an example of
a dashboard view visible to senior health officials.
To test whether senior health officials react to information about the absence of their
subordinates, we directly manipulated the data on the dashboard to make certain facilities
with high staff absence salient. This was achieved by highlighting in red, or “flagging”
reports by inspectors that found three or more staff absent at a clinic.45 This cutoff of three
or more staff absences was set by our research team and was not communicated to any of
the doctors, health inspectors, or senior health officials. We selected this cut-off based on
the distribution of staff absence from baseline data. The peak of the distribution lies at two
or three absent staff, suggesting that a cut-off at the center of this peak would yield the
highest power to detect an effect of flagging in red.
Though the cutoff was purposefully arbitrary, our motivation for making absence data
salient was not. Senior health officials in Punjab are in charge of health service provision
45In Callen et al. (2016), we examine at length whether this manipulation affects subsequent doctorabsence, finding consistent evidence that flagging facilities leads to decreased subsequent doctor absence.

32
Figure 9: Highlighting Underperforming Facilities to Test Mechanisms
in their district. These officials are constantly receiving information from facilities, staff,
and citizens. Given the volume of information available to these officials, we designed the
intervention to test whether making information salient could catalyze action by senior health
officers.
3.3.2 Personality Predicts Response to Information
Appendix Table A.2 presents summary statistics for senior health officials in Punjab, which
are similar in magnitude to summary statistics of both doctors and health inspectors. We
examine whether manipulating attendance information affects subsequent doctor absence
with the following specification
Absent Surveyit = ψ0 + ψ1Traiti + ψ2Flaggedit−1 + ψ3Traiti ∗ Flaggedit−1 + δt + ηit (4)

33
where Absent Surveyjt is equal to one if the doctor posted to facility i was absent during
our unannounced visit in wave t, Flaggedit−1 is a dummy equal to one if the facility was
flagged in red on the dashboard prior to survey wave t, Traiti is a personality measure for
the senior official in charge of facility i, and δt are survey wave fixed effects.
Facilities are flagged only if three or more staff members are absent. Consequently, if we
restrict our sample to only facilities where, in the month prior to our unannounced visit,
only two or three staff were absent, we can estimate the effect of flagging on a sample where
the only difference might plausibly be whether the facility was flagged.46
Table 4 reports results from this test, limiting the sample to facilities with two or three
staff absent during an inspection. Facilities flagged for absence to a senior official with a
Big Five index one standard deviation above the mean subsequently experience an increase
in doctor attendance that is 40 percentage points greater than a facility flagged to a senior
official at the mean Big Five index.47
There are several ways through which the above effect may have operated. For instance,
the health officials could have taken formal action against delinquent workers, or they could
simply have censured the officers informally. While we are unable to discern this effect given
our data, anecdotally, we have learned that the second channel is more likely to work, given
limited powers for hiring and firing people.
Appendix Table A.16 provides suggestive evidence that senior health officials with higher
personality types stepped up the share of their time spent monitoring health facilities in
46In Appendix Table A.14 we verify the drop in absence for people who score higher on the Big Five indexis limited to right around the discontinuity, with a waning, though significant, effect in a slightly largerwindow.
47Note that in Table 4 we cannot reject the null hypothesis that the interaction term on the Big Fiveindex is different than the uninteracted flagging effect. In Appendix Tables A.15, we show that when seniorhealth officials’ are split into quartiles by Big Five index, we can significantly reject that those in the bottomand top quartile have the same flagging effect (with a substantial differential effect). We define the windowduring which a clinic can be flagged in red prior to one of our unannounced visits as 15 to 45 days before ourvisit. Senior health officials only looked at the web dashboard every week or two, so we would not expectan immediate response from flagging. However, if the window is made too long, virtually every facility willbecome flagged and we will lose variation. The p-values of the significance of the coefficient on the Big Fiveindex and PSM index for a wide range of windows are reported in Appendix Figures A.11 and A.12. Thesefigures also indicate that we have not selected the window most favorable for our result.
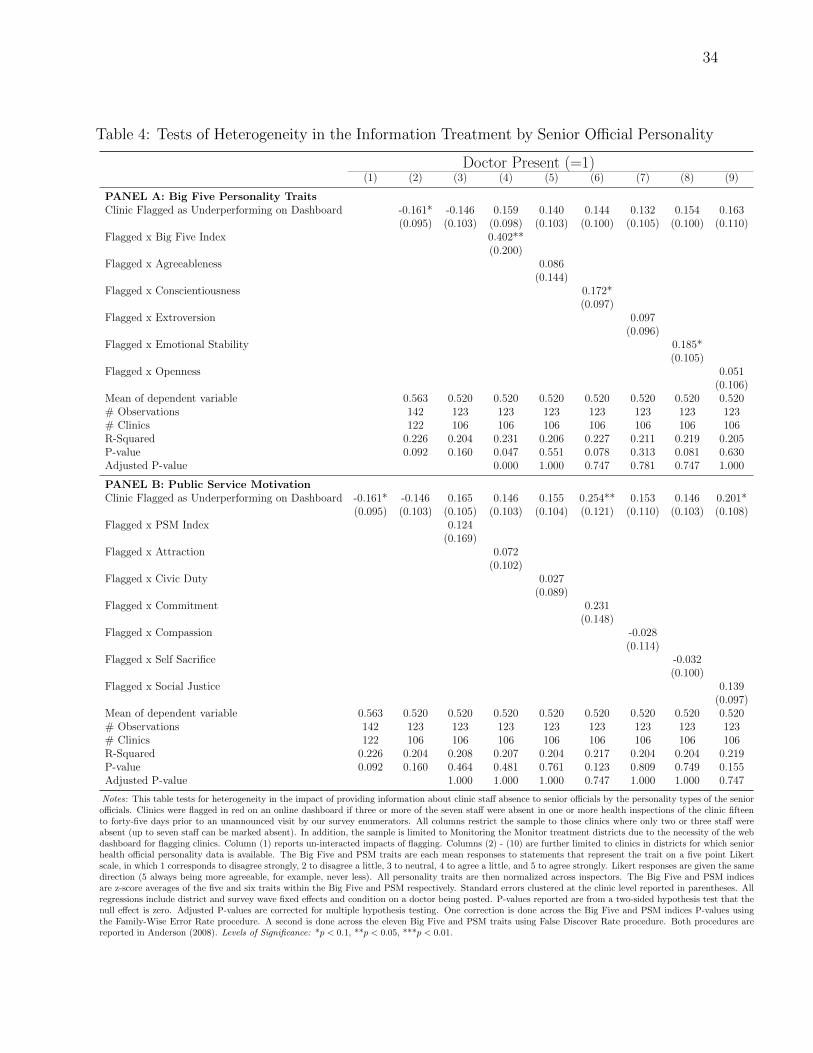
34
Table 4: Tests of Heterogeneity in the Information Treatment by Senior Official Personality
Doctor Present (=1)(1) (2) (3) (4) (5) (6) (7) (8) (9)
PANEL A: Big Five Personality TraitsClinic Flagged as Underperforming on Dashboard -0.161* -0.146 0.159 0.140 0.144 0.132 0.154 0.163
(0.095) (0.103) (0.098) (0.103) (0.100) (0.105) (0.100) (0.110)Flagged x Big Five Index 0.402**
(0.200)Flagged x Agreeableness 0.086
(0.144)Flagged x Conscientiousness 0.172*
(0.097)Flagged x Extroversion 0.097
(0.096)Flagged x Emotional Stability 0.185*
(0.105)Flagged x Openness 0.051
(0.106)Mean of dependent variable 0.563 0.520 0.520 0.520 0.520 0.520 0.520 0.520# Observations 142 123 123 123 123 123 123 123# Clinics 122 106 106 106 106 106 106 106R-Squared 0.226 0.204 0.231 0.206 0.227 0.211 0.219 0.205P-value 0.092 0.160 0.047 0.551 0.078 0.313 0.081 0.630Adjusted P-value 0.000 1.000 0.747 0.781 0.747 1.000
PANEL B: Public Service MotivationClinic Flagged as Underperforming on Dashboard -0.161* -0.146 0.165 0.146 0.155 0.254** 0.153 0.146 0.201*
(0.095) (0.103) (0.105) (0.103) (0.104) (0.121) (0.110) (0.103) (0.108)Flagged x PSM Index 0.124
(0.169)Flagged x Attraction 0.072
(0.102)Flagged x Civic Duty 0.027
(0.089)Flagged x Commitment 0.231
(0.148)Flagged x Compassion -0.028
(0.114)Flagged x Self Sacrifice -0.032
(0.100)Flagged x Social Justice 0.139
(0.097)Mean of dependent variable 0.563 0.520 0.520 0.520 0.520 0.520 0.520 0.520 0.520# Observations 142 123 123 123 123 123 123 123 123# Clinics 122 106 106 106 106 106 106 106 106R-Squared 0.226 0.204 0.208 0.207 0.204 0.217 0.204 0.204 0.219P-value 0.092 0.160 0.464 0.481 0.761 0.123 0.809 0.749 0.155Adjusted P-value 1.000 1.000 1.000 0.747 1.000 1.000 0.747
Notes: This table tests for heterogeneity in the impact of providing information about clinic staff absence to senior officials by the personality types of the seniorofficials. Clinics were flagged in red on an online dashboard if three or more of the seven staff were absent in one or more health inspections of the clinic fifteento forty-five days prior to an unannounced visit by our survey enumerators. All columns restrict the sample to those clinics where only two or three staff wereabsent (up to seven staff can be marked absent). In addition, the sample is limited to Monitoring the Monitor treatment districts due to the necessity of the webdashboard for flagging clinics. Column (1) reports un-interacted impacts of flagging. Columns (2) - (10) are further limited to clinics in districts for which seniorhealth official personality data is available. The Big Five and PSM traits are each mean responses to statements that represent the trait on a five point Likertscale, in which 1 corresponds to disagree strongly, 2 to disagree a little, 3 to neutral, 4 to agree a little, and 5 to agree strongly. Likert responses are given the samedirection (5 always being more agreeable, for example, never less). All personality traits are then normalized across inspectors. The Big Five and PSM indicesare z-score averages of the five and six traits within the Big Five and PSM respectively. Standard errors clustered at the clinic level reported in parentheses. Allregressions include district and survey wave fixed effects and condition on a doctor being posted. P-values reported are from a two-sided hypothesis test that thenull effect is zero. Adjusted P-values are corrected for multiple hypothesis testing. One correction is done across the Big Five and PSM indices P-values usingthe Family-Wise Error Rate procedure. A second is done across the eleven Big Five and PSM traits using False Discover Rate procedure. Both procedures arereported in Anderson (2008). Levels of Significance: *p < 0.1, **p < 0.05, ***p < 0.01.

35
response to dashboard flags. You can see senior health officials with a one standard deviation
higher Big Five index increased the share of their time spent monitoring health facilities by
3.1 percentage points for each facility that was flagged in their district in the window prior
to our collection of their time use information (wave three). The mean number of flags
per district in this time-frame was 7.88, which translates to large increases in time spent
monitoring by better personality types in response to flags. Although, this evidence is at
best suggestive because it is based on seventeen observations.48
The worry with the above results is that senior health officials might be substituting
other work with increased monitoring of health facilities. The data suggest that senior
health officials may have decreased their share of time spent on the lunch prayer break, on
work related to monthly polio vaccination drives, and on ‘other work’ in response to flags.
Unfortunately, these effects are not significant individually.49
As with the correlational and experimental results above, we show that personality is a
better predictor of the response to information than other important covariates for senior
health officials. See Appendix Table A.17 for these results.
The results presented in this section provide another validation of personality measures
in predicting performance, this time in the case of senior health officials. Personality mea-
sures predict which senior health officials will react to information about the absence of their
subordinates with large magnitudes. Simply flagging high absence clinics in red essentially
eliminates doctor absence in clinics overseen by senior health officials one standard devia-
tion above the mean in terms of their Big Five index. These results also speak to potential
mechanisms. It seems plausible that the same information treatment provided to individu-
48Time use information was collected through a written module provided in the same visit in whichpersonality measures were collected in which officials were asked to account for all work activities in eachhalf-hour block between 8:30am and 8:30pm from the last two regular work days. Officials could choosefrom fourteen categories, including Monitoring Visits to the BHUs, Management of BHUs done in the office,Meetings with BHU staff in office, Monitoring visits to RHCs, Management of RHCs done in the office,Monitoring visits to THQ & DHQ, Management of THQ & DHQ done in the office, Lunch/Prayer break,Tea Break, Meeting with General Public, Meeting with other Govt. Official, EPI and Polio, Other Officialactivities, and Other.
49Category-by-category time use tables available by request.
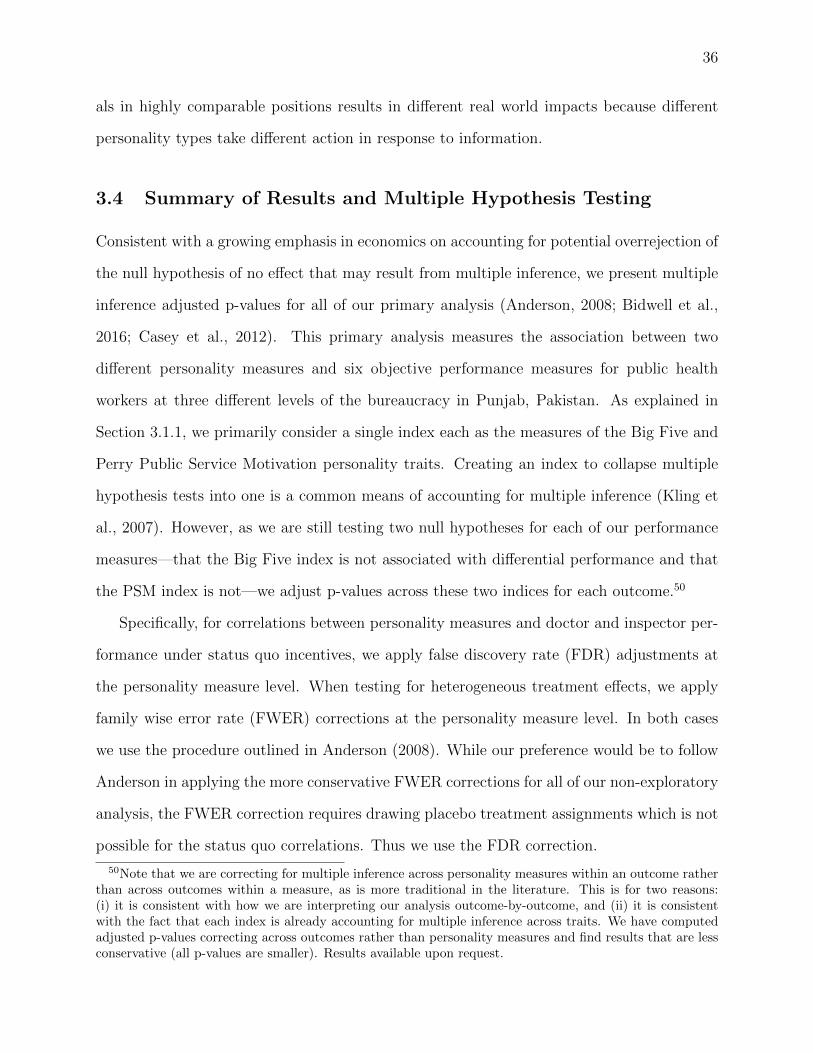
36
als in highly comparable positions results in different real world impacts because different
personality types take different action in response to information.
3.4 Summary of Results and Multiple Hypothesis Testing
Consistent with a growing emphasis in economics on accounting for potential overrejection of
the null hypothesis of no effect that may result from multiple inference, we present multiple
inference adjusted p-values for all of our primary analysis (Anderson, 2008; Bidwell et al.,
2016; Casey et al., 2012). This primary analysis measures the association between two
different personality measures and six objective performance measures for public health
workers at three different levels of the bureaucracy in Punjab, Pakistan. As explained in
Section 3.1.1, we primarily consider a single index each as the measures of the Big Five and
Perry Public Service Motivation personality traits. Creating an index to collapse multiple
hypothesis tests into one is a common means of accounting for multiple inference (Kling et
al., 2007). However, as we are still testing two null hypotheses for each of our performance
measures—that the Big Five index is not associated with differential performance and that
the PSM index is not—we adjust p-values across these two indices for each outcome.50
Specifically, for correlations between personality measures and doctor and inspector per-
formance under status quo incentives, we apply false discovery rate (FDR) adjustments at
the personality measure level. When testing for heterogeneous treatment effects, we apply
family wise error rate (FWER) corrections at the personality measure level. In both cases
we use the procedure outlined in Anderson (2008). While our preference would be to follow
Anderson in applying the more conservative FWER corrections for all of our non-exploratory
analysis, the FWER correction requires drawing placebo treatment assignments which is not
possible for the status quo correlations. Thus we use the FDR correction.
50Note that we are correcting for multiple inference across personality measures within an outcome ratherthan across outcomes within a measure, as is more traditional in the literature. This is for two reasons:(i) it is consistent with how we are interpreting our analysis outcome-by-outcome, and (ii) it is consistentwith the fact that each index is already accounting for multiple inference across traits. We have computedadjusted p-values correcting across outcomes rather than personality measures and find results that are lessconservative (all p-values are smaller). Results available upon request.
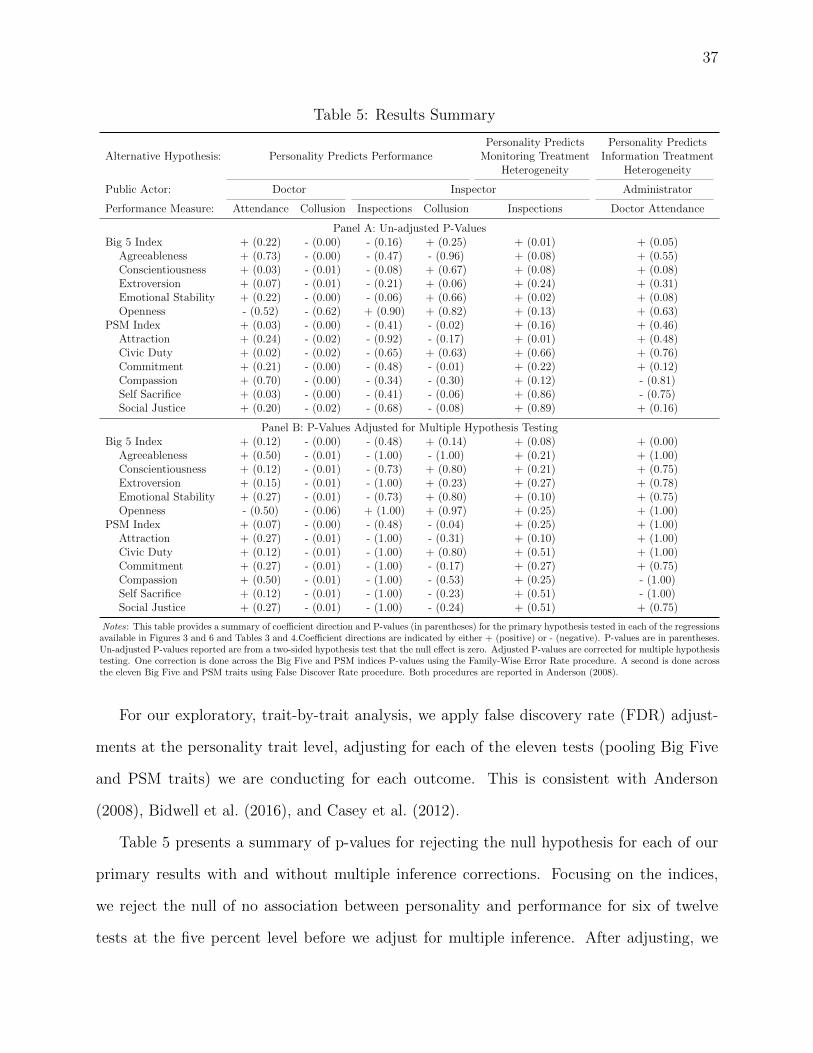
37
Table 5: Results Summary
Personality Predicts Personality PredictsAlternative Hypothesis: Personality Predicts Performance Monitoring Treatment Information Treatment
Heterogeneity Heterogeneity
Public Actor: Doctor Inspector Administrator
Performance Measure: Attendance Collusion Inspections Collusion Inspections Doctor Attendance
Panel A: Un-adjusted P-ValuesBig 5 Index + (0.22) - (0.00) - (0.16) + (0.25) + (0.01) + (0.05)
Agreeableness + (0.73) - (0.00) - (0.47) - (0.96) + (0.08) + (0.55)Conscientiousness + (0.03) - (0.01) - (0.08) + (0.67) + (0.08) + (0.08)Extroversion + (0.07) - (0.01) - (0.21) + (0.06) + (0.24) + (0.31)Emotional Stability + (0.22) - (0.00) - (0.06) + (0.66) + (0.02) + (0.08)Openness - (0.52) - (0.62) + (0.90) + (0.82) + (0.13) + (0.63)
PSM Index + (0.03) - (0.00) - (0.41) - (0.02) + (0.16) + (0.46)Attraction + (0.24) - (0.02) - (0.92) - (0.17) + (0.01) + (0.48)Civic Duty + (0.02) - (0.02) - (0.65) + (0.63) + (0.66) + (0.76)Commitment + (0.21) - (0.00) - (0.48) - (0.01) + (0.22) + (0.12)Compassion + (0.70) - (0.00) - (0.34) - (0.30) + (0.12) - (0.81)Self Sacrifice + (0.03) - (0.00) - (0.41) - (0.06) + (0.86) - (0.75)Social Justice + (0.20) - (0.02) - (0.68) - (0.08) + (0.89) + (0.16)
Panel B: P-Values Adjusted for Multiple Hypothesis TestingBig 5 Index + (0.12) - (0.00) - (0.48) + (0.14) + (0.08) + (0.00)
Agreeableness + (0.50) - (0.01) - (1.00) - (1.00) + (0.21) + (1.00)Conscientiousness + (0.12) - (0.01) - (0.73) + (0.80) + (0.21) + (0.75)Extroversion + (0.15) - (0.01) - (1.00) + (0.23) + (0.27) + (0.78)Emotional Stability + (0.27) - (0.01) - (0.73) + (0.80) + (0.10) + (0.75)Openness - (0.50) - (0.06) + (1.00) + (0.97) + (0.25) + (1.00)
PSM Index + (0.07) - (0.00) - (0.48) - (0.04) + (0.25) + (1.00)Attraction + (0.27) - (0.01) - (1.00) - (0.31) + (0.10) + (1.00)Civic Duty + (0.12) - (0.01) - (1.00) + (0.80) + (0.51) + (1.00)Commitment + (0.27) - (0.01) - (1.00) - (0.17) + (0.27) + (0.75)Compassion + (0.50) - (0.01) - (1.00) - (0.53) + (0.25) - (1.00)Self Sacrifice + (0.12) - (0.01) - (1.00) - (0.23) + (0.51) - (1.00)Social Justice + (0.27) - (0.01) - (1.00) - (0.24) + (0.51) + (0.75)
Notes: This table provides a summary of coefficient direction and P-values (in parentheses) for the primary hypothesis tested in each of the regressionsavailable in Figures 3 and 6 and Tables 3 and 4.Coefficient directions are indicated by either + (positive) or - (negative). P-values are in parentheses.Un-adjusted P-values reported are from a two-sided hypothesis test that the null effect is zero. Adjusted P-values are corrected for multiple hypothesistesting. One correction is done across the Big Five and PSM indices P-values using the Family-Wise Error Rate procedure. A second is done acrossthe eleven Big Five and PSM traits using False Discover Rate procedure. Both procedures are reported in Anderson (2008).
For our exploratory, trait-by-trait analysis, we apply false discovery rate (FDR) adjust-
ments at the personality trait level, adjusting for each of the eleven tests (pooling Big Five
and PSM traits) we are conducting for each outcome. This is consistent with Anderson
(2008), Bidwell et al. (2016), and Casey et al. (2012).
Table 5 presents a summary of p-values for rejecting the null hypothesis for each of our
primary results with and without multiple inference corrections. Focusing on the indices,
we reject the null of no association between personality and performance for six of twelve
tests at the five percent level before we adjust for multiple inference. After adjusting, we

38
reject the null for four of twelve tests at the five percent level and for six of twelve tests
at the ten percent level. That is to say that adjusting our p-values causes two cases in
which a coefficient previously significant at five percent slips to ten percent. We take this as
encouraging for our argument that personality measures predict performance.
Adjusting for multiple inference has more of an impact on our exploratory, trait-by-
trait analysis. We reject the null hypothesis of no effect for twenty six of 66 tests at the
ten percent level or below with unadjusted p-values. Once we adjust them for multiple
inference, we reject the null only thirteen times at the ten percent level or below, and eleven
of these thirteen are for one outcome—doctor collusion. Note however that an additional
eleven adjusted p-values are between 0.1 and .25. Given how conservative these adjustments
are (they are more conservative than adjusting across outcomes within each trait or than
adjusting within each personality measure separately, and we are using two-sided tests when
one-sided could be more appropriate), we take these results to be a strong caveat against
interpreting trait-by-trait results but one that does not change the underlying picture.
4 Conclusion
Governments, like any organization, are made of people with potentially stark personality
differences. We find that measurable dimensions of personality are useful in predicting
performance, how public sector workers respond to changes in incentives, and how senior
policy officials react to information about the performance of their subordinates.
These findings suggest several policy levers to improve the quality of service delivery.
First, recruitment policy will have effects through the personalities of personnel attracted to
the job (Dal Bo et al., 2013; Ashraf et al., 2014, Forthcoming; Finan et al., 2015; Deserranno,
2016). Second, a growing body of research suggests that personality traits are malleable
(Kautz et al., 2014). This suggests a role for training, potentially aimed at strengthening
non-cognitive traits (Blattman et al., 2015). Third, political economy broadly views bureau-

39
crats as agents carrying out the policy directives of politicians, supervisors, or some other
principal (Huber and Shipan, 2008; Gulzar and Pasquale, 2017). We find that how they
respond to changes in incentives can be predicted by measurable personality differences.
Indeed, there is now work showing that measurable differences in preferences between in-
dividuals can be constructively incorporated into the design of incentives (Andreoni et al.,
2016), as the principal-agent literature has previously speculated (Prendergast, 1999). Col-
lectively, this points to benefits from understanding interpersonal differences when designing
incentives. Last, there is now growing interest in whether and how providing information
to policymakers can change their actions and improve policy. We demonstrate with an
information experiment that increased information about subordinate performance can im-
prove outcomes even with existing incentive structures, and that policy-makers with different
personality profiles respond differently to this information. Collectively, this suggests that
understanding interpersonal differences in the bureaucracy can do a lot to improve policies
aimed at making it more effective.
40
References
Almlund, Mathilde, Angela Lee Duckworth, James J Heckman, and Tim DKautz, “Personality psychology and economics,” Technical Report, National Bureau ofEconomic Research 2011.
Anderson, Michael L, “Multiple inference and gender differences in the effects of earlyintervention: A reevaluation of the Abecedarian, Perry Preschool, and Early TrainingProjects,” Journal of the American statistical Association, 2008, 103 (484).
Andreoni, James, Michael Callen, Karrar Hussain, Yasir Khan, and CharlesSprenger, “Using Preference Estimates to Customize Incentives: An Application to PolioVaccination Drives in Pakistan,” 2016.
Ashraf, Nava, Oriana Bandiera, and B. Kelsey Jack, “No margin, no mission? AField Experiment on Incentives for Public Service Delivery,” Journal of Public Economics,Forthcoming, 8834.
, , and Scott S Lee, “Do-gooders and go-getters: career incentives, selection, andperformance in public service delivery,” 2014.
Augenblick, Ned, Muriel Niederle, and Charles Sprenger, “Working Over Time:Dynamic Inconsistency in Real Effort Tasks,” The Quarterly Journal of Economics, Forth-coming.
Bandiera, Oriana, Andrea Prat, and Tommaso Valletti, “Active and Passive Waste inGovernment Spending: Evidence from a Policy Experiment,” American Economic Review,2009, 99 (4), 1278–1308.
Barrick, Murray R. and Michael K. Mount, “The Big Five Personality Dimensionsand Job Performance: A Meta-Analysis,” Personnel Psychology, 1991, 44 (1), 1–26.
Bazerman, Max and Don A Moore, Judgment in Managerial Decision Making, 8thEdition, Wiley & Sons, 2012.
Benabou, Roland and Jean Tirole, “Intrinsic and extrinsic motivation,” The Review ofEconomic Studies, 2003, 70 (3), 489–520.
Bertrand, Marianne and Antoinette Schoar, “Managing with Style: The Effect ofManagers on Firm Policies,” Quarterly Journal of Economics, 2003, CXVIII, 1169–1208.
Besley, Timothy and Maitreesh Ghatak, “Competition and incentives with motivatedagents,” American Economic Review, 2005, 95 (3), 616–636.
Bidwell, Kelly, Katherine Casey, and Rachel Glennerster, “Debates: Voting andExpenditure Responses to Political Communication,” 2016.
Blattman, Christopher, Julian C. Jamison, and Margaret Sheridan, “Reducingcrime and violence: Experimental evidence on adult noncognitive investments in Liberia,”2015. Working paper.

41
Borghans, Lex, Angela Lee Duckworth, James J. Heckman, and Bas ter Weel,“The Economics and Psychology of Personality Traits,” The Journal of Human Resources,2008, XLIII (4), 973–1059.
Bowles, Samuel, Herbert Gintis, and Melissa Osborne, “The determinants of earn-ings: A behavioral approach,” Journal of Economic Literature, 2001, pp. 1137–1176.
Callen, Michael, Saad Gulzar, Ali Hasanain, and Yasir Khan, “The Political Econ-omy of Public Sector Absence: Experimental Evidence from Pakistan,” 2016. NBERWorking Paper No. 22340.
Casey, Katherine, Rachel Glennerster, and Edward Miguel, “RESHAPING IN-STITUTIONS: EVIDENCE ON AID IMPACTS USING A PREANALYSIS PLAN,” TheQuarterly Journal of Economics, 2012, 1755, 1812.
Chaudhury, Nazmul, Jeffrey Hammer, Michael Kremer, Karthik Muralidharan,and F Halsey Rogers, “Missing in action: teacher and health worker absence in devel-oping countries,” The Journal of Economic Perspectives, 2006, 20 (1), 91–116.
Dal Bo, Ernesto, Frederico Finan, and Martın A. Rossi, “Strengthening State Ca-pabilities: The Role of Financial Strengthening State Capabilities: The Role of FinancialIncentives in the Call to Public Service,” Quarterly Journal of Economics, 2013, forth-coming.
Deaton, Angus, “Instruments, Randomization, and Learning about Development,” Jour-nal of Economic Literature, 2010, 48 (2), 424–55.
der Linden, Dimitri Van, Jan te Nijenhuis, and Arnold B Bakker, “The generalfactor of personality: A meta-analysis of Big Five intercorrelations and a criterion-relatedvalidity study,” Journal of research in personality, 2010, 44 (3), 315–327.
Deserranno, Erika, “Financial Incentives as Signals: Experimental Evidence from theRecruitment of Village Promoters in Uganda,” 2016.
Digman, John M, “Higher-order factors of the Big Five.,” Journal of personality and socialpsychology, 1997, 73 (6), 1246.
Finan, Frederico, Benjamin A Olken, and Rohini Pande, “The personnel economicsof the state,” Technical Report, National Bureau of Economic Research 2015.
Gatewood, Robert, Hubert Feild, and Murray Barrick, Human resource selection,Cengage Learning, 2010.
Groth-Marnat, Gary, Handbook of psychological assessment, John Wiley & Sons, 2009.
Gulzar, Saad and Ben Pasquale, “Politicians, Bureaucrats, and Development: Evidencefrom India,” American Political Science Review, 2017.
Heckman, James J., “Integrating Personality Psychology into Economics,” 2011, (NBERWP #17378).

42
, Jora Stixrud, and Sergio Urzua, “The Effects of Cognitive and Noncognitive Abilitieson Labor Market Outcomes and Social Behavior,” Journal of Labor Economics, 2006, 24(3), 411–482.
Hogan, Joyce and Brent Holland, “Using Theory to Evaluate Personality and Job-Performance Relations: A Socioanalytic Perspective,” Journal of Applied Psychology,2003, 88 (1), 100–112.
Huber, John and Charles Shipan, “Politics, Delegation, and Bureaucracy,” in “TheOxford Handbook of Political Economy,” Oxford University Press, 2008.
John, Oliver P., Laura P. Naumann, and Christopher J. Soto, “Paradigm shift tothe integrative Big Five trait taxonomy: History, measurement, and conceptual issues,”in “Handbook of personality: Theory and research,” The Guilford Press, 2008, chapter 4.
Johnson, W. Bruce, Robert Magee, Nandu Nagarajan, and Harry Newman, “AnAnalysis of the Stock Price Reaction to Sudden Executive Deaths,” Journal of Accountingand Economics, 1985, 7, 151–174.
Jones, Benjamin F. and Benjamin A. Olken, “Do Leaders Matter? National Leadershipand Growth Since World War II,” Quarterly Journal of Economics, 2005, 120 (3), 835–864.
Kaplan, Robert M. and Dennis P. Saccuzzo, Psychological Testing: Principles, Appli-cations, and Issues, Pacific Grove, Calif.: Brooks/Cole Pub. Co., 1997.
Kautz, Tim D, James J. Heckman, Ron Diris, Bas ter Weel, and Lex Borghans,“Fostering and Measuring Skills: Improving Cognitive and Non-Cognitive Skills to Pro-mote Lifetime Success,” 2014, (NBER WP #20749).
Kling, Jeffrey R, Jeffrey B Liebman, and Lawrence F Katz, “Experimental analysisof neighborhood effects,” Econometrica, 2007, 75 (1), 83–119.
Klinger, Bailey, Asim Ijaz Khwaja, and Carlos del Carpio, Enterprising Psychomet-rics and Poverty Reduction, Springer, 2013.
Kuhn, Michael A, “Curing the Calorie Crunch: The Effect of EBT on Household Present-Bias,” 2013.
Malmendier, Ulrike, Geoffrey Tate, and Jon Yan, “Overconfidence and Early-Life Ex-periences: The Effect of Managerial Traits on Corporate Financial Policies,” The Journalof Finance, 2011, 66 (5), 1687–1733.
Miguel, Edward, C Camerer, K Casey, J Cohen, KM Esterling, A Gerber,R Glennerster, DP Green, M Humphreys, G Imbens et al., “Promoting trans-parency in social science research,” Science, 2014, 343 (6166), 30–31.
Musek, Janek, “A general factor of personality: Evidence for the Big One in the five-factormodel,” Journal of Research in Personality, 2007, 41 (6), 1213–1233.

43
National Institute of Population Studies, Pakistan Demographic and Health Survey2012-13, National Institute of Population Studies, 2013.
Nyhus, Ellen K. and Empar Pons, “The Effects of Personality on Earnings,” Journalof Economic Psychology, 2005, 26 (3), 363–384.
Olken, Benjamin A. and Rohini Pande, “Corruption in Developing Countries,” AnnualReview of Economics, 2012, 4, 479–509.
Perry, James L., “Measuring Public Service Motivation: An Assessment of ConstructReliability and Validity,” Journal of Public Administration Research and Theory, 1996, 6(1), 5–22.
and Lois Recascino Wise, “The Motivational Bases of Public Service,” Public Admin-istration Review, 1990, 50, 367–73.
Petrovsky, Nicolai, “Does Public Service Motivation Predict Higher Public Service Per-formance? A Research Synthesis,” 2009.
Prendergast, Canice, “The Provision of Incentives in Firms,” Journal of Economic Lit-erature, 1999, 1, 7–63.
Ramey, Adam, Jonathan Klingler, and Gary Hollibaugh, More Than a Feeling: Per-sonality, Polarization, and the Transformation of the US Congress, University of ChicagoPress, Forthcoming.
Rasul, Imran and Daniel Rogger, “Management of Bureaucrats and Public ServiceDelivery: Evidence from the Nigerian Civil Service,” 2014.
Reinikka, Ritva and Jakob Svensson, “Local Capture: Evidence from a Central Gov-ernment Transfer Program in Uganda,” The Quarterly Journal of Economics, 2004, 119(2), 679–705.
Roberts, Brent W., “Back to the Future: Personality and Assessment and PersonalityDevelopment,” Journal of Research in Personality, 2009, 43 (2), 137–145.
, Kate E. Walton, and Wolfgang Viechtbauer, “Patterns of Mean-Level Changein Personality Traits across the Life Course: A Meta-Analysis of Longitudinal Studies,”Psychological Bulletin, 2006, 132 (1), 1–25.
Salgado, Jesus F., “The Five Factor Model of Personality and Job Performance in theThe Five Factor Model of Personality and Job Performance in the European Community,”Journal of Applied Psychology, 1997, 82 (1), 30–43.
Schmidt, Frank L and John E Hunter, “The validity and utility of selection methodsin personnel psychology: Practical and theoretical implications of 85 years of researchfindings.,” Psychological bulletin, 1998, 124 (2), 262.
Shapiro, Jesse M, “Is there a daily discount rate? Evidence from the food stamp nutritioncycle,” Journal of Public Economics, 2005, 89 (2), 303–325.

44
Tibshirani, Robert, “Regression shrinkage and selection via the lasso,” Journal of theRoyal Statistical Society. Series B (Methodological), 1996, pp. 267–288.
Wild, Lena, Vikki Chambers, Maia King, and Daniel Harris, “Common Constraintsand Incentive Problems in Service Delivery,” Technical Report, Overseas DevelopmentInstitute 2012.
World Bank, World Development Report 2004: Making Services Work for the Poor, WorldBank, 2004.

45
A Appendix - For Online Publication Only:
A.1 Theoretical Framework
In this section, we provide a framework to help us understand the first two questions con-
sidered in this paper—do personality measures (i) predict performance under status quo
incentives and (ii) predict responses to a reform that changes incentives?51
Let our personality measures capture a worker’s type, θ, with cumulative distribution
F (θ). Let performance be the binary decision that a doctor or health inspector makes of
whether to attend work. If a worker attends, he receives a fixed salary of W and incurs a
cost of effort λ(θ). If a worker shirks, he exerts no effort and receives the fixed salary with
probability 1 − p and an arbitrarily small punishment c with probability p, as well as an
outside option of Q.52
A.1.1 Personality Type and Performance
The marginal worker indifferent between working and shirking will satisfy
W − λ(θ) = (1− p)W − pc+Q. (5)
If work is less costly for better types (∂λ∂θ
< 0), then all workers with θ greater than that
of the marginal worker will choose to work. Equation 5 therefore gives that workers with
better personality types are weakly more likely to attend work. This accords with Almlund
et al. (2011), in which the authors define traits as features which allow individuals to produce
more with a fixed amount of effort.53
51A number of papers incorporate personality traits into standard economic models such as the RoyModel (Almlund et al., 2011) or the principle-agent framework (Besley and Ghatak, 2005; Benabou andTirole, 2003).
52We choose Q here to denote ‘quack’, the term in Pakistan for a private doctor. We use the ‘he’ pronounbecause almost all government doctors and health inspectors are men.
53This might be because workers with better personality types are more efficient with their time or becausethe psychic costs required to achieve a given task are lower. Or, in a simple utility framework, we can thinkof θ as the ratio of the marginal utility from work to the marginal utility from leisure for a worker.

46
A.1.2 Personality Type and Responses to Changes to Incentives
We now turn to predictions regarding how changes to incentives affect the decision to work.
Consider a worker of type θm who is just indifferent between working and shirking. To see
what happens when the probability of detection p changes, note that
θM = λ−1(p(W + c)−Q) (6)
∂θM
∂p=
1
λ′(λ−1(p(W + c)−Q). (7)
Given our earlier assumption that ∂λ∂θ
< 0, and assuming that p(W + c) > Q, it must be
that ∂θM
∂p< 0, or that the marginal worker’s personality type decreases with an increase in
detection probability.
We can see this in a simple picture in Figure A.1. Let θM1 be the marginal worker
before an increase in p and θM2 the lower-type marginal worker afterwards. All workers with
θ > θM1 continue to work and workers with types in the shaded area θM1 > θ > θM2 are
induced to work by the increase in detection probability. The types induced to work are
the highest (best) among those that shirk prior to the shift in p. Equation 5 therefore also
describes how a personality type relates to a reform in incentives.54
Here we assume personality traits only affect the cost of effort in an otherwise simple
indifference equation. It follows that better personality types are more likely to work ex-
ante and that the better types among ex-ante shirkers will be more likely to respond to
an increase in incentives. The decision to work is potentially much more complex. For
example, personality traits that are useful in the public sector may also increase productivity
54Note that Figure A.1 allows us to make two additional points. The first is that the results in thispaper, as with all results from randomized interventions, are Local Average Treatment Effects. That is,our intervention may induce some workers to work, but there are some workers that will always work andsome that will never work regardless of the intervention. The second point is that the initial position of θM1
matters significantly to the size of the impact of an increase in detection probability. This also highlightsthe importance of the shape of the distribution of personality types, as a very narrow distribution might seedifferent effects than a uniform distribution from an increase in p. Both the initial position of θM1 and thedistribution of personality types can be estimated ex-ante, allowing for better targeted policies.

47
θM1θM2
f(θ)
θ (or MUWork
MULeisure)
Always Shirk
Always Work
Induced to Work
Figure A.1: Effect of an Increase in Detection Probability on the Decision to Work or Shirk
in the outside option (i.e., Q may also be a function of θ). More generally, θ might not
only capture the single-dimensional productivity gains to personality traits. It may also
capture heterogeneity in workers’ outside options, in workers’ cognitive ability, in workers’
ability to mitigate political pressure from outside their office, and so on. We could deal
with this in two ways. Most simply, we could redefine λ(θ) to include the all of these
personality trait-dependent costs and benefits. Then the simple model would encapsulate a
richer understanding of these costs and benefits of personality traits, but it would be unable
to differentiate these costs and benefits. Second, we could enrich the model by, for example,
modeling Q as a function of θ. Without additional and somewhat implausible assumptions,
doing so immediately expands the set of predictions to the point where the model is no
longer falsifiable. We will now demonstrate this.
A.1.3 Extending the Model
Let us extend the model to now assume that the outside option is a function of θ. Thus we
have the following updated indifference condition:
W − λ(θ) = (1− p)W − pc+Q(θ) (8)
Though it is still straightforward to see here that an increase in p weakly increases
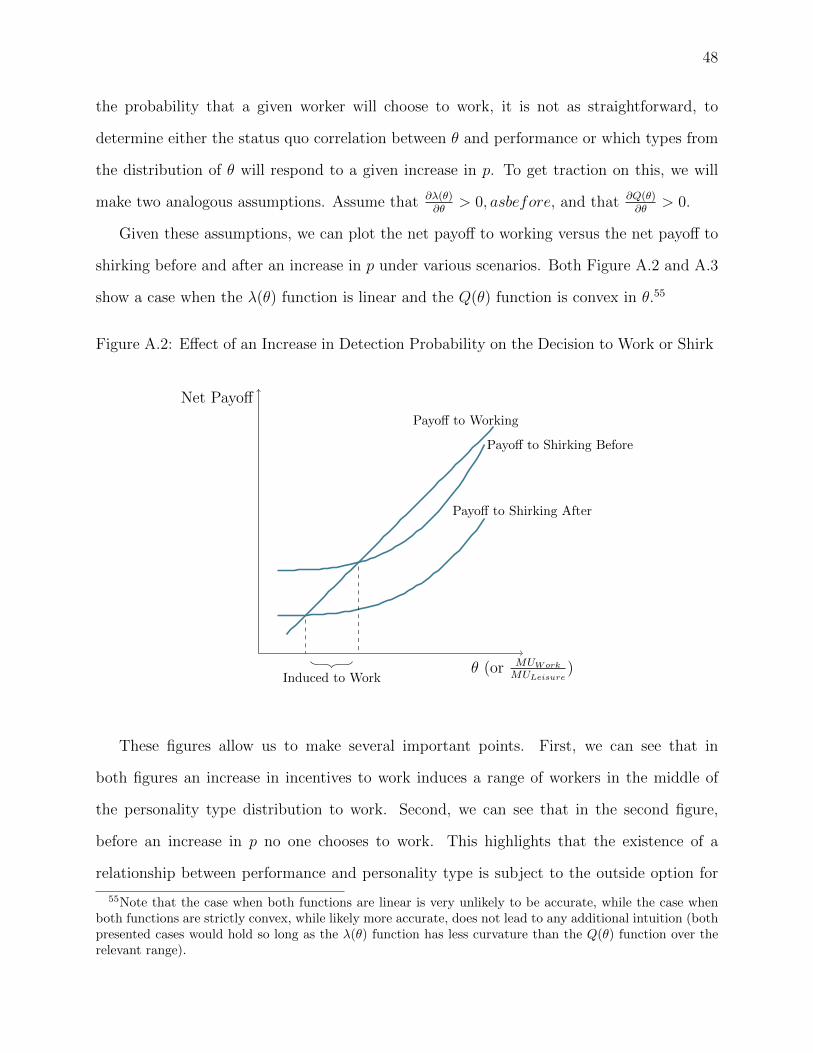
48
the probability that a given worker will choose to work, it is not as straightforward, to
determine either the status quo correlation between θ and performance or which types from
the distribution of θ will respond to a given increase in p. To get traction on this, we will
make two analogous assumptions. Assume that ∂λ(θ)∂θ
> 0, asbefore, and that ∂Q(θ)∂θ
> 0.
Given these assumptions, we can plot the net payoff to working versus the net payoff to
shirking before and after an increase in p under various scenarios. Both Figure A.2 and A.3
show a case when the λ(θ) function is linear and the Q(θ) function is convex in θ.55
Figure A.2: Effect of an Increase in Detection Probability on the Decision to Work or Shirk
θ (or MUWork
MULeisure)
Net Payoff
Induced to Work
Payoff to Shirking Before
Payoff to Shirking After
Payoff to Working
These figures allow us to make several important points. First, we can see that in
both figures an increase in incentives to work induces a range of workers in the middle of
the personality type distribution to work. Second, we can see that in the second figure,
before an increase in p no one chooses to work. This highlights that the existence of a
relationship between performance and personality type is subject to the outside option for
55Note that the case when both functions are linear is very unlikely to be accurate, while the case whenboth functions are strictly convex, while likely more accurate, does not lead to any additional intuition (bothpresented cases would hold so long as the λ(θ) function has less curvature than the Q(θ) function over therelevant range).

49
Figure A.3: Effect of an Increase in Detection Probability on the Decision to Work or Shirk
θ (or MUWork
MULeisure)
Net Payoff
Induced to Work
Payoff to Shirking Before
Payoff to Shirking After
Payoff to Working
some personality types being sufficiently low. More generally, the difference between the
two figures highlights the ambiguity in correlation between performance and personality
type under a fixed p. In the first figure, all workers above a certain marginal worker will
choose to work, with the marginal worker shifting to the left after p is increased. This would
create a positive correlation between personality type and working under the status quo
and a positive correlation between personality type and responding to an increase in p by
switching from shirking to working. Where as in the second figure, the gains to the outside
option for the highest personality types overcome the gains to those types for working even
after p is increased sufficient to induce some personality types to work, causing the best
personality types to join the worst personality types in shirking. This would lead to an
ambiguous correlation between personality type and working.
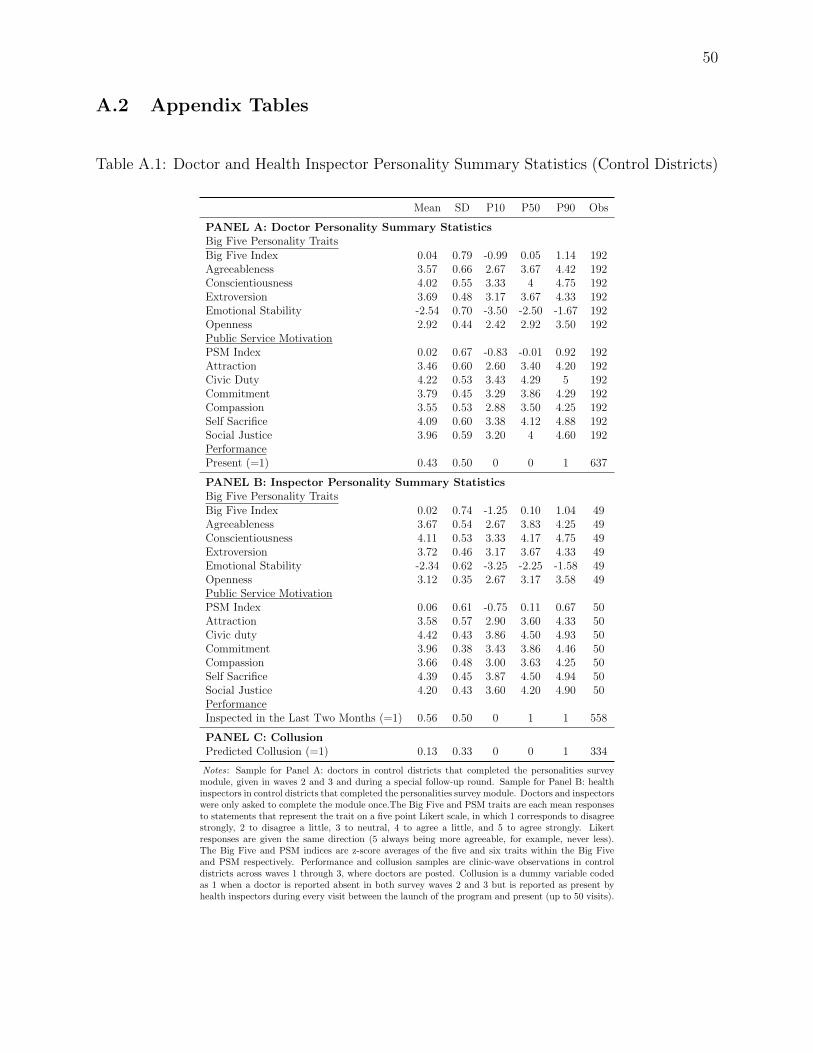
50
A.2 Appendix Tables
Table A.1: Doctor and Health Inspector Personality Summary Statistics (Control Districts)
Mean SD P10 P50 P90 Obs
PANEL A: Doctor Personality Summary StatisticsBig Five Personality TraitsBig Five Index 0.04 0.79 -0.99 0.05 1.14 192Agreeableness 3.57 0.66 2.67 3.67 4.42 192Conscientiousness 4.02 0.55 3.33 4 4.75 192Extroversion 3.69 0.48 3.17 3.67 4.33 192Emotional Stability -2.54 0.70 -3.50 -2.50 -1.67 192Openness 2.92 0.44 2.42 2.92 3.50 192Public Service MotivationPSM Index 0.02 0.67 -0.83 -0.01 0.92 192Attraction 3.46 0.60 2.60 3.40 4.20 192Civic Duty 4.22 0.53 3.43 4.29 5 192Commitment 3.79 0.45 3.29 3.86 4.29 192Compassion 3.55 0.53 2.88 3.50 4.25 192Self Sacrifice 4.09 0.60 3.38 4.12 4.88 192Social Justice 3.96 0.59 3.20 4 4.60 192PerformancePresent (=1) 0.43 0.50 0 0 1 637
PANEL B: Inspector Personality Summary StatisticsBig Five Personality TraitsBig Five Index 0.02 0.74 -1.25 0.10 1.04 49Agreeableness 3.67 0.54 2.67 3.83 4.25 49Conscientiousness 4.11 0.53 3.33 4.17 4.75 49Extroversion 3.72 0.46 3.17 3.67 4.33 49Emotional Stability -2.34 0.62 -3.25 -2.25 -1.58 49Openness 3.12 0.35 2.67 3.17 3.58 49Public Service MotivationPSM Index 0.06 0.61 -0.75 0.11 0.67 50Attraction 3.58 0.57 2.90 3.60 4.33 50Civic duty 4.42 0.43 3.86 4.50 4.93 50Commitment 3.96 0.38 3.43 3.86 4.46 50Compassion 3.66 0.48 3.00 3.63 4.25 50Self Sacrifice 4.39 0.45 3.87 4.50 4.94 50Social Justice 4.20 0.43 3.60 4.20 4.90 50PerformanceInspected in the Last Two Months (=1) 0.56 0.50 0 1 1 558
PANEL C: CollusionPredicted Collusion (=1) 0.13 0.33 0 0 1 334
Notes: Sample for Panel A: doctors in control districts that completed the personalities surveymodule, given in waves 2 and 3 and during a special follow-up round. Sample for Panel B: healthinspectors in control districts that completed the personalities survey module. Doctors and inspectorswere only asked to complete the module once.The Big Five and PSM traits are each mean responsesto statements that represent the trait on a five point Likert scale, in which 1 corresponds to disagreestrongly, 2 to disagree a little, 3 to neutral, 4 to agree a little, and 5 to agree strongly. Likertresponses are given the same direction (5 always being more agreeable, for example, never less).The Big Five and PSM indices are z-score averages of the five and six traits within the Big Fiveand PSM respectively. Performance and collusion samples are clinic-wave observations in controldistricts across waves 1 through 3, where doctors are posted. Collusion is a dummy variable codedas 1 when a doctor is reported absent in both survey waves 2 and 3 but is reported as present byhealth inspectors during every visit between the launch of the program and present (up to 50 visits).
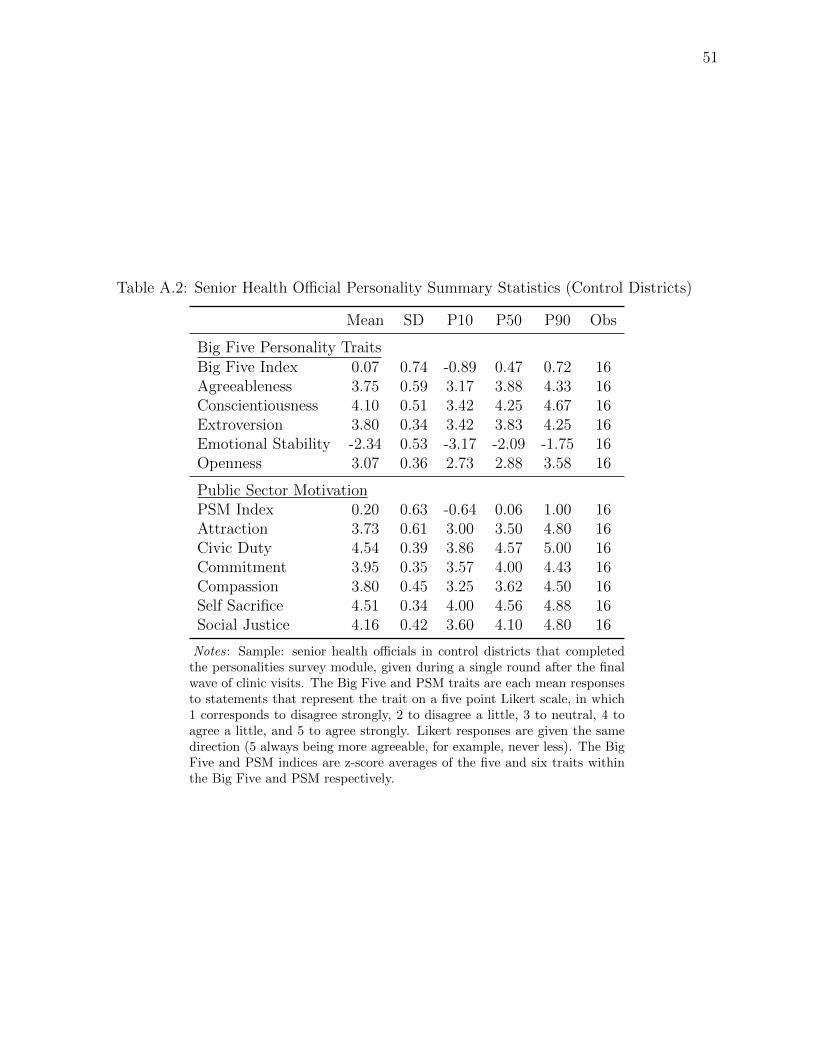
51
Table A.2: Senior Health Official Personality Summary Statistics (Control Districts)
Mean SD P10 P50 P90 Obs
Big Five Personality TraitsBig Five Index 0.07 0.74 -0.89 0.47 0.72 16Agreeableness 3.75 0.59 3.17 3.88 4.33 16Conscientiousness 4.10 0.51 3.42 4.25 4.67 16Extroversion 3.80 0.34 3.42 3.83 4.25 16Emotional Stability -2.34 0.53 -3.17 -2.09 -1.75 16Openness 3.07 0.36 2.73 2.88 3.58 16
Public Sector MotivationPSM Index 0.20 0.63 -0.64 0.06 1.00 16Attraction 3.73 0.61 3.00 3.50 4.80 16Civic Duty 4.54 0.39 3.86 4.57 5.00 16Commitment 3.95 0.35 3.57 4.00 4.43 16Compassion 3.80 0.45 3.25 3.62 4.50 16Self Sacrifice 4.51 0.34 4.00 4.56 4.88 16Social Justice 4.16 0.42 3.60 4.10 4.80 16
Notes: Sample: senior health officials in control districts that completedthe personalities survey module, given during a single round after the finalwave of clinic visits. The Big Five and PSM traits are each mean responsesto statements that represent the trait on a five point Likert scale, in which1 corresponds to disagree strongly, 2 to disagree a little, 3 to neutral, 4 toagree a little, and 5 to agree strongly. Likert responses are given the samedirection (5 always being more agreeable, for example, never less). The BigFive and PSM indices are z-score averages of the five and six traits withinthe Big Five and PSM respectively.

52
Table A.3: Doctor Personality and Doctor Attendance
Doctor Present (=1)(1) (2) (3) (4) (5) (6) (7)
PANEL A: Big Five Personality TraitsBig Five Index 0.042
(0.034)Agreeableness 0.008
(0.023)Conscientiousness 0.058**
(0.026)Extroversion 0.047*
(0.025)Emotional Stability 0.030
(0.024)Openness -0.015
(0.024)Mean of dependent variable 0.493 0.493 0.493 0.493 0.493 0.493# Observations 479 479 479 479 479 479# Clinics 190 190 190 190 190 190R-Squared 0.193 0.191 0.198 0.196 0.193 0.191P-value 0.216 0.730 0.029 0.066 0.219 0.523Adjusted P-value 0.122 0.500 0.124 0.153 0.269 0.500
PANEL B: Public Service MotivationPSM Index 0.080**
(0.037)Attraction 0.030
(0.026)Civic Duty 0.071**
(0.030)Commitment 0.033
(0.026)Compassion 0.011
(0.028)Self Sacrifice 0.056**
(0.025)Social Justice 0.028
(0.022)Mean of dependent variable 0.493 0.493 0.493 0.493 0.493 0.493 0.493# Observations 479 479 479 479 479 479 479# Clinics 190 190 190 190 190 190 190R-Squared 0.198 0.193 0.201 0.193 0.191 0.199 0.193P-value 0.033 0.242 0.019 0.213 0.696 0.030 0.201Adjusted P-value 0.071 0.269 0.124 0.269 0.500 0.124 0.269
Notes: Standard errors clustered at the clinic level reported in parentheses. All regressions include tehsil (sub-district) and survey wave fixed effects. Sample: control district clinics for which doctor personality data is availableand a doctor is posted. The Big Five and PSM traits are each mean responses to statements that represent thetrait on a five point Likert scale, in which 1 corresponds to disagree strongly, 2 to disagree a little, 3 to neutral, 4 toagree a little, and 5 to agree strongly. Likert responses are given the same direction (5 always being more agreeable,for example, never less). All personality traits are then normalized across doctors. The Big Five and PSM indicesare z-score averages of the five and six traits within the Big Five and PSM respectively. P-values reported are froma two-sided hypothesis test that the null effect is zero. Adjusted P-values are corrected for multiple hypothesistesting. One correction is done across the Big Five and PSM indices P-values using the Family-Wise Error Rateprocedure. A second is done across the eleven Big Five and PSM traits using False Discover Rate procedure. Bothprocedures are reported in Anderson (2008). Levels of Significance: *p < 0.1, **p < 0.05, ***p < 0.01.

53
Table A.4: Doctor Personality and Estimated Doctor-inspector Collusion
Doctor-inspector Collusion (=1)(1) (2) (3) (4) (5) (6) (7)
PANEL A: Big Five Personality TraitsBig Five Index -0.099***
(0.031)Agreeableness -0.083***
(0.026)Conscientiousness -0.059***
(0.021)Extroversion -0.063***
(0.023)Emotional Stability -0.063***
(0.022)Openness -0.012
(0.024)Mean of dependent variable 0.103 0.103 0.103 0.103 0.103 0.103# Observations 273 273 273 273 273 273# Clinics 273 273 273 273 273 273R-Squared 0.390 0.399 0.374 0.378 0.378 0.347P-value 0.002 0.001 0.006 0.006 0.003 0.623Adjusted P-value 0.002 0.011 0.011 0.011 0.011 0.061
PANEL B: Public Service MotivationPSM Index -0.124***
(0.037)Attraction -0.054**
(0.022)Civic Duty -0.051**
(0.022)Commitment -0.068***
(0.024)Compassion -0.067***
(0.023)Self Sacrifice -0.067***
(0.021)Social Justice -0.049**
(0.022)Mean of dependent variable 0.103 0.103 0.103 0.103 0.103 0.103 0.103# Observations 273 273 273 273 273 273 273# Clinics 273 273 273 273 273 273 273R-Squared 0.409 0.371 0.371 0.388 0.381 0.382 0.366P-value 0.001 0.016 0.020 0.005 0.004 0.002 0.025Adjusted P-value 0.002 0.011 0.011 0.011 0.011 0.011 0.011
Notes: Standard errors clustered at the clinic level reported in parentheses. All regressions include tehsil (sub-district) and surveywave fixed effects. Sample: treatment district clinics for which doctor personality data is available and a doctor is posted. Allpersonality traits are normalized. The Big Five and PSM traits are each mean responses to statements that represent the trait ona five point Likert scale, in which 1 corresponds to disagree strongly, 2 to disagree a little, 3 to neutral, 4 to agree a little, and5 to agree strongly. Likert responses are given the same direction (5 always being more agreeable, for example, never less). Allpersonality traits are then normalized across doctors. The Big Five and PSM indices are z-score averages of the five and six traitswithin the Big Five and PSM respectively. Collusion is a dummy variable coded as 1 when a doctor is reported absent in both surveywaves 2 and 3 but is reported as present by health inspectors during every visit between the launch of the program and present (upto 50 visits). P-values reported are from a two-sided hypothesis test that the null effect is zero. Adjusted P-values are correctedfor multiple hypothesis testing. One correction is done across the Big Five and PSM indices P-values using the Family-Wise ErrorRate procedure. A second is done across the eleven Big Five and PSM traits using False Discover Rate procedure. Both proceduresare reported in Anderson (2008). Levels of Significance: *p < 0.1, **p < 0.05, ***p < 0.01.

54
Table A.5: Doctor Personality Measure Predictions Compared to Other Covariates
(1) (2) (3) (4) (5)
Doctor Present (=1)Distance to Hometown (KM) -0.000 -0.000 -0.000
(0.000) (0.000) (0.000)Tenure in Department of Health (Years) 0.000 0.000 0.000
(0.000) (0.000) (0.000)Tenure at Clinic (Years) -0.001 -0.001 -0.001
(0.000) (0.001) (0.001)Big Five Index 0.048 0.056
(0.032) (0.031)PSM Index 0.091* 0.090**
(0.035) (0.035)Mean of Dependent Variable 0.502 0.493 0.484 0.493 0.484# Observations 514 479 471 479 471# Clinics 212 190 187 190 187R-Squared 0.049 0.054 0.062 0.063 0.068
Doctor-inspector Collusion (=1)Distance to Hometown (KM) -0.000 -0.000 0.000
(0.000) (0.000) (0.000)Tenure in Department of Health (Years) 0.000 0.000 0.000
(0.000) (0.000) (0.000)Tenure at Clinic (Years) -0.000 -0.000 -0.000
(0.000) (0.000) (0.000)Big Five Index -0.077** -0.082**
(0.026) (0.026)PSM Index -0.119*** -0.123***
(0.035) (0.036)Mean of Dependent Variable 0.112 0.103 0.100 0.103 0.100# Observations 295 273 269 273 269# Clinics 295 273 269 273 269R-Squared 0.051 0.087 0.094 0.123 0.130
Notes: Standard errors clustered at the clinic level reported in parentheses. All regressions include tehsil (sub-district) and survey wave fixed effects. Sample: Clinics for which doctor personality data is available and a doctoris posted. Panel A is restricted to control clinics, Panel B to treatment. The Big Five and PSM traits are eachmean responses to statements that represent the trait on a five point Likert scale, in which 1 corresponds todisagree strongly, 2 to disagree a little, 3 to neutral, 4 to agree a little, and 5 to agree strongly. Likert responsesare given the same direction (5 always being more agreeable, for example, never less). All personality traits arethen normalized across doctors. The Big Five and PSM indices are z-score averages of the five and six traits withinthe Big Five and PSM respectively. Collusion is a dummy variable coded as 1 when a doctor is reported absent inboth survey waves 2 and 3 but is reported as present by health inspectors during every visit between the launchof the program and present (up to 50 visits). Levels of Significance: *p < 0.1, **p < 0.05, ***p < 0.01.

55
Table A.6: Doctor Attendance and Health Service Provision (Control Districts)
Number of Outpatients Seen(1)
Present (=1) 197.654***(51.926)
Mean of Dependent Variable 1071.240# Observations 784# Clinics 420R-Squared 0.422
Notes: Standard errors clustered at the clinic level reported in paren-theses. Regression includes tehsil (sub-district) and survey wave fixedeffects. Sample is limited to clinics in control districts which keep recordsof outpatient visits (420 of 425). The number of outpatients seen is inthe total for each month prior to our independent visits. Present is adummy variable equal to one if the clinic’s doctor was present during thesame independent visits. Levels of Significance: *p < 0.1, **p < 0.05,***p < 0.01.

56
Table A.7: Health Inspector Personality and Inspections
Health Inspection in Last Two Months (=1)(1) (2) (3) (4) (5) (6) (7)
PANEL A: Big Five Personality TraitsBig Five Index -0.062
(0.044)Agreeableness -0.021
(0.029)Conscientiousness -0.043*
(0.024)Extroversion -0.043
(0.034)Emotional Stability -0.061*
(0.031)Openness 0.004
(0.032)Mean of dependent variable 0.588 0.588 0.588 0.588 0.588 0.588# Observations 454 454 454 454 454 454# Tehsils 45 45 45 45 45 45R-Squared 0.166 0.163 0.166 0.166 0.167 0.162P-value 0.163 0.469 0.076 0.212 0.057 0.897Adjusted P-value 0.482 1.000 0.726 1.000 0.726 1.000
PANEL B: Public Service MotivationPSM Index -0.043
(0.052)Attraction -0.003
(0.033)Civic Duty -0.010
(0.023)Commitment -0.025
(0.035)Compassion -0.054
(0.056)Self Sacrifice -0.018
(0.022)Social Justice -0.015
(0.035)Mean of dependent variable 0.572 0.572 0.572 0.572 0.572 0.572 0.572# Observations 467 467 467 467 467 467 467# Tehsils 46 46 46 46 46 46 46R-Squared 0.192 0.190 0.190 0.191 0.193 0.191 0.191P-value 0.411 0.923 0.651 0.480 0.340 0.414 0.679Adjusted P-value 0.482 1.000 1.000 1.000 1.000 1.000 1.000
Notes: Standard errors clustered at the health inspector level reported in parentheses. All regressions includedistrict and survey wave fixed effects. Sample: control district clinics for which health inspector personality datais available and a doctor is posted. The Big Five and PSM traits are each mean responses to statements thatrepresent the trait on a five point Likert scale, in which 1 corresponds to disagree strongly, 2 to disagree a little,3 to neutral, 4 to agree a little, and 5 to agree strongly. Likert responses are given the same direction (5 alwaysbeing more agreeable, for example, never less). All personality traits are then normalized across inspectors. TheBig Five and PSM indices are z-score averages of the five and six traits within the Big Five and PSM respectively.P-values reported are from a two-sided hypothesis test that the null effect is zero. Adjusted P-values are correctedfor multiple hypothesis testing. One correction is done across the Big Five and PSM indices P-values using theFamily-Wise Error Rate procedure. A second is done across the eleven Big Five and PSM traits using FalseDiscover Rate procedure. Both procedures are reported in Anderson (2008). Levels of Significance: *p < 0.1,**p < 0.05, ***p < 0.01.

57
Table A.8: Health Inspector Personality and Estimated Doctor-inspector Collusion
Doctor-inspector Collusion (=1)(1) (2) (3) (4) (5) (6) (7)
PANEL A: Big Five Personality TraitsBig Five Index 0.051
(0.044)Agreeableness -0.001
(0.027)Conscientiousness 0.009
(0.022)Extroversion 0.055*
(0.028)Emotional Stability 0.007
(0.016)Openness 0.004
(0.019)Mean of dependent variable 0.092 0.092 0.092 0.092 0.092 0.092# Observations 292 292 292 292 292 292# Tehsils 48 48 48 48 48 48R-Squared 0.148 0.144 0.144 0.159 0.144 0.144P-value 0.250 0.963 0.668 0.057 0.661 0.819Adjusted P-value 0.143 1.000 0.802 0.234 0.802 0.968
PANEL B: Public Service MotivationPSM Index -0.071**
(0.029)Attraction -0.042
(0.030)Civic Duty 0.009
(0.018)Commitment -0.050**
(0.019)Compassion -0.020
(0.019)Self Sacrifice -0.031*
(0.016)Social Justice -0.035*
(0.019)Mean of dependent variable 0.095 0.095 0.095 0.095 0.095 0.095 0.095# Observations 294 294 294 294 294 294 294# Tehsils 49 49 49 49 49 49 49R-Squared 0.160 0.153 0.149 0.167 0.151 0.155 0.157P-value 0.018 0.168 0.630 0.013 0.295 0.056 0.077Adjusted P-value 0.038 0.307 0.802 0.168 0.526 0.234 0.240
Notes: Standard errors clustered at the health inspector level reported in parentheses. All regressions includedistrict and survey wave fixed effects. Sample: control district clinics for which health inspector personality data isavailable and a doctor is posted. The Big Five and PSM traits are each mean responses to statements that representthe trait on a five point Likert scale, in which 1 corresponds to disagree strongly, 2 to disagree a little, 3 to neutral,4 to agree a little, and 5 to agree strongly. Likert responses are given the same direction (5 always being moreagreeable, for example, never less). All personality traits are then normalized across inspectors. The Big Five andPSM indices are z-score averages of the five and six traits within the Big Five and PSM respectively. Collusion isa dummy variable coded as 1 when a doctor is reported absent in both survey waves 2 and 3 but is reported aspresent by health inspectors during every visit between the launch of the program and present (up to 50 visits).P-values reported are from a two-sided hypothesis test that the null effect is zero. Adjusted P-values are correctedfor multiple hypothesis testing. One correction is done across the Big Five and PSM indices P-values using theFamily-Wise Error Rate procedure. A second is done across the eleven Big Five and PSM traits using False DiscoverRate procedure. Both procedures are reported in Anderson (2008). Levels of Significance: *p < 0.1, **p < 0.05,***p < 0.01.
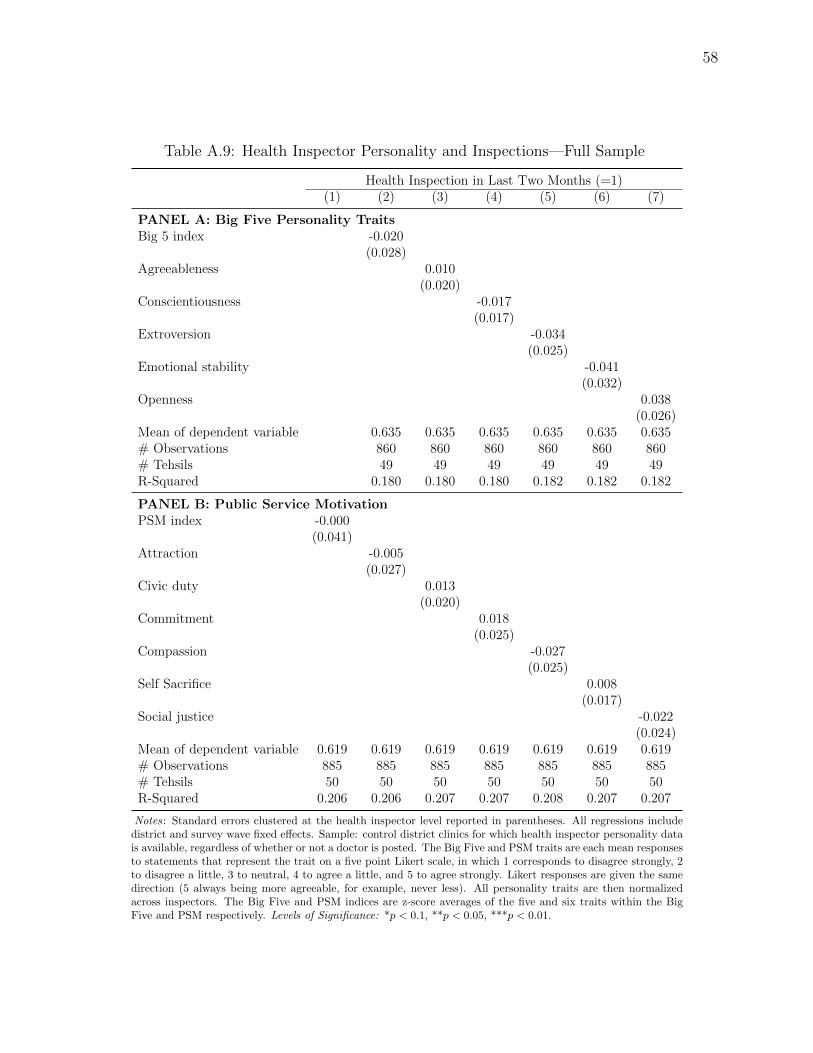
58
Table A.9: Health Inspector Personality and Inspections—Full Sample
Health Inspection in Last Two Months (=1)(1) (2) (3) (4) (5) (6) (7)
PANEL A: Big Five Personality TraitsBig 5 index -0.020
(0.028)Agreeableness 0.010
(0.020)Conscientiousness -0.017
(0.017)Extroversion -0.034
(0.025)Emotional stability -0.041
(0.032)Openness 0.038
(0.026)Mean of dependent variable 0.635 0.635 0.635 0.635 0.635 0.635# Observations 860 860 860 860 860 860# Tehsils 49 49 49 49 49 49R-Squared 0.180 0.180 0.180 0.182 0.182 0.182
PANEL B: Public Service MotivationPSM index -0.000
(0.041)Attraction -0.005
(0.027)Civic duty 0.013
(0.020)Commitment 0.018
(0.025)Compassion -0.027
(0.025)Self Sacrifice 0.008
(0.017)Social justice -0.022
(0.024)Mean of dependent variable 0.619 0.619 0.619 0.619 0.619 0.619 0.619# Observations 885 885 885 885 885 885 885# Tehsils 50 50 50 50 50 50 50R-Squared 0.206 0.206 0.207 0.207 0.208 0.207 0.207
Notes: Standard errors clustered at the health inspector level reported in parentheses. All regressions includedistrict and survey wave fixed effects. Sample: control district clinics for which health inspector personality datais available, regardless of whether or not a doctor is posted. The Big Five and PSM traits are each mean responsesto statements that represent the trait on a five point Likert scale, in which 1 corresponds to disagree strongly, 2to disagree a little, 3 to neutral, 4 to agree a little, and 5 to agree strongly. Likert responses are given the samedirection (5 always being more agreeable, for example, never less). All personality traits are then normalizedacross inspectors. The Big Five and PSM indices are z-score averages of the five and six traits within the BigFive and PSM respectively. Levels of Significance: *p < 0.1, **p < 0.05, ***p < 0.01.
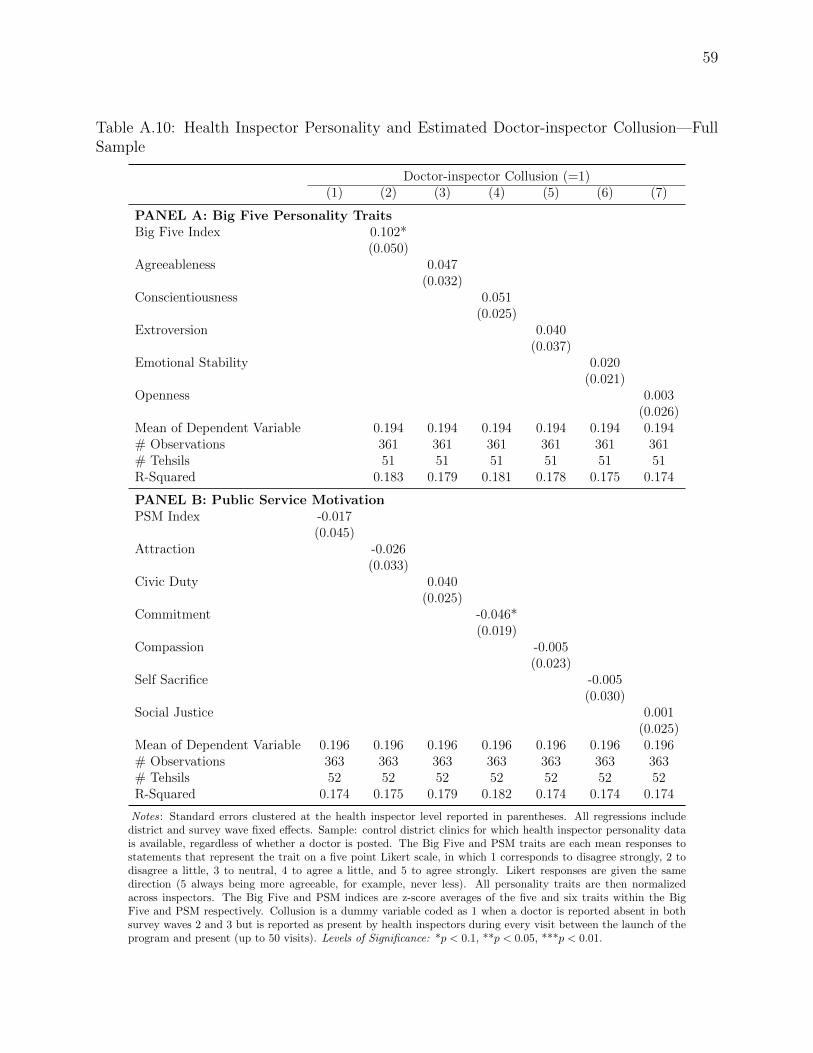
59
Table A.10: Health Inspector Personality and Estimated Doctor-inspector Collusion—FullSample
Doctor-inspector Collusion (=1)(1) (2) (3) (4) (5) (6) (7)
PANEL A: Big Five Personality TraitsBig Five Index 0.102*
(0.050)Agreeableness 0.047
(0.032)Conscientiousness 0.051
(0.025)Extroversion 0.040
(0.037)Emotional Stability 0.020
(0.021)Openness 0.003
(0.026)Mean of Dependent Variable 0.194 0.194 0.194 0.194 0.194 0.194# Observations 361 361 361 361 361 361# Tehsils 51 51 51 51 51 51R-Squared 0.183 0.179 0.181 0.178 0.175 0.174
PANEL B: Public Service MotivationPSM Index -0.017
(0.045)Attraction -0.026
(0.033)Civic Duty 0.040
(0.025)Commitment -0.046*
(0.019)Compassion -0.005
(0.023)Self Sacrifice -0.005
(0.030)Social Justice 0.001
(0.025)Mean of Dependent Variable 0.196 0.196 0.196 0.196 0.196 0.196 0.196# Observations 363 363 363 363 363 363 363# Tehsils 52 52 52 52 52 52 52R-Squared 0.174 0.175 0.179 0.182 0.174 0.174 0.174
Notes: Standard errors clustered at the health inspector level reported in parentheses. All regressions includedistrict and survey wave fixed effects. Sample: control district clinics for which health inspector personality datais available, regardless of whether a doctor is posted. The Big Five and PSM traits are each mean responses tostatements that represent the trait on a five point Likert scale, in which 1 corresponds to disagree strongly, 2 todisagree a little, 3 to neutral, 4 to agree a little, and 5 to agree strongly. Likert responses are given the samedirection (5 always being more agreeable, for example, never less). All personality traits are then normalizedacross inspectors. The Big Five and PSM indices are z-score averages of the five and six traits within the BigFive and PSM respectively. Collusion is a dummy variable coded as 1 when a doctor is reported absent in bothsurvey waves 2 and 3 but is reported as present by health inspectors during every visit between the launch of theprogram and present (up to 50 visits). Levels of Significance: *p < 0.1, **p < 0.05, ***p < 0.01.

60
Table A.11: Health Inspector Personality Measure Predictions Compared to Other Covari-ates
(1) (2) (3) (4) (5)
Health Inspection in Last Two Months (=1)Age (Years) -0.009 -0.005 -0.016
(0.012) (0.011) (0.010)Has Completed Higher Education (=1) -0.016 -0.061 -0.058
(0.072) (0.082) (0.079)Tenure in Department of Health (Years) -0.001 -0.003 0.004
(0.012) (0.012) (0.011)Tenure as Inspector (Years) 0.018 0.026* 0.036**
(0.010) (0.010) (0.011)Distance to Hometown (KM) 0.009 0.032 0.020
(0.027) (0.032) (0.032)Inspector Reports Liking Current Post (=1) -0.016 -0.017 -0.014
(0.014) (0.022) (0.019)Big Five Index -0.062 -0.105
(0.044) (0.055)PSM Index -0.043 -0.143*
(0.052) (0.070)Mean of Dependent Variable 0.565 0.588 0.587 0.572 0.570# Observations 469 454 441 467 454# Tehsils 46 45 43 46 44R-Squared 0.200 0.166 0.186 0.192 0.216
Doctor-inspector Collusion (=1)Age (Years) -0.004 -0.004 -0.011
(0.011) (0.010) (0.010)Has Completed Higher Education (=1) -0.062 -0.052 -0.038
(0.047) (0.029) (0.031)Tenure in Department of Health (Years) 0.002 0.003 0.002
(0.013) (0.010) (0.011)Tenure as Inspector (Years) -0.002 -0.001 -0.002
(0.008) (0.007) (0.006)Distance to Hometown (KM) 0.003* 0.023 0.024
(0.001) (0.012) (0.013)Inspector Reports Liking Current Post (=1) 0.001 0.008 0.005
(0.009) (0.010) (0.009)Big Five Index 0.051 0.055
(0.044) (0.047)PSM Index -0.071* -0.113**
(0.029) (0.034)Mean of Dependent Variable 0.096 0.092 0.092 0.095 0.095# Observations 301 292 292 294 294# Tehsils 50 48 48 49 49R-Squared 0.154 0.148 0.172 0.160 0.195
Notes: Standard errors clustered at the health inspector level reported in parentheses. All regressions includedistrict and survey wave fixed effects. Sample: Clinics for which doctor personality data is available and a doctoris posted. Panel A is restricted to control clinics, Panel B to treatment. The Big Five and PSM traits are eachmean responses to statements that represent the trait on a five point Likert scale, in which 1 corresponds todisagree strongly, 2 to disagree a little, 3 to neutral, 4 to agree a little, and 5 to agree strongly. Likert responsesare given the same direction (5 always being more agreeable, for example, never less). All personality traitsare then normalized across doctors. The Big Five and PSM indices are z-score averages of the five and sixtraits within the Big Five and PSM respectively. Collusion is a dummy variable coded as 1 when a doctor isreported absent in both survey waves 2 and 3 but is reported as present by health inspectors during every visitbetween the launch of the program and present (up to 50 visits). Levels of Significance: *p < 0.1, **p < 0.05,***p < 0.01.
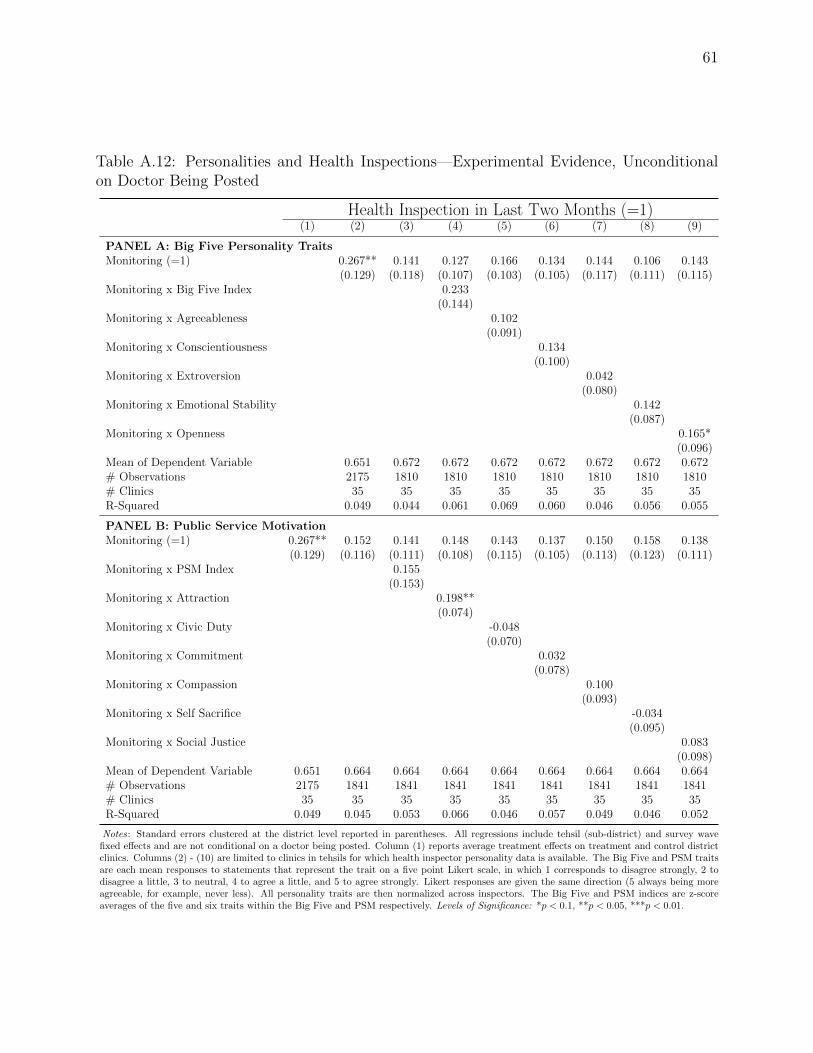
61
Table A.12: Personalities and Health Inspections—Experimental Evidence, Unconditionalon Doctor Being Posted
Health Inspection in Last Two Months (=1)(1) (2) (3) (4) (5) (6) (7) (8) (9)
PANEL A: Big Five Personality TraitsMonitoring (=1) 0.267** 0.141 0.127 0.166 0.134 0.144 0.106 0.143
(0.129) (0.118) (0.107) (0.103) (0.105) (0.117) (0.111) (0.115)Monitoring x Big Five Index 0.233
(0.144)Monitoring x Agreeableness 0.102
(0.091)Monitoring x Conscientiousness 0.134
(0.100)Monitoring x Extroversion 0.042
(0.080)Monitoring x Emotional Stability 0.142
(0.087)Monitoring x Openness 0.165*
(0.096)Mean of Dependent Variable 0.651 0.672 0.672 0.672 0.672 0.672 0.672 0.672# Observations 2175 1810 1810 1810 1810 1810 1810 1810# Clinics 35 35 35 35 35 35 35 35R-Squared 0.049 0.044 0.061 0.069 0.060 0.046 0.056 0.055
PANEL B: Public Service MotivationMonitoring (=1) 0.267** 0.152 0.141 0.148 0.143 0.137 0.150 0.158 0.138
(0.129) (0.116) (0.111) (0.108) (0.115) (0.105) (0.113) (0.123) (0.111)Monitoring x PSM Index 0.155
(0.153)Monitoring x Attraction 0.198**
(0.074)Monitoring x Civic Duty -0.048
(0.070)Monitoring x Commitment 0.032
(0.078)Monitoring x Compassion 0.100
(0.093)Monitoring x Self Sacrifice -0.034
(0.095)Monitoring x Social Justice 0.083
(0.098)Mean of Dependent Variable 0.651 0.664 0.664 0.664 0.664 0.664 0.664 0.664 0.664# Observations 2175 1841 1841 1841 1841 1841 1841 1841 1841# Clinics 35 35 35 35 35 35 35 35 35R-Squared 0.049 0.045 0.053 0.066 0.046 0.057 0.049 0.046 0.052
Notes: Standard errors clustered at the district level reported in parentheses. All regressions include tehsil (sub-district) and survey wavefixed effects and are not conditional on a doctor being posted. Column (1) reports average treatment effects on treatment and control districtclinics. Columns (2) - (10) are limited to clinics in tehsils for which health inspector personality data is available. The Big Five and PSM traitsare each mean responses to statements that represent the trait on a five point Likert scale, in which 1 corresponds to disagree strongly, 2 todisagree a little, 3 to neutral, 4 to agree a little, and 5 to agree strongly. Likert responses are given the same direction (5 always being moreagreeable, for example, never less). All personality traits are then normalized across inspectors. The Big Five and PSM indices are z-scoreaverages of the five and six traits within the Big Five and PSM respectively. Levels of Significance: *p < 0.1, **p < 0.05, ***p < 0.01.

62
Table A.13: Inspector Personality Measure Experimental Results Compared to Other Co-variates
(1) (2) (3) (4) (5) (6)
Inspected in the Last Two Months (=1)Monitoring (=1) 0.178 1.015 -0.006 0.244 0.023 0.659
(0.154) (1.121) (0.114) (1.092) (0.120) (1.094)Monitoring x Age (Years) 0.001 0.011 0.012
(0.032) (0.031) (0.032)Monitoring x Has Completed Higher Education (=1) 0.205 0.358* 0.296
(0.147) (0.148) (0.155)Monitoring x Tenure in Department of Health (Years) -0.034 -0.027 -0.044
(0.032) (0.033) (0.032)Monitoring x Tenure as Inspector (Years) 0.028 0.019 0.023
(0.024) (0.024) (0.029)Monitoring x Distance to Hometown (KM) 0.047 0.085 0.086
(0.027) (0.050) (0.049)Monitoring x Inspector Reports Liking Current Post (=1) -0.061 -0.058 -0.062
(0.048) (0.048) (0.048)Monitoring x Big Five Index 0.351* 0.277
(0.133) (0.167)Monitoring x PSM Index 0.202 0.120
(0.140) (0.159)Mean of dependent variable 0.641 0.644 0.655 0.504 0.648 0.503# Observations 1332 1178 1146 1133 1165 1152# Tehsils 35 33 34 33 34 33R-Squared 0.048 0.095 0.069 0.103 0.057 0.098
Notes: Standard errors clustered at the district level reported in parentheses. All regressions include district and survey wave fixedeffects. Sample: clinics for which health inspector personality data is available and a doctor is posted. The Big Five and PSM indicesare z-score averages of the five and six traits within the Big Five and PSM respectively. Levels of Significance: *p < 0.1, **p < 0.05,***p < 0.01.
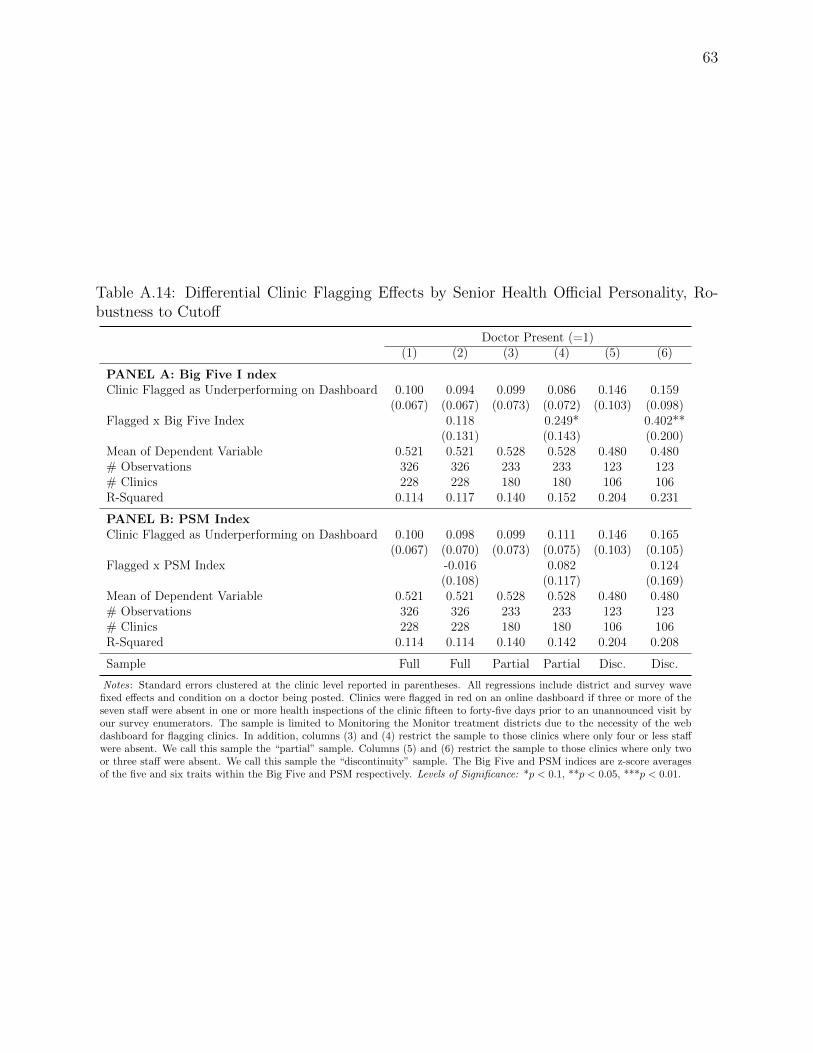
63
Table A.14: Differential Clinic Flagging Effects by Senior Health Official Personality, Ro-bustness to Cutoff
Doctor Present (=1)(1) (2) (3) (4) (5) (6)
PANEL A: Big Five I ndexClinic Flagged as Underperforming on Dashboard 0.100 0.094 0.099 0.086 0.146 0.159
(0.067) (0.067) (0.073) (0.072) (0.103) (0.098)Flagged x Big Five Index 0.118 0.249* 0.402**
(0.131) (0.143) (0.200)Mean of Dependent Variable 0.521 0.521 0.528 0.528 0.480 0.480# Observations 326 326 233 233 123 123# Clinics 228 228 180 180 106 106R-Squared 0.114 0.117 0.140 0.152 0.204 0.231
PANEL B: PSM IndexClinic Flagged as Underperforming on Dashboard 0.100 0.098 0.099 0.111 0.146 0.165
(0.067) (0.070) (0.073) (0.075) (0.103) (0.105)Flagged x PSM Index -0.016 0.082 0.124
(0.108) (0.117) (0.169)Mean of Dependent Variable 0.521 0.521 0.528 0.528 0.480 0.480# Observations 326 326 233 233 123 123# Clinics 228 228 180 180 106 106R-Squared 0.114 0.114 0.140 0.142 0.204 0.208
Sample Full Full Partial Partial Disc. Disc.
Notes: Standard errors clustered at the clinic level reported in parentheses. All regressions include district and survey wavefixed effects and condition on a doctor being posted. Clinics were flagged in red on an online dashboard if three or more of theseven staff were absent in one or more health inspections of the clinic fifteen to forty-five days prior to an unannounced visit byour survey enumerators. The sample is limited to Monitoring the Monitor treatment districts due to the necessity of the webdashboard for flagging clinics. In addition, columns (3) and (4) restrict the sample to those clinics where only four or less staffwere absent. We call this sample the “partial” sample. Columns (5) and (6) restrict the sample to those clinics where only twoor three staff were absent. We call this sample the “discontinuity” sample. The Big Five and PSM indices are z-score averagesof the five and six traits within the Big Five and PSM respectively. Levels of Significance: *p < 0.1, **p < 0.05, ***p < 0.01.
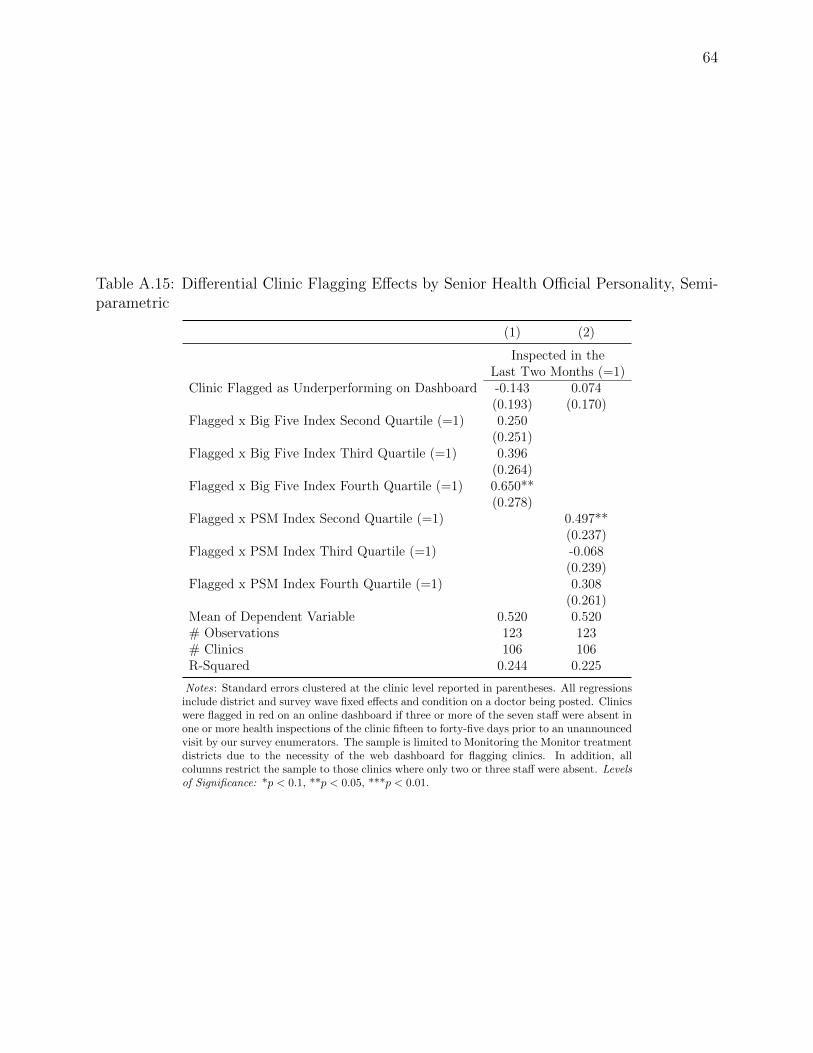
64
Table A.15: Differential Clinic Flagging Effects by Senior Health Official Personality, Semi-parametric
(1) (2)
Inspected in theLast Two Months (=1)
Clinic Flagged as Underperforming on Dashboard -0.143 0.074(0.193) (0.170)
Flagged x Big Five Index Second Quartile (=1) 0.250(0.251)
Flagged x Big Five Index Third Quartile (=1) 0.396(0.264)
Flagged x Big Five Index Fourth Quartile (=1) 0.650**(0.278)
Flagged x PSM Index Second Quartile (=1) 0.497**(0.237)
Flagged x PSM Index Third Quartile (=1) -0.068(0.239)
Flagged x PSM Index Fourth Quartile (=1) 0.308(0.261)
Mean of Dependent Variable 0.520 0.520# Observations 123 123# Clinics 106 106R-Squared 0.244 0.225
Notes: Standard errors clustered at the clinic level reported in parentheses. All regressionsinclude district and survey wave fixed effects and condition on a doctor being posted. Clinicswere flagged in red on an online dashboard if three or more of the seven staff were absent inone or more health inspections of the clinic fifteen to forty-five days prior to an unannouncedvisit by our survey enumerators. The sample is limited to Monitoring the Monitor treatmentdistricts due to the necessity of the web dashboard for flagging clinics. In addition, allcolumns restrict the sample to those clinics where only two or three staff were absent. Levelsof Significance: *p < 0.1, **p < 0.05, ***p < 0.01.
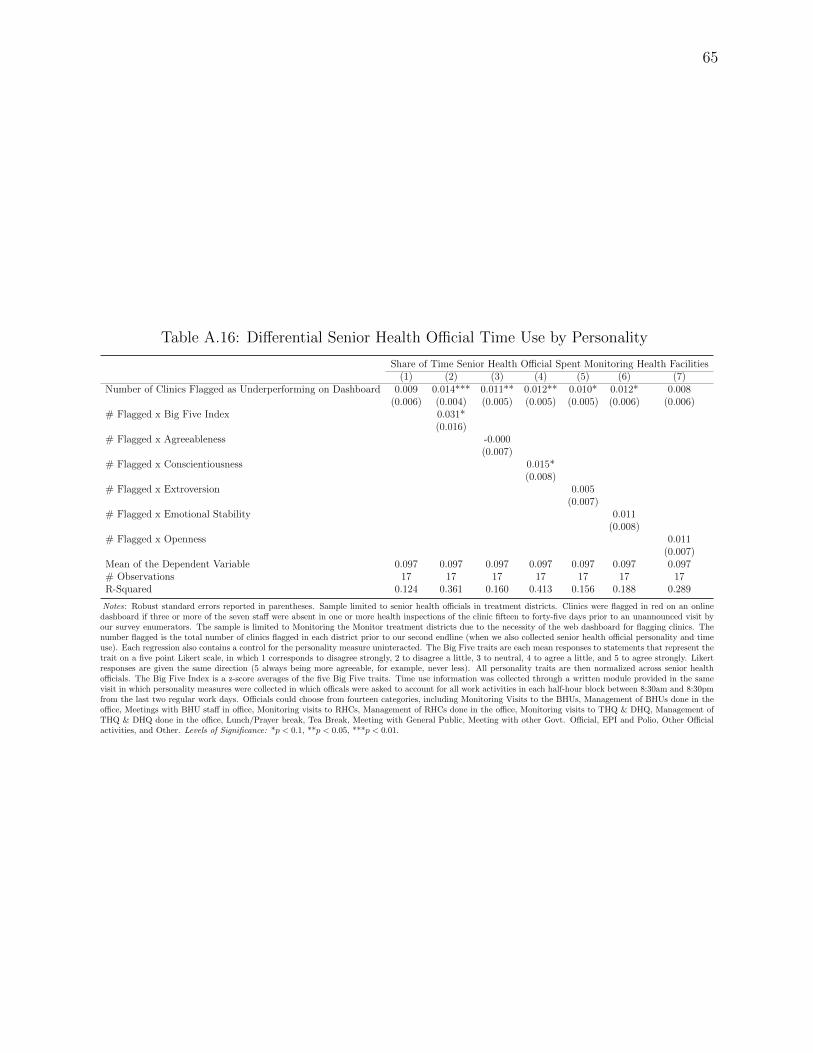
65
Table A.16: Differential Senior Health Official Time Use by Personality
Share of Time Senior Health Official Spent Monitoring Health Facilities(1) (2) (3) (4) (5) (6) (7)
Number of Clinics Flagged as Underperforming on Dashboard 0.009 0.014*** 0.011** 0.012** 0.010* 0.012* 0.008(0.006) (0.004) (0.005) (0.005) (0.005) (0.006) (0.006)
# Flagged x Big Five Index 0.031*(0.016)
# Flagged x Agreeableness -0.000(0.007)
# Flagged x Conscientiousness 0.015*(0.008)
# Flagged x Extroversion 0.005(0.007)
# Flagged x Emotional Stability 0.011(0.008)
# Flagged x Openness 0.011(0.007)
Mean of the Dependent Variable 0.097 0.097 0.097 0.097 0.097 0.097 0.097# Observations 17 17 17 17 17 17 17R-Squared 0.124 0.361 0.160 0.413 0.156 0.188 0.289
Notes: Robust standard errors reported in parentheses. Sample limited to senior health officials in treatment districts. Clinics were flagged in red on an onlinedashboard if three or more of the seven staff were absent in one or more health inspections of the clinic fifteen to forty-five days prior to an unannounced visit byour survey enumerators. The sample is limited to Monitoring the Monitor treatment districts due to the necessity of the web dashboard for flagging clinics. Thenumber flagged is the total number of clinics flagged in each district prior to our second endline (when we also collected senior health official personality and timeuse). Each regression also contains a control for the personality measure uninteracted. The Big Five traits are each mean responses to statements that represent thetrait on a five point Likert scale, in which 1 corresponds to disagree strongly, 2 to disagree a little, 3 to neutral, 4 to agree a little, and 5 to agree strongly. Likertresponses are given the same direction (5 always being more agreeable, for example, never less). All personality traits are then normalized across senior healthofficials. The Big Five Index is a z-score averages of the five Big Five traits. Time use information was collected through a written module provided in the samevisit in which personality measures were collected in which officals were asked to account for all work activities in each half-hour block between 8:30am and 8:30pmfrom the last two regular work days. Officials could choose from fourteen categories, including Monitoring Visits to the BHUs, Management of BHUs done in theoffice, Meetings with BHU staff in office, Monitoring visits to RHCs, Management of RHCs done in the office, Monitoring visits to THQ & DHQ, Management ofTHQ & DHQ done in the office, Lunch/Prayer break, Tea Break, Meeting with General Public, Meeting with other Govt. Official, EPI and Polio, Other Officialactivities, and Other. Levels of Significance: *p < 0.1, **p < 0.05, ***p < 0.01.

66
Table A.17: Differential Clinic Flagging Effects by Senior Health Official Personality Com-pared to Other Covariates
(1) (2) (3) (4) (5) (6)
Doctor Present (=1)Clinic Flagged as Underperforming on Dashboard 0.146 -1.528 0.159 0.800 0.165 1.917
(0.103) (2.640) (0.098) (2.564) (0.105) (3.613)Flagged x Age (Years) 0.058 0.028 0.038
(0.055) (0.059) (0.061)Flagged x Has Completed Higher Education (=1) 0.326 0.241 0.215
(0.290) (0.248) (0.314)Flagged x Tenure in Department of Health (Years) -0.058 -0.080 -0.120
(0.084) (0.079) (0.072)Flagged x Tenure as Official (Years) -0.014 0.030 0.031
(0.039) (0.041) (0.047)Flagged x Distance to Hometown (KM) 0.011 -0.048 -0.039
(0.030) (0.034) (0.037)Flagged x Official Reports Liking Current Post (=1) 0.008 -0.002 -0.068
(0.048) (0.045) (0.071)Flagged x Big Five Index 0.402* 0.552*
(0.200) (0.242)Flagged x PSM Index 0.124 0.452
(0.169) (0.347)Mean of Dependent Variable 0.520 0.520 0.520 0.520 0.520 0.520# Observations 123 123 123 123 123 123# Clinics 106 106 106 106 106 106R-Squared 0.204 0.225 0.231 0.245 0.208 0.235
Notes: Standard errors clustered at the clinic level reported in parentheses. All regressions include district and survey wave fixedeffects and condition on a doctor being posted. Clinics were flagged in red on an online dashboard if three or more of the seven staffwere absent in one or more health inspections of the clinic fifteen to forty-five days prior to an unannounced visit by our surveyenumerators. The sample is limited to Monitoring the Monitor treatment districts due to the necessity of the web dashboard forflagging clinics. In addition, the sample is restructed to those clinics where only two or three staff were absent. We call this samplethe “discontinuity” sample. The Big Five and PSM indices are z-score averages of the five and six traits within the Big Five andPSM respectively. Levels of Significance: *p < 0.1, **p < 0.05, ***p < 0.01.

67
A.3 Appendix Figures
01
23
Den
sity
0 .2 .4 .6Absolute Pairwise Correlations
Doctors (this study) Inspectors (this study)
Senior Health Officials (this study) Government Vaccinators
College Students Slum-dwellers in Peshawar/Islamabad
Candidates for Village Councils
Figure A.4: Absolute Pairwise Correlations of Big Five Personality Traits in Different Sam-ples
Notes: Displays smoothed density of ten absolute pairwise correlations between measures of each of the Big Five personalitytraits for seven samples. The first three samples are those of doctors, inspectors, and senior health officials in this study.Additional samples: (i) public sector polio vaccinators in Punjab (N = 420); (ii) residents of slums near Islamabad, Peshawar,and Dera Ghazi Khan, often care migrants from areas close to Pakistan’s border with Afghanistan (N = 1152); (iii) all politiciansfrom 240 electoral constituencies of Haripur and Abbotabad districts located in the province of Khyber-Pakhtunkhwa whocontested the first village council elections in 2015 (N = 3628); and (iv) students at the Lahore University of ManagementScience, an elite private sector university in Punjab (N = 227). These samples are obtained from collaborators who have usedthe same locally sourced version of the Big Five personality test as this study. The Big Five traits are each mean responsesto statements that represent the trait on a five point Likert scale, in which 1 corresponds to disagree strongly, 2 to disagree alittle, 3 to neutral, 4 to agree a little, and 5 to agree strongly. Likert responses are given the same direction (5 always beingmore agreeable, for example, never less).
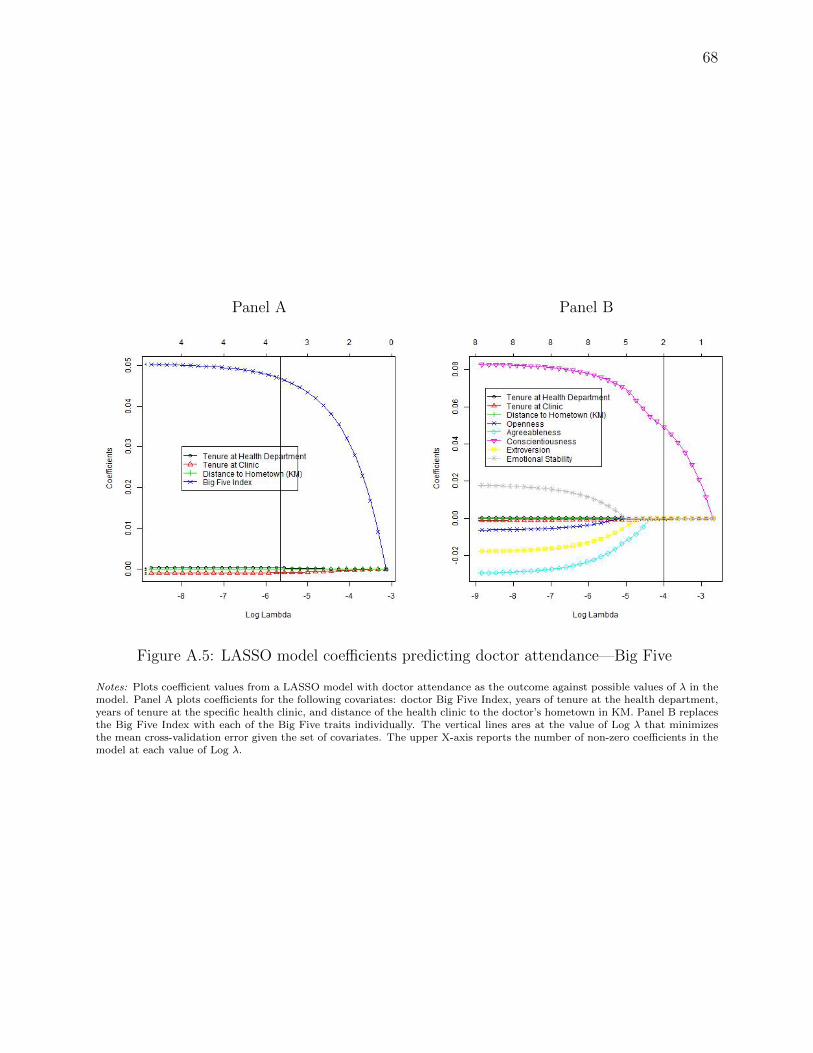
68
Panel A Panel B
Figure A.5: LASSO model coefficients predicting doctor attendance—Big Five
Notes: Plots coefficient values from a LASSO model with doctor attendance as the outcome against possible values of λ in themodel. Panel A plots coefficients for the following covariates: doctor Big Five Index, years of tenure at the health department,years of tenure at the specific health clinic, and distance of the health clinic to the doctor’s hometown in KM. Panel B replacesthe Big Five Index with each of the Big Five traits individually. The vertical lines ares at the value of Log λ that minimizesthe mean cross-validation error given the set of covariates. The upper X-axis reports the number of non-zero coefficients in themodel at each value of Log λ.

69
Panel A Panel B
Figure A.6: LASSO model coefficients predicting doctor attendance—PSM
Notes: Plots coefficient values from a LASSO model with doctor attendance as the outcome against possible values of λ in themodel. Panel A plots coefficients for the following covariates: doctor PSM Index, years of tenure at the health department,years of tenure at the specific health clinic, and distance of the health clinic to the doctor’s hometown in KM. Panel B replacesthe PSM Index with each of the PSM traits individually. The vertical lines ares at the value of Log λ that minimizes the meancross-validation error given the set of covariates. The upper X-axis reports the number of non-zero coefficients in the model ateach value of Log λ.
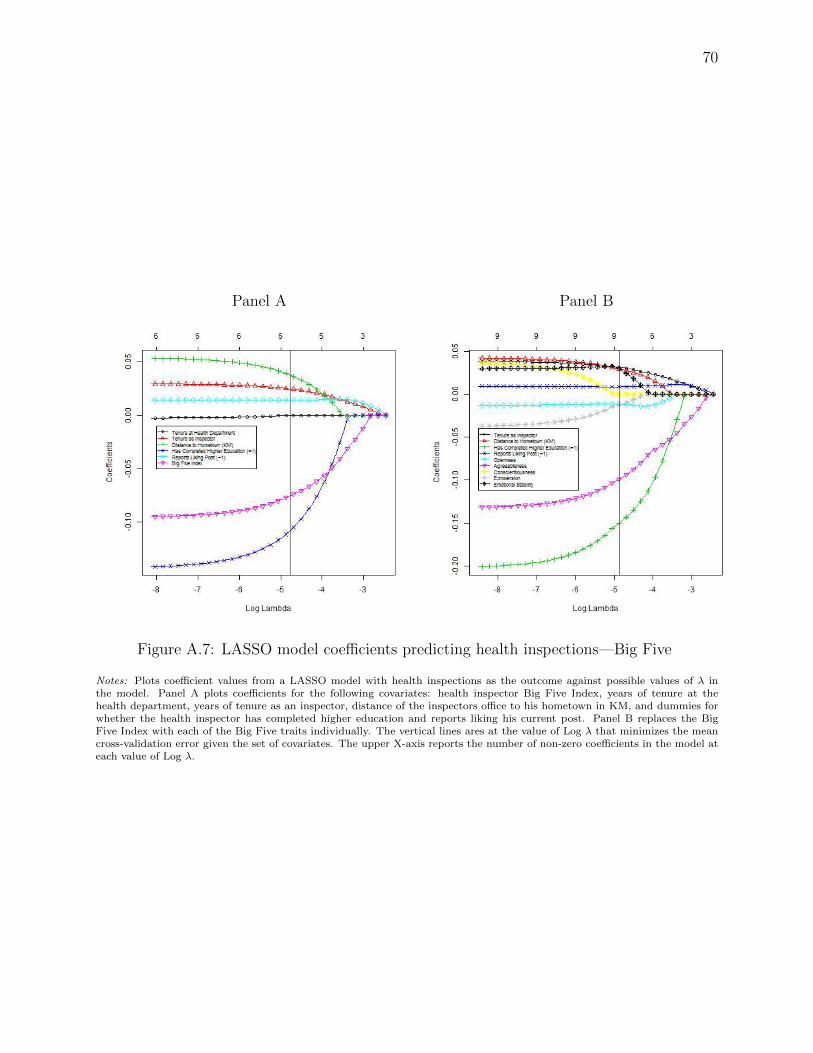
70
Panel A Panel B
Figure A.7: LASSO model coefficients predicting health inspections—Big Five
Notes: Plots coefficient values from a LASSO model with health inspections as the outcome against possible values of λ inthe model. Panel A plots coefficients for the following covariates: health inspector Big Five Index, years of tenure at thehealth department, years of tenure as an inspector, distance of the inspectors office to his hometown in KM, and dummies forwhether the health inspector has completed higher education and reports liking his current post. Panel B replaces the BigFive Index with each of the Big Five traits individually. The vertical lines ares at the value of Log λ that minimizes the meancross-validation error given the set of covariates. The upper X-axis reports the number of non-zero coefficients in the model ateach value of Log λ.

71
Panel A Panel B
Figure A.8: LASSO model coefficients predicting health inspections—PSM
Notes: Plots coefficient values from a LASSO model with health inspections as the outcome against possible values of λ inthe model. Panel A plots coefficients for the following covariates: health inspector PSM Index, years of tenure at the healthdepartment, years of tenure as an inspector, distance of the inspectors office to his hometown in KM, and dummies for whetherthe health inspector has completed higher education and reports liking his current post. Panel B replaces the PSM Index witheach of thePSM traits individually. The vertical lines ares at the value of Log λ that minimizes the mean cross-validation errorgiven the set of covariates. The upper X-axis reports the number of non-zero coefficients in the model at each value of Log λ.

72
0.1
.2.3
0.1
.2.3
0 .5 1 0 .5 1 0 .5 1
a. Big 5 index b. Agreeableness c. Conscientiousness
d. Extroversion e. Openness f. Emotional stability
Hea
lth in
spec
tion
in th
e la
st tw
o m
onth
s (=
1)D
iffer
ence
bet
wee
n tr
eatm
ent a
nd c
ontr
ol
Baseline Inspector personality percentile
Figure A.9: Health Inspector Non-parametric Heterogeneous Effects, Trait-by-Trait, BigFive
0.1
.2.3
0.1
.2.3
0.1
.2.3
0 .5 1 0 .5 1
0 .5 1
a. PSM index b. Attraction c. Civic Duty
d. Commitment e. Compassion f. Self Sacrifice
g. Social Justice
Hea
lth in
spec
tion
in th
e la
st tw
o m
onth
s (=
1)D
iffer
ence
bet
wee
n tr
eatm
ent a
nd c
ontr
ol
Baseline Inspector personality percentile
Figure A.10: Health Inspector Non-parametric Heterogeneous Effects, Trait-by-Trait, PSM

73
+0
+5
+10
+15
+20
+25
Day
s si
nce
dash
boar
d re
port
0 10 20 30 40 50
Length of analysis window (days)
.01
.05
.1
.2
.4
p-values
Figure A.11: Robustness to Different Windows for Flagging- Big Five Index
+0
+5
+10
+15
+20
+25
Day
s si
nce
dash
boar
d re
port
0 10 20 30 40 50
Length of analysis window (days)
.01
.05
.1
.2
.4
p-values
Figure A.12: Robustness to Different Windows for Flagging- PSM Index

74
A.4 Personalities Survey Instrument—Translation

75
Name
Designation
Union Council number
Name of BHU
HMIS code
Part 3
Medical Officer
(Self Reporting Section)
In this part of the on-going LUMS study, we are trying to collect data regarding the level of job satisfaction of health officers appointed in BHUs and the factors affecting their decision to retain their posts. We will be very thankful to you for taking some time out to fill out the form enclosed in this envelope, putting it back in and then handing it to the interviewer. We would like to remind you that, as with the rest of the survey, all of your responses for this section will be kept confidential by our research team and will not be shared by any official from the health department. Nevertheless, like before, your participation is voluntary.
Instructions for filling out the questionnaire:
1. Read every statement carefully and encircle the response you agree with. a. If you completely disagree with the statement, encircle (1). b. If you mostly disagree with the statement, encircle (2). c. If you are indifferent to the statement, encircle (3). d. If you mostly agree with the statement, encircle (4). e. If you completely agree with the statement, encircle (5).
2. This test has no concept of right or wrong, nor do you have to be an expert to solve it. Respond as sincerely as possible. Write your opinion as carefully and honestly as possible. Answer every question and ensure that for every response, you have encircled the right option. During the test, if you encircle the wrong option by mistake or if you change your mind after encircling a response, do not erase it. Instead, mark the wrong response with a cross and encircle your correct one.
Section 1
Statements:
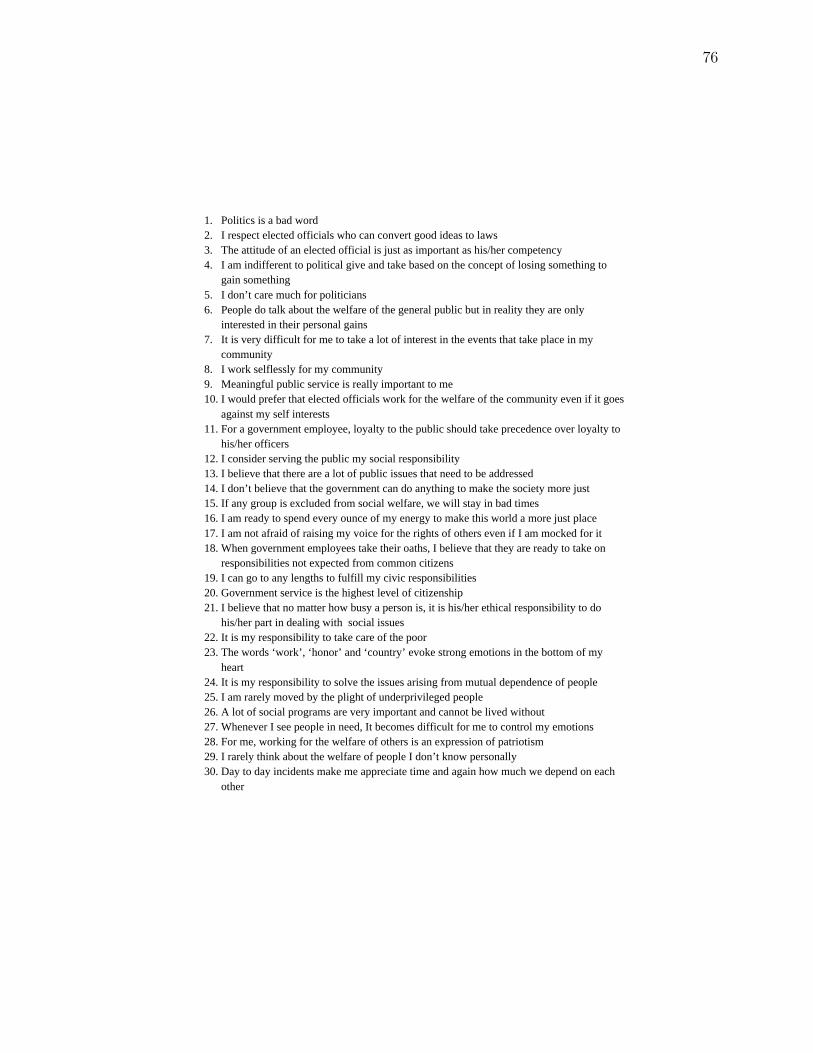
76
1. Politics is a bad word 2. I respect elected officials who can convert good ideas to laws 3. The attitude of an elected official is just as important as his/her competency 4. I am indifferent to political give and take based on the concept of losing something to
gain something 5. I don’t care much for politicians 6. People do talk about the welfare of the general public but in reality they are only
interested in their personal gains 7. It is very difficult for me to take a lot of interest in the events that take place in my
community 8. I work selflessly for my community 9. Meaningful public service is really important to me 10. I would prefer that elected officials work for the welfare of the community even if it goes
against my self interests 11. For a government employee, loyalty to the public should take precedence over loyalty to
his/her officers 12. I consider serving the public my social responsibility 13. I believe that there are a lot of public issues that need to be addressed 14. I don’t believe that the government can do anything to make the society more just 15. If any group is excluded from social welfare, we will stay in bad times 16. I am ready to spend every ounce of my energy to make this world a more just place 17. I am not afraid of raising my voice for the rights of others even if I am mocked for it 18. When government employees take their oaths, I believe that they are ready to take on
responsibilities not expected from common citizens 19. I can go to any lengths to fulfill my civic responsibilities 20. Government service is the highest level of citizenship 21. I believe that no matter how busy a person is, it is his/her ethical responsibility to do
his/her part in dealing with social issues 22. It is my responsibility to take care of the poor 23. The words ‘work’, ‘honor’ and ‘country’ evoke strong emotions in the bottom of my
heart 24. It is my responsibility to solve the issues arising from mutual dependence of people 25. I am rarely moved by the plight of underprivileged people 26. A lot of social programs are very important and cannot be lived without 27. Whenever I see people in need, It becomes difficult for me to control my emotions 28. For me, working for the welfare of others is an expression of patriotism 29. I rarely think about the welfare of people I don’t know personally 30. Day to day incidents make me appreciate time and again how much we depend on each
other

77
31. I don’t feel any sympathy for people who don’t even bother to take the first step to fulfill their needs
32. There are only a few public programs that have my full support 33. For me, bringing a change in the society is more significant than personal success 34. I give obligations precedence over personal tasks 35. I consider being financially strong to be more important than doing good things 36. Most of the causes I work for are more important than my personal benefit 37. Serving the public is a source of satisfaction for me even if I don’t get anything in return 38. I believe that people should give more to the society than what they take from it 39. I am one of the few people who are willing to help people even if it leads to personal
losses 40. I am prepared for any sacrifice for the welfare of the society
Section 2
Statements:
1. I plan everything in advance 2. I take decisions quickly 3. I save routinely 4. When I am away from my work I am eager to go back to my work 5. I can think of a lot of occasions when I kept on working diligently while others gave up 6. I continue working on difficult projects even when others opposed it 7. I like working on multiple tasks at the same time 8. Rather than completing parts of multiple projects, I prefer to complete one project every
day 9. I believe that it is better to complete old tasks before starting a new one 10. It is difficult to know who my real friends are 11. I don’t try to do something that I’m not sure about 12. In general it can be said that the people in this area are honest and can be trusted 13. A person can become rich by taking risks 14. If, during the coming week, you inherit or receive a huge amount of money, would you
still continue working with the health department? 15. How much money, if given to you, would convince you to leave your job or retire? 16. If someone finds your wallet which has Rs. 2000 in it, how likely do you expect is it that
the wallet with the complete amount would be returned to you if the wallet was found by: a. Your neighbor b. The police c. A stranger

78
Section 3
Statements:
1. I am not depressed 2. I like to be amongst lots of people 3. I don’t like to waste time day-dreaming 4. I try to be polite to everyone I meet 5. I keep all my things clean and tidy 6. I often feel inferior to other people 7. I laugh easily 8. When I find out the right way to do something, I stick with it 9. I often get into quarrels with my family members and coworkers 10. I pace my work such that I am able to complete everything on time 11. Sometimes when I am under intense psychological pressure, I feel as if I am about to fall
to pieces 12. I don’t consider myself to be a jolly person 13. Art and wonders of nature fascinate me 14. Some people think that I am selfish and egoistic 15. I am not a very organized person 16. I rarely feel lonely or sad 17. I really enjoy talking to people 18. I think that listening to controversial speakers can confuse students and lead them astray 19. I prefer cooperation over conflict 20. I try to complete all tasks entrusted to me according to my conscience 21. I often feel mentally stressed and anxious 22. I often long for thrilling situations 23. Poetry has very little or no influence on me 24. I am mistrustful and skeptical about the intentions of others 25. My objectives are very clear and I work to achieve them in a very organized way 26. Sometimes I feel completely worthless 27. I usually prefer to work alone 28. I often try new and exotic dishes 29. I believe that if you give them the chance, people will always exploit you 30. I waste a lot of time before starting to work 31. I rarely feel scared or depressed 32. I often feel full of energy 33. I don’t pay much attention to the moods and feelings evoked my surroundings and
circumstances 34. People who know me usually like me

79
35. I work very hard to achieve my goals 36. I often get frustrated by the way people treat me 37. I am a jolly and optimistic person 38. I believe that we should consult religious leaders for making decisions involving moral
affairs 39. Some people think I am cold-hearted and selfish 40. When I start something, I don’t rest until I finish it 41. Often when things start taking a turn for the worse, I give up and abandon my work 42. I am not a jolly and optimistic person 43. Sometimes while studying poetry or looking at masterpieces of art, I feel chills of thrill
and excitement 44. I am strict and stubborn in my attitude 45. Sometimes I am not as trustworthy as I ought to be 46. I am rarely sad or depressed 47. Fast pace is a highlight of my life 48. I have little interest in pondering over the working of the universe or the human condition 49. I usually try to be concerned and care about others 50. I am useful person and always do my work 51. I often feel helpless and wish someone else would resolve my problems 52. I am a very active person 53. I have a lot of intellectual curiosity in me 54. If I don’t like someone I let him/her know about it 55. I feel that I can never keep myself organized 56. Sometimes I want to hide myself due to shame 57. I would prefer to live on my own terms as opposed to being a leader for others 58. I often enjoy abstract ideas and theories 59. If need be, I am ready to use people to get my own work done 60. I try to do everything perfectly
Section 4
Note: The following questions have two possible answers
1. Did you do any charity work during the past year? 2. Have you ever contested for an electoral seat? 3. Have you ever done any volunteer work? 4. Did you vote in the last election for the National Assembly? 5. Have you ever donated blood? 6. Do you visit the Masjid regularly? 7. Do you agree with this statement: “People can be relied upon”

80
8. Do you agree with this statement: “Rules are made to be broken”