NATURAL GAS AS FEEDSTOCK FOR FERTILIZER - Welcome to ethesis - ethesis
65
NATURAL GAS AS FEEDSTOCK FOR FERTILIZER A THESIS SUBMITTED IN PARTIAL FULFILLMENT OF THE REQUIREMENTS FOR THE DEGREE OF Bachelor of Technology In Chemical Engineering By K.V.Srinivasan & Deepak Kumar Dash Department of Chemical Engineering National Institute of Technology Rourkela 2007
Transcript of NATURAL GAS AS FEEDSTOCK FOR FERTILIZER - Welcome to ethesis - ethesis

NATURAL GAS AS FEEDSTOCK FOR FERTILIZER
A THESIS SUBMITTED IN PARTIAL FULFILLMENT
OF THE REQUIREMENTS FOR THE DEGREE OF
Bachelor of Technology
In Chemical Engineering
By K.V.Srinivasan
& Deepak Kumar Dash
Department of Chemical Engineering
National Institute of Technology
Rourkela
2007

NATURAL GAS AS FEEDSTOCK FOR FERTILIZER
A THESIS SUBMITTED IN PARTIAL FULFILLMENT
OF THE REQUIREMENTS FOR THE DEGREE OF
Bachelor of Technology
In Chemical Engineering
By K.V.Srinivasan
& Deepak Kumar Dash
Under the guidance of Prof. Pradip Rath
Department of Chemical Engineering
National Institute of Technology
Rourkela
2007
National Institute of Technology
Rourkela
CERTIFICATE
This is to certify that the thesis entitled “Natural gas as feedstock for fertilizer’’
submitted by K.V.Srinivasan, Roll No: 10300040 and Deepak Kumar Dash, Roll No:
10400041D in the partial fulfillment of the requirement for the award of Bachelor of
Technology in Chemical Engineering, National Institute of Technology, Rourkela, is being
carried out under my supervision.
To the best of my knowledge the matter embodied in the thesis has not been submitted
to any other university/institute for the award of any degree or diploma.
Prof. Pradip Rath
Department of Chemical Engineering
National Institute of Technology
Date: Rourkela.
Acknowledgment
We avail this opportunity to extend our hearty indebtedness to our guide
Dr. Pradip Rath, Professor and Head, Department of Chemical Engineering, NIT Rourkela,
for his valuable guidance, constant encouragement and kind help at different stages for the
execution of this dissertation work.
We express our sincere gratitude to Dr. R.K.Singh, Professor, Department of
Chemical Engineering, NIT Rourkela, for providing us an opportunity to do this work.
We also express our gratitude to Dr.G.K.Roy, Professor, Department of Chemical
Engineering, NIT Rourkela, for helping us regarding the design of tubular reactor.
We also express our gratitude to all the faculty and staff members of Department of
Chemical Engineering for their help in completing this project.
Submitted by:
K.V.Srinivasan,
Roll No: 10300040,
Deepak Kumar Dash,
Roll No: 10400041D
Department of Chemical Engineering, National Institute of Technology,

CONTENTS
Sl. No Title Page
1 Introduction 1
2 Historical development
Purification of natural gas 2
Hydrogen production 3
Conversion of CO to CO2 4
Purification of hydrogen 4
Methanation 6
3 Mass balance
Determination of number of reforming stages 7
Basis 11
4 Energy balance 13 5 Process description 16
6 Design of PSA system for air separation
Nomenclature 21
Modeling the PSA process 22
Design procedure 25
Detailed design 37
7 Design of tubular reformer
Nomenclature 40
Design fundamentals 41
Design procedure 43
Design of tubes and shell 44
Design of head 46
8 Piping design and Instrumentation diagrams
Piping design 49
Instrumentation diagrams 51
11 Plant layout 54
10 Conclusion 55
11 References 56
ABSTRACT Separation of the hydrogen needed for the ammonia synthesis reaction, from
its source is difficult. Hydrogen production method is the main source of distinction
between the various ammonia production routes. Most of the improvements in the
technology regarding the ammonia synthesis were concerned with the hydrogen
production step. Hydrogen can be produced by steam reforming, partial oxidation and
water electrolysis. The bulk of the world ammonia production is based on steam
reforming. The major hydrogen sources are natural gas, naphtha and coal. In this project
different methods available for hydrogen separation from its source are analyzed and the
best possible way to produce synthesis gas (which will form ammonia) from natural gas
is found out. The number of reforming stages required for a plant capacity of 1500 tons
per day of ammonia production is found out. The mass balance and energy balance
calculations for the above said plant capacity is presented in this work. Then the
conventional carbon dioxide removal process and methanation process are replaced by
the advanced, economical pressure swing adsorption process. It was also found that two
stages of shift converters required for this plant capacity. The number of reforming stages
required is only one and nitrogen is obtained from oxygen pressure swing absorption
units. The oxygen separated is also used as a fuel with natural gas for reforming. The
carbon dioxide is separated in another PSA which can be used for the production of urea.
i

LIST OF FIGURES
FIGURE NO NAME PAGE
3.1 Methane steam reforming using sulfide nickel
catalyst on gamma alumina support
8
5.1 PSA process steps 19
6.1 Basic two bed PSA process 23
6.2 Effect of porosity on product purity and recovery 27
6.3 Effect of porosity on pressure drop 28
6.4 Effect of adsorption pressure on product purity 29
6.5 Effect of adsorption step time on product purity 30
6.6 Effect of tpres/tads on product purity and recovery 30
6.7 Effect of purge/feed on product purity and recovery 31
6.8 Effect of residence time and feed composition on
product purity
32
6.9 Effect of mass transfer coefficients on residence
time ratio
33
6.10 vacuum swing adsorption 36
6.11 System selection 38
7.1 Tubular reactor 47
7.2
9.1
10.1
Ellipsoidal head
Instrumentation diagram
Plant layout
48
53
54
ii

LIST OF TABLES
TABLE
NO:
NAME PAGE
NUMBER
3.1 Comparison of composition at reformer outlet for single
stage and two stage reforming
9
3.2 Composition of process streams (without recycle) 10
3.3 Composition of process streams (with recycle) 12
3.4 Molar flow rate of components in process streams 12
5.1 Comparison of Oxygen PSA and Cryogenic production 20
6.1. Comparison of PSA process with and without pressure
equalization step for air separation on CMS
35
6.2. Performance comparison of VSA cycle with ordinary
Skarstrom cycle
36
6.3 comparison of L/D ratio 39
7.1. Determination of length and number of tubes 45
7.2. Determination of average specific volume 46
9.1 Operating velocity for fluids 49
9.2 Inside diameter of pipes 49
9.3 Outside diameter of pipes 50
iii

1. INTRODUCTION In the ammonia synthesis, nitrogen is combined with hydrogen in a stoichiometric
ratio of 1:3 to give ammonia with no by-products. Ammonia itself is used as a fertilizer. About
85% of ammonia consumption is used for the manufacture of fertilizer. Air contains 79 %
(volume) of nitrogen. So, nitrogen needed for the reaction can be obtained from air. Now the
difficulty lies in separating the hydrogen needed for the reaction from its source. Hydrogen
production method is the main source of distinction between the various ammonia production
routes. Most of the improvements in the technology regarding the ammonia synthesis over the
past four decades were concerned with the hydrogen production step. Hydrogen can be produced
by steam reforming, partial oxidation and water electrolysis. The bulk of the world ammonia
production is based on steam reforming. The major hydrogen sources are natural gas, naphtha
and coal. Most of the steam reforming plants use natural gas as feed stock. Natural gas contains
fewer impurities, high hydrogen to carbon ratio and less percentage of higher hydrocarbons. So
natural gas is superior when compared with other feed stocks. The scope of this project is to
analyze different methods available for hydrogen separation from its source and to find an
economical way to produce synthesis gas (which will form ammonia) from natural gas. In this
various methods of synthesis gas production are discussed and the best way to produced
synthesis gas is found out. The detailed design of the some process equipments is also carried out
in this work. This includes the PSA system for air separation, tubular packed bed reactor for
methane steam reforming.

2. HISTORICAL DEVELOPMENT Priestly, first produced ammonia by heating “Sal ammoniac” (ammonium
chloride) with Lime in 1754.During 1850-1900, general development of physical chemistry with
new concepts of mass action and chemical equilibrium paved the way for ammonia synthesis. It
became clear that reaction of nitrogen and hydrogen to from ammonia is reversible. The
manufacture of ammonia by passing nitrogen and hydrogen, or gaseous mixture of nitrogen and
hydrogen over a catalytic substance at high temperature and removing, at a lower temperature, a
part or the whole, of the ammonia contained in gases leaving the catalytic substance, and
afterwards passing the gases from which ammonia has been removed over a catalytic substance,
the process being carried out on under pressure and nitrogen and hydrogen, or gases containing
them, being supplied in accordance with the quantity of ammonia removed from the gases. This
is called Haber’s process. In the 20th century, various research and development led to the
economical production of synthesis gas. The major steps involved in the production of synthesis
gas are
1. Purification of natural gas (desulphurization)
2. Hydrogen production (reforming or partial oxidation)
3. Conversion of CO to CO2 (shift conversion)
4. Purification of hydrogen (CO2 removal)
5. Methanation 2.1) PURIFICATION OF NATURAL GAS:
2.1.1) DESULFURISATION:
The main impurities in natural gas are few percentages of higher hydrocarbons,
sulfur compounds and negligible CO2.The sulfur compounds may be H2S, mercaptans or
thiophenic compounds. The sulfur compounds are poisonous to the catalyst used in successive
stages, therefore it has to be removed. The processes available for sulfur removal from feed stock
are
a) adsorption by activated carbon
b) Removal by chemical reaction with ZnO
c) Hydrogenation of organic sulfur compounds and then removal by using ZnO
d) Molecular sieves
2

Adsorption by activated carbon, removal by chemical reaction with ZnO are
efficient in removing compounds like mercaptans and H2S but in order to remove organic sulfur
compounds, the sulfur compounds must be first converted to H2S and then removed by using
ZnO. Therefore hydrogenation must be carried out.
2.1.2) HYDROGENATION:
Hydrogenation is carried out to convert organic sulfur
compounds to H2S and then absorbed by ZnO. The catalyst used for hydrogenation is cobalt
molybdate. Cobalt molybdate is a mixture of cobalt oxide and molybdenum oxide supported on
alumina. The reaction temperature is maintained below 4000C in order to minimize cracking of
hydrocarbon feedstock.
The reactions involved are
RSH + H2 RH + H2S
ZnO + H2S ZnS +H2O
After the hydrogenation the H2S is absorbed using zinc oxide as absorbent. Iron
oxide can also be used as absorbent because of its low cost and its potential for regeneration. The
partial pressure of H2S in the gas stream emerging from the iron oxide bed is affected by
operating conditions. Therefore control of conditions is difficult. The difference in these two
absorbents is related to the effect of water vapor on sulfur adsorption equilibrium. In case of ZnO
the equilibrium partial pressure of H2S remains very low even for wide range of water
concentration. The reaction is kinetically controllable, but this is not as in case of iron oxide.
Further iron oxide is associated with relative ease of reduction of sulfides, when compared with
ZnO. So ZnO is preferred
2.2) HYDROGEN PRODUCTION:
Reforming and partial oxidation are the processes used for hydrogen production
from the natural gas. In reforming reaction between steam and natural gas is carried out under
pressure to form carbon oxides and hydrogen. These reactions are endothermic. In partial
oxidation process oxygen separated from air is reacted with natural gas to form carbon oxides
and hydrogen. These reactions are exothermic.
REACTIONS:
A) REFORMING:
CH4 + H2O CO + 3H2 ∆H= 206 KJ/mol
CH4 +2H2O CO2 + 4H2 ∆H= 165 KJ/mol
3

B) PARTIAL OXIDATION:
CH4 +1/2 O2 CO + 2 H2 ∆H= -332 KJ/mol
CH4 + 2O2 CO2 +2H2O ∆H= -802 KJ/mol
From the reactions, it becomes clear that reforming is advantageous
than partial oxidation because of the production of more hydrogen. Since reforming is
endothermic, energy has to be supplied. In most of the cases, natural gas is used as an energy
source. To reduce the heat required, reforming is done in two stages. Around 80% of natural gas
is reformed in one stage and then a calculated quantity of air is sent to produce some energy by
methane oxygen reactions. By this nitrogen required for ammonia synthesis is also added. The
exit gas from reformer contains hydrogen, carbon oxides steam and nitrogen. The catalyst used
in reforming is nickel supported on alumina.
2.3) SHIFT CONVERSION:
Carbon monoxide is poisonous to the ammonia synthesis catalyst.
So it has to be removed. But instead of removing carbon monoxide it is converted to carbon
dioxide and then removed. This is known as shift conversion. This not only converts the carbon
monoxide but also produces hydrogen. This is exothermic reaction.
CO+H2O CO2 + H2 ∆H = -41,169 KJ/Kmol
The shift conversion reaction is independent of pressure. Shift
conversion can be carried out in single stage or in number of stages. If the shift conversion is
carried out at high temperature, it is called high temperature shift (HTS) conversion. If it is at
low temperature then it is called low temperature shift (LTS) conversion. The catalysts used for
HTS conversion and LTS conversion are chromia promoted iron oxide and ZnO, Al2O3, CuO
mixture supported on alumina. Since these reactions are exothermic, heat produced must be
removed after the reaction. The carbon monoxide conversion is more when employed in multiple
stages rather than a single stage. Isothermal shift conversion is one, where the heat produced due
to the reactions is removed within the reactor by passing water through the tubes.
2.4) HYDROGEN PURIFICATION:
The gas coming out of the shift converters contain hydrogen,
carbon dioxide, steam, nitrogen and some carbon monoxide. Carbon dioxide and carbon
monoxide should be removed before sending the gas to the ammonia synthesis reactor. Carbon
dioxide can be removed by
4

a) BENFIELD PROCESS:
This process is also called as hot carbonate process. This process is
quite effective in bringing down CO2 concentration to 2%. Stage wise scrubbing is required to
reduce CO2 concentration further. The solution contains activators added to potassium carbonate
to increase rate of absorption of CO2.
b) CATACARB PROCESS:
This is a catalytic hot potassium salt process in which a catalyst or a
promoter is used. The process utilizes an aqueous potassium salt solution containing both
catalyst and a corrosion inhibitor. The catalyst increases the reaction rate of both CO2 absorption
and regeneration steps.
c) GIAMMARCO-VETROCOKE PROCESS:
It is based on use of an activated potassium carbonate or sodium
carbonate solution. Activators such as boric acid, glycine and many other amino acids increase
the absorption efficiency. Boric acid is least effective but shows resistance to thermal
decomposition. Glycine is cheap and it can be used in impure state. The activating power of
glycine is increased by adding boric acid.
d) AMINE WASH:
Amines are organic bases defined as derivatives of ammonia in which
one or more hydrogen atom is replaced by organic group. Mono ethanol amine is the more
commonly used one.
2(HOCH2CH2N2) + CO2 + H2O (HOCH2CH2NH3)2CO3
HOCH2CH2NH2 +CO2+ H2O HOCH2CH2NH+3HCO-
3
2(HOCH2CH2N2) + CO2 CH2NHCOONH3CH2 e) PRESSURE SWING ADSORPTION:
Pressure swing adsorption is a gas separation process in which the
adsorbent is regenerated by rapidly reducing the partial pressure of adsorbed component, either
by lowering the total pressure or by using a purge gas. In the original PSA process two steps i.e.
adsorption and regeneration are carried out in two absorbent beds operated in tandem, enabling
the processing of continuous feed. In the modern PSA process three or more beds are used to
synchronize and accommodate steps in additional such as co current depressurization and
pressure equalization. Other variations include the “vacuum swing adsorption” process in which
the pressure is varied between atmospheric and mechanical vacuum pump.
5

2.5) METHANATION:
CO + 3H2 CH4 + H2 O ∆H= -206 KJ/mol
CO2+ 4H2 CH4 + 2 H2O ∆H= -165 KJ/mol
Methanation is the term used to describe the reaction
between carbon oxides and hydrogen to form methane and water. These reactions can be used to
remove carbons oxides from hydrogen or any synthesis gas, where residual methane is tolerable
in the downstream processes. The catalyst which is active for the methanation reaction is nickel.
Iron catalysts can also be use but they have excessive carbon deposition leading to blockage of
pores. Nickel has good selectivity and there is no carbon deposition or hydrocarbon formation.
Catalysts are supported on alumina, kaolin or calcium aluminate cement with magnesia or
chromia as promoter.
The first four processes for CO2 removal are very old one and
entire removal of carbon dioxide is not possible. Carbon dioxide concentration of 0.1 % will be
there. But concentrations should be around 5-10 ppm. So Methanation is carried out. Here CH4
formed is inert in ammonia synthesis reaction. But if CO, CO2 concentrations are high more H2
is required. Methanation reactions are exothermic. So the heat formed must be removed. Even
very low concentrations (50 ppm) of CO and CO2 are poisonous to ammonia synthesis catalyst.
But, when pressure swing adsorption is done pure hydrogen is obtained, so that no impurities
will be there. So methanation is not required when pressure swing adsorption is carried out for
CO2 removal.
6
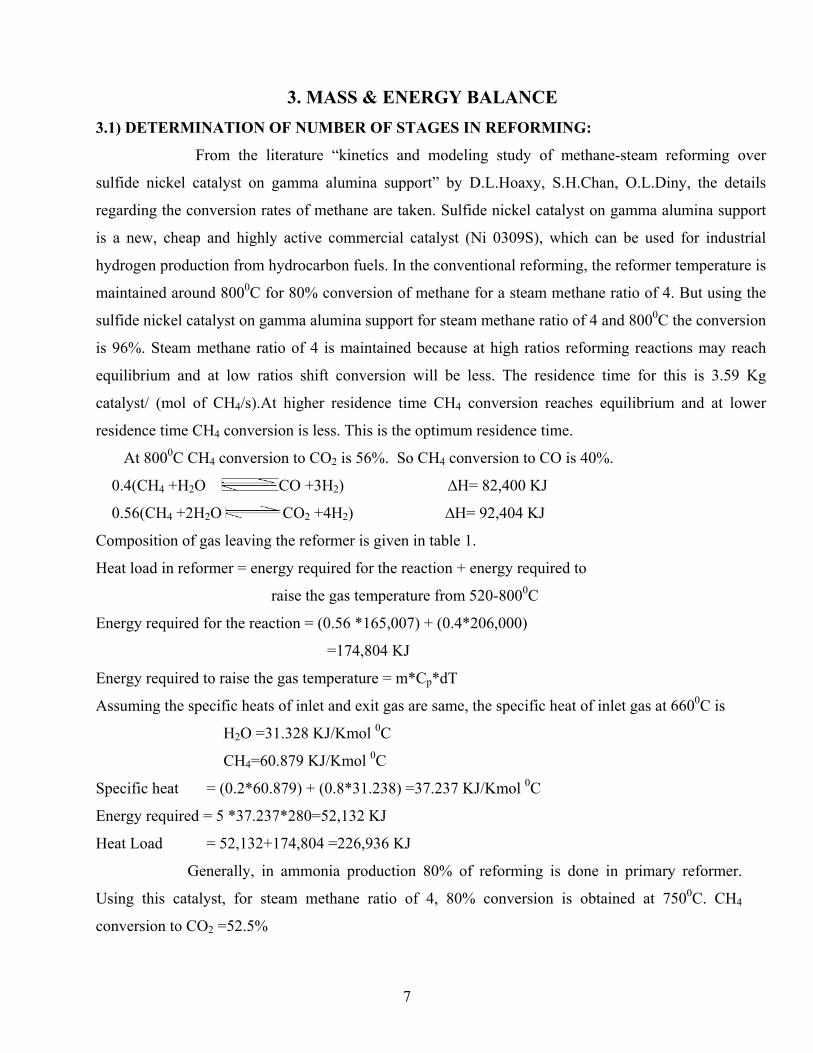
3. MASS & ENERGY BALANCE 3.1) DETERMINATION OF NUMBER OF STAGES IN REFORMING:
From the literature “kinetics and modeling study of methane-steam reforming over
sulfide nickel catalyst on gamma alumina support” by D.L.Hoaxy, S.H.Chan, O.L.Diny, the details
regarding the conversion rates of methane are taken. Sulfide nickel catalyst on gamma alumina support
is a new, cheap and highly active commercial catalyst (Ni 0309S), which can be used for industrial
hydrogen production from hydrocarbon fuels. In the conventional reforming, the reformer temperature is
maintained around 8000C for 80% conversion of methane for a steam methane ratio of 4. But using the
sulfide nickel catalyst on gamma alumina support for steam methane ratio of 4 and 8000C the conversion
is 96%. Steam methane ratio of 4 is maintained because at high ratios reforming reactions may reach
equilibrium and at low ratios shift conversion will be less. The residence time for this is 3.59 Kg
catalyst/ (mol of CH4/s).At higher residence time CH4 conversion reaches equilibrium and at lower
residence time CH4 conversion is less. This is the optimum residence time.
At 8000C CH4 conversion to CO2 is 56%. So CH4 conversion to CO is 40%.
0.4(CH4 +H2O CO +3H2) ∆H= 82,400 KJ
0.56(CH4 +2H2O CO2 +4H2) ∆H= 92,404 KJ Composition of gas leaving the reformer is given in table 1.
Heat load in reformer = energy required for the reaction + energy required to
raise the gas temperature from 520-8000C
Energy required for the reaction = (0.56 *165,007) + (0.4*206,000)
=174,804 KJ
Energy required to raise the gas temperature = m*Cp*dT
Assuming the specific heats of inlet and exit gas are same, the specific heat of inlet gas at 6600C is
H2O =31.328 KJ/Kmol 0C
CH4=60.879 KJ/Kmol 0C
Specific heat = (0.2*60.879) + (0.8*31.238) =37.237 KJ/Kmol 0C
Energy required = 5 *37.237*280=52,132 KJ
Heat Load = 52,132+174,804 =226,936 KJ
Generally, in ammonia production 80% of reforming is done in primary reformer.
Using this catalyst, for steam methane ratio of 4, 80% conversion is obtained at 7500C. CH4
conversion to CO2 =52.5%
7

Fig 3.1 Methane steam reforming using sulfide nickel catalyst on gamma alumina support
8

Table: 3.1 Comparison of composition at reformer outlet for Single Stage and Two Stage
reforming
Component Single stage reforming
Kmoles
two stage reforming
Kmoles
H2 3.44 2.925
H2O 2.48 2.675
CO2 0.56 0.525
CO 0.4 0.275
CH4 0.04 0.2
0.275(CH4 +H2O CO +3H2) ∆H= 56,650 KJ
0.525(CH4 +2H2O CO2 +4H2) ∆H= 86,629 KJ
Heat required for the reaction= (0.275*206,000) + (0.525*165,007) =143,279 KJ
Heat required to raise the temperature = 5*36.87*230= 42,408 KJ
Heat load = 185,687 KJ
In secondary reformer air is added. Assuming that N2 is inert, the reactions are
1) CH4 +1.5 O2 CO + 2 H2O ∆H= -519 KJ/mol
2) CO+0.5 H2 CO2 ∆H= -283 KJ/mol
3) H2 + 0.5 O2 H2O ∆H= -242KJ/mol
4) CH4 +H2O CO +3H2 ∆H= 206KJ/mol
5) CH4 +2H2O CO2 +4H2 ∆H= 165 KJ/mol
In the reactions 1, 2 and 3 CH4, C0, H2 are lost. One mole CH4 is approximately
equivalent to 4 moles of H2. One mole of CO is equivalent to one mole of H2.In the process of
adding N2, H2 is lost. So reforming can be done in single stage.
Increase in heat load in reformer =226,936-185,687 = 41,149 KJ
= 21.94% by using sulfide nickel catalyst.
If this catalyst is used in an operating plant with conventional reforming, then
increase in heat load = 226,936-(185,687+ (5*36.87*50))
=32,031 KJ
5*36.87*50 is added to reformer heat load because in conventional reformers
temperature is 8000C. Rise in temperature is 50 0c more than what that has been calculated for
sulfide nickel catalyst.
Increase in heat load =16.43%
9

So, single stage reforming can be done, providing suitable material to withstand
increase in heat load, thereby increasing hydrogen production and eliminating secondary
reformer. But nitrogen has to be separated from air by PSA for ammonia synthesis.
The composition of gases entering the high temperature shift conversion reactors
are given in table 1.The gases leave the shift converter at 4300C. Assuming equilibrium is
reached in the shift converter,
Kp at 430 0C =14
Kp = (PH2*PCO2)/ (PCO*PH2O)
PH2, PCO2, PCO, PCO are partial pressure of H2, CO2, CO, H2O respectively.
If “X” moles of CO is converted then X=0.295 moles.
The composition of gases entering the Low Temperature Shift converter is given in table
2.Assuming equilibrium is reached in the LTS converter, Kp at 1900C is 280.
If”Y” moles of CO is converted then Y=0.0987 moles.
Table: 3.2. Composition of process streams
Comp HTS Outlet
Mole%
LTS Outlet
Mole%
Condenser Outlet
Mole% (A)
Recycle
Mole%
(B)
PSA Inlet
Mole%
(A-B)
H2 3.735(53.97%) 3.8337(55%) 3.8337(79%) 0.0853 3.7484
H2O 2.185(31.58%) 2.0863(30.14%) nil Nil Nil
CO 0.105(1.51%) 0.0063(0.09%) 0.0063(0.13%) 0.0024 0.0039
CO2 0.855(12.35%) 0.9537(13.78%) 0.9537(19.73%) 0.021 0.9327
CH4 0.04(0.558%) 0.04(0.558%) 0.04(0.827%) 0.0008 0.0392
The composition of gases leaving the LTS converter is given in table 2. This goes to the
condenser where steam is condensed and the condensed steam is stripped off in the condensate
stripper.2% by volume of stripper outlet gas is recycled to the hydrogenator. The rest of the gas is sent to
the PSA unit for hydrogen separation. The compositions given in table 2 are found out considering only
methane. But when feed is natural gas the compositions must be found out.
Natural gas composition:
Methane =93.3% = 1mol
Ethane =3.3% =0.035 mol
Propane =0.9% =0.0096 mol
Nitrogen =2.5% =0.0027mol
10

For 1 mol of methane (1.072 moles of natural gas)
0.4(CH4 + H2O CO + 3H2)
0.56(CH4 +2H2O CO2 +4H2)
0.035(C2H6 + 2H2O 2CO+5H2)
0.0096(C3H8 +3H2O 3CO+7H2)
Assuming that there is no ammonia formation in reformer (nitrogen is
inert),recycle gases are inert and all ethane and propane reacts in the reformer, the composition
of gases leaving the reformer is the sum of change in composition due to reforming in the
reformer and the recycle gas. Since sulfur present is in the order of 50ppm. Hydrogen reacted is
50*2/1000000. Therefore
Unreacted H2 = H2 in recycle – H2 in consumed in hydrogenator
Assuming that the rest of the gases do not take part in any of the reactions in the reformer,
the composition must be found out. Taking the recycle gas composition same as that of recycle
gas composition considering methane only, the composition of gas leaving the reformer are
given in table.3. Following a similar approach done by considering methane alone i.e.
equilibrium is attained in the shift reactors, the moles of CO converted in HTS and LTS are
0.3634 and 0.1291. Then the composition of gases coming out of the stripper and recycle are
found out. The compositions are tabulated in table 4.The recycle composition for natural gas and
methane is almost same. Therefore, one trial is enough. The composition of recycle gas and PSA
inlet gas is same as that of the stripper outlet.
3.2) BASIS:
1500 Tons per day of ammonia
N2 + 3H2 2 NH3 ∆H= -82,400 KJ/Kmol
1500 tons per day of NH3 = (1500/17) Kmoles per day of NH3 = 88,235 Kmoles/day
Hydrogen required = 132,353 Kmoles/day = hydrogen from PSA unit
Assuming 99% recovery of 99.99% pure hydrogen,
H2 inlet to PSA = 132,353/ (0.99*0.9999)
= 133,703 Kmoles/day =1.547 Kmoles/s
The composition of each and every stream is known. At the PSA inlet percentage of
H2 is known. By back calculations the amount of feed to each of the reactors is found out. The
amount of gases passing through each section is given in Table 5. Fig 1 shows the flow of gases,
reaction conditions, heat load is each reactor. H2 percentage in inlet to the PSA is 78.73. So
11

78.73% is 1.547 Kmoles/s. From this total inlet to PSA is found out. CH4, N2 which are inert
after the reformer, are known in the PSA inlet. The percentage of CH4, N2 are known in the other
streams. So the amount of all the other streams is found out.
3.7656moles of H 2 is obtained from 1 mole of CH4 (in the reformer). Therefore
1.395Kmol/s of H2 is obtained from 0.370Kmol/s of CH4
Natural gas required = 0.37/0.933 = 0.3965Kmol/s
TABLE: 3.3 Composition of process streams
comp Reformer
outlet
HTS
outlet
LTS
outlet
Stripper
outlet
PSA
outlet
PSA(CO2)
outlet
Flue
Gas
H2 51.6% 56.8% 58.365 78.73% 3.62% 36.2% 3.5%
H2O 32.65% 27.65% 27.87% _ _ _ 59.9%
CO 6.86% 1.88% 0.119% 0.16% .715% 7.15% 0.67%
CO2 7.96% 12.942% 14.71% 19.85% 90% _ 29.9%
CH4 0.559% 0.559% 0.559% 0.74 3.35% 33.55 _
N2 0.337% 0.337% 0.337% 0.499% 2.26% 22.6% 2.91%
O2 _ _ _ _ _ _ 2.99%
Table: 3.4: Molar flow rate of components in process streams
Comp Feed Reformer
Outlet
HTS
Outlet
LTS
Outlet
Condenser
outlet
Recycle PSA
inlet
PSA
Outlet
H2 - 1.395 1.5299 1.579 1.579 0.0316 1.5475 0.0151
H2O 0.8828 0.7476 0.699 - - - -
CO - 0.1855 0.0508 0.0032 0.0032 0.00006 0.0031 0.0031
CO2 - 0.2158 0.3499 0.3981 0.3981 0.008 0.3901 0.3900
N2 0.01 0.01 0.01 0.01 0.01 0.0002 0.0098 0.0097
CH4 0.37 0.0148 0.0148 0.0148 0.0148 0.0003 0.0145 0.0144
C2H6 0.013 - - - - - - -
C3H8 0.0035 - - - - - - -
All compositions are in Kmoles/s
12

4. ENERGY BALANCE 4.1. OVER LTS CONVERTER
CO converted=0.4764 Kmoles/s
(∆H) reaction =41169*0.4764 = 1,961.29kg/s
Heat added to the stream = m* Cp *dT
dT = T0-Ti , T0=1900C
Cp = Cp at 1800C (assuming 200C rise)
2.704*31.536*(190-Ti) = 1961.29
Ti=1670C. So rise in temperature is 230C.
4.2. OVER HTS CONVERTER
CO converted =0.1347 Kmoles/s
(∆H) reaction =0.1347*41169 =5,545.46 KJ/s
2.704* Cp *(430-Ti) = 5,545.46 KJ/s
Cp = Cp at 1000C (assuming 600C rise)
2.704*30.919*(430-Ti) = 5,545.6 KJ/s
Ti=363.60C.
4.3. HEAT AVAILABLE AT HTS OUTLET
m * Cp* dT =2.704*Cp* (430-167)
Cp is evaluated at 2900C
=2.704*33.46*263 = 23,796 KJ/s
4.4. HEAT AVAILABLE AT REFORMER OUTLET
m * Cp* dT =2.704 * Cp * (800-363)
Cp is evaluated at 5820C
=2.704*34.07*437 = 40,259 KJ/s
4.5. HEAT REQUIRED FOR PREHEATING NATURAL GAS
m * Cp* dT =0.3945* Cp *(390-30) Cp is evaluated at 2100C
=0.3945*32.47*360 = 4,162KJ/s
4.6. HEAT REQUIRED FOR PREHEATING NATURAL GAS AND STEAM
m * Cp* dT =1.9166* Cp *(520-380)
Cp is evaluated at 4500C
=1.9166*37.8*140 =10,143KJ/s
13

4.7. HEAT BALANCE OVER REFORMER
802301(CH4) fuel= (∆H) reaction + m* Cp *dT
(∆H) reaction= (0.3552*206,172) + (0.013*347,328) + (0.00357*497,797) =79,524 KJ
m* Cp *dT =33.77*2.925*280 =27,658 KJ
802301(CH4) fuel=79524+27,058
(CH4) fuel=0.1536Kmol/s
(CH4) recycle= (0.4332)*0.0335 = 0.0145Kmol/s
(CH4) required=0.1191Kmol/s =1.9056Kg/s
Natural gas required =1.9056 Kg.
Because, for 3.3% C2H4, 0.9% C3H8 energy change will be in order of 103
(CH4) fuel= (Natural gas) fuel
Oxygen fed to reformer=0.01336*2.1=0.2806Kmol/s
Flue gas= (17.7-(0.9*0.4332*44)) + (0.2806*32) + (1.9056) =11.428Kg/s
4.8. HEAT LOAD IN CONDENSER AFTER LTS
Q=m*Cp1*dT+ λ +m*Cp2*dT
2.704* Cp1 *(190-100) +0.699*λ + 2.704* Cp2*(100-80)
Cp1 = Cp at 1450C=32.01 KJ/Kmol
Cp2 = Cp at 900C=31.83KJ/Kmol
λ=2256.2 KJ/Kg0K ; Q=11,277KJ/s
In the pressure swing adsorption, feed enters at 800C and the temperature drop will
depend on height of column so heat changes can be calculated only after design. Temperature
drop is very less. Feed is admitted at ambient temperature. In hydrogenation section the sulfur
levels are in ppm. Energy changes will be less. Temperature drop will be less. A temperature
drop of 100C over hydrogenator and ZnS absorber.
4.9. HEAT AVAILABLE FROM FLUE GAS
Q=m* Cp *dT+ X*λ
X=moles of steam in flue gas
Flue gas composition:
H2 =0.0157(3.5%)
N2 =0.013(2.91%)
O2 =0.01336(2.99%)
14

H2O =0.026724(59.9%)
CO2 =0.1336((29.9%)
CO =0.0039(0.67%)
m=0.44586 Kmol/s
Cp = Cp at 5250C
Q=0.44589* Cp * (1000-50) + (0.026724*2526.2)
=0.4459*37.89*950*603.58=16,714KJ/s
For preheating natural gas, steam mixture heat required is 14,733KJ/s
Heat available from flue gas is 16,714 KJ/s
Excess heat with the flue gas =16,714-14,755=1,959 KJ/s
This heat (excess) can be used for heating water to certain temperature.
So that it can be processed for steam production.
4.10. EMPIRICAL RELATIONS TO FIND OUT SPECIFIC HEAT OF GASES:
CO2 Cp=10.34+0.00274T-195500T-2 cal/gmol 0C
CO Cp =6.6+0.0012T cal/gmol 0C
H2O Cp =8.22+.00015T-0.00000134T2 cal/gmol 0C
H2 Cp =6.62+0.0081T cal/gmol 0C
N2 Cp =6.5+0.001T cal/gmol 0C
CH4 Cp =5.34+0.0115T cal/gmol 0C
1 cal/gmol 0C = 4.187 KJ/Kgmol0C
15
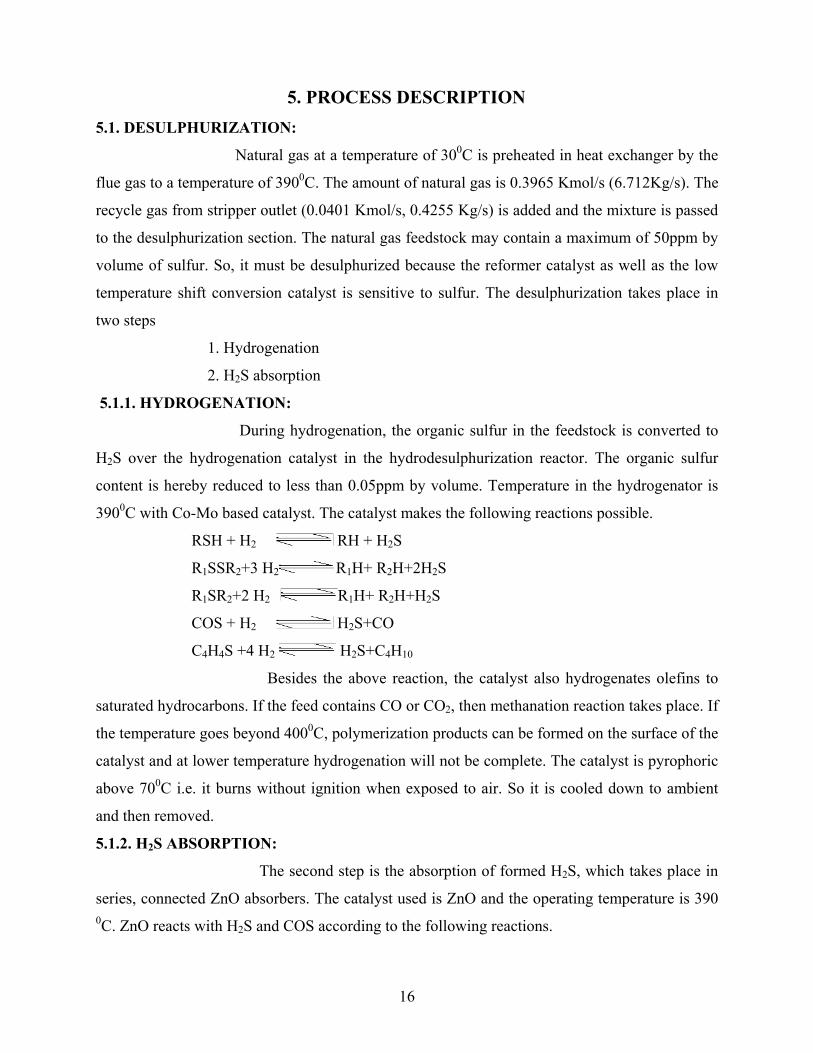
5. PROCESS DESCRIPTION 5.1. DESULPHURIZATION:
Natural gas at a temperature of 300C is preheated in heat exchanger by the
flue gas to a temperature of 3900C. The amount of natural gas is 0.3965 Kmol/s (6.712Kg/s). The
recycle gas from stripper outlet (0.0401 Kmol/s, 0.4255 Kg/s) is added and the mixture is passed
to the desulphurization section. The natural gas feedstock may contain a maximum of 50ppm by
volume of sulfur. So, it must be desulphurized because the reformer catalyst as well as the low
temperature shift conversion catalyst is sensitive to sulfur. The desulphurization takes place in
two steps
1. Hydrogenation
2. H2S absorption
5.1.1. HYDROGENATION:
During hydrogenation, the organic sulfur in the feedstock is converted to
H2S over the hydrogenation catalyst in the hydrodesulphurization reactor. The organic sulfur
content is hereby reduced to less than 0.05ppm by volume. Temperature in the hydrogenator is
3900C with Co-Mo based catalyst. The catalyst makes the following reactions possible.
RSH + H2 RH + H2S
R1SSR2+3 H2 R1H+ R2H+2H2S
R1SR2+2 H2 R1H+ R2H+H2S
COS + H2 H2S+CO
C4H4S +4 H2 H2S+C4H10
Besides the above reaction, the catalyst also hydrogenates olefins to
saturated hydrocarbons. If the feed contains CO or CO2, then methanation reaction takes place. If
the temperature goes beyond 4000C, polymerization products can be formed on the surface of the
catalyst and at lower temperature hydrogenation will not be complete. The catalyst is pyrophoric
above 700C i.e. it burns without ignition when exposed to air. So it is cooled down to ambient
and then removed.
5.1.2. H2S ABSORPTION:
The second step is the absorption of formed H2S, which takes place in
series, connected ZnO absorbers. The catalyst used is ZnO and the operating temperature is 390 0C. ZnO reacts with H2S and COS according to the following reactions.
16

H2S+ZnO ZnS +H2O
COS+ ZnO ZnS + CO2
To some extent ZnO will also remove organic sulfur. ZnO is not pyrophoric.
The desulphurized natural gas is mixed with process steam before the
preheating. Steam (1.48Kmol/s, 26.63 Kg/s) at 3850C, 40Kg/cm2 is mixed with the
desulphurized feed and then preheated in a heat exchanger using flue gas to a temperature of
5200C. Then it is sent to the reformer.
5.2) REFORMING:
The desulphurized natural gas (1.9166 Kmol/s, 33.77kg/s) is
converted into raw ammonia synthesis gas by catalytic reforming of hydrocarbon mixture with
steam. The reformer operates at 8000C, 35 Kg/cm2. The following reactions take place in the
reformer.
CH4 + H2O CO + 3H2 ∆H=206 KJ/mol
CH4 +2H2O CO2 + 4H2 ∆H=165 KJ/mol
CO + H2O CO2 +H2 ∆H=-41 KJ/mol
All the reforming reactions are endothermic. The heat required for the reactions is
produced by the combustion of natural gas (0.1191Kmol/s, 1.9056Kg/s) and recycle gas (0.0433
Kmol/s, 0.545 Kg/s) with oxygen. The flue gas leaves the reformer at 10000C. The catalyst used
in the reformer is the sulfide nickel catalyst on gamma alumina support. Since steam methane
ratio is 4, the conversion is 96%. The exit gas leaves at 8000C.
5.3) CO CONVERSION:
The process gas leaving the reformer enters the CO conversion
section. Here CO is converted to CO2 and H2. The heat evolved is primarily used for steam
production and boiler feed water preheat. The shift reaction is carried out in two stages.
5.3.1) HIGH TEMPERATURE SHIFT:
The gas from the reformer which is at 8000C is first cooled to
3630C by using the heat removed for steam production. Then it comes to the high temperature
shift reactor which operates at 32 Kg/cm2. The outlet temperature is 4300C. The catalyst used in
the high temperature shift conversion reactor is chromium oxide promoted iron oxide. The
catalyst is pyrophoric. The exit gas (2.704 Kmol/s, 33.77kg/s) leaves at 4300C.
17

5.3.2) LOW TEMPERATURE SHIFT:
The exit gas from high temperature shift conversion reactor is cooled
to 1670C in a heat exchanger using boiler feed water. Then it enters the low temperature shift
reactor which operates at 31 Kg/cm2. The catalyst used for the low temperature shift conversion
is Cu,Zn,Al based in the range of 170-250 0C.The optimum inlet temperature of both the CO
converters depends on catalyst activity. So temperature of the reactor increases with catalyst age.
The temperature rise depends on steam to dry gas ratio and conversion. The exit gas (2.704
Kmol/s,33.77Kg/s)leaves the reactor at 1900C.
The gas is the cooled to 8000C in a condenser to condense the steam
present in it. It is then sent to a stripper to strip off all the water (0.699 Kmol/s, 12.582 Kg/s).
Then 2% by volume of the gas is recycled to the hydrogenator. Then it is sent to the PSA unit for
hydrogen separation.
5.4) CO2 REMOVAL BY PRESSURE SWING ADSORPTION:
This process replaces the conventional CO2 removal by carbamate
process and methanation. From this process pure hydrogen is obtained. Pressure swing
adsorption process uses molecular sieves as adsorbents in series of vessels operated in a
staggered cyclic mode changing between an adsorption phase and various stages of regeneration.
The regeneration of loaded adsorbent is achieved by stepwise depressurization and by using the
gas from this operation to flush other adsorbers at a different pressure level. High purity
hydrogen is obtained depending on the number of adsorbers used.
a) Adsorption:
The feed gas is introduced at high adsorption pressure (8 Kg/cm2).
Except H2 all the other impurities are adsorbed and hydrogen is withdrawn as a product. When
the adsorber reaches its capacity feed is switched to fresh adsorber.
b) Co current depressurization:
To recover the hydrogen trapped in voids, the adsorber is
depressurized from product side. This H2 is used to repressurize the adsorbers.
c) Counter current depressurization:
The saturated adsorbers are then regenerated in series of steps.
The bed has impurities at the top. So it is partly regenerated towards feed end and impurities are
rejected to PSA off gas.
18

d) Purge at low pressure:
The adsorbent is then purged with H2 purge to regenerate the bed.
e) Repressurization:
The adsorber is then repressurized with H2 prior to being returned to
the feed step. The H2 for repressurization is provided from the co current repressurization and
with slip stream from product gas. Then the cycle is repeated.
The hydrogen (1.538 Kmol/s, 3.0636 Kg/s) separated from this PSA unit is mixed
with nitrogen (0.5126Kmol/s, 14.3546 Kg/s) from the oxygen PSA unit. The impurities (0.4332
Kmol/s, 17.7 Kg/s) containing CO2 is sent to other PSA unit for removal of CO2. The same
procedure is followed in this PSA unit. Here CO2 (0.3899Kmol/s, 17.15 Kg/s) is separated. The
PSA off gas (0.0433Kmol/s, 0.545 Kg/s) is then sent as a fuel to the primary reformer.
Fig 5.1 PSA process steps
5.5) OXYGEN SEPARATION BY PSA:
Oxygen separation by PSA is comprised of a two-stage concentration
process using CMS for the first stage and zeolite for the second. In the first stage, Argon a non
adsorbing component passes onto the CMS bed together with N2 and a few O2, and a mixture gas
of O2 and N2 that is adsorbed onto CMS is taken out from CMS bed. This mixed gas is sent to
the zeolite bed of the second stage adsorption column. N2 is removed by selective adsorption,
and high purity O2 remains. It is also possible to use zeolite in the first stage and CMS in the
second. The function of each adsorbent in this arrangement remains the same as the former
arrangement. In this case, the O2 recovery ratio is affected by the first stage O2 recovery ratio,
because O2/N2 selectivity of the zeolite is not good. Therefore this arrangement is not preferable.
19

Zeolites are aluminosilicate minerals with complex crystal structures
made up of interlocking rings of silicon, aluminium and oxygen ions. The chemical composition
of the zeolite used for oxygen separation is Na12[(AlO2)12((SiO2)12].27H2O. It is the zeolite’s
shape which provides most of the ability to selectively adsorb nitrogen. The zeolite used for
oxygen production is shaped like a die with holes drilled on each face to form an internal cage.
The corners of the die (providing the framework) are SiO2 and AlO2 units. Cations (either Na or
Ca) are exposed throughout the crystal lattice. The relative advantages of PSA over the
cryogenic oxygen production are
Table 5.1: Comparison of Oxygen PSA and Cryogenic production
Parameters PSA Cryogenic production
Temperature ambient low
Pressure maximum is 150 kPa Maximum is 13,000 kPa
Purity 95% near 100%
20

6. DESIGN OF PSA SYSTEM FOR AIR SEPARATION 6.1 NOMENCLATURE:
b Langmuir constant (atm−1)
C concentration in gas phase (mole per m3 of fluid)
D intracrystalline diffusivity (cm2 s−1)
dp diameter of particle (cm)
G purge/feed volume ratio
K Henry's Law constant
k overall mass transfer coefficient (s−1)
L total height of the column (m)
N total number of components
P pressure (atm)
Q molar flow rate
q adsorbed phase concentration (mole per m3 of solids)
q* equilibrium concentration of adsorbed phase (mole per m3 of solids)
qs Langmuir constant (mol cm−3)
R universal gas constant
T temperature (K)
t time (s)
v superficial velocity (m s−1)
W power (kW)
x adsorbed phase composition
y gas phase composition
z height of the bed (=0 at feed end, =L at product end) (m)
Greek symbols
α separation factor (dimension less)
ε bed Porosity
γ ratio of specific heats in gas phase
η mechanical efficiency
ρ density (kg m−3)
μ gas viscosity (Cp)
t residence time (s)
21

Subscripts
0 initial
1, 2 components
act actual
ads adsorption
blow blowdown step
f feed
g gas phase
H high pressure step
I component
L low pressure step
Min minimum value
pres pressurization step
prod product
purg purge step
s solid phase
6.2. MODELING THE PSA PROCESS
Fig.6.1 shows a typical PSA process. The process consists of two fixed-bed adsorbers
undergoing a cyclic operation of four steps such as adsorption, blowdown, purge, and
pressurization. By employing a sufficiently large number of beds and using more complicated
procedures in changing bed pressure, PSA may be carried out as a continuous process.
Additional steps such as co-current depressurization and pressure equalization have been added
to improve the purity and recovery of products as well as to make the process more energy-
efficient. A common feature of all PSA processes is that they are dynamic, i.e. they have no
steady state. After a sufficiently large number of cycles, each bed in the process reaches a cyclic
steady state (CSS), in which the conditions in the bed at the end of a cycle are approximately the
same as those at the beginning of the next cycle.
22

Fig. 6.1. Basic two-bed PSA process.
6.2.1.Assumptions:
1. The system is isothermal with negligible pressure drop through the adsorbent beds
2. The pressure change in the steps of pressurization and blowdown is so rapid that no
significant exchange between adsorbed phase and gas phase occurs. This is also called
the frozen solid assumption
3. Langmuir isotherm is valid for the system
4. The mass transfer rate is represented by a linear driving force expression
5. The ideal gas law is applicable
6. Plug flow is assumed, i.e. there is no axial or radial dispersion.
The component balance for species i in the bed is:
(1)
The last term in Eq. (1) is the mass transfer term between solid and gas, where qi is the
concentration of component i in the solid. For pressure changing steps (pressurization and
depressurization) this term is zero due to assumption (2). Summation of Eq. (1) for all the
components leads to the total mass balance equation. For constant pressure steps (adsorption and
purge) the total concentration of the fluid remains constant in the bed, thus the total mass balance
will be
(2)
while for pressure changing steps the total mass balance is
(3)
23

where it is assumed that the pressure drop in the bed is negligible. (1), (2) and (3) are applied for
the flow from z=0 to L. If the flow is reverse, the term ∂/∂z will be negative. The mass transfer
kinetics is modeled using the LDF approximation, based on the simplification of Fick's second
law of diffusion
(4)
Where qi* denotes the equilibrium concentration of component i. It is calculated using either
extended Langmuir isotherm,
(5a)
or using Henry's law,
qi*=KiCi (5b)
The following boundary conditions are considered for (1), (2) and (3). For the adsorption and
pressurization steps, the concentration of fluid at the inlet is assumed to be equal to the feed
condition, since axial and radial dispersion is neglected, namely
(6)
for the purge step it is
(7)
and for the depressurization step
(8)
The velocity boundary condition for the pressurization and adsorption step is
v|z=0=vf (9)
Where vf is the superficial velocity of feed at z=0. (Velocity need not be constant with time
during pressurization step unless specifically controlled. Normally, controllers are not used in
PSA. Above could be seen as a simplifying assumption.) For the purge step the velocity
boundary condition is
v|z=L=Gvf (10)
where G is the purge-to-feed velocity ratio. For the blowdown step the velocity boundary
condition is
24

v|z=L=0 (11)
In the cyclic operation, the initial condition in the bed is the condition at the end of the
previous step. For startup, either a clean bed or a saturated bed can be used. For a clean bed
the initial conditions are Ci(z,0)=0; qi(z,0)=0
(12)
and for a saturated bed they are
Ci(z,0)=C0; qi(z,0)=qi* (13)
6.3 DESIGN PROCEDURE:
When an adsorption for separating a gas mixture is determined, a logical sequence of decision
steps in design of a PSA process is as follows:
1. Selection of a proper adsorbent based on its equilibrium and kinetic characteristics.
2. Selection of particle size distribution and particle shape.
3. Selection of operating pressure levels for a PSA system.
4. PSA cycle configuration and duration of each individual steps.
5. PSA bed dimensions.
6. Inclusion/exclusion of pressure equalization step.
7. Vacuum swing adsorption (VSA) as an alternative.
6.3.1. Selection of adsorbent
Adsorption is achieved due to the interaction forces between the adsorbing molecules and the
adsorption surface. Different substances are adsorbed with different affinities. It is this
‘selectivity’ that provides the basis for adsorption separation processes. The task of adsorbent is
to provide the surface area required for selective adsorption of the preferentially adsorbed
species. A high selectivity is of user's interest. The separation factor (α) can be used as a measure
of selectivity. The separation factor of an absorbent is defined as
(14)
where x1 and y1 are, respectively, the mole fraction of component 1 in adsorbed phase and fluid
phase. The separation factor depends on the adsorption property, either adsorption kinetics or
adsorption equilibrium, or both. In an equilibrium controlled adsorption process, it is simply the
ratio of the equilibrium constants. For an extended Langmuir isotherm and a linear isotherm, this
separation factor is the ratio of Henry's constants
25

(15)
In a kinetically controlled adsorption, the selectivity depends on the difference of kinetic
parameters. The time-dependent concentration within the adsorbent particle depends on the
diffusivity of adsorbing molecules. For short time intervals this dependency can be approximated
by
(16)
Thus the separation factor for kinetically controlled process is calculated by
(17)
It is always useful that the separation factor is calculated by considering both equilibrium and
kinetic effect. Thus the separation factor can be defined as
a high separation factor is a key for a quick screening of various adsorbents.
6.3.2. Size distribution and shape of particles
In adsorption processes, the particle size distribution and particle shape decide the bed porosity.
Porosity affects bed performance in two ways. If other parameters remain constant, a lower
porosity leads to a higher bed pressure drop. On the other hand, a lower porosity means a higher
adsorbent content of the bed and hence a higher adsorption capacity. Moreover, a lower porosity
means less loss of the adsorbable component during the blowdown step and less requirement of
product gas for an effective extraction during the purge step. Both of these properties increase
the product recovery.
Bed porosity can be varied using different shapes and sizes of adsorbent particles and to some
extent packing techniques. Simulation studies are made using various values of bed porosity. The
effect of bed porosity on product purity is significant for both bulk separation and purification
processes. The effect on product recovery is significant only in bulk separation cases. As
porosity increases, both the product purity and recovery will decrease. It can be seen that as the
porosity increases, product recovery remains almost constant for purification processes (where
the highly adsorbing species is in very low concentration, e.g. air containing moisture).The effect
of bed porosity on product purity and recovery is given in fig6.2.
26

On the other hand, the porosity of a bed also affects the bed pressure drop. In a packed bed the
pressure drop can be calculated from Blake–Kozeny equation
(18)
From Eq. (21), as the porosity increases the bed pressure drop will decrease. Fig. 4 shows the
pressure drop versus the bed porosity. For a given system, Eq. (21) can be rewritten as
(19)
where φ is given as
(20)
Fig.6.2. Effect of porosity on product purity and recovery
There are two opposite effects of porosity: high product purity requires low porosity
and a low pressure drop is achieved with high porosity. From Fig. 4, it can be seen that for bed
porosity lower than 0.3, the pressure drop increases rapidly. Thus this should be the lower limit
of porosity (which can be achieved for most practical particle shapes and sizes). For bed porosity
higher than 0.5, the change in pressure drop becomes moderate, thus this can be considered as
the upper limit. Similarly, the effect of the porosity on the product purity, as shown in Fig. 6.3,
indicates that when bed porosity is higher than 0.5, the purity will decrease significantly, thus
confirming the use of 0.5 as the upper limit of the bed porosity.
27

Fig6.3 porosity vs. pressure drop
6.3.3. Selection of adsorption pressure
Selection of the adsorption pressure is based on the equilibrium relationship of the
system. An isotherm describes the equilibrium loading of a species, which is dependent on the
partial pressure of the species in an adsorption process. As the adsorption pressure increases, the
amount of fluid adsorbed on the adsorbent will increase. To determine the pressure level for
adsorption, one should keep in mind that the larger the difference between the capacities of the
competing adsorbates, the purer the raffinate will be. The selectivity of an extended Langmuir
isotherm and a linear isotherm is constant. These isotherms are, therefore, called ‘constant
selectivity isotherm’. For constant selectivity systems, if the pressure is increased, which causes
more adsorption of the highly adsorbed species, the product purity will be increased. The less
favorable species is also adsorbed more, but in comparison to the more favorable species it is
always less, as long as the more adsorbing species is present in significant quantities in the bulk
phase. Therefore, for such systems a higher pressure always leads to a purer product.
Besides this advantage of high pressure for constant selectivity systems, there is one
disadvantage too, that is energy loss. A higher pressure level leads to higher compression costs
and a higher loss of energy in the blowdown step. If an adiabatic compression is assumed, the
power requirement can be approximated as:
(21)
where PH and PL are high and low pressure levels, respectively, Q is the volumetric flow rate,
and T is the operating temperature. Simulation results of extended Langmuir and linear isotherms
are given in Fig. 6.4 for various adsorption pressure levels. It can be seen that as the pressure
increases, the product purity will be increased. At the same time the power required for
compression also rises. If a high purity product is desired, the adsorption pressure should be as
high as possible. The power requirement increases with the increase of the adsorption and the
28

desorption pressure ratio. Considering the trade-off between product quality and power
requirement, the adsorption pressure should be taken as the value at which the change of the
adsorbed phase concentration with pressure becomes moderate
Fig 6.4. Adsorption pressure Vs product purity
If the selectivity varies with the operating pressure, the adsorption pressure should be that
at which the selectivity is maximum. The effect of pressure for varying selectivity systems
6.3.4. Selection of adsorption time
In a PSA process, the duration of the adsorption step is determined by studying the
breakthrough curve. The term breakthrough curve refers to the response of the initially clean bed
to an influent with a constant composition. It can be seen by monitoring the concentration of the
effluent. Breakthrough occurs when the effluent concentration reaches a specific value. The
adsorbate concentration in the flow at any given point in a bed is a function of time, resulting
from the movement of concentration front in the bed. The breakthrough curve for a gas
containing a single adsorbate can be obtained by the solution of the mass balance equations for
both the bed and adsorbent particles, along with the equilibrium isotherm. The duration of the
adsorption step is the time period needed for breakthrough to occur. After this time the product
purity will decline, and before this time the full bed capacity will not be employed. Thus the
adsorption time should be near the breakthrough time. This time depends upon isotherm,
diffusivity and residence time of the feed in the bed.
From simulation studies, it can be observed that beyond a certain value of the adsorption
time, the change in product purity becomes insignificant. The product purity decreases as the
adsorption of less adsorbable species increases. Fig. 6.5 shows how the change in the adsorption
time affects the product purity. It can be seen that the time of the adsorption step should be
where the product purity is maximum. This is the time when breakthrough occurs.
29

Fig 6.5 adsorption step time vs. product purity
6.3.5. Effect of distribution of adsorption time
In a two-bed, four-step PSA system, adsorption takes place in both the pressurization and
adsorption steps. The apportion of the total adsorption time to these two steps affects the
performance of PSA. Fig.6.6a and 6.6b show the simulation results corresponding to different
time allocations to these two steps. it can be seen that as the ratio of the pressurization time and
the adsorption time increases, the product recovery will decrease, but its purity will increase.
With a higher time ratio, fewer products will be obtained. At the same time, higher time ratio
improves product quality. Moreover, it can be seen from the simulation results that the rate of the
decrease of product recovery is much greater than the rate of the increase of product purity.
Thus, the change in recovery is a dominating factor to determine the adsorption time apportion.
Having these two opposite effects and taking the fact that the recovery effect is more dominant,
the ratio of the pressurization time to the adsorption time should be low. The upper limit should
be 0.2, according to the simulation results.
Fig 6.6.variation of product purity and recovery with tpres/tads
30

6.3.6. Effect of purge-to-feed ratio
The purge step in PSA is a desorption step that regenerates adsorbents by desorbing the
adsorbed species. In a PSA process, saturated adsorbents are regenerated by lower pressure, thus
a low pressure purge step is required. Generally, from the product vessel with the raffinate at a
high pressure, a fraction of the product stream is withdrawn to purge the bed and expended to a
low pressure. The volume required in the purge step affects the product quality as well as its
recovery. As the purge volume increases, purging becomes more effective, providing a
regenerated bed with adsorbents of less loading and leading to increased product purity. In
principal, the bed should be fully regenerated with adsorbents completely unsaturated, thus more
purging is necessary. At the same time, since purging is done by utilizing the product, increase in
the purge volume decreases the product recovery. Generally, the purge volume specification for
PSA is given by the purge-to-feed volume ratio.
. The effect of this ratio on product purity and recovery is shown for two cases in Fig.6.7.
It can be seen that as this ratio increases, the product purity increases as well, but the recovery
decreases. The rate of the increase in purity is much slower than the rate of the decrease in
recovery. From these results, one may infer that the purge-to-feed ratio should be neither too low
nor too high. A guideline regarding this ratio from the simulation results is that it should be
between 1.0 and 2.0, if purging is done by product. These are volumetric ratios. It should be
noted that, although the volume of purge used is more than the volume of feed, the mass of purge
is less than the mass of feed or product, since the pressure of purging is much lower than the feed
pressure.
Fig 6.7. Effect of Purge/feed on product purity and recovery
6.3.7. Residence time determination
The residence time of species in a bed is the ratio of the bed holdup to the volumetric
feed rate. Sufficient residence time should be provided, so that the desired product purity can be
achieved. For species with lower diffusivities, greater residence time is required. The choice of
31
residence time is critical in adsorption, since if the residence time is too short, there will be no
significant adsorption. Increase in residence time can be made by reducing the feed rate or by
increasing the bed volume. Since the feed rate is decided by the desired capacity of the unit,
required residence can be achieved by changing the bed volume. However, in an existing unit,
residence time can be altered only by adjusting feed rate or feed pressure or both.
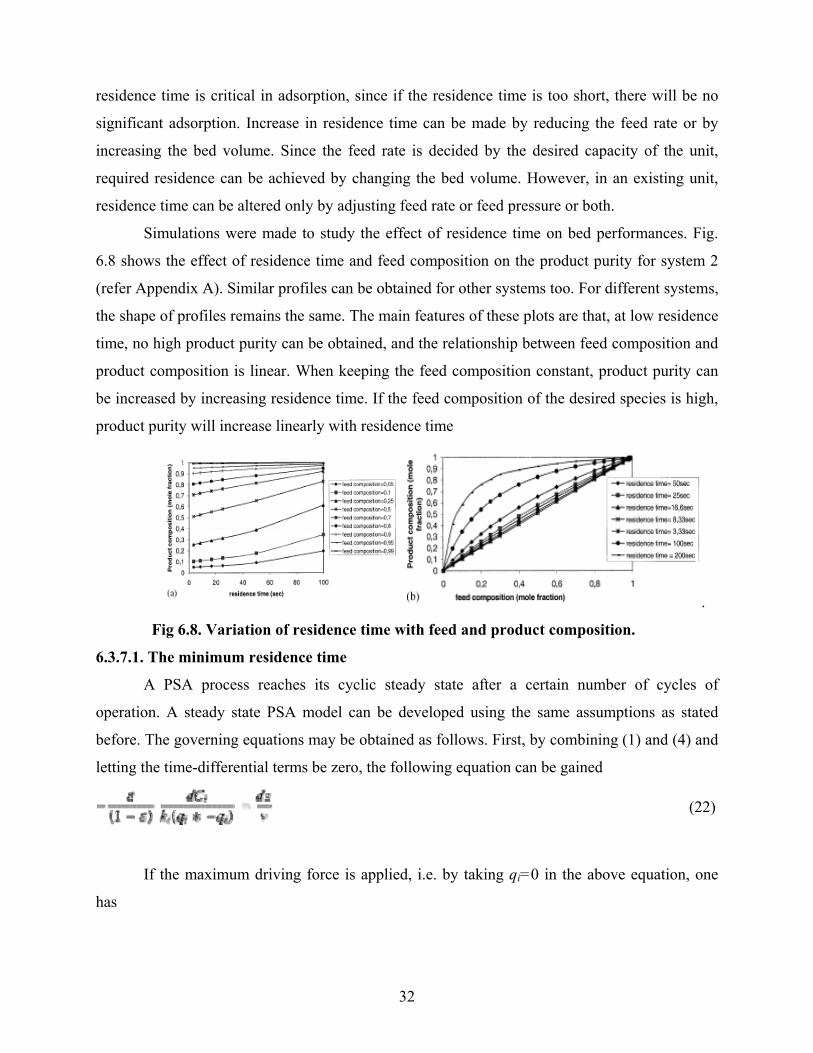
Simulations were made to study the effect of residence time on bed performances. Fig.
6.8 shows the effect of residence time and feed composition on the product purity for system 2
(refer Appendix A). Similar profiles can be obtained for other systems too. For different systems,
the shape of profiles remains the same. The main features of these plots are that, at low residence
time, no high product purity can be obtained, and the relationship between feed composition and
product composition is linear. When keeping the feed composition constant, product purity can
be increased by increasing residence time. If the feed composition of the desired species is high,
product purity will increase linearly with residence time
.
Fig 6.8. Variation of residence time with feed and product composition.
6.3.7.1. The minimum residence time
A PSA process reaches its cyclic steady state after a certain number of cycles of
operation. A steady state PSA model can be developed using the same assumptions as stated
before. The governing equations may be obtained as follows. First, by combining (1) and (4) and
letting the time-differential terms be zero, the following equation can be gained
(22)
If the maximum driving force is applied, i.e. by taking qi=0 in the above equation, one
has
32

(23)
The boundary condition for this equation is the same as given in Eq. (6). It is easy to
solve this equation, and the solution for the highly adsorbed component will give the residence
time for a system under the conditions of a constant velocity and the maximum driving force.
Therefore, the solution of Eq. (23) gives the minimum residence time for a given feed and
desired product composition. Initially, one may expect the existence of certain relationship
between the ratio of the actual and the minimum residence time, with the kinetic parameters and
separation factor. Fig. 6.9 gives the relationship between the separation factor and the time ratio.
As the separation factor increases, the required ratio of actual-to-minimum residence time also
increases. But this relation is less clear. As an explanation, one may argue that the ratio of actual-
to-minimum residence time depends on the total amount of gas adsorption, rather than the kinetic
selectivity (the ratio of diffusivities). Basis for this argument is that in the calculation of the
minimum residence time, the maximum driving force is considered (taking qi=0), but this is not
the case of the actual residence time. The difference arises due to the difference in driving force,
which is the adsorbed phase concentration in a practical cycle. The concentration in the adsorbed
phase depends on the mass transfer of each component, which relies on the individual mass
transfer coefficient. In this way, the total effect on the adsorbed phase concentration depends on
the sum of the mass transfer coefficient, rather than the kinetic selectivity.
Fig 6.8 Residence time ratio vs. mass transfer coefficients
In calculation of the minimum residence time, the assumption of a constant velocity is
taken, which is invalid if the concentration of the highly adsorbing species is high in the feed. If
the concentration of the highly adsorbing species in the feed increases, the product flow rate will
be low as compared with the feed flow rate, and the minimum residence time will be much less
than the actual residence time. Thus the ratio of actual-to-minimum residence time will also
depend on feed composition.
33

(24)
Most of the systems have (k1+ k2) (K1/K2) yf1 <0.015, where the value of the time ratio is
in between 1 and 2. From this result, a quick estimation of the bed size can be made.
The bed volume is determined based on the required residence time. To specify the bed
size, i.e. the bed diameter and bed height, some criteria should be kept in mind. The choice of the
bed diameter depends on the fluidizing velocity, which is the minimum velocity required to
fluidize a bed. The maximum velocity in the bed should not exceed 70% of the minimum
fluidizing velocity. For velocities greater than this value, entrainment of adsorbents in effluent
stream may occur and also the pressure drop in the bed would be very high. After determining
the fluidizing velocity, the bed diameter can be calculated. Another important criterion for bed
specifications is the crushing strength of the solids. The height should be such that no crushing
occurs in the bed.
6.3.8. Pressure equalization
The first improvement over Skarstrom's cycle is the introduction of a pressure
equalization step, as shown in Fig. 19. After the first bed has been purged and the second bed has
completed its high-pressure adsorption step, instead of blowing down the second bed directly,
the two beds may be connected to each other through their product ends in order to equalize their
pressures. The first bed is thus partially pressurized with gas from the outlet region of the second
bed. After the pressure equalization, the two beds are disconnected and the first bed is
pressurized with feed gas while the second bed is vented to complete the blowdown. The
pressure equalization step conserves energy, because the compressed gas from the high-pressure
bed is used to partially pressurize the low-pressure bed. Since this gas is partially depleted of the
strongly adsorbed species, the degree of separation is conserved and the blowdown losses are
reduced. Based on these considerations, a pressure equalization step is often incorporated in the
PSA process.
Table 6.1 indicates the PSA performance with and without a pressure equalization step. It
can be seen that a pressure equalization step favors product recovery. But if the pressure swing is
sufficiently low, the inclusion of a pressure equalization step may be impractical. Otherwise, the
pressure equalization step should always be incorporated in the PSA process.
34

Table 6.1. Comparison of PSA process with and without pressure equalization step for air
separation on CMS
6.3.9. Vacuum swing adsorption
Vacuum swing adsorption (VSA) is also a Skarstrom cycle in which the low-pressure
purge step is replaced by a vacuum desorption. The product end of the bed is kept closed and the
vacuum is applied through the feed end, as shown in Fig.6.10.. In a VSA process, using the same
high operation pressure as a Skarstrom cycle and for the same product purity, the loss of the less
favorably adsorbed species in the evacuation step is normally less than the corresponding loss in
the purge. The gain in raffinate recovery is achieved at the expense of the additional mechanical
energy required for the evacuation step. A significant amount of energy can be saved, if the
adsorption takes place slightly above the atmospheric pressure and the desorption is done at a
very low pressure. A VSA cycle will, therefore, be advantageous over a normal Skarstrom cycle,
if a low-pressure product is acceptable. In kinetically controlled separation, a major disadvantage
using a normal Skarstrom cycle is that the slowly diffusing raffinate product would be
continuously adsorbed during the purge step. This problem can be avoided by using VSA. In
kinetically controlled processes there is a little difference in isotherms of feed components (e.g.
nitrogen separation from air using zeolite 4A) but a large difference in diffusivity. In such a
system, purging with the product to remove the highly diffusing species from the bed is
undesirable. This is so because apart from wasting product (a certain fraction of nitrogen), the
raffinate gas will be adsorbed during this step, thereby reducing the capacity for oxygen during
the next adsorption step. For such type of systems a VSA process is worth considering. For the
nitrogen separation from air using carbon molecular sieve (CMS). The results are shown in Table
6.2, which illustrate that the recovery of nitrogen is greater in a VSA process than in an ordinary
Skarstrom cycle. From the results and the above explanation, it can be concluded that for
kinetically controlled processes, VSA is a better choice over a normal Skarstrom cycle.
35
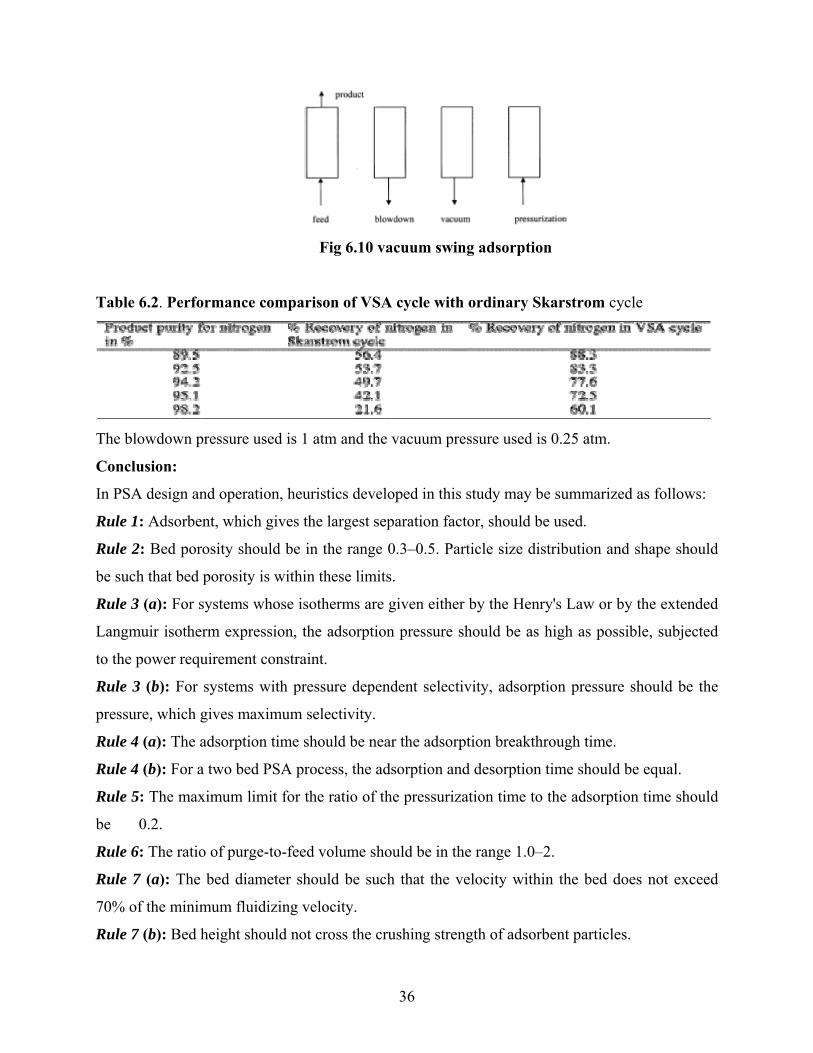
Fig 6.10 vacuum swing adsorption
Table 6.2. Performance comparison of VSA cycle with ordinary Skarstrom cycle
The blowdown pressure used is 1 atm and the vacuum pressure used is 0.25 atm.
Conclusion:
In PSA design and operation, heuristics developed in this study may be summarized as follows:
Rule 1: Adsorbent, which gives the largest separation factor, should be used.
Rule 2: Bed porosity should be in the range 0.3–0.5. Particle size distribution and shape should
be such that bed porosity is within these limits.
Rule 3 (a): For systems whose isotherms are given either by the Henry's Law or by the extended
Langmuir isotherm expression, the adsorption pressure should be as high as possible, subjected
to the power requirement constraint.
Rule 3 (b): For systems with pressure dependent selectivity, adsorption pressure should be the
pressure, which gives maximum selectivity.
Rule 4 (a): The adsorption time should be near the adsorption breakthrough time.
Rule 4 (b): For a two bed PSA process, the adsorption and desorption time should be equal.
Rule 5: The maximum limit for the ratio of the pressurization time to the adsorption time should
be 0.2.
Rule 6: The ratio of purge-to-feed volume should be in the range 1.0–2.
Rule 7 (a): The bed diameter should be such that the velocity within the bed does not exceed
70% of the minimum fluidizing velocity.
Rule 7 (b): Bed height should not cross the crushing strength of adsorbent particles.
36

Rule 7 (c): The Ratio of actual-to-minimum residence time should be in the range 1–2. Eq. (24)
may be used to calculate the ratio.
Rule 8 (a): For processes with high swing in pressure, a pressure equalization step should be
included.
Rule 8 (b): The ratio of intermediate pressure to the low pressure should be in the range 0.5–0.8
of the ratio of the high pressure to the low pressure.
Rule 9: For a kinetically controlled process, VSA should be considered.
6.4. DETAILED DESIGN
In our design, nitrogen is required for synthesis gas and oxygen is required for combustion of
natural gas in shell side of the tubular reactor.
Amount of nitrogen required=510.62 mols/s
Amount of oxygen required =280.6 mol/s
Total air required =1336.19 mol/s. From this 510.62 mol/s of nitrogen should be separated
first and then 280.6 mol/s of oxygen is separated. Rest of the nitrogen can be used for some other
purpose. So our prime aim is the separation of nitrogen
1. Adsorbents available for air separation are zeolite 5 A and CMS 3 A. the separation
factor for nitrogen in CMS is 41, where as in first case it is 0.16. Since nitrogen is desired
product CMS has to be used.
2. Porosity: 0.3
Adsorbent: CMS 3A
Particle density: 0.9 g/cc
Bulk density: 0.633 g/cc
Particle size=0.158 cm
Particle shape=spherical
3. Assuming that the adsorption isotherms for the adsorption of nitrogen on CMS are
constant selectivity isotherms, the adsorption pressure has to be taken as high as
possible.PH=6 atm.
4. Purity of the product increases with increase in residence time. For higher residence time
adsorption break through time is around 70 seconds. So adsorption time is taken as 60
seconds.
5. Purity is almost constant for increase in ratio pressurization time to adsorption time. But
recovery increases with the ratio. Taking the ratio as 0.05.tpres =3 seconds
37

6. Our main product is nitrogen. Use of purge will affect the purity and recovery of
nitrogen. So no purge is required and VSA should be employed.
7. a) Minimum fluidization velocity can be evaluated from the following formula
For air the porosity at minimum fluidization velocity is around 0.5 and sphericity
is 1. Minimum fluidization velocity is 0.3415m/s. So the maximum operating velocity is
0.2391 m/s.
b) To find out the minimum residence time, the concentration of nitrogen in adsorbed
phase and gas phase are calculated from table 5.2. τmin = 89 sec
(150 µV (1-Єm)/φs2Dp
2Єm3) + (1.75ρV2/φsDpЄm
3) =g (ρp-ρ) (25)
c) τmin/τact=1.07 so τact=98 sec
8. Since there is a large swing in pressure, pressure equalization step has to be employed.
When the third bed finishes the vacuum desorption step the first bed is finished with the
adsorption step. The product ends of these two may be connected PI/0.25=0.7*6/0.25.
PI=2.52 atm.
9. As mentioned, VSA is used. Blowdown pressure is 1 atm. Vacuum pressure is 0.25 atm.
6.4.1. Determination of bed diameter and height:
Maximum velocity in the bed will be for the feed. So
5.445/ (π/4 D2) < 0.2391
D > 5.385 m
Actual residence time = (volume/ flow rate)
D2Z=679.41.
Normally polybed PSA processes are employed. For this feed flow rate the number of beds
should not exceed 6.
Fig 6.11. System selection
38

Table: 6.3: comparison of L/D ratio
In industrial adsorbers the diameter usually ranges between 5-8 m. Assuming a
diameter of 6 m, the length of the adsorber is 18.87,9.436,6.29,4.71 m for the above four trials.
The L/D ratio ratio should be 1-3. So the second trial is satisfactory.
Trial
no.
No of beds
D m D2Z m2 L m
For D=6 m
L/D for D=6m
1 1 >5.385 679.41 18.87 3.145
2 2 >3.807 339.705 9.436 1.572
3 3 >3.1 226.47 6.29 1.044
4 4 >2.7 169.85 4.71 0.785
Length of the bed= 9.436m
Diameter of the bed=6m
39

7. DESIGN OF TUBULAR REACTOR
7.1. NOMENCLATURE:
λg Thermal conductivity of gas ,W/m0C
λs Thermal conductivity of catalyst particle, W/m0C
λE Effective thermal conductivity of bed ,W/m0C
λR Radiative thermal conductivity of gas, W/m0C
λo Isotropic thermal conductivity of the bed ,W/m0C
λt, λt’ Convective thermal conductivity of gas, W/m0C
αc Tube side heat transfer coefficient , W/m2 0C
αw Wall heat transfer coefficient, W/m2 0C
U Overall heat transfer coefficient, W/m2 0C
Nt Number of tubes
dt Inside diameter of tubes, m
t Thickness of tubes, m
dt o Outside diameter of tubes, m
dp Diameter of catalyst particle, m
u Velocity of fluid ,m/s
V Volume of tubes, m3
Re Reynolds number in packed bed
Pr Prandtl number
ε Bed porosity
εm Emisivity of the catalyst particle
ρp Density of the catalyst particle, Kg/m3
ρ Density of the gas, Kg/m3
μ Viscosity of the gas, Kg/m s
Cp Specific heat of gas ,J/Kg0K
T operating temperature ,0K
Φs Sphericity of the catalyst =1
P Design pressure, Kg/cm2
40

J joint efficiency
f Allowable stress at operating temperature, Kg/cm2
Ds Inside diameter of shell , m
Dso Outside diameter of shell ,m
ts Thickness of shell ,m
7.2. DESIGN FUNDAMENTALS:
In a catalytic tubular reactor, the temperature may not be same over the length and cross
section of the reactor. In case of exothermic reaction, temperature will be more along the axis of
the tube than near the wall (when coolant flows outside the tube) and vice versa when
endothermic reaction takes place.
Heat transfer is a result of
i. Flow independent mechanisms
1. Thermal conduction through solid particle
2. Thermal conduction through contact point of two particles
3. Radiant heat transfer between surfaces of two adjacent pellets
ii. Flow dependent mechanisms
1. Thermal conduction through fluid film near contact surface of two
pellets
2. Convective heat transfer(solid-fluid-solid)
3. Heat conduction within fluid
4. Heat transfer by lateral mixing
As fluid is passing through a bed of particles, its repeated lateral displacement
combined with mixing of volume elements gives rise to a certain degree of mixing
perpendicular to the main flow. The degree of mixing can be characterized by means of
an apparent transverse diffusion coefficient Dt.
Heat can be transported perpendicularly to the main flow by the same mechanism
if a transverse temperature gradient exists, resulting in a convective heat conductivity λt.
Heat can be transferred by conduction through the fluid from particle to particle
and with gases it is associated with thermal radiation between the particles. If there is no
flow an apparent (isotropic) thermal conductivity of the bed λ0 also exists.
41

1.7'0 LLLLLLLLLLLLLLLLLLLLLLLLLtt λλλ +=
2.7600Pr.Re30))21(2(8
)(
2
'LLLLLLLLLLLLL<<∀
−−=
t
p
pGpt
dd
udCρλ
3.793.026.0)1(67.00 LLLLLLLLLLLLLL <<∀−+= εεελλ
Ag
4.71
)1(2
)1(ln)1(
)1((
1
2LLLLLLLLL
s
gg
s
s
g
s
g
s
g BBB
BB
B
BA
λλλ
λ
λλ
λλ
λλ
−
−−
+−
−
−
−=
5.7)1( 11.1 LLLLLLLLLLLLLLLLLLLLLLLLLεε−
= CB
C=1.25 for spheres and 1.4 for crushed particles and 2.5 for cylinders and rasching rings..
6.7)100
(12
23.0 3 LLLLLLLLLLLLLLLLLLLLLLp
m
R dT−
=ε
λ
7.711)1)(11( LLLLLLLLL
S
G
R
GG
R
G
o A
λλ
λλ
εελλε
λλ
+
−+−++−−=
An additional heat transfer resistance should be taken for the transport of heat between
fluid stream and the wall containing bed. Although the point velocity in the bed can be greater
near the wall than its value averaged over the whole cross section, the intensity of transverse
mixing decreases as wall is approached. A boundary layer exists at the wall itself, it has an
average thickness determined by the velocity of the flow and by the produced by the particles
adjacent to the wall. These effects can be conveniently combined into a wall heat transfer
coefficient αw given by
8.7PrRe22.0PrRe203.0 4.08.033.033.0 LLLLLLLLLLLLL+=t
pW dλ
α
The tube side heat transfer coefficient is given by
9.7PrRe1.05 LLLLLLLLLLLLLLLLLLLLLLLLL+=G
E
λλ
10.78
LLLLLLLLLLLLLLLLLLLLLLLLLLt
eC d
λα =
The overall heat transfer coefficient can be given by
42

11.713.6
111LLLLLLLLLLLLLLLLLLLLL
t
t
WC
dU λαα
++=
Reynolds number in a packed bed can be found out by
12.7)1(3
2Re LLLLLLLLLLLLLLLLLLLLLLLL
μερε
−=
ud p
Prandtl number is given by
13.7Pr LLLLLLLLLLLLLLLLLLLLLLLLLLk
C pμ=
Ergun’s equation is given by
14.7)1(150322
20 LLLLLLLLLLLLLLLLLLLLLL
εεμ
psc dgV
LP
Φ
−=
Δ
7.3. DESIGN PROCEDURE:
1. The amount of catalyst required is known since the residence time is
known with respect to the amount of catalyst.
2. The porosity of the bed depends on the dt/dp ratio. The dt/dp ratio
should not exceed 10 and L/dp should be more than 50.
3. Assume dt/dp. Find out porosity. From this get volume of the bed,
since volume of catalyst required is known.
4. Evaluate constants A, B, C, λR, λ0, u, Re, Pr, λt, Re.Pr, αw, αc and then
get the overall heat transfer coefficient in terms of number of tubes and
length of the tube.
5. From the volume one more equation is obtained relating the number of
tubes and length of the reactor.
6. From the heat load one more equation relating heat transfer
coefficient, length and number of tubes.
7. Get the length and number of tubes in the reactor and then check it
for the pressure drop using Erguns equation.
43
Emissivity of the catalyst particle (εm) =0.19
Diameter of the particle (dp)= 0.00175 m
Thermal conductivity of the particle (λS) = 33.32 W/m0K
Bulk density of the catalyst = 3737.04 Kg/m3
Mass of the catalyst = 1328.3 Kg
Volume of the catalyst = 0.3554 m3
Thermal conductivity of gas (λG) = 0.09388 W/m0K
Density of the gas =13.13 Kg/m3
Specific heat of gas (Cp) = 2925 J/Kg0C.
Viscosity of gas = 2.8*10-5 Kg/ms
The various trial are tabulated in table6.1.It has been found out that the result of
the third trial is satisfactory. The length of the tubes is 0.616m and the number of tubes is
2546. If we have one reactor only then L/Ds is not satisfactory. If we have N identical
reactors the L/Ds ratio will become satisfactory only if we have more than 3 reactors. So
if we have 3 reactors L/Ds becomes greater than 1 which is satisfactory.
7.4. DESIGN OF TUBES AND SHELL:
7.3.1. Material of construction:
For the tubes the material of construction is authentic steel. For shell side the material of
construction is INCONEL 600(80%Ni, 16%Cr, 7%Fe) for high temperature operation around
11000C.
7.3.2. Determination of tube thickness:
The equation for finding out the thickness of the tubes is
15.72
LLLLLLLLLLLLLLLLLLLLLLLLLLLLLLLCfJ
Pdt t +=
P =35+0.1(35) =38.5kg/cm2
dt =21.4375mm
J = 0.85
f = 276*106 Pa
t= 3.2mm; dt o= 27.635 mm
The standard tube size is dt o= 31.75 mm ; dt =22.606 mm with 16 BWG
44

TABLE: 7.1. Determination of length and number of tubes:
Trial 1 Trial 2 Trial 3
dt/dp 10 15 12.25
ε 0.38 0.3675 0.3725
C 1.25 1.25 1.25
B 2.1523 2.29 2.23
A 17.318 17.0084 16.69
λR(W/m0K) 0.0360 0.0360 0.0360
λo(W/m0K) 1.5347 1.5009 1.466
u m/s 5621.2388/Nt 2589.22/Nt 3821.35/Nt
Re 1.5144*106/Nt 0.6587*106/Nt 0.995*106/Nt
Pr 0.9419 0.9419 0.9419
λt’(W/m0K) 3.4718*107/Nt 1.74*107/Nt 2.59*107/Nt
(dt/6.13λt)-1
m2 0K/W
537.58+1.216*1010/Nt 350.4958+.4063*1010/Nt 422.897+.792*1010/Nt
1/αw
m2 0K/W
(22.85/Nt0.33+1.9*104/Nt
0.8)*
(876.9715+1.984*1010/Nt
(17.3/Nt0.33+0.97*104/Nt
0.8)*
(857.65+9.943*1010/Nt
(19.7/Nt0.33+1.33*104/Nt
0.8)*
(837.71+1.41*1010/Nt
1/αc
m2 0K/W
247.3143+7.01*106/Nt 164.9+2.046*106/Nt 203.708+3.7*106/Nt
L*Nt (from
volume)
2383.196 1036.79 1569.2
1/U(load)
m2 0K/W
6.999*10-4 4.89*10-4 6.039*10-4
Nt 5996 1064 2546
L m .3972 0.97 0.616
ΔP
(Kg/cm2)
0.9559 (<4) 13.98(>4) 3.845(<4)
45
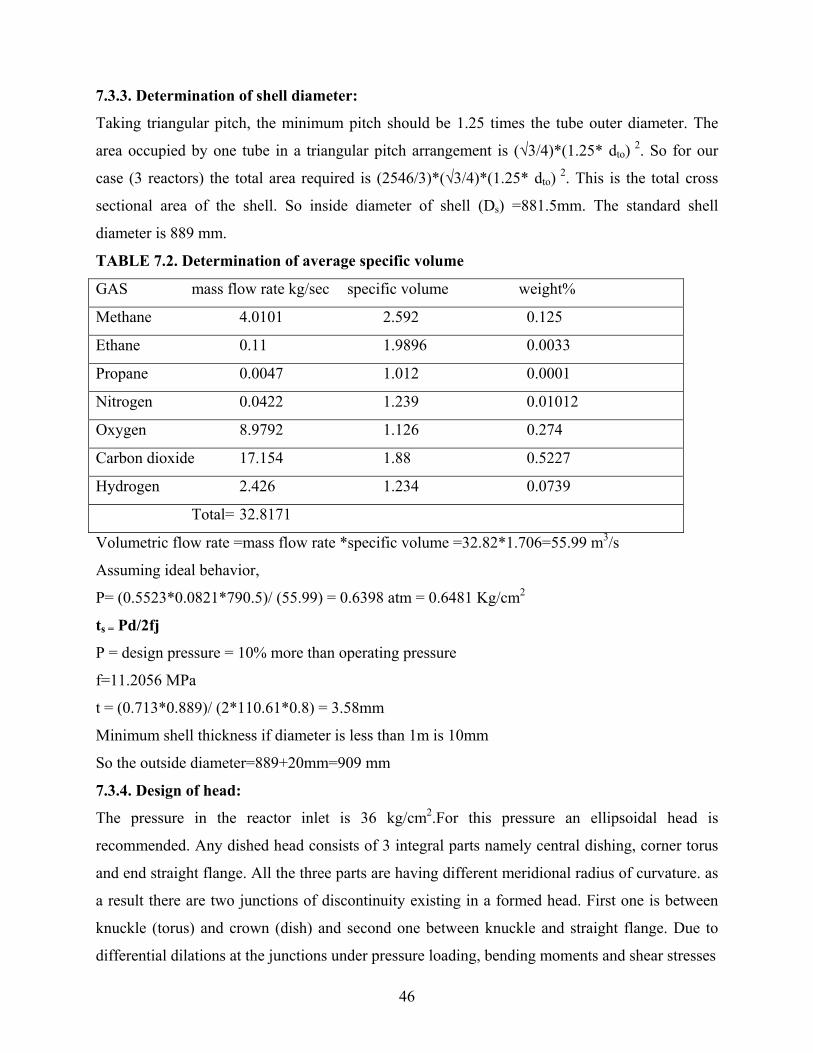
7.3.3. Determination of shell diameter:
Taking triangular pitch, the minimum pitch should be 1.25 times the tube outer diameter. The
area occupied by one tube in a triangular pitch arrangement is (√3/4)*(1.25* dto) 2. So for our
case (3 reactors) the total area required is (2546/3)*(√3/4)*(1.25* dto) 2. This is the total cross
sectional area of the shell. So inside diameter of shell (Ds) =881.5mm. The standard shell
diameter is 889 mm.
TABLE 7.2. Determination of average specific volume
GAS mass flow rate kg/sec specific volume weight%
Methane 4.0101 2.592 0.125
Ethane 0.11 1.9896 0.0033
Propane 0.0047 1.012 0.0001
Nitrogen 0.0422 1.239 0.01012
Oxygen 8.9792 1.126 0.274
Carbon dioxide 17.154 1.88 0.5227
Hydrogen 2.426 1.234 0.0739
Total= 32.8171
Volumetric flow rate =mass flow rate *specific volume =32.82*1.706=55.99 m3/s
Assuming ideal behavior,
P= (0.5523*0.0821*790.5)/ (55.99) = 0.6398 atm = 0.6481 Kg/cm2
ts = Pd/2fj
P = design pressure = 10% more than operating pressure
f=11.2056 MPa
t = (0.713*0.889)/ (2*110.61*0.8) = 3.58mm
Minimum shell thickness if diameter is less than 1m is 10mm
So the outside diameter=889+20mm=909 mm
7.3.4. Design of head:
The pressure in the reactor inlet is 36 kg/cm2.For this pressure an ellipsoidal head is
recommended. Any dished head consists of 3 integral parts namely central dishing, corner torus
and end straight flange. All the three parts are having different meridional radius of curvature. as
a result there are two junctions of discontinuity existing in a formed head. First one is between
knuckle (torus) and crown (dish) and second one between knuckle and straight flange. Due to
differential dilations at the junctions under pressure loading, bending moments and shear stresses
46

Fig.7.1. Tubular reactor
are induced, besides normal membrane stresses to maintain continuity between adjacent parts. As
the torus section is small, these stress concentration factors cannot be neglected in the design
equation. The maximum bending stress is the meridional bending stress in the knuckle due to
discontinuity at the crown-knuckle junction. Introducing a shape or stress concentration factor C,
the head thickness can be given by
fJ
CPDt o
2=
The factor C depends on hE/D0 and t/D0 for the head without any opening or openings
completely reinforced. In case of the heads unreinforced containing opening, C will depend on
hE/D0 and otD
d Where hE =the effective external height of the head.
47

Fig 7.2 .Ellipsoidal head
hE is the minimum of 2
,4
,))22
(*)2
((2
5.0 oooo
oo
oooo
rDDr
DR
DRRh −+−−=
Assuming Ri = Ro =Do = 909 m
ro = 0.06 Do
So h0=0.1546
D02/4R0 =0.17
(Do*ro/2)1/2 =0.1574
From the above three solution 0.1546 is the minimum
So hE /Do=0.1546/0.909=0.170
As the diameter of the shell (0.909 mm) is not very large the head can be fabricated from a single
plate. So J=1. From Eq.4.2.20 (B.C. Bhattacharyya)
t/Do=(PC/2fJ) = (1.1*36*9.8*104C/2*276*1)=7.03*10-3.
Several of t/DoC are to be tried to match the above relationship. It is found that for
t/Do=0.013125 and corresponding value of C is found 1.86 gives t/DoC=6.25*10-6 which is a
very good approximation. From the above findings the corroded head thickness is obtained as
follows
t/Do=0.013125 ; t=13.83mm
Blank diameter of the plate for head can be evaluated from the Equation given below.
Blank diameter =D0+D0/42+2/3ri+2Sf
Assuming Sf=40mm
Blank diameter=1076 mm
48

8. PIPING DESIGN AND INSTRUMENTATION DIAGRAMS
9.1. PIPING DESIGN:
Operating Velocity = volumetric flow rate / Area of cross section
From the area of cross section diameter can be calculated.
The design velocity depends on the operating pressure.
Table 9.1: Operating velocity for fluids
Fluid
Operating pressure Kg /cm2
Optimum operating velocity m/s
Gases
<1.05 1.05 -2 >2
3-20 5-25 20-60
Steam
10- 40 >40
20- 40 30-60
Compressed air In network 15-25
Table: 9.2: Inside diameter of pipes
From To T 0C
P Kg/cm2
n
kmoles/s
V
m3/s
u
m/s
Di
m Natural gas feed Mixing valve 390 2 0.4336 12.187 25 0.7877
Boiler Mixing valve 390 41 1.48 2.029 40 0.254
Mixing valve HE1 390 36 1.9166 2.993 35 0.329
HE1 Reformer inlet 550 36 1.9166 1.2384 35 0.2122
Reformer outlet HE2 800 33 2.7039 2.485 34 0.304
HE2 HTS inlet 367 33 2.7039 4.446 34 0.4080
HTS outlet HE3 430 32 2.7039 5.037 34 0.4342
HE3 LTS inlet 167 32 2.7039 3.152 32 0.3541
LTS outlet HE4 190 26 2.7039 4.083 31 0.4094
HE4 Stripper inlet 45 25 2.7039 2.916 31 0.3460
Stripper outlet condensate 45 8 0.6978 2.352 18 0.4078
Flue gas HE2 1000 1 0.44586 16.041 32 0.798
HE2 HE1 520 1 0.44586 29.797 32 1.0880
HE1 Vent 28 1 0.44586 11.379 32 0.6613
Natural gas shell 25 1 0.1191 3.009 14 0.523
49

The volumetric flow arte is calculated by assuming ideal behavior of gas. From the area
of cross section diameter of tube is calculated. The thickness of the tubes can be calculated from
the schedule number.
Schedule number = 1000 P/S
P is the design pressure which is 10% more than operating pressure.
S is the allowable stress at working temperature
mnumber D
tSchedule 2000=
Dm is the mean diameter of the pipe = Di +t
TABLE: 9.3: Outside diameter of pipes From To S
MPa t ( from equation) mm
NPS Type OD inch
ID(standard pipe) inch
Natural gas
feed
Mixing valve 82 1.03 - - - -
Boiler Mixing valve 82 7.6 10 40S 10.75 10.02
Mixing
valve
HE1 82 7.96 14 XS 14 13
HE1 Reformer
inlet
90.3 8.07 10 60N 10.75 8.5
Reformer
outlet
HE2 11.2 57 12 40S 12.75 12
HE2 HTS inlet 99.56 7.37 18 80N 18 16.124
HTS outlet HE3 104.63 7.28 18 30N 18 17.124
HE3 LTS inlet 110.4 5.57 16 100N 16 13.44
LTS outlet HE4 110.4 5.18 18 80N 18 16.124
HE4 Stripper inlet 110.4 4.25 14 10S 14 13.624
Stripper
outlet
condensate 110.4 1.57 18 80N 18 16.124
Flue gas HE2 3.45 12.58 - - - -
HE2 HE1 90.36 0.596 - - - -
HE1 Vent 110.4 0.317 30 30N 30 28.75
Natural gas shell 110.4 0.251 24 100N 24 20.938
50

In the pressure swing adsorption systems, normally polybed units are employed. So the
volumetric flow arte depends on number of adsorbers required. From that the pipe diameter can
be calculated by following the similar procedure.
9.2. INSTRUMENTATION DIAGRAM:
The number of controllers required to control the process variables can be determined,
only when the degree of freedom is known for the process. the degree of freedom of a
process is given by
Degree of freedom (F) =Number of variables (V) - Number of equations (N)
If a system consists of ‘n’ components then total continuity equation and n-1 component
continuity equations are enough to describe the state of the system.
9.2.1. Heat exchangers:
The control objective is outlet temperature of the process fluid. So feedback controllers
are employed and the manipulated variable is the mass flow rate of the other fluid, which
exchanges heat with the process fluid.
9.2.2. Orifice meters:
Flow rate is measured by orifice meters. Here the control objective is the flow rate of the
fluid. A controller is incorporated to maintain the flow rate of the fluid.
9.2.3. Hydrogenator:
In the hydrogenator natural gas is desulfurized. Since sulfur is present in small quantity,
the density of the gas is almost constant. The volumetric flow rate of inlet and outlet streams
is equal. The control objective is maintaining the composition of sulfur at the outlet stream.
Since it is a exothermic reaction variation in temperature will be there.
Variables = partial pressure of sulfur, partial pressure of hydrogen, temperature
Equations = component continuity equation for hydrogen, energy balance equation.
The degree of freedom is 1.
A controller is incorporated to maintain the sulfur concentration in the outlet by changing
the recycle gas flow rate.
9.2.4. Reformer:
In the reformer the methane steam reforming reactions are taking place in the tube side
and I the shell side natural gas and oxygen are used as fuel.
51

9.2.4.1. Tube side:
Total number of components
Inlet = methane, steam, hydrogen, carbon dioxide, carbon monoxide, nitrogen.
Outlet = steam, hydrogen, carbon dioxide, carbon monoxide, nitrogen.
Number of variables= temperature, partial pressure of the components (6).
Number of Equations= total continuity equation, 4 component continuity equations (except
Nitrogen) and Energy balance equation.
9.2.4.2. Shell side:
Total number of components
Inlet = methane, hydrogen, carbon dioxide, carbon monoxide, oxygen, nitrogen.
Outlet = steam, hydrogen, carbon dioxide, carbon monoxide, oxygen, nitrogen.
Number of variables= temperature, partial pressure of the components (5).
Number of Equations= Total continuity equation, 4 component continuity equations (except
Nitrogen and Energy balance equation.
Total number of equations= 12
Total number of variables = 14
Degree of freedom =2
So controllers are incorporated to maintain the inlet temperature of the fluid by a controlling
the flow rate of other fluid in heat exchanger, maintain the outlet temperature of fluid by
controlling the flow rate of fuel to the reformer.
9.2.5. Shift converters:
Total number of components = 6. They are Methane, steam, hydrogen, carbon dioxide,
carbon monoxide, nitrogen. .
Number of variables= temperature, partial pressure of the components (6) = 7
Number of Equations= total continuity equation, 5 component continuity equations and
Energy balance equation. =7
Degree of freedom = 0. So no controllers are required.
9.2.6. Other processes:
All the other processes such as PSA, gas liquid separator are separation processes. So no
controllers are required
52

53
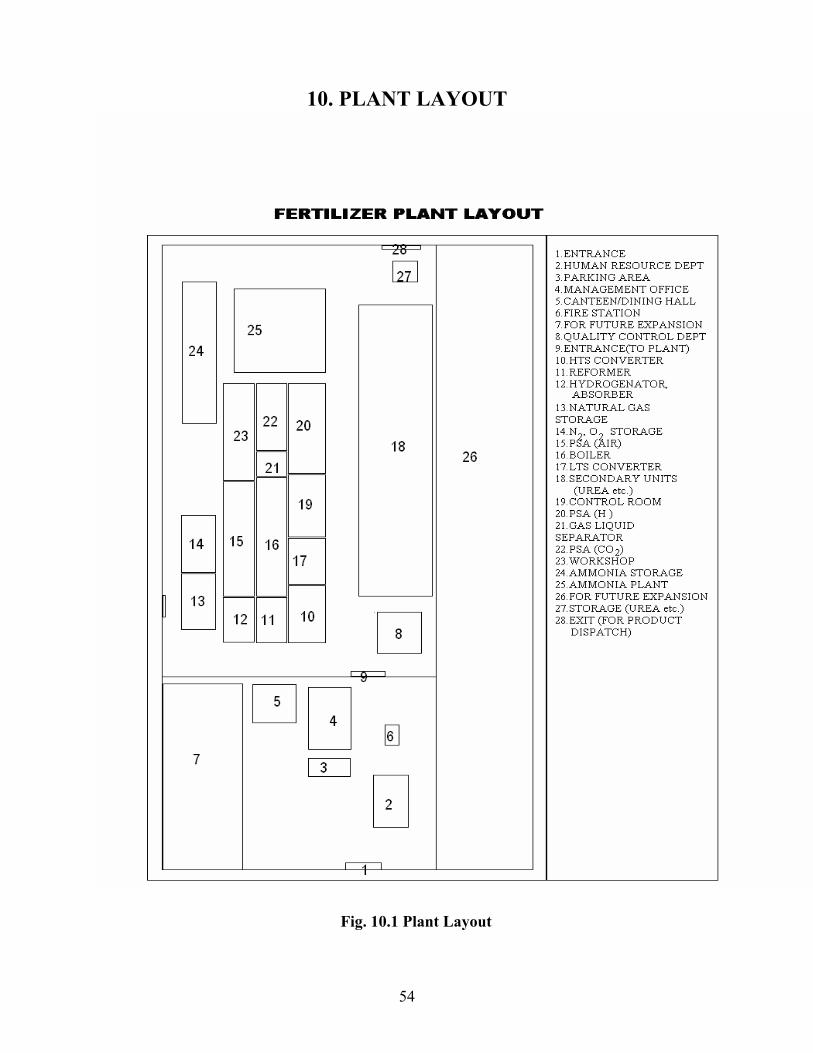
10. PLANT LAYOUT
Fig. 10.1 Plant Layout
54

11. CONCLUSION
From this present work it is found that single stage reforming is economical when
compared to two stages of reforming and it is preferred at the expense of 21.94 % increase in
heat load in the reformer. The percentage composition of hydrogen is more at the reformer outlet
in case of single stage reforming. The design of tubular packed bed reactor is carried out and it
was found that three reactors are required for the plant capacity of 1500 TPD of ammonia. From
this it is found that for higher capacity plants fixed bed reformers are preferred over tubular
reformers.
The number of stage of shift conversion is decided by the activity of catalyst over the
temperature range. Here two stages of shift conversion are used, one at high temperature and the
other one at lower temperature.
The conventional CO2 removal process and methanation are replaced by the pressure
swing adsorption process, since it is economical when compared with others. Design of a
pressure swing adsorption system for air separation is carried out and it is found that polybed
PSA systems are required for the separation.
11.1. Future scope of the project:
• Identification of more active methane steam reforming catalysts in future will lead to the
increased conversion of methane in the reformer.
• In the PSA system, since the adsorbents are not much efficient, polybed units are
required. The production of efficient, economical, commercial adsorbents in future will
lead to reduction in number of PSA units, thereby reducing the total cost.
• Isothermal shift conversion is normally employed for higher capacity plants. Since it is
very costly, it is not employed in all the plants. Improvement in design and operation of
the isothermal shift conversion reactors will lead to the use of this in all plants and it will
also be economical.
55
12. REFERENCES 1. The optimal design of pressure swing adsorption systems by Oliver j smith, Arthur w.
westerterp j.Chemical engineering science. Vol. 46. No. 12, pp. 2967-2976, 1991.
2. Heuristic design of pressure swing adsorption: a preliminary study S. Jain, A. S.
Moharir, P. Li .j. Separation and Purification Technology Volume 33, Issue 1 ,
September 2003, Pages 25-43.
3. Pressure swing adsorption processes to purify oxygen using a carbon molecular sieve by
Jeong-Geun Jee, Min-Bae Kim and Chang-Ha Lee, j. Chemical Engineering Science
Volume 60, Issue 3 , February 2005, Pages 869-882.
4. 30 Years of PSA Technology for Hydrogen Purification by J. Stöcker and M.
Whysall UOP Antwerp, Belgium and G.Q. Miller UOP Des Plaines, Illinois .
5. Kinetic and modelling study of methane steam reforming over sulfide nickel catalyst on a
gamma alumina support by D.L. Hoang, , S.H. Chan and O.L. Ding j. Chemical
Engineering Journal ,Volume 112, Issues 1-3 , 1 September 2005, Pages 1-11.
6. Simulation based synthesis, design and optimization of pressure swing adsorption
(PSA) processes by R. Rajasree, and A. S. Moharir , j. Computers & Chemical
Engineering Volume 24, Issue 11 , 1 November 2000, Pages 2493-2505
7. chemical reactor design and operation by K.R.Westerterp, W.P.M.Van Swaaij and
A.A.C.M.Beenacker, third edition, John wiley and sons p.627-638
8. Heat transmission by William H Mcadams, third edition, Mcgraw Hill,p 290-294
9. Reaction kinetics and reactor design by John B Butt, second edition,marcel dekker Inc.
p538-546.
10. Fertilizer science and technology series-vol.2, ammonia part 1 ed.A.V.Slack,G.Russel
james, Marcel Dekker Inc,1973
11. Fertilizer science and technology series-vol.2, ammonia part 2 ed.A.V.Slack,G.Russel
james, Marcel Dekker Inc,1974
12. Handbook of piping design by G.K.Sahu, first edition,New age international
pub.,1997,p31-37.
13. Chemical engineering third edition.Vol.6. Ed. Coulson Richardson, Butterwoth heinmann
pub., 1999, p214-218.
14. Introduction to chemical equipment design mechanical aspects by B.C.Bhattacharya, first
edition,CBS publishers and distributors,1985,p 51-55.
56

15. Unit operations of chemical engineering by Warren L. McCabe ,Julian C smith, Peter
Harriott, fifth edition, McGraw Hill.,p 153-55,167,455.
16. Perry’s chemical engineers handbook by ed. Robert H Perry, Don Green, McGraw Hill,
sixth edition,chap.3,6,23
57


![Assessing the environmental impacts and water consumption ... · 8/1/2019 · such as life-cycle energy use and GHG emissions [5], fertilizer/en-ergy intensity of feedstock production](https://static.fdocuments.in/doc/165x107/5fb5e80b60448741745325a3/assessing-the-environmental-impacts-and-water-consumption-812019-such-as.jpg)