
analysis and interpretation of financial statements - ethesis
147
ANALYSIS AND INTERPRETATION OF FINANCIAL STATEMENTS: CASE STUDIES THESIS SUBMITTED IN PARTIAL FULFILLMENT OF THE REQUIREMENTS FOR THE DEGREE OF Bachelor of Technology in Mining Engineering By SUDIP DAS Roll: 10605038 DEPARTMENT OF MINING ENGINEERING NATIONAL INSTITUTE OF TECHNOLOGY, ROURKELA 2010
Transcript of analysis and interpretation of financial statements - ethesis

ANALYSIS AND INTERPRETATION OF FINANCIAL STATEMENTS: CASE STUDIES
THESIS SUBMITTED IN PARTIAL FULFILLMENT OF THE REQUIREMENTS FOR THE DEGREE OF
Bachelor of Technology in
Mining Engineering
By
SUDIP DAS
Roll: 10605038
DEPARTMENT OF MINING ENGINEERING
NATIONAL INSTITUTE OF TECHNOLOGY, ROURKELA
2010

ANALYSIS AND INTERPRETATION OF FINANCIAL STATEMENTS: CASE STUDIES
THESIS SUBMITTED IN PARTIAL FULFILLMENT OF THE REQUIREMENTS FOR THE DEGREE OF
Bachelor of Technology in
Mining Engineering
By
SUDIP DAS
Roll: 10605038
Under the guidance of
Prof. D.P.TRIPATHY
DEPARTMENT OF MINING ENGINEERING
NATIONAL INSTITUTE OF TECHNOLOGY, ROURKELA
2010

National Institute of Technology Rourkela
CERTIFICATE
This is to certify that the thesis entitled “ANALYSIS AND INTERPRETATION
FINANCIAL STATEMENTS: CASE STUDIES” submitted by Sri Sudip Das, Roll No:
10605038 in partial fulfillment of the requirements for the award of Bachelor of Technology
degree in Mining Engineering at the National Institute of Technology, Rourkela (Deemed
University) is an authentic work carried out by him under my supervision and guidance.
To the best of my knowledge, the matter embodied in the thesis has not been submitted to any
other University/Institute for the award of any Degree or Diploma.
Date: (Prof. D.P. TRIPATHY)
Dept. of Mining Engineering
National Institute of Technology
Rourkela-769008

ACKNOWLEDGEMENT
I wish to express my deep sense of gratitude and indebtedness to Dr. D.P.Tripathy , Department
of Mining Engineering, N.I.T, Rourkela for introducing the present topic and for his inspiring
guidance, constructive criticism and valuable suggestions throughout the project work.
I am also thankful to all staff members of Department of Mining Engineering, NIT, Rourkela.
Lastly, I would like to thank and express my gratitude towards my friends who at various stages
had lent a helping hand.
Date: (Sudip Das)

i
ABSTRACT
Financial statements are formal records of the financial activities of a business, person, or other
entity and provide an overview of a business or person's financial condition in both short and
long term. They give an accurate picture of a company’s condition and operating results in a
condensed form. Financial statements are used as a management tool primarily by company
executives and investor’s in assessing the overall position and operating results of the company.
Analysis and interpretation of financial statements help in determining the liquidity position,
long term solvency, financial viability and profitability of a firm. Ratio analysis shows whether
the company is improving or deteriorating in past years. Moreover, Comparison of different
aspects of all the firms can be done effectively with this. It helps the clients to decide in which
firm the risk is less or in which one they should invest so that maximum benefit can be earned.
Mining industries are capital intensive; hence a lot of money is invested in it. So before investing
in such companies one has to carefully study its financial condition and worthiness.
Unfortunately very limited work has been done on analysis and interpretation of financial
statements of Indian for mining companies. An attempt has been carried out in this project to
analyze and interpret the financial statements of five coal and non- coal mining companies.
OBJECTIVES
• To understand, analyze and interpret the basic concepts of financial statements of different
mining companies.
• Interpretation of financial ratios and their significance.
• Development of programs in C++ for calculation of different financial statements and
financial ratios.
• Use of Tally 9.0 package for the analysis and interpretation of financial statements of mining
companies.
ii
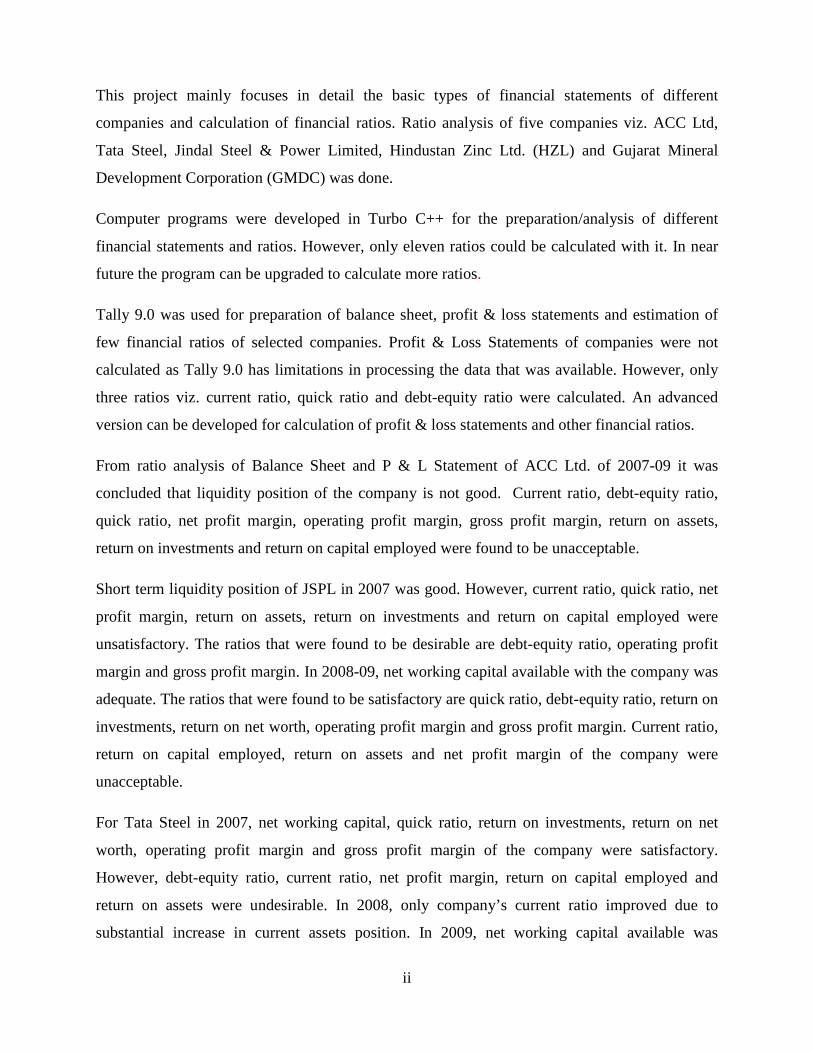
This project mainly focuses in detail the basic types of financial statements of different
companies and calculation of financial ratios. Ratio analysis of five companies viz. ACC Ltd,
Tata Steel, Jindal Steel & Power Limited, Hindustan Zinc Ltd. (HZL) and Gujarat Mineral
Development Corporation (GMDC) was done.
Computer programs were developed in Turbo C++ for the preparation/analysis of different
financial statements and ratios. However, only eleven ratios could be calculated with it. In near
future the program can be upgraded to calculate more ratios.
Tally 9.0 was used for preparation of balance sheet, profit & loss statements and estimation of
few financial ratios of selected companies. Profit & Loss Statements of companies were not
calculated as Tally 9.0 has limitations in processing the data that was available. However, only
three ratios viz. current ratio, quick ratio and debt-equity ratio were calculated. An advanced
version can be developed for calculation of profit & loss statements and other financial ratios.
From ratio analysis of Balance Sheet and P & L Statement of ACC Ltd. of 2007-09 it was
concluded that liquidity position of the company is not good. Current ratio, debt-equity ratio,
quick ratio, net profit margin, operating profit margin, gross profit margin, return on assets,
return on investments and return on capital employed were found to be unacceptable.
Short term liquidity position of JSPL in 2007 was good. However, current ratio, quick ratio, net
profit margin, return on assets, return on investments and return on capital employed were
unsatisfactory. The ratios that were found to be desirable are debt-equity ratio, operating profit
margin and gross profit margin. In 2008-09, net working capital available with the company was
adequate. The ratios that were found to be satisfactory are quick ratio, debt-equity ratio, return on
investments, return on net worth, operating profit margin and gross profit margin. Current ratio,
return on capital employed, return on assets and net profit margin of the company were
unacceptable.
For Tata Steel in 2007, net working capital, quick ratio, return on investments, return on net
worth, operating profit margin and gross profit margin of the company were satisfactory.
However, debt-equity ratio, current ratio, net profit margin, return on capital employed and
return on assets were undesirable. In 2008, only company’s current ratio improved due to
substantial increase in current assets position. In 2009, net working capital available was
iii
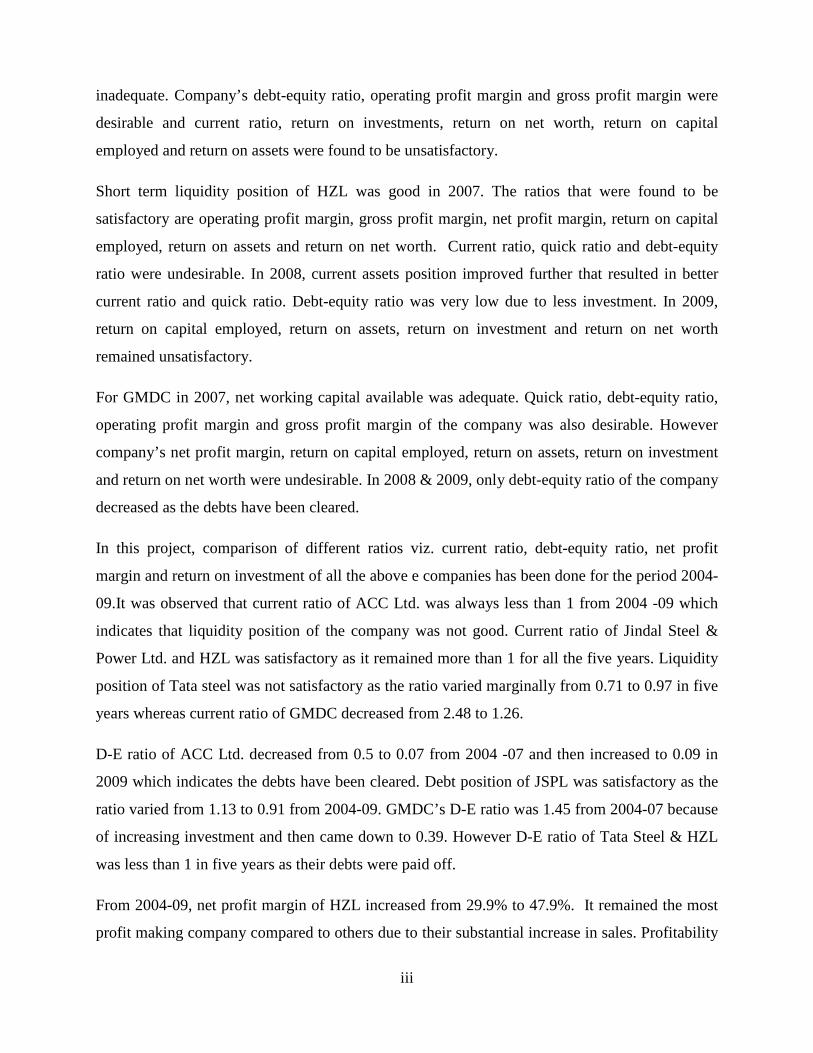
inadequate. Company’s debt-equity ratio, operating profit margin and gross profit margin were
desirable and current ratio, return on investments, return on net worth, return on capital
employed and return on assets were found to be unsatisfactory.
Short term liquidity position of HZL was good in 2007. The ratios that were found to be
satisfactory are operating profit margin, gross profit margin, net profit margin, return on capital
employed, return on assets and return on net worth. Current ratio, quick ratio and debt-equity
ratio were undesirable. In 2008, current assets position improved further that resulted in better
current ratio and quick ratio. Debt-equity ratio was very low due to less investment. In 2009,
return on capital employed, return on assets, return on investment and return on net worth
remained unsatisfactory.
For GMDC in 2007, net working capital available was adequate. Quick ratio, debt-equity ratio,
operating profit margin and gross profit margin of the company was also desirable. However
company’s net profit margin, return on capital employed, return on assets, return on investment
and return on net worth were undesirable. In 2008 & 2009, only debt-equity ratio of the company
decreased as the debts have been cleared.
In this project, comparison of different ratios viz. current ratio, debt-equity ratio, net profit
margin and return on investment of all the above e companies has been done for the period 2004-
09.It was observed that current ratio of ACC Ltd. was always less than 1 from 2004 -09 which
indicates that liquidity position of the company was not good. Current ratio of Jindal Steel &
Power Ltd. and HZL was satisfactory as it remained more than 1 for all the five years. Liquidity
position of Tata steel was not satisfactory as the ratio varied marginally from 0.71 to 0.97 in five
years whereas current ratio of GMDC decreased from 2.48 to 1.26.
D-E ratio of ACC Ltd. decreased from 0.5 to 0.07 from 2004 -07 and then increased to 0.09 in
2009 which indicates the debts have been cleared. Debt position of JSPL was satisfactory as the
ratio varied from 1.13 to 0.91 from 2004-09. GMDC’s D-E ratio was 1.45 from 2004-07 because
of increasing investment and then came down to 0.39. However D-E ratio of Tata Steel & HZL
was less than 1 in five years as their debts were paid off.
From 2004-09, net profit margin of HZL increased from 29.9% to 47.9%. It remained the most
profit making company compared to others due to their substantial increase in sales. Profitability

iv
of ACC Ltd. varied marginally from 17.28% to 20.03%. Profit Margin of GMDC came down
from 28.04% in 2004-05 to 23.6% in 2008-09. Though sales of the company JSPL, Tata Steel
and GMDC increased, their profit percentage decreased from 2004-09 due to their decrease in
net profit.
ROI of ACC Ltd. increased from 18.16% to 37.7% in five years due to substantial increase in its
profit before tax. Similarly, ROI of GMDC increased marginally from 22.41% to 30.97% in five
years. From 2004- 06, ROI of HZL increased from 43.04% to 83.30% and in 2009 it declined to
22.69%. ROI of Tata Steel was highest in 2004-05 with 74.57% and then it declined to 23.62%.
Similarly ROI of JSPL decreased from 52.31% to 39.44%.

v
CONTENTS
Sl. No. Title Page No.
Chapter-01 INTRODUCTION
1
1.1 Objectives 1 Chapter -02
FINANCIAL STATEMENTS
2
2.1 Balance Sheet 2
2.1.1 Format of Balance Sheet 3 2.1.2 Contents of Balance Sheet 4
2.2 Profit and Loss Statement 9
2.2.1 Format of Profit and Loss Statement 9
2.2.2 Contents of Profit and Loss Statement 10
2.3 Financial Ratios 13
2.3.1 Objectives 13
2.3.2 Financial Ratios and their Interpretation 14
Chapter -03
DEVELOPMENT OF PROGRAMME IN C++ FOR PREPARATION OF FINANCIAL STATEMENTS & RATIOS
22
3.1 Output for preparation of Balance Sheet 22
3.2 Output for preparation of Profit & Loss Statement 23
3.3 Output for calculation of Financial Ratios 24

vi
Chapter -04
FINANCIAL RATIO ANALYSIS : CASE STUDIES
25
4.1 RATIO ANALYSIS
25
4.1.1 ACC Ltd.
25
4.1.1.1 Ratio Analysis for 2009 27 4.1.1.2 Ratio Analysis for 2008 30 4.1.1.3 Ratio Analysis for 2007 33 4.1.1.4 Summary for Balance Sheet and Profit & Loss Statement 36 4.1.2 Jindal Steel & Power Limited
37
4.1.2.1 Ratio Analysis for 2009 39 4.1.2.2 Ratio Analysis for 2008 42 4.1.2.3 Ratio Analysis for 2007 45 4.1.2.4 Summary for Balance Sheet and Profit & Loss Statement 48 4.1.3 Tata Steel
49
4.1.3.1 Ratio Analysis for 2009 51 4.1.3.2 Ratio Analysis for 2008 54 4.1.3.3 Ratio Analysis for 2007 57 4.1.3.4 Summary for Balance Sheet and Profit & Loss Statement 60 4.1.4 Hindustan Zinc Limited
61
4.1.4.1 Ratio Analysis for 2009 63 4.1.4.2 Ratio Analysis for 2008 66 4.1.4.3 Ratio Analysis for 2007 69 4.1.1.4 Summary for Balance Sheet and Profit & Loss Statement 72
4.1.5 Gujarat Mineral Development Corporation
73
4.1.5.1 Ratio Analysis for 2009 75 4.1.5.2 Ratio Analysis for 2008 78 4.1.5.3 Ratio Analysis for 2007 81 4.1.5.4 Summary for Balance Sheet and Profit & Loss Statement 84
4.2 RATIO ANALYSIS USING TURBO C++
85
4.2.1 ACC Ltd.
85
4.2.1.1 Ratio Analysis for. 2009 85 4.2.1.2 Ratio Analysis for 2008 86 4.2.1.3 Ratio Analysis for 2007 87

vii
4.2.2 Jindal Steel & Power Limited
88
4.2.2.1 Ratio Analysis for 2009 88 4.2.2.2 Ratio Analysis for 2008 89 4.2.2.3 Ratio Analysis for 2007 90 4.2.3 Tata Steel
91
4.2.3.1 Ratio Analysis for 2009 91 4.2.3.2 Ratio Analysis for 2008 92 4.2.3.3 Ratio Analysis for 2007 93 4.2.4 Hindustan Zinc Limited
94
4.2.4.1 Ratio Analysis for 2009 94 4.2.4.2 Ratio Analysis for 2008 95 4.2.4.3 Ratio Analysis for 2007 96 4.2.5 Gujarat Mineral Development Corporation
97
4.2.5.1 Ratio Analysis for 2009 97 4.2.5.2 Ratio Analysis for 2008 98 4.2.5.3 Ratio Analysis for 2007 99 4.3 RATIO ANALYSIS USING TALLY 9.0
100
4.3.1 ACC Ltd. 100 4.3.1.1 Balance Sheet & Ratio Analysis for 2009 100 4.3.1.2 Balance Sheet & Ratio Analysis for 2008 101 4.3.1.3 Balance Sheet & Ratio Analysis for 2007 102 4.3.2 Jindal Steel & Power Limited
103
4.3.2.1 Balance Sheet & Ratio Analysis for 2009 103 4.3.2.2 Balance Sheet & Ratio Analysis for 2008 104 4.3.2.3 Balance Sheet & Ratio Analysis for 2007 105 4.3.3 Tata Steel
106
4.3.3.1 Balance Sheet & Ratio Analysis for 2009 106 4.3.3.2 Balance Sheet & Ratio Analysis for 2008 107 4.3.3.3 Balance Sheet & Ratio Analysis for 2007 108
viii
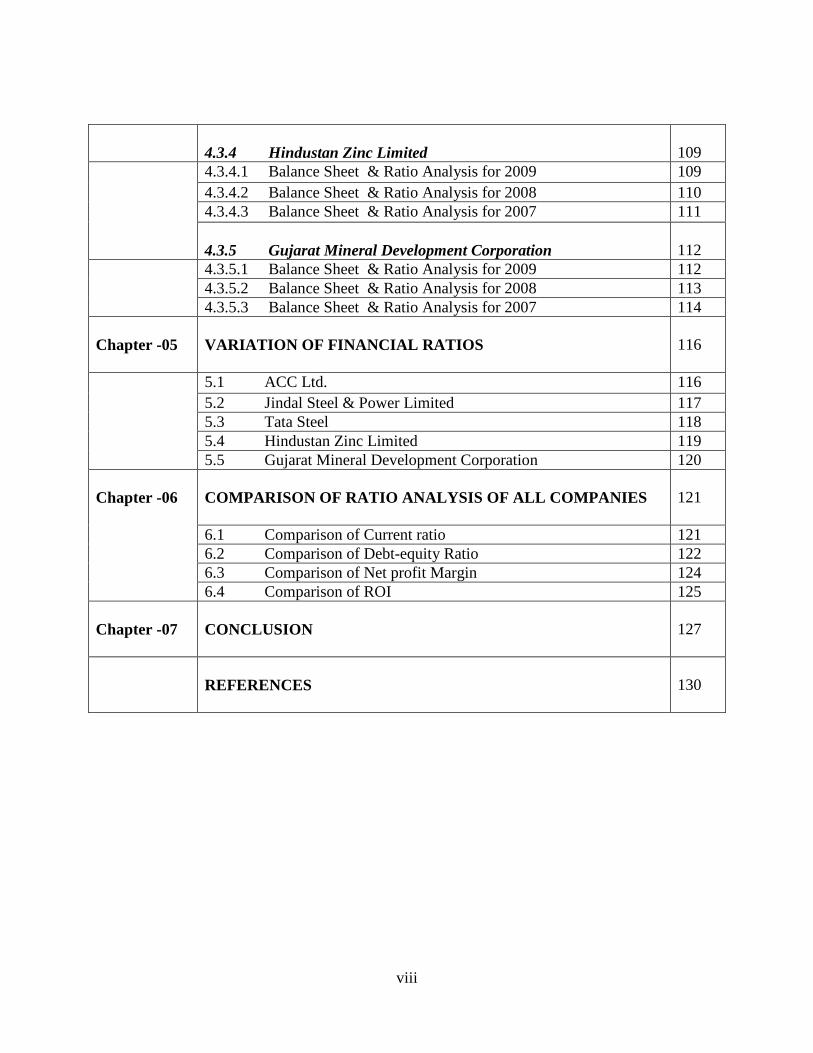
4.3.4 Hindustan Zinc Limited
109
4.3.4.1 Balance Sheet & Ratio Analysis for 2009 109 4.3.4.2 Balance Sheet & Ratio Analysis for 2008 110 4.3.4.3 Balance Sheet & Ratio Analysis for 2007 111 4.3.5 Gujarat Mineral Development Corporation
112
4.3.5.1 Balance Sheet & Ratio Analysis for 2009 112 4.3.5.2 Balance Sheet & Ratio Analysis for 2008 113 4.3.5.3 Balance Sheet & Ratio Analysis for 2007 114
Chapter -05
VARIATION OF FINANCIAL RATIOS
116
5.1 ACC Ltd. 116 5.2 Jindal Steel & Power Limited 117 5.3 Tata Steel 118 5.4 Hindustan Zinc Limited 119 5.5 Gujarat Mineral Development Corporation 120
Chapter -06
COMPARISON OF RATIO ANALYSIS OF ALL COMPANIES
121
6.1 Comparison of Current ratio 121 6.2 Comparison of Debt-equity Ratio 122 6.3 Comparison of Net profit Margin 124 6.4 Comparison of ROI 125
Chapter -07
CONCLUSION
127
REFERENCES
130

ix
LIST OF TABLES
Sl. No. Title Page No.
Table 2.1 Balance Sheet Statement 3
Table 2.2 Profit & Loss Statement 9
Table 2.3 Different Financial Ratios 14
Table 4.1 Balance Sheet of ACC Ltd. 25
Table 4.2 Profit & Loss Statement of ACC Ltd. 26
Table 4.3 Analysis of Financial Ratios for 2009 27
Table 4.4 Analysis of Financial Ratios for 2008 30
Table 4.5 Analysis of Financial Ratios for 2007 33
Table 4.6 Summary of Balance Sheet 36
Table 4.7 Summary of Profit & Loss Statement 36
Table 4.8 Balance Sheet of Jindal Steel & Power Ltd. 37
Table 4.9 Profit & Loss Statement of Jindal Steel & Power Ltd. 38
Table 4.10 Analysis of Financial Ratios for 2009 39
Table 4.11 Analysis of Financial Ratios for 2008 42
Table 4.12 Analysis of Financial Ratios for 2007 45
Table 4.13 Summary of Balance Sheet 48
Table 4.14 Summary of Profit & Loss Statement 48
Table 4.15 Balance Sheet of Tata Steel 49
Table 4.16 Profit & Loss Statement of Tata Steel 50
Table 4.17 Analysis of Financial Ratios for 2009 51
Table 4.18 Analysis of Financial Ratios for 2008 54
Table 4.19 Analysis of Financial Ratios for 2007 57

x
Table 4.20 Summary of Balance Sheet 60
Table 4.21 Summary of Profit & Loss Statement 60
Table 4.22 Balance Sheet of Hindustan Zinc Ltd. 61
Table 4.23 Profit & Loss Statement Hindustan Zinc Ltd. 62
Table 4.24 Analysis of Financial Ratios for 2009 63
Table 4.25 Analysis of Financial Ratios for 2008 66
Table 4.26 Analysis of Financial Ratios for 2007 69
Table 4.27 Summary of Balance Sheet 72
Table 4.28 Summary of Profit & Loss Statement 72
Table 4.29 Balance Sheet of GMDC 73
Table 4.30 Profit & Loss Statement GMDC 74
Table 4.31 Analysis of Financial Ratios for 2009 75
Table 4.32 Analysis of Financial Ratios for 2008 78
Table 4.33 Analysis of Financial Ratios for 2007 81
Table 4.34 Summary of Balance Sheet 84
Table 4.35 Summary of Profit & Loss Statement 84
Table 6.1 Comparison of Current ratio 121
Table 6.2 Comparison of Debt –Equity ratio 122
Table 6.3 Comparison of Net –Profit Margin 124
Table 6.4 Comparison of ROI 125

xi
LIST OF FIGURES
Fig. 3.1 Preparation of Balance Sheet 22
Fig. 3.2 Calculation of Profit & Loss Statement 23
Fig. 3.3 Calculation of Financial Ratios 24
Fig. 4.1 Ratio Analysis of ACC Ltd. for 2009 85
Fig. 4.2 Ratio Analysis of ACC Ltd. for 2008 86
Fig. 4.3 Ratio Analysis of ACC Ltd. for 2007 87
Fig. 4.4 Ratio Analysis of JSPL for 2009 88
Fig. 4.5 Ratio Analysis of JSPL for 2008 89
Fig. 4.6 Ratio Analysis of JSPL for 2007 90
Fig. 4.7 Ratio Analysis of Tata Steel for 2009 91
Fig. 4.8 Ratio Analysis of Tata Steel for 2008 92
Fig. 4.9 Ratio Analysis of Tata Steel for 2007 93
Fig. 4.10 Ratio Analysis of HZL for 2009 94
Fig. 4.11 Ratio Analysis of HZL for 2008 95
Fig. 4.12 Ratio Analysis of HZL for 2007 96
Fig. 4.13 Ratio Analysis of GMDC for 2009 97
Fig. 4.14 Ratio Analysis of GMDC for 2008 98
Fig. 4.15 Ratio Analysis of GMDC for 2007 99
Fig. 4.16 Preparation of Balance Sheet of ACC Ltd. for 2009 100
Fig. 4.17 Ratio Analysis of ACC Ltd. for 2009 101
Fig. 4.18 Preparation of Balance Sheet of ACC Ltd. for 2008 101
Fig. 4.19 Ratio Analysis of ACC Ltd. for 2008 102
Fig. 4.20 Preparation of Balance Sheet of ACC Ltd. for 2007 102
Fig. 4.21 Ratio Analysis of ACC Ltd. for 2007 103

xii
Fig. 4.22 Preparation of Balance Sheet of JSPL for 2009 103
Fig. 4.23 Ratio Analysis of JSPL for 2009 104
Fig. 4.24 Preparation of Balance Sheet of JSPL for 2008 104
Fig. 4.25 Ratio Analysis of JSPL for 2008 105
Fig. 4.26 Preparation of Balance Sheet of JSPL for 2007 105
Fig. 4.27 Ratio Analysis of JSPL for 2007 106
Fig. 4.28 Preparation of Balance Sheet of Tata Steel for 2009 106
Fig. 4.29 Ratio Analysis of Tata Steel for 2009 107
Fig. 4.30 Preparation of Balance Sheet of Tata Steel for 2008 107
Fig. 4.31 Ratio Analysis of Tata Steel for 2008 108
Fig. 4.32 Preparation of Balance Sheet of Tata Steel for 2007 108
Fig. 4.33 Ratio Analysis of Tata Steel for 2007 109
Fig. 4.34 Preparation of Balance Sheet of HZL for 2009 109
Fig. 4.35 Ratio Analysis of HZL for 2009 110
Fig. 4.36 Preparation of Balance Sheet of HZL for 2008 110
Fig. 4.37 Ratio Analysis of HZL for 2008 111
Fig. 4.38 Preparation of Balance Sheet of HZL for 2007 111
Fig. 4.39 Ratio Analysis of HZL for 2007 112
Fig. 4.40 Preparation of Balance Sheet of GMDC for 2009 112
Fig. 4.41 Ratio Analysis of GMDC for 2009 113
Fig. 4.42 Preparation of Balance Sheet of GMDC for 2008 113
Fig. 4.43 Ratio Analysis of GMDC for 2008 114
Fig. 4.44 Preparation of Balance Sheet of GMDC for 2007 114
Fig. 4.45 Ratio Analysis of GMDC for 2007 115

xiii
Fig. 5.1 Variation of ratios of ACC Ltd. 116
Fig. 5.2 Variation of ratios of Jindal Steel & Power Ltd. 117
Fig. 5.3 Variation of ratios of Tata Steel 118
Fig. 5.4 Variation of ratios of HZL 119
Fig. 5.5 Variation of ratios of GMDC 120
Fig. 6.1 Comparison of Current ratio of all companies 122
Fig. 6.2 Comparison of Debt- Equity ratio of all companies 123
Fig. 6.3 Comparison of Net Profit Margin of all companies 124
Fig. 6.4 Comparison of ROI of all companies 126
- 1 -
CHAPTER- 01
INTRODUCTION
Financial statements are records that provide an indication of the organization’s financial status.
It quantitatively describes the financial health of the company. It helps in the evaluation of
company’s prospects and risks for the purpose of making business decisions. The objective of
financial statements is to provide information about the financial position, performance and
changes in financial position of an enterprise that is useful to a wide range of users in making
economic decisions. Financial statements should be understandable, relevant, reliable and
comparable. They give an accurate picture of a company’s condition and operating results in a
condensed form. Reported assets, liabilities and equity are directly related to an organization's
financial position whereas reported income and expenses are directly related to an organization's
financial performance. Analysis and interpretation of financial statements helps in determining
the liquidity position, long term solvency, financial viability, profitability and soundness of a
firm. There are four basic types of financial statements: balance sheet, income statements, cash-
flow statements, and statements of retained earnings.
Mining industries are capital intensive. Hence a lot capital is invested in it. Unfortunately very
limited work has been done on analysis and interpretation of financial statements of Indian for
mining companies. An attempt has been carried out in this project to analyze and interpret the
financial statements of five coal and non- coal mining companies.
1.1 OBJECTIVES
• To understand, analyze and interpret the basic concepts of financial statements of different
mining companies.
• Interpretation of financial ratios and their significance.
• Development of programs in C++ for calculation of different financial statements and
financial ratios.
• Use of Tally 9.0 package for the analysis and interpretation of financial statements of mining
companies.

- 2 -
CHAPTER -02
FINANCIAL STATEMENTS
Financial statements (or financial reports) are formal records of the financial activities of a
business, person, or other entity. Financial statements provide an overview of a business or
person's financial condition in both short and long term. All the relevant financial information of
a business enterprise, presented in a structured manner and in a form easy to understand is called
the financial statements. There are four basic financial statements:
1. Balance sheet: It is also referred to as statement of financial position or condition, reports on a
company's assets, liabilities, and Ownership equity as of a given point in time.
2. Income statement: It is also referred to as Profit and Loss statement (or "P&L"), reports on a
company's income, expenses, and profits over a period of time. Profit & Loss account provide
information on the operation of the enterprise. These include sale and the various expenses
incurred during the processing state.
3. Statement of Retained Earnings: It explains the changes in a company's retained earnings
over the reporting period.
4. Cash Flow Statement: It reports on a company's cash flow activities, particularly its
operating, investing and financing activities.
2.1 BALANCE SHEET
In financial accounting, a balance sheet or statement of financial position is a summary of a
person's or organization's balances. A balance sheet is often described as a snapshot of a
company's financial condition. It summarizes a company's assets, liabilities and shareholders'
equity at a specific point in time. These three balance sheet segments give investors an idea as to
what the company owns and owes, as well as the amount invested by the shareholders. Of the
four basic financial statements, the balance sheet is the only statement which applies to a single
point in time.
A company balance sheet has three parts: assets, liabilities and ownership equity. The main
categories of assets are usually listed first and are followed by the liabilities. The difference
between the assets and the liabilities is known as equity or the net assets or the net worth or
- 3 -
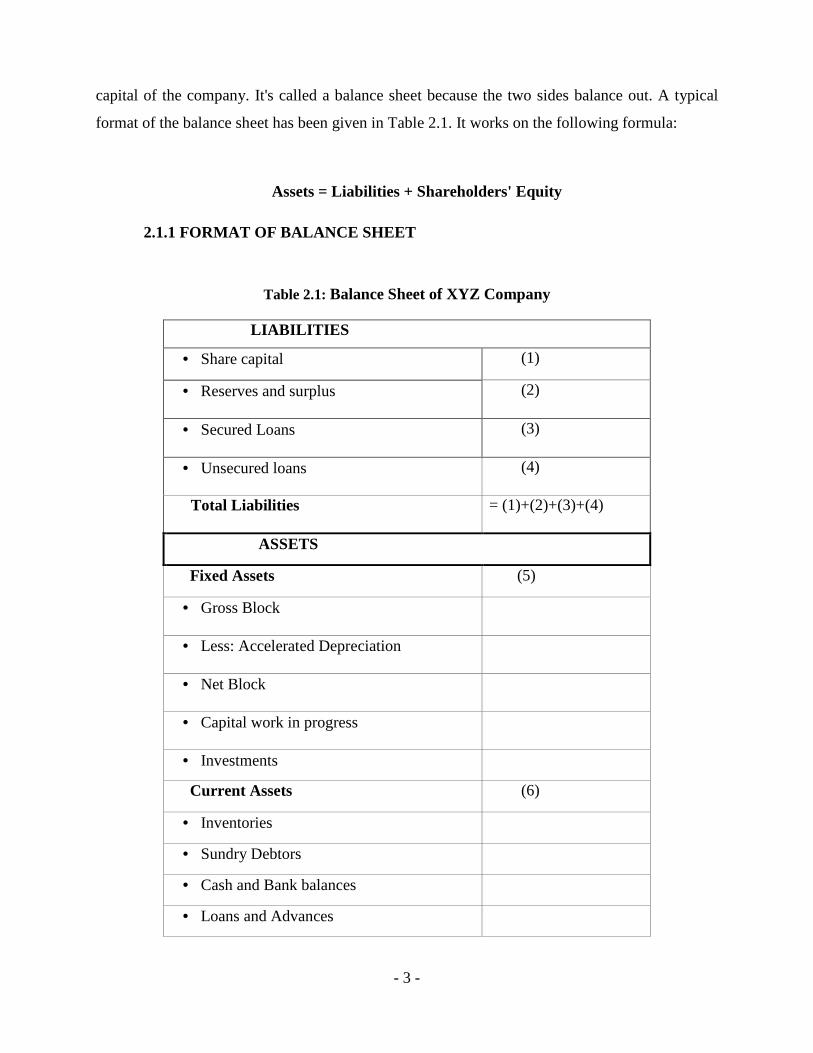
capital of the company. It's called a balance sheet because the two sides balance out. A typical
format of the balance sheet has been given in Table 2.1. It works on the following formula:
Assets = Liabilities + Shareholders' Equity
2.1.1 FORMAT OF BALANCE SHEET
Table 2.1: Balance Sheet of XYZ Company
LIABILITIES
• Share capital (1)
• Reserves and surplus
(2)
• Secured Loans
(3)
• Unsecured loans
(4)
Total Liabilities
= (1)+(2)+(3)+(4)
ASSETS
Fixed Assets (5)
• Gross Block
• Less: Accelerated Depreciation
• Net Block
• Capital work in progress
• Investments
Current Assets (6)
• Inventories
• Sundry Debtors
• Cash and Bank balances
• Loans and Advances

- 4 -
Current Liabilities (7)
• Current liabilities
• Provisions
Net Current Assets (6) – (7) = (8)
Total Assets = (5) +(8)
2.1.2 CONTENTS OF BALANCE SHEET
(A) Assets
In business and accounting, assets are economic resources owned by business or company. Any
property or object of value that one possesses, usually considered as applicable to the payment of
one's debts is considered an asset. Simplistically stated, assets are things of value that can be
readily converted into cash.
The balance sheet of a firm records the monetary value of the assets owned by the firm. It is
money and other valuables belonging to an individual or business.
Types of Assets
Two major types:
• Tangible assets
• Intangible assets
Tangible Assets
Tangible assets are those have a physical substance, such as equipment and real estate.
Intangible Assets
Intangible assets lack physical substance and usually are very hard to evaluate. Assets which do
not possess any material value.
They include patents, copyrights, franchises, goodwill, trademarks, trade names, etc.

- 5 -
Types of Tangible Assets
• Fixed assets.
• Current assets.
Fixed Assets
This group includes land, buildings, machinery, vehicles, furniture, tools, and certain wasting
resources e.g., timberland and minerals.
It is also referred to as PPE (property, plant, and equipment), these are purchased for continued
and long-term use in earning profit in a business.
Current Assets
Current assets are cash and other assets expected to be converted to cash, sold, or consumed
either in a year or in the operating cycle. These assets are continually turned over in the course of
a business during normal business activity. There are 5 major items included into current assets:
• Cash and Cash Equivalents
It is the most liquid asset, which includes currency, deposit accounts, and negotiable
instruments (e.g., money orders, cheque, bank drafts).
• Short-term Investments
It includes securities bought and held for sale in the near future to generate income on short-
term price differences (trading securities).
• Receivables
It is usually reported as net of allowance for uncollectable accounts.
• Inventory
The raw materials, work-in-process goods and completely finished goods that are
considered to be the portion of a business's assets that are ready or will be ready for sale.
• Prepaid Expenses
These are expenses paid in cash and recorded as assets before they are used or consumed (a
common example is insurance). The phrase net current assets (also called working capital) is
often used and refers to the total of current assets less the total of current liabilities.

- 6 -
I. Gross Block
Gross block is the sum total of all assets of the company valued at their cost of acquisition. This
is inclusive of the depreciation that is to be charged on each asset. Net block is the gross block
less accumulated depreciation on assets. Net block is actually what the asset are worth to the
company.
II. Capital Work in Progress
Work that has not been completed but has already incurred a capital investment from the
company. This is usually recorded as an asset on the balance sheet. Work in progress indicates
any good that is not considered to be a final product, but must still be accounted for because
funds have been invested toward its production.
III. Investments
• Shares And Securities , such as bonds, common stock, or long-term notes
• Associate Companies
• Fixed deposits with banks/finance companies
• Investments in special funds (e.g., sinking funds or pension funds).
• Investments in fixed assets not used in operations (e.g., land held for sale).
Remark: While fixed deposits with banks are considered as fixed assets, the investments in
associate concerns are treated as non current assets.
IV. Loans and Advances include
• House building advance
• Car, scooter, computer etc. advance
• Multi purpose advance
• Transfer travelling allowance advance
• Tour travelling allowance advance
• DRS payment.

- 7 -
V. Reserves
• Subsidy Received From The Govt.
• Development Rebate reserve
• Issue of Shares at Premium
• General Reserves
(B) Liability
A liability is a debt assumed by a business entity as a result of its borrowing activities or other
fiscal obligations (such as funding pension plans for its employees). Liabilities are debts and
obligations of the business they represent creditors claim on business assets.
Types of Liabilities
Current Liabilities
Current liabilities are short-term financial obligations that are paid off within one year or one
current operating cycle. These liabilities are reasonably expected to be liquidated within a year.
It includes:
• Accrued expenses as wages, taxes, and interest payments not yet paid
• Accounts payable
• Short-term notes
• Cash dividends and
• Revenues collected in advance of actual delivery of goods or services.
Long-Term Liabilities
Liabilities that are not paid off within a year, or within a business's operating cycle, are known
as long-term or non-current liabilities. Such liabilities often involve large sums of money
necessary to undertake opening of a business, major expansion of a business, replace assets, or
- 8 -
make a purchase of significant assets. These liabilities are reasonably expected not to be
liquidated within a year. It includes :
• Notes payable- debt issued to a single investor.
• Bonds payable – debt issued to general public or group of investors.
• Mortgages payable.
• Capital lease obligations – contract to pay rent for the use of plant, property or equipments.
• deferred income taxes payable, and
• pensions and other post-retirement benefits.
Contingent Liabilities
A third kind of liability accrued by companies is known as a contingent liability. The term refers
to instances in which a company reports that there is a possible liability for an event, transaction,
or incident that has already taken place; the company, however, does not yet know whether a
financial drain on its resources will result. It also is often uncertain of the size of the financial
obligation or the exact time that the obligation might have to be paid.
Fixed Liability
The liability which is to be paid of at the time of dissolution of firm is called fixed liability.
Examples are Capital, Reserve and Surplus.
Secured Loans
A secured loan is a loan in which the borrower pledges some asset (e.g. a car or property)
as collateral for the loan, which then becomes a secured debt owed to the creditor who gives the
loan.
Unsecured Loans
An unsecured loan is a loan that is not backed by collateral. Also known as signature
loan or personal loan. Unsecured loans are based solely upon the borrower's credit rating. An
unsecured loan is considered much cheaper and carries less risk to the borrower. However, when
an unsecured loan is granted, it does not necessarily have to be based on a credit score.

- 9 -
2.2 PROFIT & LOSS STATEMENT
Income statement, also called profit and loss statement (P&L) and Statement of Operations
is financial statement that summarizes the revenues, costs and expenses incurred during a
specific period of time - usually a fiscal quarter or year. These records provide information that
shows the ability of a company to generate profit by increasing revenue and reducing costs. The
purpose of the income statement is to show managers and investors whether the company made
or lost money during the period being reported. The important thing to remember about an
income statement is that it represents a period of time. This contrasts with the balance sheet,
which represents a single moment in time. A typical format of the Profit & Loss Statement has
been given in Table 2.2.
2.2.1 FORMAT OF PROFIT & LOSS STATEMENT
Table 2.2: Profit & Loss Statement of XYZ Company
Turnover
Cost of sales
Gross Profit
Distribution cost
Administration Expenses
Other income
Operating Profit
Income from other investments
Profit before interest
Net interest
Profit before Tax
Tax Payable

- 10 -
Profit after tax
Dividend
Retained profit
2.2.2 CONTENTS OF PROFIT & LOSS STATEMENT
(a) Revenue - Cash inflows or other enhancements of assets of an entity during a period from
delivering or producing goods, rendering services, or other activities that constitute the entity's
ongoing major operations.
(b) Expenses - Cash outflows or other using-up of assets or incurrence of liabilities during a
period from delivering or producing goods, rendering services, or carrying out other activities
that constitute the entity's ongoing major operations.
(c) Turnover
The main source of income for a company is its turnover, primarily comprised of sales of its
products and services to third-party customers.
(d) Sales
Sales are normally accounted for when goods or services are delivered and invoiced, and
accepted by the customer, even if payment is not received until some time later, even in a
subsequent trading period.
(e) Cost of Sales (COS)
The sum of direct costs of goods sold plus any manufacturing expenses relating to the sales (or
turnover) is termed cost of sales, or production cost of sales, or cost of goods sold. These costs
include:
• costs of raw materials stocks
• costs of inward-bound freight paid by the company

- 11 -
• Packaging costs
• direct production salaries and wages
• production expenses, including depreciation of trading-related fixed assets.
(f) Other Operating Expenses
These are not directly related to the production process, but contributing to the activity of the
company, there are further costs that are termed ‘other operating expenses’.
These comprises of costs like:
• Distribution costs and selling costs,
• Administration costs, and
• Research and development costs (unless they relate to specific projects and the costs may be
deferred to future periods).
(g) Other Operating Income
Other operating income includes all other revenues that have not been included in other parts of
the profit and loss account. It does not include sales of goods or services, reported turnover, or
any sort of interest receivable, reported within the net interest category.
(h) Gross Margin (or Gross Profit)
The difference between turnover, or sales, and COS is gross profit or gross margin. It needs to be
positive and large enough to at least cover all other expenses.
(i) Operating Profit (OP)
The operating profit is the net of all operating revenues and costs, regardless of the financial
structure of the company and whatever exceptional events occurred during the period that
resulted in exceptional costs. The profit earned from a firm's normal core business operations.
Also known as Earnings before Interest and Tax (EBIT).
OP = Turnover - COS - other Operating Expenses + Other Operating Income

- 12 -
(j) Profit before Tax (PBT)
A profitability measure that looks at a company's profits before the company has to pay
corporate income tax. This measure deducts all expenses from revenue including interest
expenses and operating expenses, but it leaves out the payment of tax.
(k) Profit after Tax (PAT)
PAT, or net profit, is the profit on ordinary activities after tax. The final charge that a company
has to suffer, provided it has made sufficient profits, is therefore corporate taxation.
PAT = PBT - Corporation Tax
(l) Retained Profit
The retained profit for the year is what is left on the profit and loss account after deducting
dividends for the year. The balance on the profit and loss account forms part of the capital (or
equity, or shareholders’ funds) of the company

- 13 -
2.3 FINANCIAL RATIOS
2.3.1 OBJECTIVES
The importance of ratio analysis lies in the fact that it presents data on a comparative basis and
enables the drawing of inferences regarding the performance of the firm. Ratio analysis helps in
concluding the following aspects:
Liquidity Position:
Ratio analysis helps in determining the liquidity position of the firm. A firm can be said to have
the ability to meet its current obligations when they become due. It is measured with the help of
liquidity ratios.
Long- Term Solvency:
Ratio analysis helps in assessing the long term financial viability of a firm. Long- term solvency
measured by leverage/capital structure and profitability ratios.
Operating Efficiency:
Ratio analysis determines the degree of efficiency of management and utilization of assets. It is
measured by the activity ratios.
Over-All Profitability:
The management of the firm is concerned about the overall profitability of the firm which
ensures a reasonable return to its owners and optimum utilization of its assets. This is possible if
an integrated view is taken and all the ratios are considered together.
Inter- firm Comparison:
Ratio analysis helps in comparing the various aspects of one firm with the other.

- 14 -
2.3.2 FINANCIAL RATIOS AND THEIR INTERPRETATION
Table 2.3: Different Financial Ratios
Sl.No. CATEGORY TYPES OF RATIO INTERPRETATION
1.
2.
Liquidity ratios
Net Working Capital = Current assets-current liabilities
• It measures the liquidity of a firm.
Current ratio =
Current Assets
Current Liabilities
• It measures the short term liquidity of a firm. A firm with a higher ratio has better liquidity. • A ratio of 2:1 is considered safe.
Acid test or Quick ratio =
Quick assets
Current Liabilities
• It measures the liquidity position of a firm . • A ratio of 1:1 is considered safe.
Turnover ratios
Inventory Turnover ratio =
Costs of good sold
Average inventory
• This ratio indicates how fast inventory is sold. • A firm with a higher ratio has better liquidity.
Debtor Turnover ratio =
Net credit sales
Average debtors
• This ratio measures how fast debts are collected. • A high ratio indicates shorter time lag between credit sales and cash collection.
Creditor’s Turnover ratio =
Net credit purchases
Average Creditors
• A high ratio shows that accounts are to be settled rapidly.

- 15 -
Sl.No.
CATEGORY TYPES OF RATIO
INTERPRETATION
3.
Capital Structure Ratios
Debt-Equity ratio =
Long term debt
shareholder�s Equity
• This ratio indicates the relative proportions of debt and equity in financing the assets of a firm. • A ratio of 1:1 is considered safe.
Debt to Total capital ratio =
Long term debt
Permanent Capital
Or
Total debt
Permanent capital + Current liabilities Or
Total Shareholder′s Equity
Total Assets
• It indicates what proportion of the permanent capital of a firm consists of long-term debt. • A ratio 1:2 is considered safe.
• It measures the share of the total assets financed by outside funds. • A low ratio is desirable for creditors.
• It shows what portion of the total assets is financed by the owners’ capital. • A firm should neither have a high ratio nor a low ratio.

- 16 -
Sl.No. CATEGORY TYPES OF RATIO
INTERPRETATION
4.
Coverage ratios
Interest Coverage =
Earning before Interests and Tax
interest
• A ratio used to determine how easily a company can pay on outstanding debt. • A ratio of more than 1.5 is satisfactory.
Dividend Coverage =
Earning after tax
Preference Dividend
• It measures the ability of firm to pay dividend on preference shares. • A high ratio is better for creditors.
Total Coverage ratio =
Earning before interests and tax
Total &ixed charges
• It shows the overall ability of the firm to fulfill the liabilities. • A high ratio indicates better ability.
- 17 -
Sl. No. CATEGORY TYPES OF RATIO
INTERPRETATION
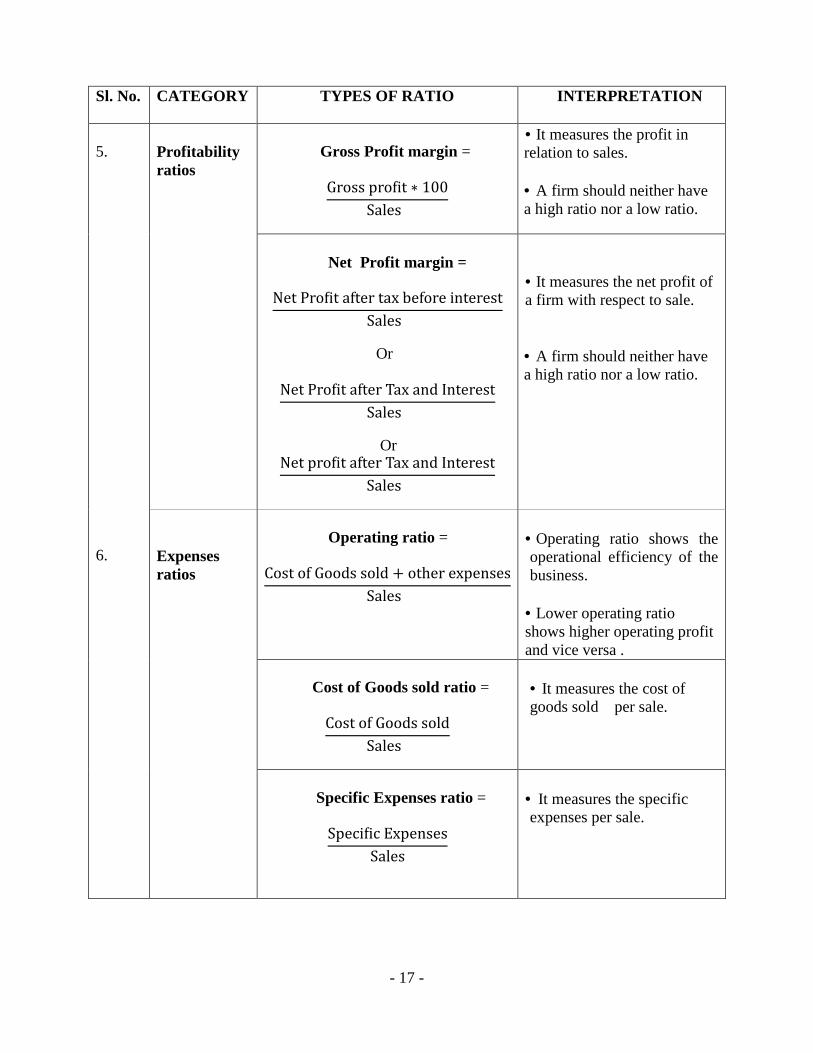
5. 6.
Profitability ratios
Gross Profit margin =
Gross pro&it ∗ 100
Sales
• It measures the profit in relation to sales. • A firm should neither have a high ratio nor a low ratio.
Net Profit margin =
Net Pro&it after tax before interest
Sales
Or
Net Pro&it after Tax and Interest
Sales
Or
Net pro&it after Tax and Interest
Sales
• It measures the net profit of a firm with respect to sale. • A firm should neither have a high ratio nor a low ratio.
Expenses ratios
Operating ratio = Cost of Goods sold + other expenses
Sales
• Operating ratio shows the operational efficiency of the business.
• Lower operating ratio shows higher operating profit and vice versa .
Cost of Goods sold ratio =
Cost of Goods sold
Sales
• It measures the cost of goods sold per sale.
Specific Expenses ratio =
Speci&ic Expenses
Sales
• It measures the specific expenses per sale.

- 18 -
Sl.No. CATEGORY TYPES OF RATIO INTERPRETATION
7.
Return on Investments
Return on Assets (ROA) =
Net Pro&it after Taxes ∗ 100
Total Assets
Or
(Net Pro&it after Taxes + Interest) ∗ 100
Total Assets
Or
(Net pro&it after Taxes + Interest) ∗ 100
Tangible Assets
Or
(Net Pro&it after Taxes + Interest) ∗ 100
Total Assets
Or
( Net Pro&it after Taxes + Interest) ∗ 100
Fixed Assets
• It measures the profitability of the total funds per investment of a firm.
Return on Capital Employed (ROCE) =
(Net Pro&it after Taxes) ∗ 100
total capital employed
Or
(Net Pro&it after Taxes + Interest) ∗ 100
Total Capital Employed
Or
(Net Pro&it after Taxes + Interest) ∗ 100
Total Capital Employed − Intangible assets
• It measures profitability of the firm with respect to the total capital employed. • The higher the ratio, the more efficient use of capital employed.

- 19 -
Sl.No. CATEGORY TYPES OF RATIO INTERPRETATION
8.
Return on Total Shareholders’ Equity =
Net Pro&it after Taxes ∗ 100
Total shareholders equity
• It reveals how profitably the owner’s fund has been utilized by the firm.
Return on Ordinary shareholders equity = Net pro&it after taxes and Pref. dividend ∗ 100
Ordinary Shareholders Equity
• It determines whether the firm has earned satisfactory return for its equity holders or not.
Shareholder’s ratios
Earnings per Share (EPS) =
Net Pro&it of Equityholders
Number of Ordinary Shares
• It measures the profit available to the equity holders on a per share basis.
Dividend per Share (DPS) =
Net pro&its after interest and preference
dividend paid to ordinary shareholders
Number of ordinary shares outstanding
• It is the net distributed profit belonging to the shareholders divided by the number of ordinary shares.
Dividend Payout ratio (D/P) =
Total Dividend To Equityholders
Total net pro&it of equityholders
Or
Dividend per Ordinary Share
Earnings per Share
• It shows what percentage share of the net profit after taxes and preference dividend is paid to the equity holders. A high D/P ratio is preferred from investor’s point of view.

- 20 -
9.
Earnings per Yield =
Earnings per Share
Market Value per Share
• It shows the percentage of each rupee invested in the stock that was earned by the company.
Dividend Yield =
Dividend per share
Market Value per share
• It shows how much a company pays out in dividends each year relative to its share price.
Price- Earnings ratio (P/E) =
Market value per Share
Earnings per Share
• It reflects the price currently paid by the market for each rupee of EPS. • Higher the ratio better it is for owners.
Earning Power =
Net pro&it after Taxes
Total Assets
• It measures the overall profitability and operational efficiency of a firm.
Activity Ratios
Inventory t urnover =
Sales
Closing Inventory
• It measures how quickly inventory is sold.
• A firm should neither have a high ratio nor a low ratio.
Raw Material turnover =
Cost of Raw Material used
Average Raw Material Inventory
Work in Progress turnover = Cost of Goods manufactured
Average Work in process inventory
Debtors turnover =
Cost of Goods manufactured
Average Work in Process Inventory
• It shows how quickly current assets i.e receivables or debtors are converted to cash. • A firm should neither have a high ratio nor a low ratio.

- 21 -
Sl. No.
CATEGORY
TYPES OF RATIO
INTERPRETATION
10.
Assets Turnover Ratios
Total Assets turnover =
Cost of Goods Sold
Total Assets
• It measures the efficiency of a firm in managing and utilizing its assets.
• Higher the ratio, more efficient is the firm in utilizing its assets.
Fixed Assets turnover =
Cost of Goods Sold
Fixed Assets
Capital turnover =
Cost of Goods Sold
Capital Employed
Current Assets turnover =
Cost of Goods Sold
Current Assets

- 22 -
CHAPTER -03
DEVELOPMENT OF PROGRAMME IN C++ FOR PREPARATION OF FINANCIAL STATEMENTS & RATIOS
The program for preparation of financial statements & calculation of financial ratios have been
developed in turbo C++ and the output has been given below:
3.1 Output for Preparation of Balance Sheet
(This data has been taken from Table 4.20: Balance Sheet, Section 4.1.4 Hindustan Zinc Ltd.)
Fig. 3.1: Preparation of Balance Sheet

- 23 -
3.2 Output for Preparation of Profit & Loss Statement
(This data has been taken from Table 4.21: Profit & Loss Statement, Section 4.1.4: HZL.)
Fig. 3.2: Calculation of P & L Statement

- 24 -
3.3 Output for Calculation of Financial Ratios
(This data has been taken from Table 4.8 and 4.9, Section 4.1.2: Jindal Steel & Power.)
Fig. 3.3: Calculation of Financial Ratios

- 25 -
CHAPTER- 04
FINANCIAL RATIO ANALYSIS
The ratio analysis of five companies from 2007-09 has been carried out below.
4.1 RATIO ANALYSIS
4.1.1 ACC Ltd.
Table 4.1: Balance Sheet of ACC Ltd. as at 31st Dec-2009
(Source: http://economictimes.indiatimes.com/bsheet.cms)
Liabilities Dec- 2009
(Rs in millions) Dec- 2008
(Rs in millions) Dec- 2007
(Rs in millions) Share Capital 1880.20 1,878.80 1,879.30
Reserves & Surplus 58282 47,398.50 39,647.80
Net Worth (1) 60162.20 49,277.30 41,527.10
Secured Loans (2) 5500 4,500.00 2,660.30
Unsecured Loans (3) 169.20 320.30 403.80
Total Liabilities 65831.40 54,097.60 44,591.20
Assets Dec- 2009 Dec- 2008 Dec- 2007
Gross Block 68262.70 58,356.70 54,640.70
(-) Acc. Depreciation 26679.80 23,659.70 21,493.50
Net Block (A) 41582.90 34,697.00 33,147.20
Capital Work in Prgs. 21562.10 16,028.60 6,491.90
Investments (C) 14756.40 6,790.80 8,448.10
Inventories 7,789.80 7,932.70 7,308.60
Sundry Debtors 2,037.00 3,101.70 2,892.90
Cash And Bank 7,463.80 9,842.40 7,434.80
Loans And Advances 7,145.50 7,797.60 5,443.10
(i) 24,436.10 28,674.40 23,079.40
Current Liabilities 25,587.30 22,453.90 19,912.70
Provisions 10,918.80 9,639.30 6,662.70
(ii) 36,506.10 32,093.20 26,575.40
Net Curr. Assets -12,070.00 -3,418.80 -3,496.00
Misc. Expenses (E) 0.0 0.00 0.00
Total Assets 65,831.40 54,097.60 44,591.20

- 26 -
Table 4.2: Profit & Loss Statement
(Source: http://economictimes.indiatimes.com/profitloss.cms)
Dec - 2009
(Rs in millions) Dec - 2008
(Rs in millions) Dec - 2007
(Rs in millions)
Sales
80,215.90 72,299.70 68,947.90
Other Income
1,361.70 2,115.90 1,422.40
Total Income 81,577.60 74,415.60 70,370.30
Raw Material Cost
12,046.80 11,801.50 18,367.20
Excise 7,815.80 10,702.10 9,703.20
Other Expenses
34,722.20 31,963.30 21,463.20
Operating Profit
25,631.10 17,832.80 19,414.30
Interest Name
843.00 399.60 738.70
Gross Profit
24,788.10 17,433.20 18,675.60
Depreciation 3,420.90 2,941.80 3,054.30
Profit Bef. Tax
22,728.90 16,607.30 17,028.20
Tax 6,889.30 5,246.00 4,917.00
Net Profit 15,839.60 11,361.30 12,111.20
Other Non- Recurring Income
227.70 766.40 2,269.50
Reported Profit
16,067.30 12,127.70 14,380.70
Equity Dividend
4,317.60 3,753.30 3,750.20

- 27 -
4.1.1.1 Ratio analysis for 2009
Table 4.3: Analysis of Financial Ratios for 2009
Sl.No.
Ratios
Particulars (Rs in millions)
Values Remarks
01.
Net Working Capital =
Current assets-Current liabilities
Current Assets = 24,436.10 Current Liabilities = 36,506.10
-12070
Liquidity position is
not good.
02.
Current Ratio =
Current Assets
Current Liabilities
Current Assets = 24,436.10 Current Liabilities = 36,506.10
0.66
It is not safe.
03.
Acid test or Quick ratio =
Quick Assets
Current Liabilities
Quick Assets = 16646.3 Current Liabilities = 36,506.10
0.45
It is not good.
04.
Debt-Equity Ratio =
Long term debt
Shareholder�s Equity
Total debt = 5669.2 Shareholder Equity = 60162.20
0.09
It is not safe.
05.
Interest Coverage =
Operating Pro&it
Interest
Operating Profit = 25,631.10 Interest = 843.00
30.40
It is satisfactory.
06.
Operating Profit margin =
Operating Pro&it ∗ 100
Sales
Operating Profit = 25,631.10 Sales = 80,215.90
31.9%
It is not satisfactory.

- 28 -
Sl.No.
Ratios
Particulars (Rs in millions)
Values Remarks
07.
Gross Profit margin =
Gross Pro&it ∗ 100
Sales
Gross Profit = 24,788.10 Sales = 80,215.90
30.9 %
It is not satisfactory.
08.
Net Profit margin =
Net Pro&it ∗ 100
Sales
Net Profit = 16,067.30 Sales = 80,215.90
20.03%
It is not satisfactory.
09.
Return on Assets =
Operating Pro&it ∗ 100
Average Assets
Operating Profit = 25,631.10 Average Assets = 94264.15
27.19 %
It is not good.
10.
Return on Investments =
Net Pro&it before Tax ∗ 100
Net Worth
Profit Before Tax = 22,728.90 Net Worth = 60162.20
37.7 %
It is not good.
11.
Return on Net Worth =
Net Pro&it ∗ 100
Average Net worth
Net profit = 15,839.60 Average Net Worth = 54719.75
28.94%
It is not safe.
- 29 -
Sl.No.
Ratios
Particulars (Rs in millions)
Values Remarks
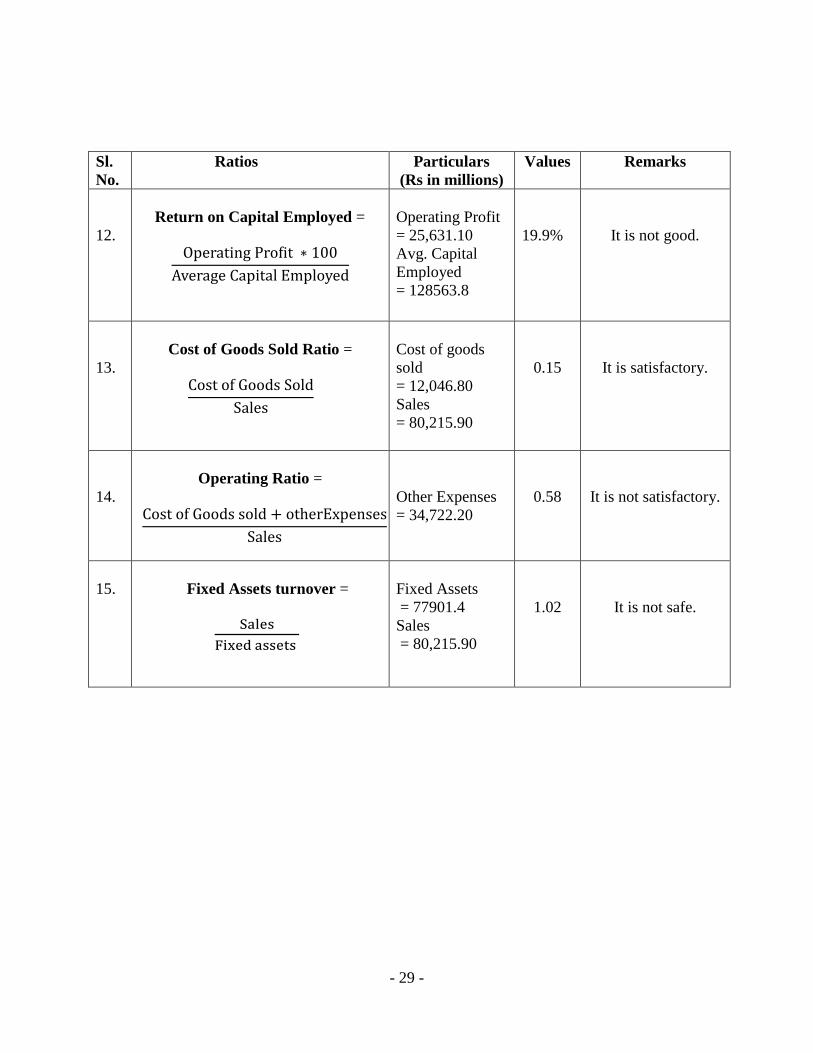
12.
Operating Pro&it ∗ 100
Average Capital Employed
Return on Capital Employed =
Operating Profit = 25,631.10 Avg. Capital Employed = 128563.8
19.9%
It is not good.
13.
Cost of Goods Sold
Sales
Cost of Goods Sold Ratio =
Cost of goods sold = 12,046.80 Sales = 80,215.90
0.15
It is satisfactory.
14.
Cost of Goods sold + otherExpenses
Sales
Operating Ratio =
Other Expenses = 34,722.20
0.58
It is not satisfactory.
15.
Fixed Assets turnover =
6789:
;<=9> 7::9?:
Fixed Assets = 77901.4 Sales = 80,215.90
1.02
It is not safe.

- 30 -
4.1.1.2 Ratio analysis for 2008
Table 4.4: Analysis of Financial Ratios for 2008
Sl.No.
Ratios
Particulars (Rs in millions)
Values Remarks
01.
Net Working Capital =
Current assets-Current liabilities
Current Assets =28674.40 Current Liabilities =32093.20
-3418.8
Liquidity available is less.
02.
Current Ratio =
Current Assets
Current Liabilities
Current Assets =28674.40 Current Liabilities =32093.20
0.89
It is not safe.
03.
Acid test or Quick ratio =
Quick Assets
Current Liabilities
Quick Assets = 20741.70 Current Liabilities = 32093.20
0.64
It is not satisfactory.
04.
Debt-Equity Ratio =
Long term debt
Shareholder�s Equity
Total debt = 4820.30 Shareholder Equity = 49277.30
0.10
It is not good.
05.
Interest Coverage =
Operating Pro&it
Interest
Operating Profit = 17832.80 Interest = 399.60
44.63
It is safe.
06.
Operating Profit margin =
Operating Pro&it ∗ 100
Sales
Operating Profit = 17832.80 Sales = 72299.70
24.66%
It is not safe.

- 31 -
Sl.No.
Ratios
Particulars (Rs in millions)
Values Remarks
07.
Gross Profit margin =
Gross Pro&it ∗ 100
Sales
Gross Profit = 17433.20 Sales = 72299.70
24%
It is not good.
08.
Net Profit margin =
Net Pro&it ∗ 100
Sales
Net Profit = 12127.70 Sales =72299.70
16.77%
It is not good.
09.
Return on Assets =
Operating Pro&it ∗ 100
Average Assets
Operating Profit = 17832.80 Average Assets = 78768.7
22.63%
It is not satisfactory.
10.
Return on Investments =
Net Pro&it before Tax ∗ 100
Networth
Profit Before Tax =16607.30 Net Worth = 49277.30
33.70%
It is safe.
11.
Return on Net Worth =
Net Pro&it ∗ 100
Average Net worth
Net profit = 11361.30 Average Net Worth =45402.2
25.02%
It is not satisfactory.

- 32 -
Sl.No.
Ratios
Particulars (Rs in millions)
Values Remarks
12.
Operating Pro&it ∗ 100
Average Capital Employed
Return on Capital Employed =
Operating Profit =17832.80 Avg. Capital Employed = 118013
15.11%
It is not satisfactory.
13.
Cost of Goods Sold
Sales
Cost of Goods Sold Ratio =
Cost of goods sold = 11801.50 Sales =72299.70
0.16
It is satisfactory.
14.
Cost of Goods sold + otherExpenses
Sales
Operating Ratio =
Other Expenses= 31963.3
0.60
It is not good.
15.
Fixed Assets turnover =
6789:
;<=9> 7::9?:
Fixed Assets = 57516.4 Sales = 72299.70
1.25
It is not safe.

- 33 -
4.1.1.3 Ratio Analysis for 2007
Table 4.5: Analysis of Financial Ratios for 2007
Sl.No.
Ratios
Particulars (Rs in millions)
Values Remarks
01.
Net Working Capital =
Current assets-Current liabilities
Current Assets = 23079.40 Current Liabilities = 26575.40
-3496
Liquidity available is less.
02.
Current Ratio =
Current Assets
Current Liabilities
Current Assets = 23079.40 Current Liabilities =26575.40
0.86
It is not safe.
03.
Acid test or Quick ratio =
Quick Assets
Current Liabilities
Quick Assets = 15770.8 Current Liabilities = 26575.40
0.59
It is not satisfactory.
04.
Debt-Equity Ratio =
Long term debt
Shareholder�s Equity
Total debt = 3064.1 Shareholder Equity = 41,527.10
0.07
It is not good.
05.
Interest Coverage =
Operating Pro&it
Interest
Operating Profit = 19414.30 Interest = 738.70
26.28
It is safe.
06.
Operating Profit margin =
Operating Pro&it ∗ 100
Sales
Operating Profit = 19414.30 Sales = 68947.90
28%
It is not safe.
- 34 -
Sl.No.
Ratios
Particulars (Rs in millions)
Values Remarks
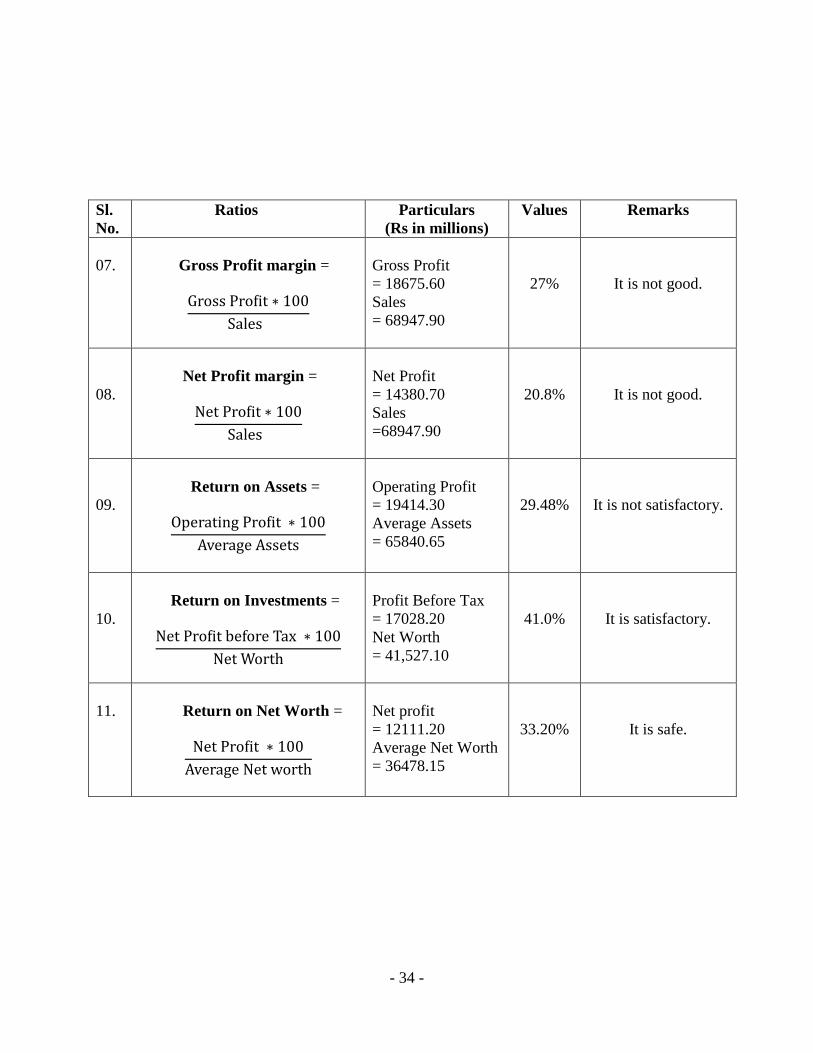
07.
Gross Profit margin =
Gross Pro&it ∗ 100
Sales
Gross Profit = 18675.60 Sales = 68947.90
27%
It is not good.
08.
Net Profit margin =
Net Pro&it ∗ 100
Sales
Net Profit = 14380.70 Sales =68947.90
20.8%
It is not good.
09.
Return on Assets =
Operating Pro&it ∗ 100
Average Assets
Operating Profit = 19414.30 Average Assets = 65840.65
29.48%
It is not satisfactory.
10.
Return on Investments =
Net Pro&it before Tax ∗ 100
Net Worth
Profit Before Tax = 17028.20 Net Worth = 41,527.10
41.0%
It is satisfactory.
11.
Return on Net Worth =
Net Pro&it ∗ 100
Average Net worth
Net profit = 12111.20 Average Net Worth = 36478.15
33.20%
It is safe.

- 35 -
Sl.No.
Ratios
Particulars (Rs in millions)
Values Remarks
12.
Operating Pro&it ∗ 100
Average Capital Employed
Return on Capital Employed =
Operating Profit = 19414.30 Avg. Capital Employed = 89820
21.61%
It is not good.
13.
Cost of Goods Sold
Sales
Cost of Goods Sold Ratio =
Cost of goods sold = 18,367.20 Sales = 68947.90
0.26
It is satisfactory.
14.
Cost of Goods sold + otherExpenses
Sales
Operating Ratio =
Other Expenses = 21463.20
0.57
It is not satisfactory.
15.
Fixed Assets turnover =
6789:
;<=9> 7::9?:
Fixed Assets = 48087.2 Sales = 68947.90
1.43
It is not satisfactory.

- 36 -
4.1.1.4 Summary for Balance Sheet and Profit & Loss Statement
Table 4.6: Summary of Balance Sheet
2007 (Rs in millions)
2008 (Rs in millions)
2009 (Rs in millions)
Remarks
Current Assets
23,079.40
28,674.40
24,436.10
Short term liquidity has increased marginally.
Fixed Assets
3064.1
57516.4
77901.4
Substantial increase in fixed assets due to increase in gross block.
Current Liabilities
26,575.40
32,093.20
36506.10
Current liabilities have increased. NWC is affected.
Long term Liabilities
48087.2
4820.3
5669.2
Debts have been paid off.
Table 4.7: Summary of Profit & Loss statement
2007 (Rs in millions)
2008 (Rs in millions)
2009 (Rs in millions)
Remarks
Sales
68,947.90 72,299.70 80,215.90 Sales position has increased.
Raw Material Cost
18,367.20
11,801.50
12,046.80
Expenses have decreased.
Operating Profit
19,414.30
17,832.80
25,631.10
Operating profit has increased.
Profit Bef. Tax (PBT)
17,028.20
16,607.30
22,728.90
PBT has increased.
Net profit
12,111.20
11,361.30
15,839.60
Net profit has increased by 30.7 %.

- 37 -
4.1.2 Jindal Steel & Power Ltd.
Table 4.8: Balance Sheet of Jindal Steel & Power Ltd. as at 31st Mar-2009
Liabilities March- 2009
(Rs in millions) March- 2008
(Rs in millions) March- 2007
(Rs in millions)
Share Capital 154.70 154.00 154.00
Reserves & Surplus 53,998.50 37,409.80 24,813.30
Net Worth (1) 54,153.20 37,563.80 24,967.30
Secured Loans (2) 21,054.90 17,833.90 21,156.10
Unsecured Loans (3) 28,571.60 20,799.60 13,921.10
Total Liabilities(1+2+3
103,779.70 76,197.30 60,044.50
Assets March- 2009
March- 2008
March- 2007
Gross Block 73,629.00 59,189.40 49,290.30
(-) Acc. Depreciation 16,170.00 11,831.10 7,817.50
Net Block (A) 57,459.00 47,358.30 41,472.80
Capital Work in Prgs. (B)
23,180.10 6,604.80 9,378.40
Investments (C) 12,334.00 10,361.90 7,098.20
Inventories 12,099.60 9,805.60 6,424.40
Sundry Debtors 3,914.60 2,873.80 3,203.10
Cash And Bank 3,089.60 5,779.10 529.70
Loans And Advances 32,789.00 14,537.20 7,859.40
(i) 51,892.80 32,995.70 18,016.60
Current Liabilities 31,258.30 15,335.40 12,099.10
Provisions 9,858.10 5,819.40 3,854.80
(ii) 41,116.40 21,154.80 15,953.90
Net Curr. Assets (i - ii) (D)
10,776.40 11,840.90 2,062.70
Misc. Expenses (E) 30.20 31.40 32.40
Total Assets (A+B+C+D+E)
103,779.70 76,197.30 60,044.50
(Source : http://economictimes.indiatimes.com/bsheet.cms)
- 38 -
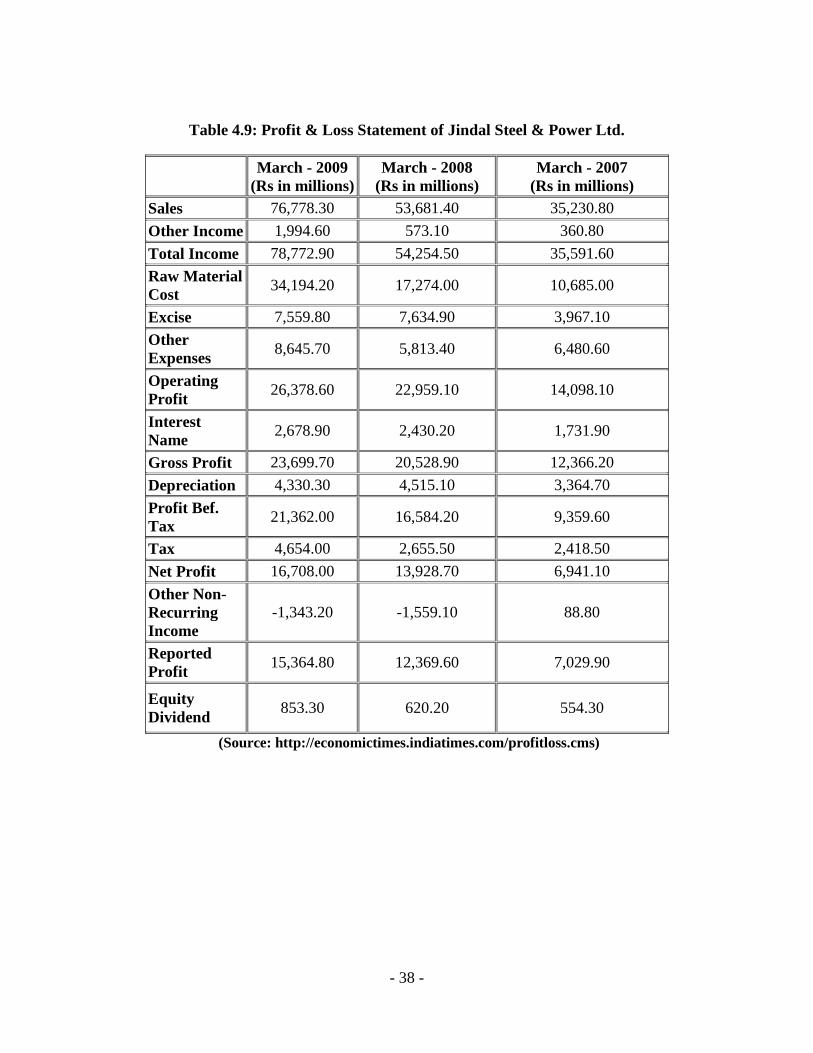
Table 4.9: Profit & Loss Statement of Jindal Steel & Power Ltd.
March - 2009 (Rs in millions)
March - 2008 (Rs in millions)
March - 2007 (Rs in millions)
Sales 76,778.30 53,681.40 35,230.80
Other Income 1,994.60 573.10 360.80
Total Income 78,772.90 54,254.50 35,591.60
Raw Material Cost
34,194.20 17,274.00 10,685.00
Excise 7,559.80 7,634.90 3,967.10
Other Expenses
8,645.70 5,813.40 6,480.60
Operating Profit
26,378.60 22,959.10 14,098.10
Interest Name
2,678.90 2,430.20 1,731.90
Gross Profit 23,699.70 20,528.90 12,366.20
Depreciation 4,330.30 4,515.10 3,364.70
Profit Bef. Tax
21,362.00 16,584.20 9,359.60
Tax 4,654.00 2,655.50 2,418.50
Net Profit 16,708.00 13,928.70 6,941.10
Other Non- Recurring Income
-1,343.20 -1,559.10 88.80
Reported Profit
15,364.80 12,369.60 7,029.90
Equity Dividend
853.30 620.20 554.30
(Source: http://economictimes.indiatimes.com/profitloss.cms)

- 39 -
4.1.2.1 Ratio Analysis for 2009
Table 4.10: Analysis of Financial Ratios for 2009
Sl.No.
Ratios
Particulars (Rs in millions)
Values Remarks
01.
Net Working Capital =
Current assets-Current liabilities
Current Assets = 51892.80 Current Liabilities = 41116.40
10776.4
Liquidity position is
good.
02.
Current Ratio =
Current Assets
Current Liabilities
Current Assets = 51892.80 Current Liabilities = 41116.40
1.26
It is not safe.
03.
Acid test or Quick ratio =
Quick Assets
Current Liabilities
Quick Assets =39793.2 Current Liabilities = 41116.40
0.96
It is safe.
04.
Debt-Equity Ratio =
Long term debt
Shareholder�s Equity
Total debt = 49626.5 Shareholder Equity = 54153.20
0.91
It is good.
05.
Interest Coverage =
Operating Pro&it
Interest
Operating Profit = 26378.60 Interest = 2678.90
9.84
It is not safe.
06.
Operating Profit margin =
Operating Pro&it ∗ 100
Sales
Operating Profit = 26378.60 Sales = 76778.30
34%
It is safe.

- 40 -
Sl.No
Ratios
Particulars (Rs in millions)
Values Remarks
07.
Gross Profit margin =
Gross Pro&it ∗ 100
Sales
Gross Profit = 23699.70 Sales = 76778.30
30.86 %
It is good.
08.
Net Profit margin =
Net Pro&it ∗ 100
Sales
Net Profit = 15364.80 Sales = 76778.30
20.01 %
It is not desirable.
09.
Return on Assets =
Operating Pro&it ∗ 100
Average Assets
Operating Profit = 26378.60 Average Assets = 132045.9
19.97%
It is not satisfactory
10.
Return on Investments =
Net Pro&it before Tax ∗ 100
Net Worth
Profit Before Tax = 21362 Net Worth = 54153.20
39.44%
It is satisfactory
11.
Return on Net Worth =
Net Pro&it ∗ 100
Average Net Worth
Net profit = 16,708.00 Average Net Worth = 45858.5
36.4%
It is satisfactory

- 41 -
Sl.No
Ratios
Particulars (Rs in millions)
Values Remarks
12.
Operating Pro&it ∗ 100
Average Capital Employed
Return on Capital Employed =
Operating Profit = 26378.60 Avg. Capital Employed = 152228.9
17.32%
It is not good.
13.
Cost of Goods Sold
Sales
Cost of Goods Sold Ratio =
Cost of goods sold = 34,194.20 Sales =76778.30
0.45
It is not satisfactory.
14.
Cost of Goods sold + otherExpenses
Sales
Operating Ratio =
Other Expenses = 8,645.70
0.55
It is not satisfactory.
15.
Fixed Assets turnover =
6789:
;<=9> 7::9?:
Fixed Assets = 92973.1 Sales =76778.30
0.82
It is good.
- 42 -
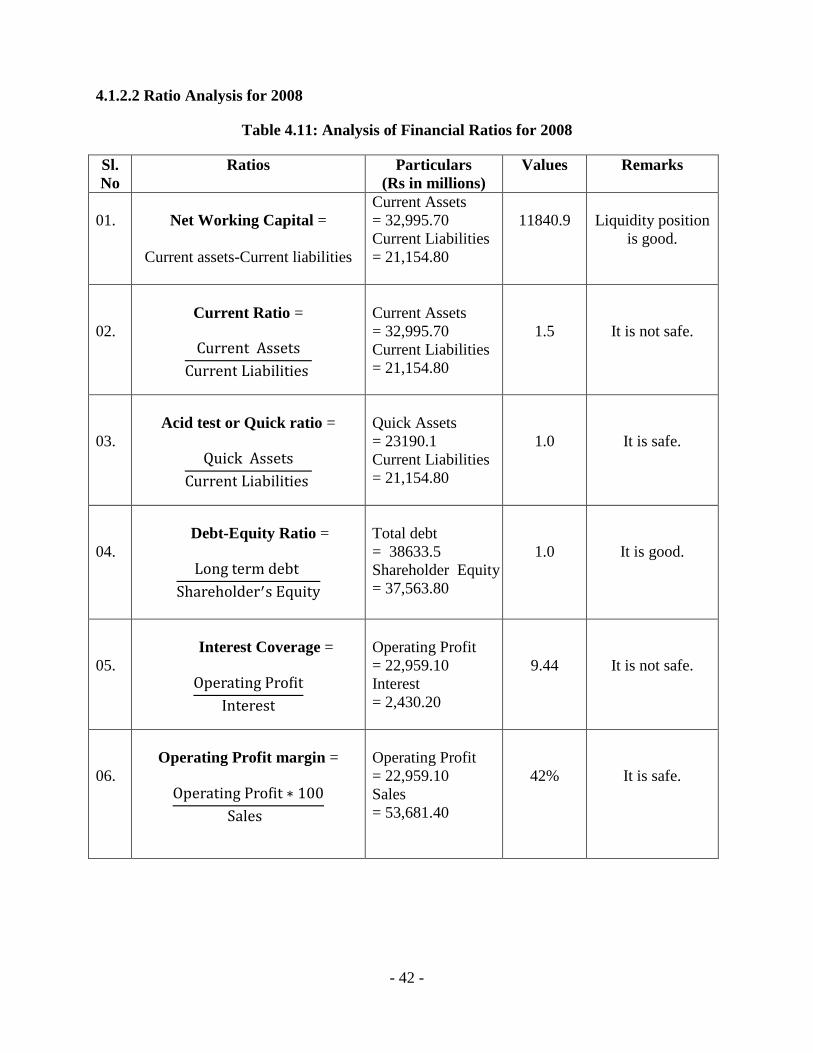
4.1.2.2 Ratio Analysis for 2008
Table 4.11: Analysis of Financial Ratios for 2008
Sl.No
Ratios
Particulars (Rs in millions)
Values Remarks
01.
Net Working Capital =
Current assets-Current liabilities
Current Assets = 32,995.70 Current Liabilities = 21,154.80
11840.9
Liquidity position
is good.
02.
Current Ratio =
Current Assets
Current Liabilities
Current Assets = 32,995.70 Current Liabilities = 21,154.80
1.5
It is not safe.
03.
Acid test or Quick ratio =
Quick Assets
Current Liabilities
Quick Assets = 23190.1 Current Liabilities = 21,154.80
1.0
It is safe.
04.
Debt-Equity Ratio =
Long term debt
Shareholder�s Equity
Total debt = 38633.5 Shareholder Equity = 37,563.80
1.0
It is good.
05.
Interest Coverage =
Operating Pro&it
Interest
Operating Profit = 22,959.10 Interest = 2,430.20
9.44
It is not safe.
06.
Operating Profit margin =
Operating Pro&it ∗ 100
Sales
Operating Profit = 22,959.10 Sales = 53,681.40
42%
It is safe.

- 43 -
Sl.No
Ratios
Particulars (Rs in millions)
Values Remarks
07.
Gross Profit margin =
Gross Pro&it ∗ 100
Sales
Gross Profit = 20,528.90 Sales = 53,681.40
38.24%
It is good.
08.
Net Profit margin =
Net Pro&it ∗ 100
Sales
Net Profit = 12369.60 Sales = 53,681.40
23.04%
It is not good.
09.
Return on Assets =
Operating Pro&it ∗ 100
Average Assets
Operating Profit = 22,959.10 Average Assets = 86643.35
26.49%
It is not good.
10.
Return on Investments =
Net Pro&it before Tax ∗ 100
Net Worth
Profit Before Tax =16584.20 Net Worth = 37563.80
44.14%
It is satisfactory
11.
Return on Net Worth =
Net Pro&it ∗ 100
Average Net worth
Net profit = 13928.70 Average Net Worth = 31265.55
44.54%
It is satisfactory

- 44 -
Sl.No
Ratios
Particulars ( Rs in millions)
Values Remarks
12.
Operating Pro&it ∗ 100
Average Capital Employed
Return on Capital Employed =
Operating Profit = 22,959.10 Avg. Capital Employed = 105197.7
21.8%
It is not good
13.
Cost of Goods Sold
Sales
Cost of Goods Sold Ratio =
Cost of goods sold = 17,274.00 Sales = 53,681.40
0.32
It is not satisfactory.
14.
Cost of Goods sold + otherExpenses
Sales
Operating Ratio =
Other Expenses = 5813.40
0.43
It is not satisfactory.
15.
Fixed Assets turnover =
6789:
;<=9> 7::9?:
Fixed Assets = 64325 Sales = 53,681.40
0.83
It is good.
- 45 -
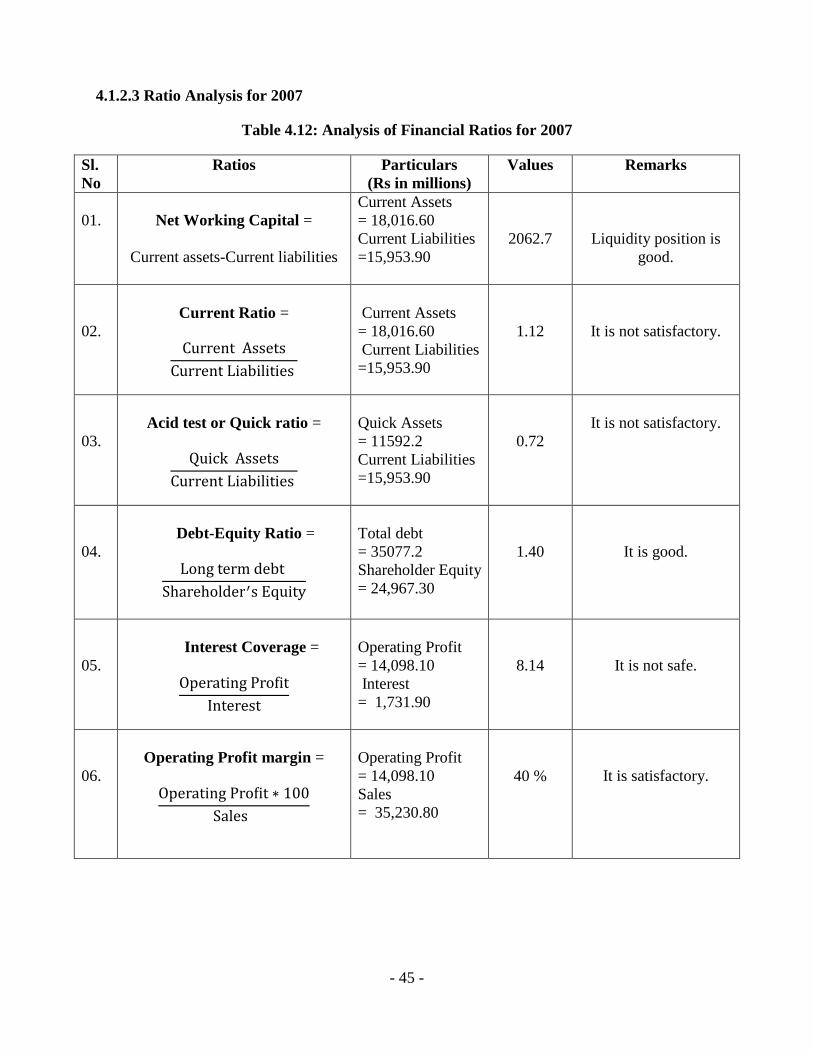
4.1.2.3 Ratio Analysis for 2007
Table 4.12: Analysis of Financial Ratios for 2007
Sl.No
Ratios
Particulars (Rs in millions)
Values Remarks
01.
Net Working Capital =
Current assets-Current liabilities
Current Assets = 18,016.60 Current Liabilities =15,953.90
2062.7
Liquidity position is good.
02.
Current Ratio =
Current Assets
Current Liabilities
Current Assets = 18,016.60 Current Liabilities =15,953.90
1.12
It is not satisfactory.
03.
Acid test or Quick ratio =
Quick Assets
Current Liabilities
Quick Assets = 11592.2 Current Liabilities =15,953.90
0.72
It is not satisfactory.
04.
Debt-Equity Ratio =
Long term debt
Shareholder�s Equity
Total debt = 35077.2 Shareholder Equity = 24,967.30
1.40
It is good.
05.
Interest Coverage =
Operating Pro&it
Interest
Operating Profit = 14,098.10 Interest = 1,731.90
8.14
It is not safe.
06.
Operating Profit margin =
Operating Pro&it ∗ 100
Sales
Operating Profit = 14,098.10 Sales = 35,230.80
40 %
It is satisfactory.

- 46 -
Sl.No
Ratios
Particulars (Rs in millions)
Values Remarks
07.
Gross Profit margin =
Gross Pro&it ∗ 100
Sales
Gross Profit = 12,366.20 Sales = 35,230.80
35%
It is satisfactory
08.
Net Profit margin =
Net Pro&it ∗ 100
Sales
Net Profit = 7,029.90 Sales = 35,230.80
19.9%
It is not satisfactory.
09.
Return on Assets =
Operating Pro&it ∗ 100
Average Assets
Operating Profit = 14,098.10 Average Assets = 66821.95
21.09%
It is not satisfactory
10.
Return on Investments =
Net Pro&it before Tax ∗ 100
Net Worth
Profit Before Tax = 9,359.60 Net Worth = 24,967.30
37.48%
It is safe.
11.
Return on Net Worth =
Net Pro&it ∗ 100
Average Net worth
Net profit = 6,941.10 Average Net Worth = 21707.2
31.9%
It is good.

- 47 -
Sl.No
Ratios
Particulars (Rs in millions)
Values Remarks
12.
Operating Pro&it ∗ 100
Average Capital Employed
Return on Capital Employed =
Operating Profit = 14,098.10 Avg. Capital Employed = 80691.15
17.47%
It is not safe.
13.
Cost of Goods Sold
Sales
Cost of Goods Sold Ratio =
Cost of goods sold = 10,685.00 Sales = 35,230.80
0.30
It is not satisfactory.
14.
Cost of Goods sold + otherExpenses
Sales
Operating Ratio =
Other Expenses = 6,480.60
0.48
It is not satisfactory
15.
Fixed Assets turnover =
6789:
;<=9> 7::9?:
Fixed Assets = 57949.4 Sales = 35,230.80
0.61
It is not good.
- 48 -
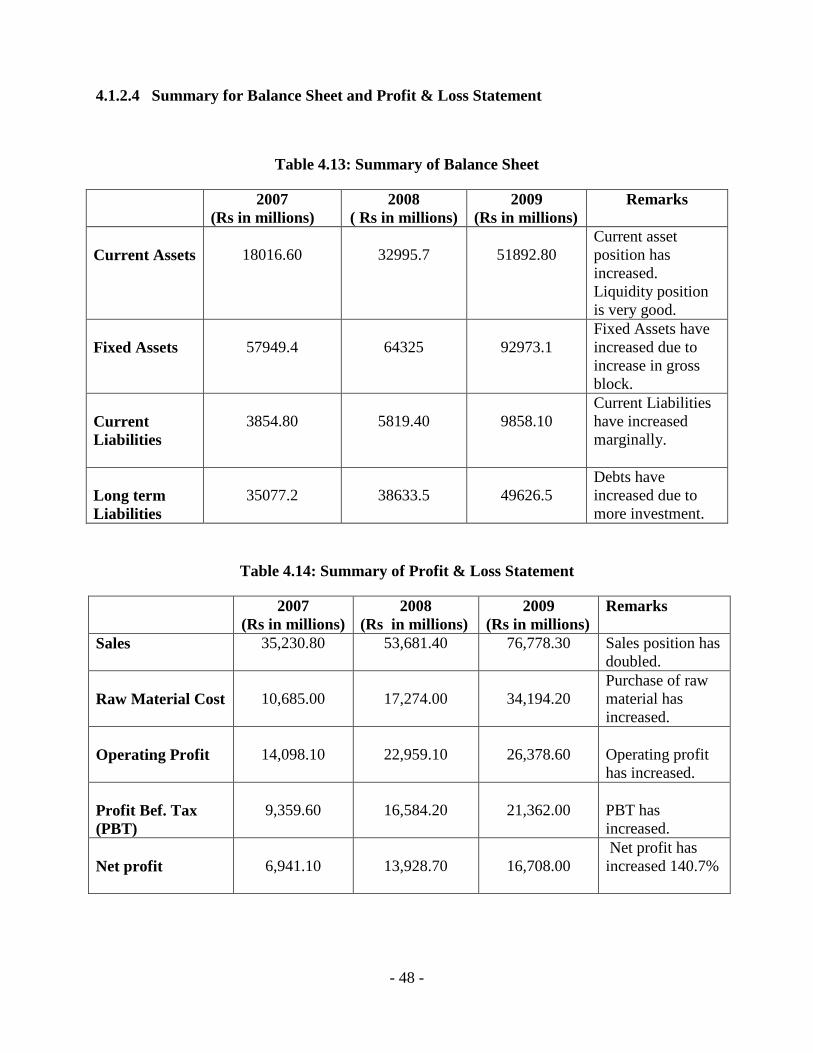
4.1.2.4 Summary for Balance Sheet and Profit & Loss Statement
Table 4.13: Summary of Balance Sheet
2007 (Rs in millions)
2008 ( Rs in millions)
2009 (Rs in millions)
Remarks
Current Assets
18016.60
32995.7
51892.80
Current asset position has increased. Liquidity position is very good.
Fixed Assets
57949.4
64325
92973.1
Fixed Assets have increased due to increase in gross block.
Current Liabilities
3854.80
5819.40
9858.10
Current Liabilities have increased marginally.
Long term Liabilities
35077.2
38633.5
49626.5
Debts have increased due to more investment.
Table 4.14: Summary of Profit & Loss Statement
2007 (Rs in millions)
2008 (Rs in millions)
2009 (Rs in millions)
Remarks
Sales
35,230.80 53,681.40 76,778.30 Sales position has doubled.
Raw Material Cost
10,685.00
17,274.00
34,194.20
Purchase of raw material has increased.
Operating Profit
14,098.10
22,959.10
26,378.60
Operating profit has increased.
Profit Bef. Tax (PBT)
9,359.60
16,584.20
21,362.00
PBT has increased.
Net profit
6,941.10
13,928.70
16,708.00
Net profit has increased 140.7%
- 49 -
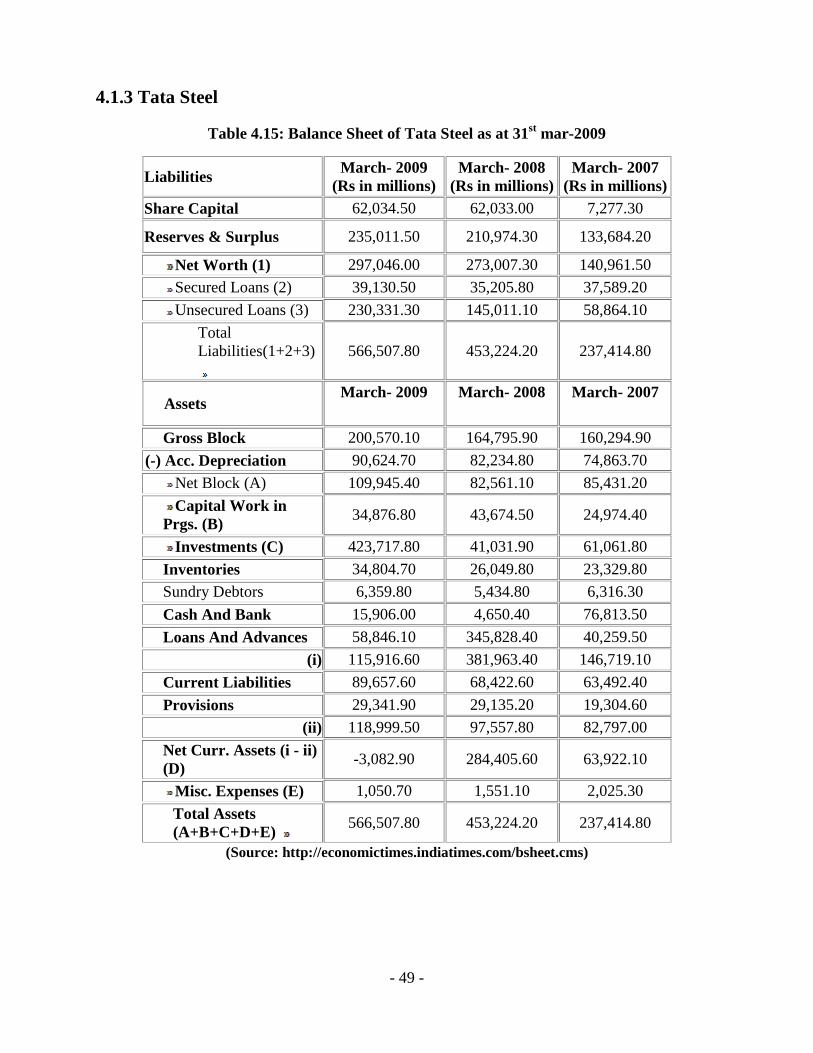
4.1.3 Tata Steel
Table 4.15: Balance Sheet of Tata Steel as at 31st mar-2009
Liabilities March- 2009
(Rs in millions) March- 2008
(Rs in millions) March- 2007
(Rs in millions) Share Capital 62,034.50 62,033.00 7,277.30
Reserves & Surplus 235,011.50 210,974.30 133,684.20
Net Worth (1) 297,046.00 273,007.30 140,961.50
Secured Loans (2) 39,130.50 35,205.80 37,589.20
Unsecured Loans (3) 230,331.30 145,011.10 58,864.10
Total Liabilities(1+2+3)
566,507.80 453,224.20 237,414.80
Assets March- 2009
March- 2008
March- 2007
Gross Block 200,570.10 164,795.90 160,294.90
(-) Acc. Depreciation 90,624.70 82,234.80 74,863.70
Net Block (A) 109,945.40 82,561.10 85,431.20
Capital Work in Prgs. (B)
34,876.80 43,674.50 24,974.40
Investments (C) 423,717.80 41,031.90 61,061.80
Inventories 34,804.70 26,049.80 23,329.80
Sundry Debtors 6,359.80 5,434.80 6,316.30
Cash And Bank 15,906.00 4,650.40 76,813.50
Loans And Advances 58,846.10 345,828.40 40,259.50
(i) 115,916.60 381,963.40 146,719.10
Current Liabilities 89,657.60 68,422.60 63,492.40
Provisions 29,341.90 29,135.20 19,304.60
(ii) 118,999.50 97,557.80 82,797.00
Net Curr. Assets (i - ii) (D)
-3,082.90 284,405.60 63,922.10
Misc. Expenses (E) 1,050.70 1,551.10 2,025.30
Total Assets (A+B+C+D+E)
566,507.80 453,224.20 237,414.80
(Source: http://economictimes.indiatimes.com/bsheet.cms)

- 50 -
Table 4.16: Profit & Loss Statement Tata Steel
March - 2009
(Rs in millions) March - 2008
(Rs in millions) March - 2007
(Rs in millions)
Sales 243,483.20 196,544.10 174,526.60
Other Income 3,053.60 3,472.80 4,851.40
Total Income
246,536.80 200,016.90 179,378.00
Raw Material Cost 82,794.40 60,248.00 56,799.50
Excise 24,952.10 25,370.20 23,041.80
Other Expenses 43,972.30 28,480.50 25,547.80
Operating Profit 91,764.40 82,445.40 69,137.50
Interest Name 14,895.00 9,290.30 2,512.50
Gross Profit 76,869.40
73,155.10 66,625.00
Depreciation 9,734.00 8,346.10 8,192.90
Profit Bef. Tax 70,189.00 68,281.80 63,283.50
Tax 21,148.70 23,802.80 20,404.70
Net Profit 49,040.30 44,479.00 42,878.80
Other Non- Recurring Income
2,977.10 2,391.30 -657.30
Reported Profit 52,017.40
46,870.30 42,221.50
Equity Dividend 11,689.50
11,689.30 9,439.10
(Source: http://economictimes.indiatimes.com/profitloss.cms)

- 51 -
4.1.3.1 Ratio Analysis for 2009
Table 4.17: Analysis of Financial Ratios for 2009
Sl.No.
Ratios
Particulars (Rs in millions)
Values Remarks
01.
Net Working Capital =
Current assets-Current liabilities
Current Assets = 115,916.60 Current Liabilities =118,999.50
- 3082.9
Liquidity available is
less.
02.
Current Ratio =
Current Assets
Current Liabilities
Current Assets = 115,916.60 Current Liabilities = 118,999.50
0.97
It is not safe.
03.
Acid test or Quick ratio =
Quick Assets
Current Liabilities
Quick Assets = 81111.9 Current Liabilities =118,999.50
0.68
It is not safe.
04.
Debt-Equity Ratio =
Long term debt
Shareholder�s Equity
Total debt = 269461.8 Shareholder Equity = 297,046.00
0.91
It is good.
05.
Interest Coverage =
Operating Pro&it
Interest
Operating Profit = 91,764.40 Interest = 14,895.00
6.16
It is not safe.
06.
Operating Profit margin =
Operating Pro&it ∗ 100
Sales
Operating Profit = 91,764.40 Sales = 243,483.20
37 %
It is good.

- 52 -
Sl.No.
Ratios
Particulars (Rs in millions)
Values Remarks
07.
Gross Profit margin =
Gross Pro&it ∗ 100
Sales
Gross Profit = 76,869.40 Sales = 243,483.20
31.57 %
It is good.
08.
Net Profit margin =
Net Pro&it ∗ 100
Sales
Net Profit = 52,017.40 Sales =243,483.20
21.36%
It is not good.
09.
Return on Assets =
Operating Pro&it ∗ 100
Average Assets
Operating Profit = 91,764.40 Average Assets = 616843.75
14.87%
It is not good.
10.
Return on Investments =
Pro&it Before Tax ∗ 100
Net worth
Profit Before Tax = 70189 Net Worth = 297046
23.62%
It is not satisfactory
11.
Return on Net Worth =
Net Pro&it ∗ 100
Average Net worth
Net profit = 49040.30 Average Net Worth = 285026.65
17.20%
It is not good.

- 53 -
Sl.No
Ratios
Particulars ( Rs in millions)
Values Remarks
12.
Operating Pro&it ∗ 100
Average Capital Employed
Return on Capital Employed =
Operating Profit = 91,764.40 Avg. Capital Employed = 725122.4
12.65%
It is not good.
13.
Cost of Goods Sold
Sales
Cost of Goods Sold Ratio =
Cost of goods sold = 82,794.40 Sales = 243,483.20
0.34
It is not satisfactory
14.
Cost of Goods sold + otherExpenses
Sales
Operating Ratio =
Other Expenses = 43,972.30
0.52
It is not satisfactory
15.
Fixed Assets turnover =
6789:
;<=9> A::9?:
Fixed Assets = 568540 Sales = 243,483.20
0.42
It is satisfactory

- 54 -
4.1.3.2 Ratio Analysis for 2008
Table 4.18: Analysis of Financial Ratios for 2008
Sl.No.
Ratios
Particulars (Rs in millions)
Values Remarks
01.
Net Working Capital =
Current assets-Current liabilities
Current Assets = 381963.40 Current Liabilities = 97557.80
284405.6
Liquidity position is
good.
02.
Current Ratio =
Current Assets
Current Liabilities
Current Assets = 381963.40 Current Liabilities = 97557.80
3.92
It is safe
03.
Acid test or Quick ratio =
Quick Assets
Current Liabilities
Quick Assets = 355913.6 Current Liabilities = 97557.80
3.64
It is satisfactory
04.
Debt-Equity Ratio =
Long term debt
Shareholder�s Equity
Total debt = 180216.9 Shareholder Equity = 273007.30
0.66
It is not safe
05.
Interest Coverage =
Operating Pro&it
Interest
Operating Profit = 82445.40 Interest = 9290.30
8.87
It is not satisfactory
06.
Operating Profit margin =
Operating Pro&it ∗ 100
Sales
Operating Profit = 82445.40 Sales = 196544.10
41%
It is satisfactory

- 55 -
Sl.No.
Ratios
Particulars (Rs in millions)
Values Remarks
07.
Gross Profit margin =
Gross Pro&it ∗ 100
Sales
Gross Profit = 73155.10 Sales = 196544.10
37.22%
It is good.
08.
Net Profit margin =
Net Pro&it ∗ 100
Sales
Net Profit = 46870.30 Sales =196544.10
23.8%
It is not satisfactory.
09.
Return on Assets =
Operating Pro&it ∗ 100
Average Assets
Operating Profit = 82445.40 Average Assets = 433708.7
19 %
It is not safe.
10.
Return on Investments =
Pro&it before Tax ∗ 100
Net worth
Profit Before Tax = 68281.80 Net Worth = 273007.30
25.01%
It is not good.
11.
Return on Net Worth =
Net Pro&it ∗ 100
Average Net worth
Net profit = 44479 Average Net Worth = 206984.4
21.48%
It is not satisfactory

- 56 -
Sl.No.
Ratios
Particulars ( Rs in millions)
Values Remarks
12.
Operating Pro&it ∗ 100
Average Capital Employed
Return on Capital Employed =
Operating Profit = 82445.40 Avg. Capital Employed = 523886.1
15.73%
It is not safe
13.
Cost of Goods Sold
Sales
Cost of Goods Sold Ratio =
Cost of goods sold = 60248 Sales = 196544.10
0.30
It is not satisfactory
14.
Cost of Goods sold + otherExpenses
Sales
Operating Ratio =
Other Expenses = 28480.50
0.45
It is not satisfactory
15.
Fixed Assets turnover =
6789:
;<=9> A::9?:
Fixed Assets = 167267.5 Sales = 196544.10
1.17
It is not safe

- 57 -
4.1.3.3 Ratio Analysis for 2007
Table 4.19: Analysis of Financial Ratios for 2007
Sl.No.
Ratios
Particulars (Rs in millions)
Values Remarks
01.
Net Working Capital =
Current assets-Current liabilities
Current Assets = 146,719.10 Current Liabilities = 82,797.00
63922.1
Liquidity position is good.
02.
Current Ratio =
Current Assets
Current Liabilities
Current Assets = 146,719.10 Current Liabilities = 82,797.00
1.77
It is not satisfactory.
03.
Acid test or Quick ratio =
Quick Assets
Current Liabilities
Quick Assets = 123389.3 Current Liabilities = 82,797.00
1.49
It is safe.
04.
Debt-Equity Ratio =
Long term debt
Shareholder�s Equity
Total debt = 96453.3 Shareholder Equity = 140,961.50
0.68
It is not safe.
05.
Interest Coverage =
Operating Pro&it
Interest
Operating Profit = 69,137.50 Interest = 2,512.50
27.51
It is not satisfactory.
06.
Operating Profit margin =
Operating Pro&it ∗ 100
Sales
Operating Profit = 69,137.50 Sales = 174,526.60
39.6%
It is good.

- 58 -
Sl.No.
Ratios
Particulars (Rs in millions)
Values Remarks
07.
Gross Profit margin =
Gross Pro&it ∗ 100
Sales
Gross Profit = 66,625.00 Sales = 174,526.60
38.17%
It is satisfactory.
08.
Net Profit margin =
Net Pro&it ∗ 100
Sales
Net Profit = 42,221.50 Sales = 174,526.60
24.19%
It is not satisfactory.
09.
Return on Assets =
Operating Pro&it
Average Assets
Operating Profit = 69,137.50 Average Assets = 253753.3
27.24%
It is not good.
10.
Return on Investments =
Pro&it Before Tax ∗ 100
Net Worth
Profit Before Tax = 63,283.50 Net Worth = 140,961.50
44.89%
It is safe.
11.
Return on Net Worth =
Net Pro&it ∗ 100
Average Net worth
Net profit = 42,878.80 Average Net Worth = 119257.25
35.95%
It is good.

- 59 -
Sl.No.
Ratios
Particulars (Rs in millions)
Values Remarks
12.
Operating Pro&it ∗ 100
Average Capital Employed
Return on Capital Employed =
Operating Profit = 69,137.50 Avg. Capital Employed = 329720.95
20.96%
It is not satisfactory.
13.
Cost of Goods Sold
Sales
Cost of Goods Sold Ratio =
Cost of goods sold = 56,799.50 Sales = 174,526.60
0.32
It is not good.
14.
Cost of Goods sold + otherExpenses
Sales
Operating Ratio =
Other Expenses = 25,547.80
0.47
It is not good.
15.
Fixed Assets turnover =
6789:
;<=9> 7::9?:
Fixed Assets = 171467.4 Sales = 174,526.60
1.01
It is not safe.

- 60 -
4.1.3.4 Summary for Balance Sheet and Profit & Loss Statement
Table 4.20: Summary of Balance Sheet
2007 (Rs in millions)
2008 (Rs in millions)
2009 (Rs in millions)
Remarks
Current Assets
146719.10
381963.40
115916.60
Short term liquidity available is very less.
Fixed Assets
171467.4
167267.5
568540
Fixed Assets have increased due to increase in investment.
Current Liabilities
82797
97557.80
118999.50
Substantial increase in liabilities. Liquidity position is not good.
Long term Liabilities
96453.3
180216.9
269461.8
Debts have increased because of more investment.
Table 4.21: Summary of Profit & Loss Statement
2007 ( Rs in millions)
2008 (Rs in millions)
2009 (Rs in millions)
Remarks
Sales
174,526.6 196,544.10 243,483.20 Sales have increased by 39.5 %
Raw Material Cost
56,799.50
60,248.00
82,794.40
Expenses have increased.
Operating Profit
69,137.50
82,445.40
91,764.40
Operating profit has increased.
Profit Bef. Tax (PBT)
63,283.50
68,281.80
70,189.00
PBT has increased.
Net profit
42,878.80
44,479.00
49,040.30
Net profit has increased marginally.
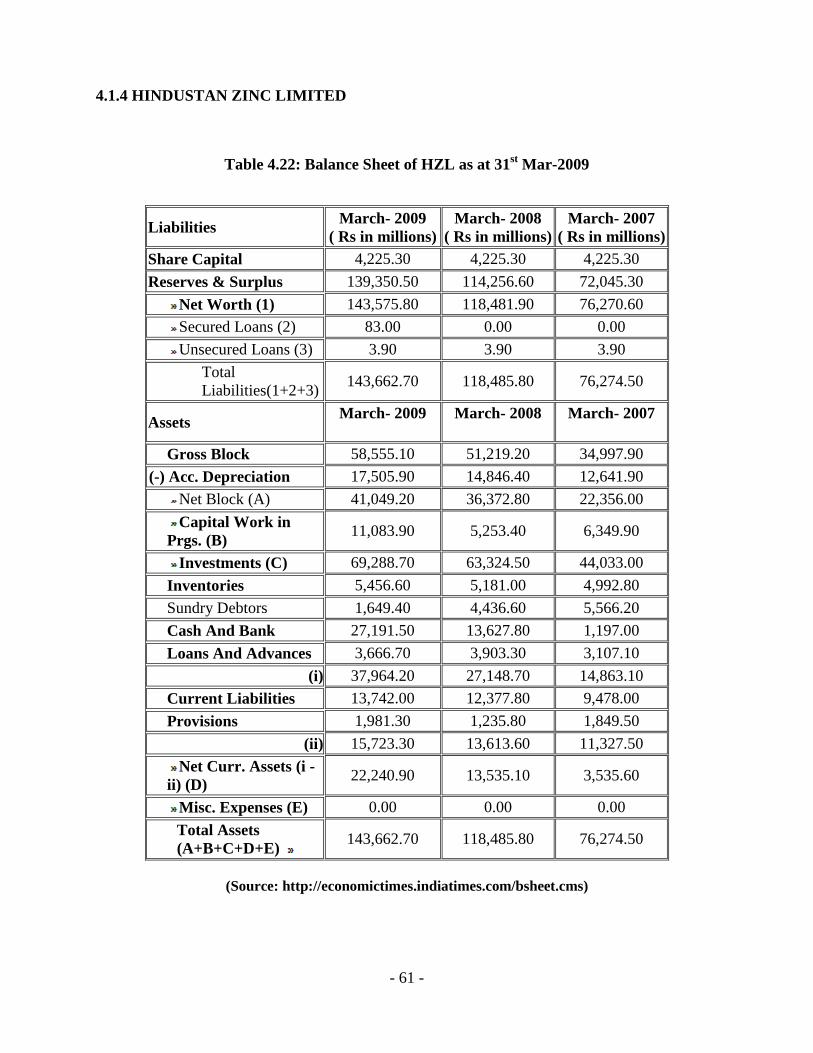
- 61 -
4.1.4 HINDUSTAN ZINC LIMITED
Table 4.22: Balance Sheet of HZL as at 31st Mar-2009
(Source: http://economictimes.indiatimes.com/bsheet.cms)
Liabilities March- 2009
( Rs in millions) March- 2008
( Rs in millions) March- 2007
( Rs in millions) Share Capital 4,225.30 4,225.30 4,225.30
Reserves & Surplus 139,350.50 114,256.60 72,045.30
Net Worth (1) 143,575.80 118,481.90 76,270.60
Secured Loans (2) 83.00 0.00 0.00
Unsecured Loans (3) 3.90 3.90 3.90
Total Liabilities(1+2+3)
143,662.70 118,485.80 76,274.50
Assets March- 2009 March- 2008
March- 2007
Gross Block 58,555.10 51,219.20 34,997.90
(-) Acc. Depreciation 17,505.90 14,846.40 12,641.90
Net Block (A) 41,049.20 36,372.80 22,356.00
Capital Work in Prgs. (B)
11,083.90 5,253.40 6,349.90
Investments (C) 69,288.70 63,324.50 44,033.00
Inventories 5,456.60 5,181.00 4,992.80
Sundry Debtors 1,649.40 4,436.60 5,566.20
Cash And Bank 27,191.50 13,627.80 1,197.00
Loans And Advances 3,666.70 3,903.30 3,107.10
(i) 37,964.20 27,148.70 14,863.10
Current Liabilities 13,742.00 12,377.80 9,478.00
Provisions 1,981.30 1,235.80 1,849.50
(ii) 15,723.30 13,613.60 11,327.50
Net Curr. Assets (i - ii) (D)
22,240.90 13,535.10 3,535.60
Misc. Expenses (E) 0.00 0.00 0.00
Total Assets (A+B+C+D+E)
143,662.70 118,485.80 76,274.50

- 62 -
Table 4.23 : Profit & Loss Statement of HZL
March - 2009 (12 months)
March - 2008 (12 months)
March - 2007 (12 months)
Sales 56,885.10 78,954.70 85,474.20
Other Income
8,320.30 5,316.50 1,139.50
Total Income
65,205.40 84,271.20 86,613.70
Raw Material Cost
6,525.80 5,338.20 2,718.20
Excise 4,529.60 8,414.40 6,730.30
Other Expenses
18,488.10 11,222.30 11,779.10
Operating Profit
27,341.60 53,979.80 64,246.60
Interest Name
218.80 230.50 284.40
Gross Profit 27,122.80 53,749.30 63,962.20
Depreciation 2,852.70 2,205.10 1,560.80
Profit Bef. Tax
32,590.40 56,845.40 63,535.80
Tax 6,630.50 16,689.60 20,365.30
Net Profit 25,959.90 40,155.80 43,170.50
Other Non- Recurring Income
1,316.20 3,804.90 1,247.60
Reported Profit
27,276.10 43,960.70 44,418.10
Equity Dividend
1,690.10 2,112.60 2,112.60
(Source: http://economictimes.indiatimes.com/profitloss.cms)

- 63 -
4.1.4.1 Ratio Analysis for 2009
Table 4.24: Analysis of Financial Ratios for 2009
Sl.No.
Ratios
Particulars (Rs in millions)
Values Remarks
01.
Net Working Capital =
Current assets-Current liabilities
Current Assets = 37,964.20 Current Liabilities =15,723.30
21970.9
Liquidity position is good.
02.
Current Ratio =
Current Assets
Current Liabilities
Current Assets =37,964.20 Current Liabilities =15,723.30
2.39
It is satisfactory
03.
Acid test or Quick ratio =
Quick Assets
Current Liabilities
Quick Assets = 32507.6 Current Liabilities =15,723.30
2.06
It is satisfactory
04.
Debt-Equity Ratio =
Long term debt
Shareholder�s Equity
Total debt = 86.90 Shareholder Equity = 143,575.80
0.0006
It is not good.
05.
Interest Coverage =
Operating Pro&it
Interest
Operating Profit = 27,341.60 Interest = 218.80
124.96
It is satisfactory
06.
Operating Profit margin =
Operating Pro&it ∗ 100
Sales
Operating Profit = 27,341.60 Sales = 56,885.10
48.06 %
It is good.

- 64 -
Sl.No
Ratios
Particulars ( Rs in millions)
Values Remarks
07.
Gross Profit margin =
Gross Pro&it ∗ 100
Sales
Gross Profit = 27,122.80 Sales = 56,885.10
47.6 %
It is satisfactory.
08.
Net Profit margin =
Net Pro&it ∗ 100
Sales
Net Profit = 27,276.10 Sales =56,885.10
47.9 %
It is satisfactory.
09.
Return on Assets =
Operating Pro&it ∗ 100
Average Assets
Operating Profit = 27,341.60 Average Assets = 145607.7
18.77%
It is not good.
10.
Return on Investments =
Net Pro&it before Tax ∗ 100
Net Worth
Profit Before Tax = 32,590.40 Net Worth = 143,575.80
22.69 %
It is not satisfactory.
11.
Return on Net Worth =
Net Pro&it ∗ 100
Average Net worth
Net profit = 25,959.90 Average Net Worth = 131028.85
17.52%
It is not safe.

- 65 -
Sl.No
Ratios
Particulars ( Rs in millions)
Values Remarks
12.
Operating Pro&it ∗ 100
Average Capital Employed
Return on Capital Employed =
Operating Profit = 27,341.60 Avg. Capital Employed = 160411.15
17.04%
It is not satisfactory.
13.
Cost of Goods Sold
Sales
Cost of Goods Sold Ratio =
Cost of goods sold = 6,525.80 Sales = 56,885.10
0.11
It is good.
14.
Cost of Goods sold + otherExpenses
Sales
Operating Ratio =
Other Expenses = 18,488.10
0.43
It is not good.
15.
Fixed Assets turnover =
6789:
;<=9> 7::9?:
Fixed Assets = 121421.8 Sales = 56,885.10
0.46
It is not safe.

- 66 -
4.1.4.2 Ratio Analysis for 2008
Table 4.25: Analysis of Financial Ratios for 2008
Sl.No
Ratios
Particulars (Rs in millions)
Values Remarks
01.
Net Working Capital =
Current assets-Current liabilities
Current Assets = 27,148.70 Current Liabilities = 13,613.60
13535.1
Liquidity position is good.
02.
Current Ratio =
Current Assets
Current Liabilities
Current Assets = 27,148.70 Current Liabilities = 13,613.60
1.99
It is satisfactory.
03.
Acid test or Quick ratio =
Quick Assets
Current Liabilities
Quick Assets = 21967.7 Current Liabilities = 13,613.60
1.61
It is good.
04.
Debt-Equity Ratio =
Long term debt
Shareholder�s Equity
Total debt = 3.90 Shareholder Equity = 118,481.90
0.000033
It is not safe.
05.
Interest Coverage =
Operating Pro&it
Interest
Operating Profit = 53,979.80 Interest = 230.50
234.18
It is satisfactory.
06.
Operating Profit margin =
Operating Pro&it ∗ 100
Sales
Operating Profit = 53,979.80 Sales = 78,954.70
68.3%
It is good.

- 67 -
Sl.No
Ratios
Particulars (Rs in millions)
Values Remarks
07.
Gross Profit margin =
Gross Pro&it ∗ 100
Sales
Gross Profit = 53,749.30 Sales = 78,954.70
68.07 %
It is satisfactory.
08.
Net Profit margin =
Net Pro&it ∗ 100
Sales
Net Profit = 43,960.70 Sales = 78,954.70
55.6 %
It is satisfactory.
09.
Return on Assets =
Operating Pro&it ∗ 100
Average Assets
Operating Profit = 53,979.80 Average Assets = 109850.7
49.13 %
It is good.
10.
Return on Investments =
Net Pro&it before Tax ∗ 100
Net Worth
Profit Before Tax = 56,845.40 Net Worth = 118,481.90
47.9 %
It is good.
11.
Return on Net Worth =
Net Pro&it ∗ 100
Average Net worth
Net profit = 40,155.80 Average Net Worth = 97376.25
41.23 %
It is safe.

- 68 -
Sl.No
Ratios
Particulars (Rs in millions)
Values Remarks
12.
Operating Pro&it ∗ 100
Average Capital Employed
Return on Capital Employed =
Operating Profit = 53,979.80 Avg. Capital Employed = 244642.5
22.06 %
It is not satisfactory.
13.
Cost of Goods Sold
Sales
Cost of Goods Sold Ratio =
Cost of goods sold = 5,338.20 Sales = 78,954.70
0.067
It is not good.
14.
Cost of Goods sold + otherExpenses
Sales
Operating Ratio =
Other Expenses = 11,222.30
0.21
It is not good.
15.
Fixed Assets turnover =
6789:
;<=9> 7::9?:
Fixed Assets = 104950.7 Sales = 78,954.70
0.75
It is not safe

- 69 -
4.1.4.3 Ratio Analysis for 2007
Table 4.26: Analysis of Financial Ratios for 2007
Sl.No
Ratios
Particulars (Rs in millions)
Values Remarks
01.
Net Working Capital =
Current assets-Current liabilities
Current Assets = 14,863.10 Current Liabilities =11,327.50
3535.6
Liquidity position is good.
02.
Current Ratio =
Current Assets
Current Liabilities
Current Assets =14,863.10 Current Liabilities = 11,327.50
1.31
It is not safe
03.
Acid test or Quick ratio =
Quick Assets
Current Liabilities
Quick Assets = 9870.3 Current Liabilities = 11,327.50
0.87
It is not satisfactory.
04.
Debt-Equity Ratio =
Long term debt
Shareholder�s Equity
Total debt = 3.90 Shareholder Equity = 76,270.60
0.00005
It is not safe
05.
Interest Coverage =
Operating Pro&it
Interest
Operating Profit = 64,246.60 Interest = 284.40
225.90
It is good.
06.
Operating Profit margin =
Operating Pro&it ∗ 100
Sales
Operating Profit = 64,246.60 Sales = 85,474.20
75.16%
It is good.

- 70 -
Sl.No
Ratios
Particulars (Rs in millions)
Values Remarks
07.
Gross Profit margin =
Gross Pro&it ∗ 100
Sales
Gross Profit = 63,962.20 Sales = 85,474.20
74.8%
It is good.
08.
Net Profit margin =
Net Pro&it ∗ 100
Sales
Net Profit = 44,418.10 Sales = 85,474.20
51.9%
It is good.
09.
Return on Assets =
Operating Pro&it ∗ 100
Average Assets
Operating Profit = 64,246.60 Average Assets = 67765.5
94.80%
It is satisfactory.
10.
Return on Investments =
Net Pro&it before Tax ∗ 100
Net Worth
Profit Before Tax = 63,535.80 Net Worth = 76,270.60
83.30%
It is satisfactory.
11.
Return on Net Worth =
Net Pro&it ∗ 100
Average Net worth
Net profit = 43170.50 Average Net Worth = 55284.2
78.08%
It is good.

- 71 -
Sl.No
Ratios
Particulars ( Rs in millions)
Values Remarks
12.
Operating Pro&it ∗ 100
Average Capital Employed
Return on Capital Employed =
Operating Profit = 64,246.60 Avg. Capital Employed = 77994.75
82.37%
It is satisfactory
13.
Cost of Goods Sold
Sales
Cost of Goods Sold Ratio =
Cost of goods sold = 2,718.20 Sales = 85,474.20
0.03
It is safe.
14.
Cost of Goods sold + otherExpenses
Sales
Operating Ratio =
Other Expenses = 11,779.10
0.17
It is safe.
15.
Fixed Assets turnover =
6789:
;<=9> 7::9?:
Fixed Assets = 72738.9 Sales = 85,474.20
1.17
It is not satisfactory.
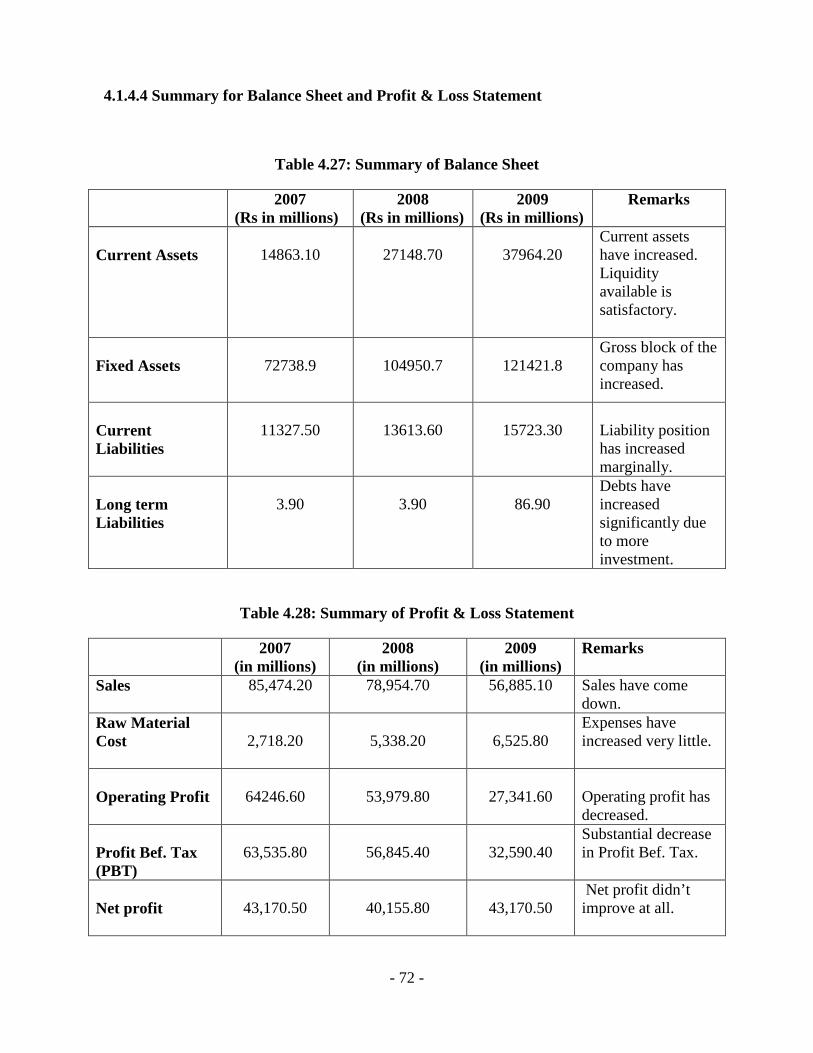
- 72 -
4.1.4.4 Summary for Balance Sheet and Profit & Loss Statement
Table 4.27: Summary of Balance Sheet
2007 (Rs in millions)
2008 (Rs in millions)
2009 (Rs in millions)
Remarks
Current Assets
14863.10
27148.70
37964.20
Current assets have increased. Liquidity available is satisfactory.
Fixed Assets
72738.9
104950.7
121421.8
Gross block of the company has increased.
Current Liabilities
11327.50
13613.60
15723.30
Liability position has increased marginally.
Long term Liabilities
3.90
3.90
86.90
Debts have increased significantly due to more investment.
Table 4.28: Summary of Profit & Loss Statement
2007 (in millions)
2008 (in millions)
2009 (in millions)
Remarks
Sales
85,474.20 78,954.70 56,885.10 Sales have come down.
Raw Material Cost
2,718.20
5,338.20
6,525.80
Expenses have increased very little.
Operating Profit
64246.60
53,979.80
27,341.60
Operating profit has decreased.
Profit Bef. Tax (PBT)
63,535.80
56,845.40
32,590.40
Substantial decrease in Profit Bef. Tax.
Net profit
43,170.50
40,155.80
43,170.50
Net profit didn’t improve at all.

- 73 -
4.1.5 GUJARAT MINERAL DEVELOPMENT CORPORATION LIMITED
Table 4.29 Balance Sheet of GMDC as at 31st Dec-2009
(Source: http://economictimes.indiatimes.com/bsheet.cms)
Liabilities Dec- 2009 (Rs in millions)
Dec- 2008 (Rs in millions)
Dec- 2007 (Rs in millions)
Share Capital 636.0 318.0 318.0
Reserves & Surplus 11551.06 10298.97 8069.33
Net Worth (1) 12187.06 10,616.97 8,387.33
Secured Loans (2) 0.00 2,000.00 9,598.29
Unsecured Loans (3) 4,785.71 4,642.86 0.00
Total Liabilities(1+2+3) 16,972.78 17,259.83 17,985.62
Assets Dec- 2009
Dec- 2008
Dec- 2007
Gross Block 18,864.06 18465.34 17917.84
(-) Acc. Depreciation 5,782.02 5037.03 4204.29
Net Block (A) 5,782.02 5037.03 4204.29
Capital Work in Prgs. (B)
19.50 134.08 329.02
Investments (C) 585.59 607.38 613.90
Inventories 591.87 482.51 293.59
Sundry Debtors 926.24 807.70 933.52
Cash And Bank 946.26 1,280.66 745.49
Loans And Advances 12,625.63 11,021.89 9,980.44
(i) 15,089.99 13,592.76 11,953.04
Current Liabilities 4,374.17 4,438.04 4,042.82
Provisions 7,540.26 6,096.85 4,936.49
(ii) 11,914.43 10,534.90 8,979.30
Net Curr. Assets (i - ii) (D)
3,175.56 3,057.86 2,973.73
Misc. Expenses (E) 110.08 32.21 355.41
Total Assets (A+B+C+D+E)
16,972.78 17,259.83 17985.62

- 74 -
Table 4.30: Profit & Loss Statement
(Source: http://economictimes.indiatimes.com/profitloss.cms)
Dec - 2009
(Rs in millions) Dec - 2008
(Rs in millions) Dec - 2007
(Rs in millions)
Sales
9,772.79 9801.22 5889.49
Other Income 452.01 556.07 338.74
Total Income 10,224.80 10357.29 6228.23
Raw Material Cost
917.77 315.58 296.92
Excise 39.33 9.34 0.78
Other Expenses
4,107.70 3882.86 2622.84
Operating Profit
4,707.99 5593.44 2968.95
Interest Name 583.54 718.67 744.96
Gross Profit
4,124.45 4874.77 2223.98
Depreciation 777.78 955.37 1293.20
Profit Bef. Tax
3,775.18 4152.78 1239.41
Tax 1,335.99 1444.64 590.74
Net Profit 2,439.19 2708.14 648.67
Other Non- Recurring Income
-125.02 -68.83 296.06
Reported Profit
2,314.18 2639.31 944.74
Equity Dividend
636.0 318.0 318.0

- 75 -
4.1.5.1 Ratio Analysis for 2009
Table 4.31: Analysis of Financial Ratios for 2009
Sl.No
Ratios
Particulars (Rs in millions)
Values Remarks
01.
Net Working Capital =
Current assets-Current liabilities
Current Assets = 15,089.99 Current Liabilities = 11,914.43
3175.56
Liquidity position is
good.
02.
Current Ratio =
Current Assets
Current Liabilities
Current Assets = 15,089.99 Current Liabilities = 11,914.43
1.26
It is not safe.
03.
Acid test or Quick ratio =
Quick Assets
Current Liabilities
Quick Assets = 14498.12 Current Liabilities = 11,914.43
1.21
It is safe.
04.
Debt-Equity Ratio =
Long term debt
Shareholder�s Equity
Total debt = 4,785.71 Shareholder Equity = 12,187.06
0.39
It is not good.
05.
Interest Coverage =
Operating Pro&it
Interest
Operating Profit = 4,707.99 Interest = 583.54
8.07
It is not safe.
06.
Operating Profit margin =
Operating Pro&it ∗ 100
Sales
Operating Profit = 4,707.99 Sales = 9,772.79
48%
It is safe.

- 76 -
Sl.No
Ratios
Particulars (Rs in millions)
Values Remarks
07.
Gross Profit margin =
Gross Pro&it ∗ 100
Sales
Gross Profit = 4,124.45 Sales = 9,772.79
42.2 %
It is satisfactory
08.
Net Profit margin =
Net Pro&it ∗ 100
Sales
Net Profit = 2,314.18 Sales = 9,772.79
23.6 %
It is not satisfactory.
09.
Return on Assets =
Operating Pro&it ∗ 100
Average Assets
Operating Profit = 4,707.99 Average Assets = 20424.17
23.05 %
It is not satisfactory.
10.
Return on Investments =
Net Pro&it before Tax ∗ 100
Net worth
Profit Before Tax = 3,775.18 Net Worth = 12,187.06
30.97 %
It is good.
11.
Return on Net Worth =
Net Pro&it ∗ 100
Average Net worth
Net profit = 2,439.19 Average Net Worth = 11402.01
21.39 %
It is not good.

- 77 -
Sl.No
Ratios
Particulars ( Rs in millions)
Values Remarks
12.
Operating Pro&it ∗ 100
Average Capital Employed
Return on Capital Employed =
Operating Profit = 4,707.99 Avg. Capital Employed = 31648.84
14.87
It is not good.
13.
Cost of Goods Sold
Sales
Cost of Goods Sold Ratio =
Cost of goods sold = 917.77 Sales = 9,772.79
0.09
It is satisfactory.
14.
Cost of Goods sold + otherExpenses
Sales
Operating Ratio =
Other Expenses = 4,107.70
0.51
It is good.
15.
Fixed Assets turnover =
6789:
;<=9> 7::9?:
Fixed Assets = 6387.11 Sales = 9,772.79
1.53
It is not good.

- 78 -
4.1.5.2 Ratio Analysis for 2008
Table 4.32: Analysis of Financial Ratios for 2008
Sl.No
Ratios
Particulars (Rs in millions)
Values Remarks
01.
Net Working Capital =
Current assets-Current liabilities
Current Assets = 13,592.76 Current Liabilities = 10,534.90
3057.86
Liquidity position is
good.
02.
Current Ratio =
Current Assets
Current Liabilities
Current Assets = 13,592.76 Current Liabilities = 10,534.90
1.29
It is not safe.
03.
Acid test or Quick ratio =
Quick Assets
Current Liabilities
Quick Assets = 13110.25 Current Liabilities = 10,534.90
1.24
It is safe.
04.
Debt-Equity Ratio =
Long term debt
Shareholder�s Equity
Total debt = 6,642.86 Shareholder Equity = 10,616.97
0.63
It is not good.
05.
Interest Coverage =
Operating Pro&it
Interest
Operating Profit = 5593.44 Interest = 718.67
7.78
It is not satisfactory.
06.
Operating Profit margin =
Operating Pro&it ∗ 100
Sales
Operating Profit = 5593.44 Sales = 9801.22
57%
It is good.

- 79 -
Sl.No
Ratios
Particulars (Rs in millions)
Values Remarks
07.
Gross Profit margin =
Gross Pro&it ∗ 100
Sales
Gross Profit = 4874.77 Sales = 9801.22
49.73%
It is satisfactory.
08.
Net Profit margin =
Net Pro&it ∗ 100
Sales
Net Profit = 2639.31 Sales = 9801.22
26.9 %
It is not good.
09.
Return on Assets =
Operating Pro&it ∗ 100
Average Assets
Operating Profit = 5593.44 Average Assets = 18235.75
30.67 %
It is satisfactory.
10.
Return on Investments =
Net Pro&it before Tax ∗ 100
Net worth
Profit Before Tax = 4152.78 Net Worth = 10,616.97
39.11 %
It is satisfactory.
11.
Return on Net Worth =
Net Pro&it ∗ 100
Average Net worth
Net profit = 2708.14 Average Net Worth = 9502.15
28.50 %
It is not good.

- 80 -
Sl.No
Ratios
Particulars ( Rs in millions)
Values Remarks
12.
Operating Pro&it ∗ 100
Average Capital Employed
Return on Capital Employed =
Operating Profit = 5593.44 Avg. Capital Employed = 27992.85
19.98%
It is not good.
13.
Cost of Goods Sold
Sales
Cost of Goods Sold Ratio =
Cost of goods sold = 315.58 Sales = 9801.22
0.032
It is not satisfactory.
14.
Cost of Goods sold + otherExpenses
Sales
Operating Ratio =
Other Expenses = 3882.86
0.43
It is not satisfactory.
15.
Fixed Assets turnover =
6789:
;<=9> 7::9?:
Fixed Assets = 5778.49 Sales = 9801.22
1.69
It is not good.

- 81 -
4.1.5.3 Ratio Analysis for 2007
Table 4.33: Analysis of Financial Ratios for 2007
Sl.No
Ratios
Particulars (Rs in millions)
Values Remarks
01.
Net Working Capital =
Current assets-Current liabilities
Current Assets = 11,953.04 Current Liabilities = 8,979.30
2973.74
Liquidity position is good.
02.
Current Ratio =
Current Assets
Current Liabilities
Current Assets = 11,953.04 Current Liabilities = 8,979.30
1.33
It is not safe.
03.
Acid test or Quick ratio =
Quick Assets
Current Liabilities
Quick Assets = 11659.45 Current Liabilities = 8,979.30
1.29
It is safe.
04.
Debt-Equity Ratio =
Long term debt
Shareholder�s Equity
Total debt = 9,598.29 Shareholder Equity = 8,387.33
1.14
It is satisfactory.
05.
Interest Coverage =
Operating Pro&it
Interest
Operating Profit = 2968.95 Interest = 744.96
3.98
It is not safe.
06.
Operating Profit margin =
Operating Pro&it ∗ 100
Sales
Operating Profit = 2968.95 Sales = 5889.49
50.41%
It is satisfactory.
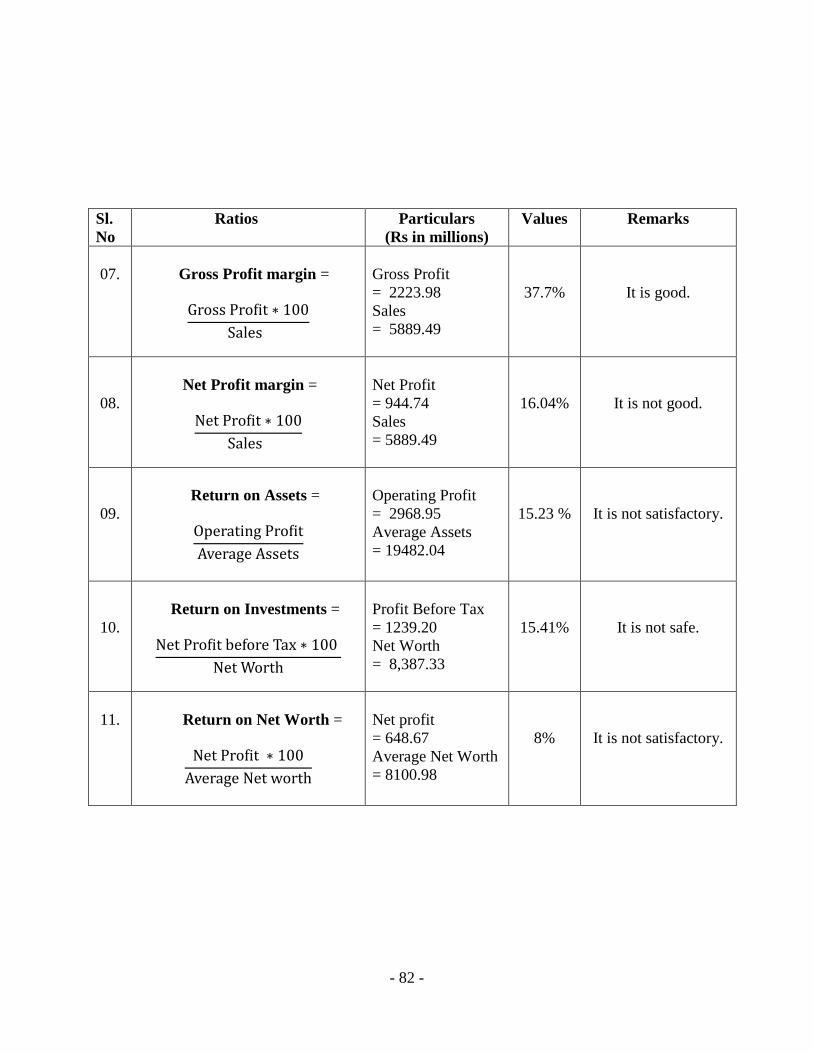
- 82 -
Sl.No
Ratios
Particulars (Rs in millions)
Values Remarks
07.
Gross Profit margin =
Gross Pro&it ∗ 100
Sales
Gross Profit = 2223.98 Sales = 5889.49
37.7%
It is good.
08.
Net Profit margin =
Net Pro&it ∗ 100
Sales
Net Profit = 944.74 Sales = 5889.49
16.04%
It is not good.
09.
Return on Assets =
Operating Pro&it
Average Assets
Operating Profit = 2968.95 Average Assets = 19482.04
15.23 %
It is not satisfactory.
10.
Return on Investments =
Net Pro&it before Tax ∗ 100
Net Worth
Profit Before Tax = 1239.20 Net Worth = 8,387.33
15.41%
It is not safe.
11.
Return on Net Worth =
Net Pro&it ∗ 100
Average Net worth
Net profit = 648.67 Average Net Worth = 8100.98
8%
It is not satisfactory.

- 83 -
Sl.No
Ratios
Particulars (Rs in millions)
Values Remarks
12. Operating Pro&it ∗ 100
Average Capital Employed
Return on Capital Employed =
Operating Profit = 2968.95 Avg. Capital Employed = 25762.88
11.52%
It is not satisfactory
13.
Cost of Goods Sold
Sales
Cost of Goods Sold Ratio =
Cost of goods sold = 296.92 Sales = 5889.49
0.05
It is good.
14.
Cost of Goods sold + otherExpenses
Sales
Operating Ratio =
Other Expenses = 2622.84
0.49
It is not good.
15.
Fixed Assets turnover =
6789:
;<=9> 7::9?:
Fixed Assets = 5147.21 Sales = 5889.49
1.14
It is not safe.

- 84 -
4.1.5.4 Summary for Balance Sheet and Profit & Loss Statement
Table 4.34: Summary of Balance Sheet
2007 (Rs in millions)
2008 (Rs in millions)
2009 (Rs in millions)
Remarks
Current Assets
11953.04
13592.76
15089.9
Current Assets have increased.
Fixed Assets
5147.21
5778.49
6387.11
Fixed Assets have increased marginally.
Current Liabilities
8979.30
10534.90
11914.43
Liabilities have increased. Liquidity position not affected.
Long term Liabilities
9598.29
6642.86
4785.71
Long term debts have been paid off.
Table 4.35: Summary of Profit & Loss Statement
2007 (Rs in millions)
2008 (Rs in millions)
2009 (Rs in millions)
Remarks
Sales
5889.49 9801.22 9,772.79 Sales have increased by 65.9 %
Raw Material Cost
296.92
315.58
917.77
Expenses have increased.
Operating Profit
2968.95
5593.44
4,707.99
Operating profit has increased.
Profit Bef. Tax (PBT)
1239.41
4152.78
3,775.18
PBT has increased.
Net profit
648.67
2708.14
2,439.19
Net profit has increased by 276 %
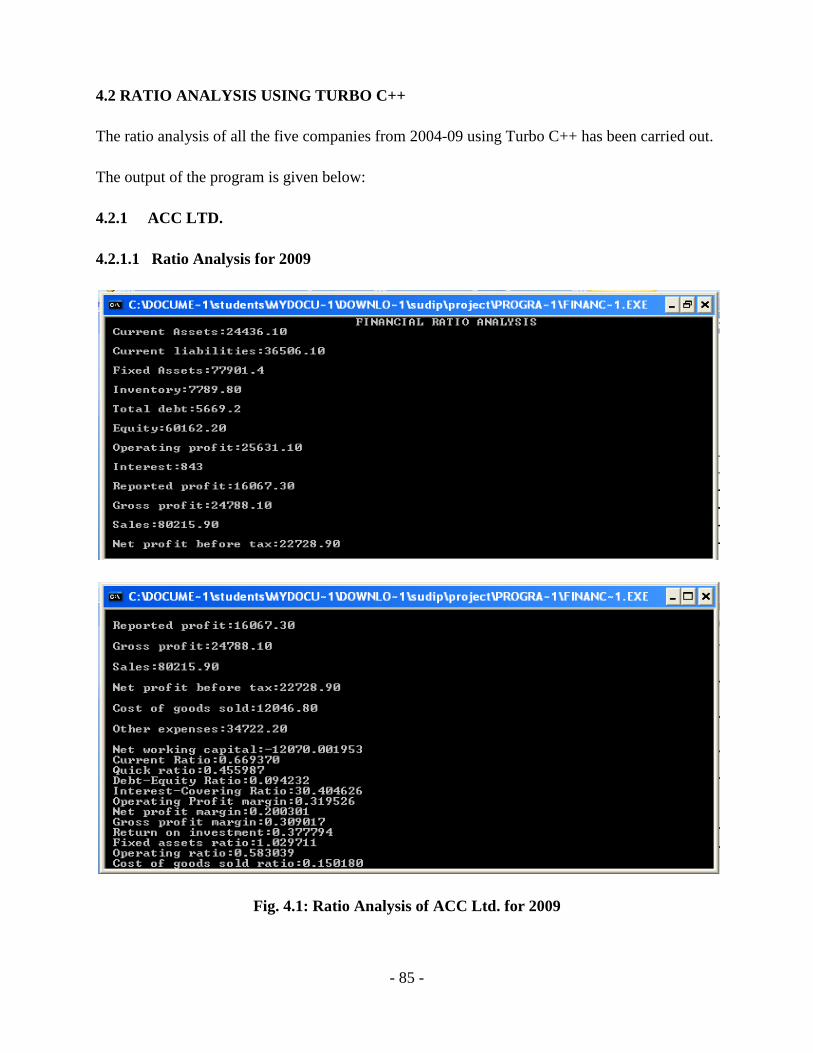
- 85 -
4.2 RATIO ANALYSIS USING TURBO C++
The ratio analysis of all the five companies from 2004-09 using Turbo C++ has been carried out.
The output of the program is given below:
4.2.1 ACC LTD.
4.2.1.1 Ratio Analysis for 2009
Fig. 4.1: Ratio Analysis of ACC Ltd. for 2009

- 86 -
4.2.1.2 Ratio Analysis of ACC Ltd. 2008
Fig. 4.2: Ratio Analysis of ACC Ltd. for 2008

- 87 -
4.2.1.3 Ratio Analysis for 2007
Fig. 4.3: Ratio Analysis of ACC Ltd. for 2007
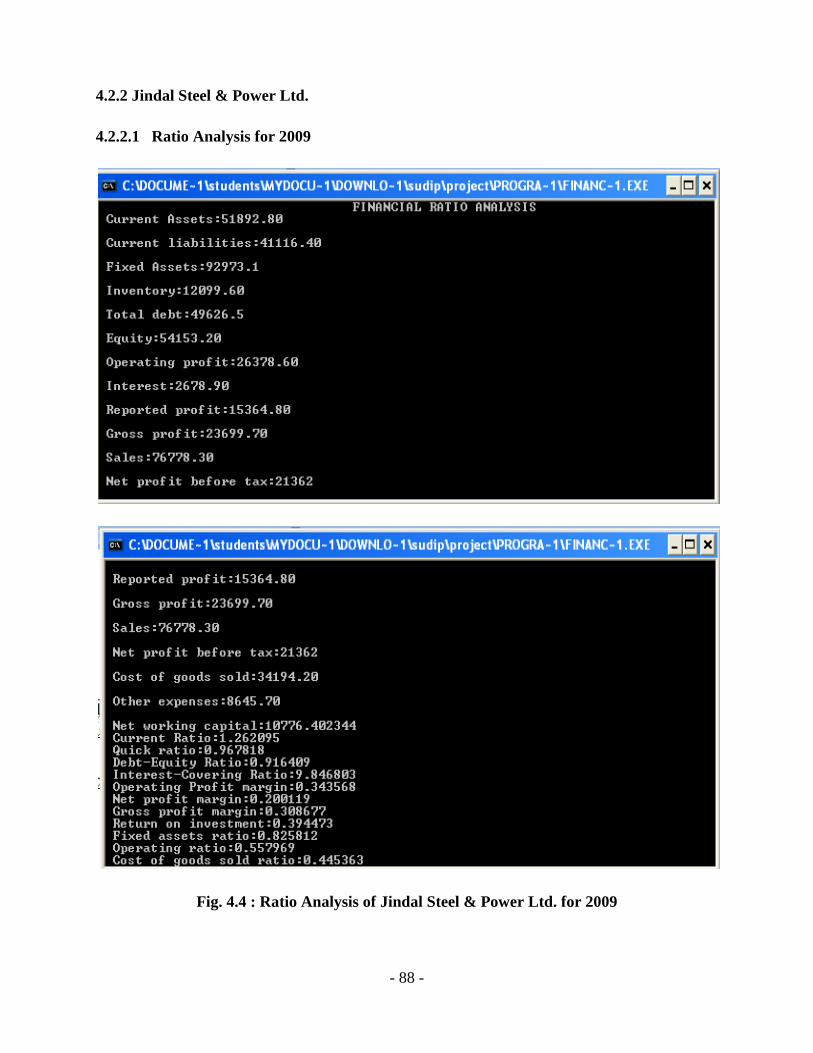
- 88 -
4.2.2 Jindal Steel & Power Ltd.
4.2.2.1 Ratio Analysis for 2009
Fig. 4.4 : Ratio Analysis of Jindal Steel & Power Ltd. for 2009

- 89 -
4.2.2.2 Ratio Analysis for 2008
Fig. 4.5: Ratio Analysis of Jindal Steel & Power Ltd. for 2008

- 90 -
4.2.2.3 Ratio Analysis for 2007
Fig. 4.6: Ratio Analysis of Jindal Steel & Power Ltd. for 2007

- 91 -
4.2.3 Tata Steel
4.2.3.1 Ratio Analysis for 2009
Fig. 4.7 : Ratio Analysis of Tata Steel for 2009

- 92 -
4.2.3.2 Ratio Analysis for 2008
Fig. 4.8: Ratio Analysis of Tata Steel for 2008

- 93 -
4.2.3.3 Ratio Analysis for 2007
Fig. 4.9 : Ratio Analysis of Tata Steel for 2007

- 94 -
4.2.4 Hindustan Zinc Limited
4.2.4.1 Ratio Analysis for 2009
Fig. 4.10: Ratio Analysis of HZL for 2009

- 95 -
4.2.4.2 Ratio Analysis for 2008
Fig. 4.11 : Ratio Analysis of HZL for 2008

- 96 -
4.2.4.3 Ratio Analysis for 2007
Fig. 4.12: Ratio Analysis of HZL for 2007

- 97 -
4.2.5 Gujarat Mineral Development Corporation
4.2.5.1 Ratio Analysis for 2009
Fig. 4.13: Ratio Analysis of GMDC for 2009

- 98 -
4.2.5.2 Ratio Analysis for 2008
Fig. 4.14: Ratio Analysis of GMDC for 2008
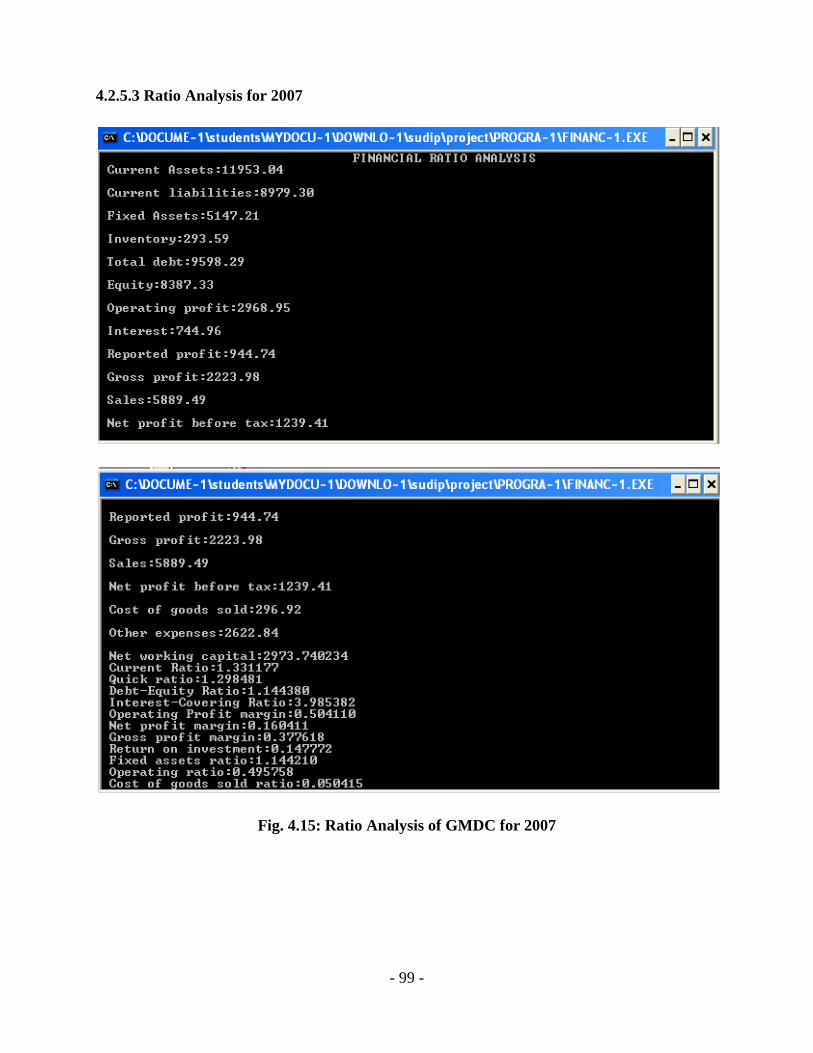
- 99 -
4.2.5.3 Ratio Analysis for 2007
Fig. 4.15: Ratio Analysis of GMDC for 2007

- 100 -
4.3 RATIO ANALYSIS USING TALLY 9.0
Tally 9.0 manufactured by Tally Solutions FZ LLC, Dubai, and Tally India Private Limited. It
facilitates smooth and error free Excise Accounting for manufacturers and dealers engaged in
manufacturing or trading of excisable goods. It is mainly used for the calculation of excise
duties, taxes and other transactions. In this project Tally 9.0 is used to compute the balance sheet
and the financial ratios of companies that can be obtained from it. However Tally 9.0 has
certain limitations. It has been used to calculate only current ratio, quick ratio and debt – equity
ratio. In future the version can be modified to calculate other ratios.
Preparation of balance sheet and ratio analysis of all the five companies from 2004-09 using
Tally 9.0 has been carried out below:
4.3.1 ACC Ltd.
4.3.1.1 Balance Sheet and Ratio Analysis For 2009
Fig. 4.16: Preparation of Balance Sheet of ACC Ltd. for 2009
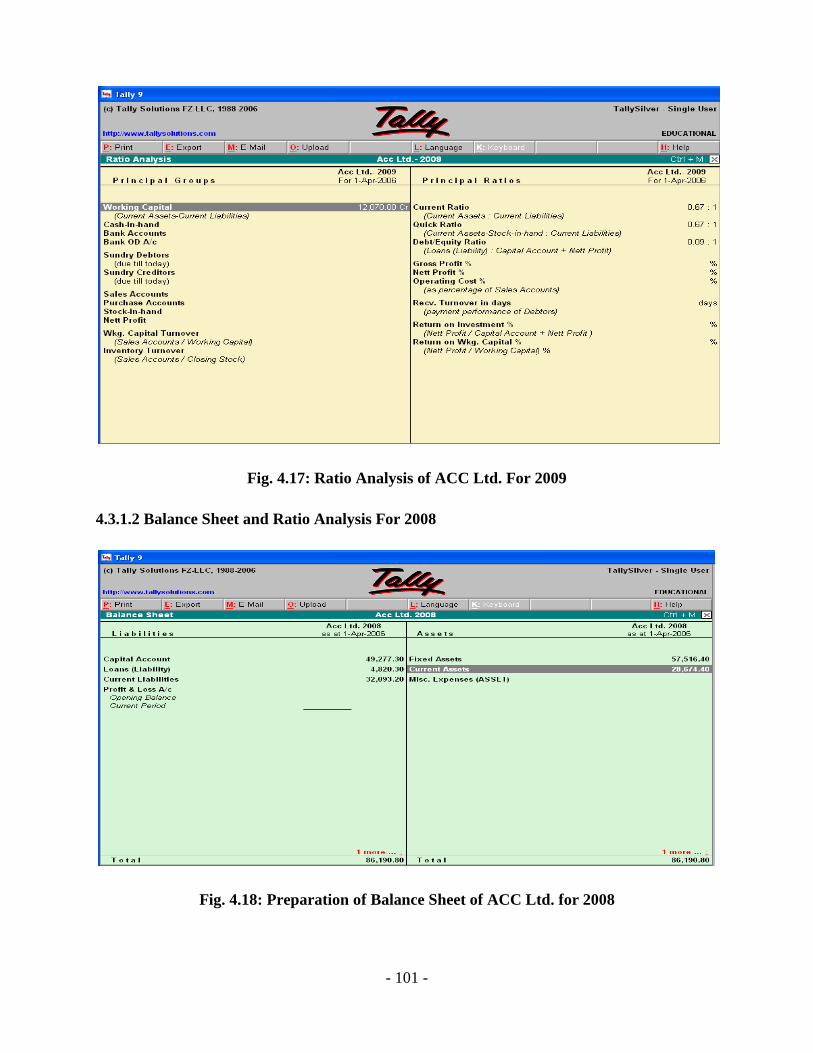
- 101 -
Fig. 4.17: Ratio Analysis of ACC Ltd. For 2009
4.3.1.2 Balance Sheet and Ratio Analysis For 2008
Fig. 4.18: Preparation of Balance Sheet of ACC Ltd. for 2008

- 102 -
Fig. 4.19: Ratio Analysis of ACC Ltd. For 2008
4.3.1.3 Balance Sheet and Ratio Analysis For 2007
Fig. 4.20: Preparation of Balance Sheet of ACC Ltd. for 2007
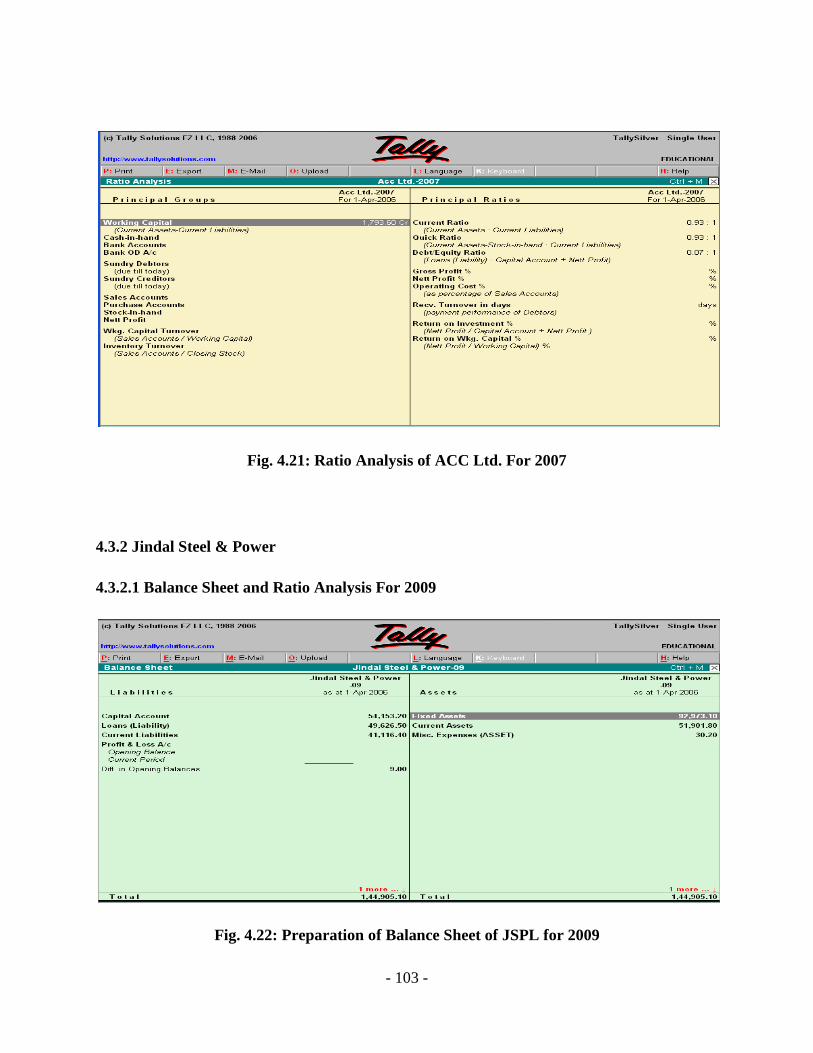
- 103 -
Fig. 4.21: Ratio Analysis of ACC Ltd. For 2007
4.3.2 Jindal Steel & Power
4.3.2.1 Balance Sheet and Ratio Analysis For 2009
Fig. 4.22: Preparation of Balance Sheet of JSPL for 2009

- 104 -
Fig. 4.23: Ratio Analysis of JSPL For 2009
4.3.2.2 Balance Sheet and Ratio Analysis For 2008
Fig. 4.24: Preparation of Balance Sheet of JSPL for 2008
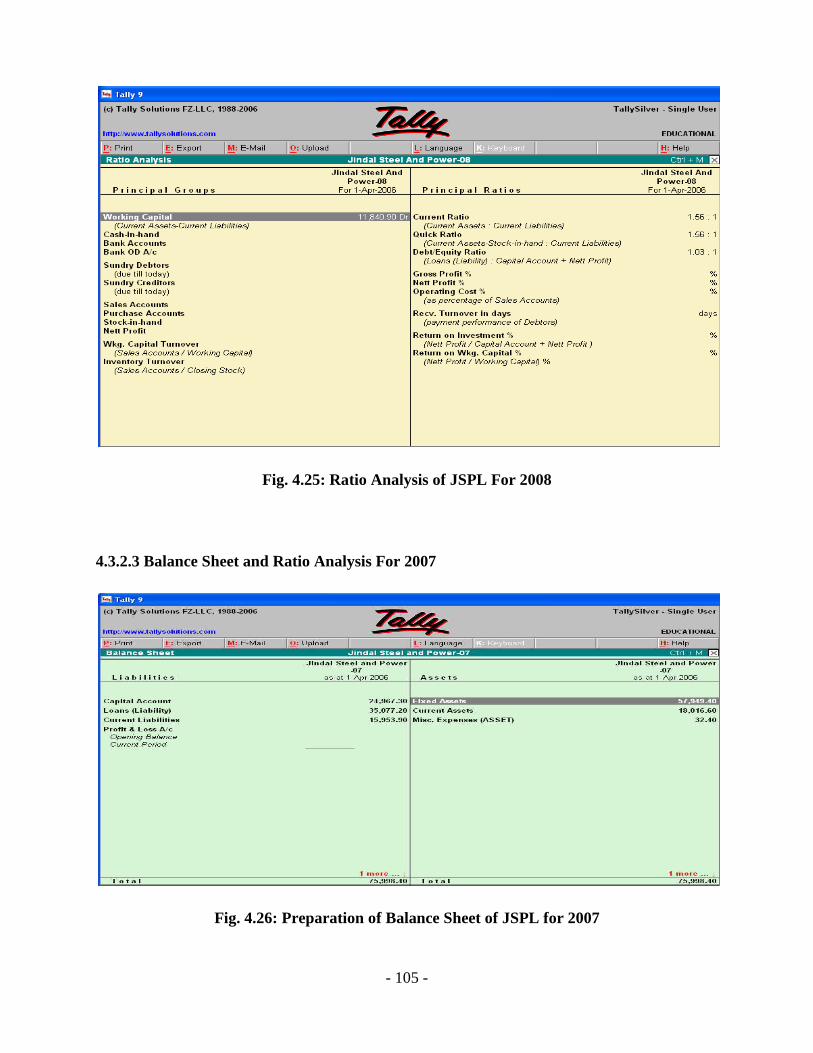
- 105 -
Fig. 4.25: Ratio Analysis of JSPL For 2008
4.3.2.3 Balance Sheet and Ratio Analysis For 2007
Fig. 4.26: Preparation of Balance Sheet of JSPL for 2007

- 106 -
Fig. 4.27: Ratio Analysis of JSPL For 2007
4.3.3 Tata Steel
4.3.3.1 Balance Sheet and Ratio Analysis For 2009
Fig. 4.28: Preparation of Balance Sheet of Tata Steel for 2009

- 107 -
Fig. 4.29: Ratio Analysis of Tata Steel For 2009
4.3.3.2 Balance Sheet and Ratio Analysis For 2008
Fig. 4.30: Preparation of Balance Sheet of Tata Steel for 2008

- 108 -
Fig. 4.31: Ratio Analysis of Tata Steel For 2008
4.3.3.3 Balance Sheet and Ratio Analysis For 2007
Fig. 4.32: Preparation of Balance Sheet of Tata Steel for 2007

- 109 -
Fig. 4.33: Ratio Analysis of Tata Steel For 2007
4.3.4 Hindustan Zinc Ltd.
4.3.4.1 Balance Sheet and Ratio Analysis For 2009
Fig. 4.34: Preparation of Balance Sheet of HZL for 2009

- 110 -
Fig. 4.35: Ratio Analysis of HZL for 2009
4.3.4.2 Balance Sheet and Ratio Analysis For 2008
Fig. 4.36: Preparation of Balance Sheet of HZL for 2008

- 111 -
Fig. 4.37: Ratio Analysis of Tata Steel For 2009
4.3.4.3 Balance Sheet and Ratio Analysis For 2007
Fig. 4.38: Preparation of Balance Sheet of HZL for 2007

- 112 -
Fig. 4.39: Ratio Analysis of Tata Steel For 2007
4.3.5 Gujarat Mineral Development Corporation
4.3.5.1 Balance Sheet and Ratio Analysis For 2009
Fig. 4.40: Preparation of Balance Sheet of GMDC for 2009

- 113 -
Fig. 4.41: Ratio Analysis of GMDC For 2009
4.3.5.2 Balance Sheet and Ratio Analysis For 2008
Fig. 4.42: Preparation of Balance Sheet of GMDC for 2008

- 114 -
Fig. 4.43: Ratio Analysis of GMDC For 2008
4.3.5.3 Balance Sheet and Ratio Analysis For 2007
Fig. 4.44: Preparation of Balance Sheet of GMDC for 2007

- 115 -
Fig. 4.45: Ratio Analysis of GMDC for 2007

- 116 -
CHAPTER -05
VARIATION OF FINANCIAL RATIOS
The variation of different financial ratios from 2004-09 of all the companies has been shown
below:
5.1 ACC Ltd.
Fig. 5.1: Variation of ratios of ACC Ltd.
0
0.1
0.2
0.3
0.4
0.5
0.6
0.7
0.8
0.9
1
Cu
rre
nt
Ra
tio
Years
0
0.1
0.2
0.3
0.4
0.5
0.6
De
bt
-Eq
uit
y
Years
0
5
10
15
20
25
Ne
t P
rofi
t M
arg
in (
in %
)
Years
05
101520253035404550
Re
turn
on
In
ve
stm
en
t (i
n %
)
Years

- 117 -
5.2 JINDAL STEEL & POWER LTD.
Fig. 5.2: Variation of ratios of Jindal Steel & Power Ltd.
0
0.2
0.4
0.6
0.8
1
1.2
1.4
1.6
Cu
rre
nt
Ra
tio
Years
0
0.2
0.4
0.6
0.8
1
1.2
1.4
1.6
De
bt-
Eq
uit
y
Years
1818.5
1919.5
2020.5
2121.5
2222.5
2323.5
Ne
t P
rofi
t m
arg
in (
in %
)
Years
0
10
20
30
40
50
60
Re
turn
on
In
ve
stm
en
t (i
n %
)
Years

- 118 -
5.3 TATA STEEL
Fig. 5.3: Variation of ratios of Tata Steel
0
0.5
1
1.5
2
2.5
3
3.5
4
4.5
Cu
rre
nt
Ra
tio
Years
0
0.1
0.2
0.3
0.4
0.5
0.6
0.7
0.8
0.9
1
De
bt-
Eq
uit
y
Years
19.520
20.521
21.522
22.523
23.524
24.5
Ne
t P
rofi
t M
arg
in (
in %
)
Years
0
10
20
30
40
50
60
70
80
Re
turn
on
In
ve
stm
en
t (i
n %
)
Years

- 119 -
5.4 HINDUSTAN ZINC LIMITED
Fig. 5.4: Variation of ratios of HZL
0
0.5
1
1.5
2
2.5
3
Cu
rre
nt
Ra
tio
Years
0
0.05
0.1
0.15
0.2
0.25
0.3
De
bt
-Eq
uit
y
Years
0
10
20
30
40
50
60
Ne
t P
rofi
t M
arg
in (
in %
)
Years
0
10
20
30
40
50
60
70
80
90
Re
turn
on
In
ve
stm
en
t (
in %
)
Years

- 120 -
5.5 GUJARAT MINERAL DEVELOPMENT CORPORATION
Fig. 5.5: Variation of ratios of GMDC
0
0.5
1
1.5
2
2.5
3
Cu
rre
nt
Ra
tio
Years
0
0.2
0.4
0.6
0.8
1
1.2
1.4
1.6
De
bt
-Eq
uit
y
Years
0
5
10
15
20
25
30
Ne
t P
rofi
t M
arg
in (
in %
)
Years
0
5
10
15
20
25
30
35
40
45
Re
turn
on
In
ve
stm
en
t (i
n %
)
Years

- 121 -
CHAPTER -06
COMPARISON OF RATIO ANALYSIS OF ALL COMPANIES
Financial ratios of all the companies from 2004-09 has been compared below:
6.1 Comparison of Current ratio of Different Companies from 2004-09
Table 6.1: Comparison of Current ratio
From the above table, it can be concluded that current ratio of ACC Ltd. was always less than 1
from 2004 -09. Short term liquidity of Jindal Steel & Power Ltd. and HZL was good as current
ratio was more than 1. Liquidity position of Tata steel was not satisfactory as the ratio varied
from 0.71 to 0.97 in five years. Current ratio of GMDC was more than 1 from 2004-09.
ACC JSPL
TATA STEEL
HZL GMDC REMARKS
Dec , 2004-05
0.81
1.34
0.71
1.17
2.48
GMDC has a better ratio
Dec , 2005-06
0.94
1.26
0.72
1.54
1.96
GMDC has a better ratio
Dec , 2006-07
0.86
1.1
1.77
1.31
1.33
Tata Steel has a better ratio
Dec , 2007-08
0.89
1.5
3.92
1.99
1.29
HZL has a better ratio
Dec , 2008-09
0.66
1.26
0.97
2.39
1.26
HZL has a better ratio

- 122 -
Fig. 6.1: Comparison of Current ratio of all companies
In this graph, Tata steel has the highest current ratio of 3.92 in the year 2007- 08, followed by
others. By 2008 -09, the ratio of Tata steel dropped to 0.97, with HZL has the highest ratio of
2.39 and JSPL & GMDC with 1.26. It can also be seen that, in the period of 5 years HZL has
improved its liquidity position compared to others, while positions of companies like Tata Steel
and GMDC have come down. Current ratio of Tata Steel decreased steeply from 2007 -09 due to
its decrease in current assets position.
6.2 Comparison of Debt –Equity ratio Different Companies from 2004-09
Table 6.2: Comparison of Debt –Equity ratio
ACC JSPL
TATA STEEL
HZL GMDC Remarks
Dec , 2004-05
0.5
1.13
0.38
0.27
1.45
JSPL has a better ratio
Dec , 2005-06
0.24
1.48
0.25
0.16
1.38 GMDC has a better ratio
Dec , 2006-07
0.07
1.4
0.68
0.00005
1.14 GMDC has a better ratio
Dec , 2007-08
0.1 1
0.66
0.000033
0.63
JSPL has a better ratio
Dec , 2008-09
0.09
0.91
0.91
0.0006
0.39 JSPL &Tata Steel has a better ratio
0
0.5
1
1.5
2
2.5
3
3.5
4
4.5
dec ,2004- 05 dec,2005-06 dec,2006-07 dec,2007-08 dec,2008-09
ACC Ltd
Tata Steel
JSPL
GMDC
HZLCu
rre
nt
Ra
tio

- 123 -
From table 6.2 it can be seen that D-E ratio of ACC Ltd. decreased from 0.5 to 0.07 from 2004 -
07 and then increased to 0.09 in 2009. Debt position of JSPL was satisfactory as the ratio varied
from 1.13 to 0.91 from 2004-09. Similarly debt position of GMDC was more than 1 from 2004-
07 because of increasing investment and then came down to 0.39. However D-E ratio of Tata
Steel & HZL remained less than 1 from 2004-09 as their debts were paid off.
Fig. 6.2: Comparison of Debt –Equity ratio of all Companies
From the preceding graph it can be concluded that JSPL has the highest debt- equity ratio of 1.48
and 1.40 from 2005-07 compared to other companies. Tata Steel has improved its ratio from 0.38
to 0.91 in five years. Though owner’s share in the company has decreased but more outsiders
have started investing in the company and that has lead to desirable ratio. GMDC has performed
very badly as the ratio came down from 1.45 to 0.39. This is due to decrease in investment of
creditor’s. Investment in ACC Ltd. and HZL have also come down in the five years.
0
0.2
0.4
0.6
0.8
1
1.2
1.4
1.6
dec ,2004- 05 dec,2005-06 dec,2006-07 dec,2007-08 dec,2008-09
ACC Ltd.
Tata Steel
JSPL
GMDC
HZL
De
bt-
Eq
uit
y
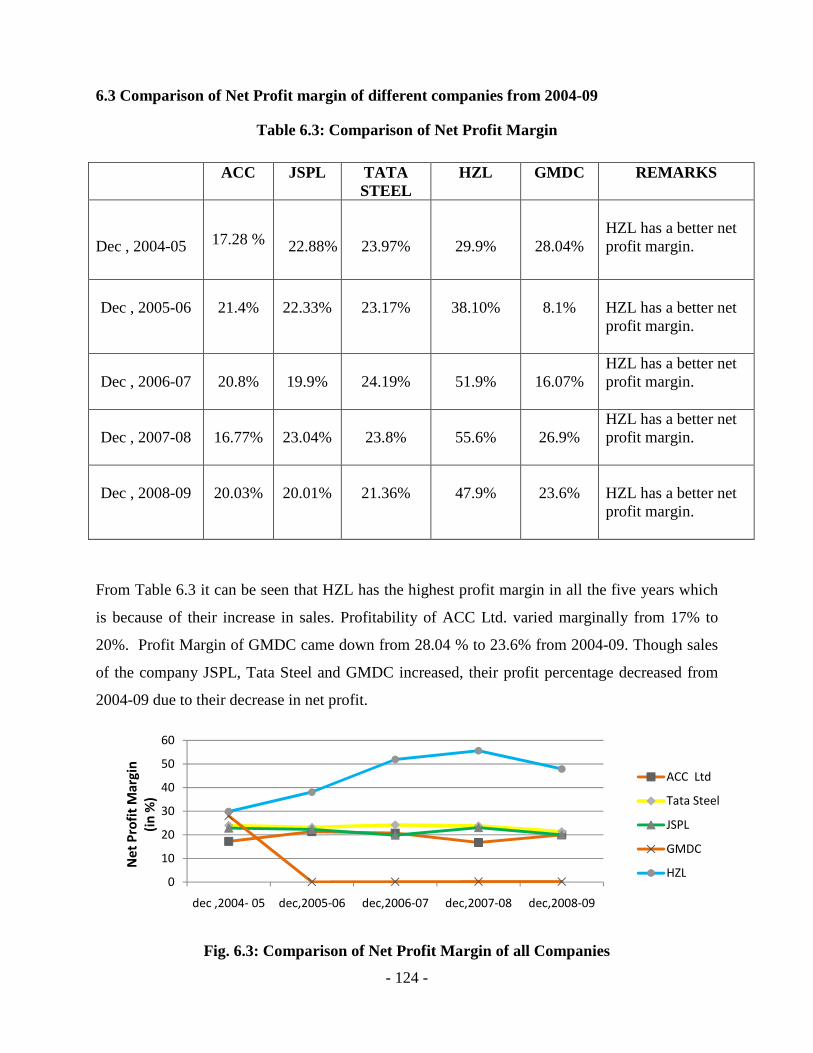
- 124 -
6.3 Comparison of Net Profit margin of different companies from 2004-09
Table 6.3: Comparison of Net Profit Margin
From Table 6.3 it can be seen that HZL has the highest profit margin in all the five years which
is because of their increase in sales. Profitability of ACC Ltd. varied marginally from 17% to
20%. Profit Margin of GMDC came down from 28.04 % to 23.6% from 2004-09. Though sales
of the company JSPL, Tata Steel and GMDC increased, their profit percentage decreased from
2004-09 due to their decrease in net profit.
Fig. 6.3: Comparison of Net Profit Margin of all Companies
0
10
20
30
40
50
60
dec ,2004- 05 dec,2005-06 dec,2006-07 dec,2007-08 dec,2008-09
ACC Ltd
Tata Steel
JSPL
GMDC
HZL
Ne
t P
rofi
t M
arg
in
(in
%)
ACC JSPL
TATA STEEL
HZL GMDC REMARKS
Dec , 2004-05
17.28 %
22.88%
23.97%
29.9%
28.04%
HZL has a better net profit margin.
Dec , 2005-06
21.4%
22.33%
23.17%
38.10%
8.1%
HZL has a better net profit margin.
Dec , 2006-07
20.8%
19.9%
24.19%
51.9%
16.07%
HZL has a better net profit margin.
Dec , 2007-08
16.77%
23.04%
23.8%
55.6%
26.9%
HZL has a better net profit margin.
Dec , 2008-09
20.03%
20.01%
21.36%
47.9%
23.6%
HZL has a better net profit margin.

- 125 -
HZL remained the single most profitable firm in the five years with net profit increasing from
29% in 2004-05 to 47% in 2008-09. Tata Steel and JSPL maintained a constant growth for the
period while net profit of GMDC after declining for the first two years increased up to 23 % in
the last year. Profit Margin for ACC Ltd. fluctuated during the period from 17 % to 20 %.
6.4 Comparison of ROI of Different Companies from 2004-09
Table 6.4: Comparison of ROI
ACC JSPL Tata Steel HZL GMDC Remarks
Dec , 2004-05
18.16%
52.31%
74.57%
43.04%
22.41%
Tata steel has a better ratio
Dec , 2005-06
45.37%
39.64%
53.28%
63.94%
8.63%
HZL has a better ratio
Dec , 2006-07
41%
37.48%
44.89%
83.30%
14.77%
HZL has a better ratio
Dec , 2007-08
33.70%
44.14%
25.01%
47.91%
39.11%
HZL has a better ratio
Dec , 2008-09
37.7%
39.44%
23.62%
22.69%
30.97%
JSPL has a better ratio
From the above table it can be seen that ROI of ACC Ltd. increased from 18.16% to 37.7% in
five years due to substantial increase in its profit before tax. Similarly ROI of GMDC increased
marginally from 22.41% to 30.97 %. From 2005- 09 overall profitability of HZL was better than
other companies, though its ROI decreased from 43.04 % to 22.69%. ROI of Tata Steel was
highest in 2004-05 with 74.57% and then it declined to 23.62%. Similarly ROI of JSPL
decreased from 52.31 % to 39.41 % due to significant increase in its expenses.

Fig. 6.4: Comparison of ROI of all Companies
From the graph it can be concluded that, overall profitability of GMDC has improve
five years from 22.41% in 2004-
in profit before tax. ROI of Tata St
increase in its expenses. Profitability of ACC Ltd. after rising
came down to 33.70% in the next two years
year. ROI of HZL increased gradually from
because of fall in operating profit during
2004-05 to 39.41 % 2008-09.
0
10
20
30
40
50
60
70
80
90
dec ,2004- 05 dec,2005
Re
turn
on
In
ve
stm
en
t
(in
%)
- 126 -
6.4: Comparison of ROI of all Companies
From the graph it can be concluded that, overall profitability of GMDC has improve
-05 to 30.97% in 2008-09. This is because of their improvement
a Steel declined steeply from 74.57% to 23.62% due to substantial
Profitability of ACC Ltd. after rising steeply in the first year
in the next two years, and then increased marginally to
HZL increased gradually from 43.04 % to 83.30 % and then decreased
rofit during the period. ROI of JSPL decreased from
dec,2005-06 dec,2006-07 dec,2007-08 dec,2008-09
From the graph it can be concluded that, overall profitability of GMDC has improved in the last
This is because of their improvement
due to substantial
the first year to 45.37 %
increased marginally to 37.7% the last
and then decreased to 22.69%
L decreased from 52.31 % in
ACC Ltd.
Tata Steel
JSPL
GMDC
HZL

- 127 -
CONCLUSION
Analysis and interpretation of financial statements is an important tool in assessing company’s
performance. It reveals the strengths and weaknesses of a firm. It helps the clients to decide in
which firm the risk is less or in which one they should invest so that maximum benefit can be
earned. It is known that investing in any company involves a lot of risk. So before putting up
money in any company one must have thorough knowledge about its past records and
performances. Based on the data available the trend of the company can be predicted in near
future.
This project mainly focuses on the basics of different types of financial statements. Balance
Sheet and Profit & Loss statements of five different coal and non coal mining companies have
been studied.
From ratio analysis of Balance Sheet and P & L Statement of ACC Ltd. of 2007-09 it was
concluded that liquidity position of the company is not good. Current ratio, debt-equity ratio,
quick ratio, net profit margin, operating profit margin, gross profit margin, return on assets,
return on investments and return on capital employed were found to be unacceptable.
Short term liquidity position of JSPL in 2007 was good. However, current ratio, quick ratio, net
profit margin, return on assets, return on investments and return on capital employed were
unsatisfactory. The ratios that are found to be desirable are debt-equity ratio, operating profit
margin and gross profit margin.
In 2008-09, net working capital available with the company was adequate. The ratios that were
found to be satisfactory are quick ratio, debt-equity ratio, return on investments, return on net
worth, operating profit margin and gross profit margin. Current ratio, return on capital employed,
return on assets and net profit margin of the company were unacceptable.
For Tata Steel in 2007, net working capital, quick ratio, return on investments, return on net
worth, operating profit margin and gross profit margin of the company were satisfactory.
However, debt-equity ratio, current ratio, net profit margin, return on capital employed and
return on assets were undesirable.

- 128 -
In 2008, only company’s current ratio improved due to substantial increase in current assets
position. In 2009, net working capital available was inadequate. Company’s debt-equity ratio,
operating profit margin and gross profit margin were desirable and current ratio, return on
investments, return on net worth, return on capital employed and return on assets were found to
be unsatisfactory.
Short term liquidity position of HZL was good in 2007. The ratios that were found to be
satisfactory are operating profit margin, gross profit margin, net profit margin, return on capital
employed, return on assets and return on net worth. Current ratio, quick ratio and debt-equity
ratio were undesirable. In 2008, current assets position improved further that resulted in better
current ratio and quick ratio. Debt-equity ratio was very low due to less investment. In 2009,
return on capital employed, return on assets, return on investment and return on net worth
remained unsatisfactory.
For GMDC in 2007, net working capital available was adequate. Quick ratio, debt-equity ratio,
operating profit margin and gross profit margin of the company was also desirable. However
company’s net profit margin, return on capital employed, return on assets, return on investment
and return on net worth were undesirable. In 2008 & 2009, only debt-equity ratio of the company
decreased as the debts have been cleared.
Three computer programs using turbo C++ were developed for preparation of balance sheet,
profit & loss statement and for calculation of different financial ratios. However, only eleven
ratios could be calculated with it. In near future the program can be upgraded to calculate more
ratios.
Tally 9.0 is used for analyzing the balance sheet and profit & loss statements of a company and
calculating the financial ratios. In this project Tally 9.0 is used to prepare the balance sheet and
calculate the financial ratios of different companies. Profit & Loss Statements of companies were
not calculated as Tally 9.0 has limitations in processing the data that was available. However,
only three ratios viz. current ratio, quick ratio and debt-equity ratio were calculated. An
advanced version can be developed for calculation of profit & loss statements and other financial
ratios.

- 129 -
In this project, comparison of different ratios viz. current ratio, debt-equity ratio, net profit
margin and return on investment of all the companies from 2004-09 has been done.
It was observed that current ratio of ACC Ltd. was always less than 1 from 2004 -09 which
indicates that liquidity position of the company was not good. Current ratio of Jindal Steel &
Power Ltd. and HZL was satisfactory as it remained more than 1 for all the five years. Liquidity
position of Tata steel was not satisfactory as the ratio varied marginally from 0.71 to 0.97 in five
years whereas current ratio of GMDC decreased from 2.48 to 1.26.
D-E ratio of ACC Ltd. decreased from 0.5 to 0.07 from 2004 -07 and then increased to 0.09 in
2009 which indicates the debts have been cleared. Debt position of JSPL was satisfactory as the
ratio varied from 1.13 to 0.91 from 2004-09. GMDC’s D-E ratio was 1.45 from 2004-07 because
of increasing investment and then came down to 0.39. However D-E ratio of Tata Steel & HZL
was less than 1 in five years as their debts were paid off.
From 2004-09, net profit margin of HZL increased from 29.9% to 47.9%. It remained the most
profit making company compared to others due to their substantial increase in sales. Profitability
of ACC Ltd. varied marginally from 17.28% to 20.03%. Profit Margin of GMDC came down
from 28.04% in 2004-05 to 23.6% in 2008-09. Though sales of the company JSPL, Tata Steel
and GMDC increased, their profit percentage decreased from 2004-09 due to their decrease in
net profit.
ROI of ACC Ltd. increased from 18.16% to 37.7% in five years due to substantial increase in its
profit before tax. Similarly, ROI of GMDC increased marginally from 22.41% to 30.97% in five
years. From 2004- 06, ROI of HZL increased from 43.04% to 83.30% and in 2009 it declined to
22.69%. ROI of Tata Steel was highest in 2004-05 with 74.57% and then it declined to 23.62%.
Similarly ROI of JSPL decreased from 52.31% to 39.44%.

- 130 -
REFERENCES
• Khan, M.Y. (1988). “Financial Management”, Tata Mc-Graw Hill , New Delhi, 1st
edition, Chapter -03 , Financial Statement Analysis: Ratio Analysis, pp.114-158
• Bhattacharya, Asish. K. (2007). “Introduction to Financial Statement Analysis”, Elsevier
, New Delhi , 1st edition, Chapter -03 , Ratio Analysis, pp.32-45
• Wanless, R.M. (1983). “Finance For Mine Management”, Chapman & Hall Ltd , New
York , 1st edition, Chapter -06 , Financial Accounting , pp. 109-112
• Khanna, O.P. (1999). “Industrial Engineering And management” , Dhanpat Rai , 1st
edition, New Delhi ,Chapter -26 , Financial Management, pp. 26.11-26.21
• Balagurusamy, E. (1994). “Object Oriented Programming With C++” , Tata Mc-Graw
Hill , New Delhi, 3rd edition, Chapter -02 , Beginning With C++, pp.19-35
• Nidhani, A.K. and Nidhani, K.K. (2008). “Simple Tally 9”, BPB publication , New
Delhi, 1st edition, Chapter -02 , Charts of Accounts , pp 17-33
Web References:
• http://en.wikipedia.org/wiki/Financial_statements
• http://en.wikipedia.org/wiki/Balance_sheet
• http://en.wikipedia.org/wiki/Asset
• http://en.wikipedia.org/wiki/Liability_%28financial_accounting%29
• http://en.wikipedia.org/wiki/Secured_loan
• http://en.wikipedia.org/wiki/Financial_statement
• http://en.wikipedia.org/wiki/Unsecured_loan
• http://en.wikipedia.org/wiki/Income_statement
• http://en.wikipedia.org/wiki/Cash_flow_statement
• www.jpec.org/handouts/jpec71.pdf
• http://en.wikipedia.org/wiki/Statement_of_retained_earnings
• http://en.wikipedia.org/wiki/Retention_ratio
• http://economictimes.indiatimes.com/bsheet.cms
• http://economictimes.indiatimes.com/profitloss.cms


![FIL_Warren Buffett and Interpretation of Financial Statements[1].pdf](https://static.fdocuments.in/doc/165x107/55cf96a7550346d0338cee96/filwarren-buffett-and-interpretation-of-financial-statements1pdf.jpg)
