National Bank of Romania - BNR · Foreword In August 2005, the National Bank of Romania adopted a...
49
Transcript of National Bank of Romania - BNR · Foreword In August 2005, the National Bank of Romania adopted a...
National Bank of Romania
INFLATION REPORT
February 2012
Year VIII, No. 27
New Series

N O T E
Some of the data are still provisional and will be updated as appropriatein the subsequent issues.
The source of statistical data used in charts and tables was mentioned only when they were provided by other institutions.
Reproduction of the publication is forbidden. Data may only be used by indicating the source.
National Bank of Romania25, Lipscani St., 030031 Bucharest – Romania Phone: 40 21/312 43 75; fax: 40 21/314 97 52
ISSN 1582-2931 (print)ISSN 1584-0948 (online)
Foreword
In August 2005, the National Bank of Romania adopted a new monetary policy strategy, i.e. infl ation targeting. This regime is based primarily on the anchoring of infl ation expectations to the infl ation target announced by the central bank and therefore on effi cient communication with the public. Infl ation Report is the main means of communication.
To this end, the National Bank of Romania revised both the structure and the frequency of Infl ation Report which has become a quarterly publication in accordance with the frequency of the forecast cycle. Apart from the information on economic and monetary developments, and on the rationale behind the monetary policy decisions in the reviewed period, the quarterly report includes the NBR projection on infl ation rate developments on an eight-quarter time horizon and the associated risks and uncertainties, as well as a section dedicated to monetary policy assessment.
The analysis in the Infl ation Report is based upon the latest statistical data available at the date of drafting the paper, so that the reference periods of indicators herein may vary.
Infl ation Report was approved by the NBR Board in its meeting of 2 February 2012 and includes data available until 27 January 2012.
All issues of this publication are available in hard copy, as well as on the NBR website (http://www.bnr.ro).

Abbreviations
ACSI Authority for the Coordination of Structural InstrumentsAER annual effective rateAMIGO Household Labour Force SurveyCCR Central Credit RegisterCOICOP Classifi cation of Individual Consumption According to PurposeCPI Consumer Price IndexDG ECFIN Directorate General for Economic and Financial AffairsEC European CommissionECB European Central BankEIA Energy Information Administration
(within the U.S. Department of Energy)
ESI Economic Sentiment IndicatorEU European UnionEurostat Statistical Offi ce of the European UnionGDP Gross Domestic ProductGVA Gross Value AddedHICP Harmonised Index of Consumer PricesILO International Labour Offi ceIMF International Monetary FundIPPI Industrial Producer Price IndexMARD Ministry of Agriculture and Rural DevelopmentMPF Ministry of Public FinanceNBR National Bank of RomaniaNCP National Commission for PrognosisNEA National Employment AgencyNIS National Institute of StatisticsON overnightOPEC Organisation of Petroleum Exporting CountriesROBID Romanian Interbank Bid RateROBOR Romanian Interbank Offer RateUVI unit value indexVFE vegetables, fruit, eggs1W one week1M one month3M 3 months 6M 6 months12M 12 months

SUMMARY ................................................................................................................7
I. INFLATION DEVELOPMENTS ......................................................................11
II. ECONOMIC DEVELOPMENTS .....................................................................14
1. Demand ans supply .........................................................................................141.1. Demand ......................................................................................................151.2. Supply .......................................................................................................18
2. Labour market .................................................................................................193. Import prices and producer prices ................................................................20
III. MONETARY POLICY AND FINANCIAL DEVELOPMENTS ..................23
1. Monetary policy ..............................................................................................232. Financial markets and monetary developments ...........................................26
2.1. Interest rates ...............................................................................................262.2. Exchange rate and capital � ows .................................................................282.3. Money and credit .......................................................................................29
IV. INFLATION OUTLOOK ..................................................................................32
1. The baseline scenario of the forecast .............................................................341.1. External assumptions .................................................................................341.2. In� ation outlook .........................................................................................351.3. Demand pressures in the current period and over the projection horizon .................................................................371.4. Risks associated with the projection ..........................................................42
2. Policy assessment .............................................................................................44
Contents


INFLATION REPORT � February 2012 7
SUMMARY
Developments in infl ation and its determinants
At the end of 2011 Q4, the annual CPI infl ation rate decreased close to the mid-point of the variation band around the 3 percent target, standing at 3.14 percent, down 0.3 percentage points from the end of 2011 Q3 and 0.2 percentage points lower than the level forecasted in the November 2011 Infl ation Report.
The maintaining of adequate real broad monetary conditions contributed to the convergence of the annual infl ation rate towards the 2011 target, consolidating the signifi cant progress in disinfl ation seen in the latter half of the year. Disinfl ation was mainly driven by the fading-out of the fi rst-round effect of the VAT rate hike of 1 July 2010 and the dissipation of tensions previously accumulated on the global food and energy commodity markets, bolstered by the 2011 bumper domestic crop.
The noticeable slowdown in the growth rate of fuel prices – due to the movements in international oil prices as well as to a base effect – and the dynamics of the adjusted CORE2 index1 contributed to the fall in the annual headline infl ation rate in 2011 Q4. As compared to the previous quarter, these favourable infl uences were countered to a certain extent by the faster increase in administered prices, following the removal of heating subsidies from the central government budget, as well as by the slightly slower annual defl ation recorded by volatile food prices (of vegetables, fruit and eggs).
At the end of 2011 Q4, the annual adjusted CORE2 infl ation rate was 0.36 percentage points lower than in September (2.37 percent against 2.73 percent). Behind the decline in core infl ation stood the persistence of the negative output gap, along with the effects of the large agricultural supply on processed food prices, together with the improvement in infl ation expectations. An opposite infl uence was induced by the swifter growth of import prices than in the previous quarter, as a result of both increases in external prices and the relative depreciation of the domestic currency against the euro and the US dollar.
During October-November 2011, industry-wide gross wages posted a faster annual growth rate than that of labour productivity, causing an increase in unit labour costs. Nevertheless, the potential for a build-up of signifi cant infl ationary pressures in the short run following these developments is expected to be limited by the constraints that producers continue to face against the background of the persistent negative output gap.
Monetary policy since the release of the previous Infl ation Report
The NBR Board decided in its meeting on 2 November 2011 to lower the monetary policy rate to 6 percent per annum from 6.25 percent previously. Behind this decision stood the signifi cant improvement in the short-term infl ation outlook, as revealed by the latest developments and the updated macroeconomic projection at that time. At the same time, the central bank’s cautious stance in calibrating the policy rate cut was warranted by the persistent risks, particularly over the medium term, of infl ation deviating upwards from the baseline scenario path. These risks referred both to the external context, i.e. the impact of the sovereign debt crisis on investors’ risk 1 This core infl ation measure excludes from the overall CPI a number of prices on which monetary policy
(via aggregate demand management) has limited or no infl uence: administered prices, volatile prices (of vegetables, fruit, eggs and fuels), tobacco and alcohol prices.

8 NATIONAL BANK OF ROMANIA
Summary
aversion and on capital fl ow volatility, as well as to domestic developments, namely the uncertainties surrounding the fi scal policy stance ahead of the upcoming elections, together with adjustments in administered prices.
The resumption of the downward trend in the 12-month infl ation rate in November, to which added the available data regarding the decrease of infl ation expectations, pointed to a high likelihood of infl ation rate converging towards the mid-point of the variation band around the 3 percent target at end-2011, while also reconfi rming the outlook for lower headline and core infl ation in the immediately forthcoming months. On the other hand, looking beyond the near-term horizon, uncertainties persisted with respect to external developments, capital fl ows, administered prices, and certain volatile prices.
After assessing the favourable prospects of infl ation rate stabilising within the variation band around the central target, on one hand, and the risks of unfavourable developments detrimenta l to the fulfi lment of this objective, on the other hand, the NBR Board decided in its meeting of 5 January 2012 to lower the monetary policy rate to 5.75 percent per annum.
Infl ation outlook
The updated projection envisages the annual infl ation rate remaining inside the ±1 percentage point variation band around the central target (set at 3 percent in 2012 and 2.5 percent from 2013 onwards) throughout the reference period.
In 2011 Q3, year-on-year real GDP growth picked up markedly, owing both to a base effect and the doubling of the quarterly growth rate versus the previous quarter. The quarterly rate of increase was underpinned by the substantial contribution of the agricultural sector, the ongoing growth in industrial output, correlated with positive export dynamics, as well as by the relative rebound in construction against the previous period.
The NBR projection envisages economic growth returning to moderate rates in both quarterly and annual terms starting 2011 Q4. GDP expansion in 2012 is expected to be driven by domestic consumer and investment demand, while the contribution of external demand is projected to be relatively contained by the anticipated slowdown in euro area economic activity. The balance-of-payments current account defi cit as a share of GDP is seen remaining close to the 2011 level throughout the reference period, which does not imply, ceteris paribus, any signifi cant adjustments of the leu exchange rate. Starting 2012 H2, disinfl ationary pressures arising from the negative output gap will decrease gradually throughout the projection horizon, without dissipating entirely.
For end-2012, the baseline scenario of the current projection places the annual CPI infl ation rate at 3.2 percent, 0.2 percentage points higher than in the November 2011 Infl ation Report. For end-2013, the infl ation rate is forecast to stand at 3 percent.
The annual rates of both CPI infl ation and adjusted CORE2 infl ation are seen following paths similar to those forecasted in the November 2011 Infl ation Report. The CPI infl ation rate will remain inside the variation band around the central targets throughout the reference period, being anticipated to reach a trough in 2012 Q1 (2 percent) and a peak in 2012 Q3 (3.8 percent) on account of statistical base effects. The prudent setting of broad monetary conditions over the entire forecast horizon will ensure that headline infl ation returns close to 3 percent in 2012 Q4 and thereafter stays in the vicinity of this level until the end of the projection horizon. The adjusted CORE2 infl ation rate is expected to stabilise at levels close to, but below 2 percent starting with 2012 Q1.
INFLATION REPORT � February 2012 9
Summary
The slight upward revision of the projected annual CPI infl ation for end-2012 is due to the relatively less favourable contributions from the dynamics of adjusted CORE2 infl ation, volatile food prices (of fruit, vegetables and eggs), and tobacco prices compared to the previous forecast. The scenario for administered price growth has been revised slightly downwards for 2012 and upwards for 2013.The forecasted pace of increase of fuel prices is slower in the current baseline scenario than in the previous projection throughout the forecast horizon. The revision of this component is more pronounced for 2013, when the dynamics of adjusted CORE2 infl ation are also anticipated to become comparatively more favourable, thus jointly contributing to the projected decline in the 12-month CPI infl ation rate by 0.2 percentage points in December 2013 versus December 2012.
The marginal differences between the updated projection of adjusted CORE2 infl ation and the previous forecast result from moderately revised infl uences of fundamentals, with a mutually offsetting net effect. Thus, infl ation expectations are lower throughout the reference period, while the reassessment of the negative output gap implies, in relative terms, more subdued disinfl ationary pressures. The anticipated growth rate of import prices is faster than in the previous forecasting round over the fi rst part of the projection horizon and slower over the remaining part.
The central bank will further seek to set the path of the monetary policy rate so as to ensure adequate real broad monetary conditions for consolidating the prospects of fi rmly keeping the infl ation rate inside the target band throughout the projection horizon and for achieving a sustainable recovery of lending to the economy. In particular, broad monetary conditions need to be adequately calibrated so as to preclude any rekindling of infl ation expectations amid the temporary increase in the annual infl ation rate forecasted for 2012 Q3, associated with an unfavourable statistical base effect.
The overall balance of risks to the infl ation rate projected in the current baseline scenario appears to be tilted to the upside, with potential sources of risks relating both to external developments and domestic factors.
The main sources of external risks are the persistent uncertainties surrounding the confi guration of a convincing and comprehensive solution to the euro area sovereign debt crisis, as well as the political and social tensions in the Middle East.
The persistence or worsening of the sovereign debt crisis would fuel the nervousness of global fi nancial markets and would heighten investors’ risk aversion. In turn, this would mean severe constraints, at European and regional levels, on the availability and costs of external fi nancing necessary for the sustainable recovery of the domestic economy and would put considerable pressures on the leu exchange rate. This would have a detrimental impact on economic growth. The shrinking domestic demand and the weaker domestic currency would have opposite effects on price dynamics. However, given the pace and magnitude of a weaker leu feeding through into prices and infl ation expectations, the net effect is seen as conducive to faster infl ation than assumed in the baseline scenario.
Escalating tensions in the Middle East might lead to substantial rises in the international oil price. Such an adverse supply-side shock would entail unfavourable deviations from the baseline scenario of both the infl ation rate and economic growth.
The balance o f domestic risks appears to be less tilted to the upside compared to that of external risks. This year’s electoral schedule stands out as a typical source of risk to infl ation in terms of

10 NATIONAL BANK OF ROMANIA
Summary
possible slippages in the implementation of fi scal policy and structural reforms. A priori, this risk is mitigated by the good performance in terms of fi scal consolidation and structural reforms in 2011, which paves the way for further fi rm implementation of the measures agreed under the arrangements signed with the EU, the IMF and the World Bank. Nonetheless, the balance of risks stemming from this source could be tilted to the upside on account of political or social pressures that may jeopardise the consistent enforcement of the agreed measures.
Risks associated with both administered price increases and the dynamics of volatile food prices are seen as relatively symmetrically distributed against the baseline scenario of the current projection.
Containing the potential for the relevant unfavourable risks to infl ation and economic growth to materialise is strictly conditional on the further consistent implementation of the economic programme on fi scal consolidation and structural reforms agreed under the arrangements signed with the EU, the IMF and the World Bank.
�
�
�
�
�
�
�
�
������
��� � �����
�� ��� � �����
�� ��� �
�������������� ����������������������� �������������������������������������
Inflation targets(Dec./Dec.)2011: 3.0%2012: 3.0%2013: 2.5%
Source: NIS, NBR projection.
annual percentage changeInflation Forecast
���!� ���������������"�#�����$���������������������%��$�������������&
Monetary policy decision
Given that the perspective of annual infl ation staying inside the variation band around the central targets set for 2012 and 2013 has been reconfi rmed, while the balance of medium-term risks to infl ation has remained relatively asymmetric, the NBR Board has decided in its meeting of 2 February 2012 to lower the monetary policy rate by 0.25 percentage points to 5.50 percent per annum. The NBR Board has also decided to pursue an adequate management of liquidity in the banking system and to maintain the existing levels of minimum reserve requirement ratios on both leu- and foreign currency-denominated liabilities of credit institutions. The gradual and judicious adjustment of real broad monetary conditions will help effectively anchor expectations throughout the projection horizon given the outlook for infl ation, namely a continued slowdown in both headline and core infl ation in the immediately forthcoming period, but also considering the impact of the unfavourable statistical base effects on the evolution of infl ation in the second part of 2012 (without overshooting the ±1 percentage point variation band around the 3 percent infl ation target).

INFLATION REPORT � February 2012 11
Target2006 Target
2007Target2008
Target2009
Target2010
Target2011
�
�
�
�
�
�
�
�
��
Dec.06 Dec.07 Dec.08 Dec.09 Dec.10 Dec.11
annual percentage change
���!� ���������������"�#�����$���������������������%��$�������������&
Source: NIS, NBR calculations.
Inflation Developments
0123456789
D J2011
F M A M J J A S O N D
tobacco, alcohol administered pricesvolatile prices* adjusted CORE2
contribution to inflation rate; percentage points
Source: NIS, NBR calculations.
Annual Inflation Rate
*) products with volatile prices: vegetables, fruit, eggs, fuels
I. INFLATION DEVELOPMENTS
In December 2011, the annual infl ation rate decreased to 3.14 percent, close to the mid-point of variation band of ±1 percentage point around the central target (3 percent) set for 2011. The considerable drop in infl ation rate in the latter part of the year was due to the dissipation of tensions on the food and energy commodity markets (amid bumper domestic and i nternational crops and developments in world oil prices), as well as to the waning of some unfavourable statistical effects associated with the noticeable price increases on these markets during 2010 Q3 – 2011 Q2 and the VAT rate hike as of 1 July 2010. The impact of these factors, along with the persistent negative output gap, also contributed to the fall in the adjusted CORE2 infl ation, which reached 2.37 percent at year-end (as compared with 4.76 percent at the end of 2011 Q2 and 2.73 percent in September). In 2011 Q4, the 12-month CPI infl ation rate went down 0.3 percentage points, on the back of the decline in core infl ation and the slowdown in the annual growth rate of fuel prices, whereas the administered price dynamics acted in the opposite direction.
In the period under review, volatile prices made a substantial contribution to the annual disinfl ation, as the growth rate of fuel prices slowed down 4.1 percentage points to 8.4 percent year on year. In 2011 Q4, fuel prices saw a moderate average monthly change, which was signifi cantly lower than that recorded in the same year-ago period. This was the joint result of the slightly downward trend in world oil prices1 and the depreciation of the domestic currency versus the US dollar. On the other hand, VFE prices – the other component of volatile prices – had no longer a disinfl ationary impact, due to the partial inversion of the abrupt corrections recorded in the preceding quarter, yet their annual change remained strongly negative (-10.4 percent in December 2011).
Administered prices stood 6.7 percent higher in 2011, accounting for nearly one third of the headline infl ation recorded at year-end. The faster annual growth rate of administered prices (up 1.4 percentage points versus September 2011) was mainly due to the removal of heating subsidies from the central government budget, with an impact on prices of heating and hot water delivery. However, this effect was contained by the (full or partial) coverage of the price difference from local budgets in more than half of the county seats (Bucharest included) with centralised heating systems.
1 Brent crude oil price dropped to USD 108.1/barrel in December 2011 from USD 110.9/barrel in September, mainly following the worsening outlook for global economic growth.

12 NATIONAL BANK OF ROMANIA
I. In� ation Developments
-10123456789
10
J2010
F MAM J J A S O N D J2011
F MAM J J A S O N D
percent
monthly rateaverage annual rateannual rate
Source: NIS.
Inflation Rate
0123456789
D J2011
F M A M J J A S O N D
CPI (total)CORE1 (CPI - administered prices)CORE2 (CORE1 - volatile prices*)adjusted CORE2**
Source: NIS.
annual percentage change
Headline Inflation and CORE Inflation
*) products with volatile prices: vegetables, fruit, eggs, fuels
**) excluding tobacco and alcohol
-1
0
1
2
3
4
5
6
7
8
D J2011
F M A M J J A S O N D
Adjusted CORE2 Components
adjusted CORE2food itemsnon-food itemsservices
Source: NIS, NBR calculations.
annual percentage change
The annual growth rate of tobacco prices (6.5 percent in December 2011) continued to hover around the minimum levels2
the group has recorded since Q3, following the elimination of the base effect associated with the VAT rate hike and in the absence of major excise duty adjustments in 2011. As a result, the contribution of tobacco prices to the annual headline infl ation remained unchanged at about 0.5 percentage points.
The analysis of price developments in terms of monetary policy scope focuses further on adjusted CORE2 infl ation, which stayed on a downward course, reaching 2.37 percent in annual terms (down 0.36 percentage points versus September 2011), owing mainly to the drop in the annual growth rate of food prices. In contrast, the annual rate of increase of market services prices turned slightly positive.
In the reviewed period, the fl agging consumer demand3
(as refl ected by the persistent negative output gap) further had a disinfl ationary impact on all components of the adjusted CORE2 index.
As for food items included in core infl ation, the plentiful agri-food supply on both domestic and international markets also had a downward impact. The lower statistical effect of adverse supply-side shocks manifest in August 2010 – May 2011 enhanced the favourable infl uence of these factors. In this context, the impact that the rises by 10 percent as of 1 July 2011 and 8 percent as of 1 October 2011 in gas prices for industrial producers had on the producer costs of some processed food items translated to a small extent into consumer prices.
The annual dynamics of prices for non-food items included in adjusted CORE2 infl ation slowed down marginally, given that the persistent negative output gap counteracted the unfavourable impact exerted by external prices4, enhanced by the depreciation trend of the domestic currency versus the euro, whereas the developments in domestic producer prices for consumer goods did not generate additional infl ationary pressures. The exchange rate movements of the domestic currency versus the euro, along with the increase in prices for heating and communal services,
2 For the period 1996-2011.3 Despite some revival signs in the volume of receipts from retail trade (except
for motorcars and motorcycles) and from market services to households in October-November 2011 versus the prior quarter (seasonally adjusted data), in annual terms, the growth of this indicator remained moderate. This was generated by the gradual change in consumer behaviour, following the auste rity measures implemented as of 1 July 2010, considering that it was also underpinned by the persistence of a favourable base effect.
4 Approximated by EU-15 industrial producer prices for consumer goods (except food and tobacco) for the external market, available for October and November.

INFLATION REPORT � February 2012 13
I. In� ation Developments
0
10
20
30
40
50
60
70
D J2011
F M A M J J A S O N D
manufacturingtradeservicesconsumers (12-month estimates)
balance of answers (%); 3-month estimates, seasonally adjusted data
Source: EC-DG ECFIN.
Inflation Expectations of Economic Agents
0
1
2
3
4
5
6
7
8
9
D J2011
F M A M J J A S O N D
EU 27 RO
Source: Eurostat.
Average Annual HICP Inflation Rate
percent
contributed to the slight pick-up in the annual growth rate of market services prices.
Infl ation expectations of consumers5 stayed on a downward path, dropping to levels lower than those recorded prior to the VAT rate hike. Given their primarily backward-looking nature, the explanation for this adjustment may lie with the relatively low levels of prices for some frequently purchased products such as food items, in the latter part of the year, with a strong impact on infl ation perceptions.
As regards the infl ation rate criterion laid down in the Maastricht Treaty, the average annual HICP infl ation rate (5.8 percent) further posts a substantial positive gap (4.3 percentage points against the average of the three best performing EU Member States in terms of price stability), due to the joint effect of adverse supply-side shocks in the past two years (changes in indirect taxes, developments in commodity prices, particularly agricultural commodities, and increases in administered prices), the signifi cantly higher share of food items in the CPI basket and the persistence of some structural rigidities on goods and services markets. Compared with September however, this gap was 1.3 percentage points smaller, owing particularly to domestic developments that supported disinfl ation. This contributed equally to the narrowing of the gap versus the EU-wide average infl ation (to 2.7 percentage points).
At end-2011, the actual annual infl ation rate stood 0.2 percentage points lower than the projection included in the November 2011 Infl ation Report. The deviation was mainly attributed to the overestimation of immediate risks generated by the removal of heating subsidies from the central government budget, which was, against expectations, offset to a large extent by the rise in subsidies from local budgets. An additional impact, yet of a low magnitude, was exerted by the slower-than-projected dynamics of adjusted CORE2 index. On the other hand, the higher-than-expected increase in volatile food prices had an opposite infl uence on the deviation.
5 According to the NIS/EC-DG ECFIN Survey.
14 NATIONAL BANK OF ROMANIA
-20
-15
-10
-5
0
5
10
15
20
-20
-15
-10
-5
0
5
10
15
20
I2009
II III IV I2010
II III IV I2011
II III
change in inventoriesnet exportsgross fixed capital formationfinal consumptionGDP (rhs)
Source: NIS, NBR calculations.
annual percentage changepercentage points
Contribution of Demand Componentsto GDP Growth
II. ECONOMIC DEVELOPMENTS
1. Demand and supply
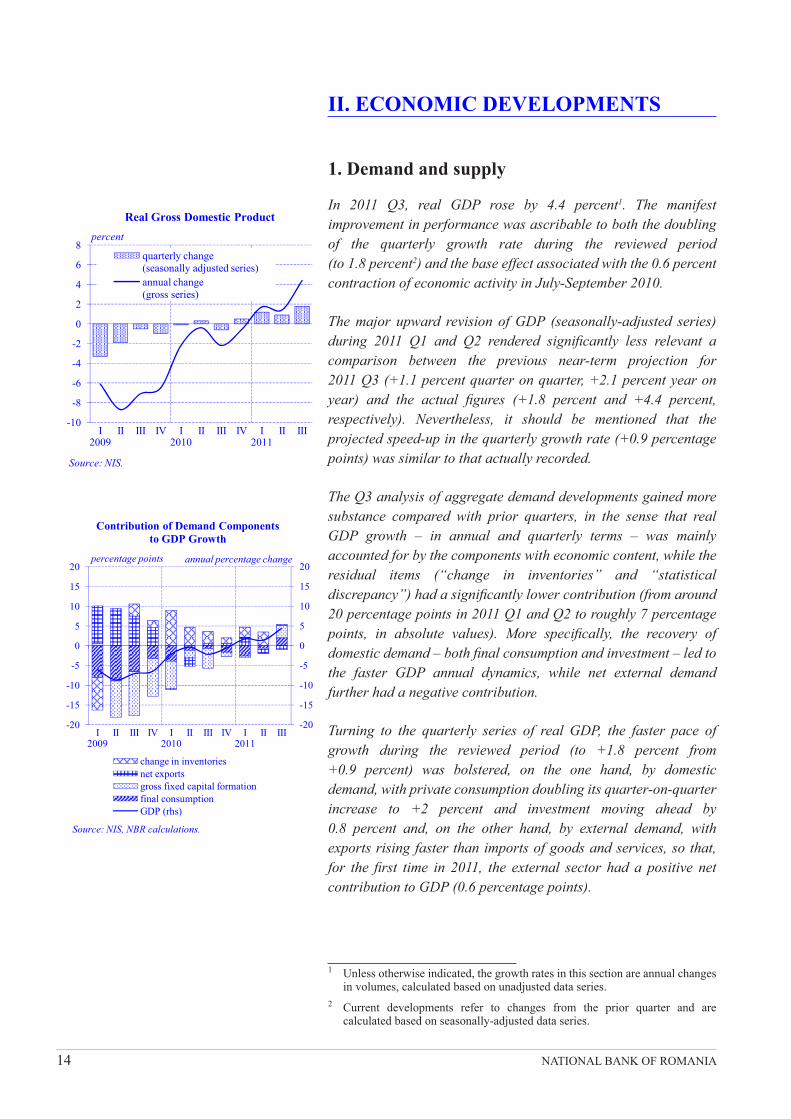
In 2011 Q3, real GDP rose by 4.4 percent1. The manifest improvement in performance was ascribable to both the doubling of the quarterly growth rate during the reviewed period (to 1.8 percent2) and the base effect associated with the 0.6 percent contraction of economic activity in July-September 2010.
The major upward revision of GDP (seasonally-adjusted series) during 2011 Q1 and Q2 rendered signifi cantly less relevant a comparison between the previous near-term projection for 2011 Q3 (+1.1 percent quarter on quarter, +2.1 percent year on year) and the actual fi gures (+1.8 percent and +4.4 percent, respectively). Nevertheless, it should be mentioned that the projected speed-up in the quarterly growth rate (+0.9 percentage points) was similar to that actually recorded.
The Q3 analysis of aggregate demand developments gained more substance compared with prior quarters, in the sense that real GDP growth – in annual and quarterly terms – was mainly accounted for by the components with economic content, while the residual items (“change in inventories” and “statistical discrepancy”) had a signifi cantly lower contribution (from around 20 percentage points in 2011 Q1 and Q2 to roughly 7 percentage points, in absolute values). More specifi cally, the recovery of domestic demand – both fi nal consumption and investment – led to the faster GDP annual dynamics, while net external demand further had a negative contribution.
Turning to the quarterly series of real GDP, the faster pace of growth during the reviewed period (to +1.8 percent from +0.9 percent) was bolstered, on the one hand, by domestic demand, with private consumption doubling its quarter-on-quarter increase to +2 percent and investment moving ahead by 0.8 percent and, on the other hand, by external demand, with exports rising faster than imports of goods and services, so that, for the fi rst time in 2011, the external sector had a positive net contribution to GDP (0.6 percentage points).
1 Unless otherwise indicated, the growth rates in this section are annual changes in volumes, calculated based on unadjusted data series.
2 Current developments refer to changes from the prior quarter and are calculated based on seasonally-adjusted data series.
-10
-8
-6
-4
-2
0
2
4
6
8
I2009
II III IV I2010
II III IV I2011
II III
Real Gross Domestic Product
quarterly change (seasonally adjusted series)annual change (gross series)
Source: NIS.
percent

INFLATION REPORT � February 2012 15
II. Economic Developments
-15
-10
-5
0
5
10
I2009
II III IV I2010
II III IV I2011
II III
final consumptionhousehold consumptiongovernment consumption
annual percentage change
Source: NIS.
Actual Final Consumption
-50
-40
-30
-20
-10
0
10
20
30
40
-25
-20
-15
-10
-5
0
5
10
15
20
I2009
II III IV I2010
II III IV I2011
II III Oct.-Nov.
Household Consumption and Main Financing Sources
expenditures for purchases of goods and servicesdisposable incomeconsumer loans, outstanding amounts (rhs)bank overdrafts, outstanding amounts (rhs)
Source: NIS, MPF, NBR calculations.
real annual percentage change
On the supply side, all economic sectors reported positive quarterly dynamics during the period under review. The agricultural sector saw the fastest rise (+8.5 percent), but it should be noted that, leaving out this sector, real GDP growth still recorded a step-up (by 0.5 percentage points, to 1.2 percent).
1.1. Demand
The trend reversal in fi na l consumption seen in 2011 Q3 was due to the rebound in private consumption, to +3.1 percent from -0.7 percent.
Even though self-consumption and purchases on the agri-food market represented the fastest-moving segment of household fi nal consumption, against the backdrop of better-than-expected agricultural crops, it should not be overlooked that the negative contribution from purchases of goods and services narrowed close to zero, which is ascribable not only to the base effect associated with the decline in consumption during the months immediately following the standard VAT rate hike and the severe budgetary-sector wage adjustments (July 2010), but also to slightly positive dynamics during the reviewed period. As seen in the previous quarter, the share of imports in the consumer goods market widened, amid further positive annual growth rates for the physical volume3 of imported non-durables and durables, along with a delayed resumption of domestic supply for these two categories4 – with the sole exception of motor vehicles, for which the advance in imports was slower than that of domestic producers’ sales.
In 2011 Q3, the main fi nancing channels for consumption saw slower annual rates of decline. A signifi cant contribution to the deceleration of the decline in household disposable income5 was brought by the base effect, while the new real contraction shown by the stock data series for consumer and overdraft loans was generated amid continued joint action of restrictive factors, i.e. sizeable household indebtedness, still high interest rates (in particular for leu-denominated loans), uncertainty among both households (with regard to fi nancial prospects) and banks (in connection with the economic developments and available fi nancing).
3 The changes in the physical volume of goods exports and imports were calculated based on balance-of-payments data, defl ated by international trade-related unit value indices. The structural analysis was based on the Combined Nomenclature.
4 Domestic supply developments have been estimated based on the turnover volume in industrial production for the domestic market.
5 Approximated by the sum of incomes from wages, social transfers (state social security, unemployment benefi t and health insurance) and infl ows from abroad, i.e. workers’ remittances and current private transfers by non-residents.

16 NATIONAL BANK OF ROMANIA
II. Economic Developments
-70
-60
-50
-40
-30
-20
-10
0
10
20
30
I2009
II III IV I2010
II III IV I2011
II III Oct.-Nov.
Purchases of Goods and Services*
non-durables excluding fuelsfuelsdurablesmarket services
Source: NIS, NBR calculations.
real annual percentage change
*) based on data on the turnover volume of retail trade and market services to households
-60
-40
-20
0
20
40
60
I2009
II III IV I2010
II III IV I2011
II III
gross fixed capital formationequipment (incl. transport means)new construction workscapital repairs
annual percentage change
Investment
Source: NIS, NBR calculations.
As concerns the infl uence of demand on consumer prices, the current turnover volume developments for trade with goods holding a large share in the CPI basket did not point to signifi cant demand-side pressures, against the backdrop of continued stagnation in the demand for food items and of further quarter-on-quarter decline in the total volume of purchases of non-durable non-food items, notwithstanding the faster dynamics in certain sub-sectors (pharmaceuticals and cosmetics, wearing apparel and, in particular, products ordered online).
Government fi nal consumption saw its pace of decrease easing further (to -0.4 percent from -1.2 percent, in annual terms); consequently, after three consecutive quarters, the negative impact of this component on GDP growth came to a halt.
In 2011 Q3, the general government budget defi cit amounted to lei 2,425 million6 (i.e. 0.4 percent of GDP7), thus remaining considerably lower compared to that recorded in the same year-ago period (lei 5,309 million8, the equivalent of 1 percent of GDP). The upturn in budgetary outcomes was solely owed to faster growth9 in total budget revenues (4.4 percent, versus 0.7 percent in Q2), while the year-on-year contraction of total budget expenditures was smaller than the last quarter’s reading (-2.3 percent, compared with -7.5 percent). This latter development was mainly generated by the slowdown in the negative annual dynamics of staff costs (-6.2 percent against -23.5 percent, including due to the base effect associated with the cuts in budgetary-sector wages in 2010 H2), of social payments and of the amounts allotted to “other transfers” and subsidies, as well as by the annual change of expenditures with projects fi nanced from non-redeemable external loans entering positive territory.
In July-September 2011, gross fi xed capital formation was the demand component with the fastest annual growth rate (11.4 percent), though it should be noted that, apart from the quarterly advance by 0.8 percent recorded during the reviewed period, the year-on-year recovery of demand for investment incorporated a signifi cant base effect. The structural analysis shows improvements in all categories of spending: (i) equipment purchases (including transport means purchased by companies and
6 Preliminary data published by the MPF in respect of the general government defi cit for January-September 2011 showed compliance with the ceiling agreed with the IMF for the fi rst three quarters of 2011.
7 The analysis relied on the operational data relating to the September 2011 budget execution, as published by the MPF.
8 The 2010 budget execution fi gures have been recalculated by the MPF to ensure comparability with those for 2011.
9 Unless otherwise indicated, percentage changes refer to the real annual growth rates.

INFLATION REPORT � February 2012 17
II. Economic Developments
15
20
25
30
35
40
I2009
II III IV I2010
II III IV I2011
II III
current account deficit/GDPsaving rateinvestment rate
Source: NIS, NBR calculations.
Note: Investment rate is the ratio of gross capitalformation to GDP; saving rate is the differencebetween national disposable income and finalconsumption as a share of GDP.
Investment Rate and Saving Rate
percent*
*) last 4 quarters' average
-4
-2
0
2
4
6
8
10
I II III IV
200920102011
Source: NIS, NBR calculations.
percentage points
Net External Demand Contribution to GDP Growth
institutions) went up by 35.6 percent, on account of a faster rise in the acquisition of capital goods from the domestic market4 andthrough imports3; (ii) investment in construction was higher for both new works and capital repairs (by 3.8 percent and 23.2 percent, respectively), but such performances were attributed to substantial base effects, whereas the current developments were negative; (iii) “other investment” (mainly capital expenditures recorded in agriculture and expenditures for services related to ownership transfer) also witnessed a trend reversal and posted a volume increase by 9.4 percent compared with 2010 Q3.
Capital investments stepped up mainly in: (i) the budgetary sector (a real increase of over 36 percent in capital expenses) and (ii) the corporate sector, supported by own sources (as suggested by the pick-up to around 6 percent of the annual rate of increase in the gross added value related to non-budgetary sectors) and by loans for purchasing equipment and motor vehicles, with the volume of bank loans for equipment10 going up by almost 11 percent and the euro-denominated value of fi nancial leasing contracts for investment in equipment and motor vehicles climbing by more than 20 percent and 50 percent, respectively, versus 2010 Q3. Nevertheless, real estate corporate fi nancing (loans or leases), as well as the fl ow of non-residents’ direct investment declined, the latter falling by 64 percent during the past four quarters. Statistical data available for households point to a weak propensity towards investment, in the context of real disposable income further staying below the same year-earlier period’s reading, and the real estate loan balance increasing only marginally.
Turning to external demand, the annual growth rate for exports of goods and services accelerated by 2.6 percentage points (to 8.9 percent), further to the EU-25 economy remaining on an uptrend, as well as to the expansion of non-EU trade relations11.The high import content of exports, along with the upturn in domestic demand, generated faster annual growth for imports of goods and services, compared with the previous quarter (to 10.5 percent, real change). Consequently, the growth rate of imports stayed above that of exports, thus causing the contribution of net external demand to GDP dynamics to remain in negative territory (-1 percentage point).
10 The calculations relating to equipment and real estate loans were based on data supplied by the Central Credit Register.
11 Though slightly lower compared with Q2, the real GDP annual dynamics in EU-25 stayed positive (1.3 percent), which caused a new pick-up in demand for imported goods and services (3.5 percent in annual terms). In point of the bias towards non-EU markets, available data indicate exports maintaining, in Q3, a faster pace of growth than in the case of the supply of goods on the intra-EU market.

18 NATIONAL BANK OF ROMANIA
II. Economic Developments
-10
-8
-6
-4
-2
0
2
4
6
-10
-8
-6
-4
-2
0
2
4
6
I2009
II III IV I2010
II III IV I2011
II III
net taxes on productagricultureconstructionservicesindustryGDP (rhs)
Contribution of Supply Componentsto GDP Growth
annual percentage changepercentage points
Source: NIS, NBR calculations.
-50
-40
-30
-20
-10
0
10
Dec. 2009
Jun. Dec. 2010
Jun. Dec. 2011
manufacturing servicestrade construction
Source: EC-DG ECFIN.
points (seasonally adjusted data)
Corporate Sector: Confidence Indicators for the Next 3 Months
More than half of the advance in goods exports was owed to “machinery and equipment” and “transport means”3 – for the former, the physical volume of sales on the external market increased by almost 16 percent (which was 1.6 times faster than during Q2) and for the latter, exports resumed their uptrend (+12.2 percent, from -6.3 percent during the previous quarter).
1.2. Supply
The faster annual growth rate of real GDP in 2011 Q3 was mainly ascribable to the step-up in gross value added in industry, agriculture and construction and, to a lower extent, to the slower downward path in gross value added in services. Quarterlydevelopments are indicative of positive changes economy-wide in the current period. Nevertheless, certain base effects, more pronounced in agriculture and construction, cannot be overlooked either.
Agriculture accounted for almost half of the 4.4 percent increase in GDP. Gross value added in this sector posted a 6.5 time faster annual growth rate than that recorded in Q2, to 22.1 percent, owing chiefl y to bumper vegetal crops in 2011.
Industry further made a positive contribution to GDP dynamics, i.e. 1.5 percentage points, in 2011 Q3, as a result of the 5.9 percent rise in gross value added against the same year-ago period. The higher demand both externally and domestically triggered the pick-up in activity in a number of sub-sectors holding large shares in the sector’s output, i.e. metallurgy, machinery and equipment, road transport means and, via the supply chain, electrical equipment.
The construction sector also made a positive contribution to real GDP growth (0.5 percentage points), albeit of a lower magnitude than that of agriculture and industry, given the sign reversal in the annual dynamics of gross value added, from -1.9 percent in 2011 Q2 to +6.9 percent. This development was mainly attributable to building works, both on the residential and non-residential segments.
Gross value added in the services sector further contracted, albeit at a 4 time slower pace than that posted in Q2, i.e. -0.2 percent year on year. The slightly faster annual growth of “wholesale and retail trade; repair of motor vehicles and household goods, hotels and restaurants, transport and telecommunications” (1.4 percent) and the weak increase reported by “fi nancial activities, real estate transactions, rentals and services rendered to companies” (0.2 percent) were not enough to offset the renewed contraction in

INFLATION REPORT � February 2012 19
II. Economic Developments
3
4
5
6
7
8
9
I2009
II III IV I2010
II III IV I2011
II III Oct.-Nov.
registered unemployment rate
ILO unemployment rate
percent
Source: NIS, NBR calculations.
Unemployment Rate*
*) seasonally adjusted data
-25-20-15-10-505
101520253035
I2009
II III IV I2010
II III IV I2011
II III Oct.-Nov.
totalminingmanufacturingenergy
annual percentage change
Source: NIS, NBR calculations.
Unit Labour Cost in Industry
500
1,000
1,500
2,000
2,500
3,000
3,500
4,000
10
20
30
40
50
60
70
80
I2009
II III IV I2010
II III IV I2011
II III Oct.-Nov.
number of private sector employees (rhs)number of public sector employees (rhs)vacancieshirings
thousand; monthly averages
Labour Force Demand Measures*
*) seasonally adjusted dataSource: NEA, NIS, NBR calculations.
gross value added in public services (-4.4 percent), yet they stood behind the markedly lower negative contribution made by the sector as a whole to real GDP dynamics.
2. Labour market
According to expectations, September through November 2011, labour market conditions remained relatively stable. Nonetheless, the worsening of the European economic environment alongside certain adverse infl uences on the supply-side impacted on the dynamics of industrial output. Consequently, the annual growth rate of unit labour costs in industry stayed in positive territory. Against this background, economic agents in the private sector are further concerned with containing wage costs, although being moderately optimistic on net labour absorption in the fi rst part of 2012. Therefore, the risk of infl ationary pressures stemming from higher wages is expected to remain relatively low over the short term.
The stabilisation of labour market conditions12 is mirrored by the developments in staff fl ows in the private sector. Thus, recruitment continued at a slightly slower pace than in the prior months and the number of lay-offs declined, so that registered payrolls economy-wide stayed on an upward trend. Registered unemployment rate fell marginally to 5 percent, although staff cuts in the budgetary sector carried on. The higher number of employees in the private sector was particularly due to services, while in industry and construction the positive monthly dynamics of this indicator slowed down, possibly on the back of: the output fall in certain industries affected by the rise in energy prices or by supply bottlenecks, the deteriorating outlook for economic growth in the EU – the main market for domestic industrial producers – and the deepening of the global fi nancial crisis, with a detrimental impact on investment projects. Companies’ employment expectations13 for December 2011 – March 2012 show relative optimism in retail trade, stability in manufacturing and in other services and a slight worsening in construction.
In the industrial sector, the above-mentioned restrictive factors on the supply-side and the slower growth rate of external demand hindered the rebound in labour productivity dynamics, so that unit labour costs further posted higher levels than those recorded in the same year-ago period, i.e. up 5.3 percent in the period October-November 2011. Nevertheless, the persistent negative output gap in domestic economy and the stronger external
12 NEA and NIS data seasonally adjusted by the NBR. 13 The NIS/DG ECFIN Survey on the expected development in staff numbers
over the following three months.
20 NATIONAL BANK OF ROMANIA
II. Economic Developments
50
60
70
80
90
100
110
120
130
140
I2009
II III IV I2010
II III IV I2011
II III
totalvegetal productsanimal or vegetal oils and fatsfuelspharmaceuticals
Major Inflationary Pressureson the Unit Value Index of Imports
Source: NIS, NBR calculations.
annual index (%)
competition, amid moderation in global demand, are acting towards offsetting such pressures on prices in the short run. Domestic producers are thus expected to resort to cost control measures or to accept lower profi t margins in order to preserve their market share.
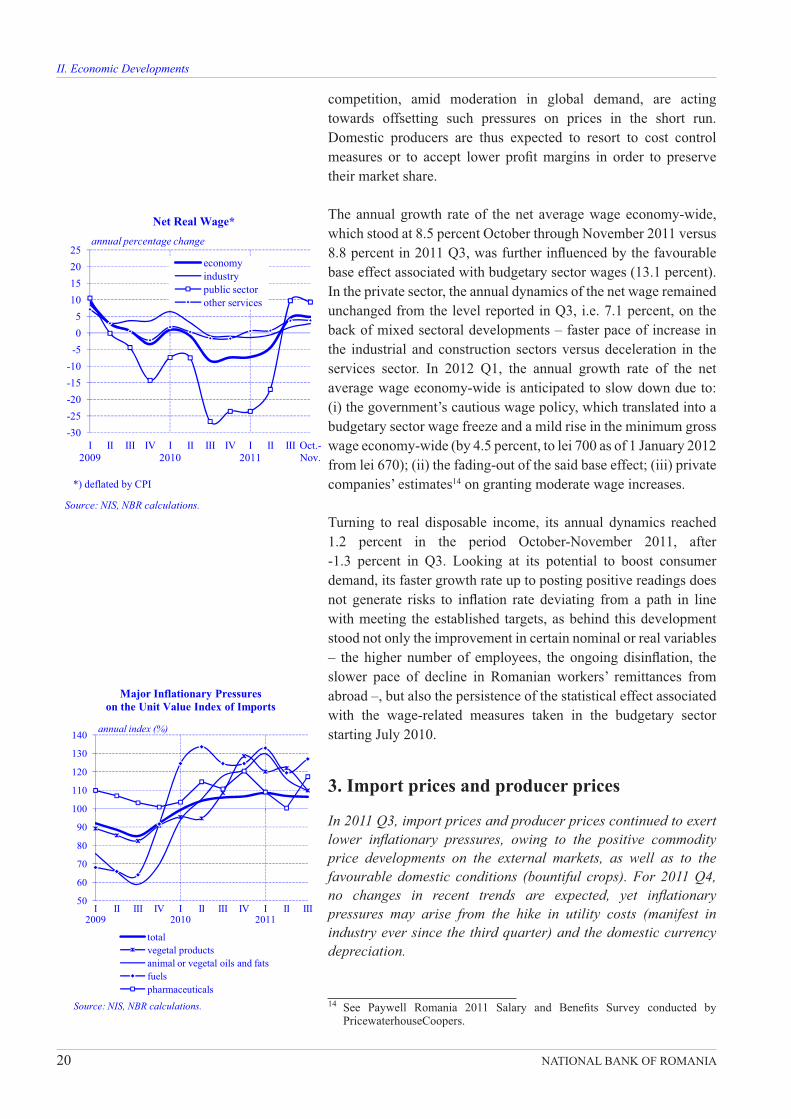
The annual growth rate of the net average wage economy-wide, which stood at 8.5 percent October through November 2011 versus 8.8 percent in 2011 Q3, was further infl uenced by the favourable base effect associated with budgetary sector wages (13.1 percent). In the private sector, the annual dynamics of the net wage remained unchanged from the level reported in Q3, i.e. 7.1 percent, on the back of mixed sectoral developments – faster pace of increase in the industrial and construction sectors versus deceleration in the services sector. In 2012 Q1, the annual growth rate of the net average wage economy-wide is anticipated to slow down due to: (i) the government’s cautious wage policy, which translated into a budgetary sector wage freeze and a mild rise in the minimum gross wage economy-wide (by 4.5 percent, to lei 700 as of 1 January 2012 from lei 670); (ii) the fading-out of the said base effect; (iii) private companies’ estimates14 on granting moderate wage increases.
Turning to real disposable income, its annual dynamics reached 1.2 percent in the period October-November 2011, after -1.3 percent in Q3. Looking at its potential to boost consumer demand, its faster growth rate up to posting positive readings does not generate risks to infl ation rate deviating from a path in line with meeting the established targets, as behind this development stood not only the improvement in certain nominal or real variables – the higher number of employees, the ongoing disinfl ation, the slower pace of decline in Romanian workers’ remittances from abroad –, but also the persistence of the statistical effect associated with the wage-related measures taken in the budgetary sector starting July 2010.
3. Import prices and producer prices
In 2011 Q3, import prices and producer prices continued to exert lower infl ationary pressures, owing to the positive commodity price developments on the external markets, as well as to the favourable domestic conditions (bountiful crops). For 201 1 Q4, no changes in recent trends are expected, yet infl ationary pressures may arise from the hike in utility costs (manifest in industry ever since the third quarter) and the domestic currency depreciation.
14 See Paywell Romania 2011 Salary and Benefi ts Survey conducted by PricewaterhouseCoopers.
-30-25-20-15-10
-505
10152025
I2009
II III IV I2010
II III IV I2011
II III Oct.-Nov.
economyindustrypublic sectorother services
annual percentage change
Source: NIS, NBR calculations.
*) deflated by CPI
Net Real Wage*
INFLATION REPORT � February 2012 21
II. Economic Developments
95
100
105
110
115
120
I2009
II III IV I2010
II III IV I2011
II III Oct. Nov.
Consumer Prices and Industrial Producer Prices
CPIIPPI in manufacturing for domestic marketIPPI in manufacturing for external market
annual index (%)
Source: NIS.
90
95
100
105
110
115
120
125
130
I2009
II III IV I2010
II III IV I2011
II III Oct. Nov.
capital goodsintermediate goodsconsumer goodsenergy products
annual index (%)
Source: NIS.
Industrial Producer Prices for Domestic Market by Industrial Products Group
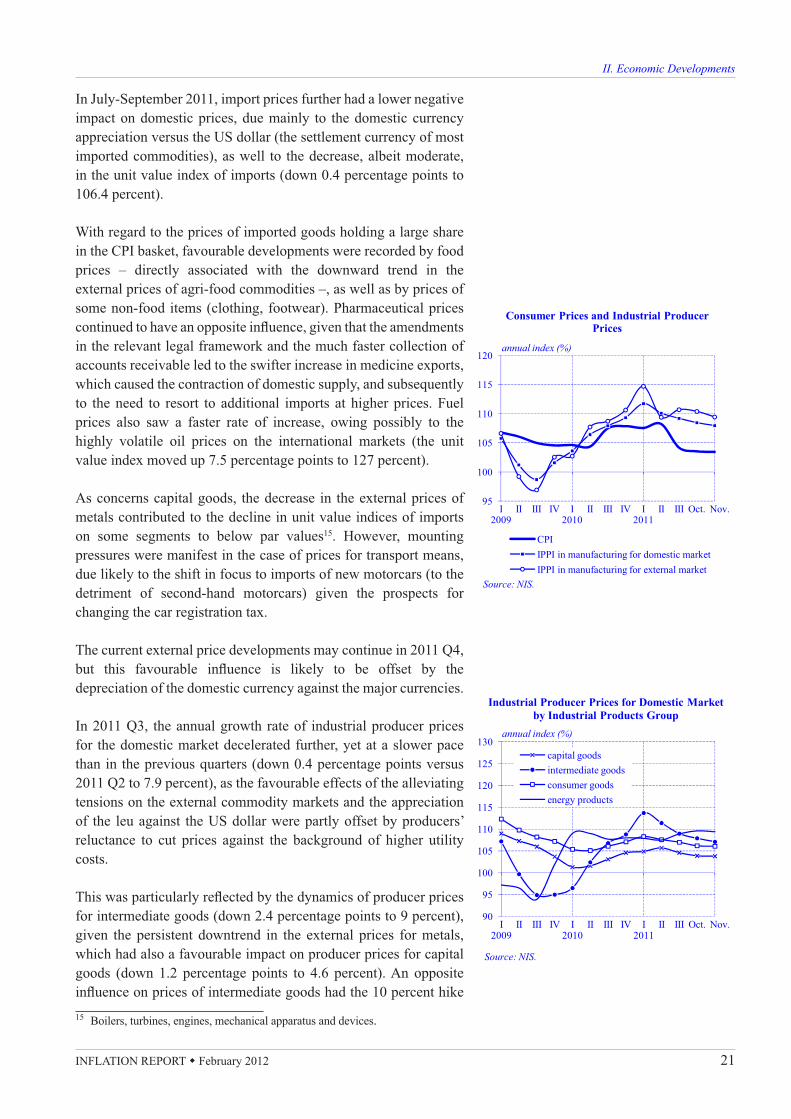
In July-September 2011, import prices further had a lower negative impact on domestic prices, due mainly to the domestic currency appreciation versus the US dollar (the settlement currency of most imported commodities), as well to the decrease, albeit moderate, in the unit value index of imports (down 0.4 percentage points to 106.4 percent).
With regard to the prices of imported goods holding a large share in the CPI basket, favourable developments were recorded by food prices – directly associated with the downward trend in the external prices of agri-food commodities –, as well as by prices of some non-food items (clothing, footwear). Pharmaceutical prices continued to have an opposite infl uence, given that the amendments in the relevant legal framework and the much faster collection of accounts receivable led to the swifter increase in medicine exports, which caused the contraction of domestic supply, and subsequently to the need to resort to additional imports at higher prices. Fuel prices also saw a faster rate of increase, owing possibly to the highly volatile oil prices on the international markets (the unit value index moved up 7.5 percentage points to 127 percent).
As concerns capital goods, the decrease in th e external prices of metals contributed to the decline in unit value indices of imports on some segments to below par values15. However, mounting pressures were manifest in the case of prices for transport means, due likely to the shift in focus to imports of new motorcars (to the detriment of second-hand motorcars) given the prospects for changing the car registration tax.
The current external price developments may continue in 2011 Q4, but this favourable infl uence is likely to be offset by the depreciation of the domestic currency against the major currencies.
In 2011 Q3, the annual growth rate of industrial producer prices for the domestic market decelerated further, yet at a slower pace than in the previous quarters (down 0.4 percentage points versus 2011 Q2 to 7.9 percent), as the favourable effects of the alleviating tensions on the external commodity markets and the appreciation of the leu against the US dollar were partly offset by producers’ reluctance to cut prices against the background of higher utility costs.
This was particularly refl ected by the dynamics of producer prices for intermediate goods (down 2.4 percentage points to 9 percent), given the persistent downtrend in the external prices for metals, which had also a favourable impact on producer prices for capital goods (down 1.2 percentage points to 4.6 percent). An opposite infl uence on prices of intermediate goods had the 10 percent hike 15 Boilers, turbines, engines, mechanical apparatus and devices.
22 NATIONAL BANK OF ROMANIA
II. Economic Developments
as of 1 July in the gas price for industrial consumers; this was visible in the chemicals sub-sector where the cost increase could feed through into prices amid the higher demand for fertilisers, specifi c to a good agricultural year.
The growth pace of producer prices for energy accelerated by 1.3 percentage points to 8.9 percent, owing possibly to the highly volatile oil prices on the external markets. According to the statements of the main market operator, an additional explanation for the price hikes lies with the expansion of transport activity as a result of higher demand in industry. The noticeable rise in investment expenses induced by the exploitation of new oil fi elds is also likely to have generated cost pressures.
The downtrend in the annual growth rate of producer prices for consumer goods (down 0.6 percentage points to 7 percent) was due solely to food price movements, fostered by the above-average crops. Nevertheless, the annual rate of increase of producer prices for food items has remained high at 15.5 percent, with producers attributing price rigidity to higher utility costs, as well as to the recovery of previously incurred losses. With regard to prices for non-food items, the step-up in their growth pace may be partly linked to the depreciation of the leu versus the euro.
For the period ahead, producer prices for the domestic market may stay on the downward path they have followed since 2011 Q2 – their annual dynamics stood at 7.2 percent in November, fostered by the persistence of developments on the external commodity markets of, as well as by the demand contraction16.
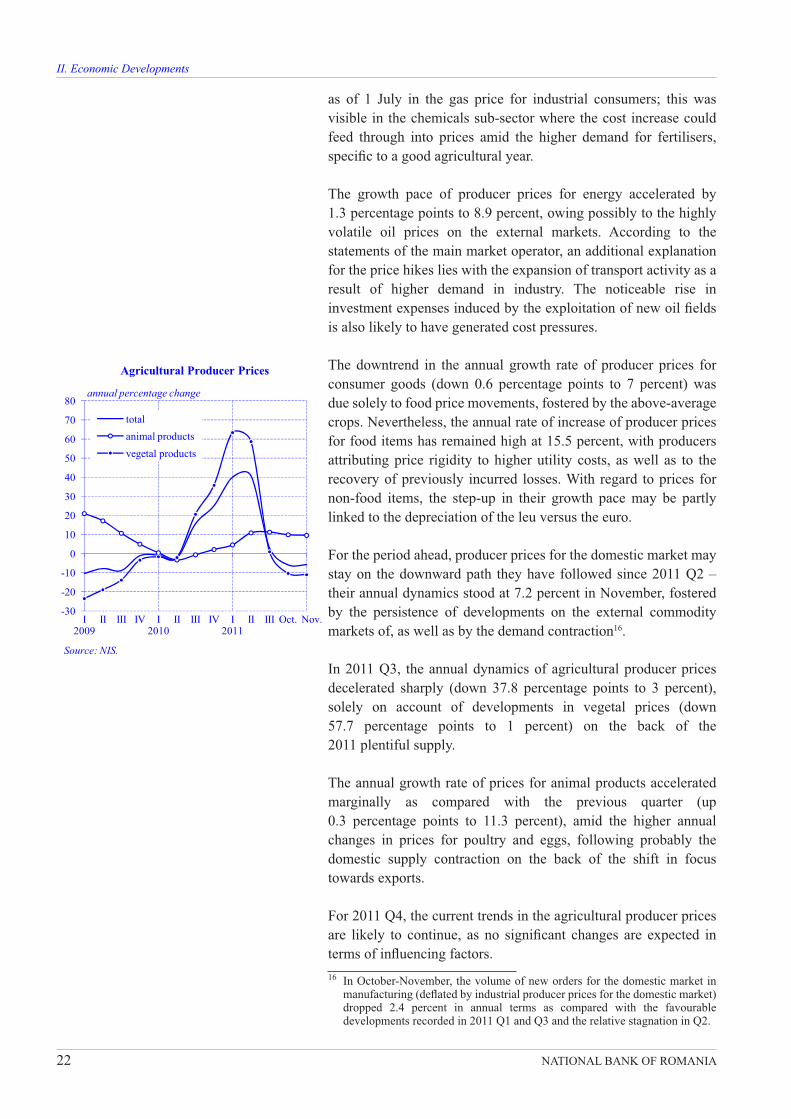
In 2011 Q3, the annual dynamics of agricultural producer prices decelerated sharply (down 37.8 percentage points to 3 percent), solely on account of developments in vegetal prices (down 57.7 percentage points to 1 percent) on the back of the 2011 plentiful supply.
The annual growth rate of prices for animal products accelerated marginally as compared with the previous quarter (up 0.3 percentage points to 11.3 percent), amid the higher annual changes in prices for poultry and eggs, following probably the domestic supply contraction on the back of the shift in focus towards exports.
For 2011 Q4, the current trends in the agricultural producer prices are likely to continue, as no signifi cant changes are expected in terms of infl uencing factors.16 In October-November, the volume of new orders for the domestic market in
manufacturing (defl ated by industrial producer prices for the domestic market) dropped 2.4 percent in annual terms as compared with the favourable developments recorded in 2011 Q1 and Q3 and the relative stagnation in Q2.
-30
-20
-10
0
10
20
30
40
50
60
70
80
I2009
II III IV I2010
II III IV I2011
II III Oct. Nov.
totalanimal productsvegetal products
Agricultural Producer Prices
annual percentage change
Source: NIS.

INFLATION REPORT � February 2012 23
III. MONETARY POLICY AND FINANCIAL DEVELOPMENTS
1. Monetary policy
In the period October 2011 to January 2012, the NBR resumed the prudent rate cutting cycle1, lowering the monetary policy rate in two consecutive steps of 25 basis points each to 5.75 percent. The central bank gradually adjusted real broad monetary conditions – amid the signifi cant improvement in both recent infl ation developments and the infl ation outlook, as well as the moderate volatility of the RON/EUR exchange rate –, thereby ensuring that they remain adequate for fi rmly keeping the annual infl ation rate inside the variation band around the central targets and fostering domestic saving, which are prerequisites for sound economic growth.
The NBR Board decided in its meeting o n 2 November 2011 to lower the monetary policy rate to 6 percent per annum from 6.25 percent previously. Behind this decision stood mainly the signifi cant improvement in current infl ation performance and in the infl ation outlook2, particularly in the short run – implying that the projected 12-month infl ation rate would remain inside the variation band around the 3 percent mid-point of the infl ation targets throughout 2011 and 2012. The new downward revision of the medium-term infl ation forecast built upon the quasi-complete fading-out of the fi rst-round effect of the VAT rate hike of July 2010, in line with central bank expectations, and the recent ample correction in volatile food prices3 (which was seen persisting over the following months). This context was expected to allow disinfl ationary pressures arising from the negative output gap grow stronger in the future, amid the slower forecasted economic recovery (with the 2011 bumper crop giving only temporary impetus). Along with the expected intensifi cation of these pressures, a major driver of the brighter infl ation prospects was the high likelihood that the recent improvement in infl ation expectations would gain momentum over the period ahead.
1 The policy rate had been lowered in May 2010 and subsequently kept at 6.25 percent.
2 The baseline scenario of the updated projection placed the 12-month infl ation rate at 3.3 percent in December 2011, i.e. 1.3 percentage points below the previously-forecasted fi gure in the August 2011 Infl ation Report, and at 3.0 percent in December 2012, i.e. 0.5 percentage points lower than in the previous projection.
3 Amid these developments, the annual infl ation rate dropped to a 20-year low of 3.45 percent in September 2011 from 7.93 percent in June 2011.
24 NATIONAL BANK OF ROMANIA
III. Monetary Policy and Financial Developments
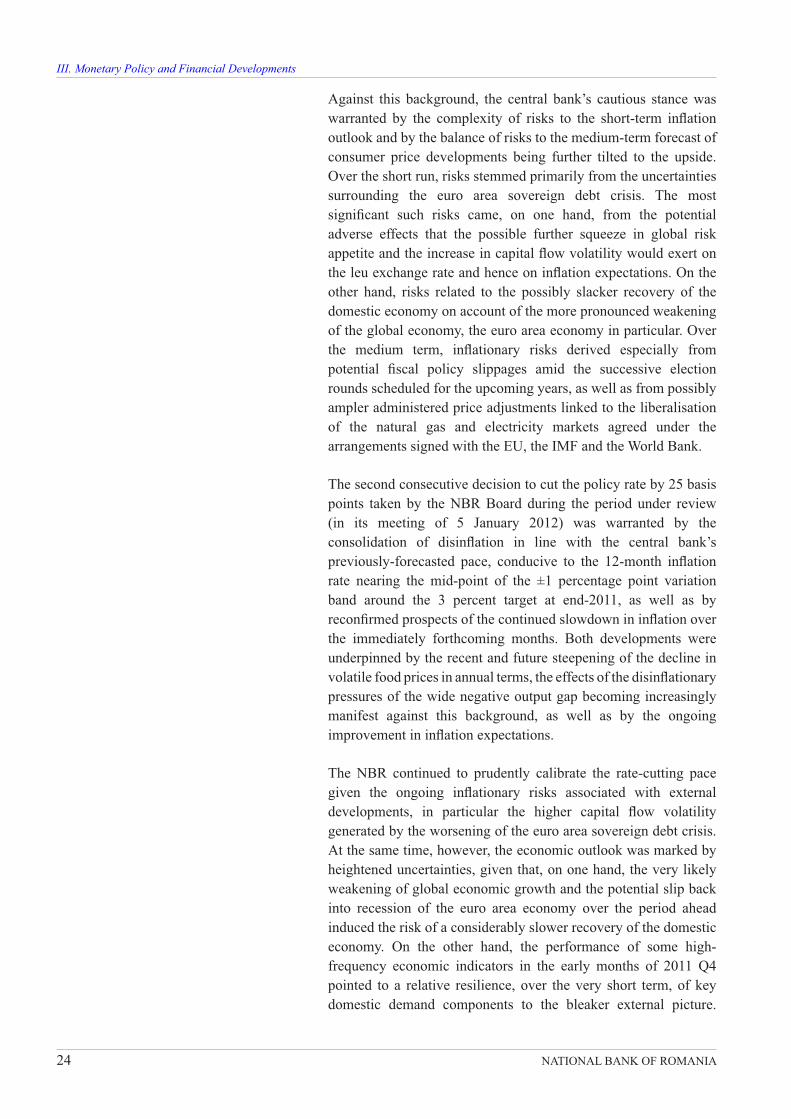
Against this background, the central bank’s cautious stance was warranted by the complexity of risks to the short-term infl ation outlook and by the balance of risks to the medium-term forecast of consumer price developments being further tilted to the upside. Over the short run, risks stemmed primarily from the uncertainties surrounding the euro area sovereign debt crisis. The most signifi cant such risks came, on one hand, from the potential adverse effects that the possible further squeeze in global risk appetite and the increase in capital fl ow volatility would exert on the leu exchange rate and hence on infl ation expectations. On the other hand, risks related to the possibly slacker recovery of the domestic economy on account of the more pronounced weakening of the global economy, the euro area economy in particular. Over the medium term, infl ationary risks derived especially from potential fi scal policy slippages amid the successive election rounds scheduled for the upcoming years, as well as from possibly ampler administered price adjustments linked to the liberalisation of the natural gas and electricity markets agreed under the arrangements signed with the EU, the IMF and the World Bank.
The second consecutive decision to cut the policy rate by 25 basis points taken by the NBR Board during the period under review (in its meeting of 5 January 2012) was warranted by the consolidation of disinfl ation in line with the central bank’s previously-forecasted pace, conducive to the 12-month infl ation rate nearing the mid-point of the ±1 percentage point variation band around the 3 percent target at end-2011, as well as by reconfi rmed prospects of the continued slowdown in infl ation over the immediately forthcoming months. Both developments were underpinned by the recent and future steepening of the decline in volatile food prices in annual terms, the effects of the disinfl ationary pressures of the wide negative output gap becoming increasingly manifest against this background, as well as by the ongoing improvement in infl ation expectations.
The NBR continued to prudently calibrate the rate-cutting pace given the ongoing infl ationary risks associated with external developments, in particular the higher capital fl ow volatility generated by the worsening of the euro area sovereign debt crisis. At the same time, however, the economic outlook was marked by heightened uncertainties, given that, on one hand, the very likely weakening of global economic growth and the potential slip back into recession of the euro area economy over the period ahead induced the risk of a considerably slower recovery of the domestic economy. On the other hand, the performance of some high-frequency economic indicators in the early months of 2011 Q4 pointed to a relative resilience, over the very short term, of key domestic demand components to the bleaker external picture.
INFLATION REPORT � February 2012 25
III. Monetary Policy and Financial Developments
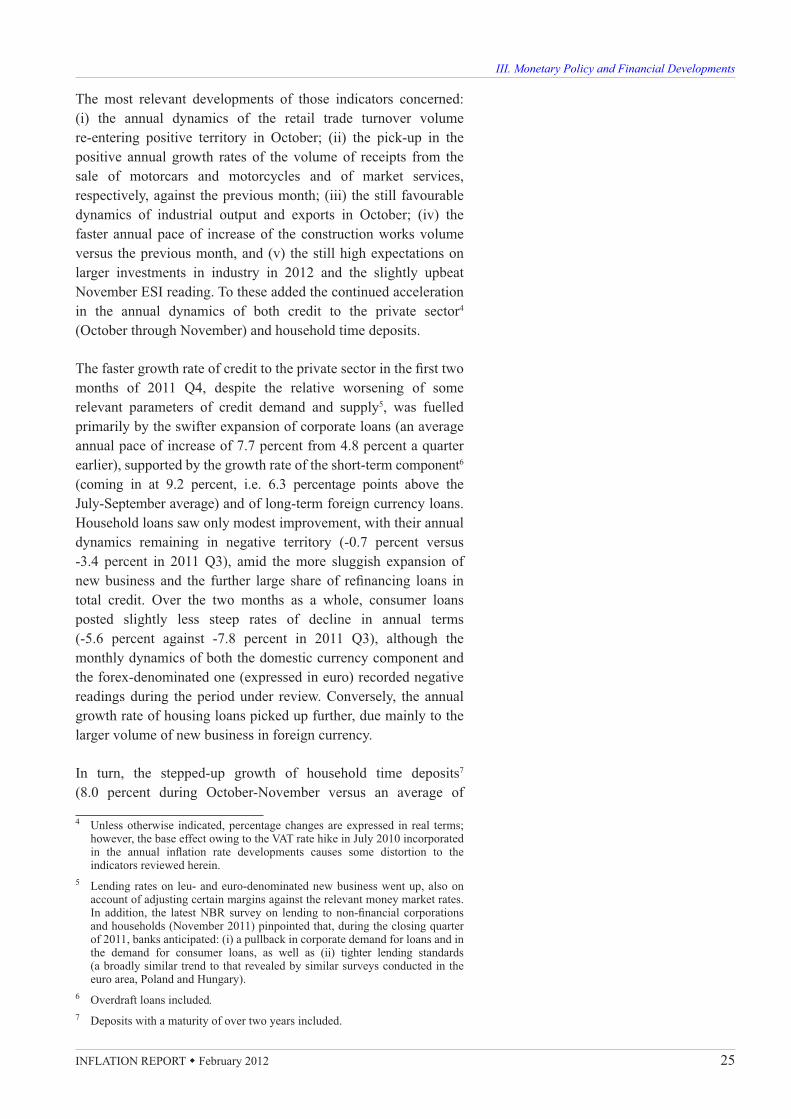
The most relevant developments of those indicators concerned: (i) the annual dynamics of the retail trade turnover volume re-entering positive territory in October; (ii) the pick-up in the positive annual growth rates of the volume of receipts from the sale of motorcars and motorcycles and of market services, respectively, against the previous month; (iii) the still favourable dynamics of industrial output and exports in October; (iv) the faster annual pace of increase of the construction works volume versus the previous month, and (v) the still high expectations on larger investments in industry in 2012 and the slightly upbeat November ESI reading. To these added the continued acceleration in the annual dynamics of both credit to the private sector4
(October through November) and household time deposits.
T he faster growth rate of credit to the private sector in the fi rst two months of 2011 Q4, despite the relative worsening of some relevant parameters of credit demand and supply5, was fuelled primarily by the swifter expansion of corp orate loans (an average annual pace of increase of 7.7 percent from 4.8 percent a quarter earlier), supported by the growth rate of the short-term component6
(coming in at 9.2 percent, i.e. 6.3 percentage points above the July-September average) and of long-term foreign currency loans. Household loans saw only modest improvement, with their annual dynamics remaining in negative territory (-0.7 percent versus -3.4 percent in 2011 Q3), amid the more sluggish expan sion of new business and the further large share of refi nancing loans in total credit. Over the two months as a whole, consumer loans posted slightly less steep rates of decline in annual terms (-5.6 percent against -7.8 percent in 2011 Q3), although the monthly dynamics of both the domestic currency component and the forex-denominated one (expressed in euro) recorded negative readings during the period under review. Conversely, the annual growth rate of housing loans picked up further, due mainly to the larger volume of new business in foreign currency.
In turn, the stepped-up growth of household time deposits7
(8.0 percent during October-November versus an average of
4 Unless otherwise indicated, percentage changes are expressed in real terms; however, the base effect owing to the VAT rate hike in July 2010 incorporated in the annual infl ation rate developments causes some distortion to the indicators reviewed herein.
5 Lending rates on leu- and euro-denominated new business went up, also on account of adjusting certain margins against the relevant money market rates. In addition, the latest NBR survey on lending to non-fi nancial corporations and households (November 2011) pinpointed that, during the closing quarter of 2011, banks anticipated: (i) a pullback in corporate demand for loans and in the demand for consumer loans, as well as (ii) tighter lending standards(a broadly similar trend to that revealed by similar surveys conducted in the euro area, Poland and Hungary).
6 Overdraft loans included.7 Deposits with a maturity of over two years included.

26 NATIONAL BANK OF ROMANIA
III. Monetary Policy and Financial Developments
0
5
10
15
20
Jan.2009 Jan.2010 Jan.2011average overnight deposit ratepolicy ratelending facility ratedeposit facility rate
percent per annum
Money Market Interest Rates
Dec.2011
6.5 percent July through September), largely on account of the faster increase in the leu-denominated component, was spurred by a relative improvement in wage dynamics and further high rates on bank deposits in local currency. The strengthening of the upward trend in the dynamics of household time deposits, which occurred despite the still rapid pace of increase in the volume of households’ holdings of government securities (albeit below the 2011 Q3 reading), hints at the further robust precautionary demand for money.
During 2011 Q4, the central bank continued to pursue an adequate management of liquidity in the banking system, tailored to the specifi c functioning of different segments of the local fi nancial market. Since banks further posted a net liquidity defi cit, the National Bank of Romania’s open market operations were aimed at providing liquidity. For this purpose, the monetary authority conducted one-week repo operations through fi xed-rate auctions with full allotment; auctions were organised on a weekly basis (each Monday) starting 17 October 2011. Temporary excess liquidity was further drained exclusively via the deposit facility.
2. Financial markets and monetary developments
In 2011 Q4, the average interbank money market rate posted an increase, with a similar trend being manifest for average ROBOR rates (short-term ones in particular). Lending rates on new business also followed an upward path, whereas the remuneration of time deposits remained virtually unchanged September through November 2011. The RON/EUR exchange rate fl uctuated inside a relatively narrow band over most of the period under review, witnessing a temporary decline towards year-end. The real annual growth rate of broad money re-entered positive territory, similarly to the dynamics of credit to the private sector.
2.1. Interest rates
Interbank money market rates stuck to an upward path in 2011 Q4, with their average reaching 5.3 percent, up 0.7 percentage points from the previous quarter.
Overnight rates remained approximately 1 percentage point below the monetary policy rate during the fi rst half of the period under review. Afterwards, amid a temporary widening of the net liquidity defi cit in the banking system, these rates witnessed an increase, before stabilising somewhat in the immediate vicinity of the new policy rate level set by the central bank. Overnight rates reverted to lower readings towards end-December, against the background
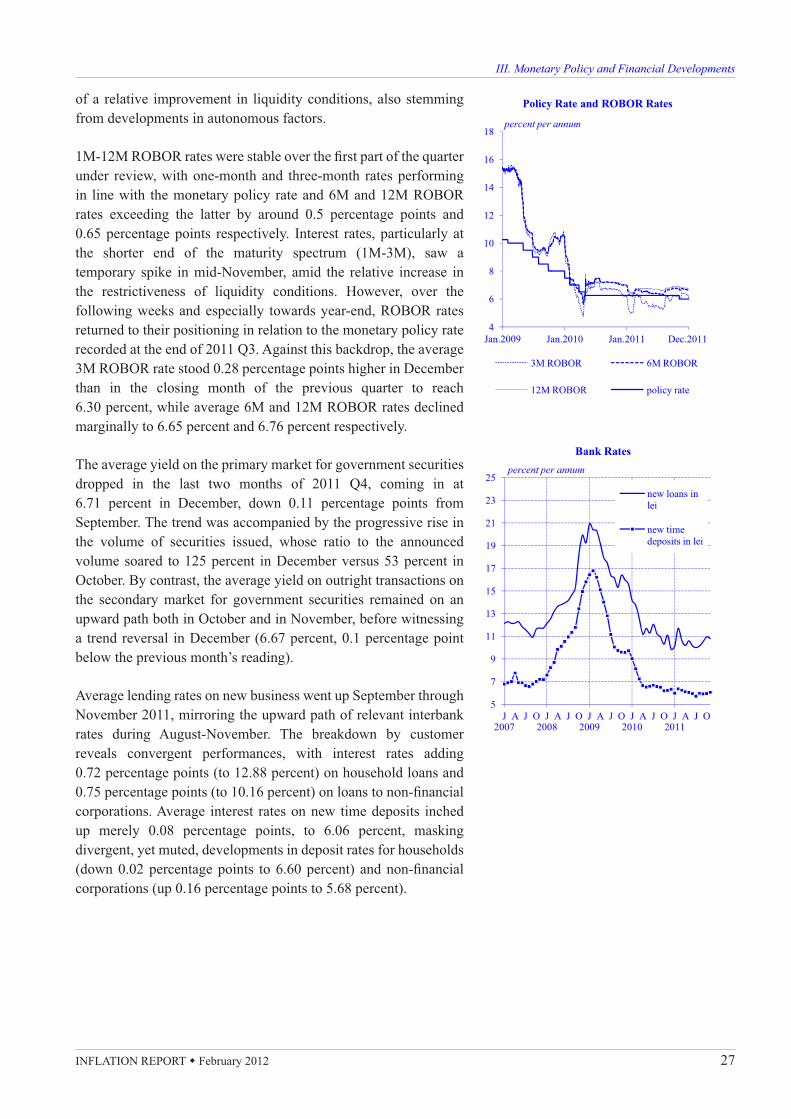
INFLATION REPORT � February 2012 27
III. Monetary Policy and Financial Developments
4
6
8
10
12
14
16
18
Jan.2009 Jan.2010 Jan.2011
3M ROBOR 6M ROBOR
12M ROBOR policy rate
percent per annum
Policy Rate and ROBOR Rates
Dec.2011
5
7
9
11
13
15
17
19
21
23
25
J2007
A J O J2008
A J O J2009
A J O J2010
A J O J2011
A J O
new loans in lei
new time deposits in lei
percent per annum
Bank Rates
of a relative improvement in liquidity conditions, also stemming from developments in autonomous factors.
1M-12M ROBOR rates were stable over the fi rst part of the quarter under review, with one-month and three-month rates performing in line with the monetary policy rate and 6M and 12M ROBOR rates exceeding the latter by around 0.5 percentage points and 0.65 percentage points respectively. Interest rat es, particularly at the shorter end of the maturity spectrum (1M-3M), saw a temporary spike in mid-November, amid the relative increase in the restrictiveness of liquidity conditions. However, over the following weeks and especially towards year-end, ROBOR rates returned to their positioning in relation to the monetary policy rate recorded at the end of 2011 Q3. Against this backdrop, the average 3M ROBOR rate stood 0.28 percentage points higher in December than in the closing month of the previous quarter to reach 6.30 percent, while average 6M and 12M ROBOR rates declined marginally to 6.65 percent and 6.76 percent respectively.
The average yield on the primary market for government securities dropped in the last two months of 2011 Q4, coming in at 6.71 percent in December, down 0.11 percentage points from September. The trend was acco mpanied by the progressive rise in the volume of securities issued, whose ratio to the announced volume soared to 125 percent in December versus 53 percent in October. By contrast, the average yield on outright transactions on the secondary market for government securities remained on an upward path both in October and in November, before witnessing a trend reversal in December (6.67 percent, 0.1 percentage point below the previous month’s reading).
Average lending rates on new business went up September through November 2011, mirroring the upward path of relevant interbank rates during August-November. The breakdown by customer reveals convergent performances, with interest rates adding 0.72 percentage points (to 12.88 percent) on household loans and 0.75 percentage points (to 10.16 percent) on loans to non-fi nancial corporations. Average interest rates on new time deposits inched up merely 0.08 percentage points, to 6.06 percent, masking divergent, yet mut ed, developments in deposit rates for households (down 0.02 percentage points to 6.60 percent) and non-fi nancial corporations (up 0.16 percentage points to 5.68 percent).

28 NATIONAL BANK OF ROMANIA
III. Monetary Policy and Financial Developments
Key Financial Account Items (balances)EUR million
2010 201111 mos. 11 mos.
Financial account 4,921 4,463Direct investment 2,553 1,570- residents abroad -6 -69- non-residents in Romania 2,559 1,639
Portofolio investments and fi nancial derivatives 624 2,055- residents abroad -355 166- non-residents in Romania 978 1 888
Other capital investments 5,362 463- credits and loans from the IMF 4,247 908- medium- and long-term investments -24 -179- short-term investments 113 716- currency and short-term deposits 961 -935- other 64 -47
NBR’s reserve assets, net("-" increase/"+"decrease) -3,618 377
2.22.42.62.83.03.23.43.63.84.04.24.44.6
J2007
A J O J2008
A J O J2009
A J O J2010
A J O J2011
A J O
RON/USDRON/EUR
Nominal Exchange Rate
2.2. Exchange rate and capital fl ows
The RON/EUR exchange rate continued to rise in the fi rst part of 2011 Q4, before stabilising somewhat on account of the slight improvement in foreign investor sentiment towards the domestic economy and then posting a temporary decline8 in the run-up to the year-end.
In the period from October to December, the domestic currency depreciated against the euro by 1.0 percent in nominal terms, while strengthening 0.3 percent in real terms. The leu weakened versus the US dollar by 5.6 percent in nominal terms and 4.4 percent in real terms, given the latter’s signifi cant appreciation on global fi nancial markets. Looking at the average annual change of the exchange rate in 2011 Q4, the domestic currency witnessed faster nominal depreciation against the euro and the fi rst nominal weakening in relation to the US dollar in the past three quarters, while in real terms it followed a less steep appreciation path versus both currencies.
The RON/EUR exchange rate fl uctuated within a narrow band in the fi rst 10-day period of October, similarly to the exchange rates of the Polish zloty and the Czech koruna, before embarking on a slightly upward path amid the rekindling of global risk aversion and the EBRD cutting its 2011-2012 growth forecasts for CEE economies, Romania included. Nevertheless, the exchange rate of the domestic currency tended to stabilise towards end-October, due to the improvement in fi nancial market sentiment on the eve of the EU Heads of State or Government meeting scheduled for this period and to the optimism triggered by the outcome9 of the summit.
The upbeat sentiment was only short-lived, as subsequent events – including the major rating agencies placing euro area sovereign ratings on watch – rekindled global fi nancial market tensions and volatility10. Nonetheless, the adverse impact of the external picture on the RON/EUR exchange rate11 was mitigated to a certain extent by the slight improvement in investor sentiment towards the
8 During 2011 Q4, the leu weakened versus the euro at a much slower pace than the Hungarian forint, the Czech koruna and the Polish zloty.
9 Participants agreed on: (i) cutting Greece’s debt and putting in place a new EU/IMF assistance programme for this country (worth up to EUR 100 billion) by end-2011; (ii) leveraging the euro zone bailout fund (EFSF) up to fi ve times, and (iii) implementing a recapitalisation plan for EU banks.
10 The tensions and volatility abated somewhat as late as 30 November 2011, when the Fed and fi ve other central banks took coordinated action to cut European banks’ borrowing costs in USD.
11 External developments led to higher risk premiums for countries in the region, Romania included, and therefore the MPF decided to postpone the bond issue on the US market.

INFLATION REPORT � February 2012 29
III. Monetary Policy and Financial Developments
90
95
100
105
110
115
120
Jan.2010
Jan.2011
HUF/EURRON/EURPLN/EURCZK/EUR
Source: ECB, NBR.
indexes; 31 December 2009=100
Exchange Rate Developments on Emerging Markets in the Region
Jun. Jun.
-40-30-20-10
0102030405060
J2008
A J O J2009
A J O J2010
A J O J2011
A J O
M3currency in circulationtime deposits (maturity of up to two years)overnight deposits
Source: NIS, NBR.
real annual percentage change
Main Broad Money Components
Annual Growth Rates of M3 and Its Components
real percentage change
2010 2011IV I II III
Oct. Nov.quarterly average growth
M3 -1.4 -2.0 -5.1 1.6 2.9 2.6
M1 -5.8 -4.1 -7.4 -1.3 3.6 1.3
Currency in circulation 3.7 2.0 -2.9 3.1 4.7 8.3
Overnightdeposits -9.8 -6.8 -9.5 -3.5 3.0 -2.2
Time deposits (maturity of up to two years) 0.6 -1.7 -4.1 2.3 1.6 2.7Source: NIS, NBR.
domestic economy. This was driven by: (i) the positive signal conveyed by the EU/IMF statement, which confi rmed the fulfi lment of all performance criteria for end-September, as laid down in the precautionary arrangement; (ii) the further favourable trend of some relevant indicators, as highlighted by data released in November (including the fl ash estimate on Q3 GDP dynamics); (iii) the less anticipated decision of the NBR Board to lower the monetary policy rate. Thus, unlike the exchange rates of most currencies in the region, which saw ample both-way fl uctuations, the RON/EUR exchange rate moved within a narrow band throughout November and in the fi rst half of December. Afterwards, it witnessed a temporary decline amid the relative easing of tensions on global fi nancial markets and especially Moody’s confi rmation of Romania’s sovereign rating with a stable outlook12. Against this background, the interbank forex market saw its defi cit narrowing in December to less than one third of the previous month’s reading, while the RON/EUR exchange rate dropped on 28 December to 4.2875, i.e. close to the lowest level recorded in September 2011.
2.3. Money and credit
Money
September through November 2011, the dynamics13 of broad money (M3) picked up (+2.9 percent versus -1.2 percent June through August 2011), although remaining low from a historical perspective. The growth rate of M3 entered positive territory primarily due to the favourable base effect associated with infl ation developments14 and the statistical infl uence of changes in the RON/EUR exchange rate, to which added the relative rebound in the dynamics of credit to the private sector.
All major components of M3 contributed to the faster pace of increase of this monetary aggregate. Time deposits with a maturity of up to two years further had the most signifi cant contribution, with their annual dynamics re-entering positive territory exclusively on account of developments under household deposits. The growth rate of narrow money (M1) also turned positive again, given the improved dynamics of both currency in circulation and overnight deposits compared to the previous period. However, the latter remained in negative territory owing to developments in household overnight deposits. The M3 breakdown by holder
12 According to the announcement posted on the MPF website.13 Unless otherwise indicated, percentage changes refer to the average annual
growth rates in real terms for September-November 2011.14 The temporary rise in the annual infl ation rate in July 2010 following the VAT
rate hike.

30 NATIONAL BANK OF ROMANIA
III. Monetary Policy and Financial Developments
-20-10
01020304050607080
J2008
A J O J2009
A J O J2010
A J O J2011
A J O
totalhouseholdsnon-financial corporations and non-MFIs
real annual percentage change
Source: NIS, NBR.
Credit to Private Sector by Institutional Sector
-20
-10
0
10
20
30
40
50
60
70
80
J2008
A J O J2009
A J O J2010
A J O J2011
A J O
totaldomestic currencyforeign currency
real annual percentage change
Source: NIS, NBR.
Credit to Private Sector by Currency
reveals an improvement in the dynamics of household and corporate deposits alike. In case of households, the brighter picture was associated with the faster real annual expansion of wages, amid the statistical effect of budgetary sector wage cuts15, and with individuals’ shrinking appetite for money market fund shares. As regards companies, the upward dynamics was due exclusively to the statistical effect of the decline in the annual infl ation rate, which more than offset the contractionary impact exerted by the larger volume of government securities held by this sector and, possibly, by higher repayments on companies’ external loans16.The M3 breakdown by currency also improved, as the share of domestic currency-denominated deposits continued to widen during the period under review.
From the perspective of M3 counterparts, the rebound in broad money dynamics was brought about by the faster growth rate of both credit to the private sector and central government net credit. An opposite effect had the more negative dynamics of net foreign assets and the faster increase in long-term fi nancial liabilities (capital accounts included).
Credit
September through November 2011, the dynamics17 of credit to the private sector re-entered positive territory for the fi rst time in the past two years, standing at 3.4 percent from -2.3 percent in the previous period. These developments refl ected the ongoing uptrend in the dynamics of both domestic and foreign currency components, as well as the statistical effects of the decline in the 12-month infl ation rate and of the weaker leu. Against this background, the average share of foreign currency-denominated loans in total credit to the private sector peaked at a 9-year high.
The growth rate of loans picked up for both main customer categories. Thus, corporate lending hit a 2½-year high, owing primarily to the rebound in the pace of increase of the short-term component. The dynamics of household loans further posted less negative readings, on account of the robust recovery in the growth rate of housing loans and the less steep negative dynamics of other
15 Starting July 2010.16 According to balance-of-payments data, medium- and long-term net fi nancial
loans to the non-banking sector posted signifi cant negative readings during the period from September to October 2011.
17 Unless otherwise indicated, percentage changes refer to the average annual growth rates in real terms for September-November 2011.
INFLATION REPORT � February 2012 31
III. Monetary Policy and Financial Developments
types of loans18. The larger amounts granted via overdrafts and credit cards19 seem to have driven these developments, whereas the fl ow of new loans witnessed a decline20, on the background of a rise in lending rates (especially on new business in domestic currency) and a relative worsening of some parameters of the credit supply.
18 Consumer loans, loans for other purposes and business development loans, analysed as a single indicator, with a view to eliminating the effects of statistical methodology changes following the entry into force of NBR Norms No. 10/2009 for enforcing ECB Regulation No. 25/2009.
19 Overdraft loans, automatically renewable and linked to credit cards, as reported by banks pursuant to NBR Norms No. 11/2009.
20 According to the November 2011 NBR survey on lending to non-fi nancial corporations and households, corporate demand for loans rose at a more sluggish pace in 2011 Q3 than in the previous quarter and was anticipated to decline in the closing quarter of the year. At the same time, household demand for mortgage loans picked up only marginally in 2011 Q3, while that for consumer loans was on the wane and expected to shrink considerably in 2011 Q4. During 2011 Q3, banks tightened several lending terms and/or announced similar adjustments for the period ahead.

32 NATIONAL BANK OF ROMANIA
IV. INFLATION OUTLOOK
For end-2012, the baseline scenario of the current projection places the annual CPI infl ation rate at 3.2 percent, 0.2 percentage points higher than in the November 2011 Infl ation Report. For end-2013, the infl ation rate is forecast to stand at 3 percent.
The annual rates of both CPI infl ation and adjusted CORE2 infl ation are seen following paths similar to those forecasted in the November 2011 Infl ation Report. The CPI infl ation rate will remain inside the variation band around the central targets throughout the reference period, being anticipated to reach a trough in 2012 Q1 (2 percent) and a peak in 2012 Q3 (3.8 percent) on account of statistical base effects. The prudent setting of broad monetary conditions over the entire forecast horizon will ensure that headline infl ation returns close to 3 percent in 2012 Q4 and thereafter stays in the vicinity of this level until the end of the projection horizon. The adjusted CORE2 infl ation rate is expected to stabilise at levels close to, but below 2 percent starting with 2012 Q1.
The slight upward revision of the projected annual CPI infl ation for end-2012 is due to the relatively less favourable contributions from the dynamics of adjusted CORE2 infl ation, volatile food prices (of fruit, vegetables and eggs), and tobacco prices compared to the previous forecast. The scenario for administered price growth has been revised slightly downwards for 2012 and upwards for 2013. The forecasted pace of increase of fuel prices is slower in the current baseline scenario than in the previous projection throughout the forecast horizon. The revision of this component is more pronounced for 2013, when the dynamics of adjusted CORE2 infl ation are also anticipated to become comparatively more favourable, thus jointly contributing to the projected decline in the 12-month CPI infl ation rate by 0.2 percentage points in December 2013 versus December 2012.
The marginal differences between the updated projection of adjusted CORE2 infl ation and the previous forecast result from moderately revised infl uences of fundamentals, with a mutually offsetting net effect. Thus, infl ation expectations are lower throughout the reference period, while the reassessment of the negative output gap implies, in relative terms, more subdued disinfl ationary pressures. The anticipated growth rate of import prices is faster than in the previous forecasting round over the fi rst part of the projection horizon and slower over the remaining part.
The central bank will further seek to set the path of the monetary policy rate so as to ensure adequate real broad monetary conditions for consolidating the prospects of fi rmly keeping the infl ation rate

INFLATION REPORT � February 2012 33
IV. In� ation Outlook
inside the target band throughout the projection horizon and for achieving a sustainable recovery of lending to the economy. In particular, broad monetary conditions need to be adequately calibrated so as to preclude any rekindling of infl ation expectations amid the temporary increase in the annual infl ation rate forecasted for 2012 Q3, associated with an unfavourable statistical base effect.
The overall balance of risks to the infl ation rate projected in the current baseline scenario appears to be tilted to the upside, with potential sources of risks relating both to external developments and domestic factors.
The main sources of external risks are the persistent uncertainties surrounding the confi guration of a convincing and comprehensive solution to the euro area sovereign debt crisis, as well as the political and social tensions in the Middle East.
The persistence or worsening of the sovereign debt crisis would fuel the nervousness of global fi nancial markets and would heighten investors’ risk aversion. In turn, this would mean severe constraints, at European and regional levels, on the availability and costs of external fi nancing necessary for the sustainable recovery of the domestic economy and would put considerable pressures on the leu exchange rate. This would have a detrimental impact on economic growth. The shrinking domestic demand and the weaker domestic currency would have opposite effects on price dynamics. However, given the pace and magnitude of a weaker leu feeding through into prices and infl ation expectations, the net effect is seen as conducive to faster infl ation than assumed in the baseline scenario.
Escalating tensions in the Middle East might lead to substantial rises in the international oil price. Such an adverse supply-side shock would entail unfavourable deviations from the baseline scenario of both the infl ation rate and economic g rowth.
The balance of domestic risks appears to be less tilted to the upside compared to that of external risks. This year’s electoral schedule stands out as a typical source of risk to infl ation in terms of possible slippages in the implementation of fi scal policy and structural reforms. A priori, this risk is mitigated by the good performance in terms of fi scal consolidation and structural reforms in 2011, which paves the way for further fi rm implementation of the measures agreed under the arrangements signed with the EU, the IMF and the World Bank. Nonetheless, the balance of risks stemming from this source could be tilted to the upside on account of political or social pressures that may jeopardise the consistent enforcement of the agreed measures.

34 NATIONAL BANK OF ROMANIA
IV. In� ation Outlook
-10
-5
0
5
10
50
65
80
95
110
II2011
III IV I2012
II III IV I2013
II III IV
Baseline Scenario for the International Oil Price
quarterly change spread (rhs)oil price - current scenariooil price - previous scenario
Source: NBR assumptions based on the data provided by U.S. Energy Information Administration
US dollar/barrel percentage points
Expectations on the Developments in External Variables
annual average2011 2012 2013
Oil price (USD/barrel) 94.9 100.2 103.7USD/EUR exchange rate 1.39 1.29 1.313M EURIBOR interest rate (% p.a.) 1.39 1.05 1.11Economic growth in the euro area (%) 1.6 0.5 1.4Annual infl ation rate in the euro area (%) 2.7 1.9 1.8Source: NBR assumptions based on data provided by
U.S. Energy Information Administration, European Commission, Consensus Economics and futures prices.
Risks associated with both administered price increases and the dynamics of volatile food prices are seen as relatively symmetrically distributed against the baseline scenario of the current projection.Containing the potential for the relevant unfavourable risks to infl ation and economic growth to materialise is strictly conditional on the further consistent implementation of the economic programme on fi scal consolidation and structural reforms agreed under the arrangements signed with the EU, the IMF and the World Bank.
1. The baseline scenario of the forecast
1.1. External assumptions
The current scenario for the economic developments in the euro area, Romania’s main trading partner, envisages a slowdown in the average annual dynamics of real GDP from 1.6 percent in 2011 to 0.5 percent in 2012, ahead of a slight revival to 1.4 percent1 in 2013. The modest economic growth is expected in the context of the euro area sovereign debt crisis and of the associated fi scal austerity measures. Moreover, the fi nancing conditions for companies and households are anticipated to worsen due to world market tensions and the deterioration of business confi dence indicators. The subsequent gradual rebound in economic activity is foreseen to be supported by the upturn in global demand, the favourable impact of lower energy and food prices on economic agents’ real income, the stimulus provided by the low interest rates and by the measures taken to restore the functioning of the fi nancial system.
Considering the anticipated slow economic growth in the euro area, the baseline scenario envisages a decrease in 3M EURIBOR rate in 2012 compared with 2011 and a slight increase in 2013.
The HICP infl ation rate in the euro area is expected to drop below 2 percent in 2012 and to remain relatively unchanged in 2013. Compared with the USD/EUR exchange rate recorded in 2011 Q4, the current projection foresees a depreciation of the euro to an average value of USD/EUR 1.29 in 2012, followed by a mild appreciation to USD/EUR 1.31 in 2013.
1 The euro area economic activity scenario for the current forecasting round was assumed from the autumn 2011 forecast of the European Commission. For 2012, this scenario will be revised after the release, by the Commission, on 23 February, of the interim forecast. The fi nal spring forecast including the revision of the economic growth scenario for 2013 will be released on 13 May 2012.
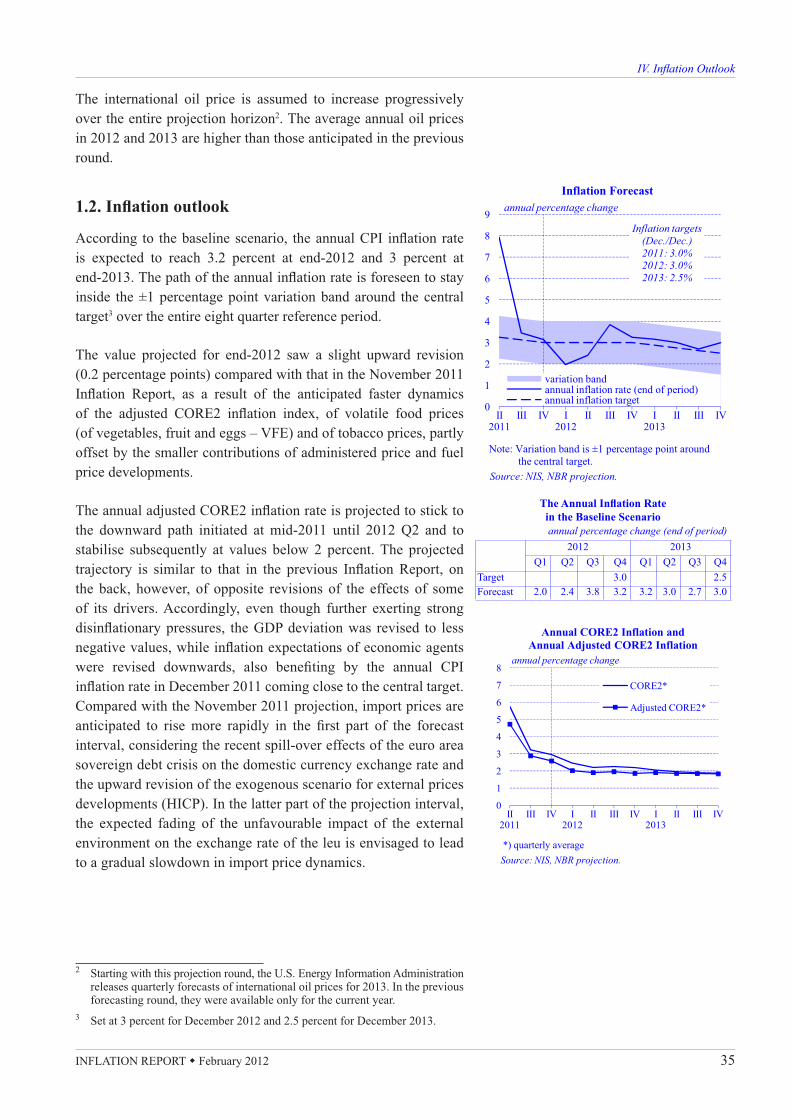
INFLATION REPORT � February 2012 35
IV. In� ation Outlook
�
�
�
�
�
�
�
�
II2011
III IV I2012
II III IV I2013
II III IV
��������������������������������������������������������������������������
Inflation targets(Dec./Dec.)2011: 3.0%2012: 3.0%2013: 2.5%
���!� ���������������"�#�����$���������������������%��$�������������&
Source: NIS, NBR projection.
annual percentage changeInflation Forecast
The Annual Infl ation Ratein the Baseline Scenarioannual percentage change (end of period)
2012 2013Q1 Q2 Q3 Q4 Q1 Q2 Q3 Q4
Target 3.0 2.5Forecast 2.0 2.4 3.8 3.2 3.2 3.0 2.7 3.0
0
1
2
3
4
5
6
7
8
II2011
III IV I2012
II III IV I2013
II III IV
CORE2*
Adjusted CORE2*
Source: NIS, NBR projection. *) quarterly average
annual percentage change
Annual CORE2 Inflation and Annual Adjusted CORE2 Inflation
The international oil price is assumed to increase progressively over the entire projection horizon2. The average annual oil prices in 2012 and 2013 are higher than those anticipated in the previous round.
1.2. Infl ation outlook
According to the baseline scenario, the annual CPI infl ation rate is expected to reach 3.2 percent at end-2012 and 3 percent at end-2013. The path of the annual infl ation rate is foreseen to stay inside the ±1 percentage point variation band around the central target3 over the entire eight quarter reference period.
The value projected for end-2012 saw a slight upward revision (0.2 percentage points) compared with that in the November 2011 Infl ation Report, as a result of the anticipated faster dynamics of the adjusted CORE2 infl ation index, of volatile food prices (of vegetables, fruit and eggs – VFE) and of tobacco prices, partly offset by the smaller contributions of administered price and fuel price developments.
The annual adjusted CORE2 infl ation rate is projected to stick to the downward path initiated at mid-2011 until 2012 Q2 and to stabilise subsequently at values below 2 percent. The projected trajectory is similar to that in the previous Infl ation Report, on the back, however, of opposite revisions of the effects of some of its drivers. Accordingly, even though further exerting strong disinfl ationary pressures, the GDP deviation was revised to less negative values, while infl ation expectations of economic agents were revised downwards, also benefi ting by the annual CPI infl ation rate in December 2011 coming close to the central target. Compared with the November 2011 projection, import prices are anticipated to rise more rapidly in the fi rst part of the forecast interval, considering the recent spill-over effects of the euro area sovereign debt crisis on the domestic currency exchange rate and the upward revision of the exogenous scenario for external prices developments (HICP). In the latter part of the projection interval, the expected fading of the unfavourable impact of the external environment on the exchange rate of the leu is envisaged to lead to a gradual slowdown in import price dynamics.
2 Starting with this projection round, the U.S. Energy Information Administration releases quarterly forecasts of international oil prices for 2013. In the previous forecasting round, they were available only for the current year.
3 Set at 3 percent for December 2012 and 2.5 percent for December 2013.

36 NATIONAL BANK OF ROMANIA
IV. In� ation Outlook
0
2
4
6
8
10
II2011
III IV I2012
II III IV I2013
II III IV
annual percentage change
Source: NIS, NBR projection.
Administered Prices Annual Inflation*
*) quarterly average
0
2
4
6
8
10
12
14
16
II2011
III IV I2012
II III IV I2013
II III IV
Source: NIS, NBR projection.
annual percentage change
Fuel Prices Annual Inflation*
*) quarterly average
Components’ Contributionto Annual Infl ation Rate*
percentage points 2012 2013
Administered prices 0.8 1.2Fuels 0.3 0.3VFE prices 0.6 0.3CORE2, of which: 1.5 1.2
– tobacco 0.3 0.1* end of period
-24
-16
-8
0
8
16
24
32
II2011
III IV I2012
II III IV I2013
II III IV
Source: NIS, NBR projection.
Vegetables, Fruit and Eggs Prices Annual Inflation*
annual percentage change
*) quarterly average
The annual tobacco infl ation rate forecast stems largely from the rise in excise duties stipulated in the Tax Code4. Compared with the previous projection, the contribution of this component to CPI infl ation at the end of 2012 was revised slightly upwards5 due to higher retail prices of cigarettes in Q16.
The scenario for VFE prices is built on the assumption that 2012 and 2013 will be normal agricultural years and foresees further negative values of their annual dynamics in the fi rst half of the current year, following the carried-on effect of the bumper crop in the previous year. Starting with 2012 Q3, given an unfavourable statistical base effect, the VFE infl ation path will reverse, thereby contributing also to the step-up in the annual CPI infl ation rate. The annual contribution of VFE infl ation to CPI infl ation is envisaged to be marginally higher in 2012 than forecasted previously.
The annual growth rate of administered prices is expected to stand at 4.9 percent in 2012 Q4 (a 0.4 percentage point downward revision from the previously forecasted level) and at 6.7 percent in 2013 Q4.
The annual infl ation rate of fuel prices is projected to slow down over the projection horizon. The anticipation of a lower level in 2012 Q1 (the starting point of the projection), as well as the fading of the recent unfavourable impact of the exchange rate place the current trajectory below that of the previous forecast.
Overall, the cumulative contribution of the components exogenous in terms of the scope of monetary policy action – administered prices, VFE, fuel and tobacco prices – to the annual CPI infl ation rate is expected to stand at 2.1 percentage points in 2012 Q4 and 1.8 percentage points in 2013 Q4.
4 According to Government Emergency Ordinance No. 117/2010, during 2012-2017, the overall excise duty will be raised only once a year, on 1 July. In 2018, the hike in overall excise duty will take place on 1 January. Based on the same source, the specifi c duty (i.e. the fi xed component of the excise duty) is expected to increase on a regular basis, while the ad valorem excise duty (i.e. the component linked to the selling price of cigarettes) is foreseen to decline gradually.
5 By 0.1 percentage points.6 It is worth mentioning that the increases are not the result of higher excise
duty on cigarettes stipulated in the Tax Code.
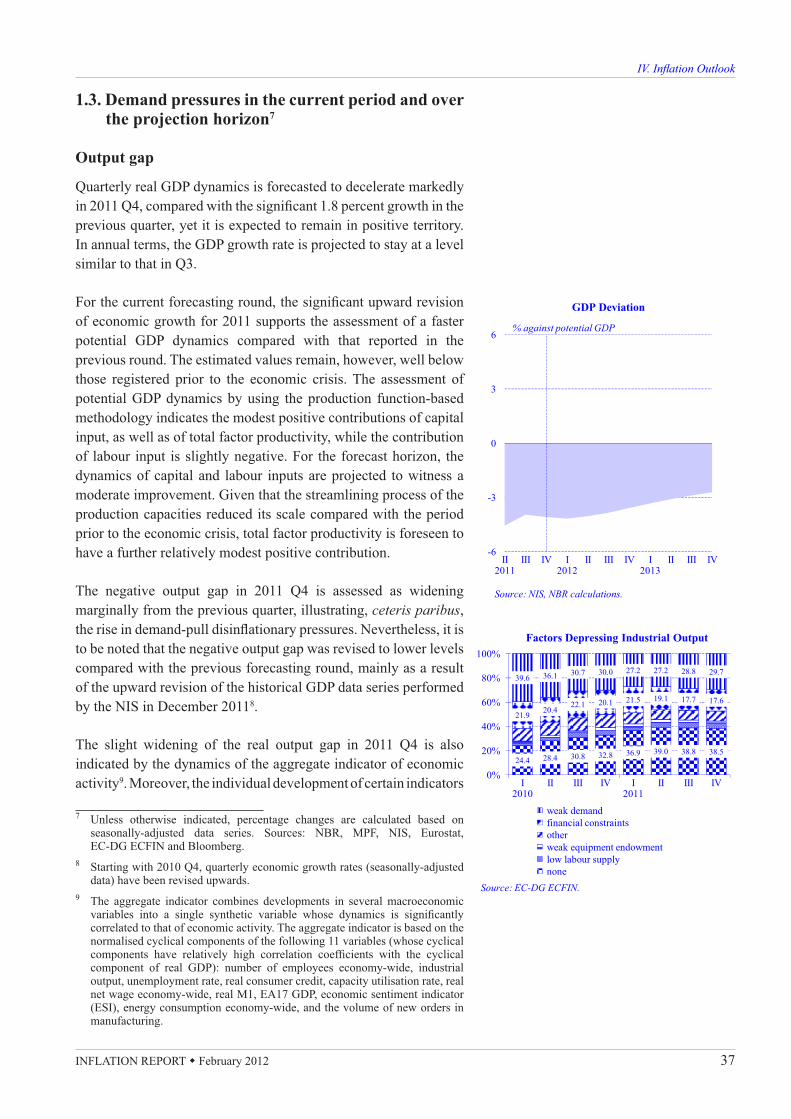
INFLATION REPORT � February 2012 37
IV. In� ation Outlook
-6
-3
0
3
6
II2011
III IV I2012
II III IV I2013
II III IV
GDP Deviation
Source: NIS, NBR calculations.
% against potential GDP
24.4 28.4 30.8 32.8 36.9 39.0 38.8 38.5
21.9 20.422.1 20.1 21.5 19.1 17.7 17.6
39.6 36.1 30.7 30.0 27.2 27.2 28.8 29.7
0%
20%
40%
60%
80%
100%
I2010
II III IV I2011
II III IV
weak demandfinancial constraintsotherweak equipment endowmentlow labour supply none
Source: EC-DG ECFIN.
Factors Depressing Industrial Output
1.3. Demand pressures in the current period and over the projection horizon7
Output gap
Quarterly real GDP dynamics is forecasted to decelerate markedly in 2011 Q4, compared with the signifi cant 1.8 percent growth in the previous quarter, yet it is expected to remain in positive territory. In annual terms, the GDP growth rate is projected to stay at a level similar to that in Q3.
For the current forecasting round, the signifi cant upward revision of economic growth for 2011 supports the assessment of a faster potential GDP dynamics compared with that reported in the previous round. The estimated values remain, however, well below those registered prior to the economic crisis. The assessment of potential GDP dynamics by using the production function-based methodology indicates the modest positive contributions of capital input, as well as of total factor productivity, while the contribution of labour input is slightly negative. For the forecast horizon, the dynamics of capital and labour inputs are projected to witness a moderate improvement. Given that the streamlining process of the production capacities reduced its scale compared with the period prior to the economic crisis, total factor productivity is foreseen to have a further relatively modest positive contribution.
The negative output gap in 2011 Q4 is assessed as widening marginally from the previous quarter, illustrating, ceteris paribus,the rise in demand-pull disinfl ationary pressures. Nevertheless, it is to be noted that the negative output gap was revised to lower levels compared with the previous forecasting round, mainly as a result of the upward revision of the historical GDP data series performed by the NIS in December 20118.
The slight widening of the real output gap in 2011 Q4 is also indicated by the dynamics of the aggregate indicator of economic activity9. Moreover, the individual development of certain indicators
7 Unless otherwise indicated, percentage changes are calculated based on seasonally-adjusted data series. Sources: NBR, MPF, NIS, Eurostat, EC-DG ECFIN and Bloomberg.
8 Starting with 2010 Q4, quarterly economic growth rates (seasonally-adjusted data) have been revised upwards.
9 The aggregate indicator combines developments in several macroeconomic variables into a single synthetic variable whose dynamics is signifi cantly correlated to that of economic activity. The aggregate indicator is based on the normalised cyclical components of the following 11 variables (whose cyclical components have relatively high correlation coeffi cients with the cyclical component of real GDP): number of employees economy-wide, industrial output, unemployment rate, real consumer credit, capacity utilisation rate, real net wage economy-wide, real M1, EA17 GDP, economic sentiment indicator (ESI), energy consumption economy-wide, and the volume of new orders in manufacturing.

38 NATIONAL BANK OF ROMANIA
IV. In� ation Outlook
80
90
100
110
120
-10
-5
0
5
10
IV I2009
II III IV I2010
II III IV I2011
II III IV
annual real GDP growth ESI (rhs)
Source: NIS, EC-DG ECFIN.
annual percentage change
Economic Sentiment Indicator* and Economic Growth
index (average=100)
correlation coefficient: 2001Q1-2011Q3: 0.90
*) seasonally adjusted data
relevant for the cyclical position substantiates the assessment of the output gap. Thus, compared to the average for 2011 Q3, industrial output remained virtually unchanged (0.1 percent) during October-November, while the capacity utilisation rate in industry declined slightly10. The economic sentiment indicator declined marginally in 2011 Q4 quarter on quarter (to 91.4 from 92.5) and the EC-DG ECFIN survey shows the increasing share of respondents citing “insuffi cient demand” as one of the factors depressing manufacturing.
The negative output gap is anticipated to persist throughout the projection interval but the forecasted values are less pronounced compared with those in the November 2011 Infl ation Report, thus indicating less ample disinfl ationary pressures. The revision of the negative output gap to lower values was determined by the upward revision of the historical GDP data series, as well as by the faster-than-previously anticipated growth in 2011 Q3. The relatively less tight fi scal policy (measured based on the fi scal impulse) in the fi rst part of the forecast horizon and the stronger stimulative impact of real monetary conditions over the entire projection horizon are also foreseen to contribute to the decline in the projected negative output gap. The forecasted dynamics of external demand, approximated by the real output gap of the euro area (Romania’s main trading partner) are anticipated to have an adverse effect, namely to widen the negative output gap.
Aggregate demand components
In 2011 Q4, the positive quarterly dynamics of actual fi nal consumption of households is anticipated to carry on, albeit at a slower pace than in the previous quarter. The slowdown in household consumption growth is driven by the relative stagnation of net real wage (-0.1 percent in October and November compared with the previous quarter’s average) and the slight compression of market services to population (-1.4 percent in October against the Q3 average), while retail trade moved 1.6 percent higher in October and November compared with the previous quarter’s average. The negative quarterly dynamics of government consumption is expected to moderate in 2011 Q4 in line with the authorities’ commitment to fulfi l the fi scal defi cit target for end-2011 agreed with the EU, the IMF and the World Bank, i.e. 4.4 percent of GDP. According to the preliminary data released by the Ministry of Public Finance, the consolidated general budget defi cit at end-2011 accounted for 4.35 percent of annual nominal GDP (cash-based methodology), showing that the assumed commitment was fulfi lled.
10 Seasonally-adjusted data, EC-DG ECFIN Survey.

INFLATION REPORT � February 2012 39
IV. In� ation Outlook
The developments in the actual fi nal consumption of households during the projection interval are anticipated to be the result of the divergent infl uence of several factors. On the one hand, the projected faster growth rate of disposable income11 in the private sector, against the background of the persistence of the annual positive GDP dynamics and, implicitly, by the upturn in labour productivity, as well as the further downward trend of fi nancing costs12 are likely to result in the gradual easing of households’ fi nancial constraints, depending on the lending conditions applied by the credit institutions in Romania. On the other hand, this effect on aggregate consumption of households is expected to be dampened by the projected implementation of the fi scal consolidation measures13 announced by the government. Overall, the dynamics of “individual consumption of households” is foreseen to be positive in 2012 and 2013, as the fi nancial constraints that have affected public sector employees gradually loosen. Concurrently, the trajectory of “collective consumption of general government” will stay in line with the authorities’ commitment to fulfi l the fi scal defi cit targets agreed with the EU, the IMF and the World Bank for end-2012 and end-201314. In this context, the baseline scenario of the projection foresees annual negative growth rates for this component in the course of 2012, followed by the return to positive annual growth rates in 2013.
For 2011 Q4, gross fi xed capital formation is forecasted to witness the same quarterly growth rate as in the previous quarter. Gross fi xed capital formation is supported by the construction sector in terms of both new constructions that increased by 8.1 percent in October and November compared with the average for the previous quarter and the number of building permits that went up 3.3 percent during the same period. Investment in equipment is seen to grow mainly on account of the 1.3 percent rise in the industrial production of capital goods in the fi rst two months of Q4 compared with the previous quarter’s average.
For 2012 and 2013, the dynamics of investment in the economy are expected to accelerate moderately and to have a positive contribution to economic growth during the projection interval. 11 Especially the “wage earnings” component.12 Given that the recently initiated loosening of the lending standards and terms
applicable to households is expected to continue.13 For example, according to Law No. 283/14 December 2011 on approving
Government Emergency Ordinance No. 80/2010 on supplementing Art. 11 of Government Emergency Ordinance No. 37/2008 on the regulation of certain fi nancial measures for the budgetary sector, one of the fi scal consolidation measures taken by the government for 2012 refers to keeping public sector wages “at the level of the wages paid from public funds in December 2011”.
14 According to the Letter of Intent of the Government of Romania released on 2 December 2011 (http://www.imf.org/external/np/loi/2011/rou/120211.pdf) the defi cit target for 2012 is below 3 percent of GDP (ESA methodology), the equivalent of 1.9 percent of GDP (cash-based methodology).

40 NATIONAL BANK OF ROMANIA
IV. In� ation Outlook
In the current year, gross fi xed capital formation is projected to rebound, mainly on account of the production destined to domestic consumption. In addition, the fulfi lment by the government of the commitments assumed towards the EU, the IMF and the World Bank regarding the prioritisation of investment projects15 may also result in improving the capacity to absorb post-accession European funds, with a favourable impact on the pace of increase in gross fi xed capital formation in 2012 and 2013.
Exports are seen to continue their favourable performance in 2011 Q4, posting a quarterly growth rate slightly higher than in the previous quarter. This development is hinted at by both the monthly data on the exports of goods and services in the balance of payments, which increased by 5.2 percent in October and November compared with the average for the previous quarter, and the 3 percent quarterly depreciation of the real effective exchange rate in 2011 Q4. At the same time, the persistence of a positive dynamics of domestic demand is expected to cause the quarterly growth rate of imports to slightly exceed the level recorded in the previous quarter. This development is envisaged by the dynamics of the imports of goods and services in the balance of payments, which rose by 1.7 percent in October and November compared with the average for Q3.
In 2012, amid the anticipated slowdown in external demand, the growth rate of exports is projected to moderate compared with 2011, entailing a lower volume of imports for manufacturing export-bound products. For 2013, given the stronger recovery in domestic demand, the growth rate of imports is anticipated to accelerate, exceeding that of exports.
Nevertheless, the current account defi cit, calculated as a share of GDP, is not expected to widen during this period, as import prices are seen to grow more slowly than export prices, partly as a result of the annual growth rate of real ULC in the private sector re-entering positive territory starting with 2013.
Broad monetary conditions
Broad monetary conditions capture the impact on the future developments of aggregate demand of the dynamics of leu-denominated real interest rates applied by credit institutions to their non-bank clients, the real exchange r ate and the costs expressed in lei of foreign currency-denominated loans.
15 By supporting the profi table projects with real chances of being fi nanced in the next 3 to 5 years.
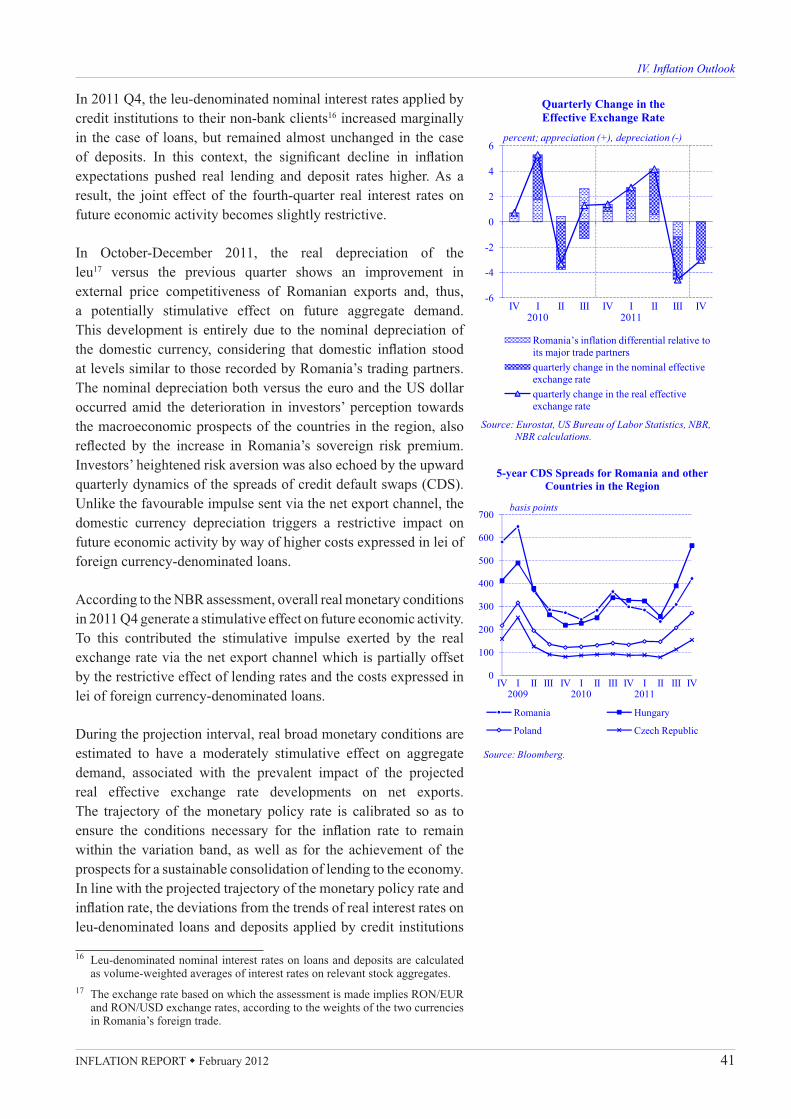
INFLATION REPORT � February 2012 41
IV. In� ation Outlook
0
100
200
300
400
500
600
700
IV I2009
II III IV I2010
II III IV I2011
II III IV
Romania Hungary
Poland Czech Republic
Source: Bloomberg.
basis points
5-year CDS Spreads for Romania and other Countries in the Region
-6
-4
-2
0
2
4
6
IV I2010
II III IV I2011
II III IV
Romania’s inflation differential relative to its major trade partnersquarterly change in the nominal effective exchange ratequarterly change in the real effective exchange rate
percent; appreciation (+), depreciation (-)
Source: Eurostat, US Bureau of Labor Statistics, NBR, NBR calculations.
Quarterly Change in the Effective Exchange Rate
In 2011 Q4, the leu-denominated nominal interest rates applied by credit institutions to their non-bank clients16 increased marginally in the case of loans, but remained almost unchanged in the case of deposits. In this context, the signifi cant decline in infl ation expectations pushed real lending and deposit rates higher. As a result, the joint effect of the fourth-quarter real interest rates on future economic activity becomes slightly restrictive.
In October-December 2011, the real depreciation of the leu17 versus the previous quarter shows an improvement in external price competitiveness of Romanian exports and, t hus, a potentially stimulative effect on future aggregate demand. This development is entirely due to the nominal depreciation of the domestic currency, considering that domestic infl ation stood at levels similar to those recorded by Romania’s trading partners. The nominal depreciation both versus the euro and the US dollar occurred amid the deterioration in investors’ perception towards the macroeconomic prospects of the countries in the region, also refl ected by the increase in Romania’s sovereign risk premium. Investors’ heightened risk aversion was also echoed by the upward quarterly dynamics of the spreads of credit default swaps (CDS). Unlike the favourable impulse sent via the net export channel, the domestic currency depreciation triggers a restrictive impact on future economic activity by way of higher costs expressed in lei of foreign currency-denominated loans.
According to the NBR assessment, overall real monetary conditions in 2011 Q4 generate a stimulative effect on future economic activity. To this contributed the stimulative impulse exerted by the real exchange rate via the net export channel which is partially offset by the restrictive effect of lending rates and the costs expressed in lei of foreign currency-denominated loans.
During the projection interval, real broad monetary conditions are estimated to have a moderately stimulative effect on aggregate demand, associated with the prevalent impact of the projected real effective exchange rate developments on net exports. The trajectory of the monetary policy rate is calibrated so as to ensure the conditions necessary for the infl ation rate to remain within the variation band, as well as for the achievement of the prospects for a sustainable consolidation of lending to the economy. In line with the projected trajectory of the monetary policy rate and infl ation rate, the deviations from the trends of real interest rates on leu-denominated loans and deposits applied by credit institutions
16 Leu-denominated nominal interest rates on loans and deposits are calculated as volume-weighted averages of interest rates on relevant stock aggregates.
17 The exchange rate based on which the assessment is made implies RON/EUR and RON/USD exchange rates, according to the weights of the two currencies in Romania’s foreign trade.
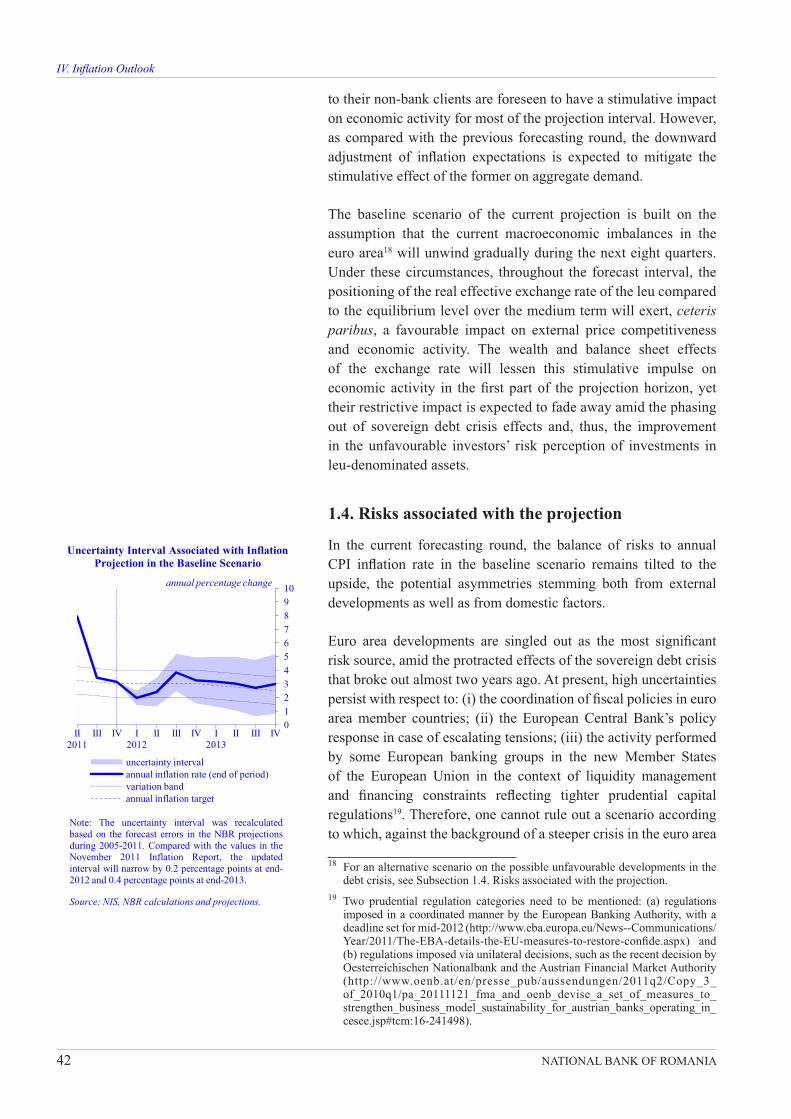
42 NATIONAL BANK OF ROMANIA
IV. In� ation Outlook
012345678910
II2011
III IV I2012
II III IV I2013
II III IV
uncertainty intervalannual inflation rate (end of period)variation bandannual inflation target
Uncertainty Interval Associated with Inflation Projection in the Baseline Scenario
Note: The uncertainty interval was recalculatedbased on the forecast errors in the NBR projectionsduring 2005-2011. Compared with the values in theNovember 2011 Inflation Report, the updatedinterval will narrow by 0.2 percentage points at end-2012 and 0.4 percentage points at end-2013.
annual percentage change
Source: NIS, NBR calculations and projections.
to their non-bank clients are foreseen to have a stimulative impact on economic activity for most of the projection interval. However, as compared with the previous forecasting round, the downward adjustment of infl ation expectations is expected to mitigate the stimulative effect of the former on aggregate demand.
The baseline scenario of the current projection is built on the assumption that the current macroeconomic imbalances in the euro area18 will unwind gradually during the next eight quarters. Under these circumstances, throughout the forecast interval, the positioning of the real effective exchange rate of the leu compared to the equilibrium level over the medium term will exert, ceterisparibus, a favourable impact on external price competitiveness and economic activity. The wealth and balance sheet effects of the exchange rate will lessen this stimulative impulse on economic activity in the fi rst part of the projection horizon, yet their restrictive impact is expected to fade away amid the phasing out of sovereign debt crisis effects and, thus, the improvement in the unfavourable investors’ risk perception of investments in leu-denominated assets.
1.4. Risks associated with the projection
In the current forecasting round, the balance of risks to annual CPI infl ation rate in the baseline scenario remains tilted to the upside, the potential asymmetries stemming both from external developments as well as from domestic factors.
Euro area developments are singled out as the most signifi cant risk source, amid the protracted effects of the sovereign debt crisis that broke out almost two years ago. At present, high uncertainties persist with respect to: (i) the coordination of fi scal policies in euro area member countries; (ii) the European Central Bank’s policy response in case of escalating tensions; (iii) the activity performed by some European banking groups in the new Member States of the European Union in the context of liquidity management and fi nancing constraints refl ecting tighter prudential capital regulations19. Therefore, one cannot rule out a scenario according to which, against the background of a steeper crisis in the euro area
18 For an alternative scenario on the possible unfavourable developments in the debt crisis, see Subsection 1.4. Risks associated with the projection.
19 Two prudential regulation categories need to be mentioned: (a) regulations imposed in a coordinated manner by the European Banking Authority, with a deadline set for mid-2012 (http://www.eba.europa.eu/News--Communications/Year/2011/The-EBA-details-the-EU-measures-to-restore-confi de.aspx) and (b) regulations imposed via unilateral decisions, such as the recent decision by Oesterreichischen Nationalbank and the Austrian Financial Market Authority (http://www.oenb.at/en/presse_pub/aussendungen/2011q2/Copy_3_of_2010q1/pa_20111121_fma_and_oenb_devise_a_set_of_measures_to_strengthen_business_model_sustainability_for_austrian_banks_operating_in_cesee.jsp#tcm:16-241498).

INFLATION REPORT � February 2012 43
IV. In� ation Outlook
and a broad-based risk aversion, negative effects might spill over to non-euro area economies as well20, leading to higher fi nancing costs, a decline in lending, the depreciation of national currencies and a decrease in households’ purchasing power.
Another major risk might materialise in the event of stronger political tensions in the Middle East, which would have an unfavourable impact on the international markets, particularly on the oil price dynamics21. Apart from the emergence of inherent infl ationary pressures diffi cult to counter22, such a shock would lead to a slowdown in the global economic growth rate, given that conventional energy resources represent a production factor diffi cult to substitute in the medium term.
Domestically, the risks associated with the fi scal policy stance seem to be balanced, despite the tight electoral timetable in the coming period. The latest information on the state budget for the previous year points to good outcomes relative to the target, which increases the probability of similar developments in the current year. However, against the background of the euro area crisis, the fi nancing of the budget defi cit might be constrained, which would induce a higher risk aversion and a decrease in capital infl ows, with the above-mentioned consequences.
Recent signs23 hint at the likelihood of a better absorption of post-accession EU funds in the period ahead. Apart from the positive contribution in the medium term to the increase in the economic potential and the moderation of infl ationary pressures24,raising such funds might improve the current account defi cit, alleviating the vulnerabilities of the economy while also averting pressures on the exchange rate.
20 Romanian economy’s vulnerability to such a risk factor originates in the tight commercial and fi nancial ties with the euro area.
21 According to the data available on the OPEC’s website, the countries in the Middle East hold a signifi cant share of the world’s oil reserves (http://www.opec.org/opec_web/en/data_graphs/330.htm).
22 In general, the monetary policy-specifi c instruments are perceived as having little effi ciency in fi ghting strong supply-side shocks.
23 According to the information disclosed by the Ministry of European Affairs, the EU fund absorption rate rose markedly in December 2011 against the previous months (in Romanian only, http://www.dae.gov.ro/338/stadiul-absorbtiei-fondurilor-structurale-de-coeziune).
24 For instance, the projects fi nanced through EU funds aiming at modernising and developing road and rail transport networks enable a decrease in the costs related to commodity transport, entailing therefore a benefi cial impact on the potential output. Another example refers to those environment projects designed to prevent and curb the effects of fl oods or of other risk factors unfavourably impacting agricultural crops and, implicitly, their prices. Further information on EU fi nanced projects is available in Romanian only at http://www.fonduri-ue.ro/programe-operationale-190.

44 NATIONAL BANK OF ROMANIA
IV. In� ation Outlook
In the absence of clear indications from the authorities concerning the liberalisation stages of certain energy market sectors25, inherent uncertainties with respect to the administered price dynamics persist; however, the balance of related risks appears to be relatively in equilibrium over the projection interval. The risks to the volatile food price evolution over the projection interval are also seen to be relatively balanced, given that the recent plentiful precipitations may help sustainably replenish the soil water reservoir depleted in the latter part of 2011.
2. Policy assessment
Disinfl ation continued to consolidate in 2011 Q4, in line with the central bank’s forecasts. The annual infl ation rate posted a slightly larger-than-expected decrease, reaching 3.14 percent in December, i.e. near the mid-point of the target set for end-2011 (3 percent ±1 percentage point). The evolution was mainly due to the further downward trend of the annual dynamics of volatile prices26 and the relatively faster deceleration in adjusted CORE2 infl ation. The latter showed primarily the persistence of the sizeable negative output gap, as well as the improvement in infl ation expectations, also underpinned by maintaining a prudent monetary policy stance.
Building on this premise, as well as on moderate both-way revisions in its main assumptions, the updated projection of medium-termmacroeconomic developments reconfi rms, in general, the favourablecoordinates of the infl ation outlook shown in the baseline scenario of the previous forecasting round. Thus, the projected annual infl ation rate continues to stay within the variation band around the central targets27 throughout the projection horizon. At end-2012 Q1, it is seen decreasing to the lower end of the variation band, following the statistical base effect from the foreseeable steeper annual decline in volatile food prices during the fi rst months of the current year. The subsequent upward adjustment that annual infl ation rate is anticipated to undergo – induced by the same statistical base effect – will be followed by its stabilisation in the upper part of the variation band, but close to the mid-point of the target. This outlook assumes a relatively modest magnitude of future adverse supply-side shocks, including the potential unfavourable base effects associated with the developments in volatile food prices in the previous quarters.
25 The electricity and natural gas markets.26 This CPI component refers to vegetables, fruit, egg prices and fuel prices.27 The infl ation target for end-2012 is of 3 percent ±1 percentage point; starting
with 2013, the infl ation target is fl at at 2.5 percent ±1 percentage point.

INFLATION REPORT � February 2012 45
IV. In� ation Outlook
From the standpoint of monetary policy conduct, it is essential that this infl ation outlook is further strongly underpinned by the improved pattern of the forecasted annual adjusted CORE2 infl ation rate. Its path – heading downwards in the fi rst part of the year and staying at a quasi-stationary level thereafter – is slightly lower than that in the previous projection, illustrating particularly the relative acceleration in the downward adjustment of infl ation expectations, including of medium-term ones, as shown by dedicated surveys.
The disinfl ationary pressures expected from the aggregate demand throughout the projection horizon are, however, less strong than those previously forecasted, given that the estimated values of the negative output gap were subject to a downward adjustment, mainly following the upward revision of economic growth projections for 2011 and 2012. This revision was primarily determined by the upward revision of the historical GDP data, as well as by the relatively faster GDP increase in Q3, which, together with the positive quarterly economic growth expected for Q4, are to generate a signifi cant statistical effect on the annual economic growth rate anticipated for 2012. The quarterly GDP dynamics are anticipated to remain in the positive territory in Q4 – albeit below the previous quarter’s level – as suggested by the evolution in the fi rst two months of several indicators relevant to the behaviour of main aggregate demand components, which seem to show some resilience to the worsening economic activity in the euro area.
Tailoring the monetary policy reaction to the context assumed by the current medium-term infl ation projection in the baseline scenario continues to be complicated by the intricate nature of the balance of infl ationary risks. From this standpoint, the diversity of risks posed by the external environment to the future trajectory of annual infl ation rate – anticipated to have potentially opposite effects – is particularly relevant. These risks stem mainly from the heightened uncertainties surrounding the evolution of the sovereign debt crisis and its impact on euro area economies/banking systems, as well as on global economy, which are likely to signifi cantly affect the domestic economic and fi nancial developments.
Thus, on the one hand, a potential protraction or continued escalation of the crisis could generate additional immediate or episodic infl ationary effects at the domestic level, via steeper leu depreciations, stemming from investors’ higher aversion to the European currency, and, implicitly to the currencies in the region. The adverse effects of the leu exchange rate might be amplifi ed by a potentially long-lasting rationing of local banks’ and companies’ access to external fi nancing, owing to the possible intensifi cation of deleveraging and capitalisation efforts by euro area credit institutions, also in view of the need to observe the new

46 NATIONAL BANK OF ROMANIA
IV. In� ation Outlook
banking regulations. Their efforts might equally affect the liquidity availability and squeeze the fi nancing of banking groups in the European Union.
On the other hand, an aggravation of the sovereign debt crisis could lead to relatively stronger demand-pull disinfl ationary pressures – likely to counter at least partly the infl uence of the leu exchange rate – given that the recovery of the Romanian economy would be markedly contained by the weakening global economy and the possible protraction of recession in the euro area, followed by a potential sluggish recovery. The effects of such developments are expected to impact primarily Romanian exports to the euro area, as well as some domestic demand components, especially private investments – which would be particularly affected by an increasingly eroded confi dence, the rise in external and internal debt servicing in foreign currency incurred by companies and households, as well as by the less readily available/more costly domestic and external fi nancing of economic agents. This last infl uence might be aggravated by a potential expansion of fi nancial deleveraging in the euro area aiming equally at diminishing the exposure of some European credit institutions on the fi nancial markets in the region, including the Romanian market.
The adverse effects of external developments would most likely spill over to the execution of the consolidated general government budget too, including via a limited access to fi nancing sources, as well as a relatively higher cost of fi nancing and refi nancing of the fi scal defi cit and public debt. These might enhance the potential diffi culties to the fi scal policy stance and to meeting the fi scal defi cit target posed in 2012 by the domestic environment, especially ahead of the elections taking place this year and given the potential emergence of social and political pressures. In such circumstances, the further fi rm implementation of the fi scal consolidation and structural reform measures, concurrently with the stepped-up efforts to raise EU funds, in line with the commitments under the arrangements signed with the EU and the IMF, is imperative, being of the essence for preventing an increase in the sovereign risk premium and, implicitly, for consolidating disinfl ation and ensuring a sustainable recovery of the Romanian economy.
Another source of risks to the infl ation outlook stemming from the external environment refers to the evolution of international prices of agri-food and energy commodities, particularly that of the oil price. In the present context, the balance of these risks is deemed to be relatively in equilibrium, at least in the near run, given, on the one hand, the downtrend in the demand for such goods, amid the signifi cant slowdown in the global economic growth. On the other hand, the likelihood of a signifi cant decline (at least short-lived)

INFLATION REPORT � February 2012 47
IV. In� ation Outlook
-4
-2
0
2
4
6
8
10
-4
-2
0
2
4
6
8
10
Jun.
10
Sep.
10
Dec
.10
Mar
.11
Jun.
11
Sep.
11
Dec
.11
Mar
.12
Jun.
12
Sep.
12
Dec
.12
annual inflation rate (rhs)
percent
vegetable-fruit price shock
annual inflation except the two
shocks
food price shock
percentage points
The Impact of the Base Effects on the Annual Inflation Rate in 2012
Food price shock
Vegetable-fruit price shock
The period the shock was manifest Aug.10-Apr.11 May 11-Sep.11The period the impact persisted on the annualinfl ation rate Aug.10-Mar.12 May 11-Aug.12Source: NIS, NBR projections.
in the global oil and agricultural produce supply is considered, in the assumption of persistent geopolitical tensions in certain regions of the world and protracted adverse weather conditions affecting large areas.
If Romania were affl icted by such conditions as well, their infl ationary effects would be magnifi ed by a domestic agricultural output considerably below expectations. At the same time, a favourable scenario cannot be yet ruled out, i.e. in 2012, weather conditions may help the domestic agricultural sector post a performance similar to that in 2011, mainly concerning fruit and vegetables, which could mitigate, relative to the forecasts, the infl ationary impact of volatile food prices induced by the existence of a signifi cant statistical base effect. In 2012, the balance of risks to the infl ation outlook linked to adjustments in administered prices is also seen to be in a relative equilibrium, their diffi cult assessment in the absence of an offi cial calendar of these measures notwithstanding. In the medium run, however, upside infl ation risks associated with this factor are expected to become prevalent again – including the risk of second-round effects – given the prospect of a relative acceleration in the signifi cant adjustment in and of the removal of some administered prices, following the conditionalities under the arrangements concluded with the EU, the IMF and the World Bank, as well as the obligations deriving from the EU legislation.
Given that the perspective of annual infl ation staying inside the variation band around the central targets set for 2012 and 2013 has been reconfi rmed, while the balance of medium-term risks to infl ation has remained relatively asymmetric, the NBR Board has decided in its meeting of 2 February 2012 to lower the monetary policy rate by 0.25 percentage points to 5.50 percentper annum. The NBR Board has also decided to pursue an adequate management of liquidity in the banking system and to maintain the existing levels of minimum reserve requirement ratios on both leu- and foreign currency-denominated liabilities of credit institutions. The gradual and judicious adjustment of real broad monetary conditions will help effectively anchor expectations throughout the projection horizon given the outlook for infl ation, namely a continued slowdown in both headline and core infl ation in the immediately forthcoming period, but also considering the impact of the unfavourable statistical base effects on the evolution of infl ation in the second part of 2012 (without overshooting the ±1 percentage point variation band around the 3 percent infl ation target).