Naohiro Ogawa and Rikiya Matsukura, Nihon University, Japan · the OECD Member States of the time...
22
199 AGEING IN JAPAN: THE HEALTH AND WEALTH OF OLDER PERSONS Naohiro Ogawa and Rikiya Matsukura, Nihon University, Japan World population growth has been slowing down, primarily as a result of the reduction in fertility in the majority of countries, both developed and developing. In 1970-1975 there were just 19 countries with below-replacement fertility, but by 2000-2005 there were 65. Over the same time period, the number of countries having very low fertility─that is, a total fertility lower than 1.3 children per woman─passed from zero to 17. Today about 40 per cent of the world’s population lives in countries with below- replacement fertility and 13 per cent lives in the countries with very low fertility. In parallel to the decline of fertility, mortality has fallen considerably in most countries over the past decades. In some developed countries, life expectancy at birth for females has already exceeded or is now approaching 85 years and it is not showing any signs of slowing down. Because of these rapid transformations, population age distributions are changing markedly as the number of older persons increase and there is a relative decrease in the number of younger persons. Thus, the twenty-first century is projected to be the century of population ageing, and even the size of the population is expected to decrease considerably in a number of countries over the coming decades (Lutz, Sanderson, and Scherbov, 2004; United Nations, 2005). The demographic changes leading to population ageing are documented elsewhere in this volume. The changes expected raise interest in the policy responses they elicit or might elicit (McNicoll, 2002). Undoubtedly, these policy responses will influence economic growth and the prevalence of poverty, intergenerational equity, and social welfare in the future. A key question is whether economic productivity can be sustained with an ageing labour force or with a decreasing population. How are transfers between age groups to be managed in a way that they remain equitable? What are the roles of the public sector, the market, the family, and individual life-cycle saving strategies in providing answers to the problems that ageing poses? Can or will fertility levels rise again to near replacement level? What role can immigration play and will it be acceptable? These policy relevant issues are particularly important for a number of countries in Eastern Asia. At present, Eastern Asia has the lowest fertility in the developing world (1.66 children per woman) and only the regions of Europe have lower average levels (United Nations, 2005; McDonald, 2005). Virtually all countries in Eastern Asian have undergone an extremely fast demographic transition and are now experiencing unprecedented changes in their age structures. In these countries, the child dependency ratio has declined rapidly, generating an important demographic dividend, and the rise in old age dependency has created significant new policy challenges. Among countries in Eastern Asia, Japan has the oldest population. In fact, by some estimates, Japan is expected to become the oldest population in the world sometime during 2005 (Ogawa, forthcoming; Ogawa and Takayama, forthcoming). This paper discusses policy-relevant issues relative to population ageing in Japan, with particular emphasis on the implications of improving health and rising wealth among the older population of the country and the contributions it can make to its economic dynamism. We begin by highlighting some of the key features of Japan’s demographic dynamics since 1945 and those expected until 2025. We then relate these demographic trends, both past and future, to Japan’s long- term economic growth performance, by focusing on the “demographic dividends”. We turn next to a description of key dimensions of Japan’s socio-economic system, which have already been substantially affected by rapid population ageing and are likely to affect the welfare of older persons in the future. We
Transcript of Naohiro Ogawa and Rikiya Matsukura, Nihon University, Japan · the OECD Member States of the time...

199
AGEING IN JAPAN: THE HEALTH AND WEALTH OF OLDER PERSONS
Naohiro Ogawa and Rikiya Matsukura, Nihon University, Japan World population growth has been slowing down, primarily as a result of the reduction in fertility in the majority of countries, both developed and developing. In 1970-1975 there were just 19 countries with below-replacement fertility, but by 2000-2005 there were 65. Over the same time period, the number of countries having very low fertility─that is, a total fertility lower than 1.3 children per woman─passed from zero to 17. Today about 40 per cent of the world’s population lives in countries with below-replacement fertility and 13 per cent lives in the countries with very low fertility. In parallel to the decline of fertility, mortality has fallen considerably in most countries over the past decades. In some developed countries, life expectancy at birth for females has already exceeded or is now approaching 85 years and it is not showing any signs of slowing down. Because of these rapid transformations, population age distributions are changing markedly as the number of older persons increase and there is a relative decrease in the number of younger persons. Thus, the twenty-first century is projected to be the century of population ageing, and even the size of the population is expected to decrease considerably in a number of countries over the coming decades (Lutz, Sanderson, and Scherbov, 2004; United Nations, 2005). The demographic changes leading to population ageing are documented elsewhere in this volume. The changes expected raise interest in the policy responses they elicit or might elicit (McNicoll, 2002). Undoubtedly, these policy responses will influence economic growth and the prevalence of poverty, intergenerational equity, and social welfare in the future. A key question is whether economic productivity can be sustained with an ageing labour force or with a decreasing population. How are transfers between age groups to be managed in a way that they remain equitable? What are the roles of the public sector, the market, the family, and individual life-cycle saving strategies in providing answers to the problems that ageing poses? Can or will fertility levels rise again to near replacement level? What role can immigration play and will it be acceptable? These policy relevant issues are particularly important for a number of countries in Eastern Asia. At present, Eastern Asia has the lowest fertility in the developing world (1.66 children per woman) and only the regions of Europe have lower average levels (United Nations, 2005; McDonald, 2005). Virtually all countries in Eastern Asian have undergone an extremely fast demographic transition and are now experiencing unprecedented changes in their age structures. In these countries, the child dependency ratio has declined rapidly, generating an important demographic dividend, and the rise in old age dependency has created significant new policy challenges. Among countries in Eastern Asia, Japan has the oldest population. In fact, by some estimates, Japan is expected to become the oldest population in the world sometime during 2005 (Ogawa, forthcoming; Ogawa and Takayama, forthcoming). This paper discusses policy-relevant issues relative to population ageing in Japan, with particular emphasis on the implications of improving health and rising wealth among the older population of the country and the contributions it can make to its economic dynamism. We begin by highlighting some of the key features of Japan’s demographic dynamics since 1945 and those expected until 2025. We then relate these demographic trends, both past and future, to Japan’s long-term economic growth performance, by focusing on the “demographic dividends”. We turn next to a description of key dimensions of Japan’s socio-economic system, which have already been substantially affected by rapid population ageing and are likely to affect the welfare of older persons in the future. We

200
conclude by considering the changing health environment and its implications for older persons in Japan, and the growing wealth of older persons as a means of mitigating the formidable challenges that population ageing may pose over the foreseeable future. Although the paper focuses on the Japanese experience, the policy responses discussed could serve as model for other countries undergoing rapid population ageing, particularly in the context of Eastern Asia because, despite its rapid economic development, Japan has retained many of its traditional cultural values, thus providing a good model for policy makers who may wish to combine the best of traditional and modern approaches to ensure adequate support to older persons.
A. THE CHANGING AGE DISTRIBUTION OF JAPAN AND THE DEMOGRAPHIC DIVIDENDS
Demographic trends: past and future Japan was the first non-Western country to experience a decline in fertility after the Second World War and that decline was more rapid than it had been in any of the industrialized countries of the time. Following a short-lived baby boom (1947-1949), Japan’s fertility dropped dramatically (Hodge and Ogawa, 1991; Ogawa and Retherford, 1993). Between 1947 and 1957, total fertility declined by more than half, from 4.54 to 2.04 children per woman. Nowhere before had the fertility of a large population decreased so rapidly. After this drop, fertility levels fluctuated around replacement level until the first oil crisis hit in 1973. Since then, total fertility has been declining, reaching 1.29 children per woman in 2004, an all-time low in post-war Japan. As in other countries of Eastern Asia that have reached very low fertility levels, Japan’s low fertility has been attracting a great deal of attention, both domestically and internationally (Retherford and Ogawa, 2005). By contrast, the unprecedentedly rapid reduction of mortality has attracted less attention. Age-specific mortality rates have declined markedly since the war. During 1947-1965, Japan’s life expectancy at birth rose from 50.1 to 67.7 years for men and from 54.0 to 72.9 years for women. When Japan joined the OECD at the end of 1964, Japan’s life expectancies for both men and women were the lowest among all the OECD Member States of the time (Mason and Ogawa, 2001). By the mid-1970s, however, life expectancy in Japan had become one of the highest among all OECD countries. In 2004, male life expectancy at birth reached 78.6 years to become the second highest in the world, following that of Iceland, and female life expectancy reached 85.6 years, the highest in the world. Moreover, between 1964 and 2004, life expectancy at age 65 increased substantially, from 12.2 to 18.2 years for men and from 14.8 to 23.3 years for women, thus implying a marked lengthening of life after retirement and of the joint survival of husbands and wives. As a result of these demographic transformations, as shown in table 1, the age structure of the Japanese population has been shifting to a pronounced degree. Table 1 also shows the projected values for total population size and indices relative to the age structure, computed from a population projection produced from the most recent version of the population, economic and social security model constructed by Nihon University Population Research Institute (NUPRI).

201
TABLE 1. POPULATION CHANGE IN JAPAN, 1950-2025
Year
Total population (1000 persons)
0-14 (per cent)
15-64 (per cent)
65 or over
(per cent)
Total
dependency ratioa
75 or over/65 or
over (per cent)
Familial support ratiob
1950
83 200
35.4
59.7
4.9
67.5
25.7
1.8
1955 89 276 33.4 61.3 5.3 63.1 29.2 1.8 1960 93 419 33.0 64.2 5.7 60.4 30.4 1.8 1965 98 275 25.6 68.1 6.3 46.8 30.3 1.8 1970 103 720 23.9 69.0 7.1 44.9 30.2 1.7 1975 111 940 24.3 67.8 7.9 47.6 32.0 1.6 1980 117 060 23.5 67.4 9.1 48.4 34.4 1.5 1985 121 049 21.5 68.2 10.3 46.7 37.8 1.4 1990 123 611 18.2 69.7 12.1 43.5 40.1 1.3 1995 125 570 16.0 60.5 14.6 50.4 39.3 1.1 2000 126 926 14.6 68.1 17.4 46.9 40.9 0.9 2005 127 449 13.8 66.2 20.0 50.6 45.1 0.8 2010 127 013 13.0 64.0 23.0 55.6 48.0 0.7 2015 125 603 12.1 61.0 26.9 63.2 48.4 0.6 2020 123 235 11.0 59.5 29.5 67.6 52.1 0.6 2025
120 094 10.2 58.8 31.0 70.0 60.0 0.6
Sources: Statistics Bureau, Population Census, various years; Nihon University, Population Research Institute Population Projection, 2003. a Number of persons aged 0-14 years or 65 years or over per hundred persons aged 15-64 years b Number of women aged 40-59 years divided by the total population aged 65-84 years.
First, the proportion of those 65 or over increased from 4.9 per cent in 1950 to 17.3 per cent in 2000, and it is expected to exceed 20 per cent in 2005, implying that the Japanese population will become the oldest population in the world during 2005, surpassing that of Italy (Ogawa, forthcoming). In addition, the proportion of those 65 or over is projected to be higher than 31 per cent in 2025, suggesting that Japan’s population will continue to be the oldest in the world. More importantly, Japan will reach the world’s highest level of ageing at an unprecedented rate (Ogawa and Retherford, 1997; Ogawa and others, 2003). Thus, Japan’s older population constituted 10 per cent of the population only by 1985, long after other industrialized countries had reached that level. Yet, the proportion of older persons then doubled in just 21 years. Compared with such European countries as Norway or Sweden, Japan’s population is ageing three times as fast. Second, Japan’s population grew from 83 million in 1950 to 127 million in 2000, with its annual growth rate declining substantially over time. Data recently released by the Statistics Bureau of Japan indicate that the male population of the country has been declining since March 2005 and the female population is expected to follow suit so that by the end of 2005 the overall population of Japan will be decreasing, a trend that is expected to continue until at least 2025 when the population is projected to be 120 million. The prospects of imminent population decline have raised grave concern at many levels of Japanese society (Ogawa and Retherford, 1997). Third, the proportion of those aged 75 or over among those aged 65 or over has been increasing almost continuously, passing from 24 per cent in 1950 to 41 per cent in 2000, as displayed in table 1. During 2000-2025, the pace of growth of that proportion is expected to accelerate so that it will reach 60 per cent by 2025. In comparison to the projections for other countries, in 2025 Japan will still be the country having the highest proportion of the population aged 75 or over among those aged 65or over, followed by Sweden with 52 per cent and Italy with 50 per cent (United Nations, 2005). This marked upward shift in the age distribution of Japan is prone to generate a substantial increase in the demand for medical and long-term care services, both formal and informal.

202
Fourth, although the total dependency ratio in Japan (i.e. the population aged 0-14 and that aged 65 or over, divided by the population aged 15-64) declined almost continuously, from 67.5 dependents per 100 persons of working age in 1950 to 43.5 in 1990, it has been increasing since 1990 and is expected to peak at 70.0 in 2025 (table 1). Japan’s total dependency ratio in 2025 will then be the highest in all industrialized countries. Furthermore, over the next two decades, the pace of increase in the total dependency ratio in Japan is the fastest among all industrialized countries, suggesting that Japan is likely to face more imminent adjustment problems in reallocating resources among various age groups. Fifth, the familial support ratio, that is, the ratio of the number of women aged 40-59 to the total population aged 65-84, is expected to decline substantially between 2005 and 2025. Its value, which was 1.30 women per elderly person in 1990, is projected to decrease to 0.65 in 2010, a decline of 50 per cent. That is, the potential support that adult daughters might give to elderly parents drops rapidly, especially after 2009 when the large cohort of “baby boomers” born during 1947-1949 passes out of the 40-59 age group. It is therefore likely that the traditional extended family system that has traditionally provided support to older persons may weaken over time. Although the Government of Japan established in 2000 a Long-term Care Insurance Scheme (LCIS) to alleviate the burden on families taking care of older parents at home, the number of households without caregivers younger than 60 is expected to rise, implying that the effectiveness of the LCIS may decline over time. It is worth noting that according to the United Nations population projections (United Nations, 2005), Japan’s familial support ratio (0.79) became in 2004 the lowest in the entire world, followed by those of Italy (0.80) and Greece (0.81). Projections of these ratios over the next 30 years are highly reliable because the persons involved are already born.
Demographic dividends Demographic trends in Japan and their effects on the age distribution of the population have been closely intertwined with economic growth during the post-war period (Ogawa, Kondo, and Matsukura, forthcoming). As Mason and Lee have argued, when a country’s fertility falls, a first dividend may accrue because the proportion of children in the population declines as the proportion of persons in working ages increases or, to be more precise, because declining fertility produces an increasing proportion of people in ages where production exceeds consumption (Mason, 2001, 2005; Mason and Lee, forthcoming). The first dividend is positive if the rate of output growth per effective consumer exceeds the rate of output growth per effective producer. In fact, the difference between these two rates is equivalent to the support ratio (Mason, 2005). Figure 1 depicts the age-specific profiles of consumption and production in Japan, derived from the National Survey of Family Income and Expenditure (NSFIE) carried out in 1999. By using the estimates displayed in figure 1 as weights for the population by age, we have calculated the annual growth rate of output per effective consumer and the annual growth rate of output per effective producer over the period 1920-2025 (see figure 2). Clearly, the indicators presented in figure 2 are calculated under the assumption that the 1999 age-specific profiles of consumption and production have remained constant over that period. Similar results are obtained if the production and consumption profiles are derived instead from the 1994 round of NSFIE. Figure 2 shows that Japan’s first dividend was positive over a short period in the second half of the 1930s and then for 45 years, from 1949 to 1994. Furthermore, its magnitude was large during the period of rapid economic growth in the 1960s, suggesting that the unprecedented decline in fertility that occurred after 1949 played an important role in boosting the growth of income per capita over that period. It is also thought that in Japan the first dividend was heavily invested and contributed to increase physical capital instead of leading just to higher consumption. A similar process seems to have occurred in the newly

203
industrializing countries of Eastern and South-eastern Asia during their period of economic boom in the1980s and 1990s.
Figure 1. Age specific profiles for labour income and consumption in Japan, 1999
Age0 10 20 30 40 50 60 70 80 90
Yen
(tho
usan
d)
0
50
100
150
200
250
300
350
Labour income Consumption
Source: 1999 National Survey of Family Income and Expenditure (NSFIE).
Figure 2. Trend in first dividend in Japan, 1920-2025
Year
1920
1925
1930
1935
1940
1945
1950
1955
1960
1965
1970
1975
1980
1985
1990
1995
2000
2005
2010
2015
2020
2025
Perc
enta
ge
-0.4
-0.2
0.0
0.2
0.4
0.6
0.8
1.0
1.2
1.4
Source: Authors’ calculations. NOTE: The first dividend is represented by the support ratio, which is defined as the difference between the annual
growth rate of output per effective consumer and the annual growth rate of output per effective producer. Mason (2005) has also argued that the shift to an older age structure caused by fertility and mortality declines can lead to a second demographic dividend which arises in response to the prospect of having

204
more people surviving longer than ever before. Therefore, in countries that rely on capital accumulation to meet the retirement needs of the older population, population ageing provides a powerful incentive to accumulate wealth. It is important to note, however, that in countries that rely on transfers, both public and familial, to meet the retirement needs of older persons, the second demographic dividend may not materialize. While the first dividend arises purely from the favourable age distribution of the population, the second dividend depends on both compositional and behavioural effects (Mason, 2005). Thus, the second dividend is affected not only by the numbers of older persons relative to younger persons, but also by the extent to which consumers and policy makers are forward-looking and respond effectively to the demographic changes that are anticipated for the years ahead. Increasing longevity, in particular, may spur greater savings and thus the accumulation of wealth which, if invested productively, can lead to a permanent increase in income. Estimating the magnitude of the second dividend is considerably more difficult than estimating the first dividend. Figure 3 illustrates changes in the household savings rate during 1955-2003 and thus provides partial evidence of the existence of a second dividend based on the fact that the household savings rate increased substantially until the mid-1970s, a period over which life expectancy was also improving at a remarkable pace.
Figure 3. Change in the household savings rate in Japan, 1955-2003
Year1955 1960 1965 1970 1975 1980 1985 1990 1995 2000 2005
Perc
enta
ge
0
5
10
15
20
25
68SNA 93SNA
Source: Cabinet Office, Government of Japan, Annual Report on National Accounts (based on the 1968 system (68SNA) and the 1993 system (93SNA)), various years. NOTE: Savings rate = Net saving ÷ (Disposable income + Changes in pension reserves in pension funds).
B. ECONOMIC GROWTH PERFORMANCE AND SUPPORT SYSTEMS IN JAPAN
Economic growth in post-war Japan During the Second World War, Japanese productive capacity was utterly shattered. In 1950, Japan’s per capita GNP was only US$153, lower than that of Mexico (US$181) or the Philippines (US$172) at the time. However, by the end of the 1950s, Japan’s per capita income had recovered to pre-war levels and during the 1960s it grew at a phenomenal rate of about 11 per cent per year. As mentioned above, the first dividend contributed markedly to this growth and because a substantial part of the first dividend was

205
saved and invested, it helped to strengthen the country’s infrastructure and to increase the productive capacity of firms. The actual impact of the first dividend on economic growth, although related to changes in the age structure, depends also on economic policy and the socio-economic and political environment. During the 1960s, the Government of Japan promoted an export-oriented development strategy in an era when the international trading environment was favourable. In addition, government functionaries demonstrated outstanding leadership by importing an optimal mix of advanced technology from other industrialized countries. Investments in education and the availability of a well educated and highly trained labour force as early as the 1950s also contributed to this success. Lastly, the political stability that Japan has enjoyed since 1950 also provided a further incentive for investment. As indicated in figure 2, the magnitude of the first demographic dividend declined gradually during the 1970s. In addition, the oil crisis of 1973 triggered a series of changes that led to the restructuring of the Japanese economy. As a consequence, its economic growth became less impressive than it had been during the 1960s. During the 1980s, Japan’s average annual rate of GDP growth was 4.2 per cent, still considerably higher than in many other industrialized countries but considerably lower than at the peak. After the 1985 Plaza Accord, the Japanese economy experienced a bubble and the investment boom that ensued ended abruptly in the second half of the 1990s. As a result, a number of leading banks and other financial institutions declared bankruptcy. It was a tragedy that the Government used inappropriate macroeconomic policies to rectify these unfavourable economic conditions and delayed recovery. Although many of these economic problems were also attributable to the increasing globalization of the world economy, the Government of Japan regarded them mainly as part of the normal business cycles and tried to address them by increasing government spending to boost economic growth but without much success. It took the Government several years to realize that major restructuring policies were needed to make the Japanese economy more competitive in international markets. This delayed response by the Government caused what some economists call “Japan’s lost decade” (Yoshikawa, 2001). It is worth noting that the timing of the burst of the economic bubble coincided with the time when the first dividend turned negative. Although changes in the population age structure cannot be held responsible for the economic bubble and the banking crisis, an interesting question arises: would the duration of Japan’s lost decade have been shorter if the first dividend had been positive for longer? In 1979, Ezra Vogel’s well-known book Japan as Number One: Lessons for America was published, and in the 1980s, Japan’s management style was highly praised by international business communities. Unfortunately, Vogel’s description of Japan in the late 1970s contrasts markedly with the Japan of more recent times, mired in recession and deflation. In the 1990s, the famed Japanese management strategy lost effectiveness and numerous government regulations or restrictions were modified or abolished. Despite these major changes in the Japanese economy, its mandatory retirement policies still remain as exceptional among industrialized countries. In fact, the proportion of firms having mandatory retirement rules has been increasing, not declining. In 2003, the average retirement age for large-scale businesses was 60 years, markedly low in comparison to other industrialized countries and especially given Japan’s high life expectancy (Clark and others, 2004). One of the main obstacles preventing a change in the mandatory age at retirement is a wage system based on seniority under which an increase in the age at retirement produces higher wage bills. The other deterrent is the provision of lump-sum severance benefits which are a function of the duration of employment. In 2003, an employee with more than 35 years of service received severance pay equivalent to 46 months of his or her final monthly salary. A substantial proportion of business firms have their own accumulated funds to cover such payments or have already incorporated such lump-sums into pension benefits provided by employers. Hence, these funds can be regarded as part of the second dividend. Furthermore, this lump-sum severance

206
pay has been drawing attention from financial institutions because the “baby boom” generations are about to begin retiring. Another feature of Japan’s labour market is a high labour force participation rate among older persons. Figure 4 shows that Japan stands out among industrialized countries because of its high labour force participation rates for men and women aged 65 or over. In 2000, 30 per cent of Japanese men in that age group were in the labour force compared to less than 10 per cent in the industrialized countries of Europe or 18 per cent in the United States. Similarly, older Japanese women are also more likely to continue working than older women in Europe or the United States.
Figure 4. Labour force participation rates for men and women aged 65 or over in selected countries, 2000
Germany Italy United States France Japan
Perc
enta
ge
0
5
10
15
20
25
30
35
40
Men Women
Source: ILO, Yearbook of Labour Statistics 2002, 2003.
Changing social security programmes As argued above, the evidence suggests that in Japan the first dividend played an important role in generating the outstanding economic dynamism that characterized the country from the late 1950s to the late 1960s. As a result, Japan managed to establish universal pension and medical care plans in 1961. Since then, Japan’s social security system has grown remarkably. Between 1961 and 2002, social security benefits increased from 5 per cent to 23 per cent of national income (Social Insurance Agency, 2004). Moreover, the proportion of the social security expenditure allotted to the older population increased from 26 per cent in 1975 to 56 per cent in 2001. However, individual contributions to the social security system have increased less rapidly than benefits and general tax revenues have had to be used to cover the growing difference between benefits and contributions. Japan’s social security system encompasses both old-age pension plans and medical plans, as well as the Long-term Care Insurance Scheme (LCIS) and other smaller programmes. The share of social security expenditures accounted for by the first two components has changed substantially over time. Pension benefits and medical benefits represented, respectively, 22 per cent and 57 per cent of total expenditures in 1965, and 53 per cent and 31 per cent of total expenditures in 2002 (Social Insurance Agency, 2004). The major shift toward pension benefits has occurred because of population ageing, the maturation of the pension system, and major changes in medical plans intended to reduce the rapid growth of health costs.

207
Another reason for the shift is that pension benefits are more closely related to population ageing than medical benefits, because every person, regardless of age, is entitled to the latter. Public pension schemes were initially established for specific occupational groups, with some groups covered earlier than others. There are currently six different public pension schemes. Two of these, the Employees’ Pension Scheme (EPS) and the National Pension Scheme (NPS), cover approximately 90 per cent of the work force. The EPS was established in 1941. The NPS was established in 1961 to cover workers not already covered by the other public pension schemes. Thus, 1961 marks the start of pension coverage for all workers in Japan. A major difference between the EPS and the NPS is that paid employees working for a firm with at least five regular workers belong to the EPS, whereas farmers, other self-employed workers, employees of small firms with less than five regular workers, and certain other categories belong to the NPS. The two schemes also differ in levels and methods of contribution. In the EPS in 2005, the equivalent of 13.934 per cent of a worker’s total annual earnings including bonuses is contributed to the Government, with contributions evenly split between the employee and the employer. In the NPS, the Government collects a flat contribution from enrolled members, most of whom are self-employed. In 2005, that contribution was 13,580 yen (about US$125) per month. Because the contributions to the NPS are lower than to the EPS, beneficiaries under NPS receive considerably lower benefits than those under the EPS. In both the NPS and EPS, the level of benefits began to vary automatically with changes in the consumer price index only in 1999. Reforms enacted in 1994 mandated the elimination by 2013 of inter-scheme differences in the minimum age at which beneficiaries are entitled to a pension. That age is gradually increasing in the different pension schemes until it reaches 65 years for all workers in 2013. An unresolved problem once the minimum age for pension entitlements reaches 65 years for all workers is that many firms currently require employees to retire at or before age 60, thus leaving an intervening period where retired persons will not be entitled to any pension either from their employer or from the social security system. When Japanese pension schemes were initially established, they were organized on the principle of reserve financing so that large amounts of reserve funds were accumulated to cover the payment of old-age benefits for future retirees. Figure 5 shows the long-term growth of reserve funds accumulated in all the public pension schemes combined from 1965 to 2002. These accumulated funds would be the basis of the second dividend associated with population ageing. However, although some of these funds have been used to promote economic development in Japan, mainly by financing public works such as highways or bullet trains, they have not always been used productively and the interest rates paid on them, which have been set by the Government, have been unreasonably low. As a result, over time the reserve funds have become insufficient to cover current benefit payouts and have required that the Government shift away from reserve financing toward pay-as-you-go financing via subsidies to the social security system covered by general tax revenues. Unlike reserve financing, pay-as-you-go financing is directly affected by the age composition of the population. As shown in figure 5, the rate of growth of the accumulated reserve funds has been slowing down markedly, especially since the second half of the 1990s, precisely when the increase in the proportion of older persons accelerates. Consequently, Japan’s public pension schemes, which were meant to be fully funded, have increasingly come to depend on transfers. Under these circumstances, projections of the expected costs of the pension schemes suggest that intergenerational equity considerations are likely to become an increasingly divisive social issue over the coming decades (Ogawa and Retherford, 1997). Owing to the gloomy long-term prospects for the pension system in Japan, an increasing proportion of the population enrolled in the NPS has stopped paying contributions to the scheme. In 2004, 36.4 per cent of all participants in that scheme had not paid their contributions.

208
Figure 5. Growth of reserve funds for all public pension schemes combined
in Japan, 1965-2002
Year
1965 1970 1975 1980 1985 1990 1995 2000
Yen
(tril
lion)
0
50
100
150
200
Source: Ministry of Health, Labour and Welfare, Financial Report on the Public Pension System: Fiscal Year 2003, 2004.
In 2004, another major pension reform was made. One of the primary objectives of the 2004 pension reform was to fix the level of future contributions to make the programme more transparent for younger workers and as a means of reducing benefits for future generations of retirees. Thus, the Government introduced a mechanism to balance benefit levels according to future changes in the population age structure. The goal of this strategy was to avoid repeated reforms and to restore the trust of younger generations in social security. These changes indicate a paradigm shift in Japan’s social security provisions because, although its public pension schemes are now sustainable from a financial point of view, they no longer assure adequacy of benefits (Sakamoto, 2005). As a result of the 2004 reform, the replacement rate for Japanese public pensions declined considerably. According to OECD, an average beneficiary of a pension scheme in Japan is expected to receive 59 per cent of the average earnings of a male worker at retirement, lower than the average for all OECD member States, which was estimated at 69 per cent (OECD, 2005a). According to the 2004 reform, the expected pension is projected to fall to 50 per cent of the average earnings of a male worker by 2023 and will then remain largely unchanged until 2050. Medical benefits constitute the second major component of social security benefits. Five major plans exist and all the population is covered by one of them since 1961. The Association-managed Health Insurance Plan (AHIP), the Government-managed Health Insurance Plan (GHIP), and the National Health Insurance Plan (NHIP) are the three major plans and together they cover 87 per cent of the population. Employees of large-scale enterprises are enrolled in the AHIP while employees of small or medium-sized businesses are enrolled in the GHIP. Persons not covered by other plans are enrolled in the NHIP. The age structure of members is older in the NHIP than in the other plans, primarily because a large proportion of NHIP members are self-employed owners of small businesses or farmers. Just at the pension system, the medical insurance plans of Japan have been revised several times. As a result of the rapid economic growth in the 1960s, a free medical care programme for those aged 70 or over was adopted in 1973 but was discontinued in 1983 because of the lacklustre performance of the
209
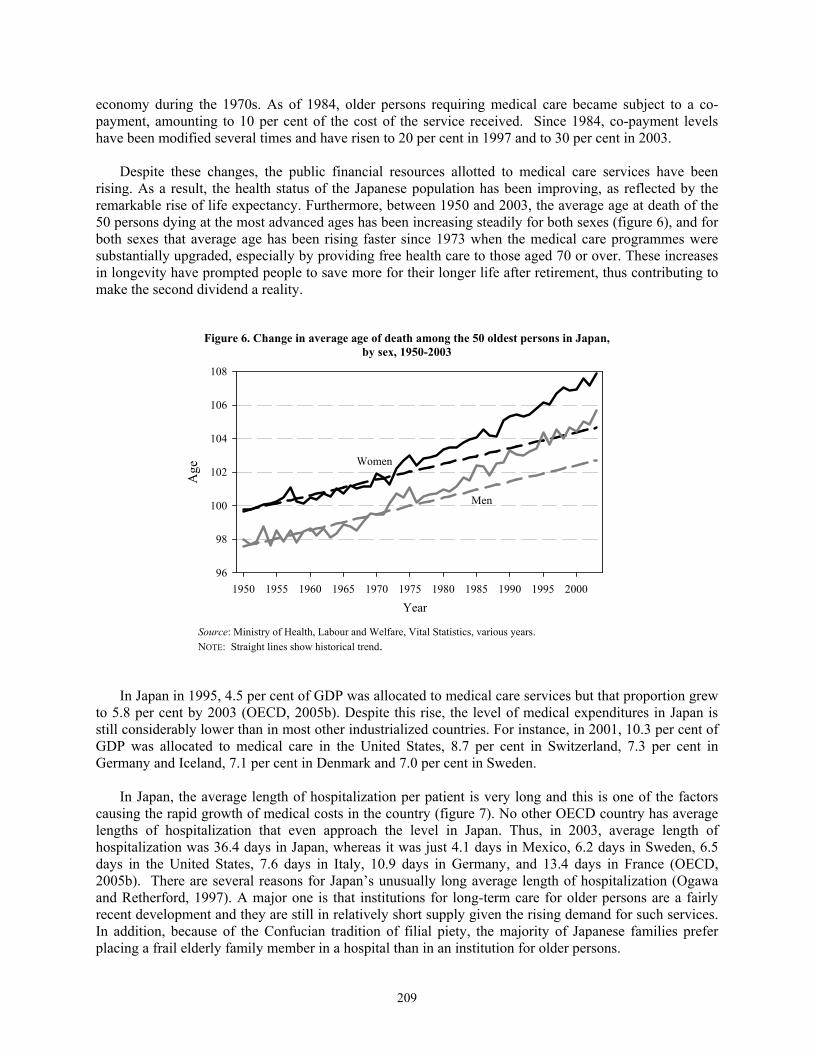
economy during the 1970s. As of 1984, older persons requiring medical care became subject to a co-payment, amounting to 10 per cent of the cost of the service received. Since 1984, co-payment levels have been modified several times and have risen to 20 per cent in 1997 and to 30 per cent in 2003. Despite these changes, the public financial resources allotted to medical care services have been rising. As a result, the health status of the Japanese population has been improving, as reflected by the remarkable rise of life expectancy. Furthermore, between 1950 and 2003, the average age at death of the 50 persons dying at the most advanced ages has been increasing steadily for both sexes (figure 6), and for both sexes that average age has been rising faster since 1973 when the medical care programmes were substantially upgraded, especially by providing free health care to those aged 70 or over. These increases in longevity have prompted people to save more for their longer life after retirement, thus contributing to make the second dividend a reality.
Figure 6. Change in average age of death among the 50 oldest persons in Japan, by sex, 1950-2003
Year1950 1955 1960 1965 1970 1975 1980 1985 1990 1995 2000
Age
96
98
100
102
104
106
108
Men
Women
Source: Ministry of Health, Labour and Welfare, Vital Statistics, various years. NOTE: Straight lines show historical trend.
In Japan in 1995, 4.5 per cent of GDP was allocated to medical care services but that proportion grew to 5.8 per cent by 2003 (OECD, 2005b). Despite this rise, the level of medical expenditures in Japan is still considerably lower than in most other industrialized countries. For instance, in 2001, 10.3 per cent of GDP was allocated to medical care in the United States, 8.7 per cent in Switzerland, 7.3 per cent in Germany and Iceland, 7.1 per cent in Denmark and 7.0 per cent in Sweden. In Japan, the average length of hospitalization per patient is very long and this is one of the factors causing the rapid growth of medical costs in the country (figure 7). No other OECD country has average lengths of hospitalization that even approach the level in Japan. Thus, in 2003, average length of hospitalization was 36.4 days in Japan, whereas it was just 4.1 days in Mexico, 6.2 days in Sweden, 6.5 days in the United States, 7.6 days in Italy, 10.9 days in Germany, and 13.4 days in France (OECD, 2005b). There are several reasons for Japan’s unusually long average length of hospitalization (Ogawa and Retherford, 1997). A major one is that institutions for long-term care for older persons are a fairly recent development and they are still in relatively short supply given the rising demand for such services. In addition, because of the Confucian tradition of filial piety, the majority of Japanese families prefer placing a frail elderly family member in a hospital than in an institution for older persons.

210
Figure 7. Trend in average days of hospitalization in OECD countries, 1960-2003
Year
1960 1965 1970 1975 1980 1985 1990 1995 2000
Day
s
0
10
20
30
40
50
60
70
Japan
Mexico
Europe
Canada andUnited States
Australia and New Zealand
Source: Ministry of Health, Labour and Welfare, Vital Statistics, various years.
In order to curb the rise in medical care costs by reducing the average length of hospitalization, the Government of Japan established in 2000 the Long-term Care Insurance Scheme (LCIS), hoping to reduce long stays in hospital by facilitating at-home care of older persons. The LCIS is expected to alleviate the care-giving burden placed on families, especially in regard to the responsibilities of middle-aged daughters or daughters-in-law (Ogawa and Retherford, 1997). Overall expenditures for both medical plans and the LCIS are projected to grow very rapidly (Ogawa and others, 2003). Consequently, further reductions will eventually need to be made to the benefits paid by the social security system and such “downward adjustments” of benefits will imply an increase in the responsibility placed on families to take care of elderly relatives. These changes pose major challenges to both the smaller families of the future and society at large.
Deteriorating familial support Multi-generational households are still fairly common in Japan (Ogawa and Ermisch, 1996; Ogawa, Retherford, and Matsukura, forthcoming). According to the 2001 round of the International Survey of Lifestyles and Attitudes of the Elderly (Cabinet Office, 2002), 22 per cent of persons aged 60 or over were living in three-generation households in Japan. By contrast, only 2 per cent of the older population in the United States did so, 1 per cent in Germany, and less than 0.5 per cent in Sweden. However, given the rapid demographic shifts that have already taken place in Japan and the rapidly changing lifestyles of both younger and older generations, the percentage of older persons living in multi-generational households has been declining, passing from 37 per cent in 1981 to 32 per cent in 1991 and probably to under 22 per cent today (figure 8). Although the Government of Japan views the persistence of multi-generational households as an asset that can be tapped to offset the adverse effects of population ageing on the sustainability of the social security system, the validity of this view has increasingly been called into question in view of the trends observed. Because co-residence of older persons with younger relatives facilitates the exchange of resources between generations, the declining trend in the prevalence of multi-generational households has affected various aspects of the post-retirement lifestyle of older persons in Japan. One salient consequence is the

211
changing trend in the place of death of older persons. Whereas in 1965, 86.5 per cent of the deaths of all persons aged 65 or over occurred at home, by 2003 just 13.5 per cent did so (figure 9).
Figure 8. Change in the proportion of those aged 60 or over living in three-generation households in selected countries, 1981-2001
Year1981 1986 1991 1996 2001
Perc
enta
ge
0
5
10
15
20
25
30
35
40
United States of America
France Germany
Italy
Japan
Rep. of Korea
Sweden
Source: Cabinet Office government of Japan, Fifth round of the International Survey of Lifestyles and Attitudes of the Elderly, 2002.
Figure 9. Change in the place of death among the elderly in Japan, 1965-2003
Year
1965 1970 1975 1980 1985 1990 1995 2000
Perc
enta
ge
0
10
20
30
40
50
60
70
80
90
100
Hospitalized Non-hospitalized
Source: Ministry of Health, Labour and Welfare, Vital Statistics, various years.
Another important change is the declining trend in the familial support ratio (the ratio of women aged 40-59 to the population aged 65-80), which was 1.3 women per older person in 1990 but is expected to be just about half, 0.65 women per older person, in 2010. These changes suggest that the demographic potential of familial support for older persons by adult children is diminishing rapidly, with the decline

212
being particularly rapid after 2009 when the last members of the large cohort born during 1947-1949 will reach age 60. In addition to these demographic shifts, there have been major and dramatic changes in the lifestyles and values of Japanese society. Data gathered in a series of National Surveys on Family Planning, undertaken every other year since 1950 by Mainichi Newspapers (Population Problems Research Council, 2000), provide evidence in this regard. Since the first round of the survey and with the exception of just a few rounds, a question regarding expected dependence on children for old-age security has been posed to currently married women of reproductive age who have at least one child. The pre-coded responses are: (a) “expect to depend on children”; (b) “do not expect to depend on children”; and (c) “never thought about it.” The percentage of respondents who responded that they “expect to depend on children” declined almost continuously from 1950 to 2004 (figure 10). Whereas in 1950 almost two thirds of married women in Japan said they expected to depend on their own children for old-age security, by 2004 just 11 per cent did so. These changed expectations are undoubtedly closely connected with the rapid improvement of old-age pension schemes that took place mainly during 1961-1990.
Figure 10. Trends in norms and expectations about elderly care in Japan, 1950 -2004
Sources: Mainichi Newspapers of Japan, Summary of Twenty-fifth National Survey on Family Planning, 2000; Mainichi Newspapers of Japan, Summary of the 2004 round of the National Survey on Population, Families and Generations, 2004.
Since 1963 the Mainichi Newspapers surveys have also included a question on what the married women interviewed thought of the expectation that children would take care of their aged parents. The pre-coded responses were: (a) “good custom”; (b) “natural duty as children”; (c) “unavoidable due to inadequacy of public support resources”; and (d) “not a good custom”. Figure 10 presents a plot of the percentage of married women who chose one of the first two responses, (a) or (b). Between 1963 and 1986, the percentage of respondents who felt that providing care for older parents was either a good
0
10
20
30
40
50
60
70
80
90
1950 1956 1962 1968 1974 1980 1986 1992 1998 2004
Year
Perc
enta
ge
“Good Custom” or “Natural Duty”
Expect to Depend on Children

213
custom or a natural duty remained fairly stable but from 1986 to 1988 a dramatic drop occurred and since then that percentage has been decreasing. In addition, results from a recent international comparative survey covering high school students in China, Japan and the United States further reinforce the above findings (figure 11). The surveys show that in Japan just 43 per cent of high school students aged 15 said they would take care of their parents, should their parents fall ill, compared to 84 per cent in China and 68 per cent in the United States (Japan Youth Research Institute, 2005). These responses suggest that the decreasing trend in familial support implied by the responses of women of reproductive age may continue unabated for the next decade or so.
Figure 11. Proportion of high school students willing to take care of parents under any circumstances, when their parents get older and need some help in their daily lives
due to poor health in Japan, United States and China, 2005
Japan United States China
Perc
enta
ge
0
20
40
60
80
43
68
84
Source: Japan Youth Research Institute (2005).
C. THE INCREASING HEALTH AND WEALTH OF OLDER PERSONS IN JAPAN What can Japan do to cope with the difficulties arising because of its rapidly ageing population? In recent years, demographers and scholars in other disciplines have discussed a variety of policy options (MacKellar, 2003; Onofri, 2004). Among them, Sinding (2002) has described the following four alternative outcomes in relation to policy responses: (a) a slow fadeout of the population in a scenario where there is no policy intervention and the population continues to age and decrease; (b) a healthy ageing scenario in which public policy recognizes the necessity of increasing the labour force participation and effectiveness of older persons; (c) a replacement migration scenario where migration is used to slow down population ageing, and (d) successful pronatalism, a scenario where policy intervention manages to increase total fertility to retard ageing. Bongaarts (2004) has recently analyzed the impact of population ageing on public pension plans and has discussed the following policy options: (a) counteracting population ageing by encouraging higher fertility and admitting more migrants; (b) increasing labour force participation; (c) raising the retirement age, and (d) reducing public pension benefits. We examine below the following two policy options for Japan: (a) increasing both the labour force participation among older workers and the age at retirement, and (b) making more effective use of the

214
financial and non-financial wealth of older persons. A discussion of other policy options can be found in Ogawa (forthcoming).
Health and work among older persons The first two rounds of the Nihon University Japan Longitudinal Study of Aging (NUJLSOA) provide data that allow the estimation of the health status of persons aged 65 or over. The NUJLSOA is designed to be comparable in many respects with the United States Longitudinal Study of Aging. The first round of the NUJLSOA was conducted in November 1999. It covered an initial sample of 6,700 persons aged 65 or over. Proxy respondents were allowed to answer questions in cases where the selected respondent was not competent to answer or was not available at the time of interview. The total number of completed interviews was 4,997. Persons aged 75 or over were over-sampled by a factor of two. When analyzing the data, therefore, weights need to be used to calculate measures relative to the total population aged 65 or over in Japan. Despite strenuous efforts to include persons in institutions in the NUJLSOA, they remain underrepresented in the survey. The second wave of the survey was conducted in November 2001. It covered a sample of 4,621 persons including 631 new respondents. To study health status, a person is considered healthy and active it he or she did not have any difficulties in performing all seven activities of daily living (ADLs) and all seven instrumental activities of daily living (IADLs) at the time of the survey. A person was considered to have poor health or be inactive if he or she was unable to perform at least one ADL or IADL. The seven ADLs are bathing, dressing, eating, transferring from or to a bed or a chair, walking inside the house, going outside, and toileting. The seven IADLs consist of preparing one’s own meals, shopping for personal items, managing money, making a phone call, doing light house work, going out alone by using public transportation, and taking medication. By using the multi-state estimation method “IMaCh” (Le Lièvre and Brouard, 2003) in conjunction with data from the two rounds of the NUJLSOA, Le Lièvre and Saito (2005) have estimated annual transition probabilities among the following three states: (a) healthy and active, (b) in poor health or inactive, and (c) dead. In figure 12, the transition from the healthy and active state to the one of poor health or inactivity is labelled “incidence of disability”; that from the healthy and active state to death is labelled “mortality from active state”; the transition from poor health or inactivity to a healthy and active state is labelled “recovery of health”, and that from poor health or inactivity to death is labelled “mortality from inactive state”. Transition probabilities are estimated by age and sex. Incorporating these transition probabilities in the most recent version of the NUPRI model, we have projected the number of healthy and active older persons and the number of those who are expected to be in poor health or inactive from 2000 to 2025 (figure 13). In doing so, the transition probabilities were assumed to remain constant over the projection period. An attempt to include education as a covariate showed that education is not statistically significant and was therefore not included in the final model. According to the projection, the proportion of older persons who are in poor health or inactive would increase, passing from 13.8 per cent in 2000 to 18.7 per cent in 2025. However, the number of healthy and active older persons would also rise substantially, going from 18.9 million in 2000 to 30.3 million in 2025. These projections suggest that Japan’s productive capacity could expand considerably if older persons who remain healthy and active keep on being economically active and gainfully employed. In order to assess such potential, a base run plus two simulated scenarios have been calculated for the period 2005-2025. In Simulation 1, it is assumed that all healthy older persons remain in the labour force over the projection period. In Simulation 2, the labour force participation rates for both men and women aged 60-64 over the projection period are set equal to those of persons aged 55-59. That is, Simulation 2 assumes

215
that the mandatory retirement age is raised from 60 to 65 years, that companies comply with that change and that the labour force participation rates for both men and women aged 65 or over are higher by 10 percentage points than those currently observed. The most recent version of the NUPRI model is used to calculate the relevant projections.
Figure 12. Estimated annual health-status transition probabilities in Japan among persons aged 65 or over
Source: Le Lièvre and Saito (2005).
Figure 13. Projected population aged 65 or older by heath status, Japan 2000-2025
Year2000 2005 2010 2015 2020 2025
Mill
ions
0
5
10
15
20
25
30
35
40
Healthy Unhealthy
Source: Authors’ calculations based on health-status transition rates in figure 12.
0.001
0.01
0.1
1
65 70 75 80 85 90 95Age
Men
0.001
0.01
0.1
1
65 70 75 80 85 90 95Age
Women
Incidence of disability
Mortality from inactive stateRecovery of health
Mortality from active state
Prop
ortio
n

216
According to Simulation 1, real GDP (in 1990 constant prices) by 2025 would be 27.8 per cent higher than in the base run if all healthy older persons continued to work. In addition, GDP per capita would be 26.7 per cent higher than in the base run (table 2). In Simulation 2, the assumed change in the labour force participation rates of older persons would produce, in 2025, a 12 per cent higher real GDP than in the base run and a similar gain in real GDP per capita. If the health status of Japanese older persons continues to improve and life expectancy at age 60 continues to increase, it is highly likely that more Japanese over age 60 will want to remain in the labour force. These two simulations suggest that if industrial relations and retirement policies change so as to allow older persons to remain economically active, the contribution that they can make to the economy can be substantial. Note that the larger work force generated by higher labour force participation among older healthy persons would produce a considerable increase in the first demographic dividend, though it may also reduce the second dividend because people would expect a shorter period of life in retirement and might therefore save less.
TABLE 2. SIMULATION EXERCISES FOR ALTERNATIVE LABOUR PARTICIPATION RATES AMONG OLDER PERSONS IN JAPAN, 2005-2025
NUPRI model projection Base run Simulation 1a Simulation 2b Potential GDP (trillion yen) 2005 561.2 653.8 (16.5%) 576.4 ( 2.7%) 2015 600.6 747.2 (24.4%) 661.8 (10.2%) 2025 619.1 791.3 (27.8%) 692.3 (11.8%) Potential GDP per capita (million yen) 2005 4.4 5.1 (16.5%) 4.5 ( 2.9%) 2015 4.8 5.9 (23.9%) 5.3 (10.8%) 2025 5.1 6.5 (26.7%) 5.7 (12.3%) Labour force (1 000 persons) 2005 66 958 86 803 (29.6%) 70 386 ( 5.1%) 2015 62 827 89 107 (41.8%) 73 938 (17.7%) 2025 59 172 87 880 (48.5%) 70 921 (19.9%)
NOTE: Numbers in parenthesis refer to the percentage increase relative to the base run. a Simulation 1: Assumes that all healthy persons aged 65 or over will participate in the labour force throughout the projection period. b Simulation 2: Assumes: (i) that the labour force participation rates of those aged 60-64 are raised to those of aged 55-59, and
(ii) that the participation rates of those aged 65 or over are raised by 10 percentage points above the current rates.
Accumulation of wealth among older persons In recent years, many financial institutions in Japan have been paying increasing attention to the generation of baby boomers and their accumulated wealth. In Japan, persons born from 1947 to 1949 are approaching the mandatory age of retirement. It is estimated that these baby boomers hold today total financial assets worth 130 trillion yen (US$1.3 trillion) or nearly 10 per cent of the nation’s overall assets (The Nikkei Weekly, 2005). As discussed earlier, both a first and a second demographic dividend have been generated over the course of Japan’s demographic transition since 1945. The second dividend is tied to the amount of wealth accumulated by older persons. Estimates of the value of real and financial assets held by older persons in Japan can be obtained from the 1999 round of the National Survey of Family Income and Expenditure (NSFIE) and are shown in figure 14. For comparison, that figure also shows the present value of the expected future stream of public pension benefits. To be consistent with the estimates of the value of real and financial assets, the present value of expected public pension benefits refers to 1999. In calculating

217
that present value, account has been taken of the changes in contributions and benefits established by the provisions adopted in 1999 and 2004 on pension reform. The discount rate used is 1.25 per cent, representing the average interest rate for long-term government bonds over the period 1999-2004. The estimates obtained show that older persons in Japan are wealthy. At age 60, the total amount of assets an average person owns is higher than 50 million yen or $US 0.5 million. In fact, the wealth of older persons is higher than these estimates suggest because private pensions have not been included in the calculation, nor has it included the various types of transfers from children to parents.
Figure 14. Age profile of assets and pension wealth in Japan, 1999
Age20 25 30 35 40 45 50 55 60 65 70 75 80 85 90 95
Yen
(mill
ions
)
0
10
20
30
40
50
60
Present value of future pension benefits Real assets Financial assets
Source: Authors’ calculations. Note that the expected amount of public pension benefits is greater than accumulated real assets at the early stages of retirement life, but the latter exceeds the former by a large margin at later stages of life. Consequently, it would appear that the liquidation of real assets, including land and housing, may be crucial for the support of consumption in very old age, particularly for persons who live alone and cannot count on familial support. To facilitate the use of those real assets, appropriate financial instruments may have to be developed, such as reverse mortgage plans. One such programme is the Musashino City Scheme which provides reverse mortgages on the real estate property of older persons (Martin, 1989). However, such financial arrangements are still rare in Japan. Future generations of older persons in Japan may not have similar accumulation of real estate assets because, as a result of Japan’s lost decade and the drop of real estate prices, Japanese people no longer have a strong preference for land as an investment. According to the National Opinion Survey on Land Issues conducted by the Ministry of National Land and Transportation in 2004, the proportion of persons aged 20 or over who think that land is a better investment than financial assets, such as savings and securities, declined from 62 per cent in 1993 to 33 per cent in 2004. This trend suggests that Japanese of all ages, but particularly older Japanese, may need more information and education regarding investment

218
opportunities and the management of financial assets. Currently, knowledge in those areas is poor. According to a recent OECD report (OECD, 2005c), 71 per cent of the population aged 20 or over in Japan had no knowledge of how to invest in equities or bonds, 57 per cent had no knowledge of financial products in general, and 29 per cent had no knowledge about insurance, pensions or taxes. Provided that older persons in Japan gain more knowledge about the dynamics of financial markets, they may decide to invest their accumulated assets productively, possibly outside Japan. Given that the timing of the first demographic dividend in nearby Asian countries has varied considerably (Cheung and others, 2004), their economies are likely to continue benefiting from favourable demographic conditions at a time when older persons in Japan are ready to invest their accumulated assets. For instance, China is expected to benefit from the first dividend between 1990 and 2030, whereas the first dividend for Japan is already exhausted. The healthier and wealthier older Japanese may thus be able to invest their assets in other dynamically growing economies in the region, including China, so as to benefit also from the effects of the first demographic dividend on other populations. Clearly, to make such an investment strategy possible, international transactions must be allowed and proper institutional and legal arrangements need to be developed to offer protection against asset mismanagement. To conclude, a word of caution is in order. Recent evidence shows that income disparities have been expanding rapidly in Japan, not only among the population in general but also among older persons (Time, 2005). This worrying trend must be studied in more detail so that measures to stop or reverse it may be taken soon. Otherwise, inequality may exacerbate the problems associated with the rapid increase in the number of older persons.
D. CONCLUSION This paper has reviewed the evidence supporting the existence of a first and a second demographic dividend in Japan and concluded that the first demographic dividend did contribute to improve the economic performance of the country, particularly during the late 1950s and the 1960s. There is also considerable evidence suggesting that the conditions for making the second dividend a reality exist. Today older persons in Japan are and will likely remain healthier and wealthier than ever before. Being healthier, they may continue to be productive as part of the labour force, thus being an important asset in any strategy to save Japan from a future economic stagnation or financial crisis. Being wealthier, they may be able to invest their accumulated assets more productively than heretofore and either help spur further economic growth in Japan itself or, if willing and capable of investing abroad, perhaps help finance the development of other Asian countries which may themselves be benefiting from demographic dividends of their own. In this way, older persons in Japan may themselves become key actors in ensuring healthy ageing and the continued dynamism of their country’s economy. However, such positive outcomes are highly dependent on the adoption of government policies that promote the continued labour force participation of older persons and that facilitate the productive investment of their accumulated wealth. Provided such policies are implemented, older persons in Japan will cease being considered liabilities and become themselves important assets for society.

219
REFERENCES Bongaarts, J. (2004). Population aging and the rising cost of public pensions. Population and Development Review,
vol. 30, No. 1, pp. 1-23. Cabinet Office (2002). The Fifth Round of the International Survey of Lifestyles and Attitudes of the Elderly, Tokyo:
Gyousei. Cheung, S. L. K., and others (2004). Change in demographic window in low fertility countries. Paper presented at
the International Seminar on the Demographic Window and Healthy Aging: Socioeconomic Challenges and Opportunities, held in Beijing, China, from 10 to 11 May.
Clark, R., and others (2004). Older workers and national productivity in Japan. Paper presented at the Symposium
on Population Ageing and Economic Productivity, held in Vienna, Austria from 2 to 4 December. Hodge, R., and N. Ogawa (1991). Fertility Change in Contemporary Japan. Chicago: University of Chicago Press. Japan Youth Research Institute (2005). High School Students' Lifestyle Survey. Tokyo, Japan. Le Lièvre, A., and N. Brouard. (2003). The estimation of health expectancies from cross-longitudinal surveys.
Mathematical Population Studies, vol. 10, No. 4, pp. 211-248. Le Lièvre, A., and Y. Saito (2005). Projection of disability among elderly Japanese using transition probabilities.
Paper presented at the NUPRI Occasional Seminar, held in Tokyo, Japan, 12 April 2005. Lutz, W., W. Sanderson, and S. Scherbov (2004). The End of World Population Growth in the21st Century: New
Challenges for Human Capital Formation and Sustainable Development. London and Sterling, Virginia: Earthscan.
Martin, L. (1989). The graying of Japan. Population Bulletin, vol. 44, pp. 1-42. Mason, A., ed. (2001). Population Change and Economic Development in East Asia: Challenges Met, and
Opportunities Seized. Stanford: Stanford University Press. Mason, A. (2005). Demographic transition and demographic dividends in developed and developing countries.
Paper presented at the United Nations Expert Group Meeting on Social and Economic Implications of Changing Population Age Structure, held in Mexico City, Mexico from 31 August to 2 September.
________, and N. Ogawa (2001). Population, labour force, saving and Japan’s future. In M. Bloomstrom, B.
Gangnes, and S. Lacroix (eds.), Japan’s New Economy: Continuity and Change in the Twenty First Century. Oxford: Oxford University Press.
________, and R. Lee (forthcoming). Reform and support systems for the elderly in developing countries: capturing
the second demographic dividend. Genus. McDonald, P. (2005). Low fertility in Singapore: causes, consequences and policies. Paper presented at the Forum
on Population and Development in East Asia, held in Beijing, China, from 16 to 17 May. McNicoll, G. (2002). The world after the demographic transition. East Asian Economic Perspectives, vol. 13,
Special Issue 2, pp. 98-105. MacKellar, L. (2003). The predicament of population aging: a review essay. Vienna Yearbook of Population
Research 2003, pp. 73-99. The Nikkei Weekly (2005). Boomers nearing retirement offer huge market potential. July 18.

220
OECD (2005a). Pension at Glance. Paris: OECD. _____ (2005b). OECD Health Data 2005. Paris: OECD. _____ (2005c). Recommendation on Principles and Good Practices for Financial Education and Awareness. Paris:
OECD. Ogawa, N. (forthcoming). Population aging and policy options for a sustainable future: the case of Japan. Genus. ________, and J. F. Ermisch (1996). Family structure, home time demands, and the employment patterns of
Japanese married women. Journal of Labour Economics, vol. 14, No. 4, pp. 677–702. ________, and N. Takayama. (forthcoming). Demography and aging. In G. Clark, A. Munnell, and M. Orszag
(eds.), The Oxford Handbook of Pensions and Retirement Income. Oxford: Oxford University Press. ________, and R. D. Retherford (1993). The resumption of fertility decline in Japan: 1973-92. Population and
Development Review, vol. 19, No. 4, pp. 703-741. _____ (1997). Shifting costs of caring for the elderly back to families in Japan: will it work? Population and
Development Review, vol. 23, No.1, pp. 59–94. Ogawa, N., M. Kondo, and R. Matsukura. (forthcoming). Japan’s transition from the demographic bonus to the
demographic onus. Asian Population Studies. _______, R. Retherford, and R. Matsukura. (forthcoming). Demographics of the Japanese family: entering uncharted
territory. In M. Rebick and A. Takenaka (eds.), Altered Boundaries: The Changing Definition of the Japanese Family in the 1990s. London: Routledge.
_______, and others (2003). Long-term Perspectives for Japan: An Analysis Based on A Macroeconomic-
Demographic-Social Security Model with Emphasis on Human Capital. Tokyo: Nihon University Population Research Institute.
Onofri, P., ed. (2004). The Economics of an Ageing Population: Macroeconomic Issues. Cheltenham: Edward Elgar. Population Problems Research Council (2000). Summary of Twenty-fifth National Survey on Family Planning.
Tokyo: Mainichi Newspapers. Retherford, D. R., and N. Ogawa (2005). Japan’s baby bust: causes, implications, and policy responses. Paper
presented at the Seminar on the Baby Bust held in Washington, D. C., 11 March. Sakamoto, J. (2005). Population challenges and social security–the case of Japan. Paper presented at the Forum on
Population and Development in East Asia held in Beijing, China, from 16 to 17 May. Sinding, W. S. (2002). Policies at the end of the demographic transition: a speculation. East Asian Economic
Perspectives, vol. 13, Special Issue 2, pp. 85-97. Social Insurance Agency (2004). Outline of Social Insurance in Japan 2003. Tokyo: Japan International Social
Security Association. Time (2005). A deepening divide. July 11 (Asian version). United Nations (2005). World Population Prospects: The 2004 Revision. New York: United Nations. Yoshikawa, H. (2001). Japan’s Lost Decade. Tokyo: International House of Japan.

![[Go] Ogawa Tomoko & James Davies - The Endgame Part 1](https://static.fdocuments.in/doc/165x107/552ae1014a795974118b4599/go-ogawa-tomoko-james-davies-the-endgame-part-1.jpg)