How does the Regional Monetary Unit work as a surveillance ... · ∗Bilateral vs. Multilateral...
52
How does the Regional Monetary Unit work as a surveillance tool? Kentaro Kawasaki Toyo University, Tokyo Japan
-
Upload
nguyenliem -
Category
Documents
-
view
212 -
download
0
Transcript of How does the Regional Monetary Unit work as a surveillance ... · ∗Bilateral vs. Multilateral...
How does the Regional Monetary Unit work as a
surveillance tool?
Kentaro Kawasaki Toyo University, Tokyo Japan

1. Background
2. The role of Regional Monetary Unit: RMU
3. Advantages of Employing RMU Deviation Indicators
in Macroeconomic Surveillance
4. Conclusions
Contents
10/28/2012 RIETI-CASS-CESSA joint workshop Beijing 2

∗ Needs for Exchange rates stability in East Asia ∗ Further economic growth in the region ∗ A threat of ‘beggar-thy-neighbor’ policy: competitive
devaluation ∗ Einchengreen and Sachs (1985): individual devaluation vs.
coordinated international devaluation ∗ A country who adopt rigid exchange rate regime may
impose trade restrictions.
Backgrounds
10/28/2012 RIETI-CASS-CESSA joint workshop Beijing 3

∗ The multilateral currency swap facility – the USD 120 million Chiang Mai Initiative Multilateralisation (CMIM) – came into effect in 2010.
∗ The ASEAN+3 Macroeconomic Research Office (AMRO) ∗ was established in Singapore, ∗ plays an important role in securing the region’s stability,
and ∗ conducts comprehensive surveillance of regional
economies.
ASEAN+3 Finance Ministers agree to move Cooperation at Higher Level in response to
the global financial crisis
10/28/2012 RIETI-CASS-CESSA joint workshop Beijing 4

∗ Needs for Exchange rates monitoring among CMIM members’ currency as a conditionality of liquidity support by CMIM, ∗ To capture possibilities of future crisis and its potential risk ∗ To analyze the determinants of regional economic trend and
policy action ∗ Exchange rates monitoring contributes to
∗ Assuring the soundness of financial system, banking sector, or capital flows, and
∗ Creating Asian regionalisms
Backgrounds (cont.1)
10/28/2012 RIETI-CASS-CESSA joint workshop Beijing 5

∗ AMRO is now playing an important role of ∗ in securing the region’s stability through the conduct of
comprehensive surveillance of regional economies to support decision-making process for CMIM.
∗ How could the AMRO monitor the members’ exchange rate monitoring?
∗ Nominal exchange rates: USD, EUR, or JPY ∗ Effective exchange rates: NEER, REER, or ULC-REER, or ∗ Basket currencies: ACU, AMU
Backgrounds (cont.2)
10/28/2012 RIETI-CASS-CESSA joint workshop Beijing 6

∗ Bilateral vs. Multilateral Real EXR ∗ Whether dose there exist significant differences in the
movement of the real Regional Monetary Unit Deviation Indicator (RMU DI) and the bilateral real exchange rate?
Motivations
10/28/2012 RIETI-CASS-CESSA joint workshop Beijing 7

∗ Improving the performance of monitoring exchange rate in employing the regional monetary unit such as AMU ∗ AMU DI: ad hoc assumption in choosing benchmark year ∗ Concerning economic growth, inter-relations, and mean-
reversions toward equilibrium exchange rates ∗ Introducing the concept of “OCA” as an equilibrium :
Kawasaki (2012a), Kawasaki and Ogawa (2006), & Ogawa and Kawasaki (2008)
∗ How would the inter-relations among member’s currencies dominate the exchange rates movements?
Motivations
10/28/2012 RIETI-CASS-CESSA joint workshop Beijing 8

http://www.rieti.go.jp/users/amu/cmi.html
10/28/2012 RIETI-CASS-CESSA joint workshop Beijing 9

∗ Decompose of Exchange rates movements; ∗ Employing the Permanent-Transitory decomposition (P-T
decomposition) proposed by Gonzalo and Granger (1995) ∗ Eliminating the effect from permanent movements and
focusing on transitory movements for the short-term monitoring
∗ Imposing the condition of equilibrium on the exchange rates among member states’ exchange rates movements ∗ Concept of G-PPP approach: cointegration among exchange
rates’ movement
Contributions
10/28/2012 RIETI-CASS-CESSA joint workshop Beijing 10

3. Advantages of Employing RMU Deviation Indicators in
Macroeconomic Surveillance
10/28/2012 RIETI-CASS-CESSA joint workshop Beijing 11

1. a stationary convergence process, where the real exchange rates possesses the long-term mean and its reverting process when the exchange rates deviate from it (mean-reversion),
2. a stationary divergent process, where the real exchange rates exhibit tendencies to increase deviations (real deviation),
3. a non-stationary random walk process, where the changes in the real exchange rates are completely random (that is, the movement is unpredictable).
Examining the properties of fluctuations in the exchange rates
10/28/2012 RIETI-CASS-CESSA joint workshop Beijing 12

Non-linear model of the UR test : the Momentum TAR (M-TAR) model by Enders and Granger (1998)
∆gt = Itρ1(gt−1 − τ ) + (1− It )ρ2 (gt−1 − τ ) + α i∆gt−1i=1
p
∑ + εi
ρ1 < 0,ρ2 < 0
It =1 if ∆gt−1 ≥ 00 if ∆gt−1 < 0
H0 :ρ1 = ρ2 = 0, H1 : no unit root H0 :ρ1 = ρ2 , H1 : asymmetric adjstment
10/28/2012 RIETI-CASS-CESSA joint workshop Beijing 13
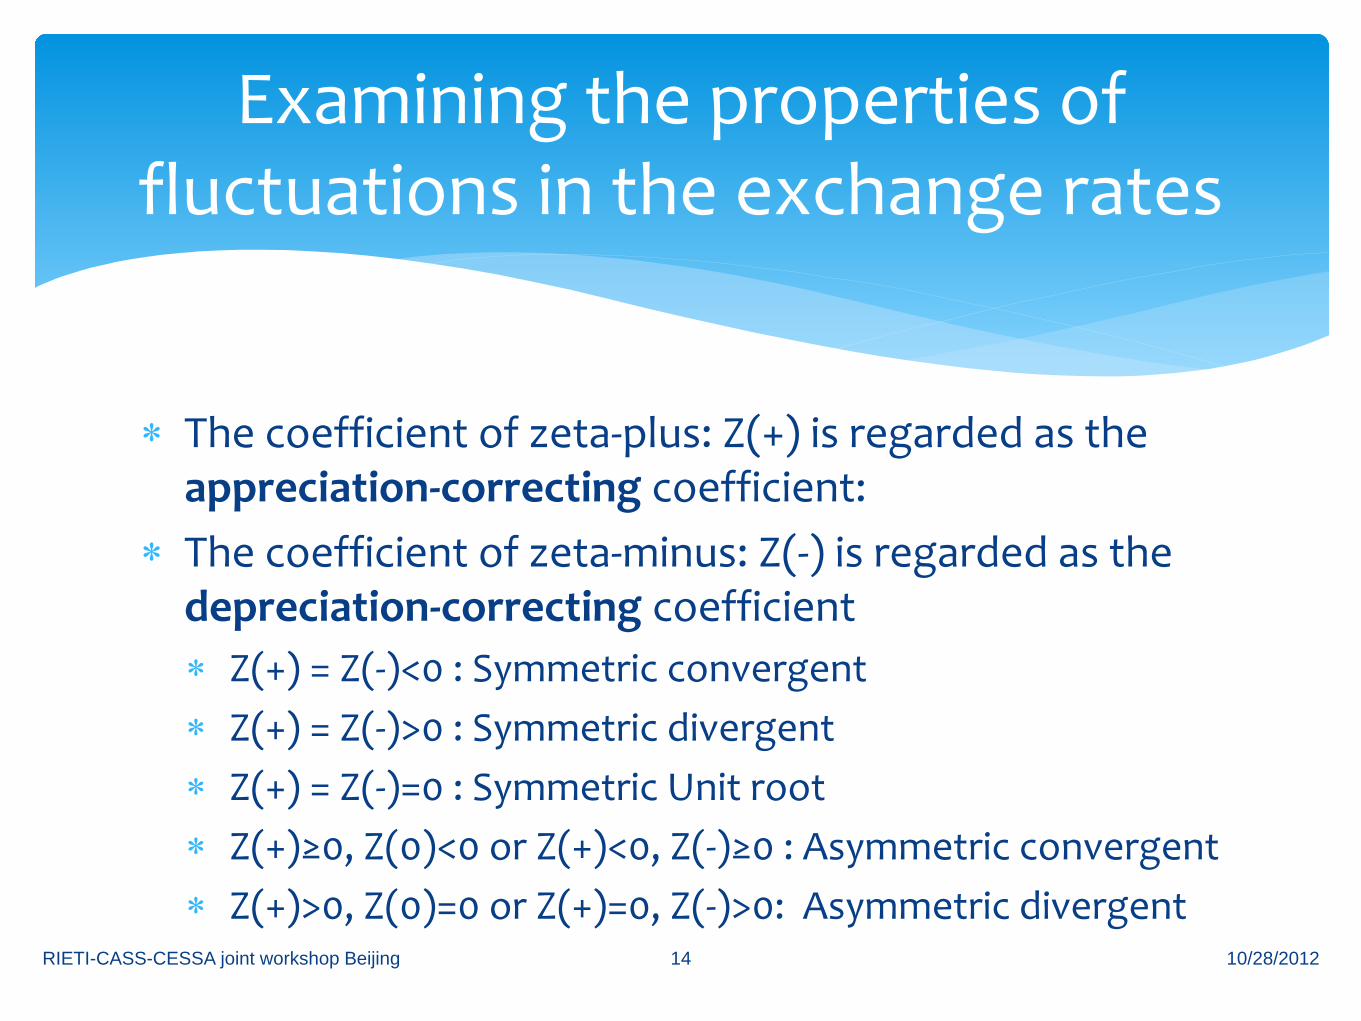
∗ The coefficient of zeta-plus: Z(+) is regarded as the appreciation-correcting coefficient:
∗ The coefficient of zeta-minus: Z(-) is regarded as the depreciation-correcting coefficient ∗ Z(+) = Z(-)<0 : Symmetric convergent ∗ Z(+) = Z(-)>0 : Symmetric divergent ∗ Z(+) = Z(-)=0 : Symmetric Unit root ∗ Z(+)≥0, Z(0)<0 or Z(+)<0, Z(-)≥0 : Asymmetric convergent ∗ Z(+)>0, Z(0)=0 or Z(+)=0, Z(-)>0: Asymmetric divergent
Examining the properties of fluctuations in the exchange rates
10/28/2012 RIETI-CASS-CESSA joint workshop Beijing 14

∗ Data ∗ Sample Period: January 3, 2000 -December 31, 2009. ∗ The data on the exchange rate and the AMU are
obtained from Datastream and RIETI. ∗ The price data is obtained from IMF-IFS as monthly
consumer price indices. ∗ The “Daily” real exchange rates and the real RMU DI are
calculated from the daily nominal exchange rates, the AMU, and the monthly CPI which is converted to daily data.
Examining the properties of fluctuations in the exchange rates
10/28/2012 RIETI-CASS-CESSA joint workshop Beijing 15

The Empirical results of the M-TAR unit root test for each currency of ‘ASEAN plus three’ exchange rate
vis-à-vis the U.S. dollars
∗ Random walk process (unforeseeable: Z(+)=Z(-)=0): ∗ China (CNY), Hong Kong (HKD), Indonesia (IDR), Japan (JPY), Korea
(KRW), Lao (LAK), Singapore (SGD) and Thailand (THB), ∗ Asymmetric stationary process
∗ one-side mean reversion and one-side divergent ∗ Cambodia: Z(+)<0, Z(-)>0
∗ one-side mean reversion ∗ Brunei* : Z(+)<0, Z(-)=0 (*10%) ∗ Malaysia: Z(+)=0, Z(-)<0
∗ one-side divergent ∗ Philippines, and Vietnam: Z(+)>0, Z(-)=0
∗ Symmetric stationary divergent process ∗ Myanmar: Z(+) = Z(-)>0
10/28/2012 RIETI-CASS-CESSA joint workshop Beijing 16

The Empirical results of the M-TAR unit root test for each currency of ‘ASEAN plus three’ exchange rate
vis-à-vis the RMU DI
∗ Random walk process (unforeseeable: Z(+)=Z(-)=0): ∗ Japan (JPY), Lao (LAK), Philippines (PHP), and Thailand (THB),
∗ Asymmetric stationary process ∗ one-side mean reversion and one-side divergent
∗ Cambodia: Z(+)<0, Z(-)>0 ∗ Korea: Z(+)<0, Z(-)>0* (10%)
∗ one-side mean reversion ∗ Brunei: Z(+)=0, Z(-)<0 ∗ China: Z(+)<0, Z(-)=0
∗ one-side divergent ∗ Hong Kong*(10%), Indonesia, Myanmar, and Vietnam: Z(+)>0, Z(-)=0
∗ Symmetric stationary convergent process ∗ Singapore and Malaysia*(10%) : Z(+)=Z(-)<0
10/28/2012 RIETI-CASS-CESSA joint workshop Beijing 17

∗ Sequential M-TAR unit root test, ∗ the short-term model: 250 samples ∗ the medium-term model: 500 samples.
∗ The rolling regressions (from January 3, 2000 + 250/500 samples) ∗ The 1st short-term model: Jan. 3, 2000 - Dec. 18, 2000, ∗ The 1st medium-term model: Jan. 3, 2000 - Dec. 3, 2001, ∗ The final short-term model: Dec. 25, 2008 - Dec. 10, 2009, ∗ The final medium-term model: Jan. 10, 2008 – Dec. 10, 2009.
The sequential M-TAR unit root for KRW, SGD, and THB
10/28/2012 RIETI-CASS-CESSA joint workshop Beijing 18

10/28/2012 RIETI-CASS-CESSA joint workshop Beijing 19

10/28/2012 RIETI-CASS-CESSA joint workshop Beijing 20
M-TAR Unit Root Test for the Real RMU DI of the SGD

M-TAR Unit Root Test for Indices of the real KRW vis-à-vis the USD
10/28/2012 RIETI-CASS-CESSA joint workshop Beijing 21

M-TAR Unit Root Test for Real RMU DI of the KRW
10/28/2012 RIETI-CASS-CESSA joint workshop Beijing 22

M-TAR Unit Root Test for Indices of the real THB vis-à-vis the USD
10/28/2012 RIETI-CASS-CESSA joint workshop Beijing 23

M-TAR Unit Root Test for the Real RMU DI of the THB
10/28/2012 RIETI-CASS-CESSA joint workshop Beijing 24

1. the magnitudes of convergence speeds in the real RMU DI deviation are larger than those of the bilateral real exchange rates vis-à-vis the USD,
2. the unit root test for the RMU DI is able to detect the possibility of exchange rates’ deviation earlier than the test for the bilateral real exchange rates,
3. the time series property of the exchange rate movement changes time to time, and
4. the unit root test for the RMU DI has the ability to capture the possibility of structural switches more clearly than the test for the bilateral rates.
Summary of Empirical Results
10/28/2012 RIETI-CASS-CESSA joint workshop Beijing 25

4. Decompose of Exchange rates movements
10/28/2012 RIETI-CASS-CESSA joint workshop Beijing 26

∗ Definition of RMU, (us$/AMU) ∗ Logarithm of real exchange rates,
Empirics: Definition of RMU
14
$/ $/1
US RMU i US ii
NEX NEXω=
= ⋅∏13
11i
iω
=
=∑
( ) ( )
/ , / , , ,
13
$/ , $/ , , ,1
13
$/ , , $/ , ,1,
13
, ,1,
RMU j t RMU j t j t RMU t
US RMU t US j t j t i i ti
i US i t i t US j t j ti i j
i i t j ti i j
rex nex p p
nex nex p p
nex p nex p
x x
ω
ω
ω
=
= ≠
= ≠
= + −
= − + − ⋅
= − − −
= ⋅ −
∑
∑
∑13
, ,1
RMU t i i ti
p pω=
= ⋅∑where
where
10/28/2012 RIETI-CASS-CESSA joint workshop Beijing 27

∗ Matrices form
Empirics: Definition of RMU
/ ,RMU j t trex W X′= ⋅
[ ]1 13, , 1,W ω ω′ = − 1, , 13,, , ,t t j t tX x x x′ =
10/28/2012 RIETI-CASS-CESSA joint workshop Beijing 28

∗ Partitioning into two groups: dominate currencies + dominated currencies
Concerning Equilibrium of G-PPP
/ , 1 1, 2 2,RMU j t t trex W X W X′ ′= ⋅ + ⋅
[ ] [ ]1 1 2 1 13, , 1, , ,m mW Wω ω ω ω+′ ′= − =
1, 1, , , 2, 1, 13,, , , , ,t t j t m t t m t tX x x x X x x+′ ′ = =
Cointegrated Not cointegrated
Dominate currencies Dominated currencies 10/28/2012 RIETI-CASS-CESSA joint workshop Beijing 29

∗ Decompose the permanent and transitory components 1) Vector is difference stationary and Vector is covariance stationary, 2) and , and 3) innovations: and for the autoregressive representation of ; ,,
P-T Decomposition by Gonzalo and Granger (1995)
1,P T
t t tX X X= +PtX P
tX
var( ) 0PtX∆ > ( )var 0T
tX >
,P tu ,T tu
( ),P Tt tX X∆
( )1,
,
lim 0t h
hP t
E Xu
+
→∞
∂≠
∂( )1,
,
lim 0t h
hT t
E Xu
+
→∞
∂=
∂
( ) ( )( ) ( )
,11 12
,21 22
PP tt
TT tt
uH L H L XuH L H L X
∆=
( )12 1 0H =10/28/2012 RIETI-CASS-CESSA joint workshop Beijing 30
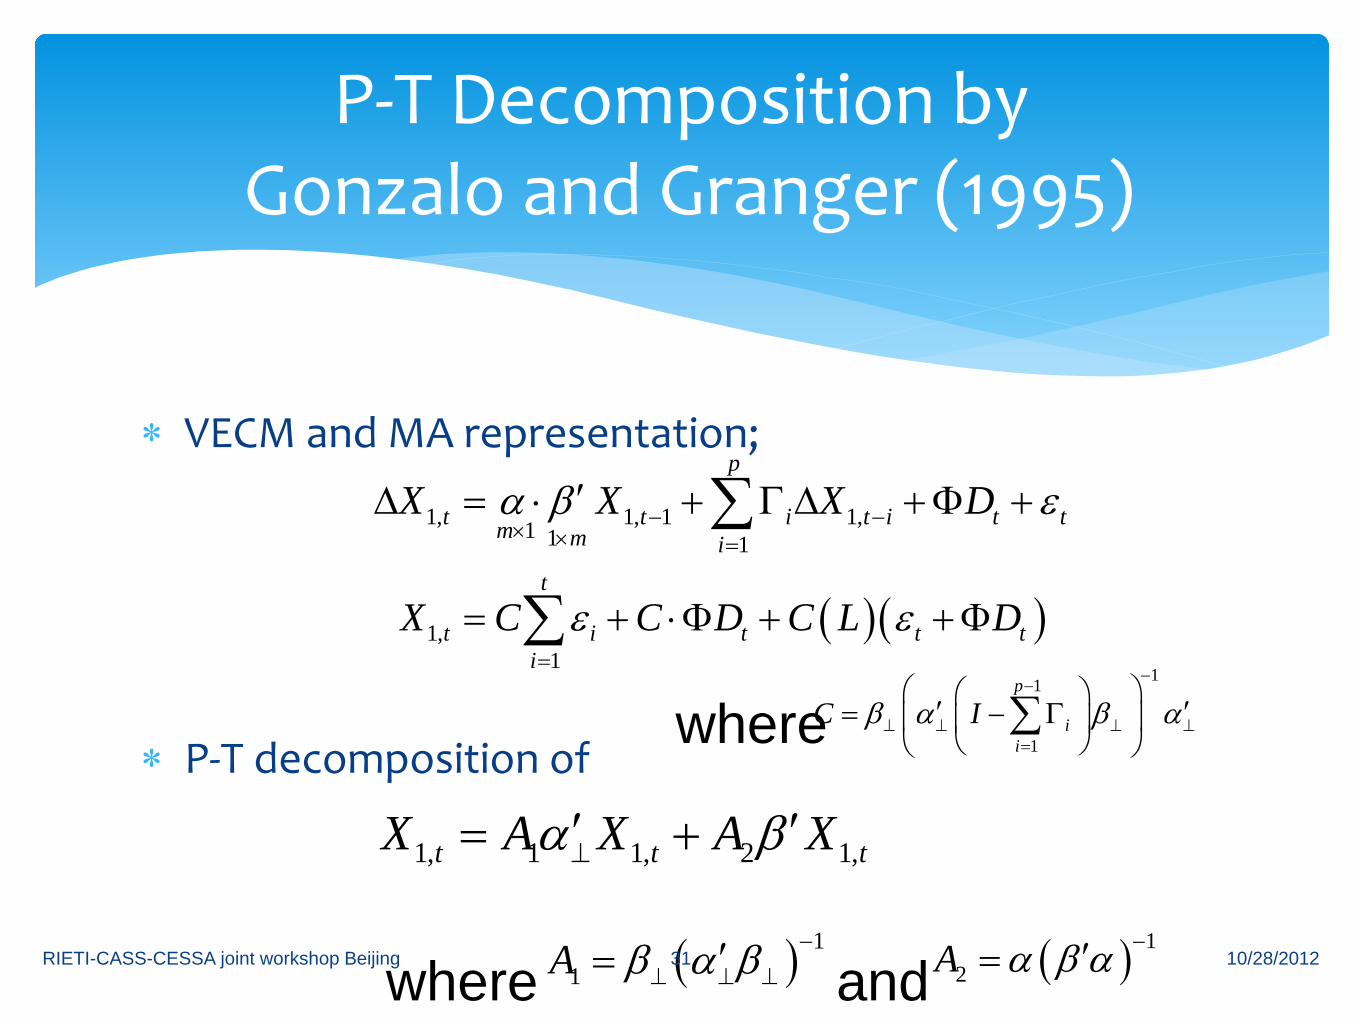
∗ VECM and MA representation;
∗ P-T decomposition of
P-T Decomposition by Gonzalo and Granger (1995)
1, 1, 1 1,1 1 1
p
t t i t i t tm m iX X X Dα β ε− −× × =
′∆ = ⋅ + Γ ∆ +Φ +∑
( )( )1,1
t
t i t t ti
X C C D C L Dε ε=
= + ⋅Φ + +Φ∑11
1
p
ii
C Iβ α β α−
−
⊥ ⊥ ⊥ ⊥=
′ ′= − Γ
∑where
1, 1 1, 2 1,t t tX A X A Xα β⊥′ ′= +
( ) 11A β α β −
⊥ ⊥ ⊥′= ( ) 12A α β α −′=where and 10/28/2012 RIETI-CASS-CESSA joint workshop Beijing 31

∗ Benchmark rates;
∗ Deviation from benchmark rates
Definition of Deviation Indicators
/ 1 1 2 2RMU jrex W X W X W X′ ′ ′= ⋅ = ⋅ + ⋅
( ) ( )( ) ( )
, / , /
1 1, 1 2 2, 2
1 1 2 2, 22
i t RMU i t RMU i
t t
P Tt t t
DI rex rex
W X X W X X
W X X X W X X
= −
′ ′= ⋅ − + ⋅ −
′ ′= ⋅ + − + ⋅ −
1, 1, , , 2, 1, 13,, , , , ,t t j t m t t m t tX x x x X x x+′ ′ = =
10/28/2012 RIETI-CASS-CESSA joint workshop Beijing 32

∗ Current misalignment for dominate currencies
∗ its deviation indicator for dominate currencies
Current misalignment and its deviation indicator
( ). / / , 1 1, 1
1 1,
1
XP Pj t RMU j RMU j t t t
Pt t
Tt
cm rex rex W X W X
W X X
W X
′ ′= − = ⋅ − ⋅
′= ⋅ −
′= ⋅
( ), 1T T
i t tCDI W X X′= ⋅ −
10/28/2012 RIETI-CASS-CESSA joint workshop Beijing 33

∗ Temporal deviation indicator for temporal misalignments of dominated currencies
Temporal deviation indicator for temporal misalignments
( ) ( ), 1 1 2 2, 2P T
i t t tTDI W X X X W X X′ ′= ⋅ + − + ⋅ −
10/28/2012 RIETI-CASS-CESSA joint workshop Beijing 34

∗ Monthly exchange rates of 14 CMIM member’s currencies vis-à-vis the USD and CPI from IMF-IFS ∗ BND, KHR, CNY, HKD, IDR, JPY, KRW, LAK, MYR, MMK, PHP,
SGD, THB, and VND ∗ Sample covers 2000:1-2011:12 ∗ Dominate currencies’ groups
∗ ASEAN5+ JPY, ASEAN5+CNY+JPY, ASEAN5+KRW+JPY, and ASEAN5+CNY+KRW+JPY (checked cointegration relationship by Johansen methodology)
∗ No cointegrated relationship in CNY+KRW+JPY
data
10/28/2012 RIETI-CASS-CESSA joint workshop Beijing 35

Brunei (BND), -23.15%
Cambodia (KHR), 61.90%
China (CNY), 4.20%
Hong Kong (HKD), 11.92%
Indonesia (IDR), 80.31%
Japan (JPY), -46.22%
Korea (KRW), 31.51%
Laos (LAK), 71.01%
Malaysia (MYR), 4.18%
Myanmar (MMK), 167.44%
Philippines (PHP), 41.06%
Singapore (SGD), -11.51% Thailand (THB), -3.38%
Vietnam (VND), 121.97%
-50%
0%
50%
100%
150%
2000:01 2000:10 2001:07 2002:04 2003:01 2003:10 2004:07 2005:04 2006:01 2006:10 2007:07 2008:04 2009:01 2009:10 2010:07
Ben
chm
ark
=200
0-20
01
Figure 1: The Deviation Indicators of CMIM member currencies
10/28/2012 RIETI-CASS-CESSA joint workshop Beijing 36

Indonesia (IDR), 9.04%
Korea (KRW), 2.09%
Malaysia (MYR), -1.16%
Philippines (PHP), 3.17%
Singapore (SGD), 1.75% Thailand (THB), 1.02%
-15%
-10%
-5%
0%
5%
10%
15%
2000:09 2001:06 2002:03 2002:12 2003:09 2004:06 2005:03 2005:12 2006:09 2007:06 2008:03 2008:12 2009:09 2010:06 2011:03
Figure 2a: Current Deviation Index for ASEAN5 + Korea
10/28/2012 RIETI-CASS-CESSA joint workshop Beijing 37

Indonesia (IDR), 0.64%
Japan (JPY), 0.35%
Malaysia (MYR), -1.38%
Philippines (PHP), 1.84%
Singapore (SGD), -0.57% Thailand (THB), 0.24%
-10%
-8%
-6%
-4%
-2%
0%
2%
4%
6%
8%
2000:01 2000:10 2001:07 2002:04 2003:01 2003:10 2004:07 2005:04 2006:01 2006:10 2007:07 2008:04 2009:01 2009:10 2010:07 2011:04
Figure 2b: Current Deviation Index for ASEAN5 + Japan
10/28/2012 RIETI-CASS-CESSA joint workshop Beijing 38

China (CNY), -1.84%
Indonesia (IDR), 13.43%
Korea (KRW), 4.17%
Malaysia (MYR), -1.84%
Philippines (PHP), 4.39%
Singapore (SGD), 1.75%
Thailand (THB), 0.86%
-22.5%
-17.5%
-12.5%
-7.5%
-2.5%
2.5%
7.5%
12.5%
17.5%
2000:01 2000:10 2001:07 2002:04 2003:01 2003:10 2004:07 2005:04 2006:01 2006:10 2007:07 2008:04 2009:01 2009:10 2010:07 2011:04
Figure 2c: Current Deviation Index for ASEAN5 + China + Korea
10/28/2012 RIETI-CASS-CESSA joint workshop Beijing 39

China (CNY), -1.78%
Indonesia (IDR), 10.31%
Japan (JPY), 0.21%
Malaysia (MYR), -1.59%
Philippines (PHP), 4.71%
Singapore (SGD), 0.79%
Thailand (THB), 3.17%
-30%
-25%
-20%
-15%
-10%
-5%
0%
5%
10%
15%
20%
2000:01 2000:10 2001:07 2002:04 2003:01 2003:10 2004:07 2005:04 2006:01 2006:10 2007:07 2008:04 2009:01 2009:10 2010:07 2011:04
Figure 2d: Current Deviation Index for ASEAN5 + China + Japan
10/28/2012 RIETI-CASS-CESSA joint workshop Beijing 40

Indonesia (IDR), 8.64%
Japan (JPY), -1.85%
Korea (KRW), 2.36%
Malaysia (MYR), -0.92%
Philippines (PHP), 3.45%
Singapore (SGD), 2.02%
Thailand (THB), -1.62%
-15%
-10%
-5%
0%
5%
10%
15%
2000:01 2000:10 2001:07 2002:04 2003:01 2003:10 2004:07 2005:04 2006:01 2006:10 2007:07 2008:04 2009:01 2009:10 2010:07 2011:04
Figure 2e: Current Deviation Index for ASEAN5 + Korea + Japan
10/28/2012 RIETI-CASS-CESSA joint workshop Beijing 41

China (CNY), -2.20%
Indonesia (IDR), 11.23%
Japan (JPY), -1.18%
Korea (KRW), 2.51%
Malaysia (MYR), -1.18%
Philippines (PHP), 4.56%
Singapore (SGD), 1.30%
Thailand (THB), 2.96%
-30%
-20%
-10%
0%
10%
20%
2000:01 2000:10 2001:07 2002:04 2003:01 2003:10 2004:07 2005:04 2006:01 2006:10 2007:07 2008:04 2009:01 2009:10 2010:07 2011:04
Figure 2f: Current Deviation Index for ASEAN5 + China + Korea + Japan
10/28/2012 RIETI-CASS-CESSA joint workshop Beijing 42

Summary of Figure 2s
∗ Temporal deviations calculated from Transitory components show that ∗ Indonesian rupiah (IDR) tends to deviate temporally, not
more than 20%, ∗ Philippines peso (PHP) tends to deviate temporally, not
more than 10%, and ∗ Chinese yuan and Malaysian ringgit were very stable . ∗ For IDR and PHP, temporal deviations continued for 4-6
years so often. ∗ The AMRO should focus on the issues why the correction
of the deviation is slow. 10/28/2012 RIETI-CASS-CESSA joint workshop Beijing 43

Table 3a: Average of TDI and differences from DI (Case for the currencies of ASEAN5+Korea are cointegrated)
Currencies Average of the TDI † Differences from DI
2000:1-2011.2 I II III IV 2000:1-
2011.2
I II III IV
2000:1-2002:12 2003:1-2005:12 2006.1-2008.12 2009.1-20011.2 2000:1-2002:12
2003:1-2005:12
2006.1-2008.12
2009.1-20011.2
Dominate
Indonesia (IDR) 6.712% 0.902% 6.601% 6.960% 14.558% 32.174% 2.284% 19.779% 50.304% 64.665% (0.067173939) (0.056400112) (0.031053286) (0.05546981) (0.048337864)
Korea (KRW) 2.741% -0.239% 1.999% 1.647% 9.355% 3.020% 1.391% -0.703% -5.329% 21.701% (0.038880867) (0.011451723) (0.012804867) (0.026245898) (0.021922084)
Malaysia (MYR) 0.884% -0.773% -0.154% -0.839% 6.921% 2.105% 0.340% 3.730% 3.712% 0.197% (0.037661104) (0.029493466) (0.014308761) (0.025883278) (0.015685951)
Philippines (PHP)
3.360% -0.062% 2.716% 2.474% 10.166% 18.345% 2.878% 23.187% 22.383% 27.839%
(0.041570255) (0.01383795) (0.014460298) (0.029162197) (0.025460383)
Singapore (SGD) 2.549% -0.295% 1.776% 1.389% 9.103% -9.065% -0.540% -5.558% -13.704% -19.033% (0.038252125) (0.011982288) (0.012485686) (0.025580314) (0.02091628)
Thailand (THB) 2.133% -0.414% 1.293% 0.832% 8.558% -3.686% -0.091% -0.793% -4.274% -11.634% (0.037270244) (0.014871212) (0.012172271) (0.024606952) (0.018952329)
Dominated
Brunei (BND) -7.954% -1.050% -4.566% -15.408% -11.623%
-2.628% -0.521% -1.838% -1.926% -7.549%
(0.079302957) (0.079302957) (0.079302957) (0.079302957) (0.079302957)
Cambodia (KHR) 25.997% 0.436% 12.402% 36.220% 65.010% (0.25243637) (0.027607046) (0.058905215) (0.154725984) (0.046815569)
China (CNY) 2.689% -1.012% 4.241% 2.412% 6.165% (0.03742698) (0.02979928) (0.031622723) (0.013737478) (0.030735281)
Hong Kong (HKD)
-0.873% -2.113% -7.031% -2.311% 10.891%
(0.073136668) (0.045856789) (0.012967949) (0.05142352) (0.03300943)
Japan (JPY) -8.578% 1.884% -6.804% -6.077% -28.849% (0.122999024) (0.057546731) (0.051564683) (0.065187323) (0.073190476)
Lao (LAK) 51.270% 9.664% 60.722% 68.071% 73.258% (0.279387038) (0.181225487) (0.083318113) (0.021702617) (0.029411295)
Myanmmar (MMK)
92.384% 16.151% 79.754% 127.127% 166.350%
(0.583949211) (0.27865515) (0.053166128) (0.223225915) (0.057244364)
Vietnam (VND) 40.091% 2.178% 22.542% 51.760% 99.376% (0.364207978) (0.036777194) (0.073511543) (0.162705705) (0.12238191)
†: A value in the parenthesis indicates the standard value
10/28/2012 RIETI-CASS-CESSA joint workshop Beijing 44

Table 3b:Average of TDI and differences from DI (Case for the currencies of ASEAN5+Japan are cointegrated)
Currencies Average of the TDI † Differences from DI
2000:1-2011.2 I II III IV 2000:1-
2011.2
I II III IV
2000:1-2002:12 2003:1-2005:12 2006.1-2008.12 2009.1-20011.2 2000:1-2002:12
2003:1-2005:!2
2006.1-2008.12
2009.1-20011.2
Dominate
Indonesia (IDR) -0.529% 0.101% 0.173% 0.767% -4.116% 39.415% 3.085% 26.207% 56.497% 83.339% (0.023664477) (0.006895175) (0.00726503) (0.024774925) (0.015333331)
Japan (JPY) -1.107% -0.073% -0.576% -0.092% -4.639% -10.099% 1.436% -8.066% -7.911% -31.759% (0.022097681) (0.007203823) (0.006848026) (0.021615112) (0.011478681)
Malaysia (MYR) -4.483% -1.088% -4.953% -5.111% -7.700% 7.472% 0.655% 8.529% 7.984% 14.818% (0.036210798) (0.048018406) (0.011643581) (0.011815349) (0.021113294)
Philippines (PHP) 1.808% 0.804% 3.204% 4.243% -1.996% 19.897% 2.013% 22.698% 20.614% 40.001% (0.03852677) (0.0341718) (0.011808539) (0.038434562) (0.033498208)
Singapore (SGD) -2.902% -0.613% -2.903% -2.760% -6.266% -3.614% -0.222% -0.879% -9.555% -3.664% (0.025722768) (0.027859528) (0.00823795) (0.013436961) (0.01017193)
Thailand (THB) -1.320% -0.137% -0.852% -0.409% -4.832% -0.234% -0.368% 1.352% -3.034% 1.755% (0.021852511) (0.009035319) (0.006802775) (0.020489166) (0.010257517)
Dominated
Brunei (BND) -10.949% -0.652% -6.289% -16.153% -24.094%
0.367% -0.919% -0.115% -1.181% 4.921%
(0.0947746) (0.018025732) (0.018402588) (0.051978647) (0.047870902)
Cambodia (KHR) 23.002% 0.834% 10.678% 35.475% 52.539% (0.210670366) (0.0202986) (0.065011131) (0.120595056) (0.03859221)
China (CNY) -0.306% -0.614% 2.517% 1.667% -6.305% (0.042539046) (0.018231108) (0.025852664) (0.041132218) (0.019104497)
Hong Kong (HKD) -3.867% -1.715% -8.755% -3.056% -1.579% (0.038136539) (0.034976521) (0.011953414) (0.021899959) (0.022214663)
Korea (KRW) 5.394% 2.071% 1.412% -2.501% 26.135% (0.139282498) (0.081144366) (0.054221008) (0.137306266) (0.068555057)
Lao (LAK) 48.276% 10.062% 58.999% 67.326% 60.787% (0.26025015) (0.186413841) (0.086159837) (0.034273124) (0.018868954)
Myanmmar (MMK) 89.390% 16.550% 78.030% 126.382% 153.880% (0.550092597) (0.285132147) (0.063488239) (0.194926959) (0.046307416)
Vietnam (VND) 37.096% 2.576% 20.819% 51.015% 86.905% (0.32047917) (0.039128805) (0.076638916) (0.126943703) (0.11036543)
A value in the parenthesis indicates the standard value
10/28/2012 RIETI-CASS-CESSA joint workshop Beijing 45

Table 3c: Average of TDI and differences from DI (Case for the currencies of ASEAN5+China+Korea are cointegrated)
Currencies Average of the TDI † Differences from DI
2000:1-2011.2 I II III IV 2000:1-
2011.2
I II III IV
2000:1-2002:12 2003:1-2005:12 2006.1-2008.12 2009.1-20011.2 2000:1-2002:12
2003:1-2005:12
2006.1-2008.12
2009.1-20011.2
Dominate
China CNY 1.053% -0.939% 0.615% -0.325% 6.293% -0.993% -0.594% 1.787% 0.810% -7.677% (0.03594266) (0.034373053) (0.018508455) (0.019272226) (0.020410738)
Indonesia (IDR) 8.483% 1.583% 8.712% 8.769% 17.342% 30.402% 1.602% 17.668% 48.495% 61.881% (0.079232593) (0.09009536) (0.040564665) (0.045483206) (0.037770856)
Korea (KRW) 3.979% 0.054% 3.803% 3.256% 10.644% 1.782% 1.098% -2.507% -6.938% 20.412% (0.041655082) (0.018652971) (0.015462093) (0.025121868) (0.022102301)
Malaysia (MYR) 1.053% -0.939% 0.615% -0.325% 6.293% 1.935% 0.506% 2.961% 3.198% 0.825% (0.03594266) (0.034373053) (0.018508455) (0.019272226) (0.020410738)
Philippines (PHP) 4.086% 0.091% 3.920% 3.387% 10.803% 17.619% 2.726% 21.982% 21.470% 27.201% (0.042294535) (0.020130924) (0.015826578) (0.025508499) (0.022342097)
Singapore (SGD) 2.802% -0.346% 2.520% 1.815% 8.893% -9.318% -0.489% -6.302% -14.130% -18.823% (0.036322802) (0.011252962) (0.013580291) (0.021512207) (0.020215858)
Thailand (THB) 2.365% -0.494% 2.044% 1.280% 8.243% -3.918% -0.011% -1.544% -4.723% -11.320% (0.035304206) (0.015340751) (0.014040989) (0.020546706) (0.019912116)
Dominated
Brunei (BND) -7.784% -1.216% -3.796% -14.893% -12.251%
-2.798% -0.355% -2.608% -2.441% -6.921%
(0.064625424) (0.022821519) (0.013779408) (0.03962477) (0.031283576)
Cambodia (KHR) 26.166% 0.270% 13.171% 36.735% 64.382% (0.250003422) (0.029538023) (0.062402349) (0.148622442) (0.052158293)
Hong Kong (HKD) -0.703% -2.279% -6.262% -1.797% 10.263% (0.069870989) (0.050918574) (0.016747555) (0.045485109) (0.038016952)
Japan (JPY) -8.409% 1.718% -6.034% -5.562% -29.477% (0.124337239) (0.053259802) (0.045175344) (0.070328817) (0.067513438)
Lao (LAK) 51.440% 9.498% 61.492% 68.585% 72.630% (0.280340249) (0.177026192) (0.087573193) (0.019117667) (0.034960542)
Myanmmar (MMK) 92.554% 15.985% 80.523% 127.641% 165.722% (0.582598596) (0.275049212) (0.053947408) (0.218560365) (0.062905033)
Vietnam (VND) 40.260% 2.012% 23.312% 52.274% 98.748% (0.362044133) (0.036098666) (0.078403403) (0.156327428) (0.128091701)
A value in the parenthesis indicates the standard value
10/28/2012 RIETI-CASS-CESSA joint workshop Beijing 46

Table 3d: Average of TDI and differences from DI (Case for the currencies of ASEAN5+China+Japan are cointegrated)
Currencies Average of the TDI † Differences from DI
2000:1-2011.2 I II III IV 2000:1-
2011.2
I II III IV
2000:1-2002:12 2003:1-2005:12 2006.1-2008.12 2009.1-20011.2 2000:1-2002:12
2003:1-2005:!2
2006.1-2008.12
2009.1-20011.2
Dominate
China CNY -2.981% -1.029% -2.419% -2.166% -7.547% 3.042% -0.504% 4.821% 2.651% 6.163% (0.034381426) (0.039481889) (0.011360788) (0.024859432) (0.010999199)
Indonesia (IDR) 7.899% 3.734% 10.797% 10.027% 6.929% 30.987% -0.548% 15.582% 47.237% 72.295% (0.0849551) (0.1412935) (0.042598463) (0.037528499) (0.033349594)
Japan (JPY) -1.192% -0.246% -0.246% -0.161% -5.166% -10.015% 1.609% -8.397% -7.842% -31.232% (0.024334202) (0.01073794) (0.007308733) (0.022947825) (0.009335778)
Malaysia (MYR) -2.812% -0.955% -2.214% -1.977% -7.323% 5.801% 0.522% 5.791% 4.850% 14.441% (0.033166013) (0.036713661) (0.010771425) (0.024610407) (0.010700204)
Philippines (PHP) 2.857% 1.527% 4.672% 4.376% 0.220% 18.848% 1.290% 21.230% 20.481% 37.785% (0.039453062) (0.057828687) (0.019872451) (0.025327033) (0.017222295)
Singapore (SGD) -0.670% -0.017% 0.388% 0.424% -4.472% -5.846% -0.817% -4.170% -12.739% -5.457% (0.023182485) (0.005070475) (0.007583413) (0.022723646) (0.009585456)
Thailand (THB) 1.472% 0.920% 2.990% 2.824% -1.622% -3.026% -1.426% -2.490% -6.267% -1.455% (0.02945995) (0.035017411) (0.014075234) (0.023494285) (0.013429203)
Dominated
Brunei (BND) -10.936% -0.920% -5.758% -15.745% -24.917%
0.354% -0.651% -0.646% -1.589% 5.744%
(0.096316782) (0.019447506) (0.012082112) (0.05592103) (0.041933515)
Cambodia (KHR) 23.014% 0.566% 11.209% 35.883% 51.716% (0.208807197) (0.021349188) (0.068560044) (0.115541846) (0.043566896)
Hong Kong (HKD) -3.855% -1.983% -8.224% -2.649% -2.402% (0.038214115) (0.0421943) (0.012542358) (0.022428176) (0.026800805)
Korea (KRW) 5.407% 1.803% 1.942% -2.093% 25.312% (0.132248832) (0.074316785) (0.050156324) (0.130096099) (0.06395662)
Lao (LAK) 48.288% 9.794% 59.530% 67.733% 59.964% (0.261599258) (0.180545938) (0.090631263) (0.040939742) (0.02414432)
Myanmmar (MMK) 89.402% 16.282% 78.561% 126.789% 153.057% (0.54863504) (0.279760305) (0.064125695) (0.190876628) (0.051597367)
Vietnam (VND) 37.108% 2.308% 21.350% 51.422% 86.082% (0.318578086) (0.035948037) (0.081786006) (0.121236013) (0.116169698)
†: A value in the parenthesis indicates the standard value
10/28/2012 RIETI-CASS-CESSA joint workshop Beijing 47

Table 3e: Average of TDI and differences from DI (Case for the currencies of ASEAN5+Korea+Japan are cointegrated)
Currencies Average of the TDI † Differences from DI
2000:1-2011.2 I II III IV 2000:1-
2011.2
I II III IV
2000:1-2002:12 2003:1-2005:12 2006.1-2008.12 2009.1-20011.2 2000:1-2002:12
2003:1-2005:!2
2006.1-2008.12
2009.1-20011.2
Dominate
Indonesia (IDR) 3.878% 1.323% 4.741% 5.098% 4.597% 35.008% 1.863% 21.639% 52.166% 74.626% (0.051107171) (0.069363268) (0.031287922) (0.047679173) (0.034158621)
Japan (JPY) -1.737% -0.209% -2.226% -2.575% -2.054% -9.469% 1.572% -6.416% -5.429% -34.344% (0.016266279) (0.015065411) (0.012509737) (0.012998941) (0.012048804)
Korea (KRW) 0.518% 0.407% 0.573% 0.507% 0.618% 5.243% 0.745% 0.724% -4.189% 30.438% (0.012969349) (0.019084643) (0.008021757) (0.012303463) (0.008448073)
Malaysia (MYR) -1.238% -0.072% -1.606% -1.892% -1.462% 4.226% -0.360% 5.183% 4.765% 8.581% (0.011087017) (0.007749994) (0.009336511) (0.008073151) (0.008530703)
Philippines (PHP) 1.103% 0.566% 1.298% 1.306% 1.310% 20.602% 2.251% 24.605% 23.551% 36.695% (0.019257455) (0.027803347) (0.01153306) (0.01832473) (0.012581348)
Singapore (SGD) 0.336% 0.357% 0.347% 0.259% 0.402% -6.853% -1.192% -4.129% -12.574% -10.332% (0.011144965) (0.01637835) (0.007123042) (0.010479046) (0.007294278)
Thailand (THB) -1.612% -0.175% -2.071% -2.404% -1.906% -12.569% -1.161% -5.987% -16.184% -31.970% (0.014921995) (0.013213796) (0.011683758) (0.01173146) (0.011137244)
Dominated
Brunei (BND) -10.075% -0.349% -6.018% -16.461% -20.007%
-0.507% -1.222% -0.386% -0.874% 0.834%
(0.086227874) (0.020181492) (0.023834691) (0.04396901) (0.054260957)
Cambodia (KHR) 23.875% 1.137% 10.950% 35.167% 56.626% (0.222734363) (0.02175688) (0.057472805) (0.138403712) (0.032070823)
China CNY 0.567% -0.311% 2.789% 1.359% -2.218% (0.024372929) (0.010428317) (0.019515655) (0.021024667) (0.012630985)
Hong Kong (HKD) -2.994% -1.413% -8.483% -3.364% 2.508% (0.045074081) (0.025532333) (0.012113215) (0.033930778) (0.017368375)
Lao (LAK) 49.149% 10.365% 59.270% 67.018% 64.874% (0.263586354) (0.194033405) (0.079232747) (0.021878043) (0.012714321)
Myanmmar (MMK) 90.263% 16.852% 78.302% 126.074% 157.967% (0.560002144) (0.291662083) (0.057253475) (0.209116633) (0.041849219)
Vietnam (VND) 37.969% 2.878% 21.090% 50.707% 90.992% (0.33310441) (0.045092286) (0.068189615) (0.145560851) (0.104679608)
†: A value in the parenthesis indicates the standard value
10/28/2012 RIETI-CASS-CESSA joint workshop Beijing 48

Table 3f: Average of TDI and differences from DI (Case for the currencies of ASEAN5+China+Korea+Japan are cointegrated)
Currencies Average of the TDI † Differences from DI
2000:1-2011.2 I II III IV 2000:1-
2011.2
I II III IV
2000:1-2002:12 2003:1-2005:12 2006.1-2008.12 2009.1-20011.2 2000:1-2002:12
2003:1-2005:!2
2006.1-2008.12
2009.1-20011.2
Dominate
China CNY -1.948% -0.611% -1.808% -2.613% -3.061% 2.009% -0.922% 4.211% 3.099% 1.677% (0.017970091) (0.026971149) (0.010486653) (0.004920417) (0.006472813)
Indonesia (IDR) 7.821% 3.166% 9.085% 10.276% 9.214% 31.065% 0.019% 17.295% 46.988% 70.009% (0.083224834) (0.137890744) (0.050183708) (0.02698218) (0.030411251)
Japan (JPY) -1.204% -0.323% -0.979% -1.632% -2.127% -10.002% 1.686% -7.663% -6.371% -34.271% (0.010681758) (0.014422688) (0.005887949) (0.003000823) (0.003840309)
Korea (KRW) 1.481% 0.715% 2.015% 1.910% 1.247% 4.280% 0.437% -0.718% -5.592% 29.809% (0.018331189) (0.030893257) (0.010841715) (0.006960663) (0.006793709)
Malaysia (MYR) -1.204% -0.323% -0.979% -1.632% -2.127% 4.193% -0.110% 4.555% 4.505% 9.245% (0.010681758) (0.014422688) (0.005887949) (0.003000823) (0.003840309)
Philippines (PHP) 2.971% 1.291% 3.676% 3.876% 3.119% 18.734% 1.526% 22.226% 20.981% 34.885% (0.033445897) (0.056037048) (0.020080982) (0.011579735) (0.012289815)
Singapore (SGD) 0.601% 0.375% 1.034% 0.749% 0.141% -7.117% -1.209% -4.816% -13.064% -10.071% (0.009741128) (0.016042103) (0.005400299) (0.004386663) (0.003677894)
Thailand (THB) 1.804% 0.840% 2.375% 2.337% 1.654% -3.358% -1.345% -1.875% -5.780% -4.730% (0.021584153) (0.036349674) (0.012845507) (0.007947963) (0.007975745)
Dominated
Brunei (BND) -10.042% -0.600% -5.391% -16.201% -20.671%
-0.540% -0.971% -1.013% -1.134% 1.499%
(0.086464393) (0.017941924) (0.016942509) (0.045852135) (0.049095409)
Cambodia (KHR) 23.908% 0.886% 11.577% 35.427% 55.962% (0.220206303) (0.018402375) (0.060526681) (0.13242118) (0.035597066)
Hong Kong (HKD) -2.961% -1.663% -7.856% -3.104% 1.844% (0.041529261) (0.032451222) (0.008460182) (0.02859812) (0.020457103)
Lao (LAK) 49.182% 10.114% 59.897% 67.278% 64.210% (0.264178797) (0.187696927) (0.083632805) (0.024384066) (0.016346959)
Myanmmar (MMK) 90.296% 16.601% 78.929% 126.334% 157.303% (0.558339726) (0.286172684) (0.05711748) (0.204949867) (0.046694131)
Vietnam (VND) 38.002% 2.627% 21.717% 50.967% 90.328% (0.330944962) (0.040507854) (0.073332682) (0.139423074) (0.109914062)
†: A value in the parenthesis indicates the standard value
10/28/2012 RIETI-CASS-CESSA joint workshop Beijing 49

Summary of Table 3s
∗ Deviations of the Indonesia rupiah from the benchmark of the RMU DI tends to be over-estimated at more than 30% in the full sample period.
∗ Deviations of the Philippines peso from the benchmark of the RMU DI tends to be over-estimated at more than 17%,
∗ Deviations of the Singapore dollar and the Thai baht tend to be under-estimated about 3-11%,
∗ Deviations of the Japanese yen are also under-estimated if the Japanese yen is included as a dominate currency, and
∗ Deviations of dominated currencies are not suffered much from the temporal deviations of dominate currencies.
10/28/2012 RIETI-CASS-CESSA joint workshop Beijing 50

∗ For an empirical analysis, accumulation of historical data is required, and hence, it might be impossible to forecast the beginning of an economic crisis with timeliness and accuracy.
∗ However, the sequential unit root test for the RMU DI employed here can detect the beginning of overvaluation, which usually happens several years before the sudden rapid depreciation of the currency in a crisis. By applying econometric methodologies to the RMU DI, we can detect changes in the determinant of exchange rates, e.g., innovative changes in real economies or unexpected booms in the market as the beginning of a bubble.
∗ Monitoring of the RMU DI, as well as the nominal exchange rates against the USD, should be helpful for raising an alert for a possible large correction in the future, and hence, the RMU DI can be a useful surveillance tool.
Conclusions
10/28/2012 RIETI-CASS-CESSA joint workshop Beijing 51

∗ The RMU DI such as the AMU DI is a better indicator for exploiting the information for deviation and mean reversion.
∗ Employing the RMU DI the surveillance unit such as the AMRO can detect an early-warning signal of deviation from the mean and the possibility of large corrections ahead.
∗ However, it is important to monitor and update the time-varying coefficients of exchange rate movement using higher frequency data of exchange rates and the policy/market variables,
∗ By employing the efficient tools for the economic surveillance to strengthen the soundness of economic structures, the governments of East Asian countries will be able to take further steps for regional financial cooperation from now onward.
Conclusions (cont.)
10/28/2012 RIETI-CASS-CESSA joint workshop Beijing 52