NAEP Vs. TIMSS Vs. PISA Comparison
11
1 Comparing NAEP, TIMSS, and PISA in Mathematics and Science The purpose of this document is to provide background information that will be useful in (1) interpreting the mathematics and science results from two key international assessments, which are being released in December 2004, and (2) comparing these results with recent findings from the U.S. National Assessment of Educational Progress in these subjects. Background Providing information to assist policymakers, researchers, educators, and the public obtain a comprehensive picture of how U.S. students perform in key subject areas is an important objective of the National Center for Education Statistics (NCES). In the United States, national- level data on student achievement comes primarily from two sources: the National Assessment of Educational Progress (NAEP)—also known as the “Nation’s Report Card”—and the United States’ participation and collaboration in international assessments, such as the Trends in International Mathematics and Science Study (TIMSS) and the Program for International Student Assessment (PISA). 1 NAEP measures fourth-, eighth-, and twelfth-grade students’ performance, most frequently in reading, mathematics, and science, with assessments designed specifically for national and state information needs. Alternatively, the international assessments allow the United States to benchmark its performance to that of other countries—in fourth- and eighth-grade mathematics and science in TIMSS and in 15-year-olds’ reading, mathematical, and scientific literacy in PISA. All three assessments are conducted regularly to allow the monitoring of student outcomes over time. 2 While these different assessments may appear to have significant similarities, such as the age or grade of students or content areas studied, each was designed to serve a different purpose and each is based on a separate and unique framework and set of items. Thus, not surprisingly, there may be differences in results for a given year or in trend estimates among the studies, each giving a slightly different view into U.S. students’ performance in these subjects. NCES released results from the 2003 administrations of TIMSS and PISA in December 2004. Results from the 2003 administration of NAEP Mathematics were released in late 2003; and results from the 2000 administration of NAEP Science also are available. 3 This document is intended to provide information that will help the press and others understand the mathematics and science results across three studies, grasp the similarities and differences in these results, and identify what each assessment contributes to the overall knowledge base on student performance. 4
-
Upload
chennai1st -
Category
Documents
-
view
44 -
download
1
description
NAEP Vs. TIMSS Vs. PISA Comparison
Transcript of NAEP Vs. TIMSS Vs. PISA Comparison

1
Comparing NAEP, TIMSS, and PISA in Mathematics and Science
The purpose of this document is to provide background information that will be useful in (1) interpreting the mathematics and science results from two key international assessments, which are being released in December 2004, and (2) comparing these results with recent findings from the U.S. National Assessment of Educational Progress in these subjects.
Background Providing information to assist policymakers, researchers, educators, and the public obtain a comprehensive picture of how U.S. students perform in key subject areas is an important objective of the National Center for Education Statistics (NCES). In the United States, national-level data on student achievement comes primarily from two sources: the National Assessment of Educational Progress (NAEP)—also known as the “Nation’s Report Card”—and the United States’ participation and collaboration in international assessments, such as the Trends in International Mathematics and Science Study (TIMSS) and the Program for International Student Assessment (PISA).1 NAEP measures fourth-, eighth-, and twelfth-grade students’ performance, most frequently in reading, mathematics, and science, with assessments designed specifically for national and state information needs. Alternatively, the international assessments allow the United States to benchmark its performance to that of other countries—in fourth- and eighth-grade mathematics and science in TIMSS and in 15-year-olds’ reading, mathematical, and scientific literacy in PISA. All three assessments are conducted regularly to allow the monitoring of student outcomes over time.2 While these different assessments may appear to have significant similarities, such as the age or grade of students or content areas studied, each was designed to serve a different purpose and each is based on a separate and unique framework and set of items. Thus, not surprisingly, there may be differences in results for a given year or in trend estimates among the studies, each giving a slightly different view into U.S. students’ performance in these subjects. NCES released results from the 2003 administrations of TIMSS and PISA in December 2004. Results from the 2003 administration of NAEP Mathematics were released in late 2003; and results from the 2000 administration of NAEP Science also are available.3 This document is intended to provide information that will help the press and others understand the mathematics and science results across three studies, grasp the similarities and differences in these results, and identify what each assessment contributes to the overall knowledge base on student performance.4

2
Comparing Features of the Assessments NAEP, TIMSS, and PISA differ from one another on several key aspects of purpose, partners, population, and content. Purpose and proximity to curriculum The goals of the assessments have some subtle but important distinctions in regard to U.S. curricula. NAEP is the U.S. source for information on mathematics and science achievement at key stages of education across the country using nationally established external benchmarks of performance (e.g., basic, proficient, advanced). The frameworks and benchmarks are established by the National Assessment Governing Board (NAGB) and are based on the collaborative input of a wide range of experts and participants in the United States from government, education, business and public sectors. Ultimately, they are intended to reflect the best thinking about the knowledge, skills, and competencies needed for students to have an in-depth understanding of these subjects at different grades. TIMSS is the U.S. source for internationally comparative information on mathematics and science achievement in the primary and middle grades. Like NAEP, TIMSS assessments are based on collaboratively developed frameworks for the topics from curricula in mathematics and science to be assessed; but unlike NAEP, the framework and related consensus process involves content experts, education professionals, and measurement specialists from many different countries. PISA is the U.S. source for internationally comparative information on the mathematical and scientific literacy of students in the upper grades at an age that, for most countries, is near the end of compulsory schooling. The objective of PISA is to measure the “yield” of education systems, or what skills and competencies students have acquired and can apply in these subjects to real-world contexts by age 15. The literacy concept emphasizes the mastery of processes, understanding of concepts, and application of knowledge and functioning in various situations within domains. By focusing on literacy, PISA draws not only from school curricula but also from learning that may occur outside of school. The tailoring of NAEP to national practices distinguishes it from the other two assessments, the content of which is determined collaboratively with other countries and allows comparisons to international views of key content. The focus in PISA on yield and literacy distinguishes it from the other two assessments, which aim at measuring curricular attainment more closely. Partners For the international assessments, the groups of countries in the comparisons are different. Around the world, TIMSS and PISA are well-subscribed programs. As shown in figure 1, some 46 countries participated in TIMSS 2003, and 41 countries participated in PISA 2003, though the

3
composition of the groups is somewhat different.5 PISA participants include all 30 OECD countries, and the international averages reported are based on only those countries. TIMSS participants include 13 industrialized countries, as well as middle-income and developing nations from around the world, and international averages reported are based on all participants. This should be kept in mind when interpreting results and is one of the reasons TIMSS and PISA scores should not be compared directly.
PISA PISA4th
grade8th
grade15-year-
olds4th
grade8th
grade15-year-
olds
Africa EuropeBotswana AustriaEgypt Belgium1
Ghana CyprusMorocco Czech RepublicSouth Africa DenmarkTunisia England2
EstoniaThe Americas Finland
Brazil FranceCanada GermanyChile GreeceMexico HungaryUnited States IcelandUruguay Ireland
ItalyAsia Latvia
Armenia LiechtensteinBahrain LithuaniaBulgaria LuxembourgChinese Taipei Macedonia, Republic ofHong Kong SAR Moldova, Republic ofIndonesia NetherlandsIran, Islamic Republic of NorwayIsrael PolandJapan PortugalJordan RomaniaKorea, Republic of Russian FederationLebanon Scotland2
Macao-China SerbiaMalaysia Slovak RepublicPalestinian National Authority SloveniaPhilippines SpainSaudia Arabia SwedenSingapore SwitzerlandThailand Turkey
United Kingdom2
Australia/OceaniaAustraliaNew Zealand
Figure 1. Participating countries in TIMSS 2003 and PISA 2003TIMSS
Continent and country Continent and countryTIMSS
2Scotland and England participated separately in TIMSS 2003 at both grade levels but jointly as the United Kingdom (also including Northern Ireland) for PISA 2003. However, England did not meet response rate standards at grade 8 for TIMSS 2003 or for PISA 2003. SOURCE: Organization for Economic Cooperation and Development (OECD), Program for International Student Assessment (PISA) 2003, and International Association for the Evaluation of Educational Achievement (IEA), Trends in International Mathematics and Science Study (TIMSS) 2003.
1Only Flemish Belgium participated in TIMSS 2003.

4
Population The students being studied may represent different groups. NAEP, TIMSS, and PISA are all sample-based assessments—that is, each administers the assessment to a subgroup of U.S. students in such a way that results can be generalized to the larger population. However, each assessment defines the population to which it is generalizing (and thus from which the sample is drawn) differently. One key distinction between NAEP and TIMSS, on the one hand, and PISA, on the other hand, is that NAEP and TIMSS use grade-based samples and PISA uses an age-based sample. These choices relate to the purposes of each program described earlier—NAEP and TIMSS to report on curricular achievement and PISA to describe the yield of systems toward the end of compulsory schooling. • The NAEP target population is all students in fourth, eighth, and twelfth grades, and thus
results reflect the performance of U.S. students in these grades—most recently for fourth, eighth, and twelfth grades in science in 2000; for fourth and eighth grades in mathematics in 2003; and for twelfth grade in mathematics in 2000.
• The TIMSS target population is all students from the upper of the two adjacent grades that
contain the largest number of 9-year-olds and all students from the upper of the two adjacent grades that contain the largest number of 13-year-olds. For the United States (and many other countries), this population is all fourth-grade and all eighth-grade students. The most recent TIMSS results reflect the performance of U.S. students in these grades in 2003.
• The PISA target population is all 15-year-old students. Operationally, this included all
students who were from 15 years and 3 months to 16 years and 2 months at the beginning of the testing period and who were enrolled in school, regardless of grade level or full- or part-time status. The most recent PISA results reflect the performance of U.S. 15-year-olds, who were in ninth, tenth, or another grade in 2003.
Thus, for mathematics, the most recent NAEP and TIMSS results are reporting on similar populations (fourth and eighth grades) in the same year—although NAEP is administered a few months prior to TIMSS in the school year. For science, however, NAEP reports on the population 3 years prior to the current TIMSS cohort. With regard to PISA, the population under study is uniformly older than the fourth- and eighth-graders in NAEP and TIMSS, and uniformly younger than the twelfth-graders in NAEP. Moreover, while most PISA students in the United States are in tenth grade, they are in other grades as well. Content The mathematics and science being assessed may be different in terms of content coverage and item format.

5
Also to be released in early 2005 are two technical reports describing the results of a content comparison of NAEP, TIMSS, and PISA in mathematics and of NAEP and TIMSS in science.6 These studies show that, while there are similarities among the assessment programs, there are notable differences in terms of frameworks (more so in science), item content, and item format. Frameworks Each assessment is developed from a framework specifying the content and skills to be measured. The comparison of the NAEP 2003 and TIMSS 2003 mathematics frameworks reveals considerable agreement on the general boundaries and basic organization of mathematics content. For example, both assessments include five main content areas related to the major mathematical curricular areas of number, measurement, geometry, data, and algebra. Both frameworks also include dimensions that define a range of cognitive skills and processes, which overlap across the two assessments. However, closer examination at the item level (as in the two following sections) shows differences in operationalization of both the content (substantive focus) and item format. PISA also specifies a range of content expectations, but the framework is organized around overarching ideas (e.g., space and shape) versus curricular-based areas like geometry or algebra and with emphasis on the contexts in which mathematics is applied (e.g., in school, in society). Closer examination of PISA items in comparison with NAEP items makes these differences apparent, though it also shows where content is similar despite its different organization in the frameworks. The comparison of the NAEP 2000 and TIMSS 2003 science frameworks highlights more organizational differences than in mathematics. While the NAEP framework defines science content in terms of three broad fields of science (physical science, life science, and Earth science), the TIMSS framework is organized around five (also disciplinarily defined) content domains. Like NAEP, TIMSS identifies life science and Earth science as domains; however, it treats physical science differently (separating a physics domain from a chemistry domain) and also includes a separate domain for environmental science. Because of the small number of scientific literacy items in PISA 2003, these items were not included in the comparison study and will not be reflected in the discussion on science in the following two sections. At the framework level, however, PISA’s definition of the domain of science differs from NAEP and TIMSS in some of the same ways it did in the domain of mathematics. Content is defined in terms of themes (e.g., form and function, biodiversity) rather than disciplines, and the frameworks also specify, along with a process dimension, a context dimension (e.g., science in life and health, science in technology). One additional feature of both the mathematics and science frameworks for all three assessments is worth noting: they specify different item types (e.g., multiple choice or constructed response). In mathematics, about two-thirds of the NAEP and TIMSS assessments (in terms of percentages of items) are multiple choice, compared with one-third of the PISA assessment, which relies more heavily on constructed-response, or open-ended, items. In science, more differences are

6
apparent between NAEP and TIMSS. NAEP is roughly balanced between multiple choice and constructed response, while TIMSS has more multiple-choice items (about two-thirds). Item content Because PISA treats mathematics as a major domain in 2003 and includes many more mathematics items with which to compare with NAEP and TIMSS, this section and the next focus on mathematics. Comparisons of NAEP and TIMSS mathematics items show that at the level of broad content area, the assessments appear to be similar. Both NAEP and TIMSS have the highest proportion of items in the number content area; for both, the content area related to data reflects a relatively small proportion, particularly at the fourth grade. There also is a greater emphasis on algebra at the eighth grade than at the fourth grade in both assessments. Although the correspondence between NAEP and PISA content areas was not as strong as between NAEP and TIMSS, there was considerable overlap between the PISA overarching idea of uncertainty and the NAEP content area of data analysis, statistics, and probability, as well as between space and shape in PISA and measurement and geometry and spatial sense in NAEP. Overall, PISA has a greater focus on data (40 percent) and less focus on algebra (11 percent) than the eighth-grade assessments in NAEP (15 percent and 25 percent respectively) or TIMSS (11 percent and 23 percent respectively). In the comparison studies, NAEP and TIMSS mathematics items were classified to each other’s assessment frameworks in terms of content topics and subtopics in order to allow comparisons across the assessments. Differences emerge with a more detailed examination of the degree to which the items from one assessment map to the subtopics specified within content areas on the other assessment. About 20 percent of fourth-grade items and 15 percent of eighth-grade items from each assessment could not be classified to a subtopic in the other’s framework. This indicates that both NAEP and TIMSS contain items that might not be included in the other assessment. The PISA items, on the other hand, have a higher level of content match with NAEP, with less than 10 percent not classified to subtopics in that framework. Another analysis compared the grade level alignment of individual items, by examining which grade on the other assessment’s framework the items were mapped to (grade match). In general, TIMSS items match to the corresponding grade level on the NAEP framework more often than NAEP items match to the corresponding grade in TIMSS: 90 percent or more for fourth- and eighth-grade TIMSS items compared to over 80 and 70 percent for fourth- and eighth-grade NAEP items, respectively. This differed greatly across the content areas, however. For example, the measurement and geometry content areas accounted for most of the TIMSS items classified at a different grade level on the NAEP framework. PISA items were found to correspond most closely with the NAEP eighth-grade framework.
7
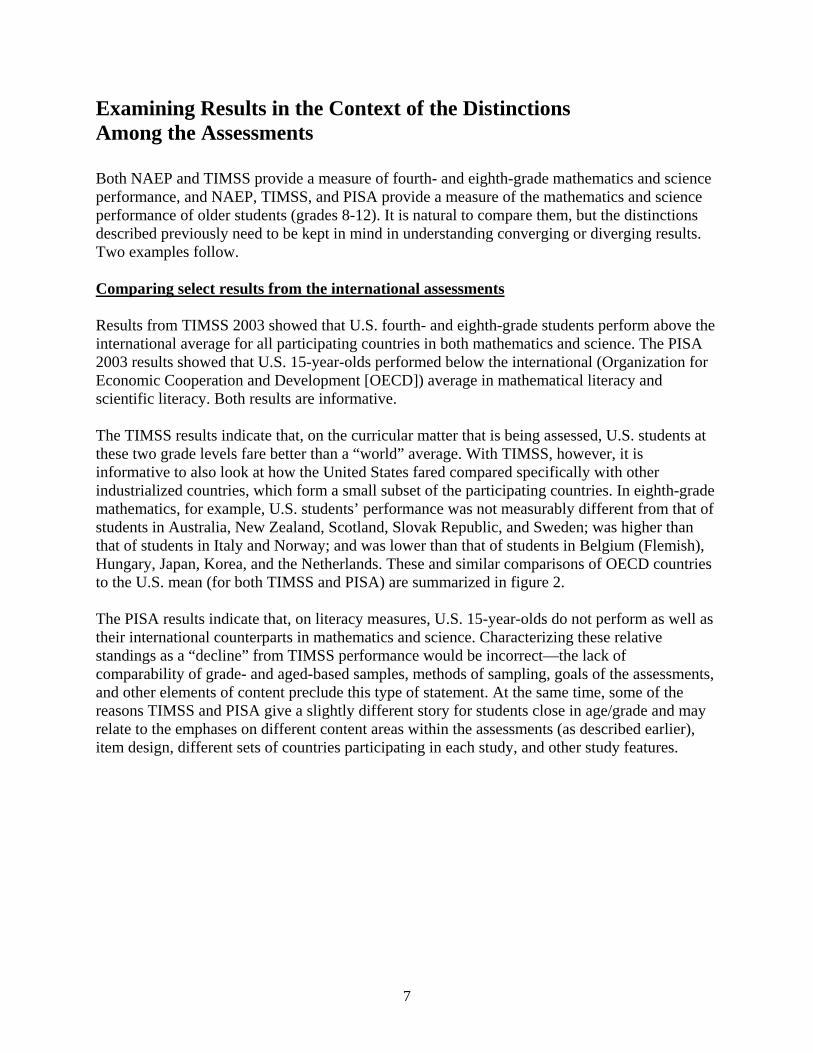
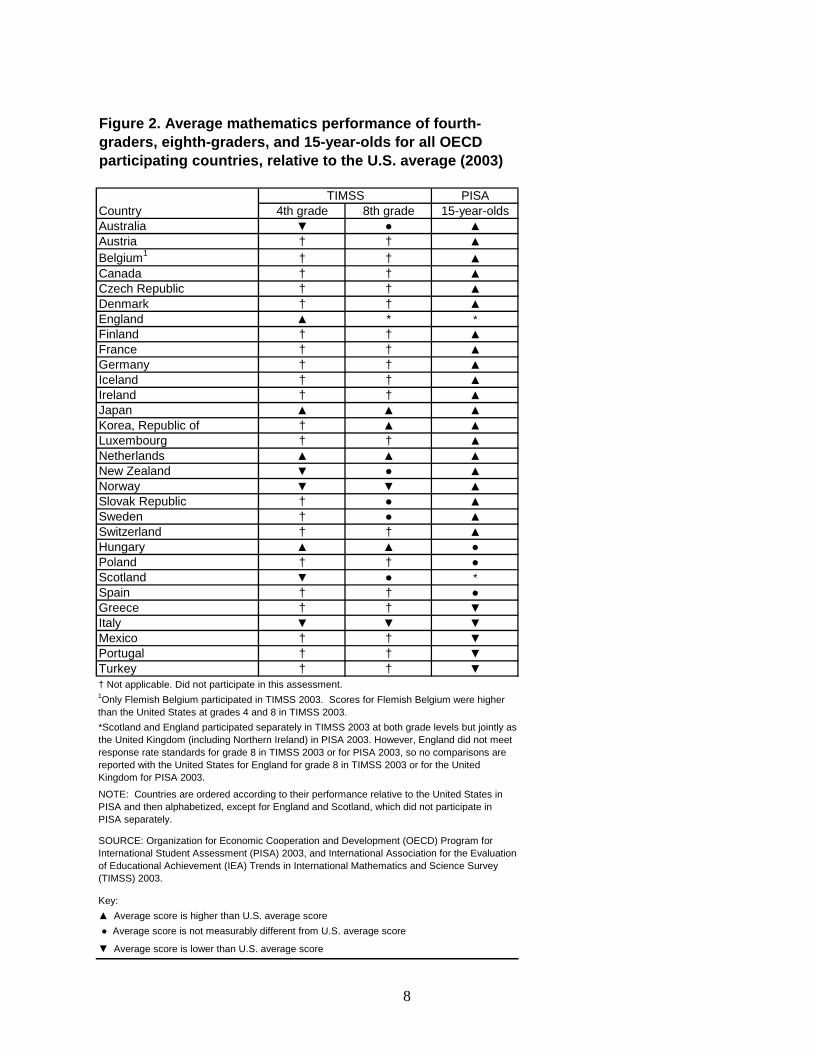
Examining Results in the Context of the Distinctions Among the Assessments Both NAEP and TIMSS provide a measure of fourth- and eighth-grade mathematics and science performance, and NAEP, TIMSS, and PISA provide a measure of the mathematics and science performance of older students (grades 8-12). It is natural to compare them, but the distinctions described previously need to be kept in mind in understanding converging or diverging results. Two examples follow. Comparing select results from the international assessments Results from TIMSS 2003 showed that U.S. fourth- and eighth-grade students perform above the international average for all participating countries in both mathematics and science. The PISA 2003 results showed that U.S. 15-year-olds performed below the international (Organization for Economic Cooperation and Development [OECD]) average in mathematical literacy and scientific literacy. Both results are informative. The TIMSS results indicate that, on the curricular matter that is being assessed, U.S. students at these two grade levels fare better than a “world” average. With TIMSS, however, it is informative to also look at how the United States fared compared specifically with other industrialized countries, which form a small subset of the participating countries. In eighth-grade mathematics, for example, U.S. students’ performance was not measurably different from that of students in Australia, New Zealand, Scotland, Slovak Republic, and Sweden; was higher than that of students in Italy and Norway; and was lower than that of students in Belgium (Flemish), Hungary, Japan, Korea, and the Netherlands. These and similar comparisons of OECD countries to the U.S. mean (for both TIMSS and PISA) are summarized in figure 2. The PISA results indicate that, on literacy measures, U.S. 15-year-olds do not perform as well as their international counterparts in mathematics and science. Characterizing these relative standings as a “decline” from TIMSS performance would be incorrect—the lack of comparability of grade- and aged-based samples, methods of sampling, goals of the assessments, and other elements of content preclude this type of statement. At the same time, some of the reasons TIMSS and PISA give a slightly different story for students close in age/grade and may relate to the emphases on different content areas within the assessments (as described earlier), item design, different sets of countries participating in each study, and other study features.
8
PISA4th grade 8th grade 15-year-olds
Australia ▼ ● ▲Austria † † ▲Belgium1 † † ▲Canada † † ▲Czech Republic † † ▲Denmark † † ▲England ▲ * *Finland † † ▲France † † ▲Germany † † ▲Iceland † † ▲Ireland † † ▲Japan ▲ ▲ ▲Korea, Republic of † ▲ ▲Luxembourg † † ▲Netherlands ▲ ▲ ▲New Zealand ▼ ● ▲Norway ▼ ▼ ▲Slovak Republic † ● ▲Sweden † ● ▲Switzerland † † ▲Hungary ▲ ▲ ●Poland † † ●Scotland ▼ ● *Spain † † ●Greece † † ▼Italy ▼ ▼ ▼Mexico † † ▼Portugal † † ▼Turkey † † ▼† Not applicable. Did not participate in this assessment.
Key:
● Average score is not measurably different from U.S. average score
▼ Average score is lower than U.S. average score
Figure 2. Average mathematics performance of fourth-graders, eighth-graders, and 15-year-olds for all OECD participating countries, relative to the U.S. average (2003)
*Scotland and England participated separately in TIMSS 2003 at both grade levels but jointly as the United Kingdom (including Northern Ireland) in PISA 2003. However, England did not meet response rate standards for grade 8 in TIMSS 2003 or for PISA 2003, so no comparisons are reported with the United States for England for grade 8 in TIMSS 2003 or for the United Kingdom for PISA 2003.
SOURCE: Organization for Economic Cooperation and Development (OECD) Program for International Student Assessment (PISA) 2003, and International Association for the Evaluation of Educational Achievement (IEA) Trends in International Mathematics and Science Survey (TIMSS) 2003.
▲ Average score is higher than U.S. average score
NOTE: Countries are ordered according to their performance relative to the United States in PISA and then alphabetized, except for England and Scotland, which did not participate in PISA separately.
1Only Flemish Belgium participated in TIMSS 2003. Scores for Flemish Belgium were higher than the United States at grades 4 and 8 in TIMSS 2003.
TIMSSCountry

9
Comparing select results from NAEP and TIMSS The most recent results from both NAEP and TIMSS include information on trends over time in the United States: between 1996 and 2003 for mathematics in NAEP; between 1996 and 2000 in science for NAEP; and between 1995 and 2003 in mathematics and science for TIMSS—with intervening assessments in NAEP mathematics and TIMSS as well. In mathematics, TIMSS 2003 shows that statistically there is no change in U.S. fourth-grade students’ average scores between 1995 and 2003. This contrasts with NAEP results, which show an improvement in the average mathematics scores of fourth-grade students over roughly the same period (1996 to 2003). However, although the populations in NAEP and TIMSS are the same, as the previous section highlighted, there are some differences in the content of the assessments: about one-fifth of items from each assessment do not correspond well to the other assessment’s framework, which could explain these differences in part. Perhaps also the nature of NAEP as a national instrument may make it somewhat more sensitive to picking up changes in the performance of U.S. students early in their school careers and over relatively short time periods. At the eighth-grade level, both NAEP and TIMSS identify an improvement in the performance of U.S. students over the respective periods. In the eighth-grade, there is more overlap in the content of the two assessments—which may explain the similarities in the results, with U.S. eighth-graders doing better in mathematics in 2003 than in the mid-1990s. In science, both TIMSS and NAEP show no change in fourth-grade students’ average scores over the two periods. Though there are differences in content between the two assessments at this grade level, these results show that U.S. students performed consistently in each assessment. At the eighth-grade level, TIMSS 2003 reports an increase in U.S. students’ science scores since 1995. The NAEP trend line, from 1996 to 2000, shows no change. However, a closer examination of the TIMSS trend line, which also has a data point for 1999, shows that the two assessments’ results are actually not dissimilar when considering similar periods. The change in U.S. students’ performance since 1995 reported in TIMSS is largely from improvements from 1999 to 2003, as TIMSS showed no change in science performance between 1995 and 1999. Conclusions In sum, there appears to be an advantage in capitalizing on the complementary information presented in national and international assessments. The NAEP assessment measures in detail the mathematics and science knowledge of U.S. students as a whole. NAEP also can provide information for different geographic regions and demographic population groups. The international assessments, PISA and TIMSS, provide a method for comparing our performance in the United States to the performance of students in other nations. Because of their international cooperative nature, they provide information on additional and different facets of mathematics and science performance than NAEP. Considering NAEP results in the context of TIMSS and PISA provides an important international perspective and allows us to reflect both on how well our students know what we believe they should know and on where we stand among other nations.

10
Contact information Elois Scott Director, International Activities Program National Center for Education Statistics U.S. Department of Education 1990 K Street, NW Washington, DC 20006 Tel: 202-502-7489 [email protected] Useful websites NAEP http://nces.ed.gov/nationsreportcard TIMSS http://isc.bc.edu (international) http://nces.ed.gov/timss (national) PISA http://www.pisa.oecd.org (international)
http://nces.ed.gov/surveys/pisa (national) 1 TIMSS is conducted under the auspices of the International Association for the Evaluation of Educational Achievement (IEA). PISA is sponsored by the Organization for Economic Cooperation and Development (OECD). 2 All statements about NAEP in this paper refer to national NAEP (versus state or long-term trend NAEP). NAEP currently assesses fourth- and eighth-grade mathematics on a 2-year cycle and twelfth-grade mathematics on a 4-/5- year cycle. It assesses all three grades of science on a 4-/5-year cycle. TIMSS is on a 4-year cycle and PISA is on a 3-year cycle. 3 See
(a) For results from TIMSS: Gonzales, P., Guzmán, J.C., Partelow, L., Pahlke, E., Jocelyn, L., Kastberg, D., and Williams, T. (2004). Highlights From the Trends in International Mathematics and Science Study (TIMSS) 2003 (NCES 2005-005). U.S. Department of Education. Washington, DC: National Center for Education Statistics.
(b) For results from PISA: Lemke, M., Sen, A., Pahlke, E., Partelow, L., Miller, D., Williams, T., Kastberg, D., and Jocelyn, L. (2004). International Outcomes of Learning in Mathematics Literacy and Problem Solving: PISA 2003 Results From the U.S. Perspective (NCES 2005-003). U.S. Department of Education. Washington, DC: National Center for Education Statistics.
(c) For results from fourth- and eighth-grade NAEP mathematics: Braswell, J., Daane, M., and Grigg, W. (2004). The Nation’s Report Card: Mathematics Highlights 2003 (NCES 2004-451). U.S. Department of Education. Washington, DC: National Center for Education Statistics.
(d) For results from twelfth-grade NAEP mathematics: Santapau, S.L. (2001). The Nation’s Report Card: Mathematics Highlights 2000 (NCES 2001-518). U.S. Department of Education. Washington, DC: National Center for Education Statistics
(e) For results from NAEP science: National Center for Education Statistics (2002). The Nation’s Report Card: Science 2000 (NCES 2002-452). U.S. Department of Education. Washington, DC: National Center for Education Statistics.

11
4 A separate analysis comparing the reading assessments of NAEP 2003 and PISA 2000 is forthcoming and is not discussed in this paper. 5 The 46 countries will have publishable results for TIMSS 2003. In PISA 2003, although 41 countries participated, because 1 country did not meet the international requirements for response rates, comparisons are available for 40 countries. 6 See
(a) Neidorf, T.S., Binkley, M., Gattis, K. and Nohara, D. (forthcoming). A Content Comparison of the National Assessment of Educational Progress (NAEP), Trends in International Mathematics and Science Study (TIMSS), and Program for International Student Assessment (PISA) 2003 Mathematics Assessments (NCES 2005-112). U.S. Department of Education. Washington, DC: National Center for Education Statistics.
(b) Neidorf, T.S., Binkley, M., and Stephens, M. (forthcoming). A Content Comparison of the National Assessment of Educational Progress (NAEP) 2000 and Trends in International Mathematics and Science Study (TIMSS) 2003 Science Assessments (NCES 2005-106). U.S. Department of Education. Washington, DC: National Center for Education Statistics.