
My Master’s Work Richa Tiwari. Outline of the talk Analysis of Phylogeny Tree Evaluation...
73
My Master ’ s Work Richa Tiwari
-
Upload
patrick-holmes -
Category
Documents
-
view
214 -
download
0
Transcript of My Master’s Work Richa Tiwari. Outline of the talk Analysis of Phylogeny Tree Evaluation...

My Master’s Work
Richa Tiwari

Outline of the talk
Analysis of Phylogeny Tree Evaluation Approaches (Project done in CS641).
Proteomics and 2-D Gel Electrophoresis (Study done for CS)
Coexpression analysis of dimerization between bZIP proteins in groups C, S1 and S2 in Arabidopsis Thaliana, under the conditions of differential light and CO2 levels (Project done for BST676).

Analysis of Phylogeny Tree
Evaluation Approaches
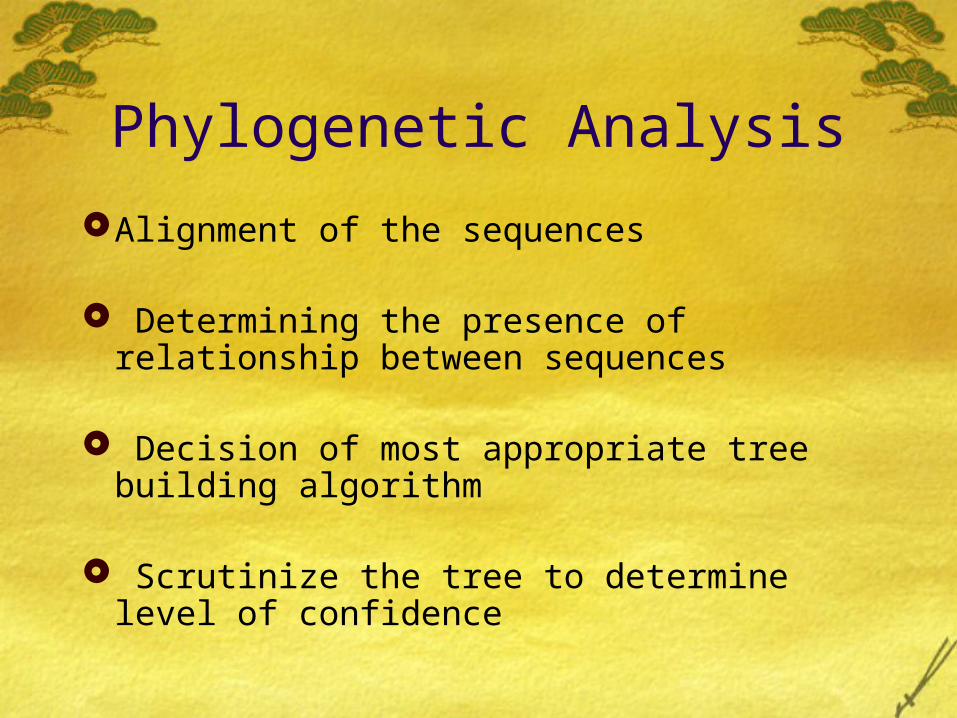
Phylogenetic Analysis
Alignment of the sequences
Determining the presence of relationship between sequences
Decision of most appropriate tree building algorithm
Scrutinize the tree to determine level of confidence

Algorithmic Method Defines an algorithm that leads to the
determination of a tree.
Criteria Based MethodDefines a criterion for comparing different
phylogenies and therefore phylogenies can be ranked, and comparison possible.
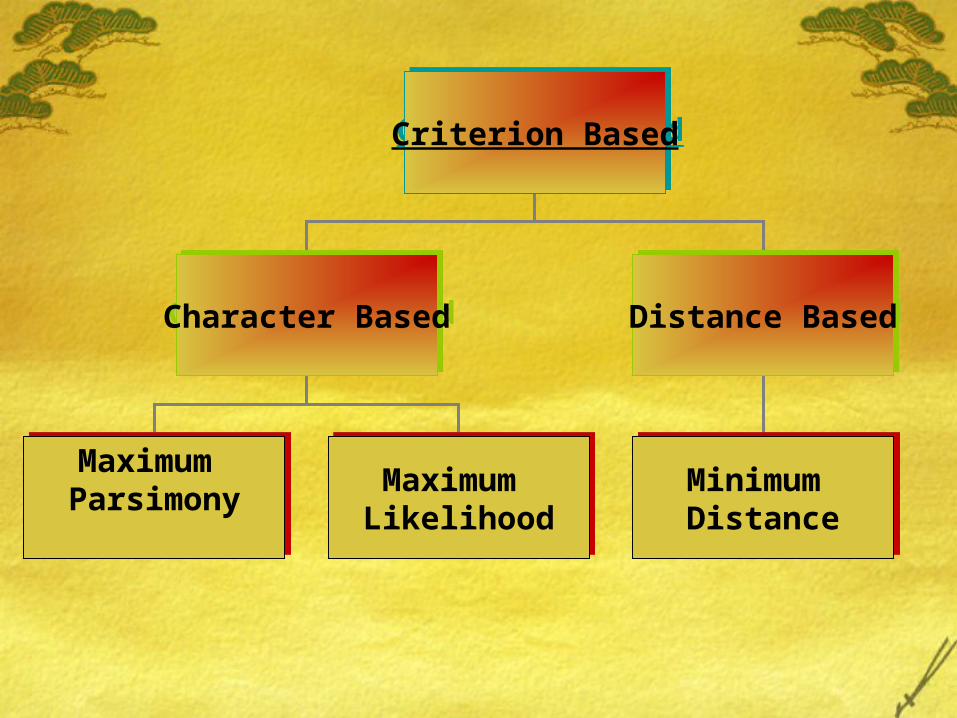
Criterion BasedCriterion Based
Character BasedCharacter Based Distance BasedDistance Based
Maximum ParsimonyMaximum Parsimony
Minimum Distance
Minimum Distance
Maximum LikelihoodMaximum Likelihood

Maximum Parsimony Method
“Most parsimonious tree will explain the observed character distribution with a tree that have the minimum tree length.”
Tree selection criterion - Minimum tree length
(Fewest character state transformation)

Maximum Likelihood (ML)
ML evaluates the probability that the chosen evolutionary model will have generated the observed sequences.
Evolutionary Model: Accounts for the changes in sequences.
Phylogenies are then inferred by finding those trees that yield the highest likelihood.
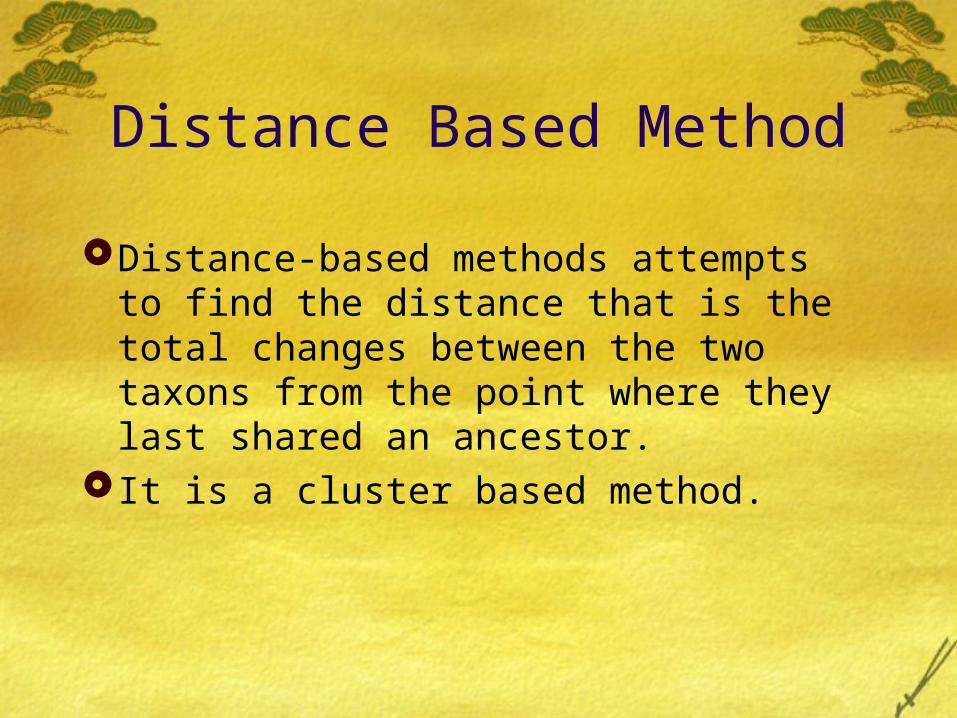
Distance Based Method
Distance-based methods attempts to find the distance that is the total changes between the two taxons from the point where they last shared an ancestor.
It is a cluster based method.

Software used….
PHYLIP To compare the three phylogeny methods.
Programs used from the package are:Maximum Parsimony: DNAPARSMaximum Likelihood DNAMLDistance-based DNADIST and NeighborTree constructed using : DRAWGRAMConsensus tree constructed using:
CONSENSUS

Maximum parsimony Maximum likelihood Distance Based
DNAPARS DNAML Neighbor
Using Sample data…

Consensus tree for given example… +------Human +--1.0-| | +------Orang +------| | | +------Rhesus | +--1.0-| | +------Gorilla | +--------------------Chimp
+-------------Orang +--1.0-| | | +------Chimp +------| +--1.0-| | | +------Human | | | +--------------------Rhesus | +---------------------------Gorilla
+------Human +--1.0-| +--1.0-| +------Chimp | | +------| +-------------Orang | | | +--------------------Rhesus | +---------------------------Gorilla
Parsimony Method Maximum Likelihood
Distance Based/Neighbor joining
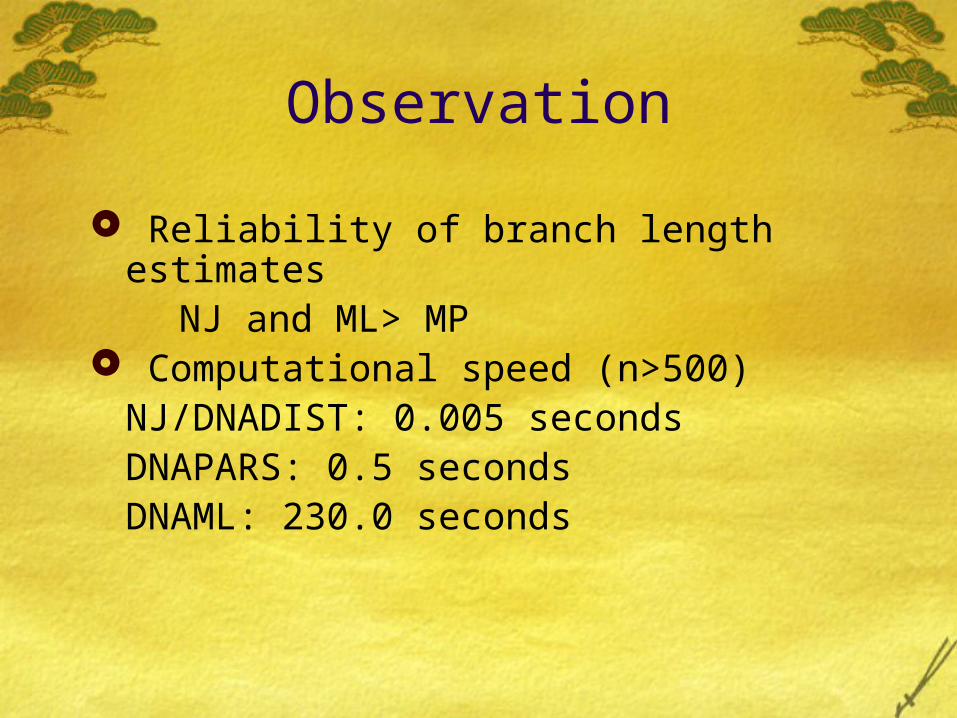
Observation
Reliability of branch length estimates NJ and ML> MP Computational speed (n>500)
NJ/DNADIST: 0.005 secondsDNAPARS: 0.5 secondsDNAML: 230.0 seconds

ConclusionOur experiments and the results obtained
indicate that the Distance Based method is better than the other two methods in terms of Fastness, Simplicity and good performance for high number of taxa.
Also we can say that if you have a fast computer and large dataset Maximum likelihood method is better than Maximum parsimony.
Proteomics and 2-D gel Electrophoresis
Introduction
The entire set of proteins expressed by the genome in a cell, organ or organism is referred to as the proteome.
Proteomics : Methods that discover and
quantify proteins and their biochemical changes.

Application of Proteomics
Protein Mining Network Mapping Mapping Protein Modifications
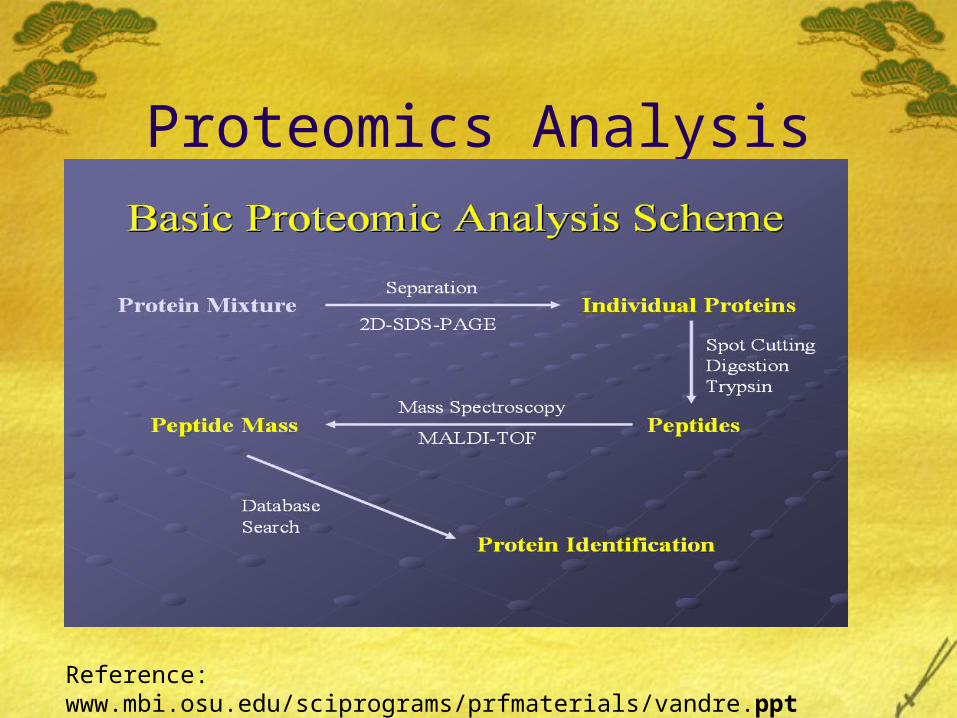
Proteomics Analysis
Reference: www.mbi.osu.edu/sciprograms/prfmaterials/vandre.ppt
2-D Gel Electrophoresis
The horizontal position tells us about the charge of a protein, whereas the intensity of the gel spot tells us about the amount of that protein in the system.
Steps-1. Prepare protein sample in solution2. Separate proteins (in each dimension)I. Based on pH Using isoelectric focusing (IEF) Using immobilized pH gradient (IPG) stripsII. Based on molecular weight (size) Using gel electrophoresis3. Stain proteins to enable visualization.
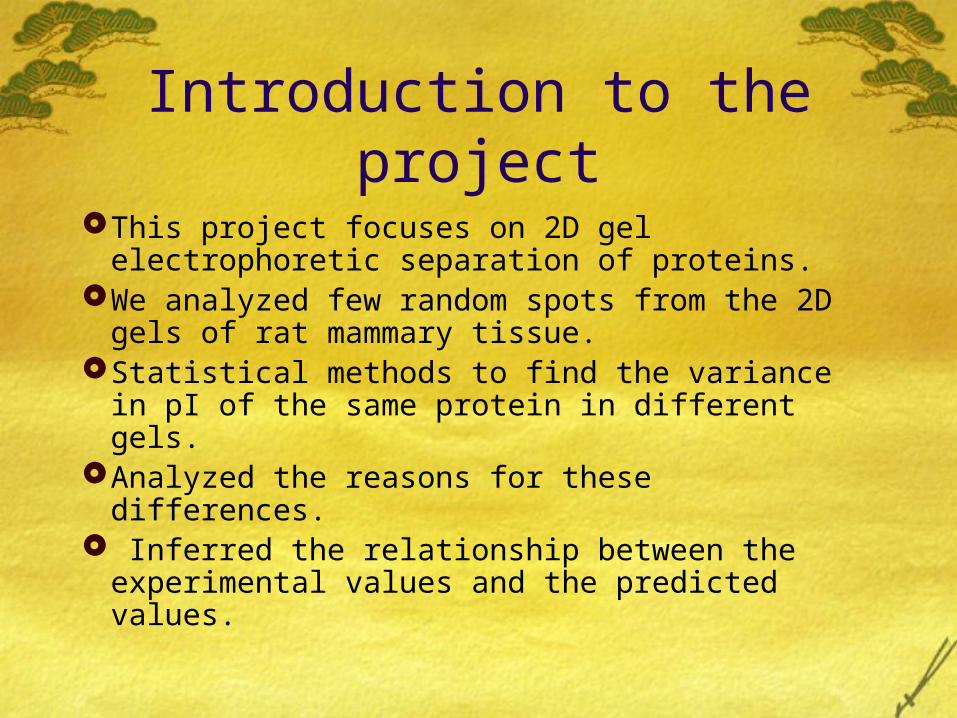
Introduction to the project
This project focuses on 2D gel electrophoretic separation of proteins.
We analyzed few random spots from the 2D gels of rat mammary tissue.
Statistical methods to find the variance in pI of the same protein in different gels.
Analyzed the reasons for these differences. Inferred the relationship between the
experimental values and the predicted values.
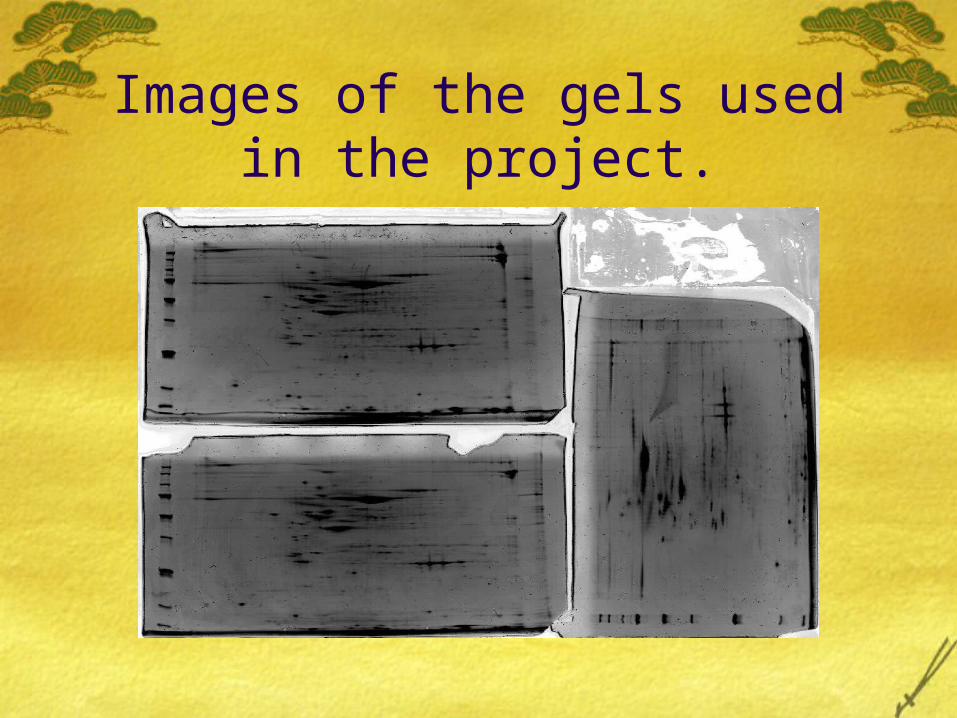
Images of the gels used in the project.
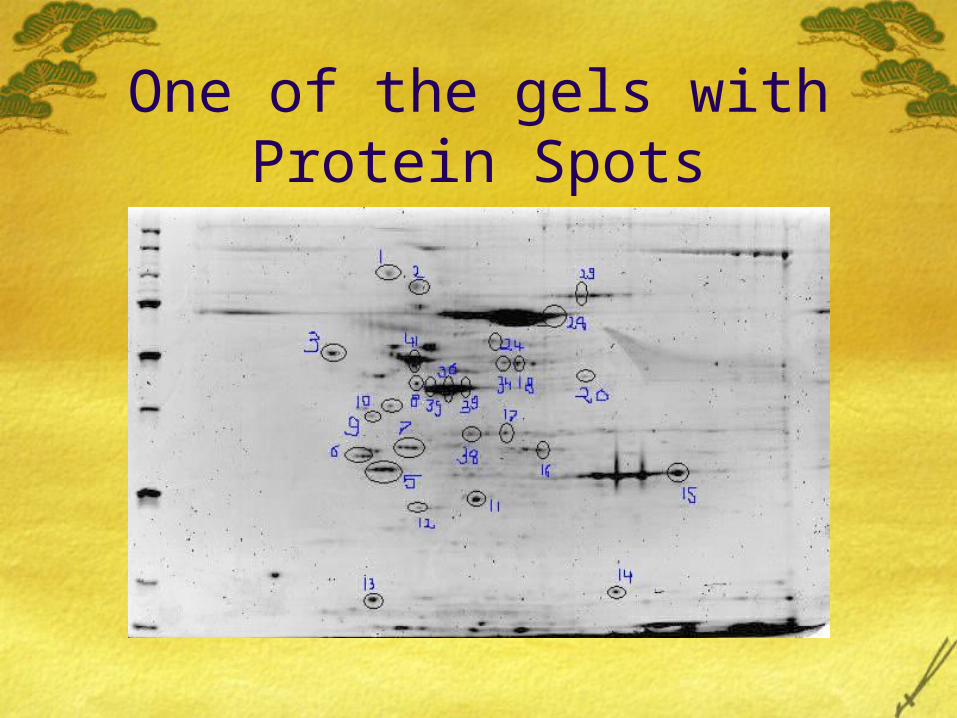
One of the gels with Protein Spots

The Gels we used were from an already done experiment. 28 Random protein spots were selected based on the their intensity from each of the three gels.
Mass Spectrometry Differentially expressed proteins identified by image analysis were excised from 2D gels and trypsin digested. The resulting peptide fragments were analyzed on a MALDI mass spectrometer (MS). The MALDI spectra displays a “peptide fingerprint” of the protein using corresponding peptide masses.
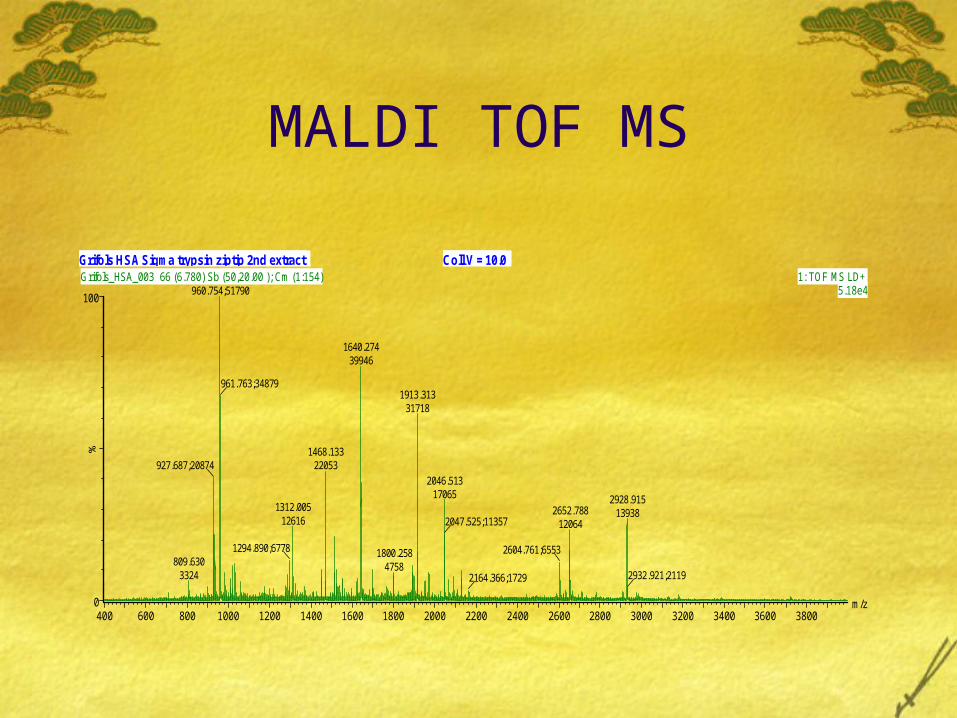
MALDI TOF MS
Coll V = 10.0Grifols HSA Sigma trypsin ziptip 2nd extract
m/z400 600 800 1000 1200 1400 1600 1800 2000 2200 2400 2600 2800 3000 3200 3400 3600 3800
%
0
100
Grifols_HSA_003 66 (6.780) Sb (50,20.00 ); Cm (1:154) 1: TOF MS LD+ 5.18e4960.754;51790
927.687;20874
809.6303324
1640.27439946
961.763;34879
1468.13322053
1312.00512616
1294.890;6778
1913.31331718
1800.2584758
2046.51317065 2928.915
139382652.788120642047.525;11357
2604.761;6553
2164.366;1729 2932.921;2119

Proteins were identified by entering the masses (ions from MALDI spectrum) of the peptides into a peptide mapping database. Some examples of such protein search engine are-
1. Mascot - very popular and also used in this project
2. Sequest3. Aldente4. ProteinLynx5. Phenyx

Image of a search data base
Results
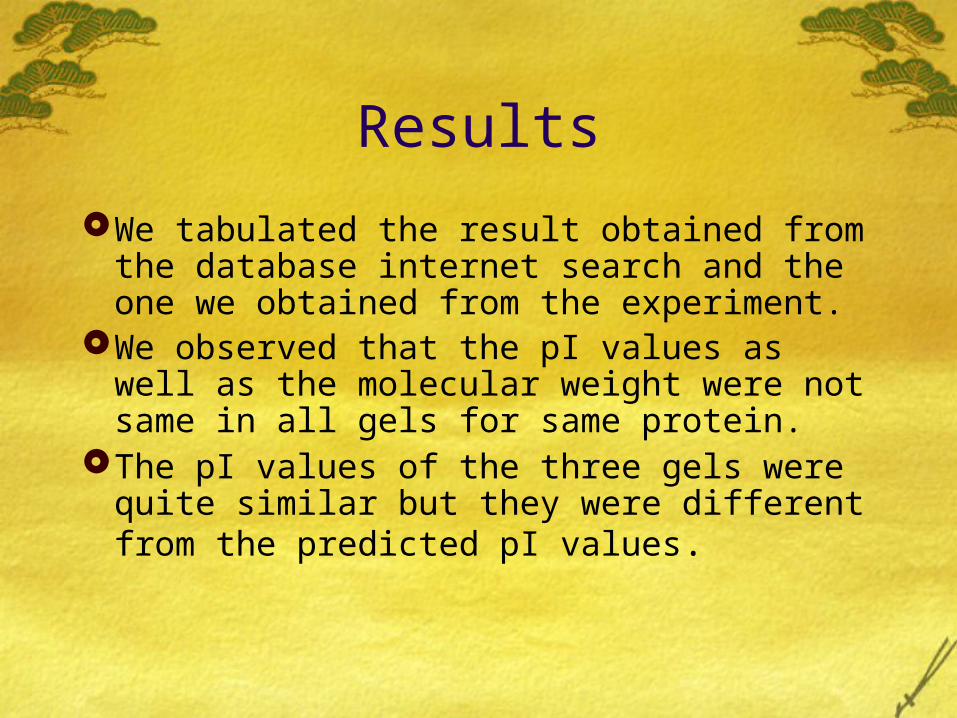
We tabulated the result obtained from the database internet search and the one we obtained from the experiment.
We observed that the pI values as well as the molecular weight were not same in all gels for same protein.
The pI values of the three gels were quite similar but they were different from the predicted pI values.

In a 2D gel the position of protein spot can change due to various reasons and because of which the molecular weight and pI values may also differ.
REASONS
Non Biological
Biological
Chemical

Graphical representation of pI values of three gels
pI values of the three Gels
0
1
2
3
4
5
6
7
Spots
Ob
se
rve
d p
I Gel12_3gel12_5gel5_6
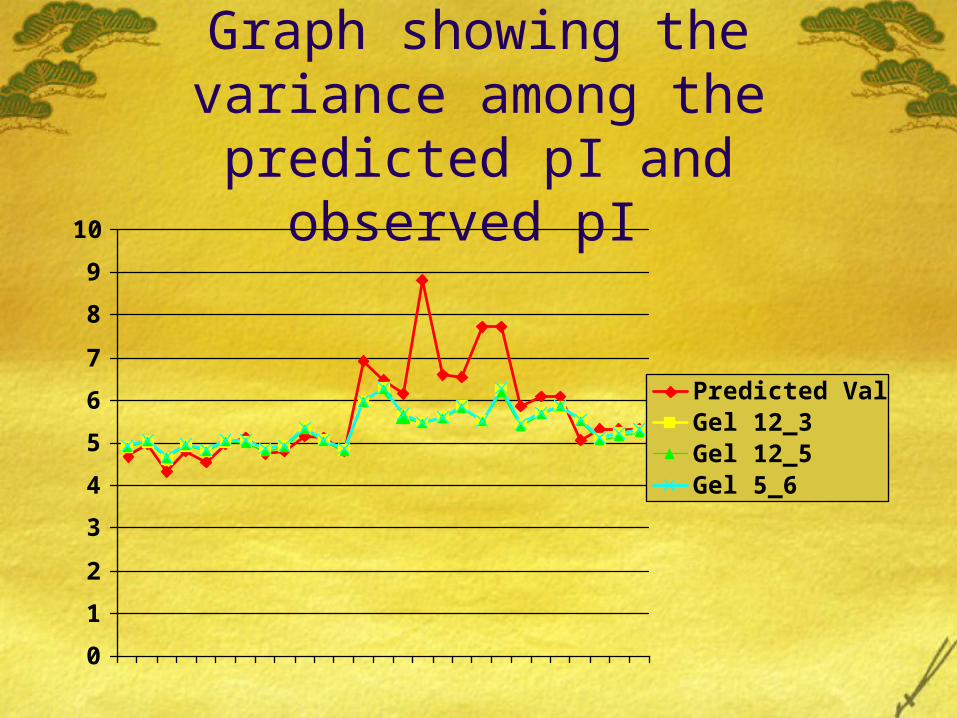
Graph showing the variance among the predicted pI and
observed pI
0
1
2
3
4
5
6
7
8
9
10
Predicted ValueGel 12_3Gel 12_5Gel 5_6

Observations We saw that the difference between the pI values of the three
gels that is the experimental values are not very different from each other.
So we can interpret that the difference due to non biological reason is very less in the experiment.
There were few protein spots for which internet search revealed the same result as same protein name. But our experiment gave different results which can be because of different group (like phosphate or sulphate) getting attached to it. There can be other reasons for it too.
Average deviations between the three observed proteins and the predicted pI values were calculated as –
{(pI (gel 12_5)- pred. pI) + (pI (gel 12_5)- pred. pI) + (pI (gel 12_5)- pred. pI)} / 3
This gave the results shown in the next slide. We obtained positive as well as negative values for the deviations.
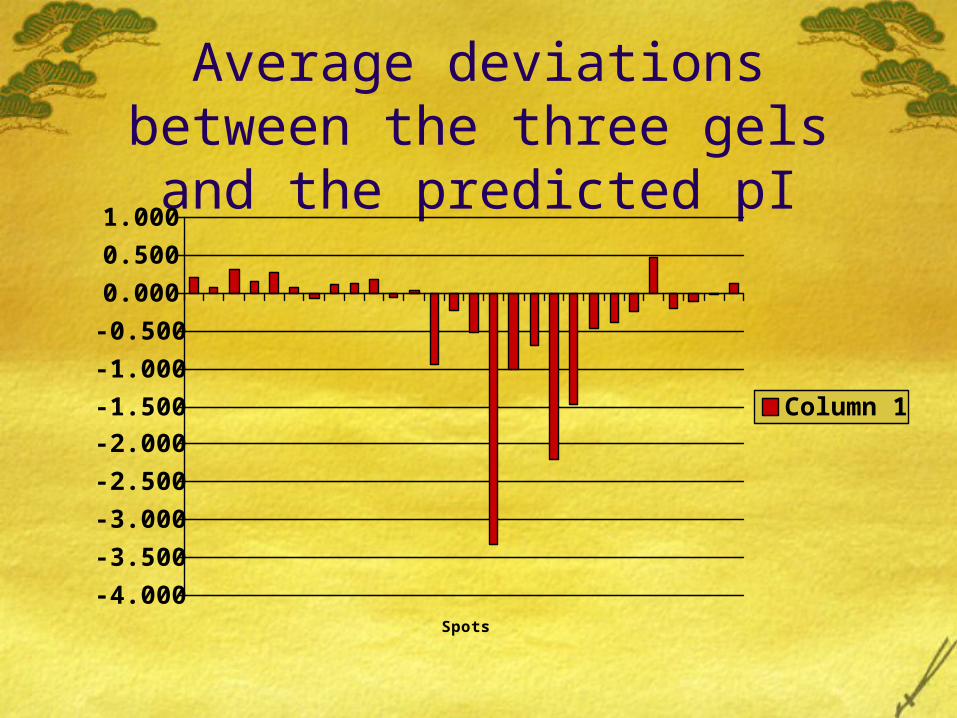
Average deviations between the three gels and the
predicted pI
-4.000
-3.500
-3.000
-2.500
-2.000
-1.500
-1.000
-0.500
0.000
0.500
1.000
Spots
Ave
rag
e d
evia
tio
n in
pI
Column 1

We can interpret that the proteins were modified more by negatively charged group such that there pI values decreased.
The addition of one phosphate groups to serine, threonine, and tyrosine residues typically decreases their isoelectric points by 0.1 pH unit.

Regression results
A statistical analysis test was performed to determine which of the three gels were closest to the predicted pI values. That is in which of the three gels had the proteins being least modified.
The test was Clibration test. We prepared a regression model for each gel. The inverse regression equation used was –
Predicted pI = {Observed pI from Gel – Intercept } slope
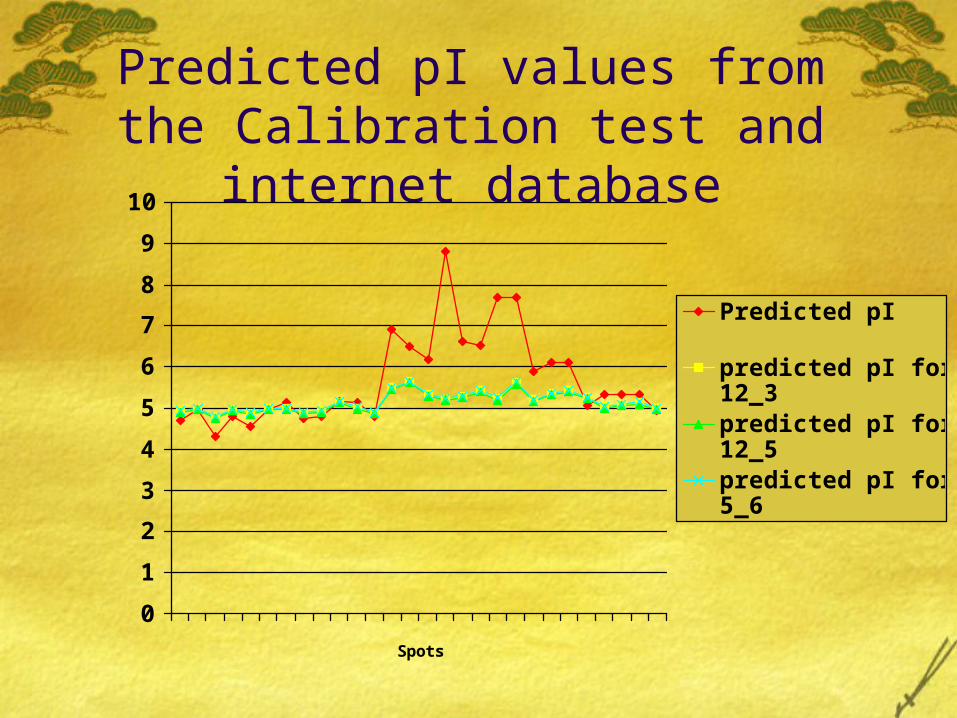
Predicted pI values from the Calibration test and internet
database
0
1
2
3
4
5
6
7
8
9
10
Spots
pI
Predicted pI
predicted pI for gel12_3predicted pI for gel12_5predicted pI for gel5_6

The result we obtained showed us that all the three gels predicted almost same pI values and they were quite away from the original predicted pI values.
All these similarities between the three gels show us that the difference between the pI values of proteins between the predicted and the experimented values is not very much because of non biological factors, but because of chemical modifications in the proteins.
Coexpression analysis of dimerization between bZIP
proteins in groups C, S1 and S2 in Arabidopsis Thaliana, under the
conditions of differential light and CO2 levels.
IntroductionTranscription factor
Transcription factor are proteins involved in the regulation of gene expression, that bind to promoter region upstream of genes.
They are composed of two essential functional regions:DNA binding domain – It binds to DNA.Activator Domain – It interacts with other regulatory proteins there by affecting the efficiency of DNA binding.

bZIP proteinsbZIP proteins are a class of transcription
factor which has leucine zipper motif consisting of a periodic repetition of a leucine residue at every seventh position forming an alpha-helical confirmation.
The segment that comprises the basic region and the periodic array of leucine residues is referred to as ‘basic-region leucine zipper’ or bZIP motif.

Some facts
There are 792 bZIP proteins recorded in nonredundant database.
The no of bZIP proteins in the cell of selected organisms are as follows
yeast – 16fruitfly – 110plant (Arabidopsis thaliana) – 75
Human - 114
Arabidopsis
The Arabidopsis genome sequence contains 75 distinct members of the bZIP family, of which ~50 of them are not well studied.
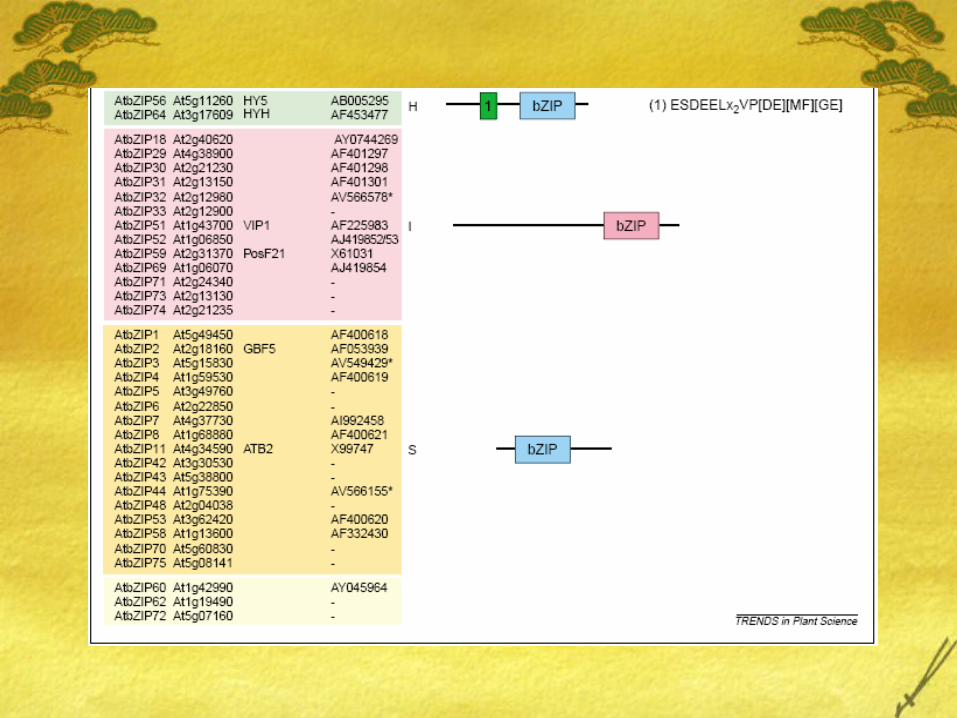
Using common domains the bZIP family can be subdivided into 10 groups: Groups A - S.


C & S protein interactionElhert et al measured
interactions between C and S proteins.
C and S1 heterodimerized
Two S2 proteins dimerized.
Fusion of bZIP proteins (dimers) to DNA-binding domain of transcriptional activator
GAL4|
▼Expression in Yeast
|▼
Quantification of transcription activation of lacZ reporter gene via β-galactosidase assays
|▼
Yeast Two-Hybrid System: detection of Heterodimers by prototrophic growth (yeast
strains on plates w/out uracil
▼Quantification of protein-protein interaction by
measuring lacZ activity

Effect of Light & CO2 on C & S proteins
Carbohydrate signalingIncrease of carbohydrate partitioning in elevated CO2, and a decrease in low light.
Seed developmentPhotosensory system detects the quality, quantity, direction and duration of light. Controls developmental pattern.
StressLight dependent generation of active oxygen species is a type of stress called photo oxidative stress.

Experiment Selection Criteria
a) Chose C and S bZIP proteins Coexpression Engine: http://www.ssg.uab.edu/coexpression
b) Selected tissue and array type
c) Chose specific experiment
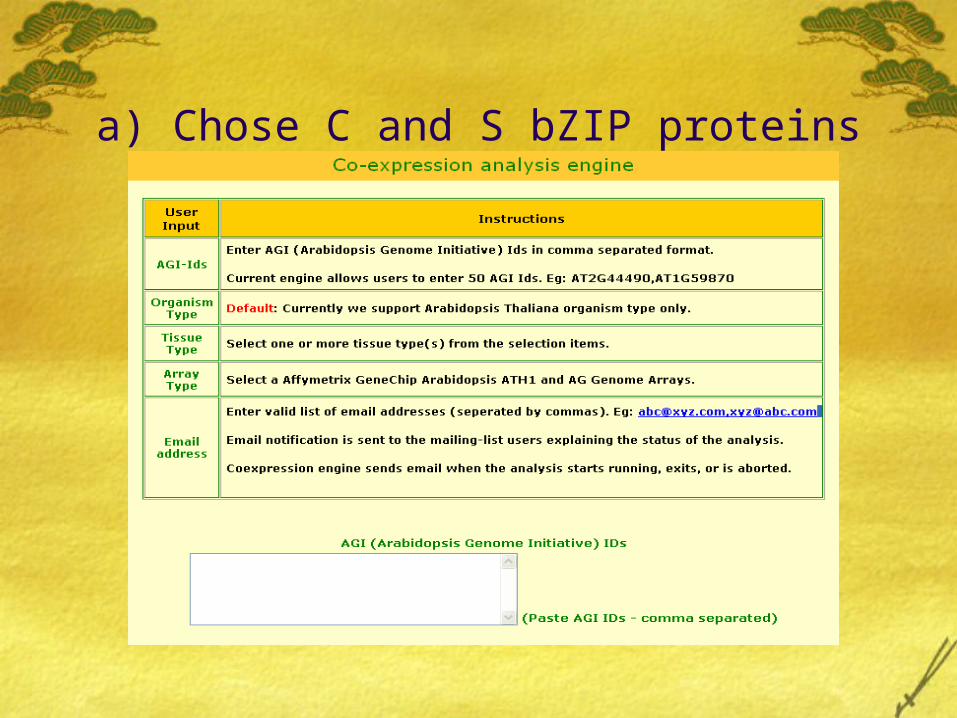
a) Chose C and S bZIP proteins
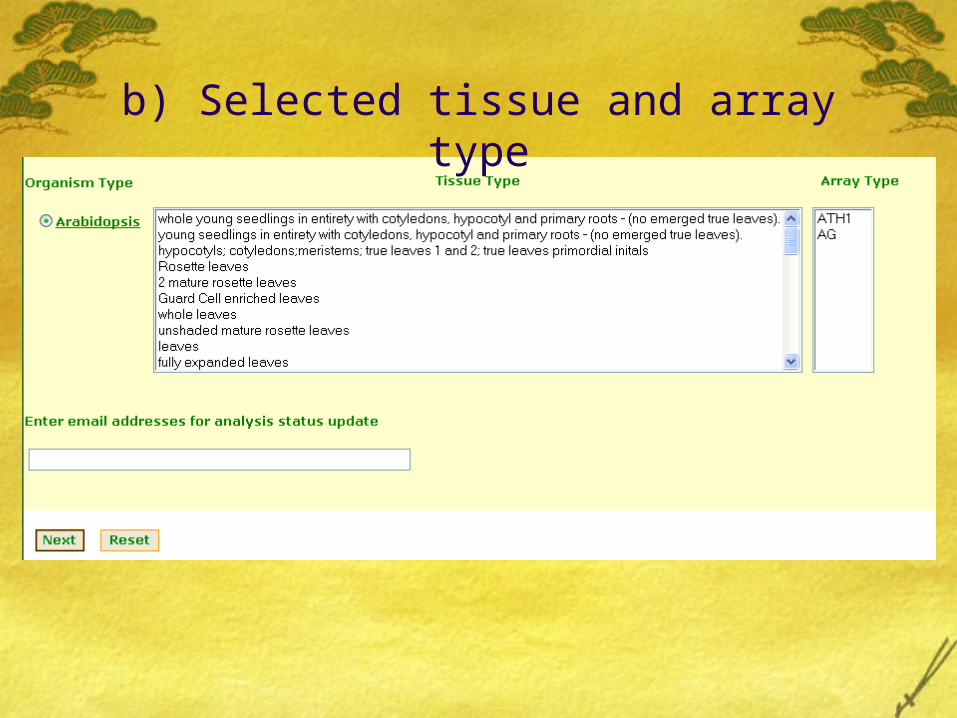
b) Selected tissue and array type

c) Chose specific experiment
NASC Experiments
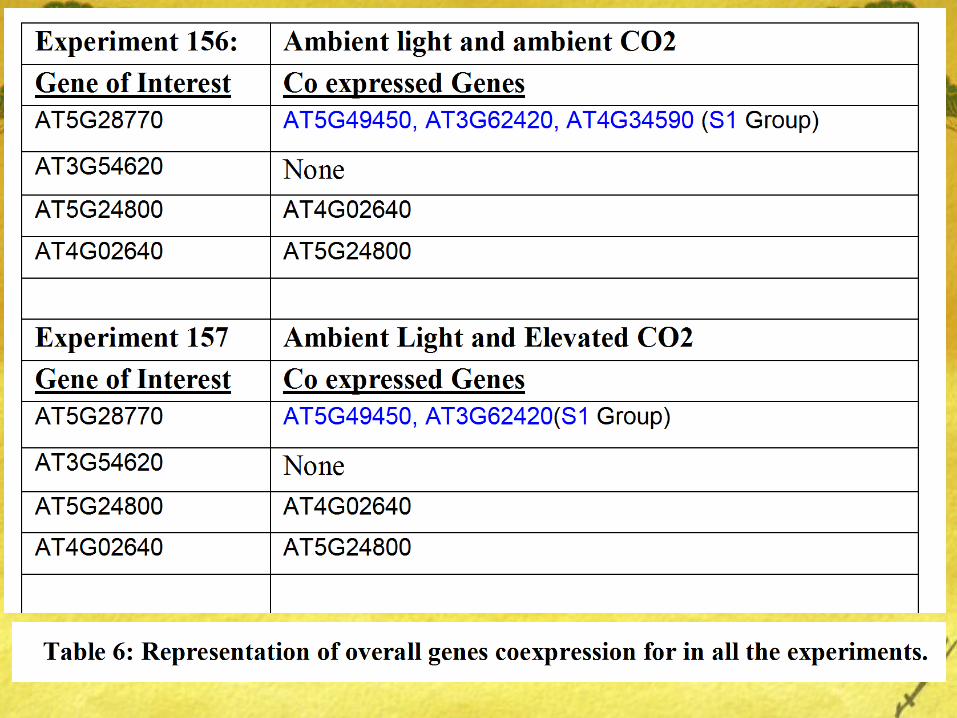
NASC__156 (Treatment 1: Ambient CO2 and Ambient Light)
Controls
NASC__157 (Treatment 2: Elevated CO2 and Ambient Light)
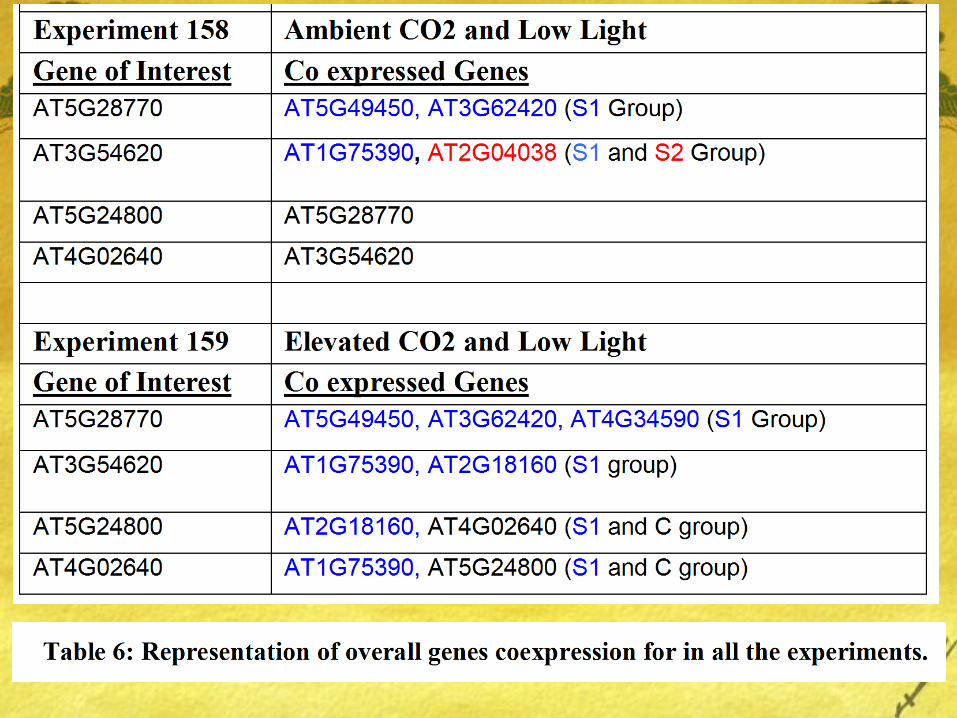
NASC__158 (Treatment 3: Ambient CO2 and Low Light)
NASC__159 (Treatment 4: Elevated CO2 and Low Light)
Justification1. Biologically feasible comparisons due to
similar: Tissue types Experiment conditions
2. Statistical: Measurement protocol

The tool used
Co-expression Analysis Tool, version 2.0 developed at the Section on Statistical Genetics, UAB http://obiwan.ssg.uab.edu:8080/coexpression/servlets/CoexpReleasesResponseManager
mainly built to analyze the co-expression in Arabidopsis plant.
NASC Experiments to study affymetrix gene chip profiling of light and CO2 effect in leaf development in Arabidopsis used.

Uses the database built from Nottingham Arabidopsis Stock Center (NASC) AffyWatch Service.
Version 2 used in this project contains total of 566 microarray chips out of which 486 ATH1 micro array chips were used.
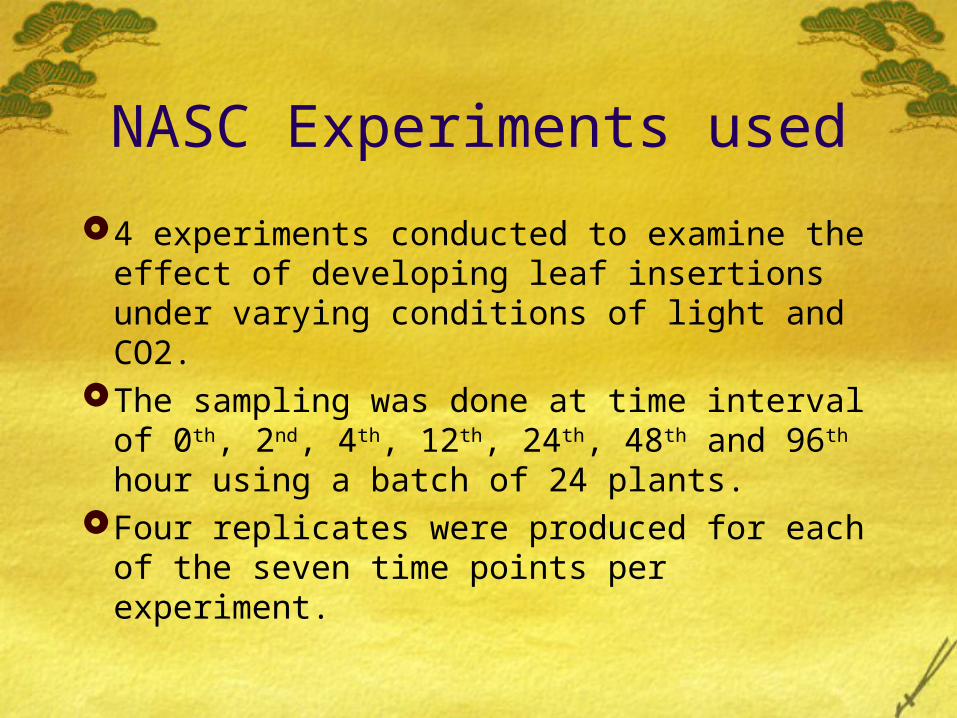
NASC Experiments used
4 experiments conducted to examine the effect of developing leaf insertions under varying conditions of light and CO2.
The sampling was done at time interval of 0th, 2nd, 4th, 12th, 24th, 48th and 96th hour using a batch of 24 plants.
Four replicates were produced for each of the seven time points per experiment.

Working of the tool
Linear regression analysis is done on the probe sets.
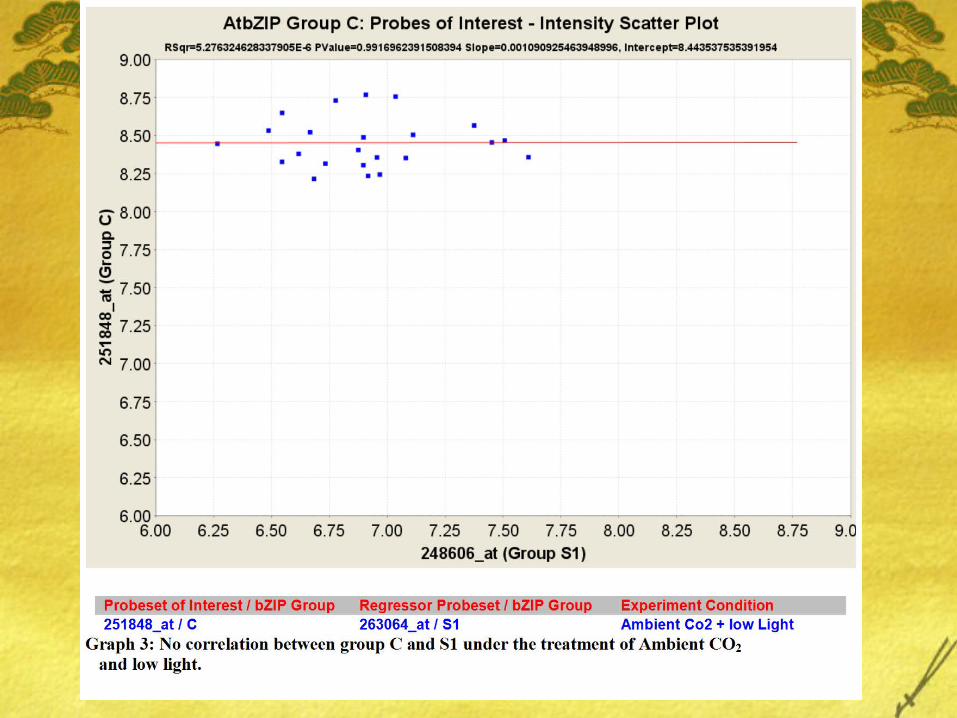
Result of regression gives three important values- slope parameter (indicating the direction of co-expression), p-value (stating the confidence in the correlation) and R squared values (strength of correlation).

Procedure
4 genes of C group, 5 genes of S1 group and 3 genes of S2 group were studied in the project.
We submit the AGI IDs, the tissue type (here leaf) and the experiment number (in our case 156, 157 158 and 159) in the tool.
Our genes of interest are regressed on all the 22,810 ATH1 probe sets and a p-value, R squared value and slope parameter is obtained.

Those genes were subsequently sorted according to the R squared value and p-value and ranked such that –
Higher the R squared value, higher is the rank.
An arbitrary cut-off 15% of the top ranked genes were identified as highly co-expressed.
Hypothesis
Genes coding for dimerizing proteins should be coexpressed at the same time.
If genes in group C and S1 lead to heterodimerization then they should be coexpressed at the same time.
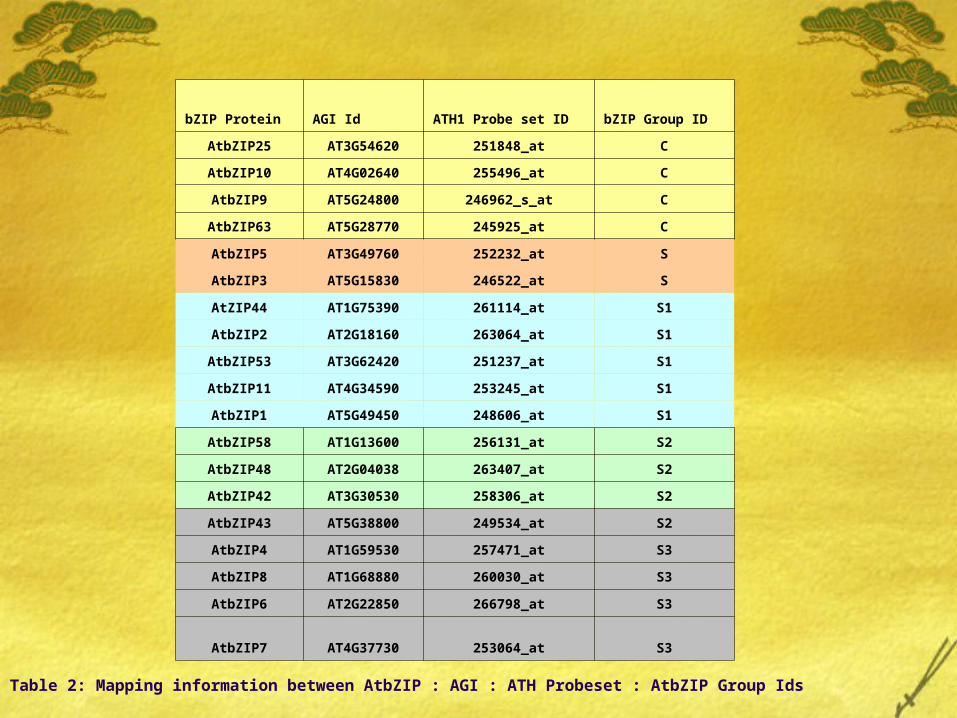
bZIP Protein AGI Id ATH1 Probe set ID bZIP Group ID
AtbZIP25 AT3G54620 251848_at C
AtbZIP10 AT4G02640 255496_at C
AtbZIP9 AT5G24800 246962_s_at C
AtbZIP63 AT5G28770 245925_at C
AtbZIP5 AT3G49760 252232_at S
AtbZIP3 AT5G15830 246522_at S
AtZIP44 AT1G75390 261114_at S1
AtbZIP2 AT2G18160 263064_at S1
AtbZIP53 AT3G62420 251237_at S1
AtbZIP11 AT4G34590 253245_at S1
AtbZIP1 AT5G49450 248606_at S1
AtbZIP58 AT1G13600 256131_at S2
AtbZIP48 AT2G04038 263407_at S2
AtbZIP42 AT3G30530 258306_at S2
AtbZIP43 AT5G38800 249534_at S2
AtbZIP4 AT1G59530 257471_at S3
AtbZIP8 AT1G68880 260030_at S3
AtbZIP6 AT2G22850 266798_at S3
AtbZIP7 AT4G37730 253064_at S3
Table 2: Mapping information between AtbZIP : AGI : ATH Probeset : AtbZIP Group Ids

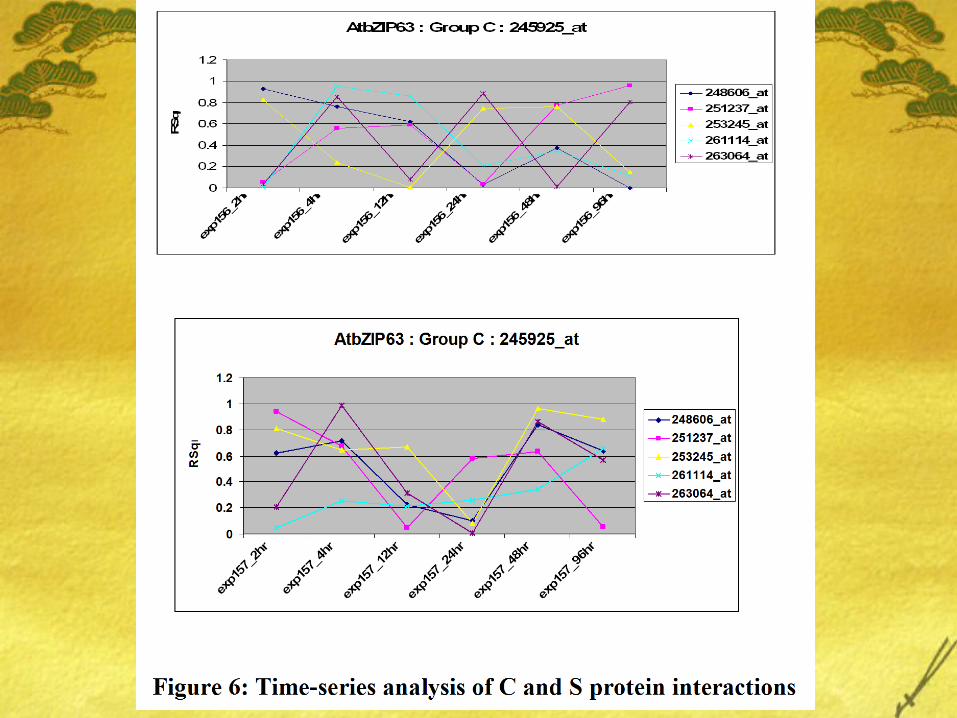
Table 3: Regression estimates between Group C AtbZIIP63 (245925_at) and Probes in Group S1, C and S2.
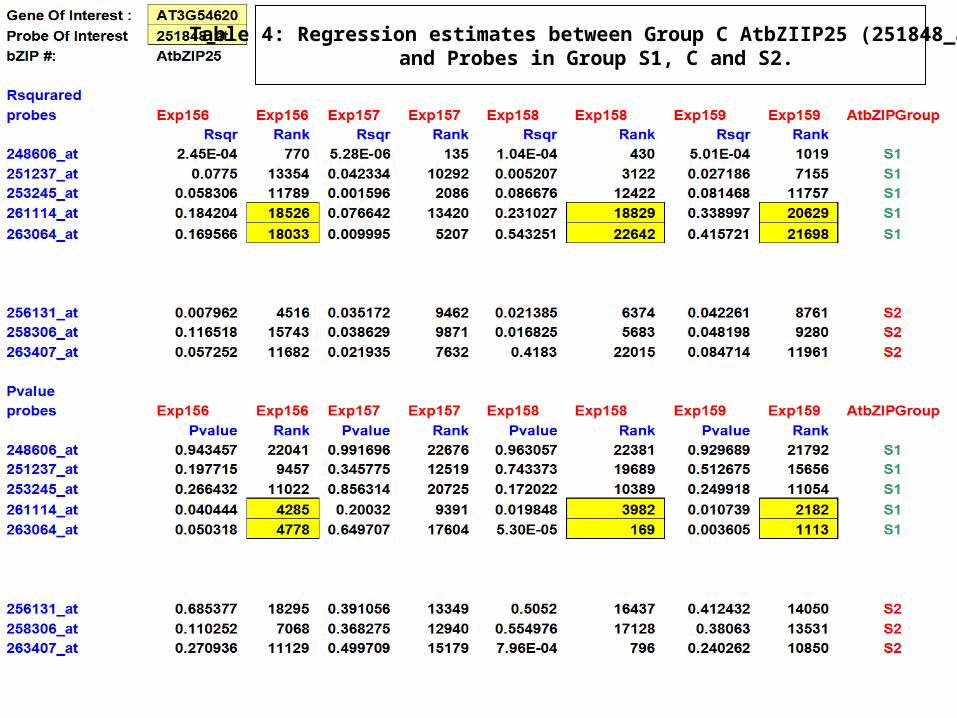
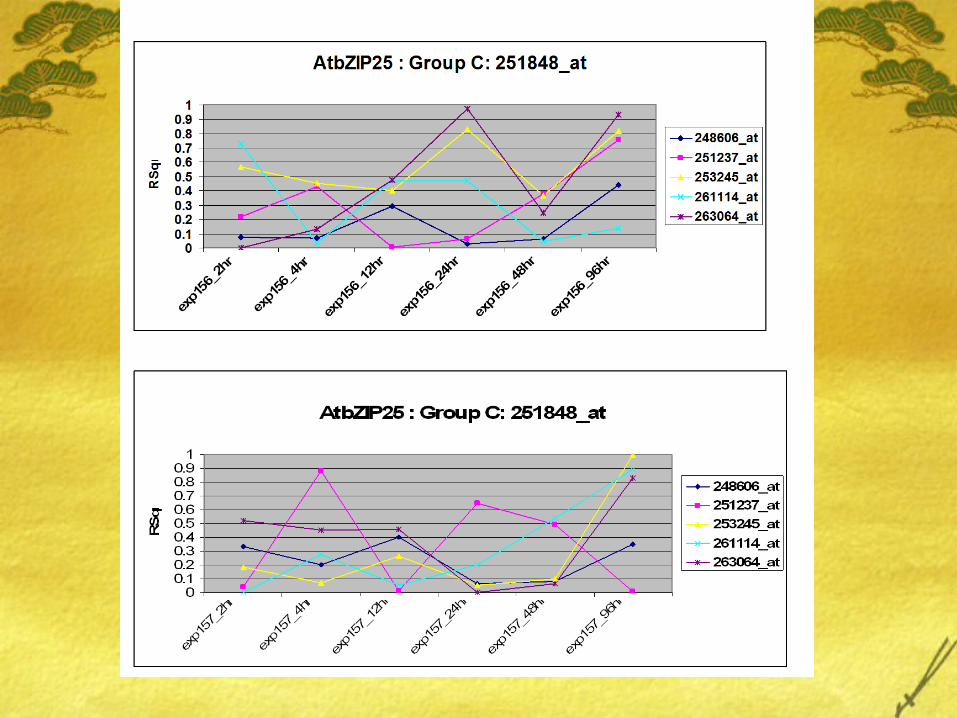
Table 4: Regression estimates between Group C AtbZIIP25 (251848_at) and Probes in Group S1, C and S2.

Regression estimates between Group C AtbZIIP9 (246962_s_at) and Probes in Group S1, C and S2.


Results
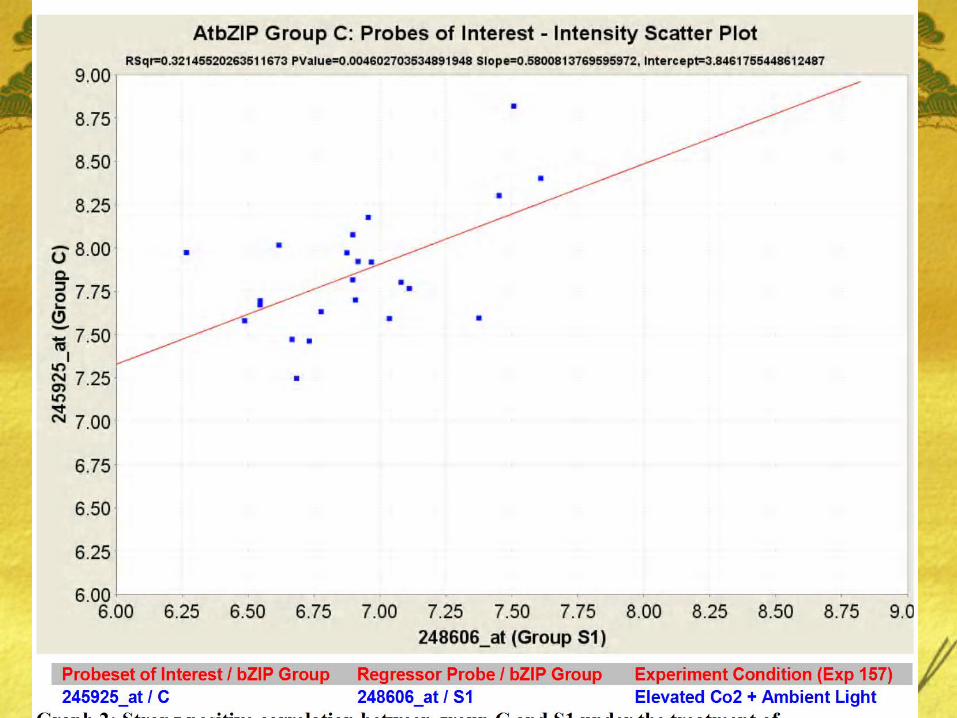
bZIP1(Group S1) coexpresses well with bZIP63 (S1) under conditions of Ambient Co2 and low light but the same coexpression interaction is weak under conditions of Elevated Co2 and Ambient Light.
Also, very minimal interaction was found between genes of Group C (bZIP25, bZIP10, bZIP9, and bZIP63) and bZIP9 (Group C
Conclusion
This bZIP study was a good litmus test for the SSG Coexpression Tool.
Results presented in this study provide evidence that a good if not significant number of AtbZIP proteins interacting as heterodimers are co-regulating under varying conditions of stress.
This study shows evidence that coexpression patterns in genes can be studied by pooling publicly available microarray data and that the use of simple linear regression procedure is feasible.

Varying trends in the coexpression proposes some theories: Different genes are expressed in diff tissues. Is study on leaf
good enough to support our hypothesis? Time-course data is valuable and should be accounted for in
the analysis. However, this kind of analysis requires more observation recorded at different timepoints.
Linear regression is good but will a robust time-series based approach be appropriate in our study?
Discussion