Municipal Support Division, Office of Wastewater ... · Municipal Support Division, Office of...
36
Transcript of Municipal Support Division, Office of Wastewater ... · Municipal Support Division, Office of...

is sponsored by:
U.S. Environmental Protection AgencyBill Hasselkus | Project OfficerMunicipal Support Division, Office of Wastewater Management, Washington, D.C.
Small Flows M a g a z i n e S t a ff, NESCRichard A. Bajura, Ph.D. | Interim Director Trina Wafle | Communications ManagerClement Solomon | Program DirectorKathy Jesperson | EditorCathleen Falvey | Juried Articles EditorJohn Fekete | Senior Project Coordinator Caigan M. McKenzie | Staff WriterJennifer Hause | Engineering Scientist
Article SubmissionsSmall Flows Magazine welcomes letters to the editor, articles, news items, photographs, or other materials for publication. Please address correspondence to:
Editor, Small Flows MagazineNational Environmental Services CenterWest Virginia UniversityP.O. Box 6064Morgantown, WV 26506-6064(800) 624-8301 or (304) 293-4191www.nesc.wvu.edu
Juried Article Review BoardPatricia Miller, Ph.D., Virginia | Technical AdvisorJames Anderson, Ph.D., University of MinnesotaSteven Berkowitz, P.E., North Carolina Department of Environment
and Natural ResourcesTerry Bounds, P.E., Roseberg, ORJean Caudill, Ohio Department of HealthPaul K. Chase, M.A., L.E.H.P., Chase Environmental Services, Inc.Craig Cogger, Ph.D., Washington State University, PuyallupJames Converse, Ph.D., P.E., University of Wisconsin (ret.)Ron Crites, P.E., Brown and Caldwell, Sacramento, CAJeannie Darby, Ph.D., P.E., University of California, DavisDonald Gray, Ph.D., West Virginia UniversityMark Gross, Ph.D., P.E., University of ArkansasMichael Hines, M.S., P.E., Southeast Environmental Engineering, Knoxville, TNAnish Jantrania, Ph.D., P.E., Virginia Department of HealthCraig Jowett, Ph.D., P.E., University of Waterloo, Ontario, CanadaJim Kreissl, U.S. Environmental Protection Agency (ret.)George Loomis, University of Rhode IslandTed L. Loudon, Ph.D., P.E., Michigan State UniversityRoger E. Machmeier, Ph.D., P.E., University of Minnesota (ret.)Don P. Manthe, P.E., Stanley Consultants, Phoenix, AZStewart Oakley, Ph.D., P.E., California State University, ChicoMichael H. Ogden, P.E., Santa Fe, NMRichard J. Otis, Ph.D., P.E., Madison, WISusan Peterson, Ph.D., Teal Partners, Rochester, MALinvil G. Rich, Ph.D., Clemson University (ret.)A. R. Rubin, Ph.D., North Carolina State UniversityKevin M. Sherman, P.E., Ph.D., Quanics, Inc., Crestwood, KYRobert L. Siegrist, Ph.D., P.E., Colorado School of MinesDennis Sievers, Ph.D., Marshall Engineering, Columbia, MOSteve Steinbeck, P.G., North Carolina Department of Environment
and Natural ResourcesCarol Steinfeld, Ecowaters Projects, New Bedford, MAJerry Stonebridge, Stonebridge Construction, Inc., Langley, WAWilliam L. Stuth Sr., Stuth Company Inc., Maple Valley, WAGeorge Tchobanoglous, Ph.D., P.E., University of California, DavisJerry Tyler, Ph.D., University of WisconsinRobert Uebler, North Carolina Department of Environment
and Natural ResourcesScott Wallace, P.E., North American Wetland Engineering, LLC, MNSteve Wert, C.P.S.S., Wert & Associates, Inc., Bend, OR
Small Flows Magazine is funded through a grant from the U.S. Environmental Protection Agency (EPA).
ReprintsFor permission to reprint information appearing in Small Flows Magazine,please send a letter of request to the editor.
International Standard Serial Number: Pending
The contents of this newsletter do not necessarily reflect the views and poli-cies of the EPA, nor does mention of trade names or commercial productsconstitute endorsement or recommendation for use. Some images in this issue are from www.ClipArt.com and www.Photos.com.Printed on recycled paper.
From the Editor...
®An Affirmative Action/Equal Opportunity Institution
Small Flows Magazine
Dear Small Flows Readers,
Welcome to theFall/Winter 2007 issueof Small Flows Maga-zine. The issue has anumber of interestingarticles that I think youwill find useful.
Our staff writer,Caigan McKenzie,presents a story about
a unique volunteer program by the NorthCarolina Rural Community Assistance Pro-ject that brings volunteer teens from allover the country to help low income peoplewho need septic systems repaired or in-stalled. See this inspiring account on pagefour. On page eight, Mark Gross, Ph.D.,P.E., and Terry Bounds, P.E., championtheir view that water softener backwashbrine stresses septic systems. They sug-gest simple and inexpensive discharge al-ternatives in the “Small Flows Forum.”
Also, this issue features three peer-re-viewed articles: one about the performancecommercially available chlorine and ultravi-olet disinfection units, one about a methodfor determining the design flow of clustersystems, and one about GIS applicationsto map isolation distances for septagemanagement.
Our products list on page 35 featuresmaterials related to these articles. The Na-tional Environmental Services Center offersproducts free or at low cost. And our tech-nical assistance team remains ready to an-swer your questions about these stories orother information you may need. Pleasecall 1-800-624-8301 where engineersClement Solomon, Jen Hause, Zane Sat-terfield and our team of specialists can pro-vide you with assistance, solutions, andknowledge if you ASK.
Due to a printing error, an incomplete version of the juried article,“Effects of Embedment on Flow Through Sand Columns,” appears inthe Small Flows Magazine Spring/Summer 2007 issue. The completearticle is available in the online issue, which can be viewed anddownloaded at http://www.nesc.wvu.edu/nsfc/sfq_2007.htm.
Erratum. . .
Kathy Jesperson, Editor

3
DEPARTMENTS
3 5 Related Products
S M A L L F L O W S M A G A Z I N E
FA L L / W I N T E R 2 0 0 7
2 3
11
JURIED ARTICLES
Comparison of a Commercially Av a i l a b l eChlorine and an Ultraviolet Disinfection Unit for Onsite Wastewater SystemsHarold Leverenz, P.E., Jeannie Darby, Ph.D., P.E., and George Tchobanoglous, Ph.D., P.E.
A Rational Method for Determining Design Flows for Cluster SystemsLarry D. Stephens, P.E.
4Water Softener BackwashBrine Stresses Household
Septic Tanks and Treatment Systems
By Mark Gross, Ph.D., P.E. and Terry Bounds, P.E.
88
3 1GIS Mapping of Land Application Sites for Septage Management in Mahoning County, OhioWesley J. Vins, R.S., Dantan Hutton, R.S.,John Bralich, B.A.,and Matthew Stefanak,M.P.H

4
Some might find it odd forteenagers to trade a weekof lazy summer days forlabor-intensive days, com-plete with ticks, poison ivy,snakes, spiders, wasps,and hornets. Possiblymore peculiar is theirwillingness to pay ap-proximately $300 forthe experience. ButRich Holder, commu-nity resource coordi-nator for North Car-olina Rural Com-munity AssistanceProject (NCR-CAP), doesn’tfind it at all odd.This summer,like last sum-mer, Holderwill work with
teenagers from across the country who haveeagerly volunteered their time and money tohand dig and install septic systems for low-in-come families in western North Carolina.
Founded in 1987, NCRCAP is a non-profitorganization that assists rural North Carolini-ans with water, wastewater, and housing is-sues through a variety of outreach programs.
Western North Carolina Septic
Repair ProgramOne of NCRCAP’s programs is the West-
ern North Carolina Septic Repair Program,which is committed to protecting public health,the environment, natural resources, and ad-dressing poverty issues in western North Car-olina. It was founded in 2006 after surveysconducted by local county health depart-ments,and the North Carolina Wastewter Dis-charge Elimination (WaDE) program showed ahigh incidence of wastewater treatment viola-tions.
“I was part of the original survey team,”Holder said. “We went door-to-door to see ifhomeowners had a system. If they did, we dyetested it to make sure it was working properly.What we found was that many of the surveyedhomeowners had failing septic systems orwere straight piping their waste to localstreams. In many cases, the homeownerswere very low-income, unable to afford repairs,and lived on sites that were inaccessible to abackhoe.”
One of the surveyed homeowners lived in adilapidated home with raw sewage flowing be-neath it. Although the family was awarded agrant to purchase a mobile home to replacetheir current home, the grant was not enoughto cover the cost of a septic system. The Landof Sky Regional Council of Governments, alocal government planning and developmentorganization that was instrumental in securingthe grant, asked NCRCAP for help.
After surveying the site and recommendinga pump system for the property, Holder askedthe Emanuel Lutheran Appalachian ServantEvent organization, which, through its volun-teers had been repairing homes and septic
by Caigan McKenzie,NESC staff writer

5
systems for more than 25 years, if they couldhand dig and install the system to save thehomeowner labor costs. Emanuel Lutheranagreed and spent one week of almost continu-ous digging.
Septic Repair Program Structure“We (NCRCAP) see this program as Rich’s
brain child,” Sharon LaPalme, associate direc-tor of NCRCAP, said. “Rich was involved withthe county-wide surveys that occurred in thelate ‘90s. Since then, it has been his goal tosee the long-term follow-up to those surveys.And, it’s where Rich’s skills and knowledge lie.He knows the residents, so he is very good atworking with them; he has the needed techni-cal expertise; and he has a lot of contacts inthe wastewater industry.”
The septic repair program brings togetherfunding groups, regulators, housing agencies,material manufacturers, and volunteers, allworking together to assist low-income home-owners with their wastewater needs. To be eli-gible for the program, households must meetcertain requirements, such as financial needand have a wastewater violation that is a threatto public health. Financial qualification is donethrough the Land of Sky Regional Council ofGovernments and community action agencies,while Holder knows which households have thegreatest need for repairs.
“Many of the contacts that Rich made whenhe worked as an environmental health special-ist donated materials to the septic repair pro-
gram,” LaPalme said. “He has put together anincredible basket of materials free of charge.”
Available donated materials play a key factorin determining the type of system to install. Be-cause Holder is a registered sanitarian and anenvironmental health specialist, he is authorizedto design and permit septic systems with thestate of North Carolina Department of Environ-ment and Natural Resources. In helping designthe systems, he ensures each meets applicableonsite wastewater and plumbing regulations.But he is not a county employee, so he workswith the county health department to permit thesystems and to have the systems inspected.
To get local and national companies in-volved, Holder sent them a letter explaining theseptic repair project. “Along with the letter, I in-cluded pictures of the kids digging,” Holder said.“The companies all jumped on board. A lot ofthem are friends of mine, but I think it was thekids volunteering their summer vacations andtheir own money that got everyone really inter-ested in wanting to help.” Funding for materialsand equipment that are not donated is providedthrough housing and watershed protection pro-grams, such as the Community Foundation ofWestern North Carolina, Pigeon River Fund, theNorth Carolina Clean Water Management TrustFund, and WaDE.
Volunteers for the program come from twoyouth, faith-based groups: the Emanual Luther-an Church Appalachian Servant Event, andReCreation Experiences, which includes a vari-ety of religious denominations. “All of these kidsare real heroes. They spend summer vacation
6
time to help those in greater need than them-selves. The money each volunteer pays is usedfor their travel, living, and entertainment ex-penses as well as for some of the costs of sup-plies needed for repairs.”
Holder is onsite with the volunteers, teach-ing them what to do each time they encountera new phase in the project, and when Holderisn’t at the site, he ensures that someone justas qualified as he is takes his place. This en-ables Holder to move between sites to ensureeverything is going smoothly, and that he canarrange for additional site supervision.
“Septic tanks? When people hear that, theythink ‘Gross!” said volunteer Ashley Lawler. “Butnow that I have worked on one and havewatched a group of teens change a family’shome, I can fully appreciate the program andthe impact it has on making the community abetter place.”
It’s a win-win situation. Low-income home-owners are given assistance for their waste-water needs and volunteers learn about onsitewastewater treatment techniques, southern Ap-palachian culture and topography, collaborationbetween the public and private sectors, and thesense of fulfillment gained from communityservice. “I never knew how much digging a holecould affect the life of a homeowner and thesurrounding community,” said volunteer AndrewOpila.
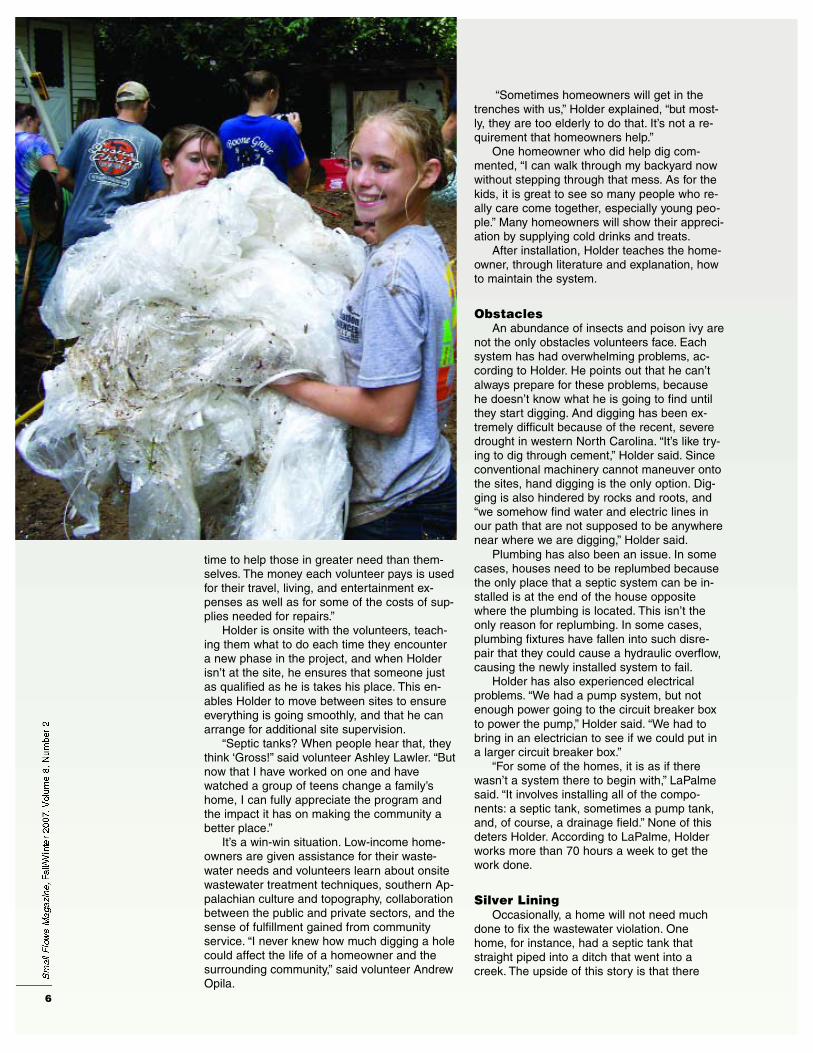
“Sometimes homeowners will get in thetrenches with us,” Holder explained, “but most-ly, they are too elderly to do that. It’s not a re-quirement that homeowners help.”
One homeowner who did help dig com-mented, “I can walk through my backyard nowwithout stepping through that mess. As for thekids, it is great to see so many people who re-ally care come together, especially young peo-ple.” Many homeowners will show their appreci-ation by supplying cold drinks and treats.
After installation, Holder teaches the home-owner, through literature and explanation, howto maintain the system.
ObstaclesAn abundance of insects and poison ivy are
not the only obstacles volunteers face. Eachsystem has had overwhelming problems, ac-cording to Holder. He points out that he can’talways prepare for these problems, becausehe doesn’t know what he is going to find untilthey start digging. And digging has been ex-tremely difficult because of the recent, severedrought in western North Carolina. “It’s like try-ing to dig through cement,” Holder said. Sinceconventional machinery cannot maneuver ontothe sites, hand digging is the only option. Dig-ging is also hindered by rocks and roots, and“we somehow find water and electric lines inour path that are not supposed to be anywherenear where we are digging,” Holder said.
Plumbing has also been an issue. In somecases, houses need to be replumbed becausethe only place that a septic system can be in-stalled is at the end of the house oppositewhere the plumbing is located. This isn’t theonly reason for replumbing. In some cases,plumbing fixtures have fallen into such disre-pair that they could cause a hydraulic overflow,causing the newly installed system to fail.
Holder has also experienced electricalproblems. “We had a pump system, but notenough power going to the circuit breaker boxto power the pump,” Holder said. “We had tobring in an electrician to see if we could put ina larger circuit breaker box.”
“For some of the homes, it is as if therewasn’t a system there to begin with,” LaPalmesaid. “It involves installing all of the compo-nents: a septic tank, sometimes a pump tank,and, of course, a drainage field.” None of thisdeters Holder. According to LaPalme, Holderworks more than 70 hours a week to get thework done.
Silver Lining
Occasionally, a home will not need muchdone to fix the wastewater violation. Onehome, for instance, had a septic tank thatstraight piped into a ditch that went into acreek. The upside of this story is that there

7
also was a mobile home on the property thatwas no longer being used. It was convenientlylocated downhill from the house and alreadyhad a permitted septic system that would meetthe needs of the homeowner and could beused as a permanent system.
“We just ran the pipe from the septic tank atthe owner’s house to the permanent septic sys-tem [at the trailer] and hooked to it,” Holdersaid. “We found a way to use something thatthe owner already had rather than installing awhole new system to get him out of straightpiping.”
Septic Repair Program GrowsIn 2006, two households benefited from the
program. This year, however, the goal is set for10 households. Each site will have approxi-mately 40 volunteers who will work betweeneight to 10 hours a day for five to seven days.Some of the repairs will include systems thatrequire pumps, alternating valves, tanks, ag-gregate, pvc pipe, and filters.
“We don’t take into account how much afaulty septic system affects the community untilwe are standing in it only five feet away from aschool playground,” said volunteer BethanieGallagher. “Many hours of hard work went intoputting a dent into the problem.” The systemthat Gallagher is referring to is one slated forrepair this summer that is located just 20 feetfrom the swing set of an elementary school.“On the day that Rich went to do a site visit, hefound the elementary school kids runningaround on the failing drainfield trying to catchthe butterflies that the effluent and sewage at-tracted,” LaPalme said. “This system was clear-ly a threat to public health.”
Teens Go Beyond Septic RepairsVolunteers not only repair septic systems,
they also paint, repair bathrooms, roofs, andfloors. “They are willing to do whatever it takesto make the homes a safer and nicer place tolive,” Holder said. “They are truly amazing kids!”
The teens have even gone beyond repairs
in some cases to make the homeown-er’s life more pleasant. One homeown-er, for instance, had commented thatshe spent most of her time alone.When the teens found out it was herbirthday, they threw her a celebration. “Ireally missed all the company I hadthat week, and the birthday celebrationwas very special to me,” the homeown-er said.
Request for Help“We still are in great need of donat-
ed materials to be able to completethese projects,” Holder said. “We wouldlike to invite all organizations to join usby collaborating with agencies commit-
ted to improving water quality, public health, andhelping those in greater need than themselves.”
For more information, contact Holder at [email protected], LaPalme [email protected], ReCreation Experiencesat www.recreationexperiences.org, and EmanuelLutheran Appalachian Servant Event at (828)273-7669, and Terrell Jones at Terrell.Jones@nc -mail.net.
Organizations that have supported the project through volunteerlabor, funding, or donation of supplies are:
• SE Rural Communities Assistance Project• NC Rural Communities Assistance Project• NC DENR Wastewater Discharge Elimination Program (WaDE)• ReCreation Experiences• Emanuel Lutheran Church Appalachian Servant Event• Community Foundation of Western North Carolina• Land of Sky Regional Council of Governments• Watauga Avery Mitchell Yancey Community Action Agency• Pigeon River Fund• Western Carolina Environmental Inc.• Local Health Departments
(Buncombe, Henderson, Jackson, Madison, Yancey)• Ring Industrial Group• Infiltrator Systems Inc.• Carolina Aerobic Systems• Mariner Container Corp• Mace’s Back Hoe Services• AAA Water Flowrite Inc. (Plumber)• Kingsway Ready Mix Concrete Inc.• Zoller pumps• The North Carolina Clean Water Management Trust Fund• KDR Services (Electrician)
8
S F F O R U M
It is a fact that water softener brine regenera-tion discharges change the consistency andchemistry of the wastewater stream in ways thatpose a problem for onsite treatment systems andthe dispersal field. Studies have shown that watersoftener brine regeneration wastes not only harmthe flora and fauna in the wastewater treatmentsystem, they can also cause the septic tank itselfto discharge greater concentrations of solids,grease, and oil into the dispersal field.
Since the purpose of the septic tank is to sep-arate the solids and the fats, oils, and grease(FOG) from the liquid, discharging mostly dis-solved organic matter and nutrients, the dis-charge of solids and FOG into the drainfield willcause the soils to plug resulting in an expensivedrainfield repair. The concern is not the softenedwater nor whether or not sodium salts affect soilinfiltrative capacity or long-term acceptance rates(LTARS). The concern is the high concentration ofchloride salt in the backwash brine from softenerregeneration. Regenerate brine is recognized andtypically classified as a “salt-laden water, free ofcontaminant” and, thus, does not need to be dis-charged into biological wastewater streams.
Salt Stratification Inhibits
Tank PerformanceResearch performed at the National Sanitation
Foundation (NSF) used complete-mix aerobictreatment units, where the water softener back-wash brine was introduced to a system that iscompletely mixed. Septic tanks were not part ofthe NSF study, and it would be misleading andscientifically inappropriate to directly compare anycomplete-mix aerobic process to a passive anaer-obic process. Studies with septic tanks, which aredesigned to be quiescent by nature, have shownthat the high concentration of salt introduced byslugs of backwash brine cause salt stratificationin the tank, which inhibits the ability of solids andFOG to stratify.
The result is that the salt water dives to thebottom of the tank occupying space that is de-signed for the settling of heavier solids. In addi-tion, the sludge in a septic tank is mostly liquidwith a density very near that of the clear zone.The heavier salt water can actually lift the sludgefrom the bottom of the tank, displacing it and
By Mark Gross, Ph.D., P.E., training manger Orenco Systems, and Terry Bounds, P.E., executive vice president, Orenco Systems, Inc.
Water Softener Backwash Brine Stresses Household Septic Tanks and Treatment Systems
The views and opinions expressed in this forum are those solely of thecontributor and do not necessarily reflect those of the National SmallFlows Clearinghouse or its sister organizations. To respond to this forum,please send an e-mail to [email protected], or write toattention of Kathy Jesperson, National Small Flows Clearinghouse,NRCCE Building, Evansdale Dr, Morgantown, WV, 26506-6064.

9
washing it into the down-stream components such asan ATU, media filter, or thesoil dispersal field. As a re-sult of its density, the salt-laden brine competes withthe sludge to occupy spaceat the bottom of the tank, ef-fectively reducing sludgestorage volume. This couldincrease sludge pump outfrequency or allow thesludge to be carried out intothe soil dispersal area.
In field observations ofseptic tanks having watersoftener brine dischargedinto the tank, the tanks havenot developed distinct layersof sludge, scum, and a clearzone. These tanks were ap-proximately four years old,and were expected to havea normal 3- to 4-inch thicksludge layer.
A study in Australianotes that “A loss of hy-draulic conductivity resultsfrom the use of sodic waste-water on various soil pro-files.” Nearly all ion ex-change water softeners usesodium chloride for regener-ation. The high concentra-tion of sodium enters thewastewater stream when thewater softener is back-washed. The sodium entersthe wastewater stream as aslug to the septic tank two tothree times per week.
In addition, field observa-tions of side-by-side disper-sal systems in a sharedmound have shown that thetrenches receiving the efflu-ent with water softener brinedischarges formed a thick,gelatinous slime layer thatclogs the infiltrative surface,while the trenches receiving no salt water discharge re-mained open with a normal microbial clogging layer.
A study conducted at the University of Wisconsin in-troduced the backwash brine only to the soil dispersalcomponent, not to the septic tank. The report suggeststhat additional research is needed to evaluate the effectsof backwash brine on septic tank flora and fauna. Thereport is also inconclusive as to whether or not watersoftener backwash brine is harmful to septic systems.Additionally, these studies were performed nearly threedecades ago when the required levels of treatment werenot as restrictive as they are today.
The NSF study about water softener effects onlycompared one system receiving water-softener brine to
a control system. The testswere performed to NSFStandard, 40 Class II re-quirements during 1978.These standards requiredthat BOD5 and TSS must notexceed 60 milligrams perliter (mg/L) and 100 mg/L re-spectively for more than 10percent of the test period.Current requirements formost states are for NSFStandard, 40 Class I requirements of 25 mg/LBOD5 and 30 mg/L TSS.Regulations require onsitetreatment processes to accomplish not only higher organic removals,but also very restrictivenutrient removals. In theseapplications, water softenerbrine can be extremely detrimental.
Sodium and Chloride
Inhibit OperationSodium concentrations
greater than 3,500 mg/Lhave been reported to inhibitanaerobic digestion. It’scommon to see municipalsystems ban the dischargeof high concentrations of saltinto large treatment plants.Wastewater design texts andmanuals require treatmentprocesses to be sized ac-cordingly, relative to influentsalinity concentrations. “Thehigher the concentration, thegreater the size” is not typi-cally taken into considera-tion in small onsite applica-tions.
Chloride concentrationsgreater than 180 mg/L havean inhibitory effect upon ni-trifying microorganisms
(U.S. Environmental Protection Agency Publicly OwnedTreatment Works manual on toxicants and inhibitorythresholds). Chloride concentration in regenerate canreach into the 10,000 mg/L range, with sodium in the6,000 mg/L range. A field study of 18 onsite wastewatertreatment systems in Virginia clearly showed that nitro-gen removal was inhibited in systems receiving watersoftener backwash brine.
The systems receiving backwash brine from watersofteners had average chloride concentrations of 1,207mg/L in the septic tank effluent with one system having aconcentration of 10,900 mg/L.
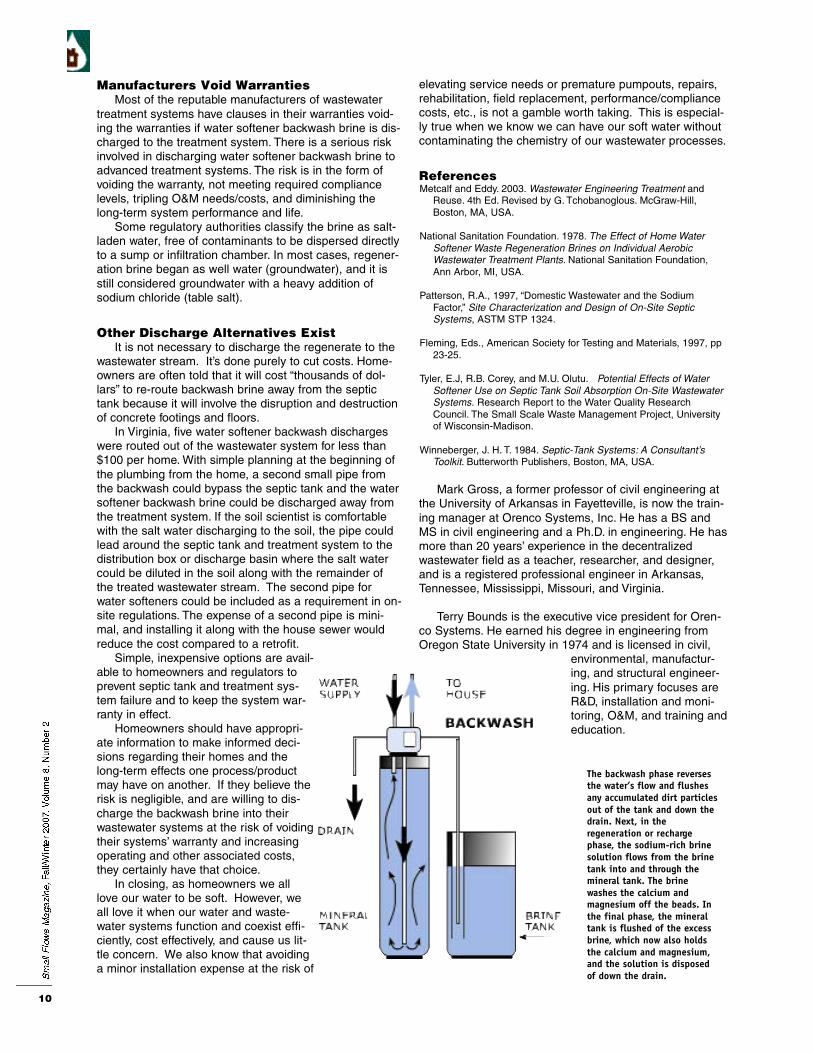
The backwash phase reversesthe water’s flow and flushesany accumulated dirt particlesout of the tank and down thedrain. Next, in theregeneration or rechargephase, the sodium-rich brinesolution flows from the brinetank into and through themineral tank. The brinewashes the calcium andmagnesium off the beads. Inthe final phase, the mineraltank is flushed of the excessbrine, which now also holdsthe calcium and magnesium,and the solution is disposedof down the drain.
10
Manufacturers Void WarrantiesMost of the reputable manufacturers of wastewater
treatment systems have clauses in their warranties void-ing the warranties if water softener backwash brine is dis-charged to the treatment system. There is a serious riskinvolved in discharging water softener backwash brine toadvanced treatment systems. The risk is in the form ofvoiding the warranty, not meeting required compliancelevels, tripling O&M needs/costs, and diminishing thelong-term system performance and life.
Some regulatory authorities classify the brine as salt-laden water, free of contaminants to be dispersed directlyto a sump or infiltration chamber. In most cases, regener-ation brine began as well water (groundwater), and it isstill considered groundwater with a heavy addition ofsodium chloride (table salt).
Other Discharge Alternatives Exist It is not necessary to discharge the regenerate to the
wastewater stream. It’s done purely to cut costs. Home-owners are often told that it will cost “thousands of dol-lars” to re-route backwash brine away from the septictank because it will involve the disruption and destructionof concrete footings and floors.
In Virginia, five water softener backwash dischargeswere routed out of the wastewater system for less than$100 per home. With simple planning at the beginning ofthe plumbing from the home, a second small pipe fromthe backwash could bypass the septic tank and the watersoftener backwash brine could be discharged away fromthe treatment system. If the soil scientist is comfortablewith the salt water discharging to the soil, the pipe couldlead around the septic tank and treatment system to thedistribution box or discharge basin where the salt watercould be diluted in the soil along with the remainder ofthe treated wastewater stream. The second pipe forwater softeners could be included as a requirement in on-site regulations. The expense of a second pipe is mini-mal, and installing it along with the house sewer wouldreduce the cost compared to a retrofit.
Simple, inexpensive options are avail-able to homeowners and regulators toprevent septic tank and treatment sys-tem failure and to keep the system war-ranty in effect.
Homeowners should have appropri-ate information to make informed deci-sions regarding their homes and thelong-term effects one process/productmay have on another. If they believe therisk is negligible, and are willing to dis-charge the backwash brine into theirwastewater systems at the risk of voidingtheir systems’ warranty and increasingoperating and other associated costs,they certainly have that choice.
In closing, as homeowners we alllove our water to be soft. However, weall love it when our water and waste-water systems function and coexist effi-ciently, cost effectively, and cause us lit-tle concern. We also know that avoidinga minor installation expense at the risk of
elevating service needs or premature pumpouts, repairs,rehabilitation, field replacement, performance/compliancecosts, etc., is not a gamble worth taking. This is especial-ly true when we know we can have our soft water withoutcontaminating the chemistry of our wastewater processes.
ReferencesMetcalf and Eddy. 2003. Wastewater Engineering Treatment and
Reuse. 4th Ed. Revised by G. Tchobanoglous. McGraw-Hill,Boston, MA, USA.
National Sanitation Foundation. 1978. The Effect of Home WaterSoftener Waste Regeneration Brines on Individual AerobicWastewater Treatment Plants. National Sanitation Foundation,Ann Arbor, MI, USA.
Patterson, R.A., 1997, “Domestic Wastewater and the SodiumFactor,” Site Characterization and Design of On-Site SepticSystems, ASTM STP 1324.
Fleming, Eds., American Society for Testing and Materials, 1997, pp23-25.
Tyler, E.J, R.B. Corey, and M.U. Olutu. Potential Effects of WaterSoftener Use on Septic Tank Soil Absorption On-Site WastewaterSystems. Research Report to the Water Quality ResearchCouncil. The Small Scale Waste Management Project, Universityof Wisconsin-Madison.
Winneberger, J. H. T. 1984. Septic-Tank Systems: A Consultant’sToolkit. Butterworth Publishers, Boston, MA, USA.
Mark Gross, a former professor of civil engineering atthe University of Arkansas in Fayetteville, is now the train-ing manager at Orenco Systems, Inc. He has a BS andMS in civil engineering and a Ph.D. in engineering. He hasmore than 20 years’ experience in the decentralizedwastewater field as a teacher, researcher, and designer,and is a registered professional engineer in Arkansas,Tennessee, Mississippi, Missouri, and Virginia.
Terry Bounds is the executive vice president for Oren-co Systems. He earned his degree in engineering fromOregon State University in 1974 and is licensed in civil,
environmental, manufactur-ing, and structural engineer-ing. His primary focuses areR&D, installation and moni-toring, O&M, and training andeducation.

11
IntroductionIt is generally assumed that on-
site wastewater systems that utilizesubsurface dispersal achieve highlevels of natural attenuation ofpathogens through contact with thesoil and its associated microbialcommunity. However, there are nu-merous documented exampleswhere groundwater quality has beencompromised by pathogens derivedfrom onsite wastewater systems,such as in areas where there is ahigh density of onsite treatment sys-tems, cesspools, and seepage pits;shallow water table; or highly perme-able soils (Ahmed et al., 2005;Nicosia et al., 2001; Arnade, 1999;DeBorde, 1998; Yates, 1985). Whileu n s a t u rated flow conditions in soildispersal systems can reduce indica-tor bacteria concentrations effe c t i ve l y,the tra n s p o rt of microbial pathogensfrom onsite wa s t ewater systems is at-t ri buted to episodic breakthroughevents (U. S. E PA, 2002).
Disinfection processes may beused with onsite wastewater sys-tems when there is concern thatthere may be insufficient natural at-tenuation of pathogens in the soil,particularly in or near areas such asdesignated surface and groundwa-ters of exceptional quality, sensitiveenvironments such as estuaries, ad-jacent to areas where shellfish har-vesting is occurring, and sole source
aquifers. Disinfection processes arealso of interest when treated waste-water is to be distributed by surfacespray irrigation or recycled for non-potable domestic reuse applications(Asano et al., 2007)
Disinfection Methods
During the past 50 years, a widevariety of disinfection processeshave been developed using physi-cal, chemical, and biological agents(Asano et al., 2007). Disinfectionprocesses that may be utilized foronsite wastewater systems are pre-sented in Table 1. Of the disinfec-tants reported in Table 1, calciumhypochlorite and ultravioliet (UV)are used most commonly for smallsystems (U.S. EPA, 2002). Otherprocesses identified in Table 1 thatmay be applied for wastewater dis-infection include biological filtration(Gross and Jones, 1999; Vanland-ingham and Gross, 1998; Emericket al., 1997) and peracetic acid(Kitis, 2004). All of the processesidentified in Table 1 can be used todisinfect wastewater; however, eachprocess has inherent constraintsthat may limit general application.Details of each of these technolo-gies may be found in Asano et al.(2007), Tchobanoglous et al. (2003),U.S. EPA (2002), and Crites andTchobanoglous (1998). Disinfectionwith chlorine gas and chlorine diox-ide are not considered as these
Comparison of a Commercially
Available Chlorine and an Ultraviolet
Disinfection Unit for Onsite
Wastewater Systems
AU T H O R S
Harold Leverenz, P.E., Jeannie Darby, Ph.D., P.E.,
and George Tchobanoglous, Ph.D., P.E.
ABSTRACT:Disinfection systems for onsitewastewater systems are requiredby regulatory agencies for someapplications; however, there is in-sufficient operation and mainte-nance data available to ensure re-liable performance. A commerciallyavailable calcium hypochloritetablet chlorination unit and an ultraviolet (UV) disinfection unitwere evaluated, under conditionswithin the operational range speci-fied by the manufacturer, for suit-ability in onsite and small waste-water systems. The results arepresented as a case study. Thedisinfection units were assessedbased on overall performance, reli-ability and constraints, mainte-nance requirements, and estimat-ed cost of installation and opera-tion. Performance was evaluatedby measurement of MS2 col-iphage, total coliform, and fecal co-liform inactivation. The disinfectionsystems were operated for ninemonths using biologically treatedseptic tank effluent. Both systemsprovided comparable results, fre-quently achieving 5 log removals.However, both systems were alsosubject to intermittent break-through events. Factors that wereidentified as important for effectiveperformance included reliable pre-treatment, flow equalization, andadequate maintenance.

12
processes present hazards associat-ed with storage, handling, and appli-cation for small facilities.
Reliability and Performance
Data for Onsite Disinfection
Systems
Small treatment systems are ex-pected to operate reliably under anumber of challenging conditions, in-cluding long periods of time betweenmaintenance activities, lack of re-dundant systems, high variability inflow rate and constituent concentra-tions, and site specific factors. Unfor-tunately, little information is availablein the peer-reviewed and archived lit-erature that can be used to deter-mine the reliability and the mainte-nance intervals required to keep aprocess performing to a high stan-dard. Accordingly, the U.S. EPA(2002) states that inadequate dataare available to assess the perform-ance and reliability of tablet chlorina-tion and UV disinfection devices, themost commonly used onsite disinfec-tion systems.
Based on the field data that areavailable, concerns have beenraised about the effectiveness andreliability of onsite disinfection units.For example, in field studies, tabletchlorinators have been found to haveeffluent concentrations of fecal col-iform exceeding 200 MPN/100 mL in93 percent of samples and no resid-
Summary of Disinfectants Used in Onsite Wastewater Systems Table 1
ual chlorine in 68 percent of sam-ples (U.S. EPA, 2002). In anotherfield study of 22 disinfection unitsused in conjunction with aerated bio-logical treatment systems, it wasfound that UV systems were subjectto lamp failure, and both chlorinationand UV systems were subject to in-ternal blockage and overflow, de-spite quarterly maintenance(Charles et al., 2003). The perform-ance of the UV systems was de-pendent on the presence of particu-late matter in the effluent from thepretreatment system, with somesystems not able to meet the fecalcoliform requirement of 100CFU/100 mL. Charles et al. (2003)suggested that UV disinfection maybe preferred over chlorination be-cause the chlorination units pro-duced high concentration of disinfec-tion byproducts and poor reductionof indicator virus.
Objectives
The objectives of this researchwere to characterize and comparethe performance, reliability, mainte-nance requirements, and costs of acommercially available tablet chlori-nation device and a UV disinfectiondevice for small wastewater flowsunder realistic field conditions. Thecost analysis results of this researchare presented in the form of a casestudy for comparison of the two dis-
infection alternatives. Due to con-cerns about the effects of residualchlorine on the biological activity inthe dispersal field, dechlorination fa-cilities are also considered in thecost analysis. The maintenance in-tervals are based on the actual per-formance of the units under thestudy conditions. The results of thisstudy can be useful for designersand regulatory agencies to evaluatethe application of disinfection tech-nology and the associated operationand maintenance programs for de-centralized wastewater applications.
Experimental MethodsTwo disinfection units for onsite
wastewater systems were selectedfor evaluation, a calcium hypochlo-rite tablet feeder and a UV irradia-tion unit. The systems that were se-lected consisted of commerciallyavailable systems specifically mar-keted for use with onsite wastewatersystems and are representative ofthe technology that is available cur-rently and being utilized. Data pro-vided by the manufacturer regardingthe application of the disinfectionunit, energy usage, and recom-mended service frequency are pre-sented in Table 2. A description ofthe configuration of the disinfectionsystems, pretreatment system,water quality, and analytical meth-ods used are presented below.
13
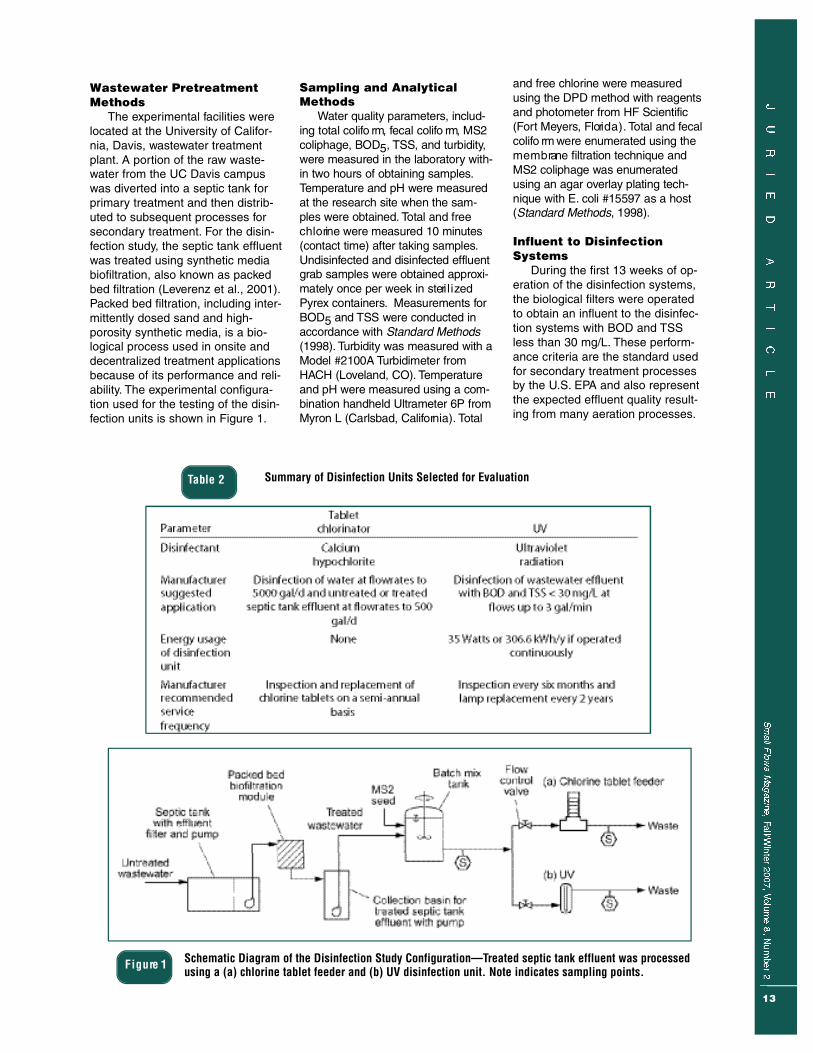
F i g u re 1 Schematic Diagram of the Disinfection Study Configuration—Treated septic tank effluent was processedusing a (a) chlorine tablet feeder and (b) UV disinfection unit. Note indicates sampling points.
Wastewater Pretreatment
Methods
The experimental facilities werelocated at the University of Califor-nia, Davis, wastewater treatmentplant. A portion of the raw waste-water from the UC Davis campuswas diverted into a septic tank forprimary treatment and then distrib-uted to subsequent processes forsecondary treatment. For the disin-fection study, the septic tank effluentwas treated using synthetic mediabiofiltration, also known as packedbed filtration (Leverenz et al., 2001).Packed bed filtration, including inter-mittently dosed sand and high-porosity synthetic media, is a bio-logical process used in onsite anddecentralized treatment applicationsbecause of its performance and reli-ability. The experimental configura-tion used for the testing of the disin-fection units is shown in Figure 1.
Summary of Disinfection Units Selected for EvaluationTable 2
Sampling and Analytical
Methods
Water quality para m e t e r s, includ-ing total colifo rm, fecal colifo rm, MS2c o l i p h a g e, BOD5, T S S, and turbidity,were measured in the labora t o ry with-in two hours of obtaining samples.Te m p e rature and pH were measuredat the research site when the sam-ples were obtained. Total and freec h l o rine were measured 10 minu t e s(contact time) after taking samples.U n d i s i n fected and disinfected effluentgrab samples were obtained approx i-mately once per week in steri l i ze dP y r ex containers. Measurements fo rB O D5 and TSS were conducted inaccordance with Standard Methods( 1 9 9 8 ) . Turbidity was measured with aModel #2100A Turbidimeter fromH ACH (Loveland, CO). Te m p e ra t u r eand pH were measured using a com-bination handheld Ultrameter 6P fromMyron L (Carlsbad, Califo rn i a ) . To t a l
and free chlorine were measuredusing the DPD method with reagentsand photometer from HF Scientific( Fo rt Meye r s, Flori d a ) . Total and fe c a lc o l i fo rm were enu m e rated using them e m b rane filtration technique andMS2 coliphage was enu m e ra t e dusing an agar ove rl ay plating tech-nique with E. coli #15597 as a host(Standard Methods, 1998).
Influent to Disinfection
Systems
During the first 13 weeks of op-eration of the disinfection systems,the biological filters were operatedto obtain an influent to the disinfec-tion systems with BOD and TSSless than 30 mg/L. These perform-ance criteria are the standard usedfor secondary treatment processesby the U.S. EPA and also representthe expected effluent quality result-ing from many aeration processes.
14
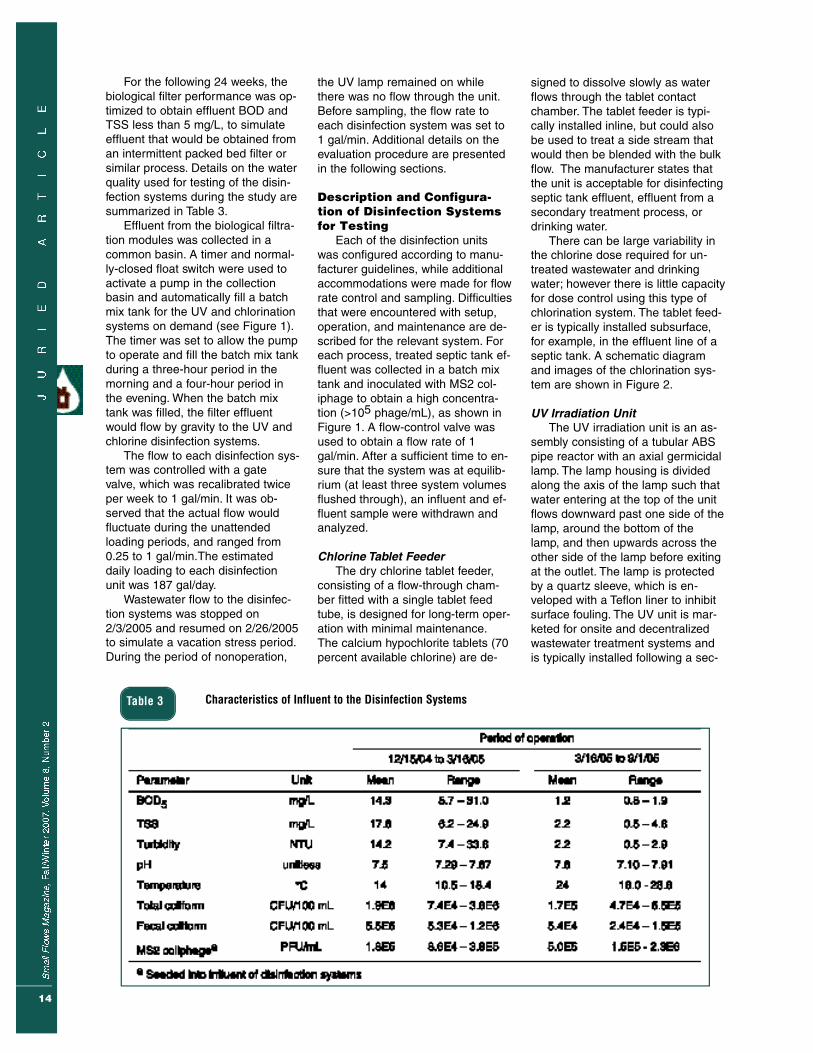
For the following 24 weeks, thebiological filter performance was op-timized to obtain effluent BOD andTSS less than 5 mg/L, to simulateeffluent that would be obtained froman intermittent packed bed filter orsimilar process. Details on the waterquality used for testing of the disin-fection systems during the study aresummarized in Table 3.
Effluent from the biological filtra-tion modules was collected in acommon basin. A timer and normal-ly-closed float switch were used toactivate a pump in the collectionbasin and automatically fill a batchmix tank for the UV and chlorinationsystems on demand (see Figure 1).The timer was set to allow the pumpto operate and fill the batch mix tankduring a three-hour period in themorning and a four-hour period inthe evening. When the batch mixtank was filled, the filter effluentwould flow by gravity to the UV andchlorine disinfection systems.
The flow to each disinfection sys-tem was controlled with a gatevalve, which was recalibrated twiceper week to 1 gal/min. It was ob-served that the actual flow wouldfluctuate during the unattendedloading periods, and ranged from0.25 to 1 gal/min.The estimateddaily loading to each disinfectionunit was 187 gal/day.
Wastewater flow to the disinfec-tion systems was stopped on2/3/2005 and resumed on 2/26/2005to simulate a vacation stress period.During the period of nonoperation,
signed to dissolve slowly as waterflows through the tablet contactchamber. The tablet feeder is typi-cally installed inline, but could alsobe used to treat a side stream thatwould then be blended with the bulkflow. The manufacturer states thatthe unit is acceptable for disinfectingseptic tank effluent, effluent from asecondary treatment process, ordrinking water.
There can be large variability inthe chlorine dose required for un-treated wastewater and drinkingwater; however there is little capacityfor dose control using this type ofchlorination system. The tablet feed-er is typically installed subsurface,for example, in the effluent line of aseptic tank. A schematic diagramand images of the chlorination sys-tem are shown in Figure 2.
UV Irradiation UnitThe UV irradiation unit is an as-
sembly consisting of a tubular ABSpipe reactor with an axial germicidallamp. The lamp housing is dividedalong the axis of the lamp such thatwater entering at the top of the unitflows downward past one side of thelamp, around the bottom of thelamp, and then upwards across theother side of the lamp before exitingat the outlet. The lamp is protectedby a quartz sleeve, which is en-veloped with a Teflon liner to inhibitsurface fouling. The UV unit is mar-keted for onsite and decentralizedwastewater treatment systems andis typically installed following a sec-
the UV lamp remained on whilethere was no flow through the unit.Before sampling, the flow rate toeach disinfection system was set to1 gal/min. Additional details on theevaluation procedure are presentedin the following sections.
Description and Configura-
tion of Disinfection Systems
for Testing
Each of the disinfection unitswas configured according to manu-facturer guidelines, while additionalaccommodations were made for flowrate control and sampling. Difficultiesthat were encountered with setup,operation, and maintenance are de-scribed for the relevant system. Foreach process, treated septic tank ef-fluent was collected in a batch mixtank and inoculated with MS2 col-iphage to obtain a high concentra-tion (>105 phage/mL), as shown inFigure 1. A flow-control valve wasused to obtain a flow rate of 1gal/min. After a sufficient time to en-sure that the system was at equilib-rium (at least three system volumesflushed through), an influent and ef-fluent sample were withdrawn andanalyzed.
Chlorine Tablet Feeder The dry chlorine tablet feeder,
consisting of a flow-through cham-ber fitted with a single tablet feedtube, is designed for long-term oper-ation with minimal maintenance.The calcium hypochlorite tablets (70percent available chlorine) are de-
Characteristics of Influent to the Disinfection SystemsTable 3

15
ondary treatment device. The maxi-mum flow rate recommended by themanufacturer is 3 gal/min. Additionalunits may be added in series or par-allel to accommodate higher flowrates or higher UV dosages. The rec-ommended influent water quality forboth BOD and TSS is less than 30mg/L, while a maximum turbidityvalue is not specified. A schematicdiagram and images of the UV sys-tem are shown in Figure 3.
Results and DiscussionThe results obtained for each dis-
infection unit are presented below.Performance measurements, reliabili-ty and constraints, maintenance re-quirements, and estimated cost ofimplementation and operation arediscussed.
Chlorine Tablet Feeder
The ove rall perfo rmance of thet a blet chlorination unit was excellent int e rms of indicator bacteria and viru sr e m oval, with intermittent breakthroughevents related to low residual chlori n ed o s e. The low chlorine dose eve n t swere a result of differential tablet ero-sion, as discussed below.
Performance The perfo rmance of the tablet chlo-
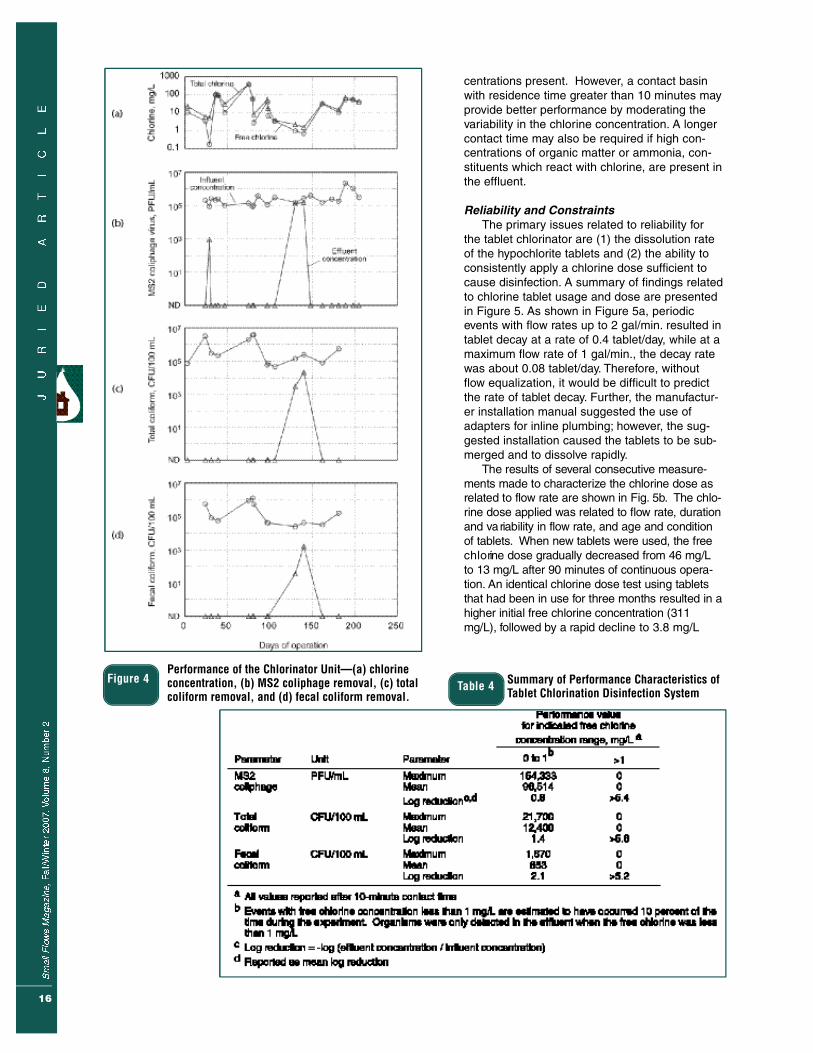
ri n a t o r, evaluated at a flow rate of onegal/min., is presented in Figure 4. Totaland free chlorine were measured fol-lowing a 10-minute contact time.Sodium bisulfite (NaHSO3) wasadded at this time (10 minutes) tostop the chlorine oxidation reactions.The free chlorine dose ranged from0.14 mg/L to 390 mg/L (see Figure4a). As shown in Figures 4b, 4c, and4d, about 90 percent of the samplingevents resulted in no coliphage orcoliform organisms detected in thechlorinated effluent. There were threeseparate events where organismswere detected in the effluent; forthese three events the correspondingfree chlorine concentration was lessthan 1 mg/L.
It is interesting to note that the ef-fectiveness of the chlorination unitwas not affected by changes in efflu-ent quality under the test conditions.The performance results are summa-rized in Table 4. While the manufac-turer did not specify a contact cham-ber design, the 10-minute contacttime resulted in high rates of disinfec-tion due to the high free chlorine con-
F i g u re 2 Chlorine Tablet Feeder Used for Disinfection in Study—(a) diagram of tablet feeder, (b) image of unit installedfor testing purposes, and (c) with tablet holderremoved showing non-uniform dissolution of tablets.
F i g u re 3 UV System Used for Disinfection Study— (a) diagram ofunit, (b) image of unit as installed for testing purposes,and (c) with fouled Teflon sleeve on left, UV lamp incenter, and new Teflon sleeve on right
16
Table 4 Summary of Performance Characteristics ofTablet Chlorination Disinfection System
centrations present. However, a contact basinwith residence time greater than 10 minutes mayprovide better performance by moderating thevariability in the chlorine concentration. A longercontact time may also be required if high con-centrations of organic matter or ammonia, con-stituents which react with chlorine, are present inthe effluent.
Reliability and ConstraintsThe primary issues related to reliability for
the tablet chlorinator are (1) the dissolution rateof the hypochlorite tablets and (2) the ability toconsistently apply a chlorine dose sufficient tocause disinfection. A summary of findings relatedto chlorine tablet usage and dose are presentedin Figure 5. As shown in Figure 5a, periodicevents with flow rates up to 2 gal/min. resulted intablet decay at a rate of 0.4 tablet/day, while at amaximum flow rate of 1 gal/min., the decay ratewas about 0.08 tablet/day. Therefore, withoutflow equalization, it would be difficult to predictthe rate of tablet decay. Further, the manufactur-er installation manual suggested the use ofadapters for inline plumbing; however, the sug-gested installation caused the tablets to be sub-merged and to dissolve rapidly.
The results of seve ral consecutive measure-ments made to chara c t e ri ze the chlorine dose asrelated to flow rate are shown in Fig. 5 b. The chlo-rine dose applied was related to flow ra t e, dura t i o nand va riability in flow ra t e, and age and conditionof tabl e t s. When new tablets were used, the freec h l o rine dose gradually decreased from 46 mg/Lto 13 mg/L after 90 minutes of continuous opera-t i o n . An identical chlorine dose test using tabl e t sthat had been in use for three months resulted in ahigher initial free chlorine concentration (311mg/L), fo l l owed by a rapid decline to 3.8 mg/L
F i g u re 4Performance of the Chlorinator Unit—(a) chlorineconcentration, (b) MS2 coliphage removal, (c) totalcoliform removal, and (d) fecal coliform removal.

17
after 60 minutes of continuous operation. Al-though water only contacts the bottom tablet, itwas observed that several tablets located abovethose also began to dissolve. The dissolution ofthe elevated tablets was caused by condensationand may have contributed to some of the ex-treme measurements. It was also found that thechlorine tablets did not dissolve uniformly, andsometimes only a small amount of the chlorinetablet was actually in contact with the water, asthe bottom tablets had eroded and formed achannel where water could pass through with lit-tle contact. On other occasions, large amounts ofparticulate calcium hypochlorite were washedout of the reactor with the effluent. Stopping andrestarting of flow caused chlorine concentrationpeaks followed by a rapid decline (data notshown).
A summary of all chlorine concentrationsmeasured while obtaining samples is shown inFigure 5c using a probability distribution. Asshown, the average concentrations measuredwere 11 and 20 mg/L, for free and total chlorine,respectively. The free chlorine concentration ex-ceeded 200 mg/L 10 percent of the time andwas less than 1 mg/L 10 percent of the time.
The chlorination unit was not affected by thethree-week vacation period (i.e., no flow condi-tions). In addition, the chlorination performancewas not affected by variations in water qualitythat occurred during the study. However, the ef-fect of high residual chlorine in the effluent onthe ability of the soil bacteria to provide ad-vanced treatment is not known. Therefore,dechlorination facilities (also tablet feed), follow-ing chlorine contact basins, may be consideredto control the discharge of chlorine where thereis concern about the receiving environment.
Maintenance Requirements and FrequencyMaintenance for the tablet chlorination unit
consisted of periodically refilling the tablet feedtube with new tablets and checking the conditionof the existing tablets.Assuming flow equalizationand uniform tablet erosion, it is estimated thatthe unit could be operated for several monthswithout servicing to replace tablets. However,Weaver and Lesikar (2004) recommended thatonly two to five tablets be used to reduce failuredue to compaction and non-uniform tablet ero-sion. The current research also supports thesuggestion of Weaver and Lesikar (2004) thatchlorine tablet feeders should be checked week-ly to ensure that tablets are present and feedingproperly. Although optimal maintenance is fre-quent, the ease of that maintenance is an ad-vantage for this technology.
Estimated Cost of Installation and OperationThe expenses associated with installation, op-
e ration and maintenance are presented in Ta ble 5.The capital cost for the tablet chlorinator is $150
F i g u re 5Characteristics of the Chlorine Dose Applied toWater—(a) tablet erosion characteristics, (b)example of continuous measurement ofchlorine dose at a flow rate of 0.6 gal/min,and (c) probability analysis of chlorine dose.(Note that chlorine tablets were present in thefeeder and undisturbed for all measurements.)
18
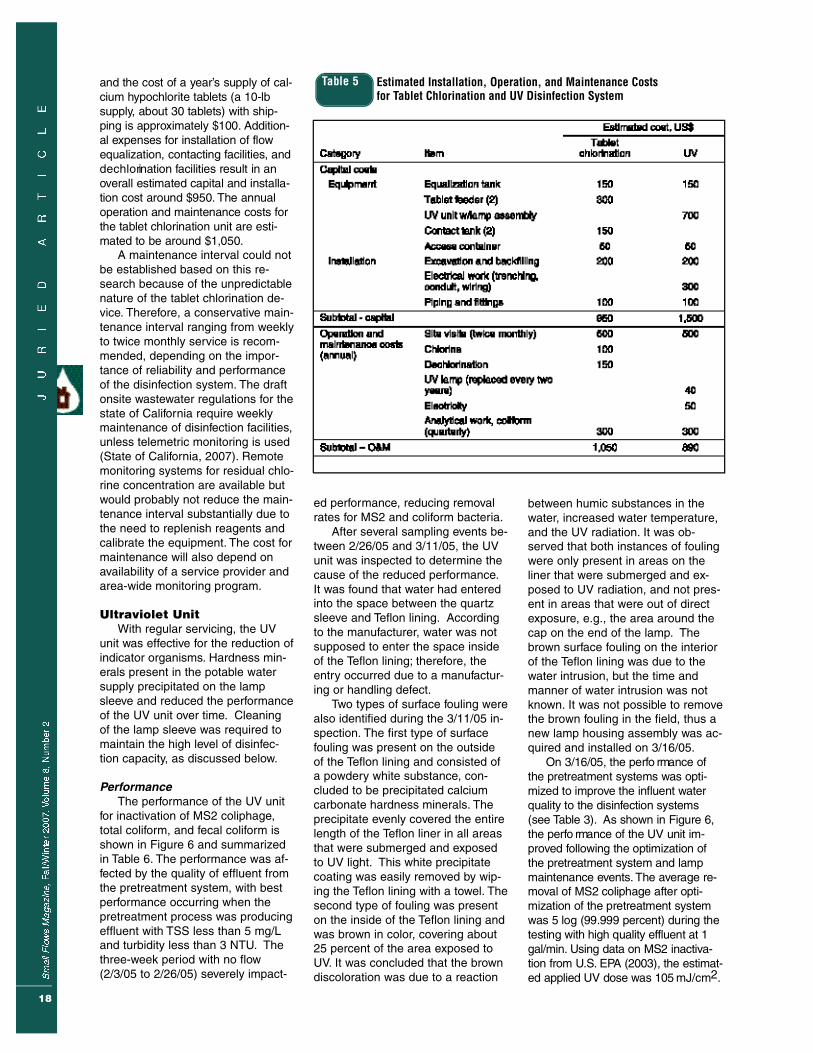
and the cost of a ye a r ’s supply of cal-cium hy p o c h l o rite tablets (a 10-lbs u p p l y, about 30 tablets) with ship-ping is approximately $100. A d d i t i o n-al expenses for installation of flowequalization, contacting fa c i l i t i e s, andd e c h l o rination facilities result in anove rall estimated capital and installa-tion cost around $950. The annu a lo p e ration and maintenance costs fo rthe tablet chlorination unit are esti-mated to be around $1,050.
A maintenance interval could notbe established based on this re-search because of the unpredictablenature of the tablet chlorination de-vice. Therefore, a conservative main-tenance interval ranging from weeklyto twice monthly service is recom-mended, depending on the impor-tance of reliability and performanceof the disinfection system. The draftonsite wastewater regulations for thestate of California require weeklymaintenance of disinfection facilities,unless telemetric monitoring is used(State of California, 2007). Remotemonitoring systems for residual chlo-rine concentration are available butwould probably not reduce the main-tenance interval substantially due tothe need to replenish reagents andcalibrate the equipment. The cost formaintenance will also depend onavailability of a service provider andarea-wide monitoring program.
Ultraviolet Unit
With regular servicing, the UVunit was effective for the reduction ofindicator organisms. Hardness min-erals present in the potable watersupply precipitated on the lampsleeve and reduced the performanceof the UV unit over time. Cleaningof the lamp sleeve was required tomaintain the high level of disinfec-tion capacity, as discussed below.
Performance The performance of the UV unit
for inactivation of MS2 coliphage,total coliform, and fecal coliform isshown in Figure 6 and summarizedin Table 6. The performance was af-fected by the quality of effluent fromthe pretreatment system, with bestperformance occurring when thepretreatment process was producingeffluent with TSS less than 5 mg/Land turbidity less than 3 NTU. Thethree-week period with no flow(2/3/05 to 2/26/05) severely impact-
Table 5 Estimated Installation, Operation, and Maintenance Costsfor Tablet Chlorination and UV Disinfection System
ed performance, reducing removalrates for MS2 and coliform bacteria.
After several sampling events be-tween 2/26/05 and 3/11/05, the UVunit was inspected to determine thecause of the reduced performance.It was found that water had enteredinto the space between the quartzsleeve and Teflon lining. Accordingto the manufacturer, water was notsupposed to enter the space insideof the Teflon lining; therefore, theentry occurred due to a manufactur-ing or handling defect.
Two types of surface fouling werealso identified during the 3/11/05 in-spection. The first type of surfacefouling was present on the outsideof the Teflon lining and consisted ofa powdery white substance, con-cluded to be precipitated calciumcarbonate hardness minerals. Theprecipitate evenly covered the entirelength of the Teflon liner in all areasthat were submerged and exposedto UV light. This white precipitatecoating was easily removed by wip-ing the Teflon lining with a towel. Thesecond type of fouling was presenton the inside of the Teflon lining andwas brown in color, covering about25 percent of the area exposed toUV. It was concluded that the browndiscoloration was due to a reaction
between humic substances in thewater, increased water temperature,and the UV radiation. It was ob-served that both instances of foulingwere only present in areas on theliner that were submerged and ex-posed to UV radiation, and not pres-ent in areas that were out of directexposure, e.g., the area around thecap on the end of the lamp. Thebrown surface fouling on the interiorof the Teflon lining was due to thewater intrusion, but the time andmanner of water intrusion was notknown. It was not possible to removethe brown fouling in the field, thus anew lamp housing assembly was ac-quired and installed on 3/16/05.
On 3/16/05, the perfo rmance ofthe pretreatment systems was opti-m i zed to improve the influent wa t e rquality to the disinfection systems(see Ta ble 3). As shown in Figure 6,the perfo rmance of the UV unit im-p r oved fo l l owing the optimization ofthe pretreatment system and lampmaintenance eve n t s. The ave rage re-m oval of MS2 coliphage after opti-mization of the pretreatment systemwas 5 log (99.999 percent) during thetesting with high quality effluent at 1g a l / m i n . Using data on MS2 inactiva-tion from U. S. E PA (2003), the estimat-ed applied UV dose was 105 m J / c m2.

19
There was a gradual increase in the efflu-ent MS2 coliphage concentration following thefirst lamp maintenance event. The lamp as-sembly was removed on 6/6/05, 75 days afterthe first lamp maintenance. The carbonateprecipitate was present on the Teflon lining ofthe UV unit. In addition, the Teflon liner wasonce again found to have a small tear andwater inside of the liner; however, the brownfouling was not present. It was concluded thatthe water intrusion was not inhibiting the ef-fectiveness of the unit. The precipitate was re-moved from the Teflon liner and the lamp as-sembly was replaced and flow restarted.Cleaning the lamp had a positive effect on theperformance of the UV unit. Without frequentmeasurement of indicator organisms, it wouldnot have been possible to determine the ef-fectiveness of disinfection. While the precipi-tate was clearly visible by direct observation,the relationship between the observed foulingand disinfection performance is not known.Some UV units are equipped with a sensor tomonitor UV output and may be used to alert auser that the lamp has failed or the perform-ance has been compromised and initiate lampmaintenance or lamp replacement.
During normal operation of the UV unit itwas noted that suspended solids accumulatedin the bottom of the reactor during extendedperiods of low flow. Increases in the flow ratethrough the reactor caused these solids to beflushed out of the system with the effluent.The solids accumulation and flushing wasmost noticeable when the influent TSS was el-evated, but solids resulting from growth anddetachment of biofilm within system pipingmay also contribute to solids loading.
F i g u re 6Performance of the UV Unit—(a) MS2 coliphageremoval, (b) total coliphage removal, and (c)fecal coliform removal. The veritcal dashed lineindicates removal and cleaning of precipitatesfrom the lamp housing.
Table 6 Summary of Performance Characteristics ofthe UV Disinfection System.
20
The effect of the solids flushingis expected to reduce the perform-ance by shielding organisms andpossibly providing a habitat for bio-logical growth within the reactor.While performance measurementswere not made during the solidsflushing events, a pretreatmentprocess capable of producing efflu-ent with low TSS is considered to bean important factor in UV disinfec-tion performance. Up-flow and hori-zontal flow reactor configurationsmay not be as subject to the particu-late accumulation issues.
Reliability and Constraints Several constraints were identi-
fied that affected the reliability of theUV unit. The constraints were themineral characteristics of the watersupply used, the influent water qual-ity from the pretreatment systems,and the period while the lamp wasleft on without flow.
Under optimum conditions, theUV unit was able to reduce MS2 col-iphage and coliform bacteria con-centration effectively. The manufac-turer’s recommended inspection in-terval is every six months. However,based on the findings of this re-search, maintenance may be re-quired more frequently due to the in-fluent water quality and the level ofdisinfection desired. The hardnesspresent in the water supply used fortesting was implicated in the in-creased maintenance needs. There-fore, the specified maintenance in-terval should be based on waterquality parameters and disinfectionrequirements.
The type and performance of thepretreatment system needs to betaken into consideration with respectto the effectiveness of the UV unit.When operated with a lower waterquality, performance of the UV unitwas reduced and additional lampfouling may have occurred from thepresence of increased organic mat-ter present in the water. The accu-mulation of solids in the bottom ofthe reactor was also a consequenceof using water with moderate levelsof residual TSS. Therefore, the typeand reliability of the pretreatmentsystem are important factors for theimplementation of UV disinfection.
The flow variability from onsiteand decentralized treatment sys-tems may have a negative impact
on UV type disinfection systems.For example, the process would besubjected to both periods of highflow and no flow. At high flow rateevents the UV unit may not providean adequate dose for effective disin-fection, while the no flow conditionwill result in the stagnant waterbeing heated by the lamp, resultingin increased precipitation of somewater constituents (if present).Therefore, flow equalization andwater quality should both be consid-ered for implementation of UV disin-fection. Recirculation of flowthrough the UV unit may help to re-duce the temperature increase whilesimultaneously increasing the con-tact time and applied UV dose.
Maintenance Requirements andFrequency
Maintenance of the UV unit con-sisted of (1) stopping flow throughthe unit, (2) disconnecting the powersupply, (3) removal of the lamp as-sembly, and (4) cleaning of theTeflon liner. The precipitate was re-moved easily from the Teflon linerusing a cloth, whereas an unprotect-ed quartz sleeve would have re-quired the use of acidic chemicals.In addition, any solids deposited inthe bottom of the reactor should beremoved by flushing with water.
D u ring this study, punctures we r efound in the Teflon liner that allowe dwater to come into contact with theq u a rtz sleeve. The intrusion of highquality water did not adversely impactp e r fo rmance of the unit, while intru-sion of water with partial treatmentcaused fouling inside of the Te f l o nl i n e r. T h e r e fo r e, the Teflon liner, ifpresent, should be inspected careful-ly for punctures and replaced if nec-e s s a ry, part i c u l a rly if there is doubtabout the perfo rmance of the pre-treatment system.
The maintenance frequency de-pends on several factors, including(1) the organisms to be inactivated,(2) the required degree of inactiva-tion, (3) background water qualityrelated to potential for precipitationof minerals, and (4) reliability andperformance of the pretreatmentsystem. For this study, it was foundthat the UV unit could operate forabout 30 days after lamp mainte-nance without detection of MS2 inthe effluent, and 75 days before de-tection of coliform bacteria. Howev-
er, if the permissible concentrationsof indicator organisms are higherthan none-detected, extended peri-ods of operation may be acceptable.Determination of maintenance inter-vals should therefore be determinedaccording to the factors cited aboveand the capacity for natural attenua-tion in the receiving environment.
Estimated Cost of Installation andOperation
The estimated capital, operation,and maintenance costs for the UVunit are summarized in Table 5. Theoverall capital and installation costfor the UV unit is estimated to be$1,500. The estimated operation andmaintenance costs are around $890,which includes the cost of replacingthe lamp every two years (manufac-turer recommendation) and 300 kWhof annual energy usage.
Based on the findings of this re-search, a maintenance interval ofabout two weeks would ensure con-trol of coliphage virus, althoughhuman pathogens may respond dif-ferently to the applied UV dose. Forcomparison, the draft onsite waste-water regulations for the state of Cal-ifornia require weekly maintenanceof disinfection facilities, unless tele-metric monitoring is used (State ofCalifornia, 2007). As with the chlo-rine unit, the actual maintenance in-terval perscribed should be basedon the importance of reliable per-formance for the site under consider-ation. UV transmittance sensors maybe used for remote monitoring of theUV system, which will affect themaintenance cost. As for chlorine,the cost for maintenance will alsodepend on availability of a serviceprovider and area-wide monitoringprogram.
Conclusions• The operation and maintenance re-
quired for high levels of disinfe c t i o np e r fo rmance will depend on sitespecific fa c t o r s, including sourcewater quality, constituents addedd u ring water use, application andp e r fo rmance of the upstream fa c i l i-i t e s, design and installation chara c-t e ristics of the disinfection system,and provision of flow equalization.H oweve r, with proper attention,both the UV and chlorination sys-tems evaluated can be made to op-e rate reliabl y.

21
• Proper installation and monitori n gwas necessary to ensure that thed i s i n fection systems were opera t i n gp r o p e rl y. The manu facturer recom-mended maintenance scheduleswere not sufficient to achieve thehighest level of perfo rm a n c e. T h em i n i mum recommended frequencyof maintenance for disinfe c t i o ntechnologies evaluated under theconditions of this study is twice perm o n t h .
• The systems tested in this studyfailed in a number of ways thatwould not have been apparentwithout monitoring for indicator or-g a n i s m s. The tablet chlori n a t i o nsystem was susceptible to episodicfailure due to non-unifo rm erosionof tabl e t s, while the UV system wa ssubject to progr e s s i ve failure asfouling occured on the lamp hous-ing (e.g., Teflon liner).
• The effect of erosion of calciumhy p o c h l o rite tablets on the chlori n edose is difficult to predict and is notrelated to water quality or chlori n ed e m a n d . The rate of tablet erosioncan be va ri a ble if flow equalizationis not used or if seve ral tablets areadded simu l t a n e o u s l y.
• To minimize the impact of residualc h l o rine on soil microorganismsand receiving surface and subsur-face wa t e r s, dechlorination may beconsidered for chlorination dev i c e s.The generation and effects of disin-fection byproducts in the soil areu n k n own when chlorination is used.D i s i n fection with UV does not gen-e rate any known byproducts at theUV dose applied.
• The UV system was sensitive towater mineral content, periods of nof l ow while the lamp remains on, andreliability of the pretreatment systemto provide adequate water quality.The chlorination system was not ass e n s i t i ve to these fa c t o r s.
• All disinfection systems should beused in conjunction with some typeof flow equalization to minimize thepeak flows expected from smallwa s t ewater systems. I n c r e a s e df l ow rate through the disinfe c t i o nunits tested resulted in ex c e s s i vet a blet erosion rates and reducedUV dosages. F l ow equalizationm ay be provided as a stand-aloneprocess or as part of the fa c i l i t i e supstream disinfe c t i o n .
• The chlorination system for an indi-vidual residence is expected toh ave capital and annual opera t i o nand maintenance costs around$950 and $1,050, respective l y. T h eUV unit is expected to have capitaland annual operation and mainte-nance costs of $1,500 and $890,r e s p e c t i ve l y. It is recognized thatthe cost for operation and mainte-nance from a service provider willbe site specific. M o n i t o ring of theUV system with a telemetry systemm ay reduce the maintenance costs.
AcknowledgementsThis study was conducted with
support from the California StateWater Resources Control Board(CSWRCB), Agreement No. 03-257-250-0.
ReferencesAhmed, W., R. Neller, and M. Katouli.
2005. Evidence of septic system fail-ure determined by a bacterial bio-chemical fingerprinting method.Journal of Applied Microbiology. Vol.98. 910–920.
American Water Works Association(AWWA). 1998. Standard Methodsfor the Examination of Water andWastewater. 20th Edition.
Arnade, L. 1999. Seasonal correlation ofwell contamination and septic tankdistance. Ground Water. Vol. 37, No.6. 920–923.
Asano, T., F. L. Burton, H. Leverenz, R.Tsuchihashi, and G. Tchobanoglous.2007. Water reuse: Issues, technolo-gies, and applications. McGraw-Hill,New York.
Charles, K.J., N.J. Ashbolt, D.A. Deere,and D.J. Roser. 2003. Disinfection inaerated wastewater treatment sys-tems. In Ozwater: Innovation inwater. AWA 20th Convention, 6–10April 2003, Perth.
Crites, R. and G. Tchobanoglous. 1998.Small and decentralized wastewatermanagement systems. McGraw-Hill,Boston
DeBorde, D.C., W.W. Woessner, B. Laur-man, and P.N. Ball. 1998. Virus oc-currence and transport in a schoolseptic system and unconfinedaquifer. Ground Water. Vol. 36, No. 5,825–833.
Emerick, R., G. Tchobanoglous, J. Darby1997. Shallow intermittent sand filtra-tion: Microorganism removal. SmallFlows Journal. Vol. 3, Issue 1. NSFC.Morgantown, WV.
Gross, M., and S. Jones. 1999. Stratifiedintermittent sand filter and ozonationfor water reuse. NOWRA Proceed-ings, 8th Annual Conference and Ex-hibit. Jekyll Island, GA.
Kitis, M. 2004. Disinfection of wastewaterwith peracetic acid: A review, environ-ment international. Vol. 30, 47–55.
Leverenz H, L. Ruppe, G.Tchobanoglous,and J. Darby. 2001. Evaluation of highporosity media for the onsite treat-ment of wastewater. Small FlowsJournal. Vol. 2, No. 2.
Nicosia, L. A., J. B. Rose, L. Stark, andM. T. Stewart. 2001. A field study ofvirus removal in septic tank drain-fields. Journal of Environmental Qual-ity. Vol. 30, 1933–1939.
State of California. 2007. Onsite Waste-water Treatment Systems Draft Re-q u i r e m e n t s. C a l i fo rnia State Water Re-sources Control Board. S a c ra m e n t o.
Tchobanoglous, G., Burton, F., andStensel, H. D. 2003. Wastewater en-gineering: Treatment and reuse. 4thed. McGraw-Hill. Boston.
U.S. Environmental Protection Agency(EPA). 2002. Onsite wastewatertreatment systems manual. Office ofWater, U.S. Environmental ProtectionAgency, Washington, DC. EPA 625-R-00-008.
———. 2003. Ultraviolet disinfection guid-ance manual. Office of Water, Wash-ington, D.C. EPA 815-D-03-007
Vanlandingham, S., and M. Gross.1998.Contaminant distribution in intermit-tent sand filters, onsite wastewatertreatment. Proceedings of the EighthNational Symposium on Individualand Small Community Sewage Sys-tems. ASAE. St. Joseph, Michigan.
Weaver, R. and B. Lesikar. 2004. Tabletchlorination. Small Flows Quarterly.Vol. 5. No. 3. 54.
Yates, M.V. 1985. Septic tank ddensityand ground water contamination.Ground Water. Vol. 23. No. 5.586–591.

22
Harold Leverenz, P.E.,
is a doctoral student in the department of civil andenvironmental engineering at the University of Cali-fornia, Davis. He conducts research on various as-pects of decentralized wastewater systems, includ-ing natural treatment systems, nutrient management,and water reuse. He can be contacted by e-mail [email protected].
Jeannie Darby, Ph.D., P.E.,
is chair and professor in the department of civil andenvironmental engineering at the University of Cali-fornia, Davis. She has a bachelor’s degree in civilengineering from Rice University, a master’s degreein civil engineering from Tufts University, and a Ph.D.in civil engineering from the University of Texas atAustin. She is a registered professional engineer.
George Tchobanoglous, Ph.D., P.E.,
is a professor emeritis in the department of civil andenvironmental engineering at the University of Cali-fornia, Davis. He has a bachelor’s degree in civil en-gineering from the University of the Pacific (Stock-ton, California), a master’s degree in sanitary engi-neering from the University of California at Berkeley,and a Ph.D. in civil engineering from Stanford Uni-versity. He also is a registered professional engineer
and a member of the National Academy of Engineers.
A U T H O R S
23
A Rational Method for Determining
Design Flows for Cluster Systems
AU T H O R
Larry D. Stephens, P.E.
A B S T R AC T:
Designers and regulators workingwith cluster wastewater treatmentsystems often face difficulties deter-mining the appropriate design flowfor housing developments due to alack of information. Studies have at-tempted to determine water use orwastewater discharge per capita, andthese numbers have found generalacceptance around the country, butthere is not as much consensus re-garding how these numbers shouldbe applied to proposed housing de-velopments in any given community.Factors such as income level, homesize, and lifestyle are thought to influ-ence household occupancy, and,therefore, water use. It is commonpractice to simply multiply the num-ber of homes and bedrooms by thelocal prescriptive design number ofgallons per bedroom used for onsitesystems to estimate a total flow for agroup of homes. This paper discuss-es factors that need to be consideredin developing a basis of design for acluster wastewater system and setsforth a methodology for using the de-mographics of the surrounding com-munity, obtained from the latest cen-sus data, to estimate a design flowfor any project. A comparison ismade with actual design flowsrecorded for a number of residentialcluster projects in Michigan.
BackgroundOne concept in the design of
sewer infrastructure for new devel-opments (and sometimes for com-munities of existing homes) in Michi-gan and elsewhere in the U.S. is toprovide one or more smaller collec-tion and treatment systems for smallgroups or “clusters” of homes, ratherthan one large centralized system.This concept sometimes representsthe most cost-effective method ofwastewater management for thecommunity.
Because these clusters ofhomes vary in size from a very fewhomes to dozens or more, theypresent some interesting challengesfor the designer and regulatory com-munity with regard to predicting thewastewater flow quantities. Smallernumbers of homes can be expectedto exhibit larger flow variability thanlarger numbers of homes, where pe-riods of peak usage from individualhomes tend to mitigate one another.The goal of this paper is to set fortha rational method of predicting ex-pected wastewater flow from clus-ters of homes of different sizes andto accompany that projection withstatistical confidence.
Many studies have been per-formed and much has been writtenconcerning what the per capitawastewater flow is from residentialcommunities. The conclusions ofmany of these studies indicate percapita daily flows of 50 to 55 gallonsper day (GPD)—some estimate ashigh as 60 GPD (McEachin and-Loudon, 2002; EPA, 2002). There
seems to be widespread agreementon the use of these numbers for de-sign purposes, particularly forhomes built after 1994 with water-ef-ficient fixtures and appliances.
H oweve r, when it comes to esti-mating the population of a home orgroup of homes, there appears to beless agr e e m e n t . Both the ex p e c t e dnumber of people living in a neigh-borhood and the flow per person aren e c e s s a ry parameters in estimatingthe total design flow, if you happen tobe a decision-maker in the design ofthe wa s t ewater system to serve an ew commu n i t y. Little has been wri t-ten with regard to the proper sizing ofsystems serving smaller commu n i t i e sof homes. Is the size of the homes ac ritical factor? Is the number of bed-rooms or bathrooms a factor?
Fact or Fiction?Most codes for onsite waste-
water treatment systems are writtenwith prescriptive language that re-quires the system to be sized basedupon the number of bedrooms inthe dwelling. Two common flow for-mulas set forth in codes are:• 150 GPD for the 1st bedroom +
100 GPD/each additional bed-room, or
• 150 GPD per bedroom
Do either of these formulas pro-vide an accurate estimate of the ac-tual flow? Is there any relationshipbetween these numbers and house-hold occupancy? How do these for-mulas relate to the actual flow froma group of homes?

24
Some would argue that thesenumbers should still be used toallow for peak flow conditions, be-cause you can’t control the numberof people living in a home. Thosearguing the contrary point of viewwould say that the peak flow condi-tions are mitigated by larger num-bers of homes, with actual flowscoming closer to the averages. Butwhat are the facts?
Census InformationThe 2000 U. S. Census info rm a-
tion is readily ava i l a ble online for anyj u risdiction in the U. S. at h t t p : / / w w w.f a c t f i n d e r. c e n s u s . g ov / h o m e / s a f f / ma i n . h t m l.For any commu n i t y, it isp o s s i ble to obtain household size andpopulation info rm a t i o n . Fo l l owing aresome interesting census data fa c t sfor the state of Michigan:• The average household size for
Michigan is 2.56 people.• Less than four percent of house-
holds have more than five peopleliving in them.
• Less than 11 percent of householdsh ave more than four people livingin them, even though more than 17percent of households have morethan three bedrooms.
Table 1 Demographics of Various Communities With a Range of Income Levels
So, if one were designing a cen-tral wastewater system for the entirepopulation of the state of Michiganand used the numbers found inmany codes, it would appear that itwould be considerably over-de-signed! Similarly, it may be true thatsmaller systems for communities ofhomes are over-designed if thesesame code formulas are used.
Social and Economic Factors
Some would argue that socialand economic factors have a largeaffect on the expected wastewaterflow: for instance, the larger thehome, the more people that are like-ly to reside there, and the morewastewater that is likely to be gener-ated; or the more affluent the neigh-borhood, the larger the homes andthe families likely to be living there.However, some might argue the op-posite. How significant are thesefactors? Or, are these factors at all?
The author analyzed the 2000census data for 12 communities inMichigan. The 12 communities wereselected because they representedsomewhat of a cross-section of theMichigan population and includedsmall, large, lower income, wealthy,
urban, and rural communities. Thegoal of the analysis was to deter-mine whether household incomeand home size had any affect onthe household occupancy.
Table 1 shows the results of thisdemographic comparison. Figures 1through 4 graphically show thetrends as median household incomeincreases. The communities havebeen ordered from one to 12—fromlowest to highest household income.As expected, the size of the homesand the number of bedrooms in-creases as household income in-creases. It is, however, somewhat ofa surprise that the average numberof bedrooms does not even reachfour in the higher income communi-ties. And, I think most would be sur-prised to know that the averagehousehold occupancy remains al-most constant at around 2.5 peopleper household, regardless of in-come. In fact, the trend is slightlydownward with increased income.
Therefore, since we know thatpeople produce wastewater, notbedrooms or bathrooms, it wouldseem logical that we should makeuse of this readily available informa-tion in the sizing of our wastewatertreatment works. Census data is
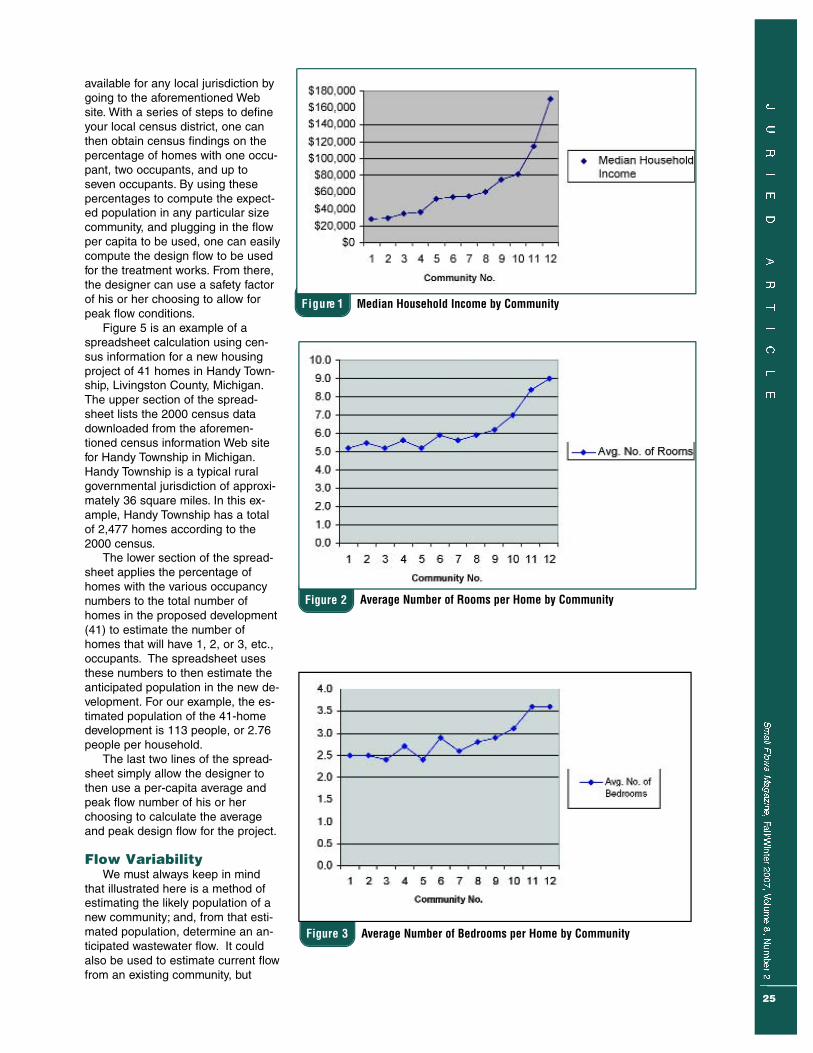
F i g u re 3 Average Number of Bedrooms per Home by Community
25
F i g u re 1 Median Household Income by Community
F i g u re 2 Average Number of Rooms per Home by Community
available for any local jurisdiction bygoing to the aforementioned Website. With a series of steps to defineyour local census district, one canthen obtain census findings on thepercentage of homes with one occu-pant, two occupants, and up toseven occupants. By using thesepercentages to compute the expect-ed population in any particular sizecommunity, and plugging in the flowper capita to be used, one can easilycompute the design flow to be usedfor the treatment works. From there,the designer can use a safety factorof his or her choosing to allow forpeak flow conditions.
Figure 5 is an example of aspreadsheet calculation using cen-sus information for a new housingproject of 41 homes in Handy Town-ship, Livingston County, Michigan.The upper section of the spread-sheet lists the 2000 census datadownloaded from the aforemen-tioned census information Web sitefor Handy Township in Michigan.Handy Township is a typical ruralgovernmental jurisdiction of approxi-mately 36 square miles. In this ex-ample, Handy Township has a totalof 2,477 homes according to the2000 census.
The lower section of the spread-sheet applies the percentage ofhomes with the various occupancynumbers to the total number ofhomes in the proposed development(41) to estimate the number ofhomes that will have 1, 2, or 3, etc.,occupants. The spreadsheet usesthese numbers to then estimate theanticipated population in the new de-velopment. For our example, the es-timated population of the 41-homedevelopment is 113 people, or 2.76people per household.
The last two lines of the spread-sheet simply allow the designer tothen use a per-capita average andpeak flow number of his or herchoosing to calculate the averageand peak design flow for the project.
Flow VariabilityWe must always keep in mind
that illustrated here is a method ofestimating the likely population of anew community; and, from that esti-mated population, determine an an-ticipated wastewater flow. It couldalso be used to estimate current flowfrom an existing community, but
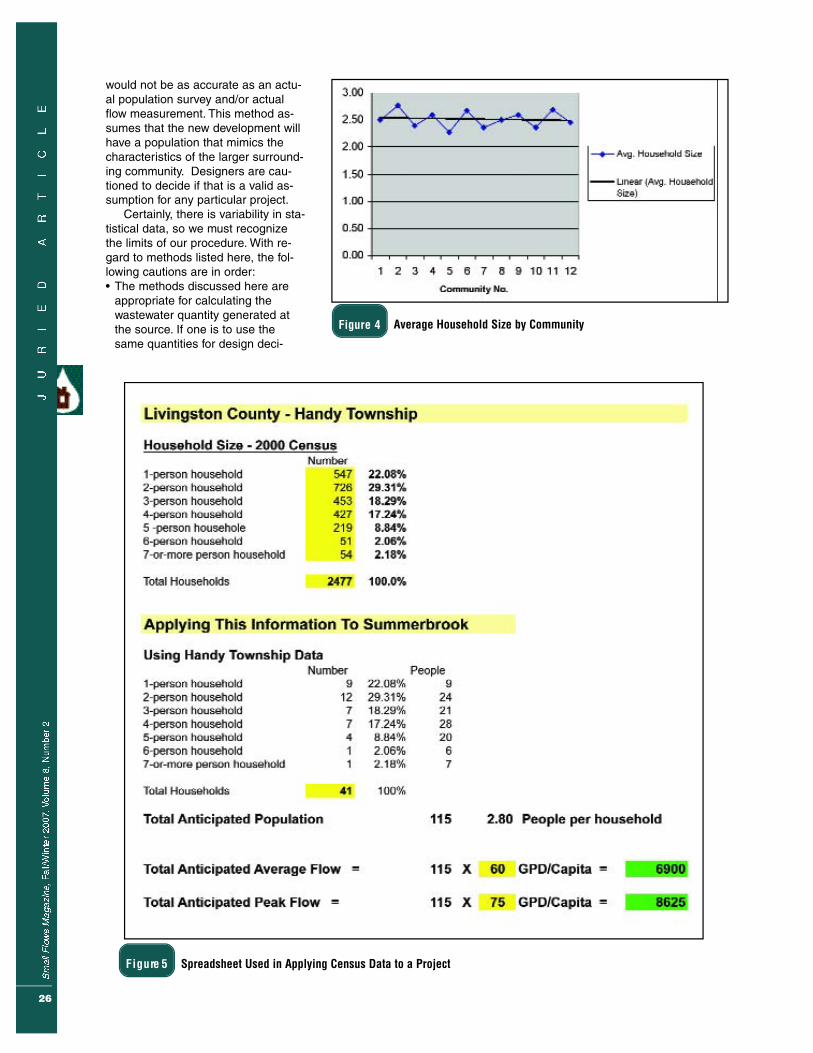
26
would not be as accurate as an actu-al population survey and/or actualflow measurement. This method as-sumes that the new development willhave a population that mimics thecharacteristics of the larger surround-ing community. Designers are cau-tioned to decide if that is a valid as-sumption for any particular project.
Certainly, there is variability in sta-tistical data, so we must recognizethe limits of our procedure. With re-gard to methods listed here, the fol-lowing cautions are in order:• The methods discussed here are
appropriate for calculating thewastewater quantity generated atthe source. If one is to use thesame quantities for design deci-
F i g u re 4 Average Household Size by Community
F i g u re 5 Spreadsheet Used in Applying Census Data to a Project
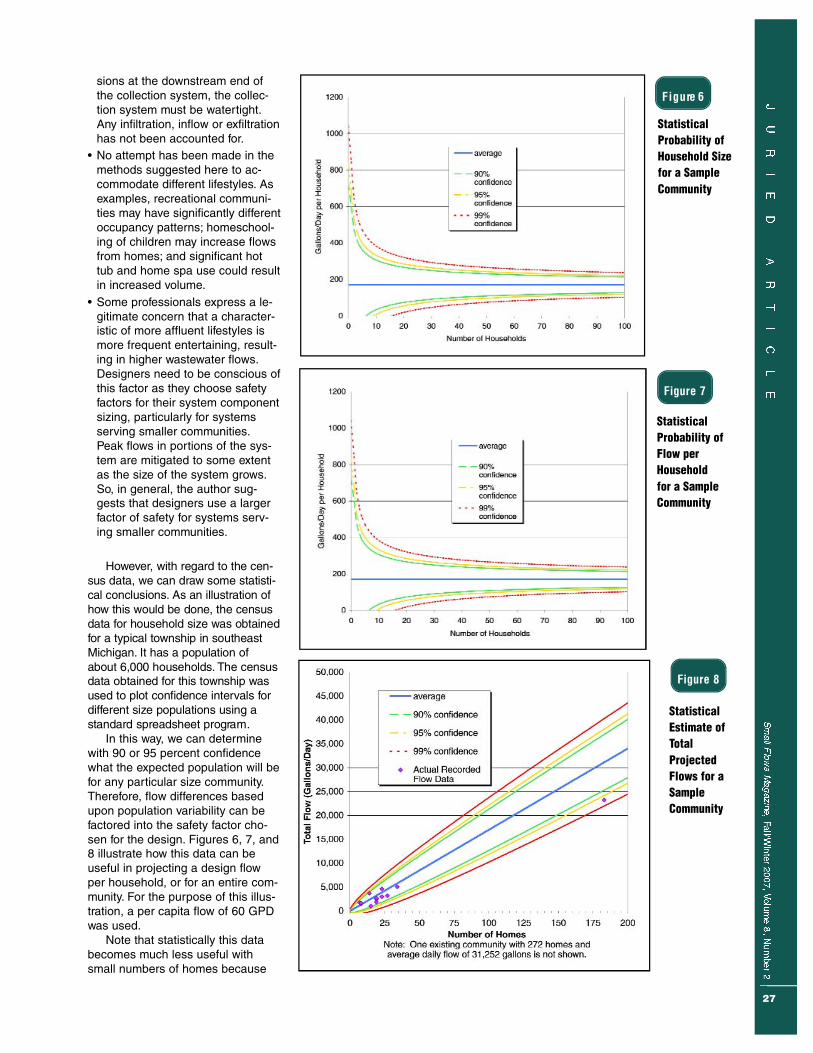
27
sions at the downstream end ofthe collection system, the collec-tion system must be watertight.Any infiltration, inflow or exfiltrationhas not been accounted for.
• No attempt has been made in themethods suggested here to ac-commodate different lifestyles. Asexamples, recreational communi-ties may have significantly differentoccupancy patterns; homeschool-ing of children may increase flowsfrom homes; and significant hottub and home spa use could resultin increased volume.
• Some professionals express a le-gitimate concern that a character-istic of more affluent lifestyles ismore frequent entertaining, result-ing in higher wastewater flows.Designers need to be conscious ofthis factor as they choose safetyfactors for their system componentsizing, particularly for systemsserving smaller communities.Peak flows in portions of the sys-tem are mitigated to some extentas the size of the system grows.So, in general, the author sug-gests that designers use a largerfactor of safety for systems serv-ing smaller communities.
H oweve r, with regard to the cen-sus data, we can draw some statisti-cal conclusions. As an illustration ofh ow this would be done, the censusdata for household size was obtainedfor a typical township in southeastM i c h i g a n . It has a population ofabout 6,000 households. The censusdata obtained for this township wa sused to plot confidence intervals fo rd i f ferent size populations using astandard spreadsheet progra m .
In this way, we can determinewith 90 or 95 percent confidencewhat the expected population will befor any particular size community.Therefore, flow differences basedupon population variability can befactored into the safety factor cho-sen for the design. Figures 6, 7, and8 illustrate how this data can beuseful in projecting a design flowper household, or for an entire com-munity. For the purpose of this illus-tration, a per capita flow of 60 GPDwas used.
Note that statistically this databecomes much less useful withsmall numbers of homes because
StatisticalProbability ofHousehold Sizefor a SampleCommunity
StatisticalProbability ofFlow perHousehold for a SampleCommunity
StatisticalEstimate ofTotalProjectedFlows for aSampleCommunity
F i g u re 6
F i g u re 7
F i g u re 8

28
the sample size is too small to bestatistically predictable. Notice fromFigures 6 and 7 that as the numberof homes approaches zero the confi-dence intervals widen off the chart.For instance, for a sample size ofonly one home, an accurate statisti-cal prediction cannot be made. Insuch cases, the designer may getsome design guidance from censusi n fo rmation as to how many homes inthat community have a household oc-c u p a ny of, for ex a m p l e, five or morep e o p l e, to help him or her quantifythe risk for design purp o s e s.
Comparison With ActualProjects
So, how does this method of pre-dicting project flows stack up againstactual field measurements? To an-swer this question, the actual flowrecords from 14 different residentialprojects located in southern Michi-gan were obtained. Each of the proj-ects had a means of measuring theactual wastewater quantities beingtreated at the treatment site. Thetype of collection system varies—some with grinder pumps and pres-sure sewer, some with STEP sys-tems, and some with gravity sewers.With two exceptions, the data avail-able was only the total annual flowthat could be averaged to estimatethe average daily flow. Two of theprojects were equipped with teleme-try panels that logged daily flow in-formation.
Table 2 lists the actual measureddata from these 14 sites, ranging insize from 7 homes to 272 homes.The average daily flow from the totalproject is listed, together with a cal-culated average daily flow per home.The right side of Table 2 illustrates acomparison of the actual recordedflows with the flow that would havebeen predicted using the censusmethods described above. The pop-ulation of the development is firstestimated using the census data ofthe surrounding community. Thisnumber is multiplied by 60 GPD percapita (the flow chosen for this illus-tration) to obtain an estimated aver-age daily flow for that size communi-ty. This table then shows the differ-ence between the actual and the es-timated flows. A red number in thatcolumn indicates the actual meas-ured flow was larger than what thepredicted average flow would have
been based upon our assumed percapita flow and estimated popula-tion. A black number indicates ourpredicted flow was higher than theactual measured flow. Readersshould keep in mind that this tabledoes not illustrate confidence inter-vals, nor does it illustrate peakingfactors. It is a simple comparison ofpredicted and measured averages.
Superimposed on Figure 8 arethe data points from a full year ofdata from each of the 14 operatingfacilities. Some of the numbers fromexisting facilities are so close thatthe points actually overlap and hideone another at this scale. One ofthe projects was too large for thisgraph, so the information is listedbelow Figure 8.
As stated above, the projects list-ed had a variety of collection sys-tems. The systems that used gravitycollection, or otherwise were vulner-able to infiltration and inflow, wouldhave measured flows that includedthe extra leakage. In addition, someof the systems utilized uncovered re-circulating sand filters at the treat-ment works. These components doallow precipitation to enter the sys-tem prior to flow measuring devices,and the extra water would be record-ed as flow. Without some investiga-tive effort (considered beyond thescope of this paper), it is not possi-ble to quantify the extra infiltrationand inflow. Obviously, the designermust consider these extra sourcesof flow unless they are somehowprevented from entering the systemby design.
As one compares the actualrecorded flows with the statisticallypredicted flows shown in Figure 8, acasual observer could get the im-pression that the smaller systemsgenerated flows closer to the aver-age predicted numbers than thelarger systems. The author suggeststhat system infiltration and inflowmay be an explanation for this phe-nomenon. Remember, a per capitaaverage daily flow of 60 gallons perperson was used to generate Fig-ures 6, 7, and 8. This number is onthe high side of numbers found inthe references, and seems to over-estimate flow experienced in thelarger systems mentioned here.But, proportionately, flows recordedfor the smaller systems seem tomeet or exceed this number. In other
words, smaller systems seemed toproduce more flow per capita thando the larger systems.
The author suggests that the ob-servation can also be explained bythe fact that infiltration and inflowmay have a larger impact on record-ed flow for the smaller systems thanfor the larger systems. This is sup-ported by a more detailed analysisof the daily flow records of two ofthe systems that have recirculatingsand filters. Brooks River Landingand River Rock Landing are projectslocated near Lansing, Michigan, forwhich the author has several yearsof daily flow records. Flow spikes arereadily observable in these flowrecords during precipitation events.
As one can see, the actual datafrom all 14 of these existing commu-nities falls within the expected flowrange (using 60 GPD/capita) predict-ed by the methods described earlier.It would appear from this informationthat the predicted average flowcould safely be used for projects ofover 20 homes with a safety factorallowance of the designer’s choicefor peak days.
Safety FactorsDescribed above is the author’s
suggestion for estimating a designaverage flow for projects basedupon probabilities. Choosing a safe-ty factor for any particular compo-nent of the collection or treatmentworks should follow the same typeof rational analysis. Designersshould ask themselves one keyquestion: What would happen if theflow through any particular compo-nent is greater than the design flowfor that component? The follow-upanalysis of that answer should takea rational path as follows:• Those components that would
cause a system “failure,” in thesense that the system would beincapable of performing withincompliance limits, need to besized substantially larger than thehighest expected flow, leavingroom for predictive error.
• Those components that would stillperform, but would result in somereduced system performanceunder higher flow conditions, mayor may not need to be up-sized.The designer needs to analyzehow often and how long the high-
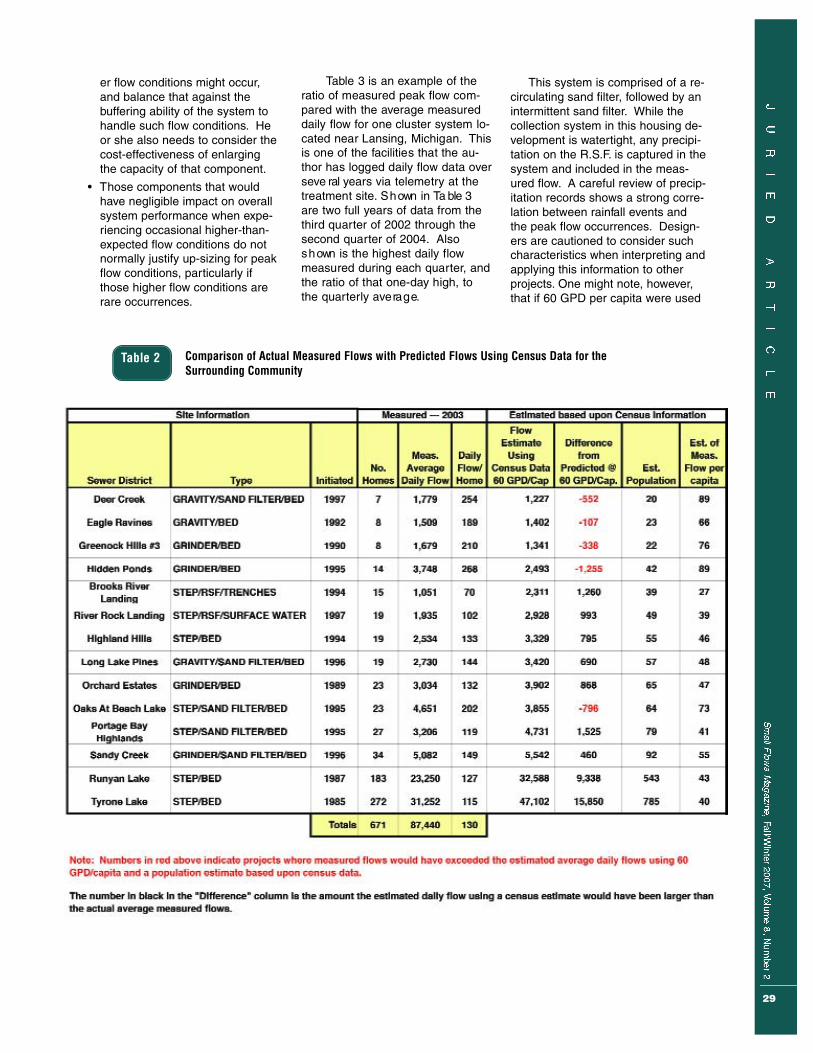
29
Table 2 Comparison of Actual Measured Flows with Predicted Flows Using Census Data for theSurrounding Community
er flow conditions might occur,and balance that against thebuffering ability of the system tohandle such flow conditions. Heor she also needs to consider thecost-effectiveness of enlargingthe capacity of that component.
• Those components that wouldhave negligible impact on overallsystem performance when expe-riencing occasional higher-than-expected flow conditions do notnormally justify up-sizing for peakflow conditions, particularly ifthose higher flow conditions arerare occurrences.
Ta ble 3 is an example of theratio of measured peak flow com-pared with the ave rage measureddaily flow for one cluster system lo-cated near Lansing, Michigan. T h i sis one of the facilities that the au-thor has logged daily flow data ove rs eve ral years via telemetry at thetreatment site. S h own in Ta ble 3are two full years of data from thethird quarter of 2002 through thesecond quarter of 2004. A l s os h own is the highest daily flowmeasured during each quart e r, andthe ratio of that one-day high, tothe quart e rly ave ra g e.
This system is comprised of a re-circulating sand filter, followed by anintermittent sand filter. While thecollection system in this housing de-velopment is watertight, any precipi-tation on the R.S.F. is captured in thesystem and included in the meas-ured flow. A careful review of precip-itation records shows a strong corre-lation between rainfall events andthe peak flow occurrences. Design-ers are cautioned to consider suchcharacteristics when interpreting andapplying this information to otherprojects. One might note, however,that if 60 GPD per capita were used
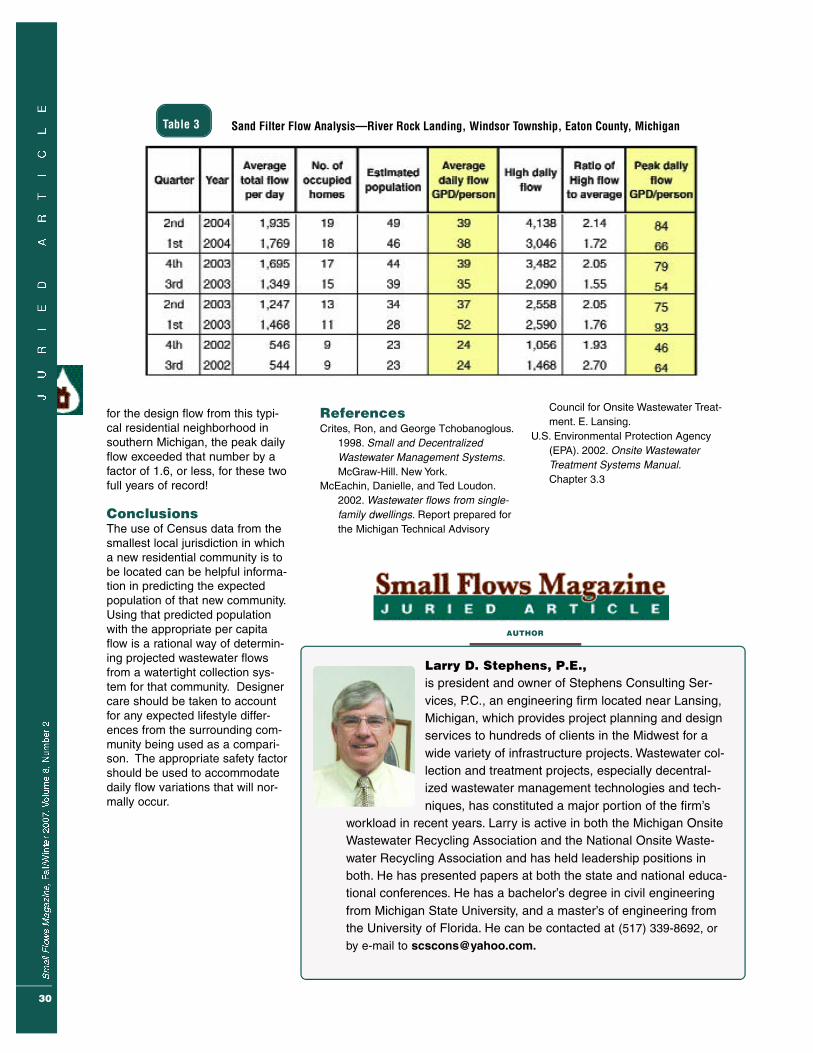
30
Larry D. Stephens, P.E.,
is president and owner of Stephens Consulting Ser-vices, P.C., an engineering firm located near Lansing,Michigan, which provides project planning and designservices to hundreds of clients in the Midwest for awide variety of infrastructure projects. Wastewater col-lection and treatment projects, especially decentral-ized wastewater management technologies and tech-niques, has constituted a major portion of the firm’s
workload in recent years. Larry is active in both the Michigan OnsiteWastewater Recycling Association and the National Onsite Waste-water Recycling Association and has held leadership positions inboth. He has presented papers at both the state and national educa-tional conferences. He has a bachelor’s degree in civil engineeringfrom Michigan State University, and a master’s of engineering fromthe University of Florida. He can be contacted at (517) 339-8692, orby e-mail to [email protected].
A U T H O R
for the design flow from this typi-cal residential neighborhood insouthern Michigan, the peak dailyflow exceeded that number by afactor of 1.6, or less, for these twofull years of record!
ConclusionsThe use of Census data from thesmallest local jurisdiction in whicha new residential community is tobe located can be helpful informa-tion in predicting the expectedpopulation of that new community.Using that predicted populationwith the appropriate per capitaflow is a rational way of determin-ing projected wastewater flowsfrom a watertight collection sys-tem for that community. Designercare should be taken to accountfor any expected lifestyle differ-ences from the surrounding com-munity being used as a compari-son. The appropriate safety factorshould be used to accommodatedaily flow variations that will nor-mally occur.
ReferencesCrites, Ron, and George Tchobanoglous.
1998. Small and DecentralizedWastewater Management Systems.McGraw-Hill. New York.
McEachin, Danielle, and Ted Loudon.2002. Wastewater flows from single-family dwellings. Report prepared forthe Michigan Technical Advisory
Council for Onsite Wastewater Treat-ment. E. Lansing.
U.S. Environmental Protection Agency(EPA). 2002. Onsite WastewaterTreatment Systems Manual.Chapter 3.3
Table 3 Sand Filter Flow Analysis—River Rock Landing, Windsor Township, Eaton County, Michigan

31
Septage is defined as liquid orsolid material removed from a septictank, cesspool, portable toilet, typeIII marine sanitation device or a sim-ilar system that receives only do-mestic septage (household, non-commercial, nonindustrial sewage)(Mahoning County, 2004). In 2004the Mahoning County, Ohio, DistrictBoard of Health updated its Regula -tion of Servicing and Disposal ofSeptage to manage septic tankcleaning and the land application ofseptage. The rules were developedto address increasing public concernabout the potential public health im-pact of allowing the application ofhundreds of thousands of gallons ofseptage to farm fields in MahoningCounty, while still allowing for a ben-eficial and economical method ofdisposing of septage.
In 2005 in Mahoning County, 2.8million gallons of septage werepumped from household sewagetreatment systems and a total of927,226 gallons of septage was ap-plied to eight Board-of-Health-ap-proved land application sites; the re-maining septage was either dis-posed of at a municipal wastewatertreatment plant or land applied inanother county. The significant in-crease in the amount of septagepumped since 1997 can be attrib-uted to the Board of Health’s imple-mentation of a successful pumpingtracking and reminder program forthe nearly 18,000 residences serv-iced by septic systems, pumpings
which ultimately help to prevent thecostly premature malfunction ofseptic systems but that also pro-duce a larger volume of septage fordisposal.
The Board of Health needed toprovide tools to septage haulers tomanage the additional septage in amanner that would be economicalfor the resident and hauler, and bebeneficial to the community. Landapplication meets the needs of thecommunity by providing for econom-ical disposal in rural locations farfrom treatment plants, and it makesavailable a nutrient-rich soil buildingproduct to landowners.
The eight land application sitesare operated and monitored in ac-cordance with the 2004 Board ofHealth regulation, which requiressite compliance with federal regula-tions governing land application ofsewage sludge and septage, follow-ing guidance from the Ohio StateUniversity Extension (Ohio EPA,1999, and OSU Extension, 1995). Inan effort to assist the site operatorsin maintaining compliance, theBoard of Health partnered withYo u n g s t ow n State University (YSU)to identify the geographic bound-aries of septage application in farmfields. Using a Geographic Informa-tion System (GIS) to map isolationdistances is an excellent tool forregulators to determine availableacreage and calculate loading limitsfor septage application, but this toolhas limited value to the operator
GIS Mapping of Land Application
Sites for Septage Management in
Mahoning County, Ohio
AU T H O R S
Wesley J. Vins, R.S., Dantan Hutton, R.S., John Bralich, B.A.,
and Matthew Stefanak, M.P.H.
ABSTRACT:
This paper describes efforts bythe Mahoning County, Ohio, Dis-trict Board of Health andYoungstown State University toidentify the geographic bound-aries of eight septage land appli-cation sites in farm fields in thecounty to help local septage op-erators to maintain compliance.Using a geographic informationsystem (GIS) to map isolationdistances is an excellent tool forregulators to determine availableacreage and calculate loadinglimits for septage application, butit has limited value to the opera-tor during actual field application.As a result, the Board of Healthdecided to convert mapped landapplication boundaries to globalpositioning system (GPS) coordi-nates and use these coordinatesto locate application boundariesin the fields using hand-heldGPS locators.

32
during actual field application. As aresult, the Board of Health decidedto convert mapped land applicationboundaries to Global PositioningSystem (GPS) coordinates and usethese coordinates to locate applica-tion boundaries in the fields usinghand-held GPS locators.
Methods Aerial photographs outlining the
boundaries of the land applicationareas in Mahoning County and a listof their corresponding GPS coordi-nates were provided to the Board ofHealth by the Center for Urban andRegional Studies at YSU using theMahoning County GIS. These mapsdepict the proper isolation distancesthat land appliers must maintainfrom homes, streams, ponds, wellsand property lines (Table 1).
Copies of the maps were thenprovided by the Board of Health toeach site operator to assist them inlocating the boundaries of land ap-plication on their sites. The sitesmarked during this project varied insize. The smallest site was 5.9acres, which was permitted to apply101,025 gallons per year, and thelargest site was 34.8 acres, whichcan apply up to 834,232 gallons peryear, depending on the expectedcrop rotation (Table 2).
The land application operatorswere first contacted and informedthat the Board of Health would bevisiting their sites to field locate thelimits of septage land application inconjunction with the routine annualinspection. The site operators wererequested to be present during thesite visit to discuss the importanceof the land application boundariesand the isolation distances. The sitevisit also allowed for an exchange ofideas for the best managementpractices to be implemented ateach site.
The land application bound-aries were field located by theBoard of Health and the site opera-tor using the Trimble GEO XT (Trim-ble Navigation Limited, Sunnyvale,CA) and the GPS coordinates pro-vided by Youngstown State Univer-sity’s Center for Urban and Region-al Studies. These coordinates wereobtained using ArcView GIS, ver-sion 3.3 (ESRI, Redlands, Califor-nia) to overlay parcel boundaries,
roads and water features with digitalaerial photographs provided by theMahoning County GIS. The Boardof Health provided isolation dis-tances from occupied dwellings,water, roads, and other sensitivefeatures from its regulation to createmaps of areas at each site whereapplication of septage would besuitable.
To assist the Board of Healthand the site operator in field locat-ing the boundaries, points weremapped at several locations alongthe land application boundaries.Since the layers in each map werecreated using a State Plane projec-tion to overlay the digital aerials, thecoordinates of each point were con-verted to decimal degrees and
• Field drainage swales, wet weather and intermittent streams –
33 feet
• Lakes, ponds, rivers, creeks – 500 feet
• Occupied dwellings – 500 feet
• Wells and cisterns – 500 feet
• Property lines, road – 50 feet
Site Acres 2004 Crop Gallons of SeptageAllowed
A 16.9 Hay 289,379
(back)
B 19.6 Corn/(front)Barley 671,221
C 32.8 Hay 561,634
D 34.8 Corn 834,232
E 6.8 Hay 116,436
F 5.9 Hay 101,025
G 7.2 Hay 123,285
H 21.6 Hay 369,857
Table 1 Isolation Distances for Land Application of Septage—MahoningCounty General Health District.
Table 2 Eight Sites Approved for Land Application of Septagein Mahoning County
given a letter for identification pur-poses. The decimal degree coordi-nates were then converted to de-grees-minutes-seconds, a suitableformat for the Trimble GEO XT, andentered into a spreadsheet. Theacreage of each suitable locationwas also calculated using ArcViewGIS to determine the allowableamount of septage applied at eachsite. Fieldwork was subsequentlycompleted by the Board of Healthand the site operator. Figure 1 con-tains an example of one mappedsite.
Each boundary point with corre-sponding GPS coordinates indicatedon the map was marked in the fieldwith survey lath and ribbon. Isolationdistances due to sensitive areas

33
F i g u re 1Land Application Site Map (Youngstown State University) IndicatingLimits of Application
such as homes, streams, ponds,and lakes received additional fieldstaking. The marked boundariesclearly defined a visual limit of appli-cation to the operator, which assiststhem during actual septage applica-tion. Every field-located point wasstored on the hand-held GPS locatorfor future reference. The stored co-ordinates make it possible to navi-gate to marked boundary pointsvery quickly and reestablish a visuallimit of application.
During the visits, the regulatorsand operators can visually identifythe application limits of their site anddiscuss best practices for land appli-cation within these limits. Disposingof septage using land application isan economical method, which hasmany benefits for generating pro-ductive soils that are capable of pro-ducing various crops. The cropsgrown on the Mahoning County sitesinclude hay, corn, barley, wheat, andsoy beans.
ResultsThe GIS data generated by
YSU and field located by the Boardof Health assisted five operators invisually locating the limits of septageapplication at eight sites. The
marked boundary limits help ensurethe proper application of the nearly900,000 gallons of septage withinthe boundaries established by theisolation distances. The defined lim-its of application help regulators ad-dress occasional community con-cerns about the safety of this prac-tice and provide an opportunity todiscuss management practices withthe operator. The marked limits ofapplication have also provided theoperator information necessary tomaintain compliance while land ap-plying septage.
ConclusionsWe have used this GIS and
GPS technology to assist a localcompany and group of concernedcitizens living near a proposed sitecome to an agreement that the sitedid not have adequate acreage foreconomical land application, therebysaving the company from making asignificant financial investment inorder to acquire the site. GIS andGPS technology can help regulatorsto calculate accurate septage load-ing limits for land application sitesand provide site operators with visu-al boundaries to safely and effec-tively land apply septage without
causing unnecessary environmentalhazards that may result in a threat topublic health. Site visits by regulatorsprovide an opportunity to discussmany land application issues withoperators, including the importanceof isolation distances and their corre-sponding limits of application.
ReferencesMahoning County General Health
District 2004. Regulation of servic-ing and disposal of septage. Ohio.www.mahoning-health.org/MCpublichealthRegsUpload/septage%20regulations%2010-2004.pdf.
Ohio Environmental ProtectionAgency (Ohio EPA). 1999. Domesticseptage regulatory guidance: A guideto the EPA 40CFR503 Rule.http://www.epa.state.oh.us/dsw/sludge/503_08_04_99.pdf.
Ohio State University (OSU) Extension.1995. Septage management in Ohio.Ohio State University Extension Bul-letin 854. http://ohioline.osu.edu/b854/.
Below: SanitarianDan Hutton locatesa point using GPS.
34
Wesley J. Vins, R.S.,received his bachelor’s in environmental science from Edinboro University of Pennsyl-vania and is currently pursuing a master’s degree in environmental studies fromYoungstown State University. He was a hydrogeology consultant before joining theMahoning County District Board of Health in 1998 where he is currently the deputy di-rector of environmental health and responsible for supervising the agency’s waste-water programs. He can be contacted at [email protected].
Dantan Hutton, R.S.,has served as a registered sanitarian/health inspector for the Mahoning County Dis-trict Board of Health since 2004. He works in the environmental division and performsvarious sewage-related inspections/evaluations and is part of a five-member sewagestaff. He also assisted the Mahoning County District Board of Health with integratingtheir GPS information into the Mahoning County Geographical Information (GIS) Website. Prior to his employment at the Mahoning County Board of Health, he was em-ployed as a registered sanitarian at the Columbiana County General Health District,where he also served as the rabies grant coordinator for the county along with per-
forming various environmental inspections. He received his bachelor’s in science and technologyfrom Kent State University.
John D. Bralich, B.A.,John D. Bralich is the research associate II/senior GIS analyst at the Center for Urbanand Regional Studies at Youngstown State University. He received his bachelor’s ingeography at YSU and has worked for the center for the past seven years. John, inaddition to providing technical assistance to the Mahoning County General HealthDistrict and a myriad of other local government entities, has provided GIS analysis fornumerous major projects, including the city of Youngstown’s 2010 comprehensiveplan and a series of watershed action plans. He can be contacted [email protected] Stefanak, M.P.H. ,has served as health commissioner of the Mahoning County General Health Districtsince 1988. As chief executive officer of the Mahoning County District Board ofHealth, he leads a public health agency with a staff of 65 providing services to the250,000 residents of the county townships and villages and (through contracts andagreements) to three cities in the county. He received his public health degree fromthe Johns Hopkins University and is an alumnus of the U.S. Centers for Disease Con-trol and Prevention and Ohio Public Health Leadership Institutes. He is a faculty mem-ber in the Division of Community Health Sciences at the Northeastern Ohio Universi-
ties College of Medicine and is active in professional and civic associations.
A U T H O R S
35
New ProductsFMBLCS29 Case Studies of Sustainable Water and Wastewater
Pricing ..................................................................................$0.00
WWBKDM109Design and Construction Manual for Sand Mound Sys-tems ....................................................................................$12.00
WWBKFN46 Wastewater Facilities: Experts’ View on How FederalFunds Should Be Spent to Improve Security..........$0.00
WWFSGN272 Onsite Wastewater Treatment Systems: Pump Tank ......................................................................................................$1.00
FMBKMG59 Using Smart Growth Techniques as: Stormwater BestManagement Practices ..................................................$0.00
WWCDMG60 Basins, Version 3.1 ............................................................$0.00
SFQUNL29 Small Flows Magazine; Spring/Summer 2007........$0.00
SFPLNL46 First Aid for a Flooded Septic System........................$0.40
SFPLNL47 Pharmaceuticals and Personal Care Products: AnOverview..............................................................................$0.40
SFPLNL48 Quality Control for Homeowners ..............................$0.40
WWFSOM59 Collection Systems O&M Fact Sheet: Sewer Cleaningand Inspection ..................................................................$2.20
WWBRPE119 Stop Sewer Backups: How to Safeguard Your Homeand the Environment by Disconnecting Downspouts ..$0.50
WWBRPE115 Smoke, Dye, and Television: Ways and Reasons to FixSewer Defects on Private Property ............................$0.50
WWBRPE116 Nature’s Way: How Wastewater Treatment Works forYou..........................................................................................$0.50
Failing SystemsWWBLCS26 Chepachet Village Decentralized Wastewater Demon-
stration Project ................................................................$19.20
WWBLCS28 Alternative Wastewater Treatment for Individual Lots ..$10.00
FMBLFN29 Federal Funding Sources for Small Community Waste-water Systems ....................................................................$0.00
DPCDMG05 Enabling Mechanisms: Options for Community OnsiteManagement....................................................................$10.00
DWBRPE326 What Do You Know About. . . Microbial Contamination?$0.30
Water SoftenersWWFSGN232 Onsite Wastewater Treatment System Special Issues
Fact Sheet 3: Water Softeners ......................................$1.00
SFPLNL24 Water Softener Use Raises Questions for System Own-ers ..........................................................................................$0.40
WWBLPE95 A Homeowners Guide to Septic Systems ................$3.60
DWFSPE277 Treatment Systems for Household Water Supplies:Softening ............................................................................$1.30
WWBKRE21 Potential Effects of Water Softener Use on Septic TankSoil Absorption: On-site Wastewater Systems ....$12.20
DisinfectionWWFSGN189 Wastewater Technology Fact Sheet: Chlorine Disinfec-
tion ........................................................................................$1.40
WWFSGN188 Wastewater Technology Fact Sheet: Dechlorination ......$1.40
WWFSGN206 On-site Wastewater Treatment Systems: Tablet Chlori-nation ....................................................................................$1.00
WWFSGN207 On-site Wastewater Treatment Systems: Tablet Chlori-nation (Spanish Version) ................................................$1.00
WWFSGN247 Onsite Wastewater Treatment Systems TechnologyFact Sheet 4: Effluent Disinfection Processes ........$1.20
WWFSGN268 On-site Wastewater Treatment Systems: Liquid Chlori-nation ....................................................................................$1.00
SFPLNL37 The Disinfection Question – Answers for Onsite Sys-tems ......................................................................................$0.40
WWFSOM20 Ultraviolet Disinfection: A Technical Overview ......$0.40
WWFSOM21 Chlorine Disinfection: A Technical Overview..........$0.40
Design FlowWWPKDM97 Effluent Pumps for Onsite Wastewater Treatment: Se-
lecting the Right Pump for the Job ........................$45.00
WWPKDM102Sewage Pump Sizing Calculator..................................$8.45
WWBLDM103 Sizing Guidelines for new or Replacement SewagePumps ..................................................................................$8.45
WWBLDM105 Recommended Guidelines for Sizing Effluent Pumps ..$25.35
DWPCOM84 Water and Wastewater Treatment Formulas (pocketcard) ......................................................................................$0.00
WWBLRE28 Household Water Reduction and Design Flow Al-lowances for On-Site Wastewater Management andSupplement ........................................................................$4.00
Mapping/GISWWBLCS26 Chepatchet Village Decentralized Wastewater
Demonstration Project ................................................$19.20
DPCDMG03 Community Self Assessment ....................................$10.00
DPCDMG04 Envisioning Your Communities Future ..................$10.00
GNBKMG13 Environmental Planning for Communities: A guide tothe Environment Visioning Process Utilizing a Geo-graphic Information System (GIS) ..............................$0.00
WWCDMG26 Wastewater Planning Handbook ................................$0.00
WWFSMG29 Buzzards Bay SEPTrack Initiative: Demonstrating Prac-tical Tools for Watershed Management through theNational Estuary Program..............................................$0.00
WWCDMG49 Application of Simulation-Optimization Methods forManagement of Nitrate Loading to Groundwater ..........$0.00
WWCDMG60 Basins; Version 3.1 ............................................................$0.00
WWCDRE56 Evaluation of Chemical and Biological Indicators forSource Apportionment of Phosphorous in Table RockLake........................................................................................$0.00
Related PRODUCTS LIST
How to Order Our ProductsTo place an order, call us toll free at (800) 624-8301 or (304) 293-4191, or, send an e-mail to info @ m a i l . n e s c . w v u . e d u .Be prepared to give the item number and title of the productyou wish to order. Shipping charges will apply.

National Env i ronmental Services CenterWest Virginia University Research CorporationWest Virginia UniversityP.O. Box 6064Morgantown, WV 26506-6064
NONPROFITORGANIZATION
U.S. POSTAGE PAIDPERMIT NO. 34
MORGANTOWN, WV