MS2 workflow training
26
MARINE WORKFLOW MS2 SURFACE GENERATION AND QUALITY CONTROL IQmulus Training Module U5
-
Upload
angela-olasz -
Category
Technology
-
view
35 -
download
0
Transcript of MS2 workflow training

MARINE WORKFLOW MS2SURFACE GENERATION AND
QUALITY CONTROL
IQmulus Training Module U5

2
MARINE WORKFLOW MS2
The aim of this workflow is • to create one seamless surface from a collection of data surves• to check the accuracy of the surface with respect to the data
points
A number of possibly overlapping data surveys are given as input to the workflow. The surveys may be acquired by different methods and have different patterns.
The point cloud combined from all data surveys is approximated by one or more LR B-spline surfaces. These are piecewise polynomial surfaces defined on a rectangular domain, but the division into polynomial patches is non-regular.
The surface set is prepared for raster generation (geotiff) with a user selected resolution.Possible pattern of
polynomial patches

3
SELECTING THE WORKFLOW
The workflow is called "Marine showcase 2" and can be found in the "Select workflow" window using the IQmulus Vizard
4
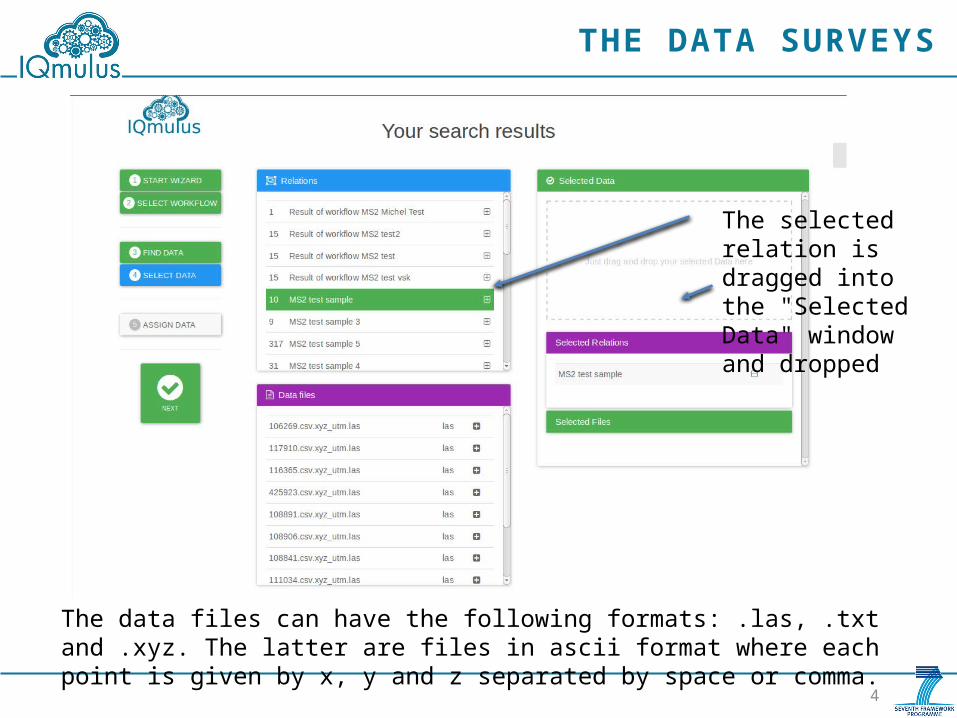
THE DATA SURVEYS
The data files can have the following formats: .las, .txt and .xyz. The latter are files in ascii format where each point is given by x, y and z separated by space or comma.
The selected relation is dragged into the "Selected Data" window and dropped

5
MS2 SERVICES AND DSL
The next 10 slides will • describe the MS2 services in some detail • show the part of the DSL associated to each service• show the service information that can be found from the
IQmulus GUI

6
MS2 SERVICES: CREATE METADATA
Service 138 collects metadata from the given data surveys and builds a three of metadata files that is used to transfer information from one service to subsequent ones throughout the workflow and provides input for visualization using IQmulusViz
Assign the selected relation to the surveys keyword in the DSL

7
MS2 SERVICES: DEFINE TILING
Service 128 checks if the accumulated number of data points is too big to be effectively approximated by one surface. If so a regular, axis parallel tiling is defined
The root of the metadata tree defined in Service 136
Metadata for the selected tile structure and placeholders for surfaces

8
MS2 SERVICES: PERFORM TILING
Service 129 perform the tiling defined by Service 128. The computation is distributed with respect to the initial data surveys.
Loop over all metadata files corresponding to input data files
Tiling definition from Service 128
Specifies the format of the file containing the tiled point clouds. If used with the hdfs file system use 0
Tiled data files and corresponding meta files are constructed

9
MS2 SERVICES: SURFACE GENERATION
Service 122 performs the actual surface generation and is the main service in the workflow. It uses the metadata information created by the previous services and one surface placeholder file from Service 128 to fetch the relevant point cloud and define conditions to the surface generation.The surface generation is done through an iterative procedure and at each step the point cloud is approximated. The number of degrees of freedom for the surface will increase for each step.The optional argument MBAthreshold can be used to govern the approximation process in some detail.

10
MS2 SERVICES: SURFACE TRIMMING
The surface created by Service 122 has a rectangular domain. Service 125 is used to adapt the valid part of the surface to the actual domain of the point cloud.
This service is not crucial for subsequent services, but may imply that undefined surface areas are given to visualization and raster definition. If the user has the knowledge that he or she can restrict the surface to its valid parts after the workflow, this service can be omitted.

11
MS2 SERVICES: SURFACE GENERATION DSL
Service 122 and Service 125 is performed for each tile. The loop content is executed for each surface placeholder file that was defined in Service 128
The argument tolerance is a threshold governing where to add new degrees of freedom to the surface representation rather then a tolerance. The surface will typically approximate most points with a much higher accuracy while some points (outliers and some points in areas with surface rounghness) will have a larger distance
Typically between 4 and 7. Governs the accuracy of the approximation. Point clouds from one data survey or with high degree of consistency should typically have a higher maxNumberIteration number than 4
Metadata information from previous services
Governs how tight the trimming loop surrounds the point cloud. Typically in the interval [3,7]. Uniform and dense point clouds can use a higher number.

12
MS2 SERVICES: STITCHING
The generated surfaces are almost continuous and smooth, but to get a true C1 surface collection Service 85 must be applied
Metadata information Previously generated surfaces
Same threshold as in surface generation
Part of the result to be visualizedThe service must not be started before all surfaces are generated

13
MS2 SERVICES: MERGE TILE FOLDERS
Service 1261 collects all metadata information for tiled point clouds into one folder to prepare for Service 126. This service is related to the multi node execution for the tiles.
MetadataThe service must not be started before the previous ones are completed
Folder for all tile metadata files

14
MS2 SERVICES: COMPUTE DISTANCE F IELD
Service 126 computes the distances between the tiled point clouds and the associated surface and stores the distance field (x, y, z, signed distance). The result are used by the visualization. Some distance field statistics are stored in the tile metafiles.
The service is parallelized on the point tiles.
The viewer requires the distance field to be stored as an ascii txt file. Also ply is supported.
Computed distance fields
Not used for MS2

15
MS2 SERVICES: PREPARE FOR RASTER
Service 137 creates metadata for the surface created in the workflow and performs a reparameterization if necessary (in some occasions the data points are scaled by Service 129).Service 138 is able to take this input and create a GeoTiff raster.
Surface metafile
Folder for final surfaces
Service 138 can create rasters with different resolution from the same MS2 results

16
RESULTS
Select results
The files produces by the workflow appears here in a flat organization. Due to the result organization, this looks a bit overwhelming
Workflow results were the folder structure is maintained is available here
17
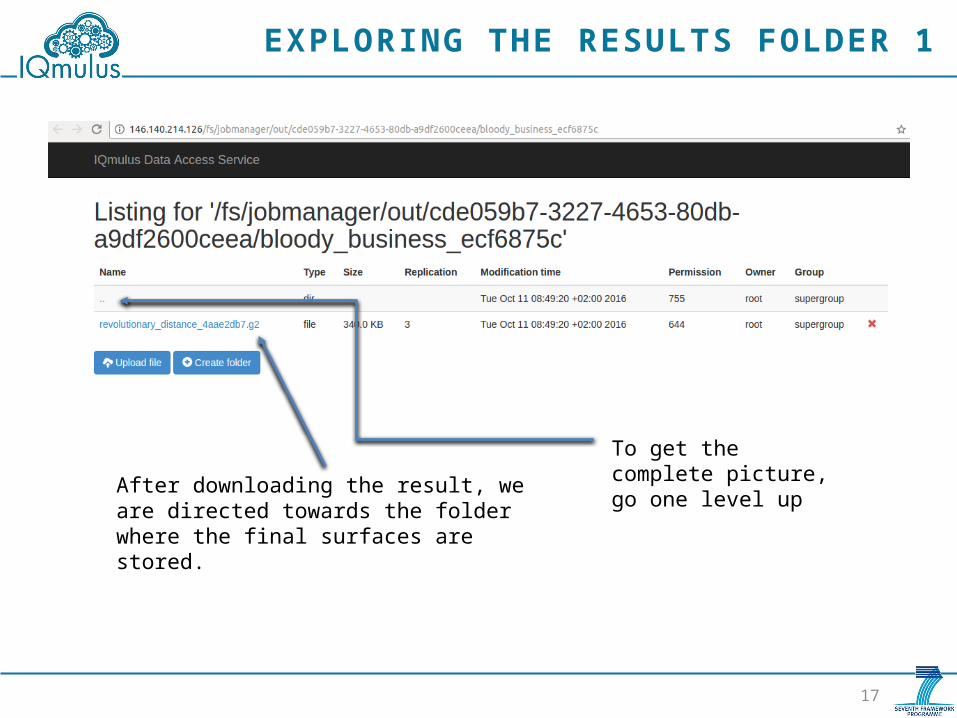
EXPLORING THE RESULTS FOLDER 1
After downloading the result, we are directed towards the folder where the final surfaces are stored.
To get the complete picture, go one level up

18
EXPLORING THE RESULTS 2
Metadata for the folder structure, surfaces prepared for viewing and distance fields
Metadata for creation of geotiff DEM from LR B-spline surfaces

19
IQMULUSVIZ
• IQmulusViz is a stand alone viewer for visualizing LR B-spline surfaces and associated distance field
• IQmulusViz is in particular dedicated to exploring results of the MS1 and the MS2 workflows
• The view can be run under Windows or Linux• Access to the hdfs file system is only available with
Windows• A NVIDIA graphics card is required

20
STARTING IQMULUSVIZ
Graphic view
Menu before any data is fetched. An initial threshold to avoid reading points very close to the approximating surfaces can be set (prior to reading any data). The cube map in the background can be turned on and off.
Typing h in the graphic view, some general information and navigation help are displayed in a separate console window (the start up window for Linux)

21
READING MS2 RESULTS FROM HDFS
1. Press ctrl + l in the main window2. The login window to the file system will appear a) Fetch the hdfs address from the workflow resultsb) Write the address in the top line indicated in the figurec) Log in
3. Right click on the file xxx.surveymeta.json and select visualize
4. One or more surfaces appear in the graphic view. Manoeuvre the model to get a good view

22
VISUALIZE SURFACES
Initially, only the surfaces are visualized
Open the menu
Turn on and off boundaries of the polynomial patches defining the surface(s)
List of surfaces
Menu related to point clouds and distance fields
List of point clouds

23
VISUALIZE POINT CLOUDS
Turn on visualization of all points
Set point size
Blue points lie above the surface with a distance larger than the threshold selected in the scroll bar, red points lie below and green points lie on both sides of the surface and are closer than the threshold
Toggle between removal of points closer to the surface than the threshold and colouring the points green. Useful for large point clouds.

24
FETCH INFORMATION FROM SINGLE POINTS
Ctrl + left click pointing at a point reveals the following information:• Point id• Geographical
location (x, y). If the data set is given in WGS84, this information is scaled
• Height (z)• Distance to surface• Id of associated point
cloud• Name of associated
surface
Ctrl + left click pointing at a surface gives the surface name

25
SELECTING DATA SURVEYS FOR INSPECTION
To fetch a subset of data surveys for closer examination, either• Select the survey in
the all surveys list• Ctrl + right click on a
point in the survey• Ctrl + right click on a
surface (results in all surveys overlapping the surface)
The selected surveys will appear in a short list enabling individual manipulation

26
INSPECT INDIVIDUAL SURVEYS
Turn on and off current surveys (the Display all surveys button must be turned off)
Individual points size. Can be used to distinguish between surveys
Individual distance thresholding
Maximum distance between data survey and surface