mro.massey.ac.nz€¦ · ABSTRACT The dairy sector is important to Argentina because it creates...
253
Copyright is owned by the Author of the thesis. Permission is given for a copy to be downloaded by an individual for the purpose of research and private study only. The thesis may not be reproduced elsewhere without the permission of the Author.
Transcript of mro.massey.ac.nz€¦ · ABSTRACT The dairy sector is important to Argentina because it creates...

Copyright is owned by the Author of the thesis. Permission is given for a copy to be downloaded by an individual for the purpose of research and private study only. The thesis may not be reproduced elsewhere without the permission of the Author.

Adopting New Zealand dairy farm principles and practices in Argentina
A thesis presented in partial fulfilment of the requirements
for the degree of Masters in Applied Science
in Agribusiness
at Massey University, Palmerston North,
New Zealand.
Matias Peluffo
2005


ABSTRACT
The dairy sector is important to Argentina because it creates genuine wea lth and employment. The competit iveness o f Argent ine dairy farms is crucial to the endurance of the dairy sector. One way to increase the competi t iveness of dairy farm systems is to incorporate beneficial innovations. New Zea land (hereafter NZ) dairy systems are international ly known for their competit iveness without the presence of subsidies. Argent ine dairy farmers have been attracted to NZ systems for more than 40 years. Simultaneously, NZ researchers and extension agents have been interested in extending NZ knowledge to Argent ina . Despite the fact that the NZ knowledge appears to be beneficial to Argent ine farms, and after so many resources spent, NZ practices have been rarely adopted. This seemingly fru it less effort in extending th i s technology shapes the research question of the present study: Can Argentine dairyfarmers bene.frt .fi·om adopting Ne\\' Zealand daily.farm principles and practices?
The main objectives o f the research are the fol lowing: I) Define a group of New Zealand ideas, practices and technologies that could be cons idered potent ial ly useful innovations for Argentine dairy farmers. 2) Assess the adopt ion and reject ion of the NZ innovations by a group of Argentine farmers. 3) Ident ify the reasons of adoption and reject ion for each innovation. 4) Describe the impact o f the adoption in the physical and financial performance of the farms. 5) Assess which have been the main causes of the non-spread of NZ innovat ions in Argentine dairy farms.
Seven Argent ine dairy farmers, who were aware of NZ dairy systems, were selected as case studies. The data was col lected through interviews, farm physical and economic records, and a field visit to the farm. In order to invest igate the Argentine socio-economic environment and the Argentine dairy sector, relevant l i terature was reviewed and two key industry informants were interviewed. Two frameworks were uti l ized to ana lyse the qual itat ive and quant itat ive data: the Diffusion Theory (Rogers, 2003) and the IFCN network (International Farm Comparison Network www. i lcnnctwork.org), respectively.
Ten NZ innovat ions were defined; they were principles and practices considered typical in NZ dairy farms and not common in Argent ine dairy farms . The innovations were related to four areas of the dairy system: pasture management, herd management & genet ics, farm structure & organization, and human resources. The seven farmers di ffered in the level of adopt ion or rej ection of the innovations. The two innovat ions most adopted were: Focus on Product ion per Hectare and NZ Style of
M i lk ing Shed and M i lk ing System; and the two least adopted were: Less than 1 5 cows per Set of Teat-cups and other innovat ions related to labour productivity and Util izat ion of Formal Pasture Budgets . Some associations were found between the level of adoption of NZ innovations by the case study farms, the most relevant fol lows: increments in Return on Investment (RO I ); reduction of land costs per kg of m ilk produced and increments in labour product ivi ty. The NZ principle Less than 1 5 cows per Set of Teat-cups was found to be the innovation most c losely associated with increase in labour productivity. NZ Genetics cows were found to be necessary for the adoption of seasonal calving. An association was found between the adoption of NZ Genet ics and higher mi lk yield per k ilogram of l ive weight, and l ower mortality and replacement rates, than those that had not adopted.
11


ACKNOWLEDGEMENTS
Thanks to the NZA ID program for granting me the scholarship that made it possible for me to come to New Zealand to study. Without it. the achievement of this Master's would have been much more difficult.
I cannot find the words to thank sufficiently my supervisors Nicola Shadbolt and Colin Holmes. Nicola. I am deeply grateful for sharing your knowledge and time with me. I want to express gratitude to you for always being so positive and for believing in me. Professor Holmes, what an honour for me to have the opportunity to work with you. I will never forget your example of commitment to your work. to your students, and to the NZ dairy industry. Thank you both for clarifying and refining my thinking. rough ideas were conve11ed with your effort into academic writing. In Argentina. I would want to show my gratitude to Bernardo Ostrowski. the IFCN coordinator for Argentina.
I would like to acknowledge the seven Argentine dairy farmers that participated in the present research. Thank you for your trust and for providing me with data from your farms, thank you also for receiving me so well in your farms and for sharing with me part of your
experience and wisdom.
I would also like to acknowledge the staff at Massey University for this wonderful two years of living in Palmerston Nonh. Especially thanks to Susan Flynn from the International Student's Office. and to Yvonne Parks and Matthew Levin from the Institute of Food
Nutrition and Human Health.
To my friends from the Larin A111erica Socicrrfor rhe Del•elop111enr of" NZ DaitT lndusrn Hector Laca-Yii'ia from Uruguay and Rene Pinochet from Chile. Thank you for those passionate discussions about dairy farmers, and their farms· productivities. risks and returns.
Thanks to you Gonzalo Tui'ion and to you Javier Baudracco. for reading my drafts and for providing valuable alternative views of Z and Argentine dairy systems and dairy farmers. Thank you for sharing the same passion for dairying. but thank to you the most for being such good friends.
Alan & Carola. Ana. Yicky and Maca. you are incredible people that have made the word "friendship·· more meaningful. Thank to you for enriching our perception of the world with
your different views. We feel lucky that God crossed our paths. My parents and brothers and sisters back at home, I missed you all a lot. Dad I am especially grateful to you for your constant support. for introducing me into the fascinating world of dairy fanning, and for initiating me in the adoption of NZ principles in Argentine farms.
Finally. my greatest gratitude and appreciation goes to my brilliant and beautiful Maria Elisa.
Thank to you Eli for helping me so much by correcting patiently my grammar, and for your constant support and encouragement during these two years of intensive experience. I am so happy that I married to you; life would be meaningless without you. Lastly, thank to you God for the gift of our baby that is still to be bom.
Ill


ACKNOWLEDGEMENTS
Thanks to the NZAID program for granting me the scholarship that made it possible for me to come to New Zealand t o study. Without it, the achievement o f this Master's would have been much more d ifficu lt.
I cannot find the words to thank suffic ient ly my supervisors N icola Shadbolt and Colin Holmes. Nicola, I am deeply grateful for sharing your know ledge and t ime with me. I want to express gratitude to you for a lways being so posit ive and for believing in me. Professor Holmes, what an honour for me to have the opportunity to work with you, I w i l l never forget your example of commitment to your work, to your students, and to the NZ dairy industry. Thank you both for clarifying and refining my thinking, rough ideas were converted with your effort into academic writ ing. ln Argent ina, I would want to show my gratitude to Bernardo Ostrowski, the I FCN coordinator for Argent ina.
I would l i ke to acknowledge the seven Argentine dairy farmers that participated in the present research. Thank you for your trust and for providing me with data from your farms, thank you also for receiving me so well in your farms and tor sharing with me part of your experience and wisdom.
I would a lso l ike to acknowledge the staff at Massey University for this wonderful two years of l iving in Palmerston North. Especial ly thanks to Susan Flynn from the Internationa l Student's Office, and to Yvonne Parks and Matthew Levin from the I nstitute of Food Nutrition and Human Hea lth.
To my friends from the Latin America Societvfor the Development of NZ Dairv lndustrv Hector Laca-Vit1a from Uruguay and Rene Pinochet from Chile. Thank you for those passionate discussions about da iry farmers, and their farms' productivit ies, risks and returns.
Thanks to you Gonzalo Tut1on and to you Javier Baudracco, tor reading my drafts and for providing valuable alternat ive views of NZ and Argentine da iry systems and da iry farmers. Thank you for sharing the same passion tor dairying, but thank to you the most for being such good friends.
Alan & Carola , Ana, Vicky and Maca, you are incredible people that have made the word "friendship" more meaningful. Thank to you for enr iching our perception of the world with your different views. We feel lucky that God crossed our paths. My parents and brothers and sisters back at home, I missed you all a lot. Dad I am especia l ly grateful to you for your constant support, for introducing me into the fascinating world of dairy farming, and for initiating me in the adoption of NZ princip les in Argentine fanns.
Fina l ly, my greatest gratitude and appreciat ion goes to my bri l l iant and beautiful Maria E l i sa. Thank to you El i for helping me so much by correcting pat iently my grammar, and for your constant support and encouragement during these two years of intensive experience. I am so happy that I married to you; l ife would be meaningless w ithout you. Last ly, thank to you God for the gift of our baby that is st i l l to be born.
IV


Table of Contents (in brief)
INTRODUCTION ....................................................................................................... 13
2 THEORETICAL FRAMEWORK ............................................................................. 17
3 DAIRY SECTORS: NEW ZEALAND AND ARGENTINA .................................. .41
4 DAIRY FARM SYSTEMS: NEW ZEALAND AND ARGENTIN A ...................... 53
5 METHODOLOGY ...................................................................................................... 89 6 NEW ZEALAND INNOVATIONS FOR ARGENTINA ............•.......................... 107
7 RESULTS (PART I) ................................................................................................. 120
8 RESULTS (PART 2) ................................................................................................. 176
9 DISCUSSION ............................................................................................................. 215
10 CONCLUSIONS ........................................................................................................ 235
11 RE FERENCES ...............................................................................•.......................... 241
IV
Table of Contents (in detail)
1 INTRODUCTI()N ....................................................................................................... 13
1.1 BACKGROUND ............................................. . . . . . .. . . . . . .............. ................ ... . . . ..... . . . . . 13 1.2 THE PROBLEM, THE QUESTION AND THE OBJECTIVES ....... . . ... ............. . . . . . . .......... 15
2 THE()RETICAL FRAMEWORK ............................................................................ 17
2.1 DIFfUSION OF INNOVATIONS ....................................................................... . . . . ... . . 17 2.1.1 History()/' the Diffusion Theory ........................................................................ 17
2.1.2 Innovation-decision process ............................................................................. 21 2.1.3 Factors Influencing the Rate oj'Adoption ........................................................ 25
2.1.4 Innovativeness and adopter categories ............................................................ 31 2.2 CRITICISMS OF AND RESPONSES TO DIFFUSION THEORY .......... . . . . . . . . . . . . ..... ...... . . . . 33
2.2.1 Pro-Innovation Bias ......................................................................................... 33 2.2.2 Person-Blame Bias ........................................................................................... 35 2.2.3 Pro-lnnovativeness Bias ................................................................................... 35 2.2.4 Heterogeneous Social Systems ......................................................................... 36
2.2.5 Diffusion Theory and "top-down" Models of Extension .................................. 37 2.2.6 Participator.v Approaches and Difji1sion 771eor_v ............................................. 37
2.3 CONSTRAINTS ON ADOPTION OF INNOVATIONS IN AGRICULTURE . . . . ....... . .......... 38 2.3.1 Perceived Attributes of'lnnovations ................................................................. 39 2.3.2 Characteristics of the Social System ................................................................ 40 2.3.3 Communication Channels ................................................................................ 40 2.3.4 Ertension Agency and Agents .......................................................................... 40
3 DAIRY SECTORS: NEW ZEALAND AND ARGENTINA ................................... 41
3.1 NEW ZEALAND DAIRY SECTOR ......... . . . . .. . . . . . . ............. ................... . . . .................... 41 3.1.1 Physical and Economic Foundations ............................................................... 41 3.1.2 Economic Environment .................................................................................... 42 3.1.3 Milk Price paid to farmers ............................................................................... 43 3.1.4 Structure qf the Sector ...................................................................................... 44 3.1.5 Si:::e and Growth of the Sector .......................................................................... 45
3.2 ARGENTINE DAIRY SECTOR . ........... . . . ... .. ... ..................................... . . . . . . . ... ... . . . . . . . . 47 3.2. 1 Physical and Economic Foundations ............................................................... 47 3.2.2 Economic Enviromnent .................................................................................... 48
3.2.3 Milk Price paid to fanners ............................................................................... 49
3.2.4 Structure of the Sector ...................................................................................... 50 3.2.5 Si:::e and Growth of the Sector .......................................................................... 51
4 DAIRY FARM SYSTEMS: NEW ZEALAND AND ARGENTINA ...................... 53
4.1 THE IFCN ...................... ................................................ .......... ............................. 53 4.2 TYPICAL DAIRY FARMS (lFCN) . . .......................... . . ... .. . .. ..................................... 55
4.2. 1 NZ-239-cows and AR-350-cows farm models .................................................. 55
4.2.2 Contrast of NZ-239 and AR-350 ...................................................................... 58 4.2.3 Four More T)pical Farms ................................................................................ 59
4.3 THE IFCN METHOD FOR DAIRY FARMS ............................................................... 62
4.4 PERrORMANCE Or TYPICAL FARMS ............................................................... ...... 64 4.4. 1 Milk Prices, Pn>f'its and Returns on lm•estment ............................................... 64 4.4.2 Operating Profit Margin and Management Levels .......................................... 68
4.4.3 Milk Production Costs ..................................................................................... 69 4.4.4 Costs of Milk Production Only, and Non-milk Returns .................................... 70 4.4.5 Costs components (/FCN) ................................................................................ 74
V

4.4.6
4.4.7
4.4.8
4.4.9
4.5
Labour .............................................................................................................. 74
Land ............... ............................................ .... . . . . . ............. . ....... . . ....................... 77
Capital .............................................................................................................. 81
Costs as Mea11S of Production .......................................................................... 85
CHAPTER SUMMARY ............................................................................................. 86
5 METHODOLOGY ...................................................................................................... 89 5.1 RESEARCH STRATEGY ........................................................................................... 89
5.1.1 The Case Study ................................................................................................. 89
5.1.2 D escriptil• eResearch ........................................................................................ 90
5./.3 Case Study Designs .......................................................................................... 9/
5.1.4 Cases Selection ................................................................................................. 94
5./.5 Enhancing the Qual itr of the Research ........................................................... 96
5.2 DATA COLLECTION ............................................................................................... 99
5.2.1 Main Data Collection Techniques .................................................................... 99
5.2.2 Principles for data collection ......................................................................... 102
5.2.3 Perception Questimmaire ............................................................................... 103
5.3 DATA ANALYSIS ................................................................................................. 103
5.3.1 The Context ..................................................................................................... 104
5.3.2 The Cases ........................................................................................................ 104
6 NEW ZEALAND INNOVATIONS FOR ARGENTINA ....................................... I07
6.1 SELECTION OF THE NEW ZEALAND INNOVATIONS .. .. 00 . . . . . . . . . . . . . . 00 .. . .. . . . . ............. . 107
6.2 DEFINITION OF NEW ZEALAND INNOVATIONS FOR ARGENTINA ........................ 1 09
7 RESULTS (PART I) ................................................................................................. 120
7.1 THE CASE STUDY FARMS: ADOPTION AND REJECTIO OF NEW ZEALAND
I NOVATIONS ....................... ................. . .. oo ........ ..... . . . . . .......... ............... ... ............ ............ 120
7././ Fanllf ............................................................................................................ /22
7./.2 7./.3
7.1.4
7.1.5
7.1.6
7.1.7
7.2
7.3
Fan11 2 ............................................................................................................ 130
Fan11 3 ............................................................................................................ 139
Farm 4 .... .......................... 00 • • 0 0 ... . .. .. . . .... . . . ... . ......... . . . .............. . .......... . ............. 146
Fan11 5 ............................................................................................................ !52
Farm6 ............................................................................................................ !57
Fann 7 ... . .... . ....... . .................. ........... ..... .. . . ...... . ..... ... 00 . ..................... ............. . /65
SUMMARY OF ADOPTION OF NZ I NOVATIONS BY THE CASE STUDY FARMS ... 171
THE CONTEXT: PERCEPTION OF THE ATTRIBUTES OF THE INNOVATIONS .......... 172
8 RESULTS (PART 2) ................................................................................................. 176
8.1 PERFORMANCE OF THE CASE STUDIES: ASSOCIATION WITH ADOPTIO OF NEW
ZEALAND l OVA TIONS .................................................................................................. 176
8././ Definition of the seasons to be analy sed ......................................................... 176
8.1.2 The Case Studies in!FCN Fonnat ........... ................. oo .. . . ................. . . . ............ /79
8.1.3 Financial Performance ................................................................................... 180
8.1.4 Total Costs ....... ..... . . . . . . . ..................................... . . .... . . . . . . . 00 ............................... 189
8.1.5 Costs of Milk Production Only. Non-milk Returns. Animal Purchases, and Replacement and Mortality Rates ................................................................................ 190
8.1.6 Costs Components (IFCN) .............................................................................. 195 8./.7 Labour ............................................................................................................ 196
8.1.8 Land ................................................................................................................ 20 I
8./.9 Capital ............................................................................................................ 207 8.1.10 Milk Yield ................................................................................................... 210
8.1. 1 I Costs as Means of Production .................................................................... 212
8.2 CHAPTER SUMMARY ........................................................................................... 213
VI

9 DISCUSSION ............................................................................................................ 215
9. 1 COMPETITIVENESS OF ARGENTINE DAIRY FARMS ............. ................................ 215
9.2 BENEFITS OF ADOPTING NEW ZEALAND PRINCIPLES ... . ................ .................... 217 9.2.i Main Consequences, Advantages, Disadvantages and Constraints (d Adopting NZ innovations ............................................................................................................ 218 9.2.2 Return 011 investment, Land, and Adoption of NZ Innovations .............. . ....... 230
9.2.3 Labour and Adoption of NZ Innovations ........... .. . .. . . . ... . . ...... . . ...... .......... . ....... 23 I 9.2.4 Capital (land not included) and Adoption of NZ Innovations ... . .... . .. . .... ....... . 232 9.2.5 Means of Production and Adoption of NZ Innovations ........................... ....... 233
9.3 NON-DIFfUSION Of NEW ZEALAND INNOVATIONS IN ARGENTINA .................... 233
10 CONCLUSIONS ................................................................................................ .... .... 235
I 0. I THE RESEARCH QUESTIONS ...... .. . . . .. . .. . .... ....... . .. .. ... ........ ..... ... .. .. . . . . .... . ... . . . . ... . . .. 235 I 0.2 RESEARCH CONCLUSIONS ........... ........ . ....... . ... . .... ........ . ... . ...................... ... .... .... 235 I 0.3 ASSESSMENT OF THE METHODOLOGY .............. ... . ... ........................................... 237 I 0.4 FURTHER RESEARCH ..................... ........... ........... . . .. ... ........................................ 239
11 REFERENCES ........................................................... .... ....................................... .... 241
VII

List of figures
Figure 1: Adoption of Hybrid Seed Corn in Two Iowa Communities . . . . . . . . . . . . . . . . . . . . . . . . . . . . . . . . . . . . . . 19
Figure 2: A Model of the Innovation-Decision Process . . . . . . . . . . . . . . . . . . . . . . . . . . . . . . . . . . . . . . . . . . . . . . . . . . . . . . . . . . 22
Figure 3: Adopter Categorization on the Basis of lnnovativeness . . . . . . . . . . . . . . . . . . . . . . . . . . . . . . . . . . . . . . . . . 32
Figure 4: Evolution of the New Zealand Company Payout (1973/7 4-2002/03) ...................... 43
Figure 5: Evolution of NZ Milk Production (1974/75-2002/03) .............................................. .45
Fig ure 6: Argentine Exports in Percentage of Total Milk Production . . . . . . . . . . . . . . . . . . .. . . . . . . . . . . . . . . . . .47
Fig ure 7: Evolution of the Argentine Milk Price to Farmers (1974-2003) ............................... 49
Fig ure 8: Monthly Evolution of the Argentine Milk Price to Farmers (2000-2003) ................. 50
Figure 9: Evolution of the Argentine Milk Production (1970-2003) ......................................... 52
Fig ure 10: Milk Price (season 2002) . . . . . . . . . . . . . . . . . . . . . . . . . . . . . . . . . . . . . . . . . . . . . . . . . . . . . . . . . . . . . . . . . . . . . . . . . . . . . . . . . . . . . . . 65
Figure 11: Milk Price (season 2003) ....................................................................................... 65
Fig ure 12: Returns and Profits (season 2002) ....................................................................... 66
Figure 13: Returns and Profits (season 2003) ....................................................................... 66
Figure 14: Return on Investment (season 2002) .................................................................... 67
Fig ure 15: Return on Investment (season 2003) .................................................................... 67
Figure 16: Operati ng Profit Margin (season 2002) ........................................... ..................... 68
Figure 17: Operating Profit Margin (season 2003) ................................................................. 69
Figure 18: Total Costs and Returns (season 2002) ............................................................... 70
Figure 19: Total Costs and Returns (season 2003) ......................................... ..................... 70
Figure 20: Costs of M i lk Production Only (season 2002) ....................................................... 71
Figure 21: Costs of Mi lk Production Only (season 2003) ....................................................... 71
Figure 22: Non-mi lk Returns (season 2002) .......................................................................... 72
Figure 23: Non-milk Returns (season 2003) .......................................................................... 72
Figure 24: Labour Costs (season 2002) ................................................................................. 74
Figure 25: Labou r Costs (season 2003) ................................................................................. 75
Figure 26: Average Wages (season 2002) ............................................................................. 75
Figure 27: Average Wages (season 2003) ............................................................................. 75
Figure 28: Labou r Productivity (season 2002) ....................................................................... 76
Figure 29: Labour Productivity (season 2003) ....................................................................... 76
Figure 30: Land Costs (season 2002) .................................................................................... 77
Figure 31: Land Costs (season 2003) .................................................................................... 77
Figure 32: Market Value of Land (season 2002) .................................................................... 78
Figure 33: Market Value of Land (season 2003) .................................................................... 78
Figure 34: Level of Land Rents (season 2002) ...................................................................... 79
Figure 35: Level of Land Rents (season 2003) ...................................................................... 79
Figure 36: Land Productivity (season 2002) ........................................................................... 79
Figure 37: Land Productivity (season 2003) ........................................................................... 80
VIII

Figure 38: Capital Costs ( land not included) (season 2002) .................................................. 81
Figure 39: Capital Costs ( land not included) (season 2003) .................................................. 81
Figure 40: Capital Structure of the Typical Farms (season 2002) ......................................... 82
Figure 41: Capital Structure of the Typical Farms (season 2003) ......................................... 82
Figure 42: Capital Input in Bui ldings and Machinery per Cow (season 2002) ....................... 82
Figure 43: Capital Input in Bui ldings and Machinery per Cow (season 2003) ....................... 83
Figure 44: Price per Heifer Sold (season 2002) ..................................................................... 83
Figure 45: Price per Heifer Sold (season 2003) ..................................................................... 83
Figure 46: Capital Productivity (land not included) (season 2002) ........................................ 84
Figure 47: Capital Productivity (land not included) (season 2003) ........................................ 84
Figure 48: Milk Y ield per Cow (season 2002) ........................................................................ 85
Figu re 49: Milk Yield per Cow (season 2003) ........................................................................ 85
Figure 50: Costs as Means of Production (season 2002) ...................................................... 86
Figure 51: Costs as Means of Production (season 2003) ...................................................... 86
Figure 52: Research Design, Multiple and Embedded Case Study . . . . . . . . . . . . . . . . . . ... .. . . ... . ......... . 93
Figure 53: Data Collection . . . .. . . .... . . . . . . ... . . . . . . . . . . . .. . . . . . . . . ........... . . . . . . . . . . . . . . . . . ... . . . . . ... . . . . ... . . .... . . . . .. . 102
Figure 54: Feeds Eaten by Farm 1 Cows . . . . ..... . .... . .. . ........ . . . . . . . . . . . . .. . . . . ...... . ... . . . . . .. . . . . . .. . . ...... 123
Figure 55: Feeds Eaten by Farm 2 Cows . . ......... . .. . ....... . . . . . . .. . . . ........ . .. . . . .. . . . . . . . . . . . . ... . . . . . . .. . . . . 131
Figure 56: Feeds Eaten by Farm 3 Dairy Ani mals .......... . . . . . . . . .... . . . . .. . .... . . . . . . . . . .. . ..... . . . . . . . . . . . . . 140
Figure 57: Feeds Eaten by Farm 4 Dairy Animals ..... . .......... . . . . . . . . .. . . . . ... . . . . . .. . . .. . ... . . . . ...... . ... 14 7
Figure 58: Feeds Eaten by Farm 5 Dairy Animals . . . . ....... . . . . . . . ... . .. .... . .. . . . . .. . . . . . . . . . ........ . . . .... . . 153
Figure 59: Feeds Eaten by Farm 6 Lactating Cows . . . . . .. . . . . . . . . . . .. . . . . . . .. ..... . . . . . . . . ... . . . . . . . . . .. . . . ... 158
Figure 60: Feeds Eaten by Farm 7 Dairy Animals . . . . . . . . . .. . . . .. . . . ... . . .............. . . . . .. . . ... . . ..... . . . . .. . 166
Figure 61: Summary of Adoption of NZ Innovations by the Case Study Farms . . .. . . . .. . . . . . . .. . 171
Figure 62: Milk Price (season 2002) .................................................................................... 180
Figure 63: Returns and Profits (season 2002) ..................................................................... 181
Figure 64: O perating Profit Margin (season 2002) .............................................................. 182
Figure 65: Return on Investment (season 2002) ................................................................. 182
Figure 66: Milk Price (season 2003) .................................................................................... 183
Figure 67: Returns and Profits (season 2003) ..................................................................... 184
Figure 68: O perating Profit Margin (2003) ........................................................................... 184
Figure 69: Return on Investment (season 2003) ................................................................. 185
Figure 70: Number of New Zealand Innovations Adopted and Entrepreneurs' Profit (season
2003) . . . . . . . . . . . . . .. . . . .. . . . . . . . . . . . . . . . . . . . . . . . . . . . . . . . . . . . . . . . .. . . . . . . . . . . . . . . . . . . . ... . . . . ... . . . . .. . . . . . . .. . . ...... . . . ... . . . . . 187
Figure 71 : Number of New Zealand Innovations Adopted and Operating Profit Margin
(season 2003) .............................................................................................................. 188
Figure 72: Number of New Zealand Innovations Adopted and Return on Investment (season
2003) ........................................................................................................................... 188
Figure 73: Total Costs and Returns of the Dairy Enterprise (season 2002) ........................ 189
Figure 74: Total Costs and Returns of the Dairy Enterprise (season 2003) ........................ 189
ix

Figure 7 5: Costs of Milk Production Only (season 2002 ) ..................................................... 190
Figure 76: Non -milk Returns (season 2002 ) .................................................... . ................... 191
Figure 77 : An imal Purchases (season 2002 ) ... ................................ .................................... 191
Figure 78 : Costs of Milk Production Only (season 2003 ) ..................................................... 192
Figure 79 : Non-milk Returns (season 2003 ) .................................... ................ .................... 193
Figure 80 : An imal Purchases (season 2003 ) ....................................................................... 193
Figure 81: Level of New Zealand Genetics Adopted and Mortality Rate (seasons 2002 and
2003 ) ........................................................................................ .................................... 194
Figure 82: Level of New Zealand Genetics Adopted and Replacement Rate (seasons 2002
and 2003 ) ......................................................................................... . . .......................... 19 5
Figure 83: Costs Components as a Percentage of Total Costs (season 2002 ) ................... 19 5
Figure 84: Cost Components as a Percentage of Total Costs (season 2003 ) ..................... 196
Figure 8 5 : Labour Costs (season 2002 ) ............................................................................... 196
Figure 86 : Average Wages on the Farm (season 2002 ) ...................................................... 19 7
Figure 87: Labour Productivity (season 2002 ) ..................................................................... 198
Figure 88 : Labour Costs (season 2003 ) ............................................................................... 198
Figure 89: Average Wages on the Farm (season 2003 ) ...................................................... 199
Figure 90: Labour Productivity (season 2003 ) ..................................................................... 199
Figure 91: Number of New Zealand Innovations Adopted and Labour Productivity (seasons
2002 and 2003 ) ............................................................................................................ 200
Figure 92: Land Costs (season 2002 ) .................................................................................. 201
Figure 93: Market Value of Land . . . . . . . . . . . . . . . . . . . . . . . . . . .. . . . . . . . . . . . . . . . . . . . . . . . . . . . . . . . . . . . . . . . . . . . . . . . . . . . . . . . . . . . . . . 201
Figure 94 : Level of Land Rents (season 2002 ) .................................................................... 202
Figure 9 5: Land Productivity (season 2002 ) ......................................................................... 203
Figure 96: Land Costs (season 2003 ) .................................................................................. 204
Figure 97: Market Value of Land (season 2003 ) .................................................................. 20 5
Figure 98: Level of Land Rents (season 2003 ) ........................ ............................................ 20 5
Figure 99 : Land Productivity (season 2003 ) ......................................................................... 20 5
Figure 100: f'Jumber of New Zealand Innovations Adopted and Land Costs (season 2003 )
. . . . . . . . . . . . . . . . . . . . . . . . . . . . . . . . . . . . . . . . . . . . . . . . . . . . . . . . . . . . . . . . . . . . . . . . . . . . . . . . . . . . . . . . . . . . . . . . . . . . . . . . . . . . . . . . . . . . . . . . . . . . . . . . . . . . . 2 W
Figure 101 : Capital Costs ( land not included) (season 2002 ) .............................................. 20 7
Figure 102: Capital Costs ( land not included) (season 2003 ) .............................................. 207
Figure 1 03: Capital Input per Cow (season 2002 ) ........................ ....................................... 208
Figure 1 04: Capital Input per Cow (season 2003 ) ............................................................... 208
Figure 10 5: Capital Productivity (land not included) (season 2002 ) .................................... 209
Figure 106 : Capital Productivity (land not included) (season 2003 ) ..................... ........ . . . . . . . 209
Figure 107: Milk Yield per Cow (season 2002 ) ................................................... ................. 210
Figure 108: Milk Yield per Cow (season 2003 ) .................................................. ...... .. . ......... 210
Figure 109: Costs as Means of Production (season 2002 ) ....... .................... ..... .................. 212
Figure 110: Costs as Means of Production (season 2003 ) ................................ ...... ............ 212
X

List of tables
Table 1 : General, Agricultural and Dairy Sector Data for Argent i na and New Zealand . . . . . . . . 1 5
Table 2 : New Zealand Economy - Financial I ndicators . . . . . . . . . . . . . . . . . . . . . . . . . . . . . . . . . . . . . . . . . . . . . . . . . . . . . . . . . 42
Table 3 : Argentine Economy - F inancial Indicators . . . . . . . . . . . . . . . . . . . . . . . . . . . . . . . . . . . . . . . . . . . . . . . . . . . . . . . . . . . . . . 48
Table 4: Differences i n Size Between I FCN Models and Statistical Average for N Z ( 2000/0 1 )
. . . . . . . . . . . . . . . . . . . . . . . . . . . . . . . . . . . . . . . . . . . . . . . . . . . . . . . . . . . . . . . . . . . . . . . . . . . . . . . . . . . . . . . . . . . . . . . . . . . . . . . . . . . . . . . . . . . . . . . . . . . . . . . . . . . . . . . 56
Table 5: Differences i n Size Between I FCN Models and Stat istical Average for Argentina .. 56
Table 6 : Typical Farm Models for New Zealand and Argentina ( I FCN, 2002) . . . . . . . . . . . . . . . . . . . . . . . 57
Table 7: Non-milk Returns, as a Percentage of Total Returns , for New Zealand and
Argentine Typical Farms . . . . . . . . . . . . . . . . . . . . . . . . . . . . . . . . . . . . . . . . . . . . . . . . . . . . . . . . . . . . . . . . . . . . . . . . . . . . . . . . . . . . . . . . . . . . . . . 73
Table 8: Cost Components, as Percentage of Total Costs, for New Zealand and Argentine
Typical Farms . . . . . . . . . . . . . . . . . . . . . . . . . . . . . . . . . . . . . . . . . . . . . . . . . . . . . . . . . . . . . . . . . . . . . . . . . . . . . . . . . . . . . . . . . . . . . . . . . . . . . . . . . . . . . . . . 74
Table 9: Basic Types Desig ns for Case Studies . . . . . . . . . . . . . . . . . . . . . . . . . . . . . . . . . . . . . . . . . . . . . . . . . . . . . . . . . . . . . . . . . . . . 9 1
Table 1 0 : Case Study Tactics for Four Design Tests . . . . . . . . . . . . . . . . . . . . . . . . . . . . . . . . . . . . . . . . . . . . . . . . . . . . . . . . . . . . 96
Table 1 1 : Selection of New Zealand I nnovations for Argentina . . . . . . . . . . . . . . . . . . . . . . . . . . . . . . . . . . . . . . . . . . . 1 08
Table 1 2 : Case Study Farms Outlook (season 2003) . . . . . . . . . . . . . . . . . . . . . . . . . . . . . . . . . . . . . . . . . . . . . . . . . . . . . . . . . . 1 2 1
Table 1 3 : Summary of I nnovations Adopted or Rejected by Farm 1 . . . . . . . . . . . . . . . . . . . . . . . . . . . . . . . . . . . 1 30
Table 1 4 : Summary of I nnovations Adopted or Rejected by Farm 2 . . . . . . . . . . . . . . . . . . . . . . . . . . . . . . . . . . . 1 39
Table 1 5 : Summary of I nnovations Adopted or Rejected by Farm 3 . . . . . . . . . . . . . . . . . . . . . . . . . . . . . . . . . . . 1 46
Table 1 6 : Sum mary of I nnovations Adopted or Rejected by Farm 4 . . . . . . . . . . . . . . . . . . . . . . . . . . . . . . . . . . . 1 5 1
Table 1 7 : Summary of I n novations Adopted or Rejected by Farm 5 . . . . . . . . . . . . . . . . . . . . . . . . . . . . . . . . . . . 1 57
Table 1 8 : Summary of I nnovations Adopted or Rejected by Farm 6 . . . . . . . . . . . . . . . . . . . . . . . . . . . . . . . . . . . 1 64
Table 1 9: Summary of I n novations Adopted or Rejected by Farm 7 . . . . . . . . . . . . . . . . . . . . . . . . . . . . . . . . . . . 1 70
Table 20 : Results from the Perception Survey with Case Study Farmers (n= 1 4) . . . . . . . . . . . . . . . 1 73
Table 2 1 : Results from the Perception Survey with Argentine Dairy Farmers (n=4) . . . . . . . . . . . 1 74
Table 22: Results from the Perception Survey with Argentine Dairy Consultants ( n=9) . . . . . 1 75
Table 2 3 : Definition of the Financial Years of the Case Studies . . . . . . . . . . . . . . . . . . . . . . . . . . . . . . . . . . . . . . . . . . 1 76
Table 24 : Names Given to the Case Study Farms on Figures . . . . . . . . . . . . . . . . . . . . . . . . . . . . . . . . . . . . . . . . . . . . 1 80
Table 2 5 : Nu mber of New Zealand I nnovation Adopted (out of 1 0) . . . . . . . . . . . . . . . . . . . . . . . . . . . . . . . . . . . . 1 87
Table 2 6 : Level of New Zealand Genetics Adopted and Mortality and Replacement Rates
(seasons 2002 and 2003) . . . . . . . . . . . . . . . . . . . . . . . . . . . . . . . . . . . . . . . . . . . . . . . . . . . . . . . . . . . . . . . . . . . . . . . . . . . . . . . . . . . . . . . . . . . . 1 94
Table 2 7 : Level of New Zealand Genetics Adopted and Milk Yield per ki logram of l ive weight
(seasons 2003) . . . . . . . . . . . . . . . . . . . . . . . . . . . . . . . . . . . . . . . . . . . . . . . . . . . . . . . . . . . . . . . . . . . . . . . . . . . . . . . . . . . . . . . . . . . . . . . . . . . . . . . . . . . . 2 1 1
XI

Chapter 1: Introduction
1 INTRODUCTION
1 . 1 Background
The Spanish conquerors brought the first bovines to the humid pampas i n the 1 560' s
and rapidly they multipl ied in those fert i le plains ( Luna, 1 994/95) . The Argentine dairy
sector grew and developed, and since the very beginning has been producing,
elaborat ing and selling mi lk products for the local market without the need of subsid ies
(SAG PyA, 2004a).
The fo l low ing statist ics show the importance of the dairy sector to the Argent ine
economy: Agriculture in general provides I 0% of the total employment and produces
6% of the total GDP of Argent ina 1 ( I FCN, 2002) . Milk, is the fifth agricu ltural product
represent i ng 8% of the total value of agricultural primary products after soybean, beef,
wheat and ma ize (SAG PyA, 2000). In the industrial phase the dairy companies are in
third place among the food and beverages industries, account ing for I I% of the total
value produced by this sector ( IN DEC, 2003). The Argent ine dairy sector has a
domest ic focus and exports only when there is an over-supply in the local market
(Gutman, Guiguet, & Rcbo l ini , 2003), during the 1 990' s an average of I 0% of the total
vo lume of mi lk produced was exported. Even though the sector is not focused on
exporting is a compet itive sector that creates genuine wealth and employment .
H istorical ly, milk price paid to farmers in Argent ina has been decreasing (calculat ions
based on Gutman et al . , 2003 ); this decreasing tendency is consistent with what was
called the .farm prohlenl. I n order to remain compet it ive3, Argent ine dairy farmers have
been constantly developing their product ion systems by adopt ing new techno logies.
New techno logies (and innovations in general) for the Argent ine dairy production sector
are usual ly the result of research done both within and o utside the country.
1 In contrast, for example, in Germany Agriculture employs 3% of labour and generates 1 % of the G DP; in the United Kingdom Agricul ture employs 1% of labour and generates 2% o f the GDP and in the United
States Agriculture employs 3% of labour and generates 2% of the GDP ( IFCN, 2002). 2 Thefann problem1 i s a theory that, in brief, states that in the long term the value of farm products tend to decrease relatively to non-farm products ( Ritson , 1 977, p. l 45) . 3 Competitiveness is defined by Harrison & Kennedy ( 1 997, p. l 6) "as the ability to profitably create and del iver value at prices equal to or lower than those offered by other sellers in a specific market".
1 3

Chapter 1: Introduction
Argentina has both public and private institutions whose main objective is to generate
usefu l innovations for its farmers, however some innovations are imported from other
countries. The United States (US) is probably the country of origin of the biggest
proportion of foreign innovation s adopted in the Argentine dairy systems. One example
o f this i s the high influence of US genetics in the Argentine Holst ein ( Molinuevo, 200 1 )
that is the most common cow in Argentine farms ( IFCN, 2002) . Another example is the
fact that some US companies are wel l settled in Argentina and are investing in research
and development, and are promoting their products. Additionally, some of the most
renowned Argentine specialists and researchers in dairy, studied in the US. However
not al l the foreign innovations come from the US . Argentine farmers have also adopted
innovations from other countries including Germany, Canada, France, Australia, N ew
Zea land and many others.
This study focused on innovations from New Zealand, mainly for three reasons: F irstly
because even though New Zealand and Argentina are very different countries ( in
economic development, cultural background of their people, size and topography); they
have some important things in common (both countries are in the southern hemisphere,
have low population densities, are able to feed animals with good quality grass a l l year
round, and tor both of them the export ofunsubsidised agricultural products constitutes
a s ignificant portion of their economy) . The second reason is that New Zealand dairy
sector is the leading exporter of milk and milk products in the world (USDA, 2004a)
and can be taken as an example o f coordination and efficiency tor the Argentine dairy
sector. The third reason, is that N ew Zealand farmers are considered to be among the
most competitive in producing milk w ithout the help of subsidies and they traditional ly
had achieved higher physical and economic performances than Argentine farmers
( IFCN, 2002) .
1 4

Chapter 1: Introduction
Table 1 : General, Agricultural and Dairy Sector Data for Argentina
and New Zealand
Argentina N ew Zealand
�eneral !Population ( M i l l . ) 36.2 3 .7 !Area (km2) 2,79 1 ,8 1 0 268,02 1 Populat ion dens ity ( inhab./km2 ) 1 3 1 4 lfotal GDP (bi l l US-$) 264 5 1 pOP/capita (US- ) 7,04 1 1 3,754 Life expectancy (years) 75 79 Infant morta lity (per 1 000 births) 20 6 [Adult l i teracy (%) 97.0 99.9 !Agriculture (% of total) Land 62% 64% Labour 1 0% 1 0%* por 6% 8%** IDairy Sector Dairy Cows ( M i l l . ) 2. 1 3 . 7 !M i lk Processed (Mi l l . kg MS) 640 I , 1 07 !Mi lk Exports (M i l l . US-$ ) 280 1 ,7 1 0 !M i lk Exports ( % o f total volume) 1 1 % 90-95%
M a i nly for 2000 and 2 001 , but also for 1 995 * and 1 999 **. I N D E C , World Bank, Euromon itor ( 2004d ), IFCN ( 2002 ), SAG PyA a nd APL. NZ Statistics ( 2002 ) , NZ Statistics (2003a ), NZ Stati stics ( 2003b), Euromonitor (2004e), I FCN ( 2002 ) , OECD and L I C ( 2002/03).
Argent ine dairy farmers have been interested in New Zealand dairy systems for many
decades. As a result of these interests many renowned New Zealand researchers were
inv ited to Argent ina ( for example Dr. Campbel l M cMeekan in the late 1 960's and in the
1 990's Professor Co lin Ho lmes, Professor John Hodson and Kevin MacDonald ) . I n
addit ion some Argentine farmers, dairy consultants and researchers visited New
Zealand with the intention to better understand their systems and evaluate what can be
adopted in Argent ine dairy farms. As a consequence of all this the adopt ion of New
Zealand innovat ions began.
1 .2 The Problem, the Quest ion and the Objectives
Summarizing the background, it can concluded that the dairy sector is important for
Argent ina because provides employment and wealth to the country. Dairy farms are at
the beginn ing of the dairy chain and their survival is heavi ly related to the endurance of
the dairy sector. Mi lk prices to farmers tend to decrease, so dairy farmers have to
1 5

Chapter 1: Introduction
constantly develop their dairy production systems to stay in business. One way to
i ncrease their competi t iveness is to adopt advantageou s innovations, and N ew Zealand
dairy systems because t hey are k nown for their compet i t iveness at low prices can
provide useful innovat ions for Argentine dairy farmers.
However despite the fact that the N ew Zealand knowledge appears to be beneficial t o
Argent ine farms, and that for more than 40 years Argent ine dairy farmers has been
interested in N ew Zealand systems and therefore many eftorts have been done in order
to extend the N ew Zealand principles in Argent ina; N ew Zealand practices have been
rarely adopted in Argent ine dairy farms. This fruit l ess etlort in extending this
techno logy, make some farmers and researchers wonder:
Can Argentine dairyfarmers henefitfrom adopting New Zealand principles and
practices?
The main object i ves of the present research were:
1 ) Define a t,:rroup of N ew Zealand ideas, pract ices and techno logies that could be
considered as potentia l ly usefu l innovations for Argent ine dairy farmers.
2 ) Assess the adoption and rejection ofNew Zealand innovat ions by a group of
Argent ine da iry farmers.
3 ) I dent ify the reasons of adoption and reject ion o f each innovat ion.
4) Analyse the impact between the adoption of New Zealand innovations and the
performance of the case study farms.
5 ) Assess which have been the main causes of the non-spread ofNew Zealand
innovat ions in Argentine dairy farms.
1 6

Chapter 2: Theoretical Framework
2 TH EORETICAL FRAM EWORK
2 .1 D iffusion of I n novat ions
The theory o f Diffusion of I nnovat ions i s the basic framework o f the present study. ot
only was the theory ut i l ized for the data analysis but i t was also crucial in elaborat ion of
the research q uest ion and main object ives. This theory has more than I 00 years of
history that are presented in the first part o f this sect ion. The main elements of the
diffusion theory are presented in the second sect ion: the process of communicat ion of a
new idea through a commun ity, and the factors affect ing the speed of that
communicat ion. The last part of this sect ion considers the main crit icisms and
l imitations o f this theory.
"An innovation is an idea, practice, or object that is perceived as new by an individual
or other unit of adopt ion" ( Rogers, 2003 , p. l 2). One example of an innovat ion is a
change to seasonal-calv ing on a farm that has always used an al l-year-around-calving
system; another example might be to stmt monitoring the pasture cover of a farm on a
regular basis. Further, an innovat ive object can be, for example, to change the milk ing
plant from a heJTingbone to a new rotary.
"Dif/itsion is the process in which an innovat ion is communicated through certain
channels over t ime among the members of a social system" ( Rogers, 2003, p.5) . The
d iffus ion process comprises all the stages, from the reception of a new idea by a specific
community, fo l lowed by its communicat ion across the community and includ ing the
process that is triggered when an ind iv idual first comes to know of the new idea. The
di ffusion process includes the c lassic process of "techno logy transfer" (or extension)
and the process of"adopt ion oftechno logy" ( B lack, 2000; Warner, 1 974).
2. 1. 1 History of the Diffusion Theory
The origins of d iffusion theory trace to Europe about a century ago, when socio logy and
anthropology were rising as new social sciences ( Rogers, 2003 ).
1 7

Chapter 2: Theoretical Framework
The first scholar who studied the way in which new ideas spread among people was
Gabriel Tarde. Tarde, a French lawyer, judge, and academic socio logist, was interested
in learning why some innovat ions spread among society while others did not . The
results of this first study were publ ished in 1 903 in a book called The Laws of1mitation
( Valente & Rogers, 1 995) .
In his book Tarde didn't used the word adoption, he used "imitat ion" instead. T arde
intuitively ident ified important research issues that were later to be studied in a more
quant itative way b y successive diffusion scholars. Among other things, he observed that
the rate of i mitat io n o f an innovation usually fo l lowed an S-shaped curve over t ime. He
reco!:,mized that when the opinion leaders o f a community used the innovation,
acceleration in the rate of adoption occurred. Another "law of imitat ion" that he
proposed was that the more similar an innovation i s to the ideas that have already been
accepted, the more l ik ely it is that the innovat ion w il l be adopted ( Rogers, 2003).
Soon after the t ime o f Gabriel Tarde a group of Br it ish and German anthropologists
undertook diffusion research. Although these anthropologists were not influenced by
Tarde's writings, they studied the same phenomenon. These scientists were the first to
use the word "diffusion". They are known in sociology as the "European d iffus io n ists"
because they claimed that social change could be explained by d i ffusion alone. This was
an extreme c laim because today we know that social change is caused by both invent ion
and diffusion, which usually occur sequentially ( Rogers, 2003).
The scho lars who fo llowed the work of the European diffusion ists most directly were
anthropo logists, especially from the United States, who began to invest igate the
d iffusion of innovat ions in the early 1 920's. I ndirectly, these anthropological schools
inf1uenced the investigation that provided the basic framework for the d iffusion model,
the "Iowa Hybrid S eed Corn Study" of Ryan and Gross ( Rogers, 2003) .
The " Iowa H ybrid S eed Corn Study" of Ryan and Gross, in 1 94 1 , i s a landmark
moment in the creation o fthe theory. Bryce Ryan, a socio logist who designed the study,
was attracted to investigate non-economic factors in farmers' economic decisions. N eal
C. Gross, appointed by Ryan as research assistant for the study, personally interv iewed
several hundred farmers in two Iowa communities. Gross asked each I owa farmer when
he decided to adopt the innovation, what were his communication sources/channels, and
how much of the respondent 's corn acreage had been p lanted in hybrid seed each year
1 8

Chapter 2: Theoretical Framework
after the first trial . I n add it ion to these recal l quest ions about the innovat ion, the Iowa
farmers were asked about their formal educat ion, age, farm size, income, travel to Des
Moines (c losest city), readership of fann magazines, and other variables. These were
later correlated w ith innovat iveness, measured as the year in which each farmer had
adopted hybrid seed ( Rogers, 2004) .
The result of the study was analysed and reported in three publ icat ions. The most
widely known is the 1 943 joumal art icle in Rural Sociology, which is known as the
found ing document for the research specialty o f the Diffusion of l nnovat ions ( Rogers,
2004). The main find ings were the following:
Ryan and Gross ( 1 943 ) found that the rate of adopt ion of hybrid seed corn formed an Sshaped curve over t ime. Earl ier adopters were characterized by larger-sized farms, higher incomes. and more educat ion. and they made more trips to Des Moines, Iowa 's largest
c i ty, about 75 m i les away. A key finding from the seed corn study was the i mporta nce o f neighboring farmers i n convi ncing an i ndividual to adopt the i nnovation ( R ogers. 2004.
p. 1 5) .
Figure I shows the adoption (cumulat ive and per year) ofthe hybrid seed by I owa
farmers fi·om 1 927 to 1 945.
Fig ure 1 : Adoption of Hybrid Seed Corn in Two Iowa Communities
300
8 250 0 al Q) (/) :g 200 .D >I .� g. 1 50 u <{ VI a; E .;" 100 0 .2l E f. 50
0
253 257 257
Cwnulativc N wnhcr of i\doptcrs
New i\doplcrs
1927 1 929 1931 1 933 1935 1937 1939 1941 1 943 1 945 Year
( Ryan and Gross, 1 943 adapted from Rogers, 2003, p.273)
Then I 0 years went by without any publ icat ion in d i ffus ion research, in part due to the
interruption of World War 1 1 . But a few years later an "invisible co l lege" in d i ffusion
research started to be formed (Yalente & Rogers, 1 995) w ith rural soc io logists
1 9

Chapter 2: Theoretical Framework
Wilkening, L ionberger, B ea l and Bohlen ( Rogers, 2004). Everett Rogers joined this
invisib le co l lege of scholars in 1 952. After reviewing the literature about diffusion of
d ifferent innovations in several environments, he argued that:
Diffus ion was a general process, not bound by the type of i nnovation studied, by who the adapters were, or by place or cul ture. I was convinced that the d iffu sion of innovat ions was a kind of universal micro-process of social change (Rogers, 2004, p. 1 6) .
I n 1 954, B eal and Bohlen gave their first presentation on the diffusion of agricultural
innovations to the staff o f the Iowa Extension Service. The presentation was focused on
the sources/channels ofcommunication used at various stages in the individual- level
innovation-decision process, and on characteristics of farmers who adopted relatively
earlier and later in the diffusion process. Soon the researchers were asked to give their
presentation to audiences outside the agricultural sector. Clearly discussion of a more
general model o f diffusion was starting ( Rogers, 2004).
I n 1 960, Lionberger published the first book about adoption of new ideas and practices
within the rural environment. An individual-level innovation-decision process was
suggested and the factors that affect the adoption and the diffusion of new ideas and
techno logy were analysed. I n 1 962 Rogers published a book, Diffitsion of1nnovations
where he proposed a general ditlusion model for the first time, and a more standardised
way of adopter categorization was developed. The book emphasized the tenn
"innovation" instead of the numerous tenns that had been used tor this concept (Rogers,
2004) . Ever since Rogers the several edit ions of this book have been the synthesis of the
"diffusion paradigm". I n the last 42 years more than 5000 diffusion papers, in numerous
science disciplines, have been publ ished.
I n Europe van den Ban from the N etherlands, inspired by Rogers, was the first one to
carry out diffusion research, in 1 963 (Roling, 1 988 ).
I n conclusion it can be said that the diffusion model is a c lassic theory that describes a
human phenomenon. This intrinsic human process, even though first described in the
rural environment, proved to be a general process that displays consistent patterns and
regularities, across a range of conditions, innovations, and cultures (Warner, 1 974).
In the fol lowing three sections some aspects of the diffusion theory relevant to the
present study are outl ined: ( 1 ) the innovat ion-decision process model, (2 ) the factors
20

Chapter 2: Theoretical Framework
that influence the rate of ado pt ion, and ( 3 ) t he innovat iveness and the adopter
categories. Then, some crit ic isms o f the d iffusion theory and the problem of non
adopt ion are addressed.
2. 1. 2 Innovation-decision process
An ind iv idual decis ion to adopt an innovat ion is not an instant act . Rather, it is a process
that occurs over t ime and consists of a series of d ifferent actions. The adoption process
is part of a broader procedure that is defined as the innovation-decision process. During
this process, an indiv idual decides to adopt or reject a new idea. I t can also be said t hat
the innovat ion-dec ision process is a part icu lar dec ision-making process in which the
decision is the adoption or reject ion of a new idea. Based on the studies of renowned
scient ists such as the German psycho logist Wundt, Dewey and Mead, the rural
sociologists Beal, Rogers and Bohlen first posited the idea ofthe innovat ion-decision
process ( Rogers, 2003) . The model synt hesized i n Rogers' book consists also of tive 4
stages :
Knmt-!edge occurs when a n ind iv idual (or other dec ision-making un i t ) is exposed to a n
i nnovat ion's existence a nd gains a n understanding o f how i t funct ions.
Persuasion occurs when an individual (or other decis ion-making u n i t ) forms a favorab le
or unfavorablc a t t i tude towards the innovat ion.
Decision takes place when an i ndividual (or other dec i s ion-mak ing un i t ) engages 1 11
act iv i t ies t hat lead to a choice to adopt or reject the innovat ion.
Implementation occurs when an individual (or other dec i s ion-mak i ng un i t ) puts a new
idea into use.
Confirmation takes place when an ind ividual seeks rei n forcement of an innovat iondecis ion a l ready made, bu t he or she may reverse this previous dec i s ion if exposed to
conflict ing messages about the i n novat ion. (Rogers, 2003, p. l 69)
4 A similar model of five stages appears in Lionberger's ( 1 987, cited in Guerin & Guerin, 1 994 ) cal led the individual-decision-process. Lionberger was part of the same invisible col lege of diffusion scholars and consequently agrees with the majority of the concepts. There have been other authors that developed simi lar models such as Chamala ( 1 987, cited in Guerin & Guerin, 1 994) and Sinden & King ( 1 990) that vary in their detai ls but recognise a decision process that goes through different stages, which is the most important factor of extrapolation of the classical model .
2 1
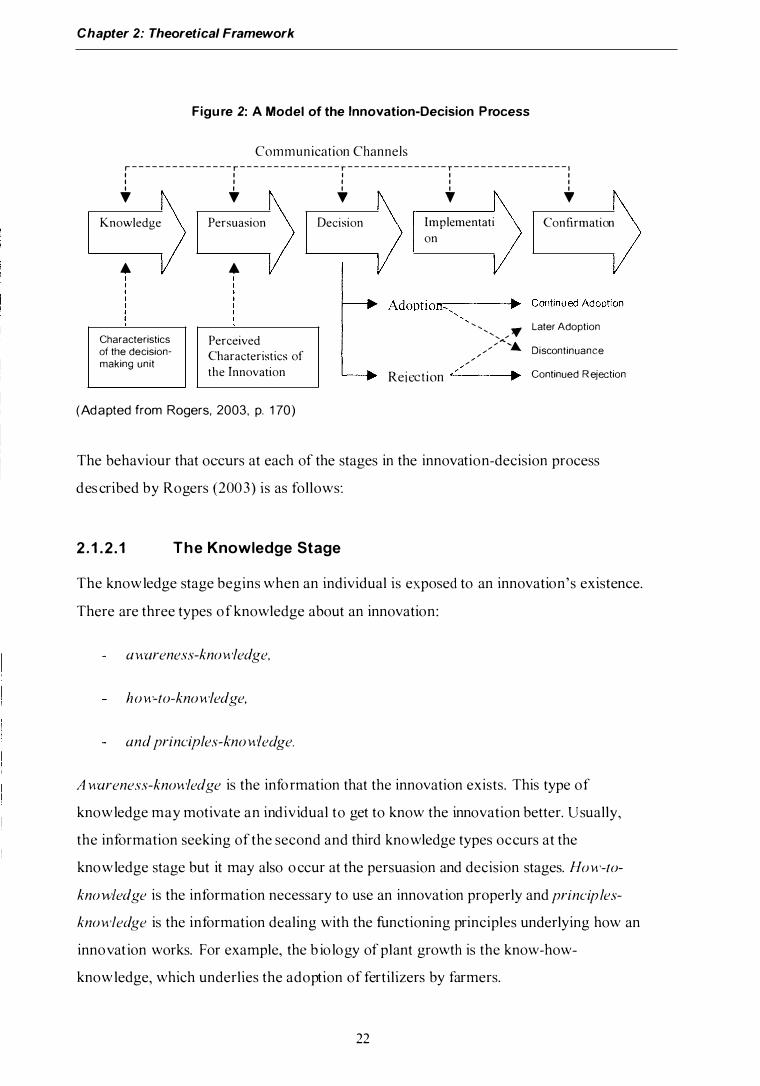
Chapter 2: Theoretical Framework
Figu re 2: A Model of the Innovation-Decision Process
Communication Channels r - - - - - - - - - - - - - - - r - - - - - - - - - - - - - - - r - - - - - - - - - - - - - - - r - - - - - - - - - - - - - - - - - 1 I I I I I I I I I I I I I I I
? ? T T T Knowledge
•
Characteristics of the decisionmaking unit
Persuasion
•
Perceived Characteristics of
the Innovation
( Ad a pted from Rogers, 2003, p. 1 70 )
Decision lmplementati
on Confirmation
Adoptio·n .... ,-,-, ,-,--_.... Continued Adoption
' ,
......... .......... ,1/f /
/ '/
//
...... Rejection / ...
Later Adoption Discontinuance Continued Rejection
The behaviour that occurs at each of the stages in the innovation-decision process
des cribed by Rogers (2003) is as follows:
2 . 1 .2 . 1 The Knowledge Stage
The knowledge stage begins when an individual is exposed to an innovation's existence.
There are three types ofknowledge about an innovation:
awareness-knowledge.
how-to-knowledge,
and principles-kno w/edge.
A wareness-knowledge is the information that the innovation exists. This type of
knowledge may motivate an individual to get to know the innovation better. U sually,
the information seeking of the second and third knowledge types occurs at the
knowledge stage but it may also o ccur at the persuasion and decision stages. How-to
knowledge is the information necessary to use an innovation properly and principles
knowledge is the information dealing with the functioning principles underlying how an
innovation works. For example, the b io logy of plant growth is the know-how
knowledge, which underlies the adoption of fertilizers by farmers.
22

Chapter 2: Theoretical Framework
To k now about an innovation is d i fferent from using it . Most people are aware of many
innovations that they have not adopted. A person may be aware of a new idea but not
consider it relevant, or useful for h is or her situation. A person 's attitudes or beliefs
about an innovat ion affect his or her way through the stages of the innovat ion-decision
process. l f the ind iv idual does not define the informat ion as relevant to his or her
situat ion, or if not sufficient know ledge is obtained, the process does not go beyond the
know ledge stage.
2 . 1 .2 .2 The Persuasion Stage
After becoming aware of an innovation, a person may form a favourable or
unfavourable att itude towards the innovat ion. "Attitude is a relat ively enduring
organizat ion of an individua l ' s bel iefs about an object that pred isposes his or her
act ions" (Rogers, 2003, p. I 74). While the mental act iv ity at the knowledge stage was
main ly of knowing, the main type of thinking at the persuasion stage is essent ia l ly
affect ive. I n order to take an attitude toward an innovat ion the person act ively seeks
informat ion abo ut the new idea, chooses what messages are considered cred ible, and
decide how to interpret the informat ion received. During this stage the perceived
attributes of the innovat ion such as its relat ive advantage, compat ibi l ity, and complexity
are especial ly important . In many cases, the ind iv idual mental ly appl ies the innovat ion
to his or her specific situat ion as a way of developing att itudes towards the new idea.
The main outcome of thc persuasion stage is a favourable or unfavourable att itude
towards the innovat ion. It is assumed that such persuasion wi l l lead to adopt ion or
reject ion ofthe idea. But in many cases att itudes and act ions may be unrelated.
2 . 1 .2 .3 The Decision Stage
The decision stage is the period when a person engages in act ivit ies that lead to the
cho ice to adopt or reject an innovat ion. "Adoption is a decision to make ful l use of an
innovat ion as the best course of act ion avai lab le. Rejection is a dec is ion not to adopt an
innovation" ( Rogers, 2003, p. I 77). During this stage it is common for the person, to t ry
o ut t he new idea on a part ial basis, to cope with the inherent uncertainty of the
innovat ion. Most innovat ions can be tried to a greater or lesser extent, but some of them
that cannot be tried part ia l ly but must be adopted completely. U sual ly, when a person
23

Chapter 2: Theoretical Framework
tries an innovation and that innovation proves to be beneficial in his or her situation, the
innovation is adopted.
2 .1 .2.4 T he Implementation Stage
Up to this stage the innovation-decis ion process has been mainly a mental exercise of
thinking and deciding. However implementation invo lves the person applying the
innovation in practice. Typically during this stage more uncertainty arises, for example
questions such as : Where can I obtain or learn about the innovation? How do I use it?
What operational problems am I like�y to encounter, and how can I solve them ?
Consequently, during this stage the adopter act ively seeks information. Here help from
previous adapters, extension agents, or sales agents play an important role.
During the implementation stage re-invention or adaptat ion occurs. Re-invention can be
defined as the degree to which an innovation is changed or modified by the user in the
process of its adoption and implementation ( adapted from Rogers, 2003, p. l 8 I ) . Some
innovations can be more easi ly adapted than others. Frequently, the innovations that are
ideas and processes (software) are more adaptive than the innovations that are artefacts
(hardware) . I n addition, a h igher degree of re-invention leads to a faster det,rree of
adoption of an innovation.
2 .1 .2.5 T he Confirmation Stage
The confirmation stage is the period when the person seeks reinforcement of an
innovation-decision already made, but he or she may reverse this previous decision if
exposed to con flict ing messages about the innovation. At this stage the person usually
tries to avoid a state of dissonance, or if u navo idable, to reduce it . Dissonance, broadly
speaking, is an uncomfortable state of mind in which the person thinks in one way and
acts in a different way. A dissonant person is motivated to reduce this condit ion by
changing his or her knowledge, attitudes or actions. Consequently if a person finds new
information that makes him or her aware that the innovation is no longer beneficial to
his or her situation, he or she wi l l move towards discontinuing the innovat ion. Another
option is to refuse to consider the new information and to simply confirm the innovation
( Albrecht et al. , 1 989; Mook, 1 98 7 c ited in (Guerin & G uerin, 1 994).
24

Chapter 2: Theoretical Framework
The innovat ion-decis ion process can lead as logical ly to the decision to reject as to the
decision to adopt. In any stage in the innovat ion-decision process ( knowledge,
persuasion, decision, implementation and confirmation) the person can decide to reject
the innovation. Even in the implementation and confirmation stages the person can
decide to reject or d iscont inue the innovat ion.
2. 1 .3 Factors Influencing the Rate of Adoption
After briefly describing the innovat ion-decision process, the factors that influence the
rate of adopt ion arc now reviewed. Rate of adoption i s "defined as the relat ive speed
with which an innovat ion is adopted by members of a social system" ( Rogers, 2003 ,
p . 2 1 9 ) . I t is usually measured as the number of persons who adopt a new idea in a
specified period, such as a year (see Figure I ) . Some innovations are adopted more
rapid ly than others. For example, the I nternet was adopted very qu ickly by mi l l ions of
people in the ent ire world after it publ ic ly appeared in 1 989. On the other hand some
very basic agricultural innovat ions have been present tor many years in developing
countries and have been hardly adopted ( Chambers & J iggins, 1 987 ; G uerin & Guerin,
1 994).
I n this sect ion five factors that influence the rate of adopt ion are presented. These
factors were suggested by the d iffusion parad igm and with smal l mod i ficat ions are
widely accepted (sec Arnon, 1 989; Guerin & Gucrin, 1 994; Rogers, 2003 ; Rol ing,
1 988) . These factors arc:
Perceived attributes of innovat ions
Type of innovat ion-decision
Communicat ion channels ( mass med ia or interpersonal)
Characterist ics of the social system
Extent of change agents' promot ion efforts
25

Chapter 2: Theoretical Framework
2 . 1 .3. 1 Perceived Attributes of Innovations
Several studies done in Sweden5, I ndia6, Canada7 and in several states of the U Sx during
the 1 960s have f(mnd that the perceived attributes of an innovat ion explain most of the
variance (between 49 to 89 percent) in the rate of adoption of an innovat ion (Rogers &
Shoemaker, 1 97 1 ) . B ased on this information it i s expected that the perceived attributes
of t he innovations are the main variables that determine the rate of adoption.
Consequently, is possible to predict the rate of adopt ion of innovat ions based on how
the potential adopters perceive the innovat ions. This k ind of study is called
"acceptab i l it y research" and is commonly done in marketing of consumer products
(Zaltman, 2003) .
Rogers (2003) suggested five attributes (relat ive advantage, compatibi l ity, complexity,
trialab i l ity, and observabi l ity) to characterize innovat ions in general. However for each
innovat ion a d ifferent group of attributes can be chosen to better characterize the
innovat ion (Goldman, 1 994; Moore & Benbasat, 1 99 1 ; Murthy, Dudhani, Jayaramaiah,
Veerabhadraiah, & Sethu Rao, 1 973 ) . For the present study four of the five attributes
previously mentioned were suitable for the NZ innovations. Complexity was not
measured because i t was considered that all the N Z innovations were relat ively simple
to understand.
Relative advantage "is the det,YTee to which an innovat ion is perceived as being better
than the idea it supersedes" (Rogers, 2003, p.229). The degree of relat ive advantage is
often expressed as economic profitabi l it y, low init ia l cost, a decrease in d iscomfort,
social prest ige, saving t ime and etlort, and/or immed iacy ofreward. "Relative
advantage" can also be defined as a ratio between the expected benefits and the actual
costs of adopt ion of an innovat ion. Most diffusion studies have found that relat ive
advantage is the strongest predictor of an innovat ion ' s rate of adoption (F liegel &
Kivlin, 1 966a, 1 966b; M artin, McM i llan, & Cook, 1 988 ; S inden & King, 1 990).
Therefore it is widely accepted that the perceived relat ive advantage of an innovat ion is
posit ively related to its rate of adoption.
5 1 845 fanners 6 3 87 peasants fanners 7 1 30 fanners 8 229 Pennsylvania fanners, 88 Ohio fanners, 80 small-scale Pennsylvania fanners
26

Chapter 2: Theoretical Framework
The k ind of the innovat ion determines what specific type of relat ive advantage
(economic, social, and the l ike) is important to adapters. I nnovations that are adopted
for business purposes (e.g. a new tractor, or the use of fert il izer in pastures) are usual ly
be oriented towards increasing economic performance. By contrast, innovations offered
to consumers could be oriented towards increasing social prestige (e.g. mobile
telephones, new clothes, cars). Another aspect that could determine which specific sub
d imensions of relat ive advantage are more important is the characterist ics of potent ial
adapters. For example, for farmers focused on increasing the profitabi lity o f their farms
usually the economic benefits of an innovation are the most important. But on smaller
farms, where the owner must do most of the act iv it ies of the farm, innovat ions that save
t ime and effort wil l also be considered advantageous.
Compatibi lity "is the degree to which an innovat ion is perceived as consistent with the
exist ing values, past experiences, and needs of potent ial adapters" (Rogers, 2003,
p.249). An innovat ion that is more compat ible is less uncertain to the potent ial adopter
and, as stated above, the innovat ion-decision process is in some way a process of
reduc ing uncertainty about a new idea. Past research suggests that perceived
compat ibi l ity is the second attribute in importance to predict adoption (for example
Kaplan, 1 999; L ievrouw & Pope, 1 994; Mensch, Bagah, Clark, & B inka, 1 999) . An
innovation can be compat ible or incompat ible w ith ( I ) socio-cultural values and bel iefs,
(2 ) previously introduced ideas, and ( 3 ) cl ient needs for the innovat ion. For example,
Australian farmers place a strong value on increasing farm product ion. Soil
conservat ion innovat ions (such as contour farming) are perceived as confl ict ing with
this product ion value and have generally been adopted slowly (Guerin, 1 999). The
compat ibi l ity o f an innovat ion with previously introduced ideas also faci l itates
adopt ion, for example after introducing the hybrid com seeds and their success ful
results, all other hybrid seeds were introduced more easily. Compatibil ity w ith needs is
also important : if a new idea or pract ice is useful to solve an exist ing problem for the
potent ial adopter, then innovat ion is more rapid ly adopted (Guerin & Guerin, 1 994;
Tully, 1 98 1 ).
Complexity "is the degree to which an innovat ion is perceived as relatively d i fficult to
understand and use" (Rogers, 2003, p.257). Any new idea or pract ice can be c lassified
along the complexity-simpl ic ity cont inuum. Some innovat ions are clear in the ir
meaning whi le others are more d i fficult for the potential adapters to understand.
27

Chapter 2: Theoretical Framework
Depending on the nature of the innovation, complexity may not be as important as
relat ive advantage or compatibi lity, but for some new ideas, comp lexity is a very
important obstacle to adopt ion (Guerin & Guerin, 1 994; Lynch, Gregor, & Midmore,
2000) .
Trialability "is the degree to which an innovation may be experimented with on a
l imited basis" (Rogers, 2003 , p .258) . The possibi l i ty of trial l ing an innovation under the
potential adopter ' s conditions can reduce uncertainty and create confidence in the
innovation. E xamples of this can be found in Campbell & Junor ( 1 992) and Dixon
( 1 982, cited in Guerin & Guerin, 1 994). Consequent ly it is expected that the perceived
trialability o f an innovation wi l l be positively related to its rate of adoption. However
not all innovations can be tried or partially adopted. I t is not difTicult to apply more
fertilizer on a specific crop on a trial basis, because it can be appl ied to only part of the
area and then compared with the other part. It is not possible though for a farmer with a
farm calving all year round, to trial seasonal calving (all cows calve at the same t ime)
because to really notice the advantages he or she has to fully adopt the innovation.
Observability "is the degree to which the results of an innovation are visible to others"
( Rogers, 2003) . Some innovat ions are easily observed and communicated to other
people, whereas others are difficult to observe or to describe. Warner ( 1 98 1 , cited in
Gucrin & Guerin, 1 994) proposed that lack o f observabi lity of results would hinder the
adoption of t echno logy. Generally innovations that are ideas are less observable than
practices or objects.
2 . 1 .3 .2 Type of Innovation-Decision
The type of innovat ion-decision is also a var iable that affects the rate of adoption of an
innovation. The innovat ion-decision can be c lassified as follows (Rogers, 2003) :
"Optional innovation-decisions [are] choices t o adopt o r reject an innovation that are
made by an i ndividual independent o f the decisions by other members o f a system"
(p .403) . The innovation-decisions that are going to be analysed in this study are all of
this k ind. A n example o f this would be Argentine dairy farmers deciding whether or not
they adopt N ew Zealand cow genetics.
"Collective innovation-decisions [are] choices to adopt or reject an innovat ion that are
made by consensus among the members o f a system" (p.403). For example, laws in
28

Chapter 2: Theoretical Framework
European countries that compel farmers to use soi l conservation pract ices to prevent
pollut ion and erosion.
"Authority decisions [are] choices to adopt or reject an innovat ion that are made by a
relat ively few ind ividuals in a system who possess power, high social status, or
technical expertise" (p.403 ). For example, if a dairy company decides to co llect only
milk at a certain temperature, therefore farmers who want to sell their milk to the
company have to buy special machinery to cool the mi lk .
2. 1 .3 .3 Commu nication Channels
Communicat ion channels arc also an important factor affect ing the rate of adopt ion . "A
communication channel is the means by which messages get rrom one individual to
another" ( Rogers, 2003, p. 1 8) . The communicat ion channels can be categorized as ( I )
interpersonal, in contrast to mass med ia and (2 ) local, in contrast to cosmopo litan.
Cosmopol it an communicat ion channels arc those that l ink a person with sources outside
the social system under study; for example, television that connects a farmer in a
spcci tic locat ion of Argent ina with the rest of the world . Very often mass media
channels are cosmopolitan. I n contrast , interpersonal channels may be either local or
cosmopolitan.
The fo llowing two statements are the result of studies about communicat ion channels
and their impact on the rate of adopt ion ( Rogers, 2003 ) : a) Mass med ia and
cosmopolitan channels are relat ively more important at the knowledge stage, and
interpersonal and local channels are relat ively more important at the persuasion stage in
the innovat ion-decision process. b) Mass media and cosmopolitan channels are expected
to be more important for the early adapters, and the interpersonal and local channels
more important for the late adopters.
2.1 .3.4 The Characteristics of the Social System
The structure, norms and opinion leadership of the social system are characteristics t hat
affect the rate of adopt ion of an innovat ion. "A social system is defined as a set of
interrelated units that are engaged in jo int problem solving to accompl ish a common
goal" ( Rogers, 2003 , p .23 ) . The members or units o f a social system may be persons,
groups, organizat ions or subsystems. Within the boundaries of the present study the
29

Chapter 2: Theoretical Framework
social system is the Argent ine dairy sector and the interrelated units are the Argentine
dairy farms and farmers.
The diffus ion theory proposes that in a speci fic social system there is a regular pattern
in the way information flows. This pattern is called t he structure o f the system. The
struct ure exists because not all people communicate w ith every member of the system
w it h the same frequency and manner. In contrast, individuals communicate more
frequently w ith people who have s imilar values. With in this structure there are some
ind iv iduals who commun icate with more members o f t he soc ial system than others, and
th is qual i ty gives them a h igher degree of opinion leadership. Further there are also
ind iv iduals who communicate with people outside their own soc ial system and act as
connectors between their system and others systems (Rogers & Kincaid, 1 98 1 ). I f two
social systems are compared, and one has more interconnectedness than the other, i t is
expected (other things being equal) that the diffusion process of a specific innovat ion
will be faster in the first one.
Apart from the structure of a social system, the norms of the system can also affect the
rate of adoption of an innovation. "Norms are the established behavior patterns for the
members of a social system. N orms define a range of tolerable behavior and serve as a
guide or standard for the behavior o f members of a social system'' ( Rogers, 2003, p.26).
In some ways the norms of a system tel l indiv iduals what behaviour they are expected
to perform. A social system can be oriented to change and faci l it ate the adoption of
innovat ions, or it can have norms that are opposed to change and consequently impede
the adoption of innovat ions ( Kincaid, 2004; Tully, 1 98 I ) .
The most innovative members of a system arc very often perceived as people that "think
out o f the box" and do not completely consent to the way of think ing, values, beliefs
and norms of most people within the social system. Therefore, as they are considered to
be d ifferent, innovators usually do not have high influence on other people's decisions
regarding adopting new practices and techno logies (Rogers, 2003) . However, as
ment ioned before, there are other indiv iduals who communicate w it h more people than
the average person of the system. What these people think about a new innovat ion is
communicated more rapidly to other members of the social system. Consequently, they
function as opin ion leaders within the system. Opinion leaders are people that influence
other individual's attitudes more frequently (Roling, 1 988 ; Veerabhadraiah, Sethu Rao,
& Dwarakinath, 1 973a) . Opinion leadership is earned and mainta ined by the
30

Chapter 2: Theoretical Framework
ind iv idual ' s technical competence, social accessibi l ity, and conformity to the system's
norms. Opinion leaders are habitual ly in conformity with the system nonns; therefore,
when the social system is oriented to change, the opinion leaders are more innovat ive,
but when the system's norms are opposed to change, t he behaviour of the leaders also
reflects this norm (Tully, 1 98 1 ) .
The idea of extend ing new techno logies through the relat ionship between opinion
leaders and extension officers was defined by the d iffusion research in the early 1 960's
and it is st i l l in use by extension agencies around the world ( Ro l ing, 1 988 ) . This
strategy is also known as "the progressive farmer strategy".
2. 1 . 3.5 Extent of Change Agents' Promotion Efforts
When change agents (a lso cal led extension workers or consultant officers) pa11 ic ipate in
the d iffusion of an innovat ion, they have an effect on the rate of adoption. I t has been
found that the change agent 's effort in d iffusing the innovat ion is posit ively related to
the rate of adoption (Veerabhadraiah, Sethu Rao, & Dwarak inath, 1 973b). Also the
empathy and cred ibi l ity of the change agent with the c l ients can have a posit ive impact
in the adopt ion of the innovat ion that the change agent is proposing ( Rogers, 2003 ) .
2. 1 .4 lnnovativeness and adopter categories
Not al l the members of a social system adopt a new idea at the same t ime; adoption
occurs sequential ly over t ime. Consequent ial ly, based on when indiv iduals start using a
new idea, they can be class ified into adopter categories. People adopt ing a specific
inno vat ion earl ier are considered to be more innovat ive than ind ividuals adopting it
later. lnnovativeness, is "the degree to which an individual (or other unit of adoption) is
relat ively earlier in adopting new ideas than other members of a system" ( Rogers, 2003,
p.96-97).
As shown in F igure I , in the study of the hybrid corn seed in Iowa, the adopt ion rate o f
an innovat ion t hrough t ime has a normal d istribut ion. Based on this d istribut ion, adopter
categories can be defined (see F igure 3 ) .
3 1

Chapter 2: Theoretical Framework
Figure 3: Adopter Categorization on the Basis of lnnovativeness
Innovators Early Adapters
1 3 .5 %
x 2sd
Early Majority
34 %
X
Late Majority
34 %
(Adapted from Rogers & Shoemaker, 1 97 1 , p. l 82)
x + sd
T yp ical characterist i cs have been defined tor each category based on numerous
d i ffusion studies in the last 40 years. Rogers (2003) combined these typical
characterist ics and defined ideal t ypo logies of adopters:
Innovators are adventuro us people; to innovate is almost an obsession w it h them. Their
interest tor new ideas could lead them out of the local c ircle into more cosmopolitan
soc ial relat ionships. Usually innovators have enough financial resources to cope with
the cases when the innovat ion does not work. They arc individuals that are able to
understand and apply complex t echnical knowledge and can deal w ith h igh degrees of
uncertainty. While other members of a social system may not respect innovators, they
play an important role introducing new ideas.
E a rly adopters are more local people than innovators. I n contrast with the innovators,
t hey do not differ from the norms of the social system. T hey usually have the h ighest
degree of opinion leadership in most systems. These early adopters are usually
respected by o ther members of the soc ial system and have a big impact on further
d i ffusion of a new idea (2000).
The people that fall w ithin t he early maj o rity category adopt new ideas just before the
average member of a system. They interact frequent ly with their peers but infrequently
ho ld strong positions. They usually get awareness of new ideas quite soon, but
deliberate for a long t ime before adopting.
The late maj ority, together w ith the early majority category, arc the most numerous,
summing up one th ird o f all adopters (see F igure 3 ). The late majority adopt just after
32

Chapter 2: Theoretical Framework
the average person of the system. They may adopt as the result of economic necessity
and o f increasing peer-pressure. They are strongly influenced by the nonns of the
system and they usual ly adopt when most of the uncertainty about a new idea has been
removed. They usual ly approach innovat ions with a scept ical and caut ions air. They
often have l imited resources so that t hey cannot afford the luxury of adopt ing
d isadvantageous innovat ions.
The lagga rds are the last ones in a social system to adopt a new idea. They are very
local and so me of them are not very social (quite iso lated) . Their po int of reference is
the past and they are very tradit ional . They tend to be suspicious of innovat ions and
change agents. Their resistance to innovations could be ent irely rat ional from their po int
of view, as their resources are usual ly l im ited and they must be assured that a new idea
wi l l not fai l before adopt ing it .
I t is important to note that the categories described above are ideal and typical. They do
not represent ind ividual farmers; they describe ind ividuals with extreme characterist ics.
Howden & Yanc lay ( 2000) , in their research about "mythologizat ion" of farming styles
in Austral ia concluded, that although several focus groups ident ified several farming
styles, when they tr ied to val idate the styles with real farmers they co uld not find
farmers that fu lfil led al l the main characterist ics. The same would happen with adopter
categories, because no real farmers match the categories of adapters. The categories are
only a simple way to describe the characterist ics that make a person more or less an
inno vator.
2.2 Criticisms of and Responses to Diffusion Theory
Hav ing o ut l ined the main po ints of the d iffusion theory, a considerat ion of the main
crit icisms to this framework is presented.
2. 2. 1 Pro-Innovation Bias
The pro-innovation b ias is one of the most serious shortcomings o f d iffusion theory.
This was the first bias to be recogn ized by diffusion scient ists:
33

Chapter 2: Theoretical Framework
"The pro-innovation hias i s the impl ication that an innovation should be diffused and adopted by a ll members of a social system, that i t should be diffused more rapidly, and that the innovation should be neither re-invented nor r�jcctcd" (Haider & Kreps, 2004, p.7) .
The diffusion theory has been developed based on innovat ions that were successfully
d iffused and adopted by most of the members of a soc ial system. In most of those
studies, the innovations were clearly advantageous and had a pos it ive impact on the
situation of the adopters. The impl icit idea behind this theory is that to adopt
innovations is always beneficial and that to reject new ideas and technologies i s
irrational.
The diffus ion theory also implied t hat all members of a social system should adopt the
innovat ion. It does not consider the d ifferent s ituat ions and characterist ics of members
of the same social system (Arnon, 1 989; Roling, 1 988 ) . An innovat ion could be
beneficial for some people and useless tor others; in those cases where the innovat ion is
not beneficial, the most intelligent decision for those people would be to reject the
innovat ion. For a third group of members of a social system the innovation has to be re
i nvented or adapted to be advantageous. The concept of re- invent ion was added later to
d iffusion theory; in t he beginning t he only two possibi l it ies were to adopt or to reject an
innovat ion.
Change agents and researchers affected by the innovat ion bias have participated in the
adoption of several practi ces that were detrimental to t he communit ies that adopt ed
them. The adoption o f those innovat ions had a negative long-term impact on the
communiti es t hat adopted them (Black, 2000). Examples of this are contaminat ion of
streams by excess usage o f ferti l izers and the salini zation of soils caused by
inappropriate irrigat ion.
Several ways were suggested by Rogers (2003 , refer to p. 1 1 2 ) and Haider & Kreps
(2004, refer to p. 8 ) to overcome this b ias. Both studies agree that the most important
step is to recognize t hat th is bias could exist and to consider that sometimes the best
opt ion i s to reject an innovation. Further, it was suggested the potential consequences of
the adoption o f new practices be carefu lly studied before extending them.
34

Chapter 2: Theoretical Framework
2. 2. 2 Person-Blame Bias
Most ofthe d iffusion research has been done from the point of view of the developers
of the innovat ions and the change agencies (also known as the sources of the
innovat ions). This b ias is probably suggested by the words that are used to describe this
field of research: "d i ffusion research" might equally have been cal led "problem
solving", "innovation seeking", or "evaluation of innovat ions'' from the po int o f view of
the potent ial adopter (Rogers, 2003 ) .
The fact that the po int of view ofthe developers has been present in most d iffus ion
studies has put the b lame on the potent ial adopters (also called the audience of the
innovat ions) when the level o f adopt ion of the innovat ion has been low. This orientation
impl ies that : !{'you do not mmt to adopt the innovation there is a prohlem with you.
I nstead would be more appropriate to put the blame on the innovat ion itself (may be the
innovat ion is not beneficial for that community) or in the way in which the innovat ion
was communicated (Caplan & Nelson, 1 973) .
As in the pro-innovat ion bias, Rogers ( 2003, refer to p. l 25 ) and Haider & Kreps (2004,
refer to p .8 ) suggested several ways to overcome the person-blame bias. Yet again both
studies agree that t he most important step is to recognize that this bias exists and that
stud ies should be designed in order to avo id it . Some ways to prevent this b ias are: not
us ing ind ividuals as so le units of analysis but consider also other aspects such as the
attributes of the innovat ions, the intentions of the change agency or company, and the
characterist ics of t he social system.
2. 2. 3 Pro-lnnovativeness Bias
Past studies (previously cited ) have correlated t he characterist ics of ind iv iduals w it h
their degree of innovat iveness. I t has been found that better educated and wealthier
farmers are among the most innovative. People that are considered more rat ional, w it h a
more positive att itude towards science and better able to cope with uncertainty adopt
before the average person of a social system. F inally it has been found that people t hat
have more social part icipat ion, and who are more cosmopol itan, have a greater degree
o f innovat iveness ( Rogers, 2003 ) .
35
Chapter 2: Theoretical Framework
These findings could induce researchers to t hink that the more innovative a person is,
the h igher the probab il ity that a person is successful . However correlation does not
necessari ly imply causality. These findings cannot say that a more innovative person
w il l be wealt hi er ; instead they mean that there is a relat ionship between wealth and
innovativeness w ithout assessing the cause or i f other variables are affecting the results
(Meyer, 2004).
Another aspect that is important to clar ify is t hat there are very few peop le who adopt
early all k inds of innovations. It is reasonable to think t hat di fferent people are more
innovat ive regarding di fferent k inds of innovations . For example, one farmer can be
more innovat ive in respect to tractors and machinery and a second farmer can be more
innovative w it h respect to pasture managing techniques or in computer uti l it ies.
Therefore i t is an over-simpl i fication to classify people as innovators or laggards tor all
k inds of innovat ions.
2. 2. 4 Heterogeneous Social Systems
The d i ffus io n theory implies that once opinion leaders of a social system adopt an
innovation t hen there is a natural d iffusio n o f the innovat ion to the rest o f the members
o f the social system. However, whereas most of the seminal d iffusion studies were done
in relat ively small and homogenous communit ies, the definit ion of social system
ut i lized w ith in the d iffus ion theory is very broad and can include, tor example, "all
farmers in Latin America".
When the d iffusion theory started to be appl ied in developing countries, i t was observed
that extension agencies communicated more o ften w ith farmers who were more
responsive. These farmers were usually relat i vely wealthy and educated and became
more wealthy and educated helped by extension agencies (Rol ing, Ascroft, & Wa
Chege, 1 98 1 ). This problem was called the inequal ity problem and it was thought that
the t heory cou ld not be appl ied to social systems t hat were heterogeneou s ( Amon, 1 989;
Chambers & J iggins, 1 987; Goss, 1 979; R6l ing, 1 988) because t he wealthy-poor gap
would be enlarged.
This inequality problem could be solved by the correct defin it ion of the t arget social
system. Roling at al. ( 1 976) in Kenya, and Shingi and Mody ( 1 976) in I nd ia (both cited
36

Chapter 2: Theoretical Framework
in Rogers, 2003 ), designed d iffusion approaches that narrowed, rather t han widened,
socioeconomic gaps. They accomplished this by target ing correctly the community in
which they wanted to extend the innovat ions ( Rol ing, 1 988 ) . For example, if the
intent ion is to diffuse rural innovations among resource-poor farmers in a region, t hen
the change agents should communicate with the opin ion leaders of the resource-poor
farmers o f that area, and once the opinion leaders have adopted, the natural d iffusion o f
the innovat ion wi l l occur. However i f change agents contact opinion leaders o f wealthy
farmers, what would probably happen is that the innovat ion would be spread through
the wealthy farmers of the region and not necessari ly to other groups of farmers.
2. 2. 5 Diffusion Theory and "top-down " Models of Extension
As prev iously mentioned, the classic d iffusion parad igm has been the originat ing t heory
of two extension st rategies, one that was cal led the "progressive farmer" or "opinion
leader" model (Arnon, 1 989; Roling, 1 988 ) and a second one called the "top-down" o r
"l inear adoption" strategy ( B lack, 2000). However the d i ffusion theory cannot be
defined as the sum of t hese two techno logy transfer strategies. The d iffusion parad igm
was only the theory that inspired these two extension models. The d iffusion process is a
broader social process than an extension strategy. It is a human phenomenon that occurs
with or without the presence of extension officers or change agencies (Warner, 1 974) .
Consequent ly, the problems ident ified in both the "progressive farmer" and the "top
down" extension strategies are not deficiencies of the d iffusion theory. They real ly are
consequences of the implementat ion of these extension methodologies.
2. 2. 6 Participatory Approaches and Diffusion Theory
There are some innovations that do not diffuse natural ly through the members of a
target social system. These innovat ions are usua l ly not advantageous in the short-tenn,
not very compat ible, are difficult to understand or explain, or have any other attribute
that make it difficult for them to be extended ( B lack, 2000). The constraints could be
also in the context of the social system; a vo lat i le context with h igh risk and uncertainty,
or a context where it is d i fficult to access credit, or where it is d ifficult to communicate
the innovat ion, wi l l make adoption more difficult (Arnon, 1 989) . There is also some
37

Chapter 2: Theoretical Framework
evidence that showed that in more tradit ional (Tul ly, I 98 1 ) or low-educated and poor
resource communit ies (Arnon, 1 989) it is more difficult to extend new technologies.
The fai lure of the "top-down" models in extending low acceptabi lity innovations
(Guerin & Guerin, 1 994), or innovations with acceptable attributes in traditional or low
educated and poor-resource communit ies (Chambers & J iggins, 1 987), mot ivated the
appearance of the "participatory approaches". These approaches in which scientists,
extensionists and potential adopters work together in the originat ion and diffus ion of
innovations; have proved to be successfu l in many cases (Carberry e t al . , 2002 ; M urray,
2 000).
But the fact that participatory approaches have been successfu l in extending some new
ideas does not imply t hat classic methods are no longer useful . Both "top-down" and
participatory approaches seem to be useful in extending innovations. They are the two
extremes o f t he extension spectrum. I t is quite accepted that the methodologies are
complementary. It is also accepted that in d ifferent situations, or tor diverse
innovat ions, one of the extension strategies could be more appropriate than the other
( B lack, 2000; Chambers & Ghi ldyal , 1 985 ; Guerin & Guerin, 1 994) .
2 .3 C onstraints on Adoption of I n novatio ns i n
Agricu lture
The problem o f non-adoption in agriculture is common around the world (Guerin &
G uerin, 1 994). Very often there are ideas and practices that experts perceive as
beneficial for farmers to adopt but farmers are not interested. Much research in this field
has been carried out . Especial ly in developing countries where the need tor basic
agricu ltural techno logies is great (Arnon, 1 989; Chambers & J iggins, 1 987 ; Rol ing et
a l . , 1 98 1 ) . There has also been research in Austral ia in relation to the adoption of more
sustainab le practices (Guerin, 1 999; Lockie, Mead, Vanclay, & B ut ler, 1 995; Vanclay,
2 004) and other k inds o f techno logy; for example, inte l ligent support systems ( Lynch
et al . , 2 000).
The "problem" of non-adoption is c learly mult i-factorial. Guerin & Guerin ( 1 994) in a
comprehensive review of th is field ident ified several factors that were found to
38

Chapter 2: Theoretical Framework
constrain t he adopt ion of innovat ions. Based in the factors proposed by d i ffusion theory
the reasons for non-adoption can be classified in four groups.
These four groups relate to :
The attributes of the innovations as perceived by the potential adapters within
their own context/ situat ion .
The characterist ics of the social system with respect to intercommunication,
opinion leaders and norms.
The channels through which the innovat ion is communicated.
Whether a change agency part ic ipates or not in the d iffusion process, the extent
of effort of the change agents and the extension strategy ut il ized by the
extension agency.
A brief ana lysis o f these four gro ups of constraints to l lows:
2. 3. 1 Perceived Attributes of Innovations
M u lt iple factors influence the way in which tanners perceive innovat ions. The
fo l lowing factors do not affect innovat ions d irectly but they affect, in contrast, the way
in which farmers perceive them:
Factors I n herent in the Farmer: exist ing needs, socio-economic status, age, goals,
fami ly situat ion, level of educat ion, personality in general , level of aspirat ion, att itude
towards farming, att itude towards economic future of farming, att itude towards risk,
att itude towards technology, att itude towards change, beliefs, values and fears.
Factors i nherent in the farm or business: scale, locat ion, and other characteristics.
Economic conditions of the context: economic benefits of the innovation within the
specific context, access to cred it or other way of financing to buy the innovat ion, prices
at the internat ional and local l evel, foreign exchange fluctuat ions, government pol ic ies,
i mport dut ies and demand for food.
39

Chapter 2: Theoretical Framework
I n relation to the innovation: perceived benefits (comparat i ve advantage, economic
benefits, status benefits, comfort benefits), in it ia l and maintenance costs, perceived
compatibi li ty, perceived complexity, perceived trialab i l ity and perceived observabi l ity .
2. 3. 2 Characteristics of the Social System
As previously stated , the main factors that cou ld l imit the d iffusion of an innovation are:
low level of inter-connectedness and system norms resistant to change.
2. 3. 3 Communication Channels
The lack of resources to advertise or promote through mass media channels can l imit the
awareness of an innovation to only a smal l group. On the other hand, as most
innovat ions cannot be ful ly communicated through mass media alone, lack ofresources
to provide advice to farmers during the innovat ion-decision process (special ly in the
persuasion and implementat ion stages) can slow the diffusio n process.
2. 3. 4 Extension Agency and Agents
The presence of an inst itution interested in d iffusing the inno vat ion usually accelerates
the rate of adoption. A change agency can prov ide funds to promote the innovations in
t he mass media and train people to give advice to farmers during the innovat ion
dec is ion process. Complex innovat ions, those integrated or with low observabi lity are
more d ifficult to extend. This k ind of innovat ions requires more contact between the
change agent and the farmer ( more participatory approaches) and/or a higher level of
t echnical understand ing by the farmers and/or more ski lfu l change agents ( B lack, 2000).
40

Chapter 3: Dairy Sectors: New Zealand and Argentina
3 DAI RY SECTORS : New Zealand and Argentina
I n the next two sect ions the New Zealand and Argent ine dairy sectors are described in
order to get an overv iew of the environments in which the dairy farms of these two
count ries are immersed.
3 . 1 New Zealand Dai ry Sector
3. 1. 1 Physical and Economic Foundations
There are two dominant factors that make the ew Zealand dairy sector the lead ing
exporter o f dairy products (USDA, 2004a). First ly and best known, is the production
system based on pasture. ew Zealand is a rough country and does not have so i ls that
arc naturally fert ile. What it does have is a temperate, moist cl imate with regular rain
that is nearly ideal tor growing temperate pastures. This is the country's main natural
resource. Grass has the potent ial to be grown all year round and grazed intensively over
approximately 45% of New Zealand's area 9. Product ions of I 0 to 1 6 tonnes of Dry
Matter o f high quality grass per year are achieved on New Zealand dairy farms
( Holmes, 2003b) . 'The efficient ut i l izat ion of the grass through integrated management
of past ure and l ivestock is the economic cornerstone ofthe dairy industry. I t is the basis
of the industry's comparat ive advantage internat ional ly" ( M itchel l, 2002, p. 4) .
The second fundamental factor of the ew Zealand dairy sector is its export orientat ion.
" o other dairy industry in the world, and few ind ustries in any other sectors, match the
focus the dairy industry in New Zealand has on internat ional customers" ( M itchel l,
2002, p.4) . The domest ic market is nearly insign i ficant . I t consumes only about 5% to
I 0% o f N ew Zealand mi lk and mi lk products ( Stat ist ics-NZ, 2000) . The rest is so ld to
overseas markets thousands of k i lometres away. This requires a remarkable capacity to
bui ld commercial relat ionships wit h companies and customers all over the world .
9 Arable land + grassland + horticulture = 1 2 ,060,945 hectares. From this land I , 794,4 74 hectares ( 1 5%) are used for dairy farming (own calculations from 2002 National Agricultural Production Census).
4 1

Chapter 3: Dairy Sectors: New Zealand and Argentina
I n New Zealand the dairy sector is the leading exporting sector of the economy. I n the
last 6 years ( from 1 997 to 2003) the dairy sector earned between 1 6 to 20% of total New
Zealand's exports by value (Stat ist ics-NZ, 2003). I n relative terms it is much more
important to N ew Zealand than, tor example, the automobile sector to Japan (Mitchell,
2 002). The performance of the sector is, therefore, not just important tor New Zealand
da iry farmers or others t hat work in t he sector, it is also of weighty significance to the
nation as a whole.
3. 1 .2 Economic Environment
New Zealand's economy has perfonned well in recent years, with a growth rate o f 3 %
per year from 1 998 to 2003, and inflat ion kept under 2 . 7% per year (see Table 1 ) .
Table 2 : New Zealand Economy - Financial Indicators
1 998 1 999 2000 2001 2002 2003 Avr Dev (%) I nflation (% change) 1 .3 -0 . 1 2.6 2 .6 2 .7 1 .8 1 .8 60%
I nterest rate ( %) 1 1 .2 8 . 5 1 0.2 9.9 9 .8 9 .8 9 .9 9%
Exchange rate (per US$) 1 .87 1 .89 2 .2 2.38 2 . 1 6 1 . 7 2 2 .04 1 2%
GDP (% real growth) -0.2 3.9 4 2 . 5 4.3 3 . 5 3 . 0 56%
( Euromonitor, 2004c)
The exchange rate between the New Zealand do llar (NZ-$) and the United States
currency ( U S-$) has h ad an increasing trend s ince 1 99 8 . The appreciat ion of the N Z-$
affects negat i vely New Zealand 's economy as i t is heavi ly dependent on commodity
exports.
The interest rates for long-term loans have been around I 0% during recent years, which
is one of the h ighest interest rates within developed countries but much lower than in
d I . . 1 0 many eve opmg countnes .
10 Average interest rates for some developed countries between 1 996 and 2002 have been 6.7% for France, 9.4% for Gennany, 4.5%, for The Netherlands, 6.9% for USA, 4.0'Vo for Switzerland and 5 .2'% for UK. For developing countr i es for the same period have been for Argentina 22%, for Brazil 69%, for Chile 1 2 % and for Uruguay 68% (Euromonitor, 2004b).
42

Chapter 3: Dairy Sectors: New Zealand and Argentina
3. 1. 3 Milk Price paid to farmers
M ilk and mi lk products prices in the intemat ional arena are much lower than in most of
the domest ic markets 1 1 ( 1 FCN Dairy Report, 2003) . This is mainly caused by the
restrict ions on imports by tariffs and tariff quotas and by direct and ind irect subsidies.
Prices in the export markets are also far more volat i le than prices in most domestic
markets because intemat ional markets cannot be contro l led and because there is a great
number of factors influencing them (M itchel l, 2002).
The fo llowing figure shows changes in the company payout , in real terms, paid to
tanners in the last 30 years.
VJ "0 0 rJ)
�
E 0)
� --fA-N z
F ig u re 4: Evolution of the New Zealand Company Payout ( 1 973/74-
2002/03)
8
7
6
5
4
3
2
0
1 97 3-74
New Zela n d Company Payout
1 980-81 1 987-88 1 994-95
( LIC, 2002/03)
200 1 -02
Prices weighted to give real dollar val ues using the Consumers Price I ndex for the end of the June quarter . Average Dairy Company total actual Payout for 1 97 4/75 to 1 988/89 has been derived from NZ-$/kilograms mil k-fat, a rel ationship of 74% m il k-protei n/ mi l k-fat has been considered .
1 1 Milk prices for lreland, The Netherlands, Spain, Gennany, France and Belgium from 1 996 to 2002 ranged between 27 to 37 US-$/kilograms of standardized milk (!FCN Daily Report, 2003). For New Zealand the m ilk price from 1996 to 2002 ranged between 1 3 to 20 US-$/kilograms standardized m i lk (!FCN Daily Report, 2003) .
43

Chapter 3: Dairy Sectors: New Zealand and Argentina
The company payout has a decreasing trend of 1 . 3% annually and varied remarkably
from one year to another. There have been very low prices like NZ-$ 3 .04 ( 1 990-9 1 )
and high prices like NZ-$ 5 .50 (200 1 -02) .
As previously mentioned, the payout for dairy farmers i s affected by changes in
commodity prices. Other important factors that influence milk price are the fluctuations
in exchange rates, the product mix, and the sales volume of the different cooperatives
and companies. To reduce the impact of the fluctuations on exchange rate, the main
New Zealand cooperative (Fonterra) has a foreign exchange hedging policy (Fonterra
Ne>t:�·, 2 003) . This policy allows the cooperative to predict more exactly the payout for
the following year and guarantee to the farmers a minimum price for their milk for the
who le season, 1 5 months in advance.
3. 1 .4 Structure of the Sector
The N ew Zealand sector is an inteb:rrated cooperative system, made up of fiv e main
components (adapted from Holmes, 2003b) :
The farmers are the owners of the whole sector (there were 1 3 ,900 dairy farmers in
200 1 in New Zealand, I FCN 2003) . Consequently the industry is focused on
maximising their returns.
Fonterra Cooperative Group, which collects, industrializes and sel ls 95% o f N ew
Zealand milk all o ver the world. There are also some other smaller dairy cooperatives
and companies, which make up for the remaining 5%.
Live.�>tock Improvement Corporation, which operates the dairy sector's genetic
improvement programme and provides essential services to dairy farmers and Fonterra
( tor example, herd testing for 2 .8 million cows, artificial breeding for 2 .6 million cows,
sire proving service, research and development) .
Dexcel (Centre for excellence i n dairying), research company responsible for all
sector-good activities, to optimise whole farm systems: extension, farm production,
research, economic modelling, and strategic planning.
44

Chapter 3: Dairy Sectors: New Zealand and Argentina
Fon terra Research Centre, a sect ion from Fonterra, which provides essent ial services
to dairy companies in relat ion to the manufacture of dairy products. This centre is in
charge of basic research, technical and product development programmes and of a l l
aspects ofthe dairy manufacturing industry.
3. 1. 5 Size and Growth of the Sector
During the 2002/03 seasons the 3 . 8 mi l l ion New Z ealand cows produced I , 1 9 1 mi l l ion
k i lograms ofmi lkso l ids ( L IC, 2002/03) . This comprises 2% of world 's total m i lk
product ion; however New Zealand is the main expotter country of milk and mi lk
products in the world with more than 25% of the world 's total trade in dairy products in
the last 5 years ( U S DA, 2004b). The evo lut ion o f t he ew Zealand mi lk product ion in
the last 30 years is shown in the fo llowing figure:
Fig ure 5: Evolution of NZ Mi lk Production (1 974/75-2002/03)
New Ze la n d M i lk Pro d u ct ion
1 400
1 200
Vi "0 1 000 0 (/) � -- 800 E Ol � 600 c 0 � 400
200 - - - - - - - - - - - - - - - - - - - - - - - - -
0
1 974-75
( LIC, 2002/03)
1 981 -82 1 988-89 1 995-96 2002-03
During the last 3 0 years in New Zealand, there has been a cont inuous growth o f mi lk
production. This growth has been at a rate of 3 .4% annual ly and the total mi lk
production has t ripled from 1 974 to 2003.
During the 2003/04 season a 5 . 3% increase in m i lksol ids processed was registered ( LI C,
2003/04), despite the very d ifficult climat ic cond it ions for most regions. In the
beginning of the year there were forecasts of a payout only s l ight ly higher t han 2002/03 ,
45

Chapter 3: Dairy Sectors: New Zealand and Argentina
and expectations of a further drop in 2 004/05 ( MAF, 2004) . The final payout figure
l ifted throughout 2004 to NZ-$ 4.25 per k i lograms of milksolids (Fencepost . com, 2004).
The number of herds decreased during this season fo llowing a trend t hat started several
years ago. N umber of cows increased by 1 1 0,000 and, as a result, the average number of
cows per herd increased to over 3 00 cows (LIC, 2003/04).
D uring the next season (2004/05) milk product ion is expected to continue increasing,
helped by bet ter climati c condit ions. The forecasts payout tor farmers is NZ-$ 3 . 85 per
k i lO!:,lfam o f mi lkso lids ( MAF, 2004) .
46
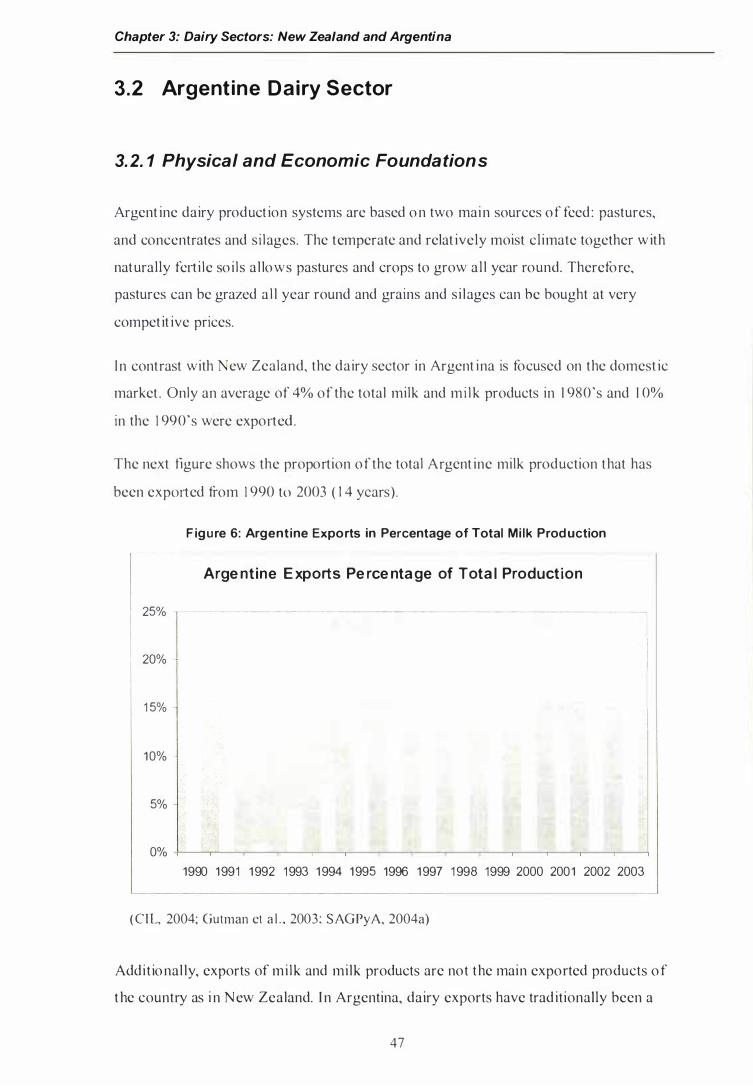
Chapter 3: Dairy Sectors: New Zealand and Argentina
3.2 Argent ine Dairy Sector
3. 2. 1 Physical and Economic Foundations
Argent ine dairy product ion systems are based o n two main sources of feed : pastures,
and concentrates and s i lages. The temperate and relat ively moist cl imate together with
naturally fe11 i le so i ls a l lows pastures and crops to grow al l year round. Therefore,
pastures can be grazed a l l year round and grains and s i lages can be bought at very
compet it ive prices.
I n contrast with ew Zealand, the dairy sector in Argent ina is focused on the domest ic
market . Only an average of 4% of the total milk and mi lk products in 1 980's and I 0%
in the 1 990's were expo11ed.
The next figure shows the proportion of the total Argent ine milk production that has
been exp011ed from 1 990 to 2003 ( 1 4 years) .
F igure 6: Argentine Exports in Percentage of Total Mi lk Production
Arge ntine E xports Pe rce nta ge of Tota l Production
25%
20%
1 5%
10%
5%
0%
1990 1 991 1 992 1 993 1 994 1 995 1996 1 997 1 998 1999 2000 2001 2002 2003
(C IL, 2004; Gutman et a l . , 2003; SAGPyA, 2004a)
Addit ional ly, exports of mi lk and milk products are not the main exported products o f
t he country as i n New Zealand. I n Argentina, dairy exports have trad itionally been a
47

Chapter 3: Dairy Sectors: New Zealand and Argentina
very smal l proportion of the total exports of the country (for example, in the year 2000
only l % of the total value of exports ) (Gutman et al. , 2003) .
3.2.2 Economic Environment
In D ecember 200 1 , after 4 years of economic recess ion that had a remarkable social
impact, the president of the country abd icated. In January 2002 a provis ional president
decided to do an asymmetric devaluat ion of the Argentine currency, "the Peso", that had
severe effects in the financial markets. An external and internal default was announced
and the "Country Risk" reached one of the highest values in Argentine history. A l l th is
generated a huge uncertainty in the country and the economic recession worsened; the
gross domesti c product (GDP) of the country fel l by 1 1 % in 2002. A new president was
e lected in Apr i l 2003 and that year the economy recovered by nearly 9%.
Table 3: Argentine Economy - Financial Indicators
1998 1999 2000 2001 2002 2003 Avr Dev (%) Inflation (% change) 0 . 9 - 1 .2 -0.9 - 1 . 1 25.9 1 3.4 6.2 1 82% Interest rate (%) 1 0.6 1 1 1 1 . 1 27.7 51 .7 1 9. 1 2 1 .9 74% Exchange rate (per US$) 1 .00 1 .00 1 .00 1 .00 3 .06 2 .90 1 .66 62% GDP (% real growth) 3.8 -3.4 -0.8 -4.4 -1 0.9 8.7 - 1 .2 584%
( Euromonitor, 2004a)
The exchange rate with the US-$ after the 200% devaluat ion in December 200 I has
been quite constant around AR-$ 3 . A strengthening of the AR-$ could be negat ive for
raising exports of commodity products that is one of the main forces of the GDP
!,>TOwth.
In the coming years, the GDP is predicted to grow 5 . 5% in 2004 and 4% in 2005 . After
very h igh inflat ions rates in 2002 and 2003, it is expected to decrease to 6. 7% in 2004
and increase again to 9SYo i n 2005 ( Euromonitor, 2004a).
Tradi t ionally, interest rates have been h igh in Argentina and access to credit has been
difficult in comparison w it h other countries. Last year (year 2003) t he interest rates
were c lose to 1 9%, and in 2004 there has been a decrease in the interest rates making
access to credit s light ly eas ier.
48
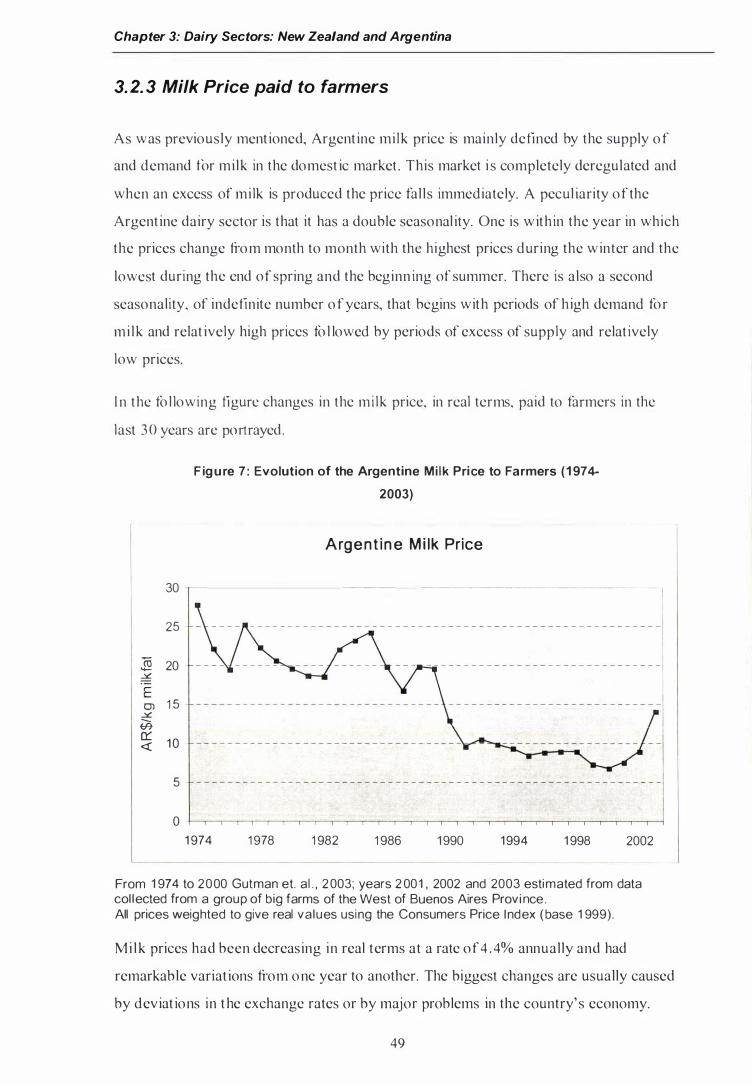
Chapter 3: Dairy Sectors: New Zealand and Argentina
3. 2. 3 Milk Price paid to farmers
As was previously ment ioned, Argent ine mi lk price is mainly defined by the supply o f
and demand for mi lk in the domest ic market . This market i s completely deregulated and
when an excess of mi lk is produced the price fal ls immediately. A pecul iarity of the
Argent ine dairy sector is that it has a double seasonal ity. One is w ith in the year in which
the prices change from month to month with the highest prices during the winter and the
lowest during the end of spring and the beginn ing of summer. There is also a second
seasonality, of indefinite number o f years, that begins with periods of h igh demand for
mi lk and relat ively high prices fo l lowed by periods of excess of supply and relat ively
low prices.
I n the fo l lowing tlgurc changes in the mi lk price, in real terms, paid to farmers in the
last 3 0 years are p011rayed.
30
25
J§ 20 �
E Ol 1 5
� � � 1 0
5
0
F ig u re 7 : Evolution of the Argentine Mi lk Price to Farmers ( 1 974-
2003)
Argent in e M i lk Price
1 974 1 978 1 982 1 986 1 990 1 994 1 998 2002
From 1 97 4 to 2000 Gutman et. a l . , 2 003; years 2 001 , 2002 and 2003 esti mated from data col l ected from a grou p of big farms of the West of Buenos Aires Prov i nce . All prices weighted to give real v a l u es usi ng the Consumers Price I nd ex ( base 1 999).
Mi lk prices had been decreasing in real terms at a rate of 4 . 4% annual ly and had
remarkable variat ions from one year to another. The biggest changes are usually caused
by deviat ions in t he exchange rates or by major problems in the country' s economy.
49

Chapter 3: Dairy Sectors: New Zealand and Argentina
I n the next figure the "within years seasonality" can be seen. It can be not iced how
during 2000, 2 00 1 and 2003 the milk price was h igh during the winter (June-July) and
then decreased in the spring (October-November). D uring 2002 the price kept
increasing due to a strong demand for milk by the milk companies.
Jjj � E Ol "'E � a::: <(
1 8 1 6 1 4 1 2 1 0 8 6 4 2 0
Fig u re 8 : Monthly Evolution of the Argentine Milk Price to Farmers
(2000-2003)
Arg entina Mi lk Price
From 1 974 to 2000 G utman et. al . , 2003; years 200 1 , 2002 a nd 2003 estimated from data coll ected from a group of b ig farms of the West of Buenos Aires Prov i nce. Al l prices weighted to give real val ues u si ng the Consu mers Price I ndex (base 1 999) .
3.2. 4 Structure of the Sector
The Argentine dairy sector, in marked contrast with New Zealand 's, is not very
intef:,>rated and does not have a common strategic plan. Even further, one of its main
characteristics i s a continuous conf1ict between the dairy companies and the farmers
regarding the milk price.
The approximately 1 3 ,000 Argentine dairy farms are very heterogeneous. There are
very b ig farms ( more than 1 ,000 cows) and also very small farms ( less than 50 cows)
w ith an average of 1 74 cows per farm (Gambuzzi, Zehnder, & Chim icz, 2003) . The
production systems are also very d ifTerent and change across the d ifferent dairy regions
(Gutman et al., 2003) . Another peculiarity of the Argentine dairy farmers is that they do
not have an inst itution w ith enough representative power to negotiate with da iry
companies and the government.
50

Chapter 3: Dairy Sectors: New Zealand and Argentina
There are approximate ly 800 dairy companies in Argent ina (Gutman et al . , 2003 ) . They
can be d iv ided into three well-defined groups. The ftrst group includes a smal l number
ofbig companies most of them Argentine owned . The 6 biggest dairy companies
process 53% of the total milk production and they export most of the milk and mi lk
products o f the country. The second group includes a s ignificant number of med ium
companies, each process ing less than 1 . 5% of the total mi lk produced (Ostrowski &
Debl itz, 200 1 ). And the last group consists of hundreds of small companies that usually
special ize in producing cheese and very often are accused of not paying taxes and not
complying with hygiene regulat ions (G utman et al . , 2003).
Research and extension in dairy farming in Argentina is not given the same importance
as in N ew Zealand. Argent ina does not create much knowledge with in its dairy sector
and nom1al ly farmers and consultants look for innovat ions for their product ion systems
to other countries as the United States, Austral ia and New Zealand ( researcher's
experience in the Argent ine dairy sector).
3. 2. 5 Size and Growth of the Sector
After 8 years of an average growth of 9%, the highest milk product ion occurred in 1 999
( I 0,329 mi l l ion litres ) . However from 2000 to 2003 mi lk product ion decreased to
s imi lar vo lumes as in 1 994. During 2003 approximately 1 . 2 mi l l ion cows ( SAG PyA,
2003 ) produced 7,95 1 mi l l ion litres (approx imately 538 mi l l ion k i lograms of
mi lkso l ids) . The to l lowing graph shows the Argent ine total milk production from 1 970
to 2003 (2 1 years ) .
5 1

Chapter 3: Dairy Sectors: New Zealand and Argentina
Figure 9 : Evolution of the Argentine M i lk Production ( 1970-2003)
Arg entine Mi lk Prod uct ion
1 2,000
1 0,000
(/) 8,000
� c 6,000 .2 ·-
:::2: 4,000
2,000
0
1 983 1 988 1 993 1 998 2003
(SAGPyA, 2004a)
During the period shown in F igure 6 the annual t,Jfowth in total milk production h as
been 3%, which i s lower t han the 3 .4% annual t,Jfowth of New Zealand.
Throughout 2004 the mi lk production increased approximately 20% (SAGPyA, 2 004b)
and a further t,Jfowth is forecasted for 2005.
52

Chapter 4: Dairy Farm Systems: New Zealand and Argentina
4 DAI RY FARM SYSTEMS: New Zealand and Argentina
Farm models were chosen from the I nternational Farm Comparison N etwork (hereafter
I FCN ) as examples of dairy systems of N ew Zealand and Argent ina. There are six farm
models, three for each country; these models were defined as typical 1 2 for each country.
What fo llows is an introduction to the I FCN framework.
4.1 The I FCN
The I F C i s a worldwide associat ion of agricultural sc ient ists, consult ants and farmers.
Most of the main countries that produce agricu ltural foodstuffs are represented in the
network; every cont inent is represented . The framework is d ivided into sections that
analyse systems of production of d ifferent agricult ural products; I FCN Dairy, the I FCN
Beef and the I FCN Arable Crops. In the I FC Dairy there were 27 co untries
represented in the last annual report (2004) with 83 different typical farms. The
inst itut ions that originated the network are the Federal Agricultural Centre ( FAL) from
Germany, and the Agricultural and Food Po licy Center (AFPC) from the Texas A&M
University from the United States.
In brief, the quest ions that the I FCN wants to answer for each country are:
How is farmi n g done ( farming system, product ion technology)?
What is the cost o f product ion? What are the reasons for advantages and disadvantages i n compet it iveness?
What is the fut ure perspect ive of agricu l tura l production at the locat ions considered?
(adapted from lsermeyer, Deb l i tz, 1-lemme, & Plessmann, 2004) .
To answer these quest ions, the I FCN util izes the fo l lowing methods and principles; here
they are i l lustrated by reference to the I FCN Dairy for the agricultural product "milk" :
The concept of "ty p ical regional models": the first step is to select the most important
regions and locat ions for milk production in the world. Regional experts and local
farmers in t hose areas are contacted and a "panel" is organised to define typical fanns
1 2 Note that 'typica l ' means characteristic, which is not the same as most frequent (mode) or a stat istical average.
53

Chapter 4: Dairy Farm Systems: New Zealand and Argentina
for the region. This panel aims to define a moderate and a large farm for the region, but
variat ion can be found in d ifferent regions. The idea is to establ ish the data for each
typical farm in a very detailed manner, and as close to reality as possible. The data have
to cover all relevant aspects, ranging from the physical organizat ion of enterprises to
taxat ion of the profit . Stat istical averages derived from farm groups are avo ided unless
they are very accurate. In addit ion, real farms are not used because they have
pecul iar it ies that deviate too much from the typical (adapted from I sermeyer et al.,
2004).
The "principle of total costs" : in the framework not only cash expenses are taken into
account but also non-cash adjustments ( including the costs of depreciation, the change
in inventory and gains or losses in capital value), and the opportunity costs o f the
factors that are owned by the farmer (capital, land and labour).
The comp uter model T I PI-CAL 13 is uti l ized to input all the physical and economic
data from the different models and to compare costs and economic indicators across the
d ifferent models. The model works in MS- Excel® (spreadsheet) in order to enable
everyone invo lved in the I FCN to have access to the database. It has two main parts,
one where al l the actual data from each model is registered and another that s imulates
for periods up to 1 0 years, to evaluate growth, investments and the impact of changes in
po l icy and prices.
The whole farm data is analysed. The typical models take into account the data from
al l the acti vities (or enterprises) of the farm business (for example, dairy, beef and cash
crops) plus the income and the expenses of the owner ( including the income from off
farm act iv it ies and fami ly expenses). To calculate the total cost of each product, the
indirect costs are distributed proport ional ly (for example the machinery expenses are
d istributed according to the amount of t ime used in the d ifferent act iv it ies).
The costs structure and the economic indicators are explained in further detai l in the
next sect ion. For more details about the I FCN refer to w ww. itennct work .org.
1 3 T IPI-C AL: Technology lmpact and Pol icy Calculations
54

Chapter 4: Dairy Farm Systems: New Zealand and Argentina
4.2 Typ ica l Dai ry Farms ( IFCN)
The six typical dairy farm models are presented in the fo l lowing way:
First ly, two typical farms, one for each country, are described and contrasted with the
average dairy farm in those countries. Secondly, t he main characterist ics of the two
farms are compared. Final ly, details of four other farms are presented in order to
describe the d ifferent dairy farm systems within each country.
4. 2. 1 NZ-239-cows and AR-350-cows farm models
The fo llowing two farm models tor New Zealand and for Argentina were selected by
the I FC to represent the farms that contribute the biggest proport ion of mi lk for each
countr/ 4, with management levels that are average or above average 1 5 • However they
are not average farms in any aspect (s ize, management level, or any other). The data is
rrom the 2000-200 I season for the New Zealand farm and fi·om the year 200 I for the
Argent ine ( I FC , 2002 ) .
The New Zea lan d model fa rm with 239 cows ( Z-239) is based on data from an
annual survey (Profit Watch ) carried out annual ly by Dexcel (a research and
development company owned by New Zealand da iry farmers). The average data rrom
the South Auckland region was chosen to define the most typical New Zealand farm
(N ico la Shadbo lt , I FC coord inator for New Zea land, personal communicat ion) . I n the
South Auckland region are 32% of all ew Zealand dairy farms ( LI C, 2002/03 ) and
they produce 29% o f the total New Zealand mi lk (calculat ions based on L I C, 2002/03 ).
i t is a lso considered that the typical South Auckland farms are simi lar to those of the
Taranaki region, where there are a further 1 6% ( L IC, 2002/03 ) of New Zealand 's herds
and 1 2% of its milk production (calcu lat ions based on L I C, 2002/03) . Consequently the
model defmed represents a typical farm for two major regions that together contribute
4 1 % of ew Zealand mi lk, and contain 48% of New Zealand dairy farms. This farm
1 4 ' Fanns that contribute the biggest proportion of mi lk ' means that each of these two farms are representative of the category of dairy farms that produce more milk in each country. In order to do this, a l l farms in the country were categorized by number of cows by the I FCN experts (Ostrowski & Deblitz, 200 I ) . The category that contributes with the biggest proportion of milk in Argentina is the category of farms with 250 to 350 cows. For New Zealand, farms located in the Taranaki and Waikato regions form this category. 1 5 TI1e IFCN experts in each of the countries assessed the management levels.
55

Chapter 4: Dairy Farm Systems: New Zealand and Argentina
model is d i fferent from the statistical average because the average for N ew Zealand has
25 1 cows, and an effective area of96 hect ares (LIC, 2000/0 1 ) (see Table 4).
Table 4: Differences in Size Between I FCN Models and Statistical
Average for NZ (2000/01 )
The Argentine model farm with 350 cows (AR-350) is based o n the average data of a
group of farms in the Cordoba province. This farm model, and another of250 cows
located in the Santa Fe province were considered typical of the farms t hat together
contribute the b iggest proportion of the Argentine total milk production 1 6 (Bemardo
Ostrowski, I FCN coordinator tor Argentina, personal communicat ion). The Santa Fe
and Cordoba provinces produce 69% of the Argentine milk (Gutman et al. , 2003) . It is
important to mention that th is model does not represent the Argentine statist ical
average. The model that the panel of experts of the I FCN defined as being most similar
to the statist ical average for Argentina is a farm of 1 50 cows on 250 hectares (Bemardo
Ostrowsky, personal communication). These characteristics of the average Argentine
farm are s imilar to the results of a survey done by Gambuzzi et al. (2003) of 530 farms
in the most important dairy farming regions of Argentina, where they found an average
herd of 1 74 cows on a farm o f 27 1 hectares. Consequently, this 350 cows, 450 hectare
Argentine model has approximately twice the number of cows and 1 .7 t imes the number
of hectares compared to the stat istically average farm (see Table 5) .
Table 5 : Differences i n Size Between IFCN Models and Statistical
Average for Argentina
AR-350 Average Farm IFCN Average Farm Gambuzzi et al.
Number of Co 350 Hectares 450 250 27 1
The following t able presents the main descript ive data of these two typ ical farm models:
16 The 250 cows was not analysed in the present study, because that model appeared in I FCN (2002) and then was discontinued.
56

Chapter 4: Dairy Farm Systems: New Zealand and Argentina
Table 6: Typical Farm Models for New Zealand and Argentina
( IFCN, 2002)
Farm
Cows at the beginning ( I ) Live weight (2)
Fat a nd protein content o f m i lk
M i lk yield per COW ( 3 )
Land Use Dairy Enterprise
Land use
Share of grassland Share of maize s i lage
Share of gra in and other
M i lk produced per ha
Stocking ra te (4)
Labour Dedicated to da iry ( 5 )
Share of fami ly labour
Herd M anagement Seasona l i ty
Calving season
Age of first ca lv ing
Interca lving period
Dry COWS (6 )
Feed ing Feeding system
Feed source winter (7 )
Feed source summer
Grazing Season
Concentrates use ( 8 )
Notes for Ta ble 6:
no. kg
% kg ECM
Ha
%
%
%
t ECM I ha L U I ha
NZ-23 9
239 437 4.85% I 3 .63%
4, 1 74
1 04
1 00%
0%
0% 9 .6
2 .7
Labour units I . 9 % of total labour 67%
yes I no
M onths
Months
Days
%
Descript ion
Description
Descript ion
duration in days
t OM tota l
yes
J u ly - Aug
24
365
1 7%
feed wagon
grazing off farm
grazmg
365
1 9
1 ) Average num ber of dairy cows (dry a nd lactating ) per season 2) Average l ive wei ghts of cul l cows.
AR-350
350 500
3 . 5% I 3.2%
5,284
450
85%
1 5%
0% 4. 1
1 . 2
6
8%
no
M arch - Dec
28
395
25%
concentrate i n parlour
grazing + s i lage
grazmg
365
753
3) E nergy Converted Milk ( ECM) with 4% mil k-fat a nd 3 . 3% mil k-protei n1 7 . 4) Livestock Un it ( LU ) , 1 LU is equal to 1 adult cow. The Stocking Rate i ncl udes the you ng
stock and the calves raised on the farm. 5) O ne labour u nit was assumed to work approx imatel y 2 ,440 hours i n New Zealand and
between 2, 555 and 2 , 700 hours i n Argentina . 6) Proportion of average dry cows for the season. 7) In New Zealand it is common to send the young stock and some d ry cows to graze off
the farm. I n Argenti n a it is normal to have a n nual wi n ter pastures ( oats and rye grass) because the pere n n i al pastures hav e very low growth rates during the winter ( I F C N , 2002).
8) Concentrate is any grai n , soybea ns meal , com po u nd feed and al l other com parable feedstuffs with hig h energy or protein content and dry matter > 85% ( i n ton nes).
1 7 Formula used for adjustment : ECM = (mi l k production in l i tres * ((0.383 * % fat + 0.242 * % protein + 0.7832)13 . 1 1 3 8)
57

Chapter 4: Dairy Farm Systems: New Zealand and Argentina
4. 2. 2 Contrast of NZ-239 and AR-350
The data tor the fo llowing analysis was presented in Table 3 . These two farm models
(NZ-23 9 and AR-350) were defined as t ypical of the farms that contribute the biggest
proportion of the total mi lk for each country.
Farm size: I n compar ison to the N ew Zealand dairy farm model, the Argentine dairy
far m model is bigger in hectares (3 t imes more), in cow numbers ( 1 .46 t imes more) and
in total mi lk production ( 1 . 8 5 t imes more).
Cows' size and milk yield : The cows o f the Argentine farm are heavier ( 1 . 1 3 t imes
more) and produce more ( 1 .2 1 t imes more) per cow than those of the New Zealand
farm. Expressed as mi lk produced per k i lob:rram o f l ive weight, the value tor the
Argent ine farm is s light ly higher ( 1 . 09 more).
Calculations for NZ-239: 4 1 74 k ilograms ECM / 437 k ilograms LW 9.55 k i lograms
ECM/kilograms LW.
Calculations for AR-350: 5284 k i lob:rrams ECM I 500 k ilograms LW I 0.57 k i lograms
ECM/ki lograms LW
Land use: Al l the land used by the da iry enterprise in the New Zealand fimn is ut i l ised
as grazing area, consequent ly all the concentrates (very l it t le used) are brought in. In
contrast, 1 5% of the land used in the Argentine tarm is ut i l ised for maize s ilage, b:rrain or
other crops.
Stocking rate: The New Zealand typ ical farm supports 2 . 7 l ivestock units (LU) per
hectare. In contrast, the Argentine typ ical dairy farm supports s l ightly more than 1 LU.
The d i tJerences between the cows must also be addressed; therefore if the stocking rate
is calculated as k i lob:rram o f l ive weight per hectare, the New Zealand farm supports
1 . 97 t imes more l ivestock than the Argentine.
Calculationsfor NZ-239: 2 .7 LU/ha x 437 k ilograms LW/LU = 1 1 80 k ilograms LW/ha.
Calculationsfbr AR-350: 1 .2 LU/ha x 500 k i lob:rrams LW/LU 600 k ilograms LW/ha.
Herd management: The main d ifference between the management of the two herds is
related to reproduction. The New Zea land average farm has a clear ly defined calving
5 8
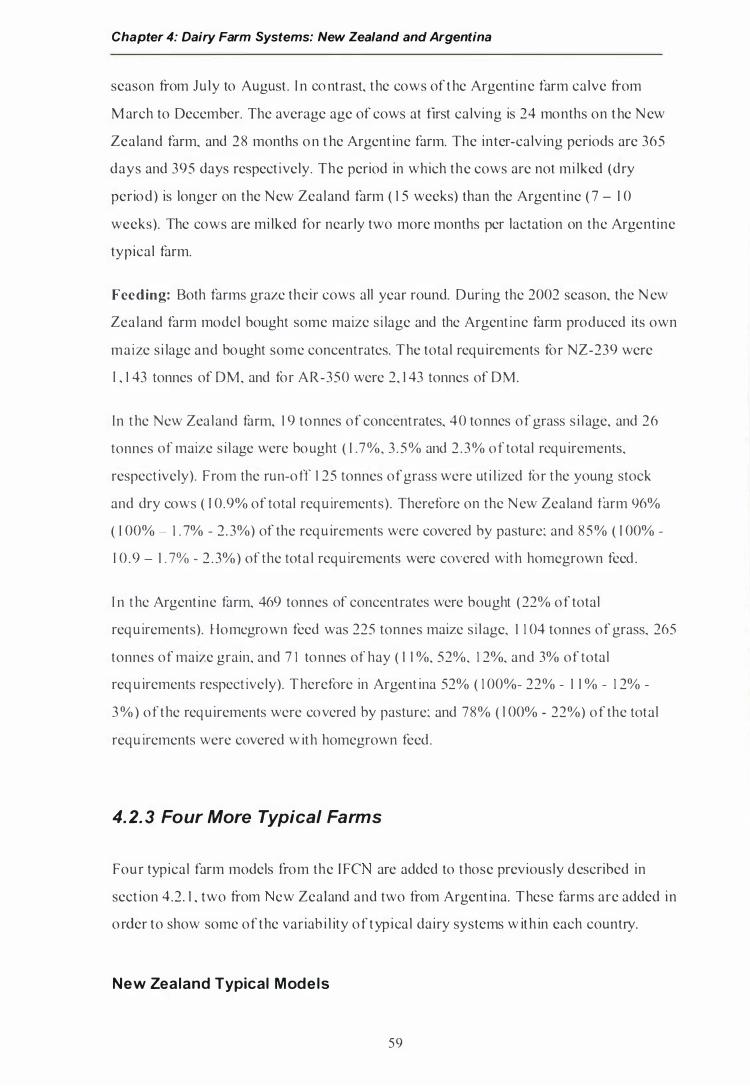
Chapter 4: Dairy Farm Systems: New Zealand and Argentina
season from July to August . I n co ntrast, the cows of t he Argentine farm calve from
M arch to December. The average age of cows at first calving is 24 months on t he New
Zealand farm, and 28 months on t he Argent ine farm. The inter-calving periods are 365
days and 395 days respect ively. The period in which the cows are not mi lked (dry
period) is longer on the New Zealand farm ( 1 5 weeks) than the Argent ine ( 7 - I 0
weeks). The cows are mi lked for nearly two more months per lactation on the Argentine
typical farm.
Feeding: Both farms graze their cows all year round. During the 2002 season, the N ew
Zealand farm model bought some maize s i lage and the Argent ine farm produced its own
maize si lage and bought some concentrates. The total requirements for NZ-239 were
I , 1 43 tonnes of DM, and for AR-350 were 2, 1 43 tonnes of DM.
In the New Zealand farm, 1 9 tonnes of concentrates, 40 tonnes of grass s i lage, and 26
tonnes of maize s i lage were bought ( I . 7%, 3 . 5% and 2 . 3% of total requirements,
respect ively). From the run-otT 1 25 tonnes of grass were ut i l ized for the young stock
and dry cows ( I 0.9% of total requ irements) . Therefore on the New Zealand tarm 96%
( I 00% - I . 7% - 2 . 3%) of the requ irements were covered by pasture; and 85% ( I 00%
I 0 .9 - 1 . 7% - 2 . 3%) of the tota l requ irements were covered with homegrown feed .
I n the Argent ine farm, 469 tonnes of concentrates were bought (22% of total
requ irements). Homcgrown feed was 225 tonnes maize s i lage, 1 1 04 tonnes of grass, 265
tonnes of maize grain, and 7 1 tonnes of hay ( 1 1 %, 52%, 1 2%, and 3% of total
req u irements respect ively). Therefore in Argent ina 52% ( I 00%- 22% - 1 1 % - 1 2% -
3 % ) ofthe requirements were covered by pasture; and 78% ( l OO% - 22%) of the total
requ irements were covered w ith homegrown feed.
4. 2. 3 Four More Typical Farms
Four typical farm models from the I FC are added to those previously described in
sect ion 4.2 . 1 , two from ew Zealand and two from Argent ina. These farms are added in
order to show some of the variab i l ity of typical dairy systems w ith in each country.
New Zealand Typical Models
59
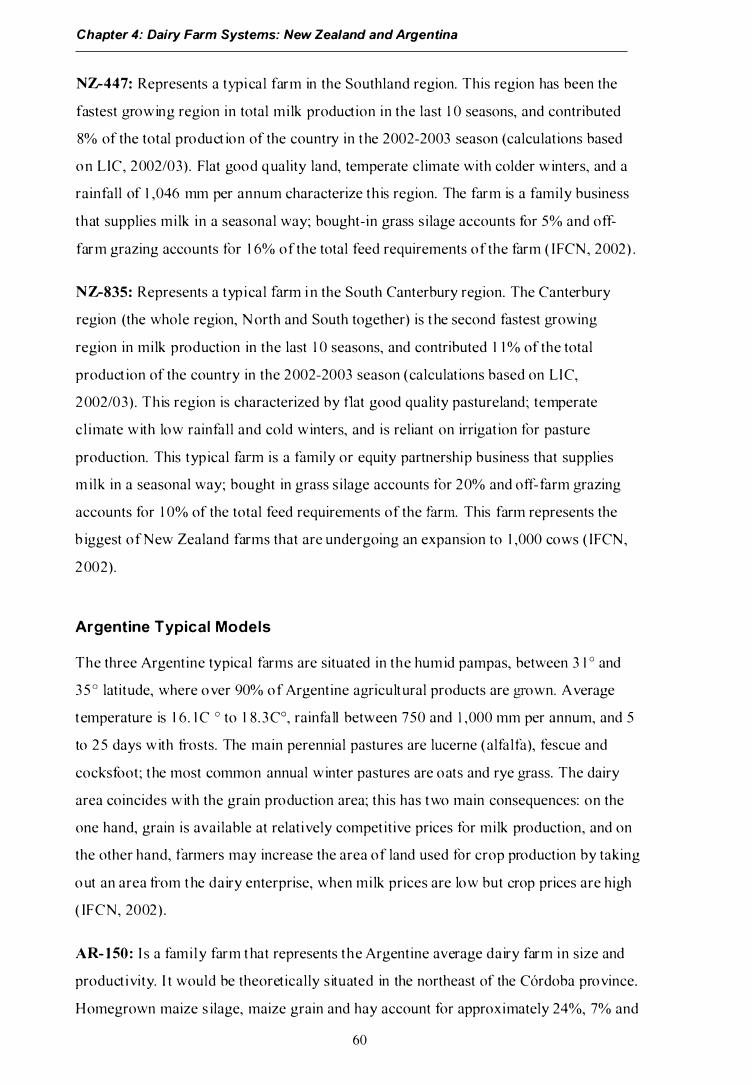
Chapter 4: Dairy Farm Systems: New Zealand and Argentina
NZ-447: Represents a typical farm in the Southland region. This region has been the
fastest !,YfOwing region in total mi lk product ion in the last I 0 seasons, and contributed
8% of the total product ion of the country in the 2002-2003 season (calculat ions based
on LIC, 2002/03) . Flat good q uality land, temperate climate with colder w inters, and a
rainfall of 1 ,046 mm per annum characterize th is region. The farm is a family business
that supplies mi lk in a seasonal way; bought-in grass s ilage accounts for 5% and off
farm grazing accounts for 1 6% of the total feed requirements of the farm ( I FCN, 2002) .
NZ-835: Represents a typ ical f"imn i n the South Canterbury region. The Canterbury
region (the whole region, N orth and South together) is t he second fastest growing
region in milk production in the last I 0 seasons, and contributed 1 1 % of the total
product ion of the country in the 2002-2003 season (calculat ions based on LI C,
2 002/03) . This region is characterized by f1at good quality pastureland; temperate
c l imate with low rainfall and cold winters, and is reliant on irrigat ion tor pasture
production. This typ ical fa.nn is a family or equity partnership business that supplies
m ilk in a seasonal way; bought in grass s ilage accounts for 20% and off-farm !,Yfazing
accounts for I 0% of the total feed requirements of the fann. This farm represents the
b iggest ofNew Zealand farms that arc undergoing an expansion to 1 ,000 cows ( IFCN,
2 002) .
Argentine Typical Models
The three Argent ine typical farms are situated in the humid pampas, between 3 1 o and
3 5 ° latitude, where o ver 90% of Argent ine a!,rricult ural products are !,!Town. Average
temperature is 1 6 . 1 C 0 to 1 8 . 3 C0, rainfall between 750 and I ,000 mm per annum, and 5
to 2 5 days with frosts. The main perennial pastures are lucerne (alfalfa), fescue and
cocksfoot; the most common annual w inter pastures are oats and rye !,rrass. The dairy
area coincides w ith the grain production area; this has two main consequences: on the
one hand, grain is avai lable at relat i vely compet it ive prices for milk production, and on
the other hand, farmers may increase the area of land used f()r crop production by taking
o ut an area from t he dairy enterprise, when milk prices are low but crop prices are high
( IFCN, 2002) .
AR- 1 50 : I s a fami ly farm t hat represents the Argent ine average dairy farm in size and
product i vity. I t would be theoret ically s ituated in the northeast of the Cordoba province.
Homegrown maize s ilage, maize grain and hay account for approximately 24%, 7% and
60

Chapter 4: Dairy Farm Systems: New Zealand and Argentina
8% of the total feed requirements of the farm respect ively. Bought- in concentrates
account for 2% of total feed requ irements of the farm. The balance ( 5 9% of total feed
requ irements of the farm) is from grazi ng lucerne (42% of total) and annual w inter
pasture ( 1 7% of total) ( l FCN, 2002) .
A R- 1 400: This model is based on data of a group of farmers from the west of Buenos
Aires pro vince. It is situated within the top I 0% farms in size and w ithin the top 25% in
management level. The Buenos A ires province contributes 27% of the Argentine total
milk product ion, and the largest farms are situated to the west of this province
(Gambuzzi et al . , 2003 ). Homegrown feed accounts for 96% of the feed requ irements of
the farm: Maize grain accounts for 8%, maize si lage 1 7%, grazing perennial pasture
(mix o f fescue, cocksfoot, white c lover and lucerne) accounts for 49%, and winter and
summer crops 1 2%, soybean for grazing accounts for 9.9%, and hay 0. 1 % of total feed
requirements of the farm. Bought-in concentrates account for 4% o f total feed
requ irements of the farm ( I FCN, 2002 ) .
6 1

Chapter 4: Dairy Farm Systems: New Zealand and Argentina
4.3 The I FCN Method for Dai ry Farms
+ Total Returns (1 ) = + Mi lk returns + Non-milk returns =
+ Sales of c ul l cows + Sales of surplus heifers + Sales of calves + Interest on savings
- Total E xpenses ( 1 ) = + Cash expenses
+ Paid wages (gross salary + insurance, taxes, etc) + Paid land rent + Paid interest on liabilities
= N et Cash Farm Income
+ Non cash adjustments
= Farm I ncome
- Opportunity costs
Depreciation (2) +I- Change in livestock inventory (3) +1- Capital gains I losses (4) +1- VAT balance (5 )
+ Calculated interest on owned capital (6)
+ Calculated rent on owned land (7) + Calculated cost for unpaid family labour (8)
= Entrepreneur's Profit
N otes for the I FCN Method:
1 ) Al l cost components and returns are stated without value added tax (VAT), called GST in N ew Zealand.
2) M achinery and bui ldings were depreciated using a straight-line schedule on purchase prices with a residual value of zero.
3 ) Change i n livestoc k inventory, i s the difference i n numbers between the beginning and the end of the seasons; it assumes that the value of l ivestock does not change during the season.
4) Capital gains I losses include the change in numbers and value of bui ldings and machinery. It d oes not inc lude c hanges in land values; it assumes that the value of land does not change during the season.
5 ) Value Added Tax (VAT) balance. 6) C apital i s defined a s owned assets, without land and quota (calculation: assets tor
buildings, machinery, l ivestock and other), plus circulating capital ( 1 0% of all dairy related variable expenses), a real interest rate of 3% was used in all countries.
7) Regional rent prices provided by the farmers were used for owned land. In those countries with l imited rental markets (like NZ), the land market value was capitalised at 4 .5% annual interest to obtain a theoretical rent price.
8 ) For unpaid family labour, the average wage rate per hour for a qualified ful l-t ime worker in the respective region is used.
62

Chapter 4: Dairy Farm Systems: New Zealand and Argentina
Another categorizat ion o f costs is used by the I FCN. This way of analysing the Total
Costs is by "costs component", as described below :
Total Costs = + Costs as Means of Production =
+ Animal purchases + Feed (purchase feed, fert i l i ser, seed, pest icides )
+ Machinery (ma intenance, depreciation, contractor)
+ Fuel, energy, l ubricants, water
+ Bui ldings ( ma i ntenance, deprec iation) + Vet & medic ine, i nseminat ion
+ Insurance a nd taxes
+ Other i nputs
+ Capiwl Costs =
+ Land Costs =
+ Paid interest on l iab i l i t ies + Calcu lated in terest on capital
+ Paid land rent + Calcu lated rent on owned land
+ Lahour Costs =
+ Paid wages ( gross sa lary + social fees)
+ Ca lcu lated cost for unpaid family labour
63

Chapter 4: Dairy Farm Systems: New Zealand and Argentina
4.4 Performance of Typical Farms
Before starting the analysis it is important to mention that the farm models have
d ifferent management levels. The t hree New Zealand farms have management levels
t hat can be considered average for the country. However only the smallest Argentine
model (AR- 1 50) has average management levels, AR-350 and AR- 1 400 arc probably
within the top 25% in management levels. The panel of experts of the I FCN for each
country assessed the management levels. The differences in the management levels in
the Argentine (w ith the AR- 1 50 having lower returns than the A R-350 and the AR-
1 400) and the s imilarit i es in the N ew Zealand farms can be seen in indicators such as
the Return on I nvestment and the Operating Profit M argin (see F igures 1 4 and 1 5, and
F igures 1 6 and 1 7 further in the present chapter) .
4.4. 1 Milk Prices, Profits and Returns on Investment
The season that ended in 2002 is d i tl!cult to analyse tor Argent ina because on January
8t11, 2002 there was a big devaluation of the Argentine currency that generated
uncerta inty about costs and prices. Previous to the devaluation the exchange rate was 1
A R-$ tor each U S-$, whereas the first six months after the devaluation it was 2 .6 AR-$
for each US-$ and 3 .6 AR-$ for each US-$, for the last 6 months . The average tor the
whole year was 3 . 1 AR-$ tor each US-$ (FXHistory: Historical currency exchange
rates, 2005) . Most o f the costs started to increase due to inf1at ion which was 1 1 8% for
that year (calculat ions based on Wholesale P rice I ndex INDEC, 2005).
The 2003 season was more stable in Argent ina, t he exchange rate stayed constant at
nearly 3 AR-$ f()r each U S-$ (FXl/istory: Historical currency exchange rates, 2005)
and inf1at ion was nearly 2% (calculations based on Wholesale Price Index I N D EC,
2005) .
64
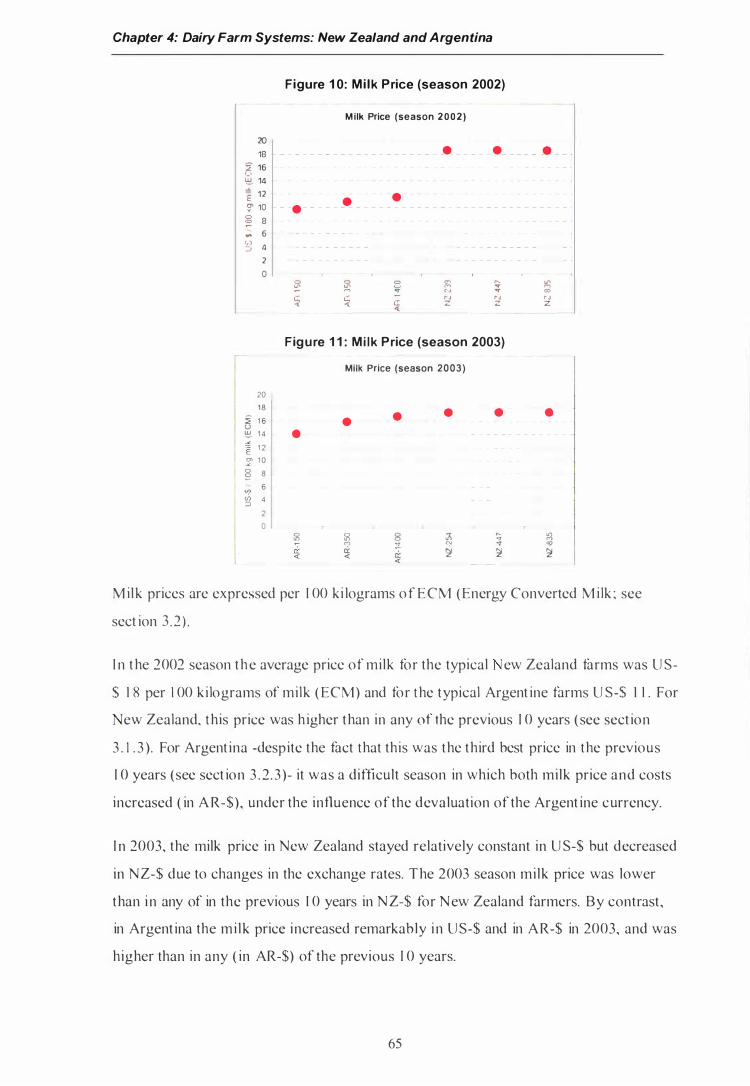
Chapter 4: Dairy Farm Systems: New Zealand and Argentina
Figure 1 0: Mi lk Price (season 2002) ----
M ilk Price (season 2 0 0 2 )
20 18 • - • - .
� 16 (_) � 14 � 12 � • ;r 10 • g 8 ;;; 6 01 4 �
2 0
0 0 � "' .... >!; � � (""> .... " .... "' c; � "J � ' J <t. er z z ....
Figure 1 1 : M i lk Price (season 2003)
Milk Price (season 2003)
20 18 • • • � 1 6 • •
'-' � 1 4 • .><
E 1 2 � 1 0 0 8 ;! - 6 "t ffJ 4 :::J
2 0
5I 5I 8 Ji "- :q "' er <-;> " � "f "? Cl: er 5e! 5e! 5e! <{ <{ <{
M ilk prices are expressed per I 00 ki lograms o f ECM ( Energy Converted M i lk ; see
sect ion 3 . 2 ) .
I n t he 2002 season the average price of milk for the typical ew Zealand farms was U S
$ 1 8 per I 00 ki lograms of milk ( ECM) and for the typical Argent ine farms U S-$ 1 1 . For
ew Zealand, this price was h igher than in any of the previous I 0 years ( see sect ion
3 . 1 . 3 ). For Argent ina -despite the fact that this was the third best price in the previous
I 0 years (see sect ion 3 . 2 . 3 )- it was a difficult season in which both milk price and costs
increased ( in A R-$), under the influence of the devaluation of the Argent ine currency.
I n 2003, the milk price in New Zealand stayed relatively constant in U S-$ but decreased
in NZ-$ due to changes in the exchange rates. The 2003 season milk price was lower
than in any of in the previous I 0 years in N Z-$ for New Zealand farmers. By contrast ,
in Argent ina the mi lk price increased remarkably in U S-$ and in AR-$ in 2003, and was
higher than in any ( in AR-$) of the previous I 0 years.
65

Chapter 4: Dairy Farm Systems: New Zealand and Argentina
I n conc lusion, it can be said that 2002 was a wonderful season for New Zealand farmers
and not very beneficial for Argentine farmers and the season 2003 was the opposite.
This is more clearly seen in the fo llowing figures in which the profits and the return on
investment are analysed.
Figure 1 2: Returns and Profits (season 2002)
Returns and Profits (season 2002)
25
� 20 0 0 0 !:!. i!f 1 5 0 E 0 0 � 10 6 0 ' 6 ' � 5 6 ...... 6 • • .. • ciJ 0 -:::l •
·5 0 0 0 "' ..... "' "' "' � M V M
� M "' ... CO
a: N "J ,.:, < � z z z
o Returns from dairy enterprise b. Fann income • Entrepreneu(s profit
Figure 1 3: Returns and Profits (season 2003)
Profits and R eturns ( 2003)
25
� 20 0 u 0 w 0 0 0 0
; 1 5 E :1' 1 0 6 6 0 6 � 5 !:,. • • !:,. !:,. "' eh 0 • e-----. ----:::>
-5 � � 8 '1, ..... � o;f
:i: ;:1 o;f � 'f "'' :i: � � � ...: ...: ...:
o Returns from dairy enterprise I:J. Farm income • Entrepreneur's profit
The Entrepreneur's Profit (calculated as Total Returns - Total expenses + Non Cash
Adjustments - Opportunity Costs, see sect ion 3 . 2 ) measures the economic sustainabi l ity
of the business in the long run ( I FCN, 2002) . For the 2002 season, the New Zealand
models showed a higher economic sustainab i l ity than two of the Argent ine models. For
2003 the Argent ine models had higher Entrepreneur's Profit.
Note that in the 2003 season, despite the fact that New Zealand and Argent ine models
had s imi lar returns, the Farm I ncome and Entrepreneur's Profit were higher for
Argent ine models. This could be due to h igher costs as means of production, by higher
paid interest on l iab i l it ies because o f the higher debt load ofNew Zealand farms, and
other causes that are analysed further in this sect ion.
66
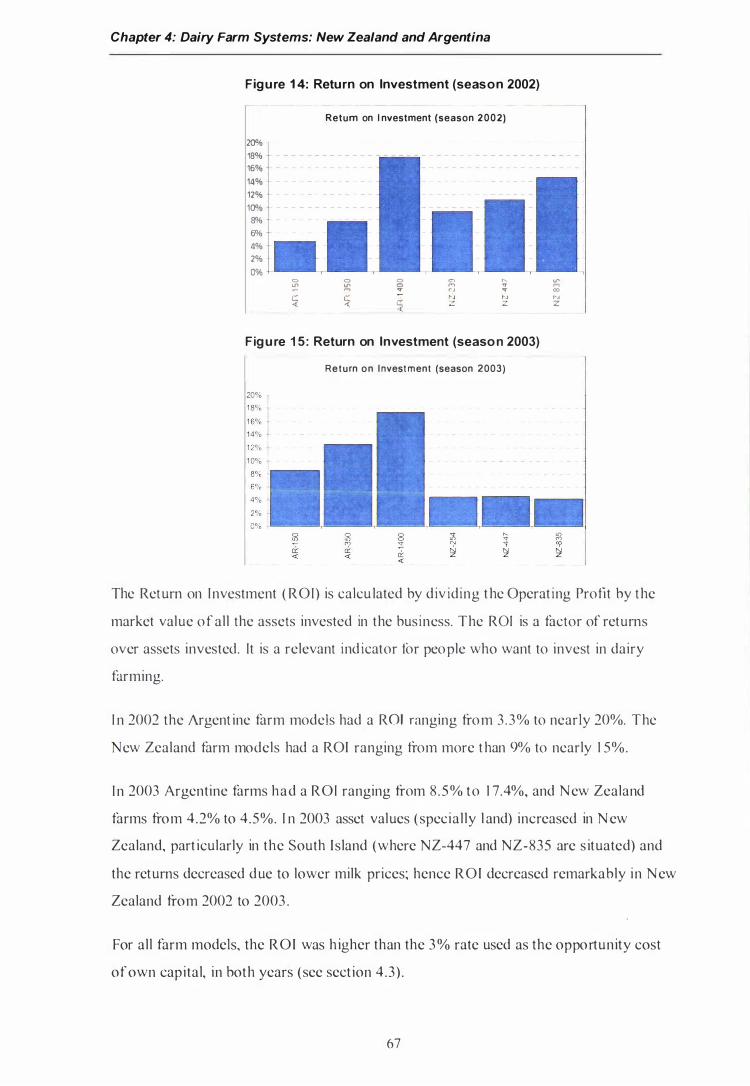
Chapter 4: Dairy Farm Systems: New Zealand and Argentina
Figure 1 4: Return on Investment (season 2002)
200!6 18% 16% 14% 12% 10"!6 8% 6% 4% 2% 0"!6
��- �-- --
Return on I nvestment (season 2 0 0 2)
0 0 0 C> "-
� � � � ::: c: c: "J N ..; <( c: <(
Fig u re 1 5 : Return on Investment (season 2003)
Return on I nvest ment (season 2003)
"' M "' "' z
The Return on Investment ( ROI) is calcu lated by d iv iding t he Operat ing Profit by the
market value of all the assets invested in the business. The ROI is a factor of returns
over assets invested. It is a relevant ind icator tor people who want to invest in dairy
farming.
I n 2002 the Argent ine farm models had a ROI ranging from 3 . 3% to nearly 20%. The
ew Zealand farm models had a ROI ranging from more t han 9% to nearly 1 5%.
I n 2003 Argentine farms had a ROI ranging from 8 .5% to 1 7.4%, and New Zealand
farms from 4.2% to 4.5%. I n 2003 asset values ( special ly l and) increased in N ew
Zealand, part icularly in the South I sland (where NZ-44 7 and NZ-835 are s ituated) and
the returns decreased due to lower milk prices; hence ROI decreased remarkably in New
Zealand from 2002 to 2003 .
For all farm models, the ROI was h igher than the 3 % rate used as the opportunity cost
of own capital, in both years (see sect ion 4 .3) .
67

Chapter 4: Dairy Farm Systems: New Zealand and Argentina
I t is i mportant to bear in mind the d ifferences in the management levels of farm models.
Only A R- 1 50 has average management levels for Argentina, therefore in order to
compare the return on investment of the farm models of the two countries this farm
should strict ly be compared with the N ew Zealand farms, al l of which have average
management levels. The AR-350 and AR- 1 400 have h igher than average management
levels.
4. 4. 2 Operating Profit Margin and Management Levels
T he Operat ing Profit M argin i s the ratio between the Operat ing Profit and the Total
Returns of the business. The Operating Profit M argin is an indicator of the operating
efficiency of the dairy farms; it indicates how well the farms have turned income into
profit. The Operating Profit, also called Economic Farm Surplus ( EFS) in N ew Zealand,
is calculated in the following way:
Operating Profit =
+ Farm Income (see 2 .3 .4 .3) + Paid land rent + Paid interest on liabil ities - Calculated cost for unpaid family labour (opportunity cost)
The Operating Profit makes it possible to compare farms that operate on leased land
w ith farms that operate on owned land. It also makes it possible to compare farms that
are financed in d ifferent ways, and farms that have different proport ions of unpaid
fam i ly labour. It can also be used as an indicator of what financial commitments (how
much interest and principal payments) a farm can carry ( I FCN, 2002).
Figure 1 6: Operating Profit Margin (season 2002)
60% �
SO"A>
LXl%
30%
20%
10%
0%
Operating Profit Margin (season 2002)
- - - - - -
- - - - - -
- - - - - - -
C> C> t.n t.n
� M
�
-
C> C> ...
;i <(
68
,._
� N z
t.n M '? N z
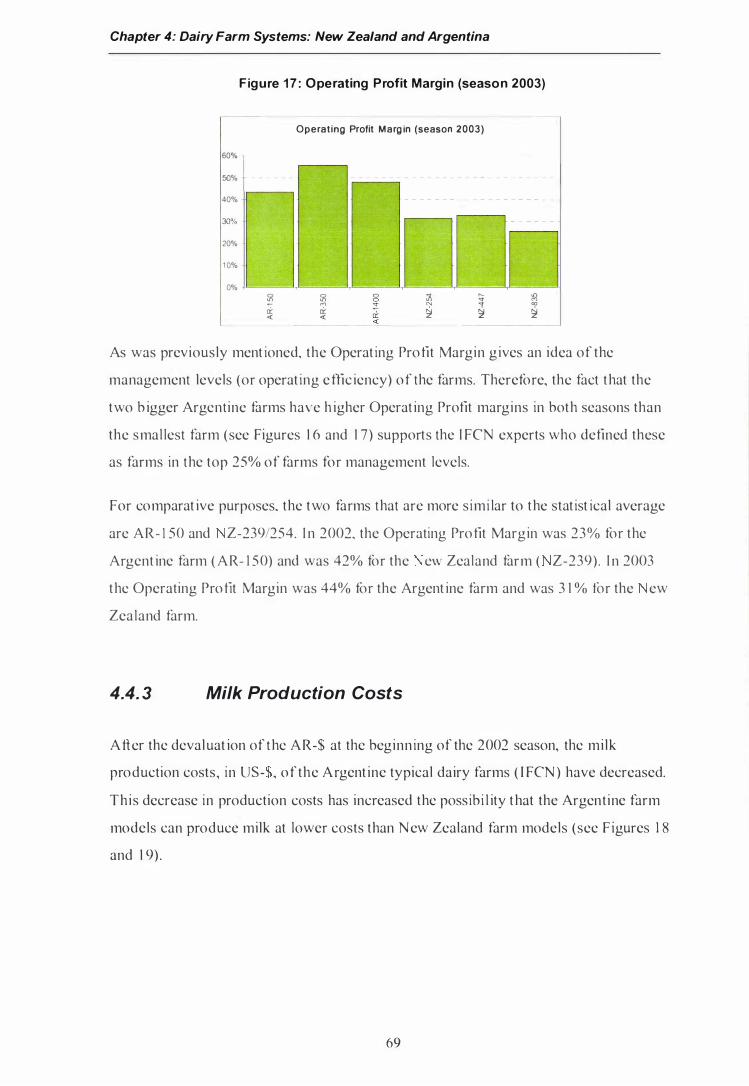
Chapter 4: Dairy Farm Systems: New Zealand and Argentina
Figure 1 7 : Operating Profit Margin (season 2003)
---
Operating Profit Marg in (season 2003)
60%
50% �
40% �
30%
20%
1 0%
0% � � Ul; ,.._
"'
;i <") N 'f er si! � <( <(
� �
� � �
-
:'l <0
si!
As was previously ment ioned, the Operat ing Profit Margin g ives an idea of the
management levels (or operat ing effic iency) of the farms. Therefore, the fact that the
two b igger Argentine farms have h igher Operat ing Profit margins in both seasons than
the smal lest farm (see Figures 1 6 and 1 7) supports the I FCN experts who defined these
as farms in the top 25% of farms for management levels.
For comparat ive purposes, the two farms that are more s imi lar to the stat ist ical average
are AR� 1 50 and Z�239/254. I n 2002, the Operating Profit Margin was 23% for the
Argent ine farm ( AR� 1 50) and was 42% for the cw Zealand farm ( Z-239) . I n 2003
the Operating Profit Margin was 44% for the Argent ine farm and was 3 1 % tor the ew
Zealand farm.
4.4. 3 Milk Production Costs
After the devaluat ion of the AR-$ at the beginn ing of the 2002 season, the milk
production costs, in US- , of the Argent ine typical dairy farms ( I FCN ) have decreased.
This decrease in production costs has increased the possibi l ity that the Argentine farm
models can produce milk at lower costs than New Zealand farm models (see Figures 1 8
and 1 9) .
69

Chapter 4: Dairy Farm Systems: New Zealand and Argentina
Figure 1 8: Total Costs and Returns (season 2002)
45 40
3 35 � 30 t 25 F 8 20 ::::. 1 5 � 10
5 0
Total C osts and R eturns (season 2002)
0 o Depreciation
• Cash costs
<> lei.Ell 2: Lei.Ell 1 + cull cow, caii.Els, heifer + other retums
e lei.Ell 1 : Milk price - - - - - - - - - - �------------------------� 1
"' r3 ,.:., z
� ... T N z
on M '!' N z
Figure 1 9 : Total Costs and Returns (season 2003)
Total Costs and R eturns (season 2 003)
30
� 25 () w ;; 20 E 1�-V-� � 1 5 8 11:::::::=:::=::1 :::: 10 "' 3 5
0
o Opportunity costs o Depreciation • Cash costs o Le�.el 2: Le�.el 1 + cull cow, cal\€5, heifer + other returns • lei.Ell 1 : Milk price
I n 2002, Total Costs per I 00 k ilograms is lower for the three Argent ine farms ( US-$ 1 4)
than for the three N ew Zealand farms (US-$ 1 9) . In 2003 the average Total Costs were
US-$ 1 9 and U S-$ 24 respect ively. The analysis of the costs fo l lows in the next sect ion.
4.4.4 Costs of Milk Production Only, and Non-milk Returns
The Costs of M ilk Product ion Only is a usefu l indicator to compare the Total Costs that
a dairy farm incurs to produce 1 00 ki lograms of mi lk, w ith the price received for this
m i lk . I n order to calculate th is indicator, the Non-milk Returns (returns from sales of
cu l l cows, surplus heifers, calves, and other returns) are deducted from the Total Costs .
This indicator al lows the compar ison of the costs of mi lk product ion of two farms in
which the Non-milk Returns are d ifferent . For example, if two farms have the same
Total Costs per 1 00 k ilograms of milk, the farm with h igher Non-mi lk Returns is able to
70

Chapter 4: Dairy Farm Systems: New Zealand and Argentina
produce milk at lower Costs of Mi lk Product ion Only. Essentially the Non-milk returns
are treated as a sub-product of mi lk product ion.
Figure 20: Costs of Mi lk Production Only (season 2002)
C osts of M ilk Production Only (season 2002)
20 • • •
� u 1 5 \!!. ,. E _Q' 10 � 0
;;. 5 &1 :::>
0 0 0 0 "' "" � � � � ..., .... " ..,. CO
s: c: � � " ,, <. z z
• Costs from P&L account - non-m1lk returns 0 OppMuOI!y cost . M1lk pnce
Figure 21 : Costs of Mi lk Production Only (season 2003)
Costs of Milk Prod uct ion Only (season 2003)
20 � 1 8 u 1 6 \!!. 1 4 ;,!; 1 2 E 0> 1 0 �
8 8 6 "' 4 eh ::J 2 0
0 0 0 " � "' "' � 0 "' &l :i: " N er er ..:., N ..:.,
<( <( z z z <( • Costs h"om P&L account - non-mllk returns 0 Opportunlty cost (e)CI quota) • Mlkpnce
Figures 20 and 2 1 (Costs o f Mi lk Product ion Only) show similar trends as those shown
in Figures 1 8 and 1 9 (Total Costs), comparing the Argent ine and the ew Zealand farm
models. The Costs of M i lk Product ion Only is lower for the three Argent ine farms than
for the three New Zealand farms for both seasons. I n 2002 the average Costs of M ilk
Production Only o f the Argent ine model farms was U S-$ 1 1 and the average Costs of
Mi lk Production Only o f t he New Zealand model farms was US-$ 1 5 . I n 2003 the
average Costs of M ilk Product ion Only were US-$ 1 2 and US-$ 1 7, respect ively.
I t is impo rtant to ment ion that before the devaluat ion of the Argentine currency { AR-$)
in January 200 1 , New Zealand farms had lower Costs of M i lk Product ion Only than the
typical Argent ine farms ( I FCN, 2002) . The actual exchange rate of t he Argent ine
currency has been float ing around AR-$ 3 for each US-$ since March 2003 with low
7 1

Chapter 4: Dairy Farm Systems: New Zealand and Argentina
intervention of the Argentine Central Bank, and is expected to continue in similar levels
in 2005 (BCRA, 2005) .
Figure 22: Non-mil k Returns (season 2002)
2.5 � 2o tf====r
0.0 0 "'
N on-milk Returns (season 2002)
"' "" N N z
"... ... N z
"' "" a> N z
li Cull CCJN receipts o Surplus heifers o Sale of cal"'s o Other retums
Figure 23: Non-mi lk Returns (season 2003)
Non-milk Returns (season 2003)
4.00
:i" 3.50 u 3.00 !!:'. "" 2.50 E � 2.00 0
1 .50 � '-:> 1 .00 Vl ::J 0.50
0.00
• Q.Jll cow receipts o Surplus heifers o Sale of cal\eS o Other returns
The Non-milk Returns per I 00 kilograms of milk are the returns from sales of cull
cows, the surplus heifers, and the calves.
In 2 002, the total N on-milk Returns were similar for farms in both countries (US-$ 1 .5
per 1 00 k i lograms o f milk on average for the three Argentine farms and US-$ I . 7 for
N ew Zealand farms) . Non-milk Returns were 1 4% of the Total Returns for the
Argent ine farms and 7% for the New Zealand farms (see Table 7).
I n 2003 the Non-milk Returns were h igher for the Argentine typical farms than for New
Zealand farms (average of the three farms U S-$ 2 .9 for Argentina and US-$ 1 .6 for New
Zealand) . N on-milk Returns were 1 6% ofthe Total Returns for the Argentine farms and
8% for the New Zealand farms (see Table 7) .
72

Chapter 4: Dairy Farm Systems: New Zealand and Argentina
As shown in Figures 22 and 23, the proport ion o f the Non-milk Returns that i s derived
from sel l ing o ff surplus heifers is higher for Argentine farms than for New Zealand
farms (see Table 7) . This is part ly caused by the fact that most Argentine farms raise a l l
their heifer calves ( researchers ' experience in Argent ine dairy farming). Addit ionally,
these figures show that for ew Zealand farms, t he proport ion of the on-mi lk Returns
that comprises the sel l ing of calves is higher ( see Table 7). This is because N ew Zealand
farms sell not only their bull calves but also a proport ion of their hei fer calves . I n
add it ion i n Argentina the prices received for bul l calves are nearly insignificant because
there is no market for them. In contrast, in New Zealand, there is an establ ished market
for bull calves also cal led "bobby calves" (NZ-B iosecurity, 1 997).
Table 7 : Non-mi lk Returns, as a Percentage of Total Returns, for
New Zealand and Argentine Typical Farms
Argentine Typical Farms New Zealand Typical Farms
Season 2002 Season 2003 Season 2002 Season 2003 Cu l l cows 8 . 1 % 1 0 . 7% 4 .3% 4 .6% S urplus Hei fers 4 .8% 4 .3% 0 .3% 0 . 3% Calves 0 .9% 0 .8% 2 . 9% 3.4% Total Non-milk Returns 1 3.8% 1 5 .8% 7 . 5% 8 . 3%
Table 7 also shows that the proportion of the rctums from the sales of cull cows in Total
Returns is higher for the Argentine model farms than for the New Zealand model farms.
As reflected in F igures 22 and 23, the returns from the sale of cull cows per k i logram o f
mi lk produced were higher i n the Argent ine farms than in t he ew Zealand farms ( 1 . 9
t imes higher in 2002 and 2 . 2 t imes higher in 2003 ). This is exp lained by the h igher
replacement rates of the Argentine farms and the bigger s ize of the Argent ine cows. The
replacement rate was, on average, 29% for the Argent ine farms and 2 1 % for the New
Zealand typical farms. The l ive weight of the typical Argentine cows is between 500
and 550 k i logram and for the New Zealand typ ical cow is approximately 440
k i lograms.
73

Chapter 4: Dairy Farm Systems: New Zealand and Argentina
4.4. 5 Costs components (IFCN)
I n the fo llowing sections, the different cost components are analysed, as defined by the
I FCN: Labour Costs, Land Costs, Capital Costs and "Costs as Means of Production"
( see section 4. 3) .
Table 8: Cost Components, as Percentage of Total Costs, for New
Zealand and Argentine Typical Farms
Argentine Typical Farms New Zealand Typical Farms
Season 2002 Season 2003 Season 2002 Season 2003 Labour Costs 1 9% 1 7% 1 8% 1 8% Land Costs 25% 24% 1 3% 1 6% Capital Costs 4% 5% 1 1 % 1 1 % Costs as Means of 52% 54% 58% 5 3% Production Total Costs 1 00% 1 00% 1 00% 1 00%
4.4. 6 Labour
I n th is section, Labour Costs per 1 00 kilograms of milk, the Average Wages of the
farms, and the Labour Productivity are analysed.
4.0 � 3.5 � 3.0 � 2.5 '1' 2.0 0 '-= 1.5 ..... .. 1.0 ({) ::> 0.5
0.0
Figure 24: Labour Costs (season 2002)
La bour Costs ( sea son 2002)
74

Chapter 4: Dairy Farm Systems: New Zealand and Argentina
Figure 25: Labour Costs (season 2003)
Labour Costs (season 200 3 )
4.0
� 3.5 - - - - - - - - -
u 3.0 � ."- 2.5 E � 2.0 0 1 . 5 � "' 1 .0 rh :::J 0 .5
0 .0
• Wages paid o Gale. costs for family labour
On New Zealand farms Labour Costs were, on average, 1 .4 t imes h igher per I 00
ki lograms mi lk than on the Argentine farms in the 2002 season and in the 2003 season.
F igure 26: Average Wages (season 2002)
Average Wages (season 2002) 8.0 7 0 • • 6.0
� 5.0 .s;;
;;;; 4.0 � 3.0
2.0 • • •
1 . 0 0.0
:il :il 0 m ..... 0 M 1 M " N r!: r!: r!: N N <! <! z z <!
F igure 27 : Average Wages (season 2003)
10 0
9.0
8.0 7.0
a 6.0 -.c
"' 5.0 rh 4.0 :::J
3.0 2.0 1 .0 0.0
•
0 .,., r:i: <!
Average Wages (season 2003)
- ll -· - -
• •
•
.,., M 00 N z
- -·
I n 2002 Average Wages paid per hour ofwork on N ew Zealand farms were 2 . 8 t imes
h igher than on Argent i ne typical dairy farms. In 2003 , they were 4 t imes h igher.
75

Chapter 4: Dairy Farm Systems: New Zealand and Argentina
Figure 28: Labour Productivity (season 2002)
350
300
� 250
� 200 u ;- 150
� 100 �
50
0
Labour Productivity (season 2002)
Figure 29: Labour Productivity (season 2003)
350
300
� 250
:i" 200 u w ; 150 E I!.' 100
50
0
Labour Productivity (season 2003)
Labour Product iv ity is calculated by d ividing the total k i lograms o f mi lk (ECM)
produced by the total hours for feeding, forage product ion, young stock rearing, mi lk ing
and manure handl ing ( I FCN, 2002).
I n the N ew Zealand farm models the Labour Product iv ity (calculated as k ilograms of
m i lk produced per hour of work) was 2. 7 t imes h igher than in Argent ine farm models in
2002, and 2 . 8 t imes higher in 2003 .
I n conclusion, Labour Costs per k i logram of milk produced were h igher in New
Zealand than Argentina, despite the fact t hat Labour Product ivity ( i n k i lograms of milk
per hour of work) was higher in N ew Zealand than in Argent ina, because the d ifference
o n average Wages (US-$ per hour of work) were larger than the d ifferences in Labour
Product ivity.
76
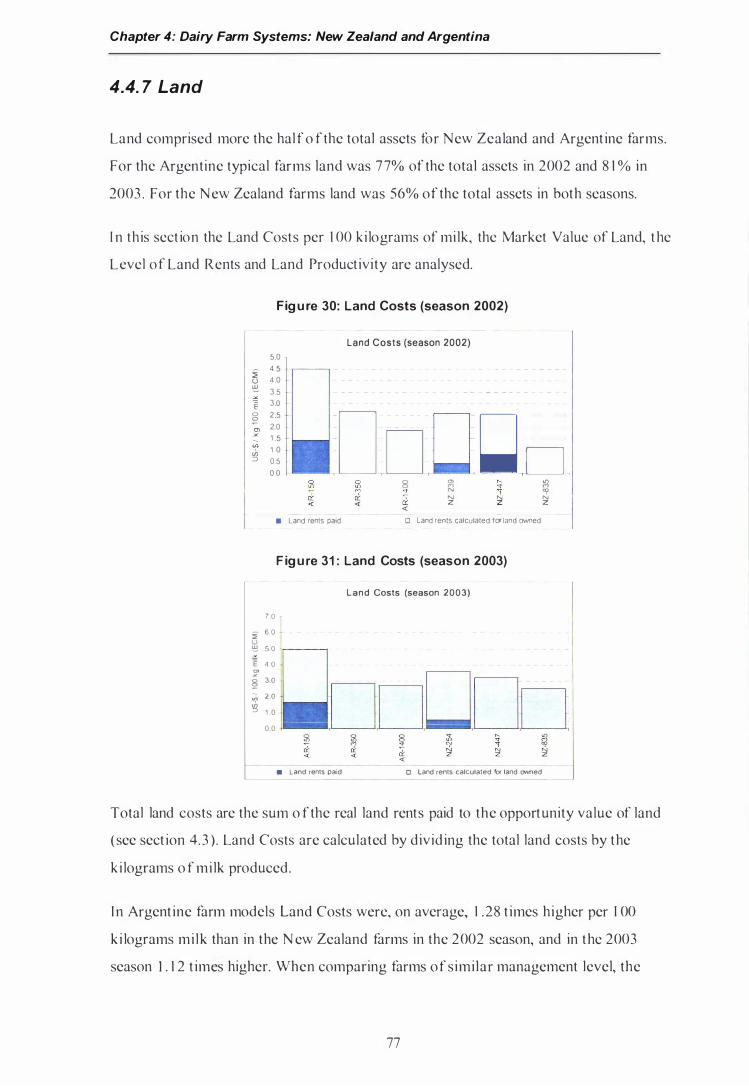
Chapter 4: Dairy Farm Systems: New Zealand and Argentina
4.4. 7 Land
Land comprised more the hal f o f the total assets for New Zealand and Argent ine farms.
For the Argentine typical farms land was 77% of the total assets in 2002 and 8 1 % in
2003 . For the New Zealand farms land was 56% of the total assets in both seasons.
I n this sect ion the Land Costs per 1 00 ki lograms of mi lk, the Market Value of Land, t he
Level of Land Rents and Land Product ivity are analysed.
Fig u re 30: Land Costs (season 2002)
Land Costs (season 2002)
5 0
i 4 5 u 4 0 � 3 5 "'
E 3 0 0 2 5
.D o .� D ;? 2.0 � 1 5 "' 1 0 .;, :::> 0.5
0 0 8 ""
ci: � N N z <{
• Land rents patd 0 Land rents calculated for land owned
F ig u re 31 : Land Costs (season 2003)
7 0 :E 6 0 u !!'. 5 0 lr----, E • o "' § 3 0 � 2 0 en ::::> 1 0
0 0
• Land rents pa1d
Land Costs (season 2003)
o Land rents calculated b land owned
:£1 a;> N z
Total land costs are the sum o f the real land rents paid to the opportunity value of land
( see sect ion 4. 3 ) . Land Costs are calculated by divid ing the total land costs by the
k i lograms o f mi lk produced.
I n Argent ine farm models Land Costs were, on average, 1 . 28 t imes higher per I 00
k i lograms mi lk than in the N ew Zealand farms in the 2002 season, and in the 2003
season 1 . 1 2 t imes higher. When comparing farms of s imi lar management level, the
77

Chapter 4: Dairy Farm Systems: New Zealand and Argentina
Land Costs of AR- 1 50 were 1 . 7 and 1 .4 t imes higher per k i logram of milk produced in
2 002 and 2003 than t hose ofNZ-239/254.
In Argent ina it is more common to rent a piece of land than in New Zealand
( researcher's experience in Argent ine dairy farming sector). This cannot be seen in
F igures 30 and 3 1 because only the AR- 1 50 leased land, and because the run-offs ( land
separated from the farm that is used for grazing dry cows, rearing replacement heifers or
p lant ing crops) ofNew Zealand farms appeared as rented land.
Figure 32: Market Value of Land (season 2002)
"' "'
6,000
5,000
4.000
;; 3.000 (/) ::>
2.000
1 ,000
Market Value of Land (season 2002)
Figure 33: Market Value of Land (season 2003)
M arket Value of Land (season 2003)
1 0,000 9.000 8.000 7.000
"' 6.000 "' tJ? 5.000 (/) ::::> 4,000
3.000 2,000
1 1 11 1 .000 j 0 fil 1il ';!, � � � ci: N N "" "" z z
� 'I' N z
� "' N z
Average M arket Value of Land in N ew Zealand farms was 3 . 75 t imes higher than in
Argent ine farms in both years.
78

Chapter 4: Dairy Farm Systems: New Zealand and Argentina
Figure 34: Level of Land Rents (season 2002)
Level of Land Rents (season 2002)
300
200 "' s:
;;; 150 eh ::J
100
50
0 0 g 0 "' � "' 0 ('") ('") " N ri: ri: ri: � � <( <( <(
Figure 35: Level of Land Rents (season 2003)
"'
450 400 350 300
::: 250 � 200 :::>
Level of Land rents (season 2003)
i6 N z
"' l? �
I n 2002 the average Level of Land Rents in ew Zealand farms was 2 t imes higher than
in Argent ine farms, and in 2003, 2. 9 times higher. The Level of L and Rents was
approximately 4. 5 % of the Market Value of Land in ew Zealand and approximately
6 .5% in Argent ina.
Figure 36: Land Productivity (season 2002)
Land Productivity (season 2002)
16.000
14.000
"' 12.000 .c
i 10.000
u 8.000 !:'!.
"' 6.000
E 0> 4.000 "'
2.000 .. 0
g
� <(
79

Chapter 4: Dairy Farm Systems: New Zealand and Argentina
Figure 37: Land Productivity (season 2003)
1 6,000
14,000
2? 1 2,000
� 1 0.000 u � 8,000 �
'E' 6.000 "' � 4,000
2,000
0
Land Productivity (season 2003)
Land Product ivity is calculated by dividing the total mi lk produced in k ilograms of mi lk
( ECM) by the hectares ut i l ized by the dairy enterprise. I n the Argent ine models most of
the supplements are produced on the same farm. Those hectares ut i l ized for producing
those supplements are included in the calculat ion ofthe Land Product iv ity; the only
feeds that are not included are the concentrates that were bought. In the N ew Zealand
farms, the run-off hectares are not included to calculate the Land Product ivity
consequent ly the grass grown in the run-off is feed that was brought in.
Should be ment ioned that the amount of feed brought in from outside the hectares
considered has an impact in land product iv ity:
Typical N ew Zealand farms: NZ-239 brought in 1 5% of total feeds, N Z-447
brought in 2 1 % o f total feeds, and NZ-835 brought in 30% of total feeds (the
proport ions are approx imate).
Typical Argent ine farms: AR- 1 50 brought in 0 .5% of total feeds, AR-350
brought in 22% of total feeds and AR- 1 400 brought in l 0% of total feeds (the
proport ions are approximate).
I n 2002 the average Land Product iv ity of N ew Zealand farm models was 2 .6 t imes
h igher than in Argent ine typical dairy farms, and in 2003, 3 t imes higher.
I n conclusion, the Land Costs per k ilogram o f mi lk produced were higher in Argent ina
than in New Zea land, despite the fact that the M arket Value of Land and the Level o f
Land Rents were lower in Argent ina than in N ew Zealand. This i s explained because the
d i fference in Land Productivity (k i lograms of mi lk per hectare) was even higher than
the d ifference in M arket Value of Land and Level of Land Rents.
80

Chapter 4: Dairy Farm Systems: New Zealand and Argentina
4.4. 8 Capital
Capital is another cost component. The I FCN analyses t he capital factor separately from
the land factor, consequent ly capital in the present context is the total assets w ithout t he
land (bui ld ings, machinery, l ivestock, co-operat ive shares, and others) .
F igure 38: Capital Costs ( land not included) (season 2002)
Ca pita l Costs (land not inc luded) (season 2002)
2 0
1 .8
� 1 .6 u � 1 .4 -" E 1 2
� 1 . 0
8 0 8
0 6 "' eh 0 4 ::J
0 2
0 0 · · · - · 0 "'
cl: <!
0 0 "' ,... "' "' 0 � ::f 2 "' <t cl: cl: � Si � <! <!
F igure 39: Capital Costs ( land not included) (season 2003)
3 0
- 2 5 6 � 2 0 E � 1 .5 8 � 1 0
':!l 0 5
0.0
Capital Costs ( la n d not inlcuded) (season 2003)
In order to calculate the Capital Costs (on an annual basis), the I FC considers a rea l
interest rate of 6% for borrowed funds, and a 3% real interest ( as opportunity cost ) for
owner' s capital (bui ldings, machinery, l ivestock and others) .
I n 2002 the average Capital Costs in N ew Zealand farms were 4 t imes h igher than in
Argent ine typical dairy farms, and in 2003, 2 . 7 t imes h igher. The Capital Costs of AR-
1 50 changed dramat ical ly from 2002 to 2003 because the farm had financial problems
during 2002 and incurred in a large short-tenn loan that was paid d uring 2003. The
fo l lowing figures (Capital Structure, Capital I nput per cow, Milk Y ield per cow and
Capita l Product iv ity) help to understand why Argent ine farms had less Capital Costs.
8 1

Chapter 4: Dairy Farm Systems: New Zealand and Argentina
Figure 40: Capital Structure of the Typical Farms (season 2002)
1 00% 90% 80% 70% 60% 50% 40% 30% 20%
Capital Structure (season 2002)
10% 0% �L----�----�L----L�--��----�-----L
"'
� .,.,
"" "" � � N N z z z
o Equity • Liablitilies
Figure 41 : Capital Structure of the Typical Farms (season 2003)
100% 90% 80% 70% 60% 50% 40% 30% 20% 1 0%
Capital structure (season 2003)
�� �----�----�----�.L_ ____ JT�----�----�
0 Equity • Liablitilies
N ew Zealand typical farms had, on average, 33% of l iabil ities in 2002 and 37% in 2003.
Argent ine typical farms had, on average, 5% of liabil it ies in 2002 and 4% in 2003 . As
shown in F igures 40 and 4 1 , two of the three typical Argentine dairy farms do not have
debts. This is because, among other t hings, the interest rates are usually very high in
Argentina and because loans are difficult to obtain.
Figure 42: Capital Input in Bui ldings and Machinery per Cow
(season 2002)
Buildings and Machinery per Cow (season 2002)
BOO 700
600
poo <.>
;;; 400
� 300 200
100
0
:il :il 8 "' r-. .,., � <f M
d: M .,. "'' oc N N N <( <( z z z
82

Chapter 4: Dairy Farm Systems: New Zealand and Argentina
Figure 43: Capita l Input i n Bui ld ings and Machinery per Cow
(season 2003)
B u ildings and Machinery per cow (season 2003)
800
700
600
� 500 8 � 400 <f) ::J 300
200
100
0
� lfl §l .,. f "' � &l ci: ci: ci: si� S;l si� <( <( <(
Capita l I nput in Bui ld ings and Machinery is calcu lated by d ividing the total assets o f
bui ld ings and machinery o f each farm d iv ided by the number o f cows.
I n 2002 the average Capita l I nput in Bui ld ings and Machinery per cow in ew Zealand
typical farms were 2 .2 t imes higher than in Argent ine typical dairy farms, and in 2003,
i t was 3 . 1 t imes higher.
Figure 44: Price per Heifer So ld (season 2002)
450
400
350
2 300 � 250
� 200 (f) ::> 150
100
50
0
Price per He ifer Sold (season 2002)
Figure 45: Price per Heifer Sold (season 2003)
500 450 400
350 15 ! 300 - 250 '? 1!3 200
150 100
50 0
Price per H eifer Sold (season 2003)
8 3

Chapter 4: Dairy Farm Systems: New Zealand and Argentina
I n 2 002 the average Price per Heifer Sold (pregnant heifers 20 months old) in N ew
Zealand typical farms was 2 times higher than in Argentine typical dairy farms, and in
2003 1 . 8 times higher.
This difference in Price of Heifers So ld between countries is similar for the other
categories of livestock; which explains why the total capital input in l ivestock divided
by the number of cows (Capital I nput in Livestock per cow) was 2 .65 times higher in
New Zealand model farms than in Argentina model farms tor both seasons. This is
caused by lower livestock prices in Argentina than in New Zealand.
Figure 46: Capital Productivity ( land not included) (season 2002)
Capital Productivity ( la n d not included) (season 2002)
1 2,000
J; 1 0,000 ::J 0 g 8, 000
:::; 6, 000 0 :; 4, 000 E '2 2,000
0
Figure 47: Capital Productivity ( land not included) (season 2003)
Capital Productivity ( land not included) (season 2003)
1 2,000
"' 1 0,000 � § 8,000
� 6,000 '!:'-.:.-: 4,000 E � 2,000
0
Capital Product ivity is calculated by dividing the total milk produced by the capital
invested in buildings, machinery, livestock, and co-operative shares. In 2002 capital
product ivity in Argentine typical farms was 5 . 8 times higher than in New Zealand
typical dairy farms, and in 2003, it was 4.3 times higher.
This difference is caused by the fact that the Argentine typical farms produced more
milk per cow (see F igures 48 and 49) with less capital invested per cow.
84

Chapter 4: Dairy Farm Systems: New Zealand and Argentina
Figure 48 : Mi lk Yield per Cow (season 2002)
6.000
t 5,000
� 4,000
s- 3.000 u w ;; 2.000 E :;: 1 .000
0
Milk Y ie ld per cow ( season 2002)
Figure 49: M i lk Yield per Cow (season 2003)
6.000
.. 5.000 � � 4 .000 u ;;; 3.000 E a 2 .000 w � 1 .000
0
M ilk Y ie ld per Cow (sea son 2003)
I n 2002 the M ilk Y ield per cow in Argent ine typical farms was I . I 2 t imes h igher than
in N ew Zealand typical dairy farms, and in 2003 I .03 t imes higher.
I n conclusion, Capital Costs per k i logram of mi lk produced were higher in New
Zealand than in Argent ina mainly due to three causes: first ly because the ew Zealand
dairy farms have more than 6 t imes the amount o f debt . Secondly, because the ew
Zealand dairy farm invested more in build ings, machinery and l ivestock per cow than
the Argent ine farms. And thirdly, because typical New Zealand farms need to own co
operat ive shares in order to sell their milk to the dairy company.
4.4. 9 Costs as Means of Production
The last cost component defined by the I FCN is the Costs as Means of Product ion (see
sect ion 4.3) . The means of production are the fo l lowing: animal purchases, feed
expenses (purchase feed, fert i l iser, seed, pest icides), machinery expenses ( maintenance,
deprec iation, contractor), fuel, energy, lubricants and water expenses, bui ld ings
85

Chapter 4: Dairy Farm Systems: New Zealand and Argentina
expenses ( maintenance, depreciat ion), veterinarian and medicine expenses, inseminat ion
expenses, insurance and taxes, and other inputs.
Figure 50: Costs as M eans of Production (season 2002)
C osts a s Means of production (season 2002)
12.0
3 10.0 1!!. �
----, .:t. 8.0 e '1 6.0 �
0 0 � 4.0 .. 0? :::> 2.0
0.0 5l � g :<:l "- � �
i ... "' ... cc d:
� N ,.:J N <{ z z z
Figure 51 : Costs as Means of Production (season 2003)
Costs as Means of Production (season 2003)
12.0
10.0 g !!:'. 8.0 X 'E "'
.. ,o. X
§ ;;; 4.0 <f) ::::> 2.0
0.0 5l 1il � -:!, ,_ .,.,
:f "'
;t "' cc c:i: ;t S2 N N <( <( z z <(
I n 2002 the average Costs as Means of Production in New Zealand farms were 1 .6 t imes
higher than in Argentine typical dairy farms, and in 2003, they were 1 . 3 times higher.
The fact that the d ifference decreased from 2002 to 2003 could be related by the
increase of inputs in Argentine farms due to the increase in the milk price.
4.5 C hapter Summary
• The average New Zealand farm has 285 cows and I l l hectares.
• The average Argent ine farm has 1 74 cows and 27 1 hectares.
• Argentine typical cows ( I FCN) have a l ive weight between 500 and 550
k ilograms. New Zealand typical cows weight approximately 440 k i lograms.
86

Chapter 4: Dairy Farm Systems: New Zealand and Argentina
• The typical farm models ( I FCN) that contribute t he b iggest proportion of the
total milk for each country are A R-350 and NZ-2 3 9.
• Cows in AR-350 and NZ-239 produce simi lar ki lograms of mi lk ( ECM) per
k i logram of live weight .
• Z-239 supports nearly 2 t imes more k i lograms o f live weight o f l ivestock per
hectare than AR-350 .
• Typical Argent ine farms have a l l year round calv ing. New Zealand typical farms
have seasonal calv ing.
• I n A R-350, 52% o f the total feed requirements o f al l the l ivestock are covered
by grass. In Z-23 9, 96% of the total feed requirements of all the livestock are
covered by grass.
• I n A R-350, 78% of the total feed requirements o f al l the l ivestock are covered
by homegrown feeds . I n NZ-239, 85% of the total feed requirements of al l the
l ivestock arc covered by homegrown teeds.
• The farm models defined by the I FC as typical are AR- 1 50, AR-350 and A R-
1 400. For ew Zealand the typical farm models are NZ-239, NZ-447 and Z-
825 .
• A R- 1 50 and Z-2 3 9 are the typical farms that are closer to the statistical dairy
farm averages of their countries.
• A R- 1 400 represents a group of Argentine farms t hat are situated within the top
1 0% in size and w ithin the top 25% in management.
• N Z-447 and NZ- 8 3 5 are average farms from the two dairy farming regions that
have been growing most rapid ly in milk product ion in New Zealand during the
l ast I 0 seasons.
• N ew Zealand typical farm models had, on average, higher Costs for Mi lk
Production Only per k i logram o f mi lk ( ECM) than Argent ine typical farm
models in 2002 and 2003 ( 1 .6 t imes and 1 .42 t imes higher, respect ively).
87

Chapter 4: Dairy Farm Systems: New Zealand and Argentina
• New Zealand typical farm models had, on average, higher Labour Costs per 1 00
k ilograms of mi lk ( ECM) than Argentine farm models in 2 002 and 2003 ( 1 . 39
t imes and 1 .4 1 t imes higher, respectively).
• New Zealand typical farm models had, on average, higher Capital Costs, per
k ilo!:,'Tam o f milk ( ECM) than Argentine typical farm models in 2002 and 2003
(2. 1 t imes and 2. 7 t imes higher respect ively).
• N ew Zealand typical farm models had, on average, higher Costs as Means of
Production, per kilogram o f m i lk ( ECM) than Argentine t yp ical farm models in
2002 and 2003 ( 1 .6 t imes and 1 . 3 t imes higher, respectively).
• Argentine typical farm models had, on average, higher Land Costs per ki logram
of milk (ECM) than New Zealand typical dairy farm models in 2002 and 2003
( 1 .2 8 t imes and 1 . 1 2 t imes lower, respectively).
88

Chapter 5: Methodology
5 M ETHODOLOGY
5 . 1 Research Strategy
5. 1. 1 The Case Study
Several research strategies were analysed from the l iterature in order to find the most
su itable strategy for the research quest ion. Phi l l iber, Schwab and S loss ( 1 980) suggested
three main strategies for social research: case studies, surveys and experiments. Bouma
( 2000) incorporated two more research strategies: longitudinal studies and comparison
studies. Another author who specializes in social research and more specifical ly in case
studies (2002; Y in, 2002) also analysed the t lu·ee most common ( the experiment , the
survey and the case study) and added two more to the five suggested by Bouma (2000),
these are the archival analysis and the history.
From the seven research st rateg ies named, the case study was chosen as the most
appropriate for th is research. The defin it ion of the case study research strategy and the
reasons for choos ing it arc explained in the fo l lowing paragraphs.
T here are very d ifferent defin it ions of the case study as a research strategy. Phi l l iber et
al . ( 1 980, page 63) stated, 'The d ist inguishing characterist ic of the case study is that
there is a sample s ize of one" and that "Whi le many data-co l lect ion techniques may be
employed in any design, mult ip le measures are general ly the rule rather than the
exception in case study research."
Bouma (2000, page 90) also stated that the main characterist ic of the case study "is that
it focuses on a single case" and that is the research strategy more suitable for
exploratory research.
Other authors (Chetty, 1 996; E isenhardt, 1 989, 1 99 1 ; Rowley, 2002 ; Y in, 2002) defined
t he case study as a more powerful research strategy because they consider the
possibi l ity o f mult iple case studies and to bui ld theories from case study research. They
suggested that this research strategy cou ld be used for many cases and for descript ive
and explanatory research as a contrast to only exploratory research of only one case.
A case study can be defmed as the fo l lowing:
89

Chapter 5: Methodology
"A case study is an emp irical inquiry that investigates a contemporary phenomenon w ithin its real- l ife context, especially when the boundaries between phenomenon and context are not clearly evident." (Yin, 2002, p. l 3)
Phil l iber et al. ( 1 980) and Bouma (2000) agree with this definition of a Case Study.
Both authors stated that the case study invest igates a phenomenon within its real context
and focused more in the present than in the past . Considering these two aspects, an
experiment would be an example of a research strategy in which the researcher tries to
have control o ver the context ; and a history an example of a research strategy in which
the researcher is more interested in the past than in a contemporary phenomenon.
I t can be added to the definit ion of the case study that it usually employs many data
col lect ion techniques (Phil l iber et al. , 1 980). Therefore the data co llected can be a mix
of qualitat ive and quantitative data. I s also important to mention t hat the case study is
the preferred strategy for exploratory research (Bouma, 2000), even though it can be
used also for descript ive and explanatory research (Chetty, 1 996; E isenhardt, I 989,
1 99 1 ; Rowley, 2002 ; Y in, 2002) .
In th is research project the phenomena to be studied i s the impact of adopting N ew
Zealand innovations to Argent ine farms, the impact of this and the possibil it ies and
constraints of diffusing the innovat ions through the Argentine production sector. Each
farm is a case and it is impossible to separate the farms from their environment .
Consequently, according to its definit ion, the case study is the most appropriate strategy
for this research project .
5. 1 . 2 Descriptive Research
ln t he continuum from explorat ion to explanation passing through descript ion, this
research started exploring and is mainly descriptive. I t was not the objective of the
present study to proved cause-effect relationships. However some associations between
variables were found.
At the moment when the proposal for this research was elaborated no other study on the
topic of this research could be found. Nor was there any trustworthy information about
the fol lowing points :
90

Chapter 5: Methodology
I ) There was not a l ist ofNew Zealand ideas, practices and techno logies t hat were
potent ial ly useful for Argentine dairy farmers.
2 ) The proport ion, number o r identity o f the Argent ine dairy farmers that were
adopting New Zealand ideas was unknown (but the existence of a group of
farmers that were adopting N ew Zealand ideas was certain).
3 ) I t was unknown which were t he New Zealand ideas that had been adopted by the
farmers in contact with t he N ew Zealand ideas.
4) o study of the process of adoption of innovat ions (of any origin or kind ) by
Argent ine dairy farms cou ld be found .
5 ) As a conseq uence of a l l this it can be considered that the topic was unexplored
and that this was the first study to invest igate the mentioned topic.
5. 1. 3 Case Study Designs
I n t he fo l low ing sect ion are described the d ifferent kinds of case study des igns. The one
that was chosen is then described in detail .
Table 9: Basic Types Designs for Case Stud ies
Single-case designs M ulti p le-case des igns
H olistic Type I Type 3 ( S i ngle unit of analys is) Litera l and/or theoret ical
repl ication E mbedded Type 2 Type 4 ( M u l tiple unit of a na lysis) Literal and/or theoretical
repl ication
(Source: Adapted from Yin, 2002, p.40)
There are four basic t ypes of case studies designs ( see Table 8). Within single and
mult iple case studies designs there are two different types, the ho l ist ic and the
embedded. An embedded case study is one in which more than one unit is analysed, for
example a case study of a farm business in which every aspect of the business is
invest igated. On the other hand, a ho l ist ic case study is when only one unit is analysed,
9 1

Chapter 5: Methodology
as in a case study of a farm business in which only the attitude towards risk of the
farmer is invest igated (for more details refer to Yin, 2002, p.42-45) .
The present study is an embedded study because three units of analysis were
investigated for each case study. The first unit of analysis was to assess the adoption or
rejection of a list of N ew Zealand innovations. The second unit of analysis is the
reasons that support the decision to reject or to adopt the innovations. The third unit is
to study the impact of adopting the N ew Zealand innovations on each case study farm.
Also Table 8 shows that within the multiple case study designs (types 3 and 4) literal
and/or theoretical replication can be chosen. B efore explaining the two kinds of
replications that can be used, it is important to clarify why the term "replication" was
used rather than "sampl ing".
The sampl ing logic is commonly used in surveys in which the researcher selects a group
of cases that statistically represents the population that is to be studied (Jankowicz, 1 99 1
cited in Ghauri & Gronhaug, 200 1 ) . The objective of this kind of research is to
generalize conclusions to the populat ion. I n this k ind of research the u lt imate object of
study i s not the sample, i t i s the population itself that i s studied through the sample.
I n contrast the replicat ion logic is used when a specific phenomenon is studied by itself:
not as a part of a greater phenomenon. I n a mult iple case study each case is studied as
an end in itsel f with the intention to understand certain aspects of the case study. I n a
case study design of multiple cases in each case the same phenomenon is studied. I t is
similar to a multiple experiments design in which the same phenomenon is studied i n
more than one experiment in similar conditions. The intention i n both the multiple
experiments and case studies designs is to repeat similar studies of the same
phenomenon with the intention to validate the results by repetition (Yin, 2002) .
Continuing with the explanation about the replication logic, i t was mentioned before
that t he replication could be literal or theoretical. Literal rep lication is when the cases
are carefully selected with the intention to predict s imilar results . W hen someone does a
l iteral replication he or she tries to find cases that are s imilar in the aspects that affect
the unit of analysis that is being studied. I s easy to understand with an example of an
experiment, the replication of experiments are tried in very similar condit ions to
validate the previous experiments. Theoretical repl icat ion is when each case is selected
92

Chapter 5: Methodology
to predict contrast ing results but for predictable reasons. Consequently when a mult iple
case study w ith theoret ical replication is designed cases are selected that are different,
w ith the intent ion to study the same phenomenon in cases that are selected to be
different. I n the example of an experiment, the aim would be to do the same experiment
in sl ightly d i fferent cond itions to test if the same results are obtained ( Y in, 2002, p. 47) .
I n this research project the case study farms were selected with the intent ion to replicate
literally and theoret ically. Farmers considered innovators ( in respect to ew Zealand
ideas) were selected w ith the intent ion to find simi lar results and some contrasting
farmers ( considered more typical or conservat ive) were also selected w ith the object ive
to contrast their results w ith the others (more detai ls of the case select ion in the next
sect ion) .
In conclusio n, the research is a multiple case study design because seven tarms were
selected w ith different degrees of innovat iveness w ith respect to New Zealand
innovat ions. And the cases were embedded because mult iple units of analysis were
invest igated in each case (see Figure 52) .
, , I I I I I I I \
F igure 52: Research Desig n, Multiple and Embedded Case Study
� ' '
\ \ I CASE I \
I I I
CO TEXT I I
, � � I
I I CASE 7 I I
' ' \ I I
I
',, I , � U nit of A na lysis : I nnovat ions Adopted or Rejected? Reasons?
I \ ',, ,
I I I I
/ I I �
-----' ' \ I
I I I I
I I CASE 2 I I mpact of Adopt i ng?
I \ ',, ----- / �
I I I I ' / ' I \ I \ I I I I
I CAS E 3 I I I I I I I \ I '..... ... ," -----
/ ' I ' I \ I I I I : CASE 4 I I I I I \ I
'..... .... ...."' " -----
- - - - -.... -- - -
' / ' I \ I \ I I I I
� '
, :1 CASE 6 ) "' ' \ I
/ ' \ I I \ ' /
I \ ' ,"
: CASE 5 \ ,
_ _ _ _ / I I I I I I \ I '..... ..... .... ... " _ _ _ _ ....
Figure 52 shows the main elements o f the research study: the cases, the context and the
unit of analysis. The dashed lines that define each case study show that the boundaries
between the context and the cases are not clear. This is because the context and the
cases are related. Farms and farmers are very influenced by the Argent ine socio
economic environment and also by the changes that occur within the Argent ine dairy
93

Chapter 5: Methodology
sector and at the same t ime farmers are actively impacting on the Argentine dairy sector
individual ly and as a group.
5. 1 .4 Cases Selection
For reasons of confidentiality numbers instead o f real names identifies the farms and
farmers in the present report, and specific details that could lead to accurate
identificat ion were omitted.
Farmers with knowledge ofNew Zealand systems were needed. It was essential to
achieve the research objectives that the farmers that were to be chosen knew about the
New Zealand dairy production systems and the N ew Zealand innovations prior to
meeting the researcher.
The researcher establ ished contact with one of these farmers, Farmer 2, who is
renowned as an innovator within the dairy farm sector. The researcher, who is family
related to Farmer 2, worked on one of Farmer 's 2 dairy farms for a year. Working on
this farm the researcher became aware that there was a smal l !,troup of Argentine
farmers that were adopting New Zealand innovat ions. Most of them were
interconnected because they shared information and experiences. They also applied
systems that were diflerent from typical Argentine farmers and consequently they were
continual ly challenging and being challenged by more typical farmers.
Farmer 4 was recommended by Farmer 2 as one of the first ones to adopt New Zealand
innovations and as one of those most persuaded o f the benefits of the New Zealand
dairy farm principles. These two farm<> are very big in scale (more than 2 ,000 cows) and
are probably representative of the biggest and best managed Argentine dairy farms.
These two farmers recommended Farmer 6 as someone with comprehensive knowledge
o f the N ew Zealand dairy principles. This farmer has long experience in adopting the
N ew Zealand dairy farm principles in several countries ( tor exampl e, N igeria, Jamaica
and N icaragua). This farm can be considered a family farm that is growing and being
developed financed by its own profits. They started milking 6 years ago and have been
increasing cow numbers up to the current 400 cows.
94

Chapter 5: Methodology
Farms 5 and 7 were recommended by Farmer 2. These two farmers had previously
worked in associat ion with Farmer 2 and were at that moment working independently.
They have experience in typical Argent ine farms and also the experience o fworking in
Farm 2 where several New Zealand innovat ions have been adopted. Nowadays both of
them are owners and directors of their own dairy businesses. Both farmers lease al l the
land and are probably exposed to a greater degree of risk than all the other farmers
selected. Farm 7 has current ly 400 cows, is a family business in which the family
provides part of the labour. In Farm 5, I ,000 cows were milked last season (03-04), and
is a lso a family business. The fact that both lease al l the land and that both farmers'
families are very invo lved in the business ob liges the farmers to be very cautious in the
innovations that t hey adopt.
Farm I is a very b ig farm (6,500 cows) owned by a family that also owns several other
farms and businesses. I n this farm the CEO ( Chief Execut ive Officer) was interviewed
as the main decision taker of the dairy enterprise. This farm is situated in the more
traditional and product ive dairy area of Argent ina. The 6,500 cows are milked in 1 8
farm dairies of d ifferent sizes. H istorical ly Farm I has been considered typical and with
some degree of opinion leadership among other farmers in the area (people of the region
interviewed) . I f the Z innovat ions are proved to work in this farm it is possible that
they will be spread to other dairy farmers.
Farmer 3 has a family relat ionship to Farmer 2 and is in the same discussion group as
Farmer 4. Therefore he is constant ly in contact with the New Zealand innovations
adopted in those two farms. Farm 3 is also large scale ( 1 900 cows). Farmer 3 is
considered to adopt new techno logies and ideas only when they have proved to be
beneficial ( from interviews of Farmer 2 and Farmer 4) . This farm is among the top
performers of the discussion group (data from the d iscussion group and interviews with
Farmer 2 and Farmer 4). Due to his prestige and relat ive acceptance of the social
system norms Farmer 3 can be considered to be an opinion leader within the farmers of
the discussion group. Even though Farmer 3 is considered sceptical about new
technologies he has adopted some NZ innovat ions.
The researcher ho lds these farmers in h igh esteem; all of them are successful dairy
farmers with great experience in the production sector, optimist ic about the future of the
dairy sector and act ively compromised to i ts development.
95

Chapter 5: Methodology
5. 1 . 5 Enhancing the Quality of the Research
Tradit ional ly four criteria are used to examine the qual ity of any empirical social
research. These are construct validity, internal validity, external validity and
reliability (Kidder & Judd, 1 986, p.26-29 cited in Y in, 2002) :
"Construct v alidity: establishing correct operational measures for the concepts being studied.
Internal v alidity: establishing a causal relat ionship, whereby certain c onditions are shown to lead to other conditions, as distinguished from spurious relationships .
E xternal valid ity: establishing the domain t o which a study's findings can be generalized.
Reliability: demonstrating that the operations of a study -such as the data col lection procedures- can be repeated, with the same results ."
To enhance the quality of this invest igation some tactics that were suggested by Y in
( 2002) for different phases of a case study were used (see Table 1 0).
Table 1 0: Case Study Tactics for Four Design Tests
Tests Case Study Tactic Phase of Research in which Tactic Occurs
• Use mult ipl e sou rces of ev idence Data col lection Construct • Establ i sh chain of ev idence Data collection validity • Have key i nformants rev iew d raft case Com position
study report • Do pattern-matching Data a nalysis
I n ternal • Do explanation-bu i ld ing Data a nalysis validity • Address riv al ex planations Data a nalysis
• U se l ogic model s Data a nalysis
• U se theory i n single-case stud ies Research design External • Use repl ication l ogic i n m ult iple-case Research design validity stud ies
• U se case study protocol Data col l ection Reliabil ity • Develop case study database Data col l ection
(Source: Yin, 2002, p .34)
Construct Val i dity
Construct val id it y addresses the question: A re we measuring what we real�y want to
measure? To meet the "test of construct valid it y" the researcher has to focus on two
important steps (adapted from Y in, 2002, p . 35 ) :
Select and c learly define the specific concepts t o be measured.
96

Chapter 5: Methodology
Demonstrate t hat the "measuring instruments" that are going to be used, do
measure those specific concepts.
The three tactics that appear in Table I 0 to enhance the construct validity in a Case
Study were used in this invest igat ion ; they are: mult iple sources of evidence to analyse
the same concept (dat a 11-om documentation, archival records, interviews and direct
observat ion), a chain o f evidence was establ ished, and key informants (experts in the
area) reviewed the draft case reports (these tact ics become c learer in the data analysis
sect ion).
Internal Val id ity
I ssues of internal va l id ity exist only when causal relat ionships are intended.
Consequent ly only explanatory case studies have to deal with this problem. Most of this
invest igat ion is descriptive, therefore very few "suggest ions as to causal ity" (a lso cal led
associat ions or explanatory relat ionships between concepts or categories) are planned
and no "defin ite causal" relat ionships (a lso cal led genuine causal ity or causal
relat ionships between concepts or categories) are projected. However some inferences
are made during the d iscussion. To in(er is the act or process of deriving logical
conclusions from premises known or assumed to be true. Some quest ions that can help
to increase the qual i ty of the inferences fo l low: "I s the inference correct? H ave all the
riva l explanat ions and possib i l it ies been considered? Is the evidence convergent? Does
it appear to be airt ight?" ( Y in, 2002, p. 36) .
The other tact ics that appear in Table I 0 ( pattern matching, explanat ion bui ld ing,
address rival explanat ions and use logic models) were taken into account and some
aspects of them were used during the data analys is to increase the validity o f the
inferences.
External Val idity or Genera l ization
General izat ion in case studies is c losely related to what was explained before about the
d ifferent log ics used when select ing cases in d ifferent k inds of research strategies.
Repl ication logic or purposeful sampl ing is used in case studies as opposed to the
sampl ing or "stat ist ical" logic used in surveys.
97

Chapter 5: Methodology
When a survey is done the researcher does a statistical sampl ing because the intention is
to do a stat istical generalization. B ut when a case study is done the researcher does a
purposeful sampling because the intention is to generalize to a theory ( also called
analyt ical generalization) .
Analytical (or theoretical) generalizat ion is the same logic util ized when generalizing
the results of a specific experiment. When an experiment is carried out within a speci fic
and control led environment, its results are only applicable to that phenomenon in the
same environment . This is not a problem because the original idea was not to generalize
the results to the population but to generalize to theory. The same happens with the case
studies. However in case studies and experiments, generalization is not automatic as it is
in surveys. To further generalize to theory, more experiments or case studies
(replications) must be done.
Consequently, the specific results of this research were generalized only to similar
farms in similar conditions. N evertheless, the general results and conclusions could be
t aken into account to build theory or support existing theory.
Rel iabi l ity
An investigator passes the test of reliabi lity when a later researcher can repeat the same
investigation and obtains the same results as the earlier researcher. The objective of this
test is to minimize errors and biases in a study by giving other people (a third party) the
opportunity to check the results by repeating the research. Y in (2002) suggested two
t actics to increase the reliability of a case study research (see Table 1 0) :
Al l the procedures should be documented by the utilization of data collectio n
and data analysis pro tocols.
The raw data of each farm should be organized in a case study database
available for other researchers in case they wanted to repeat the analysis.
The organization of a database for each case study will also give other researchers the
possib ility to differentiate the data collected from the analysis made by the researcher.
And it wi l l also enable the present researcher to go back to the raw data in the future if
necessary.
98

Chapter 5: Methodology
5.2 Data Col lect ion
Most of the data was co l lected in a journey by the researcher to Argent ina. The
researcher first contacted the farmers and the experts by electronic mail or by telephone
and invit ed them to pat1 icipate in the research project . The conditions were explained
and appo intments were set w ith the farms and persons that accepted. Then the
researcher travelled to Argent ina and co l lected most of the data in a period of20 days.
After returning to New Zealand the researcher kept in contact with the farmers and
expet1s in order to complete the informat ion and clari fy several po ints.
5. 2. 1 Main Data Collection Techniques
Six teclmiques were suggested by Y in (2002) to be the most commonly used in do ing
case stud ies. These techniques are similar to those proposed by M intzberg ( 1 97 3 ) for
studying managerial work and the ones proposed by Rougoor, Trip, Hu ime, & Renkema
( 1 998) tor studying managerial capacity:
Documentation
Archival records
I nterviews
D irect observat ion
Part icipant-observation
Physical artefacts
In this research mainly four of these techniques were used to study the cases:
documentat ion, archival records, interviews and d irect observat ion. The study of t he
context was done through relevant l it erature and interviews with experts.
99

Chapter 5: Methodology
D ocumentation:
There are two different types of documentation, the primary source and the secondary
source documentation (Mintzberg, 1 973 ). The primary source documentation is that
prepared by the dairy farmer himself or by people within the business. For example
written p lans, contracts, letters, memoranda, agendas, written reports of events,
proposals, formal studies, etc (adapted from Y in, 2002 and Rougoor et al., 1 998) .
People outside the dairy farm, in contrast, set up the secondary source documentation.
Examples of this are t ax data, accounting data, reports prepared by consultants in
different areas, ete (Rougoor et al . , 1 998) .
From this source of evidence very l i t t le information was col lected. Only the accounting
data of one of the farms was col lected (Farm 7). The farmers from their archival records
provided al l the other physical and financial information.
Archival Records:
Relevant physical and financial information was co l lected from the last seasons on most
farms:
Farm 1: Complete physical and financial information ofthe seasons July 200 1 -June
2002 and July 2002-June 2 003 was provided. A lso complete physical information for
the period July 2003-June 2 004.
Farm 2: Complete physical and financial informat ion of the last three seasons (periods
February 200 1 -January 2002, February 2002-January 2003 and February 2003-January
2 004) w as provided.
Farm 3: The Company has two dairy enterprises. Complete physical and financial
information of the last three seasons (July 200 1 -June 2002, July 2002-June 2003, and
July 2 003-June 2004) was col lected from one of the dairy enterprises. From the second
dairy enterprise only the information of the last season was provided.
Farm 4: Comp lete physical and financial information of the last three seasons (periods
Ju ly 200 1 -June 2002, July 2002-June 2003 and July 2003-June 2004) was provided.
1 00

Chapter 5: Methodology
Farm 5: Complete physical and financial informat ion of the seasons February 200 1 -
January 2002 and February 2002-January 2003 was provided . Also some physical and
financial informat ion of the period July 2003-June 2004 was obtained .
Farm 6: Only some general physical and financial informat ion from the last seasons
could be obtained .
Farm 7: Complete financial info rmat ion was obtained from t he last three seasons
(periods July 200 ! -June 2002, J uly 2002-June 2003 and July 2003-June 2004) . Some
physical informat ion was also obtained but not the all information needed.
Interviews :
The interviews were focus interviews also called semi-structured. This k ind of interview
fo l lows a certain set of quest ions, is open-ended and assumes a conversat ional manner.
The interviews were recorded, w ith permission from the interviewees.
Fo urteen interviews of between two and three hours were done: one with each of the
seven farmers or CEOs of the Argent ine farms; two interviews with experts in the
Argent ine dairy sector and five more within the case study farms.
I n the interviews with the Argent ine dairy farm owners and CEOs and with other people
working on the farms the researcher asked abo ut the fo llowing topics :
Their opinion and percept ion of 1 4 New Zealand innovat ions with potent iality to
be adopted in Argent ina.
Then q uest ions were asked about the adopt ion or reject ion of the innovat ions in
the farm and about the reasons for having adopted or rejected them.
Add it ional ly some quest ions were asked about the i mpact of the innovat ions on
the dairy system.
Final ly some quest ions about the possibi l it ies and constraints for adopting N ew
Zealand innovat ions to Argentine dairy farms.
T he two experts were asked about their opinions and percept ions of the same list o f
N ew Zealand innovat ions for Argent ine dairy farms. They also were asked about the ir
area of expert ise and about the ir experience in the Argentine dairy sector. Add it ional ly,
1 0 1

Chapter 5: Methodology
they were enquired of about adoption of New Zealand innovations to Argent ina in the
past. Finally some q uestions were asked about the possibil i t ies and constraints for
adopting New Zealand innovations to Argentine dairy farms.
D i rect Observation :
A field visit was made t o each case study farm. The intention was t o quickly inspect
some specific paddocks, the main buildings, the plant and machinery, and the animals
and also meet some of the people working on the farm. This observation was very
i mportant because it gave not on ly a general impression of the business but also specific
and relevant informat ion about whether the observer was correct ly prepared or had
some experience in the field.
Figure 53: Data Collection
CONTEXT Interviews with experts (Argentine Dairy S ect or)
t Literature
I / / /
I I I I
I I I \ I \ \ \
/ / /
-------- - - - -- --- - --. / '
, , , - - -Interviews
�
---F AR:--',,,
.__c_A_s_' E_o_A_T_A ____.I ' Direct
' \
I ', Documents & ' ',,,
', Records Observation /,//
..... ..... ..... ..... _ _ --- - --5.2. 2 Principles for data collection
------ , _ ,
' \
I I
\ \ \ I I I I I I I
Three principles for data co l lection were taken into account (2002) as a way to
maxim ize construct valid ity and reliabi l ity of the invest igat ion. These three principles
have been summarized by Rowley (2002) in the fol lowing way:
"Triangulation (multiple sources of evidence) one of the great strengths of case studies as compared with other methods is that evidence can be collected from multiple sources. Triangulation uses evidence from different sources to corroborate the same fact or finding.
C reate a case study database a case study database of the evidence gathered needs to be collected. Whilst a report o r dissertation may be the primary dist i llation of the case s tudy, a further outcome which strengthens the repeatabil ity of the research, and increases the transparency of the findings is a well organized collection of the evidence base. This
1 02

Chapter 5: Methodology
base may i nc lude case notes made by the invest igators, case study documents t hat are col lected during a case study, i nterview notes or transcripts, and analysis of the evidence. When preparing a dissertation it w i l l be useful to agree with a supervisor whet her some elements of this evidence base should be presented as appendices to the dissertat ion.
Maintain a chain of evidence - the researcher needs to mainta in a cha in of evidence. The report shou ld make clear the sec tions on the case study databases that it draws upon, by appropriate citat ion of documents and interviews. Within the database, it shou ld be clear that the data col lection followed the protocol, and the l ink between the protocol quest ions and the proposit ions should be transparent." (Rowley, 2002, p. 23 )
5. 2. 3 Perception Questionnaire
As was previously expla ined in the sect ion about the Diffusion Theory, the way in
which the potential adapters perceive an innovat ion can part ia l ly pred ict the rate at
which that innovat ion wil l be adopted. To have an idea of the percept ion o f the case
study farmers, the experts and other farmers, a questionnaire was designed .
The quest ionnaire comprised 1 4 pa1is in which each of 1 4 New Zealand innovat ions
were briefly exp la ined. For each innovat ion the person was asked to mark fi-om I ( very
low) to 4 (very high) for four characterist ics. These were, "Level o f Advantage", "Level
of Compatibi l ity", "Level of Trialabi lty", and "Level of Awareness of Results".
I n total 29 quest ionnaires were answered by three d ifferent groups of Argent ine people:
I ) 1 4 persons in the seven selected Argentine dairy farms, 2) five Argent ine fanners that
can be considered neutral about the New Zealand innovat ions, and 3 ) n ine consult ing
officers of an Argent ine inst itut ion of d iscussion groups. A summary of the results
obtained is presented in the first chapter of results (Chapter 7) .
5.3 Data Analysis
As Rowley ( 2002) stated "there are no cookbook procedures that have been agreed for
the analysis o f case study results, but good case study analysis adheres to the fo llowing
principles:"
"The analys is makes use of a l l the relevant evidence.
The a nalysis considers a l l of the major riva l i nterpretations, and explores each of them i n turn.
1 03

Chapter 5: Methodology
The analysis should address the most significant aspect of the case study.
The analysis should draw on the researcher's prior expert knowledge in the area of the case study, but in an unbiased and objective manner" (Rowley, 2002, p.24, i s a summary of Yin 2002, p. l 37- 1 38) .
5. 3. 1 The Context
Some characteristics of the Argentine socio-economic environment and the main
characteristics of the Argentine dairy sector were described. To complement data from
the l iterature two experts were interviewed and the previously explained perception
questionnaire was completed by some Argentine farmers, consultants and experts.
The interviews were analysed by transcribing the relevant ideas from the tapes to a word
processor and ordered b y the topics o f interest. Then the relevant ideas regarding the
Argentine dairy sector were translated to English and reported into the t1rst chapter o f
results (Chapter 7 ) of the present report.
5.3. 2 The Cases
Qualitat ive and quantitative data were obtained from each farm.
The qualitative data col lected through the interviews, the questionnaires and the visit to
the farm was analysed by selecting the important information for the topic studied. The
interviews were analysed in the same way as described before tor the experts'
interviews. The data from the interviews was complemented by the data of the
questionnaires and the visit to the farm.
The quantitative data from the farms was analysed with the I FCN spreadsheet. The data
from each farm from the 2002 and 2003 seasons was processed (excluding Farm 6).
The main indicators that resu lted from the spreadsheet analysis were then presented and
analysed in the second results section of the present report (Chapter 8).
Fo l lows an explanation of the main modifications done to the financial and physical
data collected from the farms in order to make them comparable and in order to
introduce it in the I FCN database:
1 04

Chapter 5: Methodology
Farm 1: Seasons 2002 and 2003 were loaded to the I FCN database. The financial data
was original ly in nominal AR-$ for each period and a l l the figures excluded GST. Only
the data from the dairy enterprise was used; this enterprise bought the replacement
heifers and the concentrates and silages from other enterprises ofthe same company.
The farm provided the prices at which the concentrates and silages were bought . The
cropping enterprise of the farm sold the concentrates and silages at market prices. The
prices of replacement heifers were taken from the I FCN database and were the same for
all the farms. Farm I was the only farm in which the raising of the heifers was not
analyzed as part of the dairy enterprise.
Farm 2: Seasons 2002 and 2003 were loaded to the I FCN database. The financial data
was originally in nominal AR-$ for 2003 and all the figures excluded GST. However
the financial data for the 2002 season was originally adjusted by the who lesale price
index, therefore was converted again to nominal AR-$ in order to be compared to the
other farms. On ly the data fTom the dairy enterprise was used; this enterprise raised al l
i ts own replacement heifers and bought the concentrates fi·om the cropping enterprises
of the same company. The farm prov ided the prices at wh ich the concentrates and
si lages were bought. The cropping enterprise of the farm so ld the concentrates and
si lages at market prices.
Farm 3: The data had the same characteristics to Farm 2 's data; therefore the same
mod ificat ions were done.
Farm 4: Seasons 2002 and 2003 were loaded to the I FCN database. The financial data
was originally adjusted by the wholesale price index, therefore was converted again to
nominal AR-$ in order to be compared to the other farms. The original data had the
same characterist ics to Farm 2 's data in respect to replacement heifers and concentrates
bought .
Farm 5: Only the 2002 season was analysed. The financial data was original ly in
nominal AR-$ for 2003 and all the figures excluded GST. The original data had the
same characteristics to Farm 2 's data in respect to replacement heifers and concentrates
bought .
Farm 6: Only some general physical and financial information from the last seasons
could be obtained.
1 05

Chapter 5: Methodology
Farm 7: The financial accounts from 2002 and 2003 were provided. They were in
nominal AR-$. The original data had the same characteristics to Farm 2 's data i n
respect t o replacement heifers and concentrates bought . This was t h e only farm w it h
unpaid fami ly l abour, the wages per hour o f fami ly labour provided b y the I F CN were
used to calcul ate the total labour costs.
1 06

Chapter 6: New Zealand Innovations for Argentina
6 N EW ZEALAN D I N NOVATIONS FOR ARGENTINA
6.1 Selection of the New Zea land i nnovat ions
The select ion o f the ew Zealand innovat ions for the present study was based on three
sources: the knowledge and experience o f Argentine farmers who are adopting ew
Zealand practices and technologies; relevant literature and articles in the rural press that
describe the typical pract ices and techno logies ofboth countries; and the knowledge and
experience o f t he researcher on Argent ine and New Zealand dairy farm systems.
The criteria for the selecting the New Zealand innovat ions was as fo l lows:
The principles, pract ices and techno logies have to be typicai 1 R o f N ew Zealand
dairy systems and not common on Argent ine farms.
The innovations must have been adopted, at least part ia l ly, on one Argent ine
dairy farm.
The innovat ions selected have to cover the main aspects of a dairy system.
Some of the principles, pract ices and techno logies that were chosen as New Zealand
innovations may be also found in other countries, or may have been suggested as
recommended dairy farming pract ices by researcher and developers in other parts o f
the world. However i n e w Zealand, these principles, pract ices and techno logies are
actually being used and considered normal and typical.
I nit ial ly, the researcher ident ified a l ist of 1 4 practices and ideas that matched the above
criteria. This l ist was sent to two of the most renowned Argentine dairy farmers who
have adopted N ew Zealand innovations. Both ofthem approved the l ist and suggested
some small changes. I n New Zealand, N ico la Shadbo lt and Colin Ho lmes, who are
18 Note that ' typica l ' means characteristic of New Zealand fanns, which is not the same as more frequent. For example, ' formal pastoral budgets' are not used in most New Zealand fam1s (Gray, 200 I ) but they are recommended by most New Zealand consultants and used by many top New Zealand fanners ( Dexcel, 2003) and are probably more spread throughout New Zealand than any other country in the world ( Hodgson, 1 990; Holmes et a l . , 2002).
1 07

Chapter 6: New Zealand Innovations for Argentina
experts on N ew Zealand dairy farm business and systems respectively, concurred that
the innovations suggested were typical tor N ew Zealand farmers.
I n addition, in order to include all the relevant N ew Zealand innovations, during the
data collection, the farmers and experts interviewed ( 1 4 people within the seven case
studies farms and two experts in the Argentine dairy sector) were asked about the group
of 1 4 innovations selected. Most of them agreed that the list was complete and that it
covered the main points of a dairy system.
Once the data had been co llected, it was decided that tour ofthe innovations were not
sufficiently relevant or that they could be combined with other innovations, therefore
the analysis includes 1 0 N ew Zealand innovations.
Table 1 1 : Selection of New Zealand Innovations for Argentina
Original I nnovations Proposed ( 14) Final Selection of Innovations ( 1 0)
1 ) S tocking rate decided taking into account 1 ) Focus on production per hectare prices of milk and supplements 2a) Intenti on to rai se the phosphate level of 2) M arked importance to pasture product ion soi l s of the farm 2b) Intent ion to have pastures that last more than 4 years without the need to replant them 2c) Ut i l izat ion of adequate species on pastures 3a) Quantitative pasture monitoring 3) Quantitative pasture monitoring 3b) Target pre and post grazing pasture covers 4) Ut i l izat ion of formal pastoral budgets 4) Ut i l ization of formal pastoral budgets 5) M ore 'technology ' and less working hours 5) Less than 15 cows per set of teat-cups, and
other innovations that impact on labour productivi ty
6a) S ki l l ed and motivated people working on 6) Skil led and motivated people working on farms farms 6b) Working contract similar to New Zealand share-mi lking contracts 7) S easonal calving, one or two calving 7) Seasonal calving, one or two calving periods periods 8) N ew Zealand genetics 8) New Zealand genetics 9) Rearing of calves in groups 9) Rearing of calves in groups 1 0) S tyle of milking shed and mi lk ing system 1 0 ) S tyle of milking shed and milki ng system
1 08
Chapter 6: New Zealand Innovations for Argentina
6.2 Defi n itio n of New Zealand innovations for
Argenti na
I n th is section each innovat ion is defined by d i fferent iat ing the typical Argent ine
pract ices from the ew Zealand innovat ions. Add i t ional ly, the indicators and criterions
that were used to assess the acceptance or reject ion of the New Zealand innovat ions on
the case studies are defined.
A l l the innovat ions selected are integral parts of a system. They were separated here in
order to better understand and d ifferent iate one from the other. The sequence in which
they are presented below runs from general to part icular and from principles to
techno logies.
1 ) Focus on Production per Hectare
Milkso l ids produced per hectare is the ult imate measure of physical performance in
ew Zealand dairy farms ( Holmes et al . , 2002 ) . New Zealand dairy farmers and
researchers have been tradit ionally focused on maximizing milk production per unit of
area; the management of stocking rate has been one of the key drivers of product ivity of
the farm and land ( MacDonald e t a l . , 200 I ; Pen no , 1 999).
In New Zealand there is an ongo ing debate between farmers who prefer to have higher
product ion per cow and a lower stocking rate, and other farmers that prefer exact ly the
opposite. Even though farmers who have a preference for lower stocking rate, and are
targeting higher per cow production, may seem to be focused on cow product ivity, they
are ult imately interested in producing as much m i lkso lids per hectare as possible, the
only d ifference is t hat they prefer to do it with a lesser number of cows.
I n Argent ina, as in New Zealand, l and is more than half of the total assets of t he typical
dairy farm. I t comprises more than 55% of the total assets in New Zealand typ ical farms
and more than 75% in Argentine typical farms ( I FC , 2003). Therefore land can be
considered as the main asset o f the dairy farm business. Despite this fact t he focus on
production per hectare is not so clearly defined in Argent ina where researchers and
typical farmers seem to be more focused on productivity than in New Zealand
(Castignani & Zehnder, 2003 ). Very often in Argentina the cow productivity is seen as
an end in itse lf; several farmers have a target milk production per cow but do not know
1 09

Chapter 6: New Zealand Innovations for Argentina
how much they should be producing per hectare (researchers experience in Argentine
dairy farming).
Accordingly, a clear Focus on production per hectare is considered an innovat ive
principle for typical Argentine dairy farms. To assess the adoption or rejection of this
innovation the case study farmers were asked questions in order to assess if they were
more focused on productivity per hectare or productivity per cow.
To fo llow this principle, without necessarily increasing the level of supplements, New
Zealand systems try to maximise the amount and quality of feed produced per hectare
and optimise the utilisation of that feed by the cows (Holmes et al. , 2002).
2) G ive Marked Importance to Pasture Production
In New Zealand there is a clear focus of farmers on trying to maximize the productivity
and vigour of pastures in their farms. Farmers, oriented by research, use specific levels
o f fertiliser inputs, and utilise certain grazing techniques in order to maximise growth,
quality and amount eaten from their pastures. Phosphate fertiliser is spread annually in
order to keep recommended levels of phosphate in the soils (Thomson, Roberts,
McCallum, Judd, & Johnson, 1 993 ). Additionally, farmers look after their pastures,
trying not to graze them too intensively in order to promote re-growth (especially in
w inter). They also do "on-off !,:rrazing", "24 hour grazing", "square breaks", and other
practices to prevent damage to pastures by the cows on wet days (Clark , Carter, Walsh,
C larkson, & Waugh, 1 994; Pande, Valentine, Betteridge, MacKay, & Home, 2000;
Thomson & al, 1 993) . Very o ften N ew Zealand farmers are recommended to give
priority to their pastures over their cows in s ituat ions in which they have to decide
which of the two would lose condition the most ( Lamboume & Betterridge, 2004) .
N ormally in N ew Zealand the durability of pastures is not an issue and they last several
decades without the need for re-sowing.
I n contrast, pastures very rarely last more than four years in Argentina. The causes are
unknown, but it is not common to fertilize pastures or to leave optimal residuals for re
growth, which must contribute to this lack of longevity. I n Argentina a typical farmer
would give priority to the cows over the pastures in situations in which o ne of the two
have to lose condition in some degree (interviews with experts, farmers and
consultants) .
1 1 0

Chapter 6: New Zealand Innovations for Argentina
Therefore the principle o f Focusing on pasture production was considered to be the
second N ew Zealand innovat ion for Argentine dairy farmers. The ind icators used to
assess the adoption of this innovation by the case study farms were mainly four:
Ask about the actual levels of phosphate in so ils and if they had the intent ion to
raise the phosphate levels to those recommended by experts to be more suitable
for optimum pasture production.
Ask them if they were do ing any kind of special management to look after t he
pastures in order to increase the durability of the pastures ( for example leaving
minimum residuals at certain t imes ofthe year, or prevent ing cows from
damaging the pastures during wet cond itions).
Ask if they were actively looking for pasture species that better suit their
production systems and eco logical cond itions.
Assess whether they would give priority to the cows or the pastures in the case
that they have to choose which would have to lose condit ion.
As previously stated, to maximise milk product ion per hectare ( ftrst ew Zealand
innovat ion) it is important not only to produce as much grass as possible (second ew
Zealand innovation) but also to ut il ise efficient ly the grass produced. Two New Zealand
pract ices that assist farmers to better util ize their pastures were defined as N ew Zealand
innovat ions to Argentine farms: Quantitative Pasture Monitoring (th ird New Zealand
innovat ion) and Utilisation o_(Forma/ Pastoral Budgets ( tourth New Zealand
innovat ion).
3) Quantitative Pasture Monitoring
Pasture is the main feed of dairy cows in typical N ew Zealand and Argentine dairy
farms ( I FCN, 2002) . Therefore, efficient grazing management is relevant for farms in
both countries.
It is wel l known that N ew Zealand farmers rely more on pasture than probably any other
farmers in the world ( M itchel l , 2002) . This situation is generated by, among other
things, t he fact that pasture is by far the cheapest feed in New Zealand (Holmes, 2 003a) .
I l l

Chapter 6: New Zealand Innovations for Argentina
Over the years, with the help of research and extension, N ew Zealand farmers have
developed effective pasture management skil ls (McCall & Sheath, 1 993) .
For reasons that are beyond the scope of the present study, Argentine farmers,
researchers and consultants have not been so interested in pasture management as their
counterparts in New Zealand (researcher's experience in Argentina and interviews with
several Argentine dairy farmers and experts). However, to improve the general
efficiency o f Argentine dairy farms, a l l the resources must be wel l managed and grass is
an important resource for Argentine farmers. I n this context, Argentine farmers may
benefit from research and best practices of farmers in New Zealand.
Pro fessor John Hodgson, a renowned scientist in grazing management both in the
U nited Kingdom and in New Zealand, stated that "the regular appraisal of sward
conditions is an important prerequis ite of efficient grazing management" (Hodgson,
1 990, p. l 8 1 ). He also suggested that the adoption of etlective recording programs cou ld
greatly increase management objectivity.
It is common to find farmers in N ew Zealand who regularly measure the pasture cover
( in k i lograms of dry matter) of their paddocks and farms, and record the measurements
on paper or computer spreadsheets ( Hodgson, 1 990). This quantitative recording year
after year gives them an estimate of the total pasture production of a typical season.
They can use the information to approximately assess at which t imes of the year the
pastures growth rates are h igher or lower. The ability to assess the cover of their
pastures at a certain moment in time enables them to set pasture cover targets for
different t imes of the year. Addit iona lly, they can decide pre and post grazing covers
based on research that investigated the optimal covers of pastures at different times of
the year.
F inal ly, the recording of pasture cover through several seasons a l lows farmers to do
feed or pasture budgets. The accuracy of the estimations done on the budgets depends
on the qual ity of the data recorded in the previous years.
To assess if the Argentine farmers were quantitatively monitoring and recording pasture
they were asked if they actually have a recording programme for pasture growth (or
pasture cover) during the whole season.
1 1 2

Chapter 6: New Zealand Innovations for Argentina
4) Uti l isation of Formal Pasture Budgets
The last New Zealand innovat ion related to the principle of maximizing product ion per
hectare is the Utilisation C!fformal pasture budgets.
As with any kind of budget ( for example financial budgets), pasture budgets are a
balance between demand and supply, outputs and inputs. The demand for feed is given
by the total requirements of the animals on a farm for a certain period of t ime in the
future. And the supply is given by the est imated average growth of the pastures of the
farm during the same period of t ime. Pasture budgets are useful to ant ic ipate periods of
pasture surplus and deficit, and to allow farmers to plan in advance ( Hodgson, 1 990;
Hopkins, 2000).
Some farmers do pasture budgets mentally; they do not use paper or computers to
ca lculate the d i fferences between pasture growth and animal requ irements (Gray, 200 1 ) .
I n the present study, only feed budgets that are recorded on paper or computer ( formal
pasture budgets) were considered to be New Zealand innovat ions because this provided
a basis tor assessment of the extent to which the innovat ion has been adopted.
5) Ski l led and Motivated People Working on Farms
I n the present study "people working on farms" means people that l ive on and are in
charge of the dai ly act ivit ies of the dairy farm. They are people that work on the farm
and do the act ivit ies that are inherent to a dairy farm ( feed ing, milk ing, and looking
after the health and reproduct ion of cows) .
One of the strengths of the N ew Zealand dairy sector is that most people on farms are
energet ic, posit ive, technical ly ski lful and opt imistic (Holmes, 2003b). This is a very
important characterist ic of the New Zealand dairy sector and probably one of the drivers
o f its success.
I n ew Zealand, most dairy farms (63% of all herds) are owner-operated; owner
o perators are farmers who either own and operate their own farms, or who employ a
manager to operate the farm for a fixed wage. Managers employed by landowners were
l ess than I % of all owner-operated herds in 200 I ( LI C, 200 1 102), therefore more t han
60% of all N ew Zealand dairy farms are operated by their owners. Add it ional ly, people
1 1 3

Chapter 6: New Zealand Innovations for Argentina
working on farms are at same t ime the owners of the main dairy company (see section
3 . 1 .4).
In Argentina, by contrast, the levels of skills possessed by staff working on farms have
been suggested as one of the main weaknesses of the Argentine dairy sector (Guardini,
Labriola, & Schaller, 1 999) . This fact has an impact on the performance of the
Argentine dairy systems and also on the Argent ine dairy sector in general.
Accordingly Skilled and Motivated People Working on Farms was defined as a N ew
Zealand innovation for Argentine dairy farms. However the level of ski lfulness and
mot ivation of the people working in the case studies was very difficult to assess in such
a limited t ime (20 days of data collection). Motivation is very related to ownership and
ambit ion ; therefore the owners and the employees that want to grow in the dairy
business are usually the most motivated people. In addition, people can be more
mot ivated to work towards increasing a dairy farm's performance if they are associated
to that performance. Skilfulness, on the other hand, is more related to education and
training.
S everal indicators were used to assess the adoption of this New Zealand innovation:
A meeting with the main operator of one dairy farm ( for each case study farm)
in order to assess his motivation and skilfu lness.
The level of education of people working on farms ( for example, years of formal
education before start working on the job, specific formal training for the job,
and other).
Existence of "on the job training" by people of the farm that have more
experience or knowledge than them.
Observation of the working environment (technology provided, milking shed
characteristics, roads and races, and other details).
The job conditions (working hours per day and per year, milking times, time off
and ho lidays, and wages) were related in some degree with the level o f
skilfuln ess. I t was assumed that farmers who are looking for more skilful people
o ffer better job condit ions.
1 1 4

Chapter 6: New Zealand Innovations for Argentina
Assessment of the possib i l it ies given to the people working on the farm to grow
i n the dairy farm business ( for example, by increasing the level of responsibi l it y
when they are more experienced, by part ic ipat ing i n the resu lts of the farm) .
6) Less than 1 5 cows per Set of Teat-cups, and Other Innovations that Impact on Labour Productivity
I n New Zealand dairy farms there is approximate ly one person for each I 00 to 1 40 cows
( J FCN, 2002) . This relat ionship of cows per person is the highest in the world ( J FC ,
2002) . I n order to complete al l the dai ly act ivit ies, New Zealand farmers have to be very
effic ient with their t ime. They accomplish this by ut i l izing adequate technologies and
also by designing relat ively simple systems.
Every day, during the t ime when the cows are lactat ing, the dairy farmer has to mi lk the
cows. This job is done for approximately four hours per day for 250 to 300 days a year
( Holmes et al., 2002 ). "M ilk ing, is therefore a major factor in the work routine on al l
dairy farms" (Ho lmes et al . , 2002, p. 1 55) . The number teats-cups has a big impact on
the tota l mi lk ing t ime, the more sets ofteat cups the faster it is to milk the same number
of cows; up to a l imit (usual ly 25 set of teat-cups per person) in which the person can
not attend so many sets of teat-cups. Therefore the number of cows per set of teat-cups
has a big impact in the labour productivity of the farm (see Holmes et al., 2002). I n N ew
Zea land typical farms 1 5 cows, or less, are mi lked per set of teats-cups. This
re lat ionship is relat ively low in comparison to most of dairy farm systems around the
world ( J FCN, 2002).
Other techno logies normally ut i l ised are, for example, motorbikes, front loaders on
tractors, posthole borers, automat ic teat spray, automat ic effluent spreaders, motorised
backing-gates, overhead backing gate, and automatic systems to wash the co l lect ion
yard. Add itiona l ly many dairy farms in New Zealand use contractors to do the main
"non-dairy" work ( for example, s i lage conservat ion, cult ivat ion, fencing and farming
development), th is increases the labour product ivity of the dairy farmers.
In Argent ina, on a typ ical farm, there is one person for each 40 to 60 cows ( I FCN,
2002). Dairy farmers in Argent ina spend most of their working t ime mi lking the cows
because nonnal ly more than 25 cows are milked per set of teat-cups. I nstead of the other
techno logies used in New Zealand, horses are used instead of motorbikes and a
1 1 5
Chapter 6: New Zealand Innovations for Argentina
characteristic example is that usually people use spades to dig postholes tor fences
instead of using posthole borers as in N ew Zealand (researchers experience in Argentine
dairy farms) . In Argentina, tor all previously mentioned things, typical farms are more
labour intensive than those ofNew Zealand.
To assess the adoption or rejection of this innovation, tour aspects were assessed:
N umber of milking cows per set ofteat-cups.
Util ization of other technologies as motorbikes, front loaders on tractors,
postho le borers, automatic teat spray, automatic et11uent spreaders, motorised
backing-gates, overhead backing gate, and automatic systems to wash the
collection yard.
S implicity of the systems, as tor example simplified milking routine.
In addition the farm owners were questioned about their preferences tor either a
system that employs more labour and usually invests less in p lant, machinery
and buildings; or a system that employs less people but invests more in p lant,
machinery and buildings.
7) Seasonal Calving, One or Two Calving Periods per Year
On the majority ofNew Zealand dairy farms, the whole herd calves during a period o f
about 1 2 weeks in late winter and early spring (Garcia & Ho lmes, 1 999; LIC, 2002/03) .
This is done in order to match the daily feed requirements of the herd with the daily
pasture growth, which is the main teed for most ofNew Zealand herds. Consequently a
big proportion of the pasture grown is harvested directly by the cows at the lowest
possib le cost (Garcia & Holmes, 1 999; Holmes et al., 2 002; M itchell, 2002) .
I n marked contrast, nearly all the dairy farms in Argentina have some cows calving in
every month ( Garcia, 1 997) . The main cause of this is probably the tact that most of the
milk produced is used to supply the local Argent ine market which needs a relatively
constant supply o f milk during the whole year (Gutman et al. , 2003) . Consequently,
most o f the Argentine dairy companies encourage winter and summer milk production,
when feeding is more expensive, by raising the price of milk ( interviews with farmers,
experts and consultants). But despite this constraint some Argentine farmers have
1 1 6

Chapter 6: New Zealand Innovations for Argentina
adopted seasonal calving systems successfully, and some ofthem st i l l produce most o f
their milk during the periods in which t he mi lk price i s higher (examp les are al l case
study farmers interviewed apart from Farmer 4) .
To assess whether t he Argentine farms were calving seasonal ly or all year round, the
farmers were asked about their herds' calv ing period. Calving periods shorter than four
months were considered seasonal. Those farms with spl it calving were considered
seasonal only i f both calving periods were also shorter than four months each.
8) New Zealand Genetics
New Zealand cows are known for having been selected under cond it ions of seasonal
pastoral dairy systems. Therefore these cows are able to conceive every year, and are
prepared to walk long d istances and harvest grass as the ir main feed ( L I C, 200 I ) . The
fact that large numbers of cows are mi lked per person, in comparison to other countries
( I FC , 2002), ensures that cows that need special treatments (for example, need udder
st imulat ion before milk ing, have bad temper or arc s lower to get mi lked) have
tradit ional ly been cul led ( Holmcs et al., 2002). More recently, longevity, udder and
body conformat ion, and reproduct ive performance have been introduced to the select ion
criteria ( L I C, 200 I ) . Another characteristic is that New Zealand cows produce more
concentrated mi lk, which is preferred by the ew Zealand dairy companies that are
oriented mainly to overseas markets ( LI C, 200 1 ) .
I n Argent ina dairy cows are mainly Ho lstein, but some cows have a h igh degree of
North American Ho lstein whi le at the other extreme some cows have a degree of o ld
Friesian genetics ( AC H A, 2000). There is a t rend to increase the genetic merit of
Argent ine Holstein cows, mainly by ut i l isat ion ofNorth American bul ls ( researcher' s
experience in Argentine dairy farming and interviews with farmers) . North American
cows have been selected to produce high vo lumes of milk, mainly in confinement
systems where they are fed with total mixed ration (TM R). They can consume very h igh
amounts ofthese d iets and convert them efficiently to large vo lumes of mi lk ( Mayne,
1 998) .
The criteria used to assess if the Argent ine farms were using N ew Zealand genet ics was
simply by asking farmers if they were using New Zealand genet ics, and also what
proportion of the cows and hei fers were being inseminated with New Zealand semen.
1 1 7

Chapter 6: New Zealand Innovations for Argentina
9) Rearing of Calves in G roups
On most dairy farms in Argentina calves are reared in individual cages or tied to a chain
and fed with milk or milk substitute in buckets. Each calf has two buckets, one for the
milk or milk substitute and the other for water. The person that feeds the calves fil ls the
buckets once or twice a day. Occasionally the calves are moved to keep the ground or
pasture under the calf clean (AACREA, 1 986).
Conversely, calves are reared in groups in small paddocks on N ew Zealand dairy farms.
I nstead of drinking the milk or substitute from buckets, groups of calves suck through
"calf-teats" from a container; a barrel of200 litres can be used (Holmes et al. , 2002) .
To assess if the Argentine farmers were doing Rearing olCalves in Groups they were
asked which calf rearing system they were using for most oftheir calves.
1 0) Style of M i l king Shed and M ilk ing System
The most typical N ew Zealand milking sheds (also called "farm dairies" or "cow
sheds") have one concrete waU and are open on three of the four sides. The most
common milking systems are the high-line single herringbone parlours (also called
"swing over" parlours). This system usually has a central high pipe with sets of teat
cups hanging from it (Holmes et al. , 2002) . These sheds and systems are designed so
that the cows can be brought from paddocks and milked in the least possible amount of
time, and then returned to the paddocks again. They are characterized by their simplicity
and relatively low cost. Nowadays rotary milking sheds are becoming increasingly
popular, especially on bigger farms (more than about 500 cows).
I n N orth America, milking sheds are usually more complex, most of them are built in
s imilar way to houses and offer more protection against the weather conditions than in
N ew Zealand. U sually they have two pipe lines with sets of teat-cups ( IFCN, 2002). In
North America cows usually spend more time inside the milking shed than in New
Zealand because they produce more milk per cow and because the milking routine
includes more tasks, and is longer. There are also rotary milking sheds on some North
American dairy farms ( IFCN, 2002) .
Argentine milking sheds are somewhere intermediate between those ofN ew Zealand
and North America. Typical Argentine milking sheds have two walls, two pipe lines and
1 1 8

Chapter 6: New Zealand Innovations for Argentina
sets of teat-cups ( I FCN, 2002) . I n general cows spend more t ime in t he mi lking shed in
Argent ina than in New Zealand because the mi lking routine is more complex but after
the milking they return to pastures as in New Zealand (AACREA, 1 986; Ho lmes et al . ,
2002).
Direct observat ion of the milking shed and sunound ings was used to classify the
Argent ine farmers into those that util ise or not the ew Zealand Style of Milking Shed
and Milking System.
1 1 9

Chapter 7: Results (Part 1)
7 RESULTS (Part 1 )
The Results o f the present study are presented in two chapters. In the first chapter
(Chapter 7 ) the case studies are presented and issues related to the adoption or rejection
ofNew Zealand innovations are addressed. I n the second chapter (Chapter 8) the
performance of the case studies in 2002 and 2003 is analysed and the impact of the
innovations adopted is assessed.
7 . 1 The Case Study Farms: Adoption and Reject ion of
New Zealand I nnovat ions
The seven farm businesses chosen as cases studies are medium to large dairy farms by
Argent ine standards . They are larger in cow numbers and hectares than the Argentine
average dairy farm (Gambuzzi et al. , 2003); and larger than the typical farm chosen by
the I FCN (2002) as the major contributor to Argentine milk production. Addit ionally,
four of the case studies can be considered of a very large scale with more than 1 ,500
cows.
The cases are described from the largest to the smallest in number of cows for the last
season analysed (2003 ) .
For the complete description o f each New Zealand innovation please refer to section
6 .2 .
In the methodology chapter in section 5 . 1 .4 the way in which the case studies were
selected is explained.
1 20

Chapter 7: Results (Part 1)
Table 1 2 : Case Study Farms Outlook (season 2003)
FAR M S Total Area Stock Cows M i l k M i l k M i l k % of feed Approx Total Cows Number Cows COWS uti l ised -mg l ive produced produced produced brought market people per of per
(a vera- for COWS Rate weight per year per COW per ha fi·om value work ing on person mi lk ing set of ge for and (cow (kg) ( 1 000 of kg (kg (kg outside of land the dairy sheds teat-
the heifers per ECM 19) EC M ) EC M ) the area (US- enterprise cups season) (has) ha) $)20 ( labour
units) Farm I 6,350 2,603- 2 .44 605 29,744 4,684 1 1 ,427 ' 43% 2,500 70.4 90 1 8 25 Farm 2 2,530 1 ,435 1 .76 424 1 2,372 4,890 8 ,622 49% 1 ,400 25 .7 98 3 25 Farm 3 1 ,700 1 ,665 1 .02 500 8 ,839 5 ,200 5 ,309 39% 2,000 20.0 67 3 26 Farm 4 1 ,375 780 1 .76 400 6,697 4,87 1 8 ,587 55% 2,000 25 .5 69 I 24 Farm 5 9 1 5 39 1 2 . 34 442 3,750 4,099 9,593 63% 1 ,400 9 .2 1 00 I 30 Farm 6 4004 25o-- 1 .604 5 20 1 ,9544 4,8864 7, 8 1 8"' 0%4 2 ,000 8 50 I 20 Farm 7 400 600 0 .67 432 1 , 557 3,735 2,596 60% I ,400 3 .4 1 1 9 1 25
---
1 9 Energy Converted Milk ( ECM) with 4% fat and 3 .3 'Yo protein . Fonnula used for adjustment: E CM = (milk production in litres * ((0. 383 * %fat + 0. 242 * %protein + 0. 7832)13. 1 138). 2° Calculated based on the market value of land for the typical Argentine farms ( I FCN, 2004) 2 1 Farm I is the only fann in which the area for raising the heifers is not included. for all the other fanl1S the hectares include al l the area used for lactating and dry cows, plus the area uti l ised for rearing the hei fers. 22 The data for Farm 6 was estimated from data given during the interview with the fanner (no fam1 records provided) .
1 2 1

Chapter 7: Results (Part 1)
7. 1 . 1 Farm 1
General C haracteristics
The Farm Business
Farm 1 is a dairy enterprise owned by a large company. This company is also the owner
o f more farms (dairy, cropping and beef farms) and some other agribusinesses. The
company has a long tradition in dairy farming (since 1 930) and is well known in the
region where the dairy farm is situated. As was mentioned in the methodology chapter
(section 3 . 1 .4) no further details are given for confidentiality reasons.
Farmer 1 (see below) mentioned that ' . . . today what we want is to produce milk as
efficiently as possible, at the lowest cost, with a pastoral ,\ystem helped hy the
supplements that we have . . . '
The Farmer
The person who was interviewed is the Chief Executive Officer (CEO) ofthe farming
d ivision of the company. For confidentiality reasons in this report he is called ·Farmer 1 .
This person i s responsible ( among other things that are not related t o the present study)
for the main tactical decisions of the dairy enterprise. He is also responsible for making
most of the strategic decisions; however the approval of the owners of the company is
needed for strategic decisions.
Farmer 1 is a cosmopolitan person who reads many farming-related journals from
several areas of Argentina and other parts of the world. He has travelled to N ew
Zealand, Australia and the United States of America to learn about other farm systems.
Some aspects of the N ew Zealand dairy systems (some of them also found in Australia)
have attracted his interest and have been implemented in some of the company' s dairy
farms.
Feeding Sources
• 57% of total annual requirements for the cows (lactating and dry) are produced
on the milking p latform (grazed lucerne and lucerne silage).
1 22

Chapter 7: Results (Part 1)
F igure 54: Feeds Eaten by Farm 1 Cows
Feeds eaten by Farm 1 cows ( percentage of total annual req uirements)
Grains and
other feedstuffs
Maize and
silages
2 1 % Lucerne silage
1 2%
Grazed lucerne
45%
• The company produces most of the feeds that are used in the dairy enterprise;
the cropping enterprise sel ls the grains to the dairy enterprise at market prices.
• "Other feedstuffs" are: maize grain, wheat bran, toasted soybean of broken or
smal l beans, brewers' grains, cotton seeds, and sunflower expel ler.
Adoption and/or Rejection of New Zealand Innovations
1 ) F ocus on Production per Hectare :
Farmer I ment ioned during the interview that the company wants to maximize
t he product ion of mi lkso l ids per hectare.
Farmer I showed the researcher a report that he prepared for a seminar abo ut
production systems in which he describes the main areas that, accord ing to his
experience, affect t he product ion per cow. These were: feed ing, reproduct ion,
health, and genet ics. Then he related product ion per cow to stocking rate, as the
two main factors t hat affect the product ion per hectare. The u lt imate physical
ind icator for h im was product ion per hectare. Therefore t he focus of Farm 1 is
very similar of that of typical N ew Zealand farms.
Farmer 1 ment ioned in the interview that the company tries to add value to its
produce as much as possible. The dairy enterprise ut i l izes some o f the soybean
and maize grain from the cropping enterprise with the object ive of convert ing it
to mi lk.
T his innovat ion was completely adopted in Farm 1 (mark= ! 00%).
1 23
Chapter 7: Results (Part 1)
2) G ive Marked Importance to Pasture Production :
Al l pastures in Farm 1 are o f composed of lucerne (also called alfalfa) and white
clover.
Farmer 1 mentioned that they would like to increase the durability of their
pastures.
The management of the pastures and the levels of fertilization used were typical
for the region. No special management or fertilization was mentioned.
Farm 1 is not really focused o n pasture production. This innovation is just
starting to be taken into account ; at the moment of the visit to the farm this
innovation did not seem to be an aspect in which they though they shou ld
improve too much (mark=25%).
3) Quantitative Pasture Monitoring :
Each paddock with lucerne is hlTazed or cut between five and six t imes per year.
I t was a common practice in Farm 1 to measure mass production of selected
paddocks at certain t imes o f the year. Farmer 1 considered that this was not
enough and that more measurements should be made.
'Th is L'>' probably the most lacking and problematic aspectfhr us ·, Farmer 1
stated about pasture management. ' We should start by implementing the
methodology of' measuring grass '. ' We are thinking of' establishing a .<.ystem in
1-thich university students could come to get farming experience and at the same
time they would provide the service ofmeasuring pasture coverfor the firm '.
This innovation is just starting to be taken into account for adoption in Farm 1
( mark=25%).
4) Uti l ization of Formal Pasture Budgets:
A yearly feed budget is drawn up; this budget is more focused on supplements
and concentrates than on pasture.
1 24

Chapter 7: Results (Part 1)
Cows usually eat all the avai lable l ucerne and the farmer tries to complete their
requirements with supplements. I n the periods in which the lucerne grows more
than the cows' requirements, paddocks are closed, and it is conserved in the
form of hay (bales) or s i lage (p it/stack).
Formal pasture budgets are not used, they use a yearly feed budget ; therefore,
this innovat ion was not adopted in Farm I (mark=O%).
5) Ski l led and Motivated People Working on Farms:
During the visit to this farm i t was not possible for the researcher to meet the
main operator of one dairy farm or to see the working cond it ions. However, the
researcher had prev iously visited the Farm 2 years before and had the
opportunity to visit ome of its dairy farms and to talk with some of the farmers.
The C EO confirmed that there were few changes in the labour structure since
that v is it .
Farm I has quite a vert ical labour structure. There is a "management team" that
is formed by the CEO and a group o f veterinarians . E ach veterinarian is in
charge of a group of da iry farms (approximately 6 farms each) and is responsible
for mak ing the main tact ical decisions in those dairy farms. In charge of the
basic activ it ies of each farm there is a dairy farmer ( for whom the main act iv ity
is the mi lking of the cows) and h is fami ly. Add it ional ly, in some of the larger
dairy farms within Farm I, some workers are employed.
I n tenns of formal educat ion, the CEO and the veterinarians have at least 5 years
of tertiary educat ion. Most of the dairy farmers finished primary schoo l ( first 7
years o f formal educat ion ) and some of them also fin ished secondary school ( 5
more years); but usual ly they had not had any formal educat ion i n agriculture
and they have not been special ly t rained on Farm I during their periods of
employment.
The job cond it ions on Farm 1 seemed to be quite s imi lar to most Argent ine
dairy farms, which are as fo l lows: a normal working d ay has between 8 and 1 0
hours; it is common to have two days o ff every two w eeks and somet imes two
days off every four weeks . Holidays range between 1 0 to 20 days per year. The
cows are milked at 3 a. m. and 3 p .m. ; each milking takes approximately four
1 25

Chapter 7: Results (Part 1)
hours. The dairy farmer and his family usually get approximately 1 2% ofthe
milk returns, and he usually pays for extra labour if it is needed.
I n Farm I, there are five walkthrough milking sheds in a total of 1 8 dairy farms.
This type of old milking shed can still be found in some of the most traditional
dairy farm areas of the country. They are uncomfortable for the people that milk
the cows and consequently they are not longer built in Argentina.
Farm I has a vertical labour hierarchy; the people that are performing the daily
tasks do not have fonnal farming training or education, and the job conditions
are relatively hard. I n conclusion Farm I had not adopted this New Zealand
innovation and it is relatively typical in this respect (mark=O%).
6) Less than 1 5 cows per Set of T eat-cups, and Other Innovations that Impact on Labour Productivity:
I n Farm 1 , there are between 22 and 25 cows milked per set of teat-cups. I n New
Zealand, typical farms milk 1 5 cows or less per set of teats-cups (see section
3 . 5 .7).
From what was defined as "other technologies" in section 3 . 5 . 7 only front
loaders on tractors are used on Farm I .
The general impression ofthe interviewer was that i n Farm 1 they are not so
interested in getting similar labour productivities to those ofNew Zealand. The
management team takes the labour productivity into account and they try to
increase it constantly but not by investing more in plant and machinery as in
N ew Zealand. I nstead one strategy is to s implify the system; for example, this
farm utilizes the simplified milking routine that is typical in New Zealand farms .
Another strategy is the specialization o f tasks, which means that eaeh person
specialises in a limited number of tasks; for example, most dairy farmers in
Farm 1 spend most of their working time milking cows.
In Farm 1, they had more than 1 5 cows per set of teat-cups. Because they had an
average o f 2 3 . 5 cows set of teat-cups, they use front loaders on tractors and a
1 26

Chapter 7: Results (Part 1)
system that is relat ively simple, it is defined that Farm 1 adopted 45%23 of this
innovat ion.
7) Seasonal Calving, One or Two Calving Periods per Year:
From the 1 8 dairy farms of Farm 1, 3 of them have seasonal calv ing with one
calving period. The cows calve for approximately 1 2 weeks during February,
March and April . They have chosen this calving period in order to produce milk
during the period of higher mi lk prices (June-July, see sect ion 2 .6 .2 . 3 ).
I n Farm 1 , the management t eam has carried out some research about the
advantages and disadvantages that they find in adopting seasonal calving:
The advantages that they fou nd are: events occurs in sequences and
consequent ly only one task must be done at a t ime (calving, rearing of calves,
mat ing and drying off) ; most of the cows have common requirements at a given
t ime; increases the possib i l ity of feed ing the cows better in the periods that they
have higher requirements { peak of lactation and mat ing); the possib i l ity o f
producing a higher proport ion of milk during the period o f the year when the
milk price is higher; possib i l it y of choosing not to have any cow calving during
t he summer; better results are achieved on the raising of replacement heifers ;
better reproduct ive perfonnance; possibi l ity o f choosing not to have cows
producing mi lk during the warmest months of the year; possib i l ity of producing
more si lage and hay reserves; t he fact that there is a period o f t ime in which the
cows do not produce milk; fac i l itat ion of repair and maintainenance of the farm
structure and organization o f ho lidays for the staff.
The d isadvantages that they found are: it is impossible to do seasonal calv ing
i f only one dairy farm is owned in Argent ina because the dairy company
requires milk on every day o f t he year; more labour needed at the beginning of
t he season; t he need for b igger milking sheds to milk the same number of cows
per year; and the need for more space to rear t he calves.
23 It was assumed that the higher the number of cows per set of teat cups the lower the adoption of th is innovation . Less than 1 5 cows per set of teat c ups was defined as nearly I 00% adoption, more than 30 cows per set of teat cups was defined as nearly 0%.
1 27

Chapter 7: Results (Part 1)
Farm 1 adopted this N ew Zealand innovation partially, in three of its 1 8 dairy
farms ( mark= l 7%).
8) New Zealand Genetics:
In Farm 1, they have been using N ew Zealand Jersey genetics in all heifers
during recent years; actually approximately 2 0% of all cows and heifers are
crossbreds. They decided to use Jerseys because they used to have a lot of
calving problems in heifers and because they wanted to increase milksolids per
l itre of milk.
Presently, they are thinking of continuing with the same practice (to cross all
heifers with Jersey) but they are considering using North American Jersey
instead. They believe that the North American Jerseys would have the same
advantages of the N ew Zealand Jerseys and additionally increase the production
per cow.
They util ized N ew Zealand Holstein Friesian genetics on their Argentine
Holstein cows and the decided not to use it anymore tor several reasons: the
resultant heifers had 'udder problems ' and also calving problems. ln addit ion,
the level of milksolids per litre did not change significantly in respect of the
Argentine Holstein, and also they did not l ike the phenotype of the New Zealand
Holstein Friesian.
They have been trying New Zealand Jersey f()f some years now and they have
found some advantages in using it :
In a recent seminar given by the CEO of the dairy enterprise he showed how, f()f
them, the Jersey cows produce more income per hectare than the crossbreds or
Holstein Friesian cows. He showed that at the same stocking rate in kilO!,JTams of
l ive weight per hectare (adjusted by metabolic weight), Jersey cows produce
more milkso lids per hectare. This is an advantage for them because the dairy
company, to which they sell their milk, pays tor milksolids (milk-protein + milk
milk-fat) .
One of the reasons why in Farm 1 they started to use New Zealand Jersey
genetics was because they were having calving problems. Using New Zealand
1 28

Chapter 7: Results (Part 1)
Jersey semen to mate their A merican Ho lstein heifers decreased the mortality of
calves and the need to help cows to calve.
The crossbreed cows, which resulted from using New Zealand Jersey semen on
the North American Holstein heifers, proved to stay longer in the dairy farm
because they had less fert i l ity problems, less abo11ions, less lameness, and less
mast itis. Further, the crossbreds showed better temperament, they were l ighter
and consequent ly caused less damage to pastures and they also recovered faster
after calving than the 011h American Ho lsteins.
The dairy company prefers mi lk w ith a higher proportion of mi lkso lids because
it costs less per k i logram ofmi lkso lids to be transported and is easier to process.
Farm 1 adopted this New Zealand innovat ion part ially ( mark=20%).
9) Rearing of Calves in Groups :
I n Farm I , all calves are reared in the typical Argentine way.
Some years ago in Farm I they tried to rear some calves in groups and they had
a very high level of mortality due to an epidemic of salmonel la. They think that
the problem cou ld have been caused by cont inued use of the same area of land
for rearing calves for too many years (s ince 1 955 ) . They designed a cal f-feeder
with a tank of 400 litres and approx imately 30 calf-teats that could be fitted onto
the front loader o f a tractor. They think that the innovation cou ld be useful for
them because it take less t ime to feed the calves. They are planning to try this
ew Zealand innovat ion with some male calves again in the near future.
This New Zealand innovat ion was not adopted at the moment of the co l lect ion
of the data but there is some interest in trial ing it again (mark= I O%).
1 0) Style of Mi lking Shed and M i l king System :
The newest milk ing sheds and m i lk ing systems in Farm 1 are very simi lar to
those of New Zealand ( for more details see sect ion 6.2) . I n Farm 1, they
considered the possibi l ity of adopting rotary mi lking sheds but t hey had not
done so yet because the rotaries are more expensive per cow mi lked, and
1 29

Chapter 7: Results (Part 1)
because they think t hat in large dairy farms t hey would h ave too many problems
with excess of mud around the milking shed.
They arc using New Zealand style milking sheds and systems because it costs
less per cow milked per hour, and they provide enough comfort to the people
who milk the cows.
Even though, at the moment, they have adopted this innovation in only 2 or 3 of
the dairy farms, t hey are convinced that this is the style t hat they prefer and that
t hey would use in all new milking sheds (mark=80%).
Table 1 3: Summary of Innovations Adopted or Rejected by Farm 1
N ew Zealand Innovations Mark
1 ) F ocus on Production per Hectare 1 2) G ive Marked Importance to Pasture Production 0 .25 3 ) Quanti tative Pasture M onitoring 0 . 25 4) Uti l ization of Formal Pasture Budgets 0 5) Ski lled and Mot ivated People Working on Farms 0 6) Less than I 5 cows p er Set of Teat-cups 0.45 7) Seasonal Calving, One or Two Calving Periods per Year 0 . 1 7 8 ) New Zealand Genetics 0 .2 9 ) Rearing of Calves in Groups 0. I 1 0) Style of Mi lking Shed and M ilking System 0 .8
TOTAL (out of 1 0) 3 .2
7. 1 . 2 Farm 2
Genera l Characteristics
The Farm Business
Farm 2 is the dairy enterprise of a larger farm business; the complete farm business also
comprises a cropping enterprise and two more dairy farms on leased land. The dairy
enterprise started in 1 984 and has been continual ly growing since then. Farm 2 is
known in the region as an example of the adoption of New Zealand principles to
Argentina.
1 30

Chapter 7: Results (Part 1)
Farm 2 is considered a model for a very specific product ion system that is based on
try ing to achieve excel lence in a l l aspects, and on the high motivat ion of the people
working in it .
The Farmer
Farmer 2 is the main owner of the farm; he makes all the strategic decisions. He is a lso
in charge of supervising the d i fferent enterprises and sect ions of the farm business, of
training and giv ing advice to the people in charge of each enterprise or sect ion (dairy
farmers and others) of the farm business, and he is very invo lved in recruit ing new staff
As was ment ioned before, Farmer 2 is a renowned innovator within the dairy farm
sector especial ly in the adoption of ew Zealand principles to Argent ina. H e is a
cosmopo l itan person who reads scient i fic and tanning journals fi·om several areas of
Argent ina and other parts of the world. He became interested in the ew Zealand
systems when he started dairying. He travelled for the first t ime to ew Zealand in 1 992
and s ince then has been in contact with the country's dairy sector.
Farmer 2 is conv inced that al l ew Zealand innovat ions proposed in the present study
can be benefic ial to Argentine dairy farmers and he believes that in the future Argent ine
dairy farmers wo uld have to change their present product ion systems to be more simi lar
to the ew Zealand systems in order to remain compet it ive.
Feeding Sources
• 5 1 % of total annual requirement for the cows ( lactat ing and dry) are produced
on the mi lk ing platfonn (grazed grass, and winter and summer crops) .
Figure 55: Feeds Eaten by Farm 2 Cows
Feeds eaten by Farm 2 cows (percentage of total annual requirements)
Concentrates
(maize grain,
wheat bran and
minerals)
43%
Hay
6%
1 3 1
Grazed grass,
and winter and
summer crops
51%

Chapter 7: Results (Part 1)
• The company produces its own maize !:,Yfain and buys wheat bran; the cropping
enterprise sells the grains to the dairy enterprise at market prices.
• In Farm 2, silages are not made, maize is used in the fi)fm of grain and usually
there is no excess of grass to be conserved (all !:,Jfass is eaten directly by the
cows).
N ew Zealand Innovations Adopted a nd/or Rejected
I n Farm 2, not only was the owner interviewed but two couples that manage two dairy
farms were also interviewed.
1 ) Focus o n Production per Hectare :
I n Farm 2 , the milksolids production per hectare is their ultimate physical
indicator. They monitor on a monthly basis a number of physical indicators for
the different dairy farms of Farm 2 and other dairy farms of the company, and
they contrast them with indicators o f other companies; one of those indicators is
the production of milk so lids per effective hectare.
I n Farm 2, they are focused on production per hectare because is their most
limiting production factor (the farm' s factors of production arc land, labour and
capital). With some et1ort they can find the right people tor dairy farming and
also o perating capital, but land is usually expensive to buy and is difficult to
lease for 7 to 1 0 years (approximate time frame needed tor a dairy business on
leased land to pay off the investment and the et1ort) .
This innovation was completely adopted in Farm 2 (mark= I 00% ) .
2) G ive Marked Importance to Pasture Production:
Farmer 2 mentioned that pasture production, pasture utilization and longevity of
pastures are all important aspects for them. One of the dairy farmers of Farm 2
stated that they know that the concentrates are expensive in comparison to
pasture, consequently they try to produce and utilize as much pasture as they
can.
1 32

Chapter 7: Results (Part 1)
Another of the dairy farmers stated : 'we supplement with concentrates and most
Argentine .farmers supplement with grass. We try to get the most.from our
pastures and then we supplement Vlith concentrates; that 's why. even
supplementing strongly, we consider that we have a pastoral system '.
I n Farm 2, they are invest ing heavily in ra ising the level o f phosphate in their
so ils to reach 20 parts per mil l ion (ppm) o f phosphates extracted by Olsen
recommended by some Argent ine experts.
The dairy farmers ment ioned that they look after the pastures, they try not to let
the cows graze too low and they protect the newest pastures on the wet days. I n
some very co ld winters when there is no past ure growth, to prevent the pasture
cover from decreasing too much, they feed the cows only with supplements.
Farmer 2 usual ly spends some t ime training new dairy farmers in how to graze
the different grass species at different t imes o f the season.
Farm 2 is very focused on pasture production (mark= I 00%) .
3) Quantitative Pasture Monitoring :
Farm 2 dairy farmers monitor pasture stock ( instead of pasture cover) on a
regular basis. They do visual assessment and include only the pasture that could
be eaten by the milk ing cows. This is sl ight ly d ifferent to New Zealand where a l l
grass above so i l level is included in the assessment . They believe that this way is
more appropriate for their pastures and their product ion system. From the
assessment that they do, they calculate the total stock of grass, as k i lograms of
dry matter o f grass avai lable for cows.
Every new dairy farmer is t rained by cutt ing grass samples in d ifferent
paddocks, with d ifferent grass species and at d ifferent t imes of the year. Those
samples are dried in a stove or microwave and then weighed.
Farmer 2 bel ieves that in order to manage pasture efficient ly, constant
monitoring is essent ial. One of the dairy farmers ment ioned that they monitor
the pasture cover and growth frequently (especial ly at some t imes o f the year) in
order to regulate the quanti ty of concentrates t hat are fed.
1 33

Chapter 7: Results (Part 1)
I t can be considered that they adopted this N ew Zealand innovation with some
small modificat ions (mark=90%) .
4) U ti l ization of Formal Pasture Budgets:
A feed budget is p lanned on a computer spreadsheet at the beginning of the year,
and updated periodically with the actual stocks of dry matter of grass and other
feeds. Decisions to buy feedstuffs and to fertilise are based on the feed budget.
Some years ago only Farmer 2 used to do the feed budgets of the three dairy
farms. N owadays he is still doing a centralized feed budget and some of the
dairy farmers do theirs as well.
Every year Farmer 2 and the dairy tanners have to take an important decision at
the beginning of the spring as to when they decide to stop feeding supplements
because there is enough pasture and pasture growth to cover the cows'
requirements.
Farmer 2 plans and monitors frequently a feed budget for all the dairy farmers in
order to help them to take the decisions to buy foodstuffs or to fertilize with
nitrogen. Other reasons are to keep records of stock of pasture and cows intake
at different times of the year and through several years, and consequently to
increase the prediction accuracy each year. The pasture budget also helps him to
find problems in pasture production or pasture utilization on the different dairy
farms.
This innovation was completely adopted by Farm 2 (mark= l OO%).
5) Sk i l led and Motivated People Working on Farms:
The three dairy farms of Farm 2 are managed separately. The operating structure
of each dairy enterprise is quite simi lar to a New Zealand "share-milking"
contract (for more details see LIC, 2003/04). The two parts that sign the contract
are "the dairy farmers" (usually a young couple) and "the administrator" ( in the
three farms of the present study the administrator is Farmer 2) . Both parts
receive wages from the dairy enterprise per day worked. The dairy enterprise
leases all the land and the cows. All the costs and returns o fthe dairy enterprise
1 34

Chapter 7: Results (Part 1)
are shared equal ly between the two parts. In the t hree dairy enterprises of Farm
2 most ofthe land and cows is owned by Farmer 2 .
The dairy farmers in Farm 2 are a l l university graduates most of them from
careers related to agriculture. When they started working in Farm 2 they were
trained in one of the dairy enterprises, and some o f them became the dairy
farmers after the train ing period . The dairy farmers are responsible for most o f
the decisions w ithin their dairy enterprise and at the same t ime are very invo lved
in t he daily dut ies o f the farm. One member of the couple is usual ly in charge o f
one ofthe daily mi lk ings, they usual ly milk at 6 a.m. and at 3 p.m. (not very
common in Argent ina).
This is the New Zealand innovat ion that is considered as the most important for
Farmer 2. He believes that al l the other innovat ions are adopted in order to be
able to get skil led and motivated people working in dairy farm businesses. He
thinks that with the typical Argentine system it is not possible to provide the
working cond it ions and enough mot ivat ion required by people of this kind .
He mentioned in the interview that this was the aspect that impressed h im the
most in his first v is it to New Zealand. He was surprised that the farm owner
could delegate most o f the dairy farm act iv it ies to other people, and then have
the oppot1unity to focus on other act ivit ies.
Farm 2 has completely adopted this New Zealand principle of having ski l led and
mot ivated people in charge and work ing on the dairy farms ( mark= I 00%).
6) Less than 15 cows per Set of Teat-cups, and Other In novations that I mpact on Labour Productivity:
I n Farm 2, there are approximately 25 cows mi lked per set of teat-cups. They
have a policy that nobody should mi lk more than four hours per day.
Consequently, they implemented mi lk ing shifts in order to prevent any person
from mi lking more than 4 hours per day. They are aware that they have too
many cows for the mi lk ing sheds that they have. Farmer 2 stated t hat they are
thinking about once a day milk ing in order to have the possib i l ity to increase the
cow numbers witho ut t he need to invest in a new m ilking shed, while cont inuing
to l imit the t ime spent milking by each person to 4 hours per day.
1 35

Chapter 7: Results (Part 1)
One of the business goals in Farm 2 is to have high labour productivity in order
to be able to employ less people that are better paid individually. Therefore, they
are continually investing in plant, machinery and buildings in order to meet this
goal.
Other technologies used in Farm 2 are: motorbikes, front loaders on tractors,
automatic effluent spreaders and motorised backing-gates.
I n Farm 2, this innovation was partially adopted (mark=50%).
7) Seasonal Calving, One or Two Calving Periods per Year:
Before converting to dairy they were beef farmers, and produced their own
calves. The beef cows in Argentina typically calve seasonally. From the
beginning of the dairy enterprise they planned to continue with a seasonal
system but with dairy cows.
In Farm 2, they decided to adopt seasonal calving in order to provide better
working conditions tor the dairy farmers. They think that seasonal calving gives
the people on the dairy farms the opportunity to focus on one important task at
one time. They can, tor example, plan the mating, train the people and
themselves tor it, then execute the plan, and finally measure the results. It is also
an advantage for them to have high workload periods alternated with less
intensive periods.
Farmer 2 also mentioned the fo llowing advantages: the need for pregnancy
testing only twice a year ( in all-year round calving dairy farms, pret,mancy
testing is done periodically), the possibility to raise the replacement heifers in a
more simple and orderly fashion because they are all o f the same age, have some
periods without calving and mating. Farmer 2 thinks that everything is more
simple if it is seasonal.
It is important to mention that from the four dairy farmers interviewed ( apart
from Farmer 2 who is the administrator) three of them agreed in ranking
seasonal calving as one ofthe most important New Zealand innovations. Most of
them would not work on an all year round calving dairy farm.
1 36

Chapter 7: Results (Part 1)
Farm 2 has recent ly started two other dairy farms in a different region of the
country, also seasonal but in these cases with spring calving. They completely
adopted this New Zealand innovat ion (mark= I OO%).
8) New Zealand Genetics:
I n Farm 2, they use only New Zealand genet ics. In the first years of the dairy
enterprise they started buying some Jersey bulls from Farmer 4, and when they
had the opportunity, they started to buy New Zealand semen.
Up to the last season they have been breeding to have crossbreed cows; they
have been putt ing New Zealand Jersey semen to those cows with a higher
proportion of Ho lstein or Ho lstein Friesian, and ew Zealand Ho lstein Friesian
semen to those cows with a higher proportion of Jersey. Now they only use New
Zealand Jersey semen.
Farmer 2 mentioned that they decided to use New Zealand genet ics because,
fi·om the very beginn ing, they wanted to have a seasonal and pastoral dairy
system, and ew Zealand cows were selected for that kind of system.
In Farm 2 they bel ieve that ew Zealand genet ics are benefic ial for their
systems. The tour dairy farmers interviewed agreed in ranking the New Zealand
Genet ics as one of the three most important New Zealand innovat ions adopted
by Farm 2. One of them, a veterinarian with some experience in Argent ine
Ho lstein cows, stated : 'these co VI�\· are machines .f()r getting in ea(( Wefound
that the COVI� that were getting in ca(ffor the second time had the highest in-ea((
rate ofa/1. This is complete�y the opposite of what we learnt in the university
and what usual�y occurs with Argentine Holstein cows. We think that this could
be caused by the ve1y strict selectionforfertility that occurs in New Zealand
herds. '
A disadvantage of New Zealand genet ics is that the bull calves, especially the
Jerseys, are very difficult to sell in the Argentine market. And that there is no
market for cows and heifers ofNew Zealand genetics.
They completely adopted this New Zealand technology ( mark= ! 00%).
1 37

Chapter 7: Results (Part 1)
9) Reari ng of Calves i n Groups:
All the calves are reared in groups in the t hree dairy enterprises. U sually the
woman of the dairy farming couple is in charge of rearing the calves.
In one o ft he dairy farms, the calves are fed with a round calf feeder that can be
towed with a 4-wheel b ike. The other two dairy farms use a 200 litre plastic
barrel with approximately 20 "calf-teats" which is filled from a big tank attached
to a trailer t hat is towed by a tractor.
The two women interviewed who are in charge of raising the replacement
heifers in two of the dairy farms are convinced of the benefits of this New
Zealand practice. H owever, they also agree that this could not be the best system
for everyone. This calf rearing system requires t hat the person in charge must
treat each calve individually even though they are in groups. Therefore this
system could be beneficial for people interested in the calves and with the
capacity to differentiate them individually within the !:,1fOups.
In Farm 2, they have completely adopted this New Zealand pract ise
(mark= l OO%).
1 0) Style of M i lking S hed and M ilk ing System:
The first milking sheds that were built in Farm 2 from 1 984 to 1 987 had two
walls with two lines of pipelines and sets of t eat -cups, very similar to most
typical Argentine milking sheds.
However after the visit of Farmer 2 to New Zealand in 1 992 and with the
increase in cow numbers, they had first to add more sets of teat-cups, and then to
demolish the sheds and build new ones. The new milking sheds were built in the
New Zealand way; they are one wall herringbone mi lk ing sheds, with typical
New Zealand milking systems.
In Farm 2, they adopted these New Zealand style milking sheds and milking
systems for two main reasons ; firstly because they are designed to milk
1 38

Chapter 7: Results (Part 1)
maximum number of cows with the least t ime and labour, and secondly because
o f the relatively low cost of the structures.
The new dairy sheds that were built in the two new dairy enterprises of Farm 2
are also typical New Zealand sheds with single line swing over herringbone
mi lking systems. Farmer 2 thinks that the next milking shed could be a rotary
mi lking shed and system. They have adopted completely this New Zealand
techno logy ( mark= I 00%).
Table 1 4: Summary of Innovations Adopted or Rejected by Farm 2
New Zealand Innovations Mark
I ) Focus on Production per Hectare I
2) G ive M arked I mportance to Pasture Production I
3) Quant i ta t ive Past ure Monitoring 0 .9
4) Ut i l i zat ion of Forma l Pasture Budgets I
5 ) Sk i l led and Mot i vated People Worki ng on Farms I
6) Less than 1 5 cows per Set of Teat-cups 0 .5
7) Seasona l Calving, One or Two Calving Periods per Year I
8 ) New Zealand Genet ics I
9) Rearing of Calves i n Groups I
1 0 ) Style o f M i lk ing S hed and M i l k ing System I
TOTAL (out of 1 0) 9 .4
7. 1. 3 Farm 3
General Characteristics
The Farm Business
Farm 3 is a dairy enterprise of a larger farm business; the complete farm business has
farms at two sites approximately 300 km apart . In both sites, there is a dairy and a
cropping enterprise. Farm 3 is the dairy enterprise of one ofthe sites. The company is a
family business owned and directed by several members of a family.
The owners of Farm 3 are focused on t heir return on assets ( ROA), and considering that
their main asset is the land, they are particularly interested in the return per hectare.
Consequent ly they add or subtract hectares to the dairy enterprise depending on how
profitable this act ivity is in comparison to cropping.
1 39
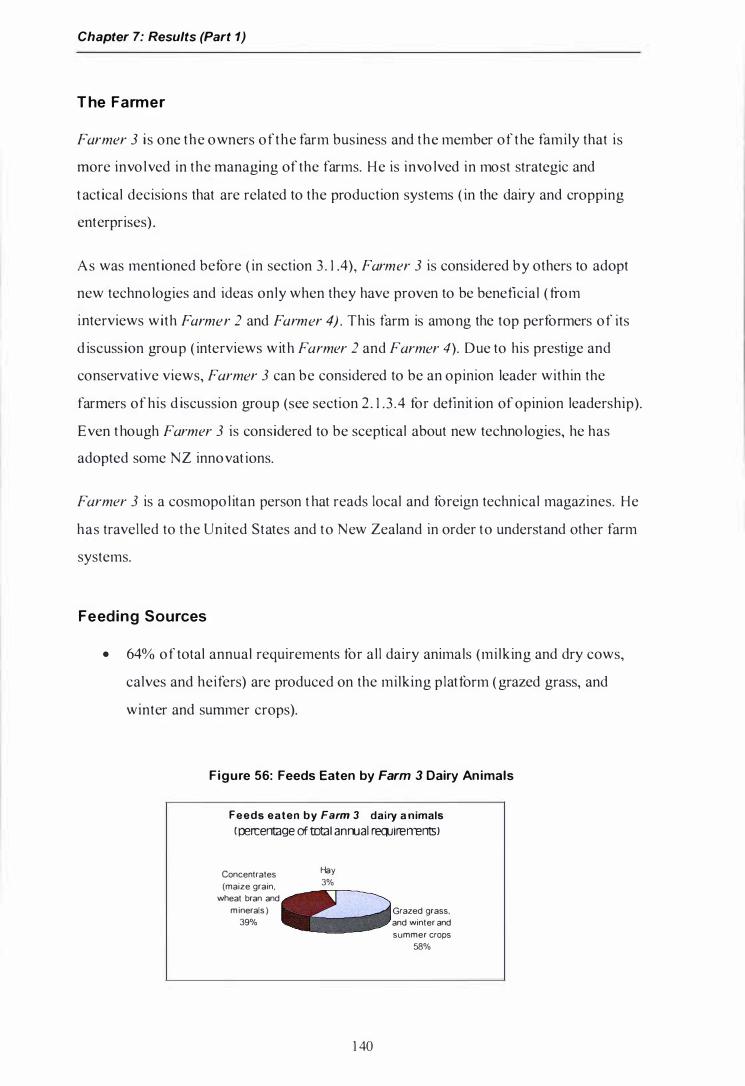
Chapter 7: Results (Part 1)
T he Farmer
Farmer 3 i s one the owners of the farm business and the member of the family that is
more invo lved in the managing of the farms. He is invo lved in most strategic and
t act ical decisions that are related to the production systems ( in the dairy and cropping
enterprises) .
As was mentioned before ( in section 3 . 1 .4), Farmer 3 is considered by others to adopt
new techno logies and ideas only when they have proven to be beneficial ( from
interviews with Farmer 2 and Farmer 4) . This farm is among the top performers of its
d iscussion group ( interviews with Farmer 2 and Farmer 4). Due to his prestige and
conservat ive views, Farmer 3 can be considered to be an opinion leader within the
farmers of his d iscussion group (see section 2 . 1 . 3 .4 for definit ion of opinion leadership).
Even though Farmer 3 is considered to be sceptical about new techno logies, he has
adopted some NZ innovat ions.
Farmer 3 is a cosmopo l itan person t hat reads local and foreign technical magazines. He
has travel led to the United States and to New Zealand in order to understand other farm
systems.
Feeding Sources
• 64% of total annual requirements for al l dairy animals (milking and dry cows,
calves and heifers) are produced on the milking platform (grazed grass, and
winter and summer crops).
Figure 56: Feeds Eaten by Farm 3 Dairy Animals
Feeds eaten by Farm 3 dairy a nimals ( P=rcent:lge of total anrual reQJiremmts>
Concentrates Hay
(maize grain. wheat bran and
minerals ) 39%
3%
1 40
Grazed grass. and winter and summer crops
58%

Chapter 7: Results (Part 1)
• The company produces its own maize grain and buys wheat bran; the cropping
enterprise sel ls the grains to the dairy enterprise at market prices.
• I n Farm 3 (as in Farm 2) silages are not made, maize is used in the form of
grain. Hay is usual ly produced in t he farm from a summer crop called "Moha"
(Setaria ltalica).
New Zealand Innovations Adopted and/or Rejected
1 ) Focus on Production per Hectare :
I n Farm 3 they t ry the get the highest possible productivity per effect ive hectare,
at the same time they monitor the ratio between the prices of concentrates and
mi lk in order to increase or decrease the level o f supplementation. For example,
they know that they should not spend, during winter, more than 40%
(approximately) o f the gross milk income on concentrates.
Typical ly, large Argentine dairy farms also have a cropping enterprise and can
easi ly change hectares between the two enterprises, this introduces a more
complex situat ion when the optimum stock ing rate is being decided.
In Farm 3 they monitor more fi·equent ly the production per cow than the
production per hectare, because once the stocking rate and the level o f
supplements are decided, the production per hectare depends mostly o n the
productivity per cow.
In Farm 3 they are very clear that, within the physical indicators, product ion per
hectare is the most important, this approach is very simi lar to that of ew
Zealand farmers ( mark= I OO%).
2) Give Marked I mportance to Pasture Production:
In Farm 3, they are s lowly increasing the phosphate levels of the so ils; they are
trying to have 20 ppm of phosphates extracted by Bray and Kurtz (or Bray I ) .
Some experts suggested to Farmer 3 that he should increase the phosphate levels
up to 25 ppm for lucerne and up to 1 5 ppm for fescue.
1 4 1

Chapter 7: Results (Part 1)
I n Farm 3, when they have to choose between pastures and cows they usually
give priority to cows, therefore in some periods of the year in which cows'
requirements are much h igher than pastures growth, they usually graze the
pastures very intensively leaving lower residuals than t hose recommended by
experts.
I ncreasingly in Farm 3, they are giving more importance to pasture production.
Farmer 3 is not completely convinced that it is beneficial to fertilize or to look
after their pastures. However, he is slowly becoming convinced as some
consultants and other top farmers are doing it.
In Farm 3 they have adopted this New Zealand principle partially (mark=60%).
3) Quantitative Pasture Monitoring:
Approximately 2 years ago, in Farm 3, t hey adopted a programme to record
pasture cover and growth. One person is in charge of going around all paddocks
of t he three dairy farms once a week, or once every two weeks, depending on the
time of the year. The results of each monitoring are reported to Farmer 3, to the
person in charge of the whole dairy enterprise and to each dairy farmer.
Farmer 3 finds that the adoption of this innovat ion has several advantages: it
helps them to better manage the cows' supplementat ion; it gives them useful
information about the stock of grass avai lable to be eaten by the cows (they
calculate a ratio of the k ilograms of dry matter available per milking cow); in
some c ircumstances they use the data to redistribute hectares across the dairy
farms when necessary; and it helps them to have a minimum stock of dry matter
of grass o n each dairy farm.
I n Farm 3 they adopted this practice in a similar way as is done in New Zealand.
The main difference from a typical New Zealand farm would be that in New
Zealand, the dairy farmer (who milks the cows and decides the paddock that the
cows will graze) does the pasture monitoring. This difference could be quite
s ignificant because information and t ime are lost in the process ofrep01iing the
results o f the monitoring to t he dairy farmer (mark=70%).
1 42

Chapter 7: Results (Part 1)
4) Uti l ization of Formal Pasture Budgets:
In Farm 3, feed budgets are utilized in which are included pastoral budgets.
Pasture growth was measured during several years in the ninet ies, and they use
average monthly figures for their pastoral budgets. They usually do a pasture
budget for the year, not only for the milking cows but also for all the animal
categories in all the farms. During the year, these pasture budgets are checked
three or four times and modificat ions are done if necessary.
Farmer 3 uses pasture budgets in order to decide stocking rates and level of
supplementation needed. He finds pasture budgets useful to decide the amount
of supplements that they need to buy.
In Farm 3, they adopted this technique completely and in the same way as it is
used in some New Zealand farms. However, in comparison to what was
observed in Farm 2 the pasture budget is monitored less frequently in Farm 3
(mark=90%) .
5) Ski l led and Motivated People Working on Farms :
In addit ion to Farmer 3, who spends approximately half of his t ime working for
the dairy enterprise, there are two more people invo lved in the "management
team" of the three dairy farms. One of them l ives near the dairy farms and
spends most of his t ime on the dairy enterprise ( from now on he is cal led the
"dairy enterprise supervisor") . The other person is a veterinarian who visits the
dairy farms one or twice a week. In addition, there is a dairy farmer in charge of
operat ing each of the dairy farms. Some of the members of the dairy farmers '
fami ly usually work with them.
Farmer 3, the dairy enterprise supervisor, and the veterinarian are all university
graduates. The dairy farmers have finished primary or secondary school.
Farmer 3 mentioned that he understands some of the advantages of having more
skil led and motivated people, however he is not sure whether the benefits are
higher than the costs. He fmds the transition from typical Argentine dairy
farmers to more skil led and motivated people to be very costly. A big investment
would have to be made to enlarge the milking sheds and to repair the dairy
1 43

Chapter 7: Results (Part 1)
farmers' houses. However, t he b iggest cost would be the training o f those new
dairy farmers. He t hinks that at the moment these new people wou ld need to be
trained d irectly by h im. He stated that the dairy farms' performance would have
to be much better in order to compensate for the investment and the higher
income that this new k ind of dairy farmers should receive.
The working environment, t he job condit ions and the level of educat ion of the
people working on the dairy farms of Farm 3 were quite typ ical o f Argentina.
Therefore they have not adopted th is New Zealand principle (mark=O%).
6) Less than 1 5 cows per Set of Teat-cups, and Other Innovations that Impact on Labour Productivity :
In Farm 3 there are approximately 26 cows milked per set of teat-cups ( 1 . 73
t imes more cows per set o f teat-cups than in New Zealand).
Farmer 3 bel ieves that to improve labour productivity they would need more
ski lled and mot ivated people and at the same t ime more investment in plant,
machinery and houses. He thinks that the dairy fanners who are actually
working in Farm 3 dairy farms would not use eflicient ly the spare t ime given
by, for example, larger mi lking sheds. Consequently, investment in p lant,
machinery and bui ld ings has to go together with the employment of more ski lled
and mot ivated people.
In Farm 3 this New Zealand innovation was adopted only in a small proportion
(mark=30%).
7) Seasonal Calving, One o r Two Calving Periods per Year:
The t hree dairy farms o f Farm 3 have cows calving during ten months of the
year ( they try not to have cows calving in January and February).
Farmer 3 mentioned two main reasons for rejecting seasonal calving. The first
reason is the seasonality of the milk price in Argentina; usually the h ighest
prices are paid during w inter, but he thinks that is not always the case and
consequently is quite r isky to have a big proportion of milk produced in a short
period of t ime. The second reason is that they cannot get all their cows in calved
1 44

Chapter 7: Results (Part 1)
each 1 2 mot hs; on average their cows need 1 3 months between two calvings,
some of those cows are very h igh producers with long lactations.
I n Farm 3, they have not adopted this New Zealand innovat ion (mark=O%) .
8) New Zealand Genetics:
In Farm 3, t hey use Argent ine Ho lstein genet ics for al l their cows and heifers.
They use Argent ine Ho lstein bul ls with negat ive values for l ive weight with the
intent ion to moderate the cows' size; their adult cows weigh, on average, 500
ki lograms instead of more than 550 kilograms of a normal Argent ine Ho lstein
COW.
In other dairies of the company, they use a small proport ion o f ew Zealand
genet ics (mostly Ho lstein Friesian).
F irst ly they prefer Argent ine Ho lstein because the North American genet ics
(which have a big influence in Argentine Holstein cows) are selected from a
bigger populat ion and have been selected for a larger number of years. Secondly,
because they are paid mainly for milk-protein and New Zealand cows have
higher prop01t ion of milk-fat than the Argentine Holstein cows, considering also
that milk-fat is energet ical ly more expensive to produce than milk-protein. And
thirdly, they prefer Argentine Holstein because is cheaper and easier to find than
N ew Zealand semen.
I n Farm 3 they have not adopted this New Zealand techno logy (mark=O%) .
9) Rearing of Calves in Groups:
I n Farm 3, they adopted this N ew Zealand innovat ion for raising most of the
calves of the three dairy farms. They adopted this innovat ion previously in other
dairy farms o f the company, and approximately 2 years ago they adopted in
Farm 3 because it increases labour productivity (mark= I 00%).
1 0) Style of M i lk ing Shed and M i lking System :
Only the newest of the three milking sheds was built in the New Zealand style.
The other two milking sheds are typical Argentine mi lking sheds. Two of the
mi lking systems are high-l ine single herringbone parlours ( also cal led "swing
1 45

Chapter 7: Results (Part 1)
over" parlours) and one has two low pipelines with sets ofteat-cups. Farmer 3
mentioned that they are planning to change t he milking system of this last dairy
farm to the N ew Zealand style.
I n Farm 3, they have chosen N ew Zealand style milk ing sheds mainly because
of t heir lower cost, and they adopted N ew Zealand milking systems because
more cows can be milked per set of teat-cups than in other milk ing systems.
I n conclusion in Farm 3 they are changing to milk ing sheds and systems t hat are
common in N ew Zealand, and they are convinced that is the style that they
would use in future new milking sheds (mark= 1 00% ) .
Table 1 5: Summary of Innovations Adopted or Rejected by Farm 3
N ew Zealand Innovations Mark
1 ) Focus on Production per Hectare 1 2) G ive M arked I mportance to Pasture Production 0 .6 3 ) Quantitative Pasture M onitoring 0 . 8 4 ) Uti l ization o f Formal Pasture Budgets 0 .9 5 ) Ski l led and M ot ivated People Working on Farms 0 6) Less than 1 5 cows per Set of Teat-cups 0 . 3 7 ) S easonal Calving, One or Two Calving Periods per Year 0 8 ) New Zealand Genetics 0 9) Rearing of Calves in Groups 1 1 0) Style of M i l king Shed and M i lking System 1
TOTAL (out of 1 0) 5 .6
7. 1 .4 Farm 4
Genera l Characteristics
T he Farm Business
Farm 4 is the largest dairy farm of a family farm business that is mainly focused on
dairy farming. This farm business breeds and commercialises New Zealand Jersey
heifers and bulls.
The mission of Farm 4 is the following: 'lookfor excellence within farming, for the
satisfaction ofall the members that work on the company, andfor the good (�j'the
community. Contribute to improve the image (4' the A rgentine dairy sector '. Probably
1 46

Chapter 7: Results (Part 1)
the main characteristic o f Farm 4 is a production system completely consistent with the
goals and values of its owners.
The Farmer
Farmer 4 is one the owners of the farm business and member of the family in charge of
its d irection. He i s responsible for taking most of the strategic decisions o f the farm
business. H e l ives on the farm and is invo lved in the daily running in the business.
As was previously ment ioned, Farmer 4 was one of the first Argent ine farmers to adopt
New Zealand innovat ions and one of the most convinced of the benefits of the ew
Zealand dairy farm principles. Farmer 4 is a cosmopo litan person who is both aware of
the evo lution of the Argent ine dairy sector and of the changes that occur in the
internat ional dairy markets.
Farmer 4 is in close contact with New Zealand and Australian dairy production sectors.
Farmer 4 first travel led to New Zealand in 1 982, init ia l ly interested in the genet ics of
New Zealand dairy cows.
Feeding Sources
• 45% of total annual requirements for al l dairy animals (mi lking and dry cows,
calves and heifers) are produced on the milking platform (grazed grass, and
winter and summer crops).
Figure 57 : Feeds Eaten by Farm 4 Dai ry Animals
Feeds eaten by Farm 4 da i ry an imals (percentage of total annual requirements)
Concentrates,
maize silage
and hay
55%
1 47
G razed grass,
and winter and
summer crops
45%

Chapter 7: Results (Part 1)
• The company produces maize silage, maize b:rrain and buys wheat bran. The
cropping enterprise sells the grains and silage to the dairy enterprise at market
pnces.
New Zealand Innovations Adopted and/or Rejected
1 ) Focus o n Production per Hectare :
In Farm 4 milksolids production per hectare is their ult imate physical indicator,
because this helps the business to meet their financial goals.
This innovation was completely adopted in Farm 4 (mark=l OO%).
2) G ive Marked Importance to Pasture Production :
Farmer 4 and the team that manages Farm 4 believe that their knowledge of
their pastures i s one of the strengths of their system.
In Farm 4 pastures are fertil ized strongly, at higher levels that on most
Argentine dairy farms. Levels of25 ppm of phosphate (Olscn), 1 5 ppm of
sulphates arc maintained, 1 50 units ofN itrogen are applied per hectare each
season. The target in farm 4 is to produce 1 2 tonnes of dry matter of grass per
hectare per year in their best soils.
Farmer 4 has calculated that in his production system the dry matter from
grazed grass is t he cheapest feed for their cows. Therefore he tries to produce as
much grass dry matter, as is economically feasible. However they are also
aware that in Argentina supplements are relatively cheap and they util ize them
as long as it is convenient for them.
In Farm 4 this New Zealand principle is completely adopted (mark= l OO%).
3) Quantitative Pasture Monitoring:
Pasture cover is estimated on a regular basis on Farm 4. The person in charge
uses a rising p late meter and also visual assessment. Based on this information
he calculates the average pasture cover and the pasture b:rrowth rates. Then,
148
Chapter 7: Results (Part 1)
together w ith the dairy farmer, they decide the pastures to be grazed and the pre
and post grazing covers wanted.
In Farm 4 quant itative pasture monitoring is nearly completely adopted. The
only deviation from the typical New Zealand farm is that it is not the dairy
farmer who monitors the pasture-cover (mark=90%).
4) Uti l ization of Formal Pasture Budgets:
A pastoral budget is p lanned on a computer spreadsheet at the beginning of the
year and updated period ical ly with the actual pasture covers and growths. The
pastoral budget is an essent ial tool for grazing management for Farm 4.
In Farm 4 pastoral and feed budgets are tools that help in the mak ing of
medium-term decisions on feed ing. The budgets help to assess the need to buy
or make more supplements or the need to fert il ize pastures with nitrogen.
This innovat ion was completely adopted by Farm 4 (mark= I 00%).
5) Ski l led and Motivated People Working on Farms:
The management team of Farm 4 is co mprised of Farmer 4 ("the managing
director"), one person in charge of the dairy enterprise ("the dairy manager"),
one person in charge of the machinery enterprise, the cropping and the rearing of
replacements ("the cropping manager"), and a person in charge of the
admin istrative tasks ("financial manager") .
There are two fami lies of dairy farmers in charge of the dairy farm operat ional
activit ies. One family is in charge of the autumn calv ing herd and the other is in
charge o f the spring calving herd. There is a third group of four people, who
help the two famil ies of dairy farmers at the t imes of greatest act ivity (calving
and mat ing).
The people in charge of the dairy farm operat ional activit ies have fin ished
primary or secondary school. The dairy manager, who is a university graduate, is
very invo lved in the dairy farm and works closely with the dairy farmers.
1 49

Chapter 7: Results (Part 1)
In farm 4 they adopted this innovation because they believe that, in order to be
efficient in dairy farming, the people invo lved have to be trained and have to be
mot ivated.
In Farm 4 people that typically work in Argentine dairy farms are employed to
operate the dairy farm. What is innovative on Farm 4 is that they t ry to select the
best people and they continue training them. Another innovative practice is the
fact that the owner of the farm and other skilful people ( in technical matters)
work closely with the dairy farmers.
Farmer 4 mentioned that he believes that an operating structure similar to the
share-milking contract in New Zealand is possible in Argentina. However he
believes that Farm 4 is too large and complicated to be operated within that
structure.
The job condit ions, working environment and the level of education of the
people in charge of the dairy t�mn operational tasks are higher than those o f
typical Argentine dairy farms. However they have not completely adopted this
New Zealand innovation (mark=80%).
6) Less than 1 5 cows per Set of Teat-cups, and Other Innovations that Impact on Labour Productivity :
I n Farm 4 approximately 24 cows are milked per set of teat-cups ( 1 .6 t imes
more cows per set of teat-cups than in New Zealand) (mark=40%) .
In Farm 4 this New Zealand principle was only partially adopted because they
believe that in Argentina the economic conditions are different to New Zealand,
and that given the local environment, it is probably more convenient to have
more people working on the farm and less investment in plant and machinery.
7) Seasonal Calving, One o r Two Calving Periods per Year:
Farm 4 has two seasonal calving periods per year, one in autumn and one in
spnng.
Farmer 4 has completely adopted this New Zealand innovation (mark= l OO%).
1 50

Chapter 7: Results (Part 1)
8) New Zealand Genetics:
In Farm 4, only New Zealand genetics is used, and nearly all the cows are
Jerseys. Farmer 4 is known for having high genetic merit Jersey cows and for
sell ing Jersey bul ls and heifers.
In Farm 4. this ew Zealand technology was completely adopted (mark= I 00%).
9) Reari ng of Calves in Groups:
All calves are reared in groups. They completely adopted this New Zealand
pract ise (mark= I 00% ).
1 0 ) Style of M i lk ing Shed and Mi lki ng System:
Farm 4 i s one of the few dairy farms in Argent ina with a rotary mi lking shed
and milk ing system. The design and most of t he parts were brought from ew
Zealand. This innovat ion is completely adopted by Farm 4 (mark= I 00%).
Table 1 6: Summary of I nnovations Adopted or Rejected by Farm 4
New Zealand Innovations Mark
I ) Focus on Product ion per Hectare I
2 ) G ive Marked I mportance to Pasture Product ion 0 .8 3) Quantitat ive Pasture Monitoring 0 .8 4 ) Ut i l ization of Forma l Pasture Budgets 0 .9 5 ) Ski l led and Mot ivated People Worki ng on Farms 0 . 8 6 ) Less t han 1 5 cows per Set of Teat-cups 0.4 7 ) Seasona l Calving, One or Two Calving Periods per Year 1 8 ) New Zea land Genet ics I 9 ) Rearing of Calves i n Groups I 1 0) Style of M i lk ing Shed and M i lking System I
TOTAL (out of 1 0) 9 . 1
1 5 1

Chapter 7: Results (Part 1)
7. 1 . 5 Farm 5
Genera l C haracteristics
The Farm Business
A single fami ly owns Farm 5. It is d irected by one of its owners (Farmer 5), and at least
one addit ional member of the family works tor the business. Farm 5 is a farm business
w it hout land, as all the land is leased and most of the plant, machinery and cows are the
assets of the business. There are not many dairy farmers in Argentina that lease all the
land (researcher ' s experience in Argentine dairy production sector) . In New Zealand
dairy farms on leased land are also rare ( IFCN, 2002) .
The family is also involved in other businesses, some of them related to fanning. They
are focused on maximizing returns o n capital and they are interested in being diversified
in order to reduce risks. Farmer 5 mentioned that they are not interested in having their
capital t ied to physical assets, but they prefer to keep a high level of liquidity in the
business in order to take advantage o f financial opportunities.
T he Farmer
Farmer 5 i s the main decision maker of the business; he is very involved in all strategic
decisions and in the main tactical decisions.
Farmer 5 is a very entrepreneurial person, he also owns (at least in part) and directs a
business that sells, repairs and maintains milk ing machines, milk tanks and cooling
systems. He has also worked as a dairy farm consultant in the past.
Farmer 5 is very informed about the evo lution of the Argentine dairy sector, reads most
relevant Argentine l iterature about dairy farming and is aware of the principles of dairy
farming in o ther countries like the Un ites States of America, New Zealand and
Australia. H owever, he can be considered to be more locally oriented than Farmers 1 , 2,
3 and 4.
Feeding Sources
• I n Farm 5 in the last season ( 2003/04) approximately 70% o f the total
requirements of cows, heifers and calves were brought from outside the milk
p latfo rm ( maize s ilage and concentrates) .
1 52

Chapter 7: Results (Part 1)
Figure 58 : Feeds Eaten by Farm 5 Dai ry Animals
Feeds eate n by Fa rm 5 d a iry a n ima ls
( percent3ge Of tota l annual requirerrentsl
Concentrates (maize grain,
wheat bran and
Grazed grass, and winter and sum mer crops
mo;;�'•l
E"=[ 3Ho:" - - 2°/o
Maize silage 35%
• Maize si lage is used abundant ly, especially during the winter. I t is fed by a
system that it is cal led "self-feed ing". The cows eat by themselves from the big
plastic bags where the si lage is stored. They can eat approximately 20 ki lograms
of s i lage (green matter) in approximately two hours. Farmer 5 said that the
wastage is very low.
New Zealand Innovations Adopted and/or Rejected
1 ) Focus on Production per Hectare :
The fact that all the land is leased puts a lot of pressure on the returns per
hectare. Consequent ly, Farm 5 is very focused on maximizing production per
hectare provided that the increase in product ivity has a posit ive impact on the
financial returns per hectare.
In Farm 5 th is focus is completely adopted (mark= I 00%).
2) G ive Marked Importance to Pasture Production:
Farmer 5 clearly stated that he gives priority to the cows over the pastures. He
said ' at the moment the cow is more important than pastures. For me, cows are
sacred, like in I ndia, I try to feed t hem as wel l as possible even if l have to
sacrifice the pasture' . Consequent ly, very often the cows graze the pastures too
low or go into a paddock despite it being too wet .
However in Farm 5 , they give a lot o f importance to pasture and crop
productivity because (as was mentioned before) the rent of the land is one of the
highest costs. They have noticed that on th�ir land, the pastures produce much
1 53

Chapter 7: Results (Part 1)
more in the first three years o f production, therefore Farmer 5 decided to replant
pastures every three years, instead of the tradit ional 4 years, in order to eliminate
the fourth year of low pasture productivity.
In Farm 5 they decided not to invest in phosphate ferti lization because they do
not know if the landowner would renew the leasing contract . They ferti lise with
small quantities of phosphate and nitrogen at the moment of replanting.
Farmer 5 says that he enjoys grazing cows, and that he wou ld give more priority
to pastures if he had the t ime or if he owned the land (he would fertilize more).
H e also emphasised that only 28% of the requirements of the cows, heifers and
calves are covered by f,>Tazed f,>Tass and therefore the focus is on utilizing si lage,
hay and concentrates (which cover 70% of al l the requirements).
In Farm 5 this principle was not adopted (mark=O%).
3) Quantitative Pasture Monitoring:
I n Farm 5, al l the f,>Tass avail able is utilized, and for the reasons explained in the
previous po int, pasture is not considered of sufficient importance to justify more
t ime or resources spent on this N ew Zealand practice.
I n Farm 5 this principle was not adopted (mark=O%).
4) Uti l ization of Formal Pasture Budgets:
In �Farm 5 this principle was not adopted (mark=O%).
5) Sk i lled and Motivated People Working on Farms:
Farmer 5 is a national university graduate from a career called "agricultural
engineering". H e p lans and supervises most of the activit ies of the farm.
People that work on the farm are all employees; all of t hem receive wages for
t heir work. He mentioned that this is quite uncommon in the region where most
o f the people in charge of a dairy farm receive from 8 to 9% of the milk
proceedings.
1 54

Chapter 7: Results (Part 1)
Al l employees have fin ished primary or secondary school without any other
formal training in farming. However Farmer 5 makes the effort of supervising
them and training them constant ly.
In Farm 5 people from the region are employed. These people are the people
that t radit ionally work in dairy farming in Argent ina. Farmer 5 ment ioned that
he has tried to motivate and train the people on his farm and he bel ieves that he
found a limit. After reaching a certain level of income and condit ions of living
and working, it seems that staff is not motivated by further improvements. H e
thinks that in order t o get returns from add itional incentives and improvements
ofworking and l iv ing condit ions, he would have to look for people outside the
traditional dairy-farming environment (for example young graduates fi·om
technical schools or universit ies) . However, he is uncertain if that kind of people
would really compensate for the addit ional costs and investment with more
efficiency.
The working and job conditions are sl ight ly above those of typical Argent ine
dairy farms, and the farmer trains the staff on the job. This cw Zealand
principle is part ia l ly adopted (mark=30%).
6) Less than 1 5 cows per Set of Teat-cups, and Other Innovations that Impact on Labour Productivity:
In f(mn 5 there are approximately 30 cows mi lked per set of teat-cups, with two
shi fts of people to milk the cows (2 times more cows per set of teat cups than in
ew Zealand).
I n Farm 5 they achieve a relat ively high number of cows per person based on an
extreme simplificat ion of the system, and a high motivat ion to perform from the
relat ively high wages and close supervision.
Farmer 5 bel ieves that the ratio between investment in plant, machinery and
build ings and the number of people working on the farm is well balanced for his
production system. It is important to take into account that Farm 5 is in leased
land and that this l imit s the intent ion to invest in its overal l structure.
1 55

Chapter 7: Results (Part 1)
The New Zealand innovation principle of investing more in plant, machinery
and buildings in order to maximize labour productivity was not adopted
( mark=O%).
7) Seasonal Calving, One or Two Calving Periods per Year:
In Farm 5 there are t wo calving periods, one in autumn ( February, M arch and
April) and one in spring (Ju ly, August and September) .
Farmer 5 explained that the calving period in autumn is to take advantage of the
high milk prices during the winter; and that the spring calving is tor financial
reasons because they have to continue paying expenses during the summer. In
addition, because during the first months of the year there is usually a s light
increase in the milk price.
In Farm 5. this New Zealand innovation was completely adopted (mark= l OO%).
8) New Zealand Genetics:
Farmer 5 is implementing a breeding scheme with t hree breeds: Argentine
Holstein, New Zealand Holstein Friesian and New Zealand Jersey. He is
convinced that New Zealand genetics are adequate for his system however he
wants to take the most from the heterosis.
All heifers in Farm 5 are inseminated with New Zealand Jersey. The Argentine
Holstcin semen utilized is with negative values for l ive weight and for calving
difficulty. Target average adu lt live weight of the herd is between 450 and 470
kilot,>Tams.
Farmer 5 stated: 'The possibility of'having a seasonal calving system is given by
the breed, as you can not have a seasonal calving H'ith A rgentine Holstein cows
because the minimum interval between two calvings ola Holstein cow is around
1 4 months '. 'Seasona!izy is related to fertility andfertility is related to (vpe ol
cow '. Farmer 5 uses New Zealand genetics mainly for robustness and fertility.
Approximately two thirds of Farm 5 's herd is New Zealand Genetics and one
third are Argentine Holstein. Therefore this New Zealand technology was
1 56

Chapter 7: Results (Part 1)
partially adopted in Farm 5 ( mark=67%). However, it is the opinion o f the
researcher that Argent ine genetics are used for clear specific reasons.
9) Rearing of Calves in Groups:
They completely adopted this New Zealand pract ice for autumn and spring
calves (mark= I OO%).
1 0) Style of M i lking Shed and Mi lking System:
I n Farm 5 the milk ing shed and milk ing system are ew Zealand style because
they are o f relat ively low cost and simple (mark= I 00%).
Table 1 7 : Summary of I nnovations Adopted or Rejected by Farm 5
New Zealand Innovations Mark
I ) Focus on Produc t ion per Hectare I
2 ) G ive Marked I mportance to Pasture Product ion 0
3 ) Quant itat ive Pasture Monitoring 0 4) Ut i l i zat ion of Forma l Pasture B udgets 0
5 ) Sk i l led and M ot i vated People Work i ng on Farms 0 .3
6) Less than 1 5 cows per Set of Teat-cups 0
7) Seasona l Calving, One or Two Calv ing Periods per Year l 8) New Zealand Genetics 0 .67 9) Rearing of Calves in Groups l 1 0) Style of M i lk ing Shed and M i lk ing System l TOTAL (out of 1 0) 5
7. 1. 6 Farm 6
General Characteristics
The Farm Busi ness
Farm 6 is a family business; several members of a family owning it. The father (Farmer
6) and a son work full t ime for the farm business. Other family members help on the
farm sporadical ly. The father was s lowly passing the d irection o f the business to the
son.
! 57

Chapter 7: Results (Part 1)
The business started as a family project. The farm was bought and s lowly they have
been developing it for irrigat ion, through flood-irrigation. The family started with the
dairy enterprise six years ago and they have been investing al l the profit in continuing to
develop the farm and increase the cow numbers.
The farm is s ituated in a remote area of the country, far from populated areas. There are
not many dairy farms close by and the dairy company that buys the milk is small and is
situated relat ively far from the farm. Additional ly, to reach the farm it is necessary to
drive 35 kilometres on a dirt road that is in bad condit ion.
Farmer 6 ment ioned: · . . . we wanted to develop a low cost dairy production system. We
have the goal of being the last dairy farm in the country to close !l necessary . . . '
T he Farmer
Farmer 6 i s a very experienced person in dairy product ion systems. He has worked as a
dairy farm consultant for many years in very different countries and condit ions and he
ment ioned that he tried the 'New Zealand dairy production principles ' in a l l of them
with very good results.
Feeding Sources
• In Farm 6 the farmers do not carry quant itat ive records, therefore only general
data about the system is detailed in this sect ion.
Figure 59: Feeds Eaten by Farm 6 Lactating Cows
F e e ds e ate n by Farm 6 lactating cows
< percent3ge of total annual reQJirerrentsl
Maize silage 27%
Concentrates� (mostly maize� razed grass,
grain) hay and 5% pasture s ilage
68%
• N early al l of the feeds are produced on the farm.
1 58

Chapter 7: Results (Part 1)
New Zea land Innovations Adopted and/or Rejected
1 ) F ocus on Production per Hectare :
Farm 6 is a self-contained farm in which the maize silage and the concentrates
are produced on the farm. Their target at the moment is to produce
approximately 1 5 ,000 litres of mi lk per hectare (approximately I ,080 ki lograms
o f mi lkso lids per hectare).
Farmer 6 stated they are more focused on maximizing production per hectare
than product ion per cow. He also ment ioned that they make the cows graze too
low for maximizing product ion per cow, however the grazing levels are
adequate in order to maximize production per hectare.
I n Farm 6 this principle was completely adopted (mark= I 00%).
2) Marked Importance to Pasture Production:
Farmer 6 stated that year-by-year, the productivity of the pastures is increasing;
he thinks that they arc util izing 1 5 tonnes of dry matter of grass per hectare in
their best paddocks. However, on average, pastures are producing approximately
8 tonnes of dry matter of grass.
Farmer 6 and his son would l ike to apply more phosphate and nitrogen fert il izer
to their pastures, however they have not been able to buy enough due to
financial restrictions. The so ils o f the farm have a long history of cropping
(onion and other crops) that was very extract ive of nutrients. Another factor that
affected the fert i l ity of the soi ls was the level l ing of the farm during the
developing for flood-irrigat ion. Therefore Farmer 6 thinks that in order to
increase the fert i l ity levels, the farm needs at least I tonne of the fert il iser called
"phosphate bi-ammonic" (a fert i l izer used in Argent ina: 1 8 parts ofN itrogen, 46
parts of Phosphate and 0 parts o f Potassium) per year. Last year they managed to
buy and apply 500 ki lograms of "phosphate bi-ammonic" per hectare (90 units
o f N and 230 units ofP) . These levels o f fert i l izat ion are much higher than on
typical Argent ine farms.
Pasture is their main feed and, for Farm 6, increments in pasture product ion per
hectare is the main driver of growth in milk production.
1 59

Chapter 7: Results (Part 1)
In Farm 6 this principle is adopted (mark= 1 00% ).
3) Quantitative Pasture Monitoring:
The son of F arm er 6, who is in charge of the grazing management, does not
monitor the pasture quantitat ively. He manages the farm based on his
experience; he estimates the pasture cover by mentally calculat ing how many
days of grazing are sti l l available. Therefore t here is no historic recording of
pasture cover and/or pasture !:,'TOwth i n Farm 6.
In Farm 6 they do not use quantitative pasture monitoring probably because they
bel ieve they do not need to do it. The person that does the !:,'Tazing management
is the same person that monitors the pasture cover and growth, and does not
think he needs to record it on paper or a computer spreadsheet. Pasture
production i s continually increasing therefore they do not give much value to
records that would change the next year. Another reason is that they bel ieve that
doing quantitat ive pasture monitoring is not a priority for them and they prefer
to spend their time on tasks that has a bigger impact on the farm results. Thus
priorities may change when full pasture production is achieved.
In Farm 6 this principle was partially adopted (mark=50%).
4) Uti l ization of Formal Pasture Budgets:
For the same or similar reasons that recording of pasture growth or cover was
not adopted, and because the farm is relat ively small (approximately 250
hectares) and the system is quite simple, the farmers believe that there is no need
for complex calculations and budgets.
In Farm 6 th is principle was not adopted ( mark=O%).
5) Sk i l led and M otivated People Work ing on Farms:
Farmer 6 gained a B achelor's degree in Agriculture and then did some
postgraduate studies in New Zealand. Farmer 6's son also gained a Bachelor's
degree in Agriculture, and he has learnt from his father and from other farmers
in N ew Zealand and Australia.
1 60

Chapter 7: Results (Part 1)
The people that work on the farm (apart from Farmer 6 and his son) are all
employees; all of them receive wages for their work. Most of the employees
have very low levels of formal educat ion. However, they are moderately ski lful
because Farmer 6 and his son work together with them in the daily farm
act ivit ies and train them constantly.
In Farm 6 the milking of the cows takes place at 6 a. m. and at 5 p .m. They
usually work many hours during the periods of calving and mat ing. Overall the
working conditions are similar to those on New Zealand farms.
In Farm 6 the owners work their own farm, and their main income is from the
farm. They are motivated because they are growing the family bus iness. Farmer
6 has become very skilful by learning fi·om his own experience and from many
successful examples in Argentina and several other countries. He has had the
oppo1tunity to learn what he cal ls 'the New Zealand dai1y principles ', and then
test them in many di fferent environments.
Farm 6 is probably the farm that was found to be more simi lar to a N ew Zealand
farm in this aspect, especially because the owners work actively on the farm
(mark= ! 00%).
6) Less than 1 5 cows per Set of Teat-cups, and Other Innovations that Impact on Labour Productivity:
In Farm 6 they have a policy of a max imum of20 cows mi lked per set of teat
cups ( 1 . 3 3 times the number of cows per set of teat-cups of typical New Zealand
farms) . They try not to spend more than four hours per day milking the cows.
There is one ful l-time person per approximately 50 cows, including the irrigat ion
workers. However Farmer 6 stated : 'this is a .farm to be managed by 5.full-time
persons with this number o.fcovvs (actually there are 8 people working full-t ime
and there are 400 cows), but at the moment we are still developing the .farm '.
When fully developed, they could milk approximately 750 cows (own
calculat ions based on data provided by the farmer).
Farmer 6 mentioned that they invest in enough plant, machinery and buildings
in order to work in a good environment, and in order to avoid spend ing too
1 6 1
Chapter 7: Results (Part 1)
much t ime in duties that can be done more quickly with relatively inexpensive
machinery. They are definitely trying to apply al l New Zealand dairy principles
if they can; however the socio-economic environment in which the farm is
situated is very different from that in N ew Zealand. Some services and
infrastructure that are common tor New Zealand farmers ( and a lso for some
Argentine farmers in other regions) are not available for Farm 6. and
consequently they need more people working on the farm.
I n Farm 6, this innovation was adopted to the highest degree of al l case studies
( mark=70%).
7) Seasonal Calving, One or Two Calving Periods per Year:
I n Farm 6 there are two calving periods, each of nine weeks, one in autumn and
one in spring. They inseminate the cows for six weeks and then they put bulls in
the herd for three more weeks.
T he fami ly decided to have a seasonal calving system 'hecause the eff'ort is
concentrated. ' Farmer 6 mentioned that, for example, 'the mating is the most
stressing period for my son and me, hut it is no so stress/id because we can
delegate the monitoring of' the calving herd and the other activities to the stafl '
However the heat detection and the insemination of the cows (during the mating)
are not routine type activit ies and have to be done by Farmer 6 or h is son; they
prefer to do these activities in a short period of time, concentrating their efforts.
' We have two calving periods in this farm hecause our client (the dairy
company) need•; winter m ilk. {fit was only our decision we vvould have only one
calving period in spring hecause it makes everything easier. '
They adopted this New Zealand innovation completely (mark= I OO%).
8) New Zealand Genetics:
In farm 6, they started six years ago with average genetic merit Argentine
Holstein heifers. Since then, they have been using only New Zealand semen;
they used both Jersey and Holstein Friesian.
1 62

Chapter 7: Results (Part 1)
The fo l lowing quote expresses Farmer 6 's thinking: '/ do not believe that it is
necessary to have New Zealand genetics for having seasonal calving; however
1-l'e are aware that it is easier with these genetics because they have been
selected to calve each 1 2 months. '
' We still have some co1-t:s o,( North American genetics, we bought 40 when we
started with the dai1yfarm 6 years ago and 15 of them still are on the farm, the
other 25 Here culled because they were useless. But these 15 cmcs are ve1y good
producers and there have heen seasons in which some of those co1-t:s were
producing up to 24 litres at the time to dry them o,[(. so we decided to keep
milking them up to the next calving. For those cows probably you cannot define
a season (�( 12 months, you need a different system. '
' We rented some co li :�· to some smallfarmers (5 to 15 CO VI:S) and all o,( them told
me that they are good. that the New Zealand cmn· do not lose condition and they
produce the same amount o(milk. We also sold 75 heifers. rnany a,( them
cmsshreds. and thefarmer who hough/ them is ve1y happy with them. and they
1rere the daughters o(the lo ll'(:r producing CO li :\·. '
Therefore Farm 6 adopted this ew Zealand technology completely
(mark= I 00%).
9) Reari ng of Calves in Groups :
In Farm 6, they have very good results rearing the calves ' VI ·e have I or 2 deaths
per year (out of approximately 350 calves reared per year), and the moment of
death is usual�v the calving '. Farmer 6, who is in charge of rearing the calves,
rears both male and female calves.
Farmer 6 ment ioned that there are as many rearing systems as people in charge
of rearing the calves. 'It all depends of the person in charge, some people rear
ve1y well with buckets and others rear very well with calf-teats and there are
some that are a disaster with both. '
' There are two main advantages o.f rearing with a barrel with ca!f-teats, one is
that it takes less time and the other is that the calves do not grow like kids that
did not go to the kindergarten, with this system the calves socialise very early.
When you rear them individually, then put them into a group in a paddock, it
1 63

Chapter 7: Results (Part 1)
takes them 2 or 3 week'\ to realise that there are others like them and that they
are part ola group, and this has an impact on their growth. '
'Thefact that it takes less total time to rear calves in groups is less important to
me, what is more important is that this c'.,ystem gives the person more time to
observe the calves, to see if they are sick and to touch their belly buttom; to
assess ilthey are infected. In the other system the person is so bwy warming the
milk, filling the buckets and moving the stakes that he or she does not have time
to observe the calves. '
'Another advantage is the p.'>ychology of the calrteats that may have an impact.
A lso, the calves can movefreely and go to shade if' it is too hot, or shelterfrom
the wind when it is too cold. '
They completely adopted this New Zealand pract ise for al l the calves
( mark= 1 00%).
1 0) Style of M i lking Shed and M i lk ing System:
In Farm 6 the milking shed and m i lk ing system are New Zealand style
( mark= 1 00%).
Table 18: Summary of Innovations Adopted or Rejected by Farm 6
New Zealand Innovations
I ) Focus on Production per Hectare 2) M arked Imp ortance to Pasture Production 3) Quantitative Pasture Monitoring 4) Ut i lization of F ormal Pasture Budgets 5) Skil led and M ot ivated People Working on Farms 6) Less than 1 5 cows per Set of Teat -cups 7 ) Seasonal Calving, One or Two Calving Periods per Year 8) N ew Zealand Genetics 9) Rearing of Calves in Groups 1 0) S tyle of M i lking Shed and M i lking System
TOTAL (out of 1 0)
1 64
Mark
1 1 0 0 1
0 .7 1 1 1 1
8.2

Chapter 7: Results (Part 1)
7. 1. 7 Farm 7
Genera l Characteristics
The Farm Busi ness
Farm 7 is a husband and wife partnership. Both the husband and the wife direct the
farm. The husband is more focused on the product ion activit ies of the farm and the wife
does most of the paper work and financial management . Occasional ly some of the
children help with the farming act ivit ies. Farm 7 is a dairy enterprise on leased land.
The pminership owns all the cows, plant and the machinery.
The system is focused on maximizing milk product ion with the available resources.
They have also been focused on increasing the cow numbers. Farmer 7 ment ioned that
they usually have liquid ity prob lems. This problem o f cash avai labi l ity forces them to
use less concentrates and less fert il izer than they would like t o use.
The Farmer
Farmer 7 is a very experienced person in farming. He worked for Farmer 2 for several
years and then they became equity partners in a dairy-farming project . Farmer 7 bought
halfof the business fi·o m Farmer 2 and cont inued with the dairy project that today is
Farm 7.
Occasionally Farmer 7 is invo lved in other dairy farms, especial ly during the
development of new da iry farms, where he helps to supervise the daily dut ies and so lve
operat ional problems.
Farmer 7 is a local person and an act ive learner from colleagues, neighbours and
fi·iends . He very rarely reads technical journals.
Feeding Sources
On Farm 7 farmers do not carry many physical records, therefore only general data
about t he system is detailed in this sect ion.
Approximately 60% of t he annual requirements of a l l the dairy animals are produced on
the milk platform (grass, summer crops, winter crops and maize silage).
1 65
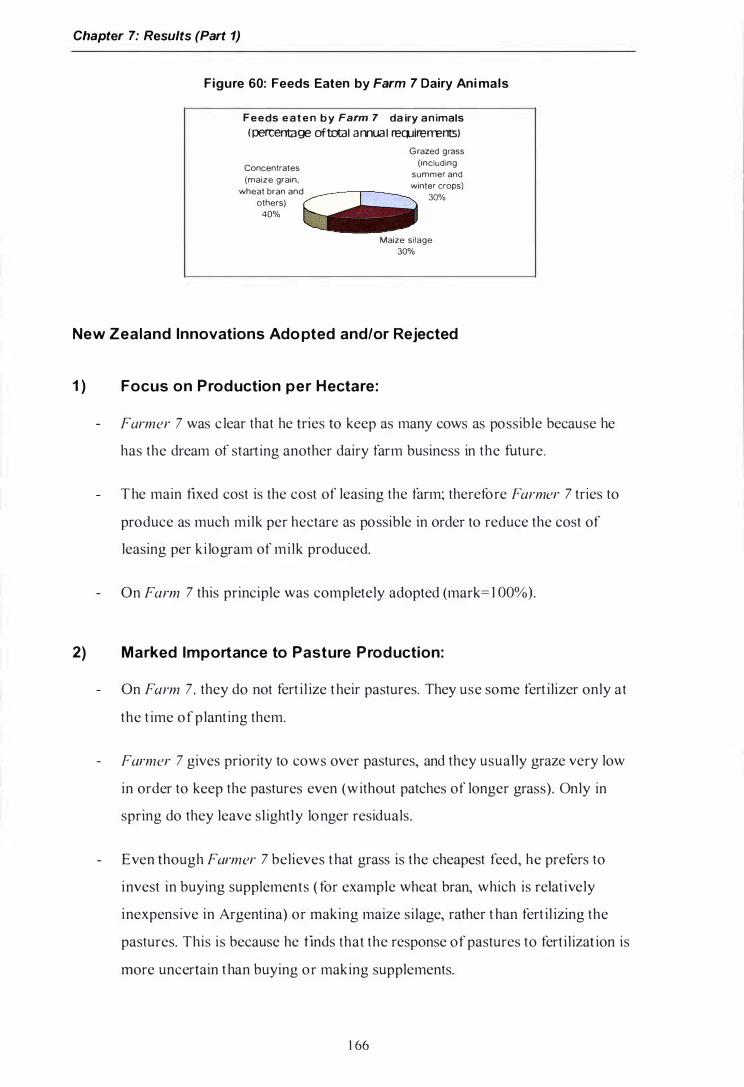
Chapter 7: Results (Part 1)
Figure 60: Feeds Eaten by Farm 7 Dairy Ani mals
F e e ds e a t e n b y Farm 7 da iry a n imals
< percentage oftotal annua l reQ..Jirerrents>
Concentrates (maize grain,
wheat bran and others)
40%
Grazed grass (including
summer and winter crops)
30%
Maize silage 30%
New Zealand Innovations Ado pted and/or Rejected
1 ) Focus on Production per Hectare:
Farmer 7 was c lear that he tries to keep as many cows as possible because he
has the dream of stat1ing another dairy farm business in the future.
The main fixed cost is the cost of leasing the farm; therefore Farmer 7 tries to
produce as much milk per hectare as possible in order to reduce the cost of
leasing per ki logram of milk produced.
On Farm 7 this principle was completely adopted (mark= 1 00%).
2) Marked Importance to Pasture Production:
On Farm 7, they do not fert i l ize their pastures. They use some fert ilizer only at
the t ime of plant ing them.
Farmer 7 gives priority to cows over pastures, and they usually graze very low
in order to keep the pastures even (without patches of longer grass). Only in
spring do they leave sl ightly longer residuals.
Even though Farmer 7 believes that grass is the cheapest feed, he prefers to
invest in buying supplements ( for example wheat bran, which is relat ively
inexpensive in Argentina) or making maize silage, rather t han fert il izing the
pastures. This is because he finds that the response of pastures to fert il izat ion is
more uncertain than buying or making supplements.
1 66

Chapter 7: Results (Part 1)
Another important aspect of Farm 7 is that there are usual ly feed deficits in the
winter when pastures do not grow, even if they are fertilized ; consequent ly they
prefer to use maize s i lage and supplements instead .
On Farm 6 this principle was not adopted (mark=O%).
3) Quantitative Pasture Monitori ng :
Farmer 7 and the person in charge of the grazing are very experienced in
grazing management . T hey do not use any kind of recording method for pasture
growth or pasture cover.
In Farm 7 they do not use quantitat ive pasture monitoring because they bel ieve
they that they do not need to do it .
In Farm 7 this principle was not adopted (mark=O%).
4) Uti l ization of Formal Pasture Budgets :
Farmer 7 bel ieves that he and the person in charge do not need to do pastoral or
feed budgets. They base their feed management on the observation of the farm
and on their own experience.
In Farm 7 this princ iple was not adopted (mark=O%) .
5) Ski l led and Motivated People Working on Farms :
Farmer 7 finished primary and secondary educat ion; the secondary school he
attended included a specializat ion in farming. He then worked for many years in
farming and accumulated experience, knowledge and ski l ls. Most of his
experience has been in operat ional and tactical planning, implementation and
contro l. When they started with Farm 7. he and his wife became invo lved in the
strategic aspects of the farm business. When Farmer 7 is not employed as a
manager in other dairy fanns he works on Farm 7.
The other people that work on Farm 7 have quite low levels of formal educat ion.
Two o f them are very experienced in dairy farming and have worked with
Farmer 7 for many years.
1 67

Chapter 7: Results (Part 1)
I n Farm 7 the owners work in their own farm business, and their main income
comes from the farm. They are strongly motivated because they are growing the
family business. Farmer 7 has experienced the adoptio n of the New Zealand
innovations described in Farm 2, and has adopted the practices that he bel ieves
are beneficial for his own farm.
The working environment and the working conditions are better than on a
typical Argentine dairy farm. Farmer 7 mentioned t hat one of his daughters
works occasionally on the farm and is planning to work full t ime next season.
In this aspect Farm 7 is similar to a N ew Zealand dairy farm (mark= l OO%).
6) Less than 1 5 cows per Set of Teat-cups, and Other Innovations that Impact on Labou r Productivity:
On Farm 7 they have approximately 25 cows per sets of teats-cups ( 1 .6 7 times
more cows per set of teat-cups than in New Zealand). Farmer 7 does not like
situations when people have to spend too much time milking the cows.
In Farm 7 they usual ly work very intensively and sometimes long hours. The
fact that the owner (the person who makes the investment decisions) works on
the farm has helped to design a simple system in which everything is done as
quickly as possible ( mark=SO%).
7) Seasonal Calving, One or Two Calving Periods per Year:
On Farm 7 there are two calvings, each f()r a period of three months, one in
autumn (70% of the cows) and one in spring (30% o f the cows). They started
with the cows that they had, and slowly they have fitted the cows into the two
seasons.
'We need the col-1:'>' to produce during summer (\pring calving) because we still
have to pay the f'arm lease and other costs. A nd our cows produce during the
winter (autumn calving) because the dairy company indirectZv obliges us to do
so because the milk price is h igher in winter. '
They adopted this New Zealand innovation completely ( mark= I OO%).
1 68

Chapter 7: Results (Part 1)
8) New Zealand Genetics:
In Farm 7, they are slowly increasing their util izat ion ofNew Zealand genet ics.
They bought some Jersey bul l s from Farmer 4 and last year approximately 30%
o fthe cows were mated with New Zealand genet ics (both bul ls and semen) . 'My
idea is to keep increasing the proportion of Nevr Zealand genetics. my idea is
not to have all Jersey cows hut I would like to have crossbreds or threefourths
Jerseys. '
Farmer 7 ment ioned that he l ikes New Zealand genet ics cows because of 'their
size. the strength of their legs and their udders '. He ment ioned that after
working for many years with New Zealand genetics, he started working in a
dairy farm with all North American Holstein cows. He said that he tried to send
the cows to graze in paddocks that were quite far from the milk ing shed and the
cows started to 'he destroyed ' and that 'in summer they stayed under the trees
all day while my crossbreds at home VI-ere grazing comfortah�v. ' I suggested to
the owners of this farm that they should buy some New Zealand Holstein
Friesian cows, they d id it, and they had good results with them: ' the New
Zealand Holstein Friesian coH�\· did not produce as much as the North American
co \\ :s· hut they got in-cal{every year (and the others did not) and produced
similar amounts of milksolids. '
Farm 7 adopted this New Zealand techno logy partial ly (mark=30%).
9) Rearing of Calves in G roups:
Farmer 7 bel ieves that rearing calves in groups is much better than doing it
individually. He mentioned that in a farm in which they were having problems
rearing the calves, he suggested changing to group-rearing and al l problems
were solved. Farmer 7 was asked if rearing calves individual ly would be
successful in situations in which the person in charge of rearing the calves was
not very ski lful. He answered that people can be easily trained to rear calves in
groups, and also stated that he does not believe in having people that are not
ski lful and do not want to learn. '!{that is the situation the most that you can do
is wait one or two weeks until you find another worker '.
1 69

Chapter 7: Results (Part 1)
In Farm 7 they completely adopted this N ew Zealand practi se for all the calves
(mark= l OO%).
1 0) Style of M i lk ing Shed and M i lking System:
O n Farm 7 they have a typical N ew Zealand herringbone with a one high-line o f
sets of teat cups because they believe i s a simpler and less expensive system.
Because Farm 7 is on leased land; Farmer 7 prefers not to invest too much in
buildings, therefore they used a shed that was already on the farm. When the
leasing contract finishes they would take most ofthe investment with them. I n
Farm 7 the milking shed and milking system are N ew Zealand style
( mark= l OO%).
Table 1 9: Summary of Innovations Adopted or Rejected by Farm 7
New Zealand Innovations Mark
1 ) F ocus on Production p er Hectare 1 2 ) M arked Importance to Pasture Production 0 3 ) Quantitative Pasture M onitoring 0 4) Ut i l izat ion of Formal Pasture Budget s 0 5) Skil led and Motivated People W orking on Farms 1 6) Less than I 5 cows per Set of Teat-cups 0 .5 7) Seasonal Calving, One or Two Calving Periods per Year I 8 ) N ew Zealand Genet ics 0 .3 9) Rearing of Calves in Groups I 1 0) S tyle of M i lking Shed and M i lking System I
TOTAL (out of 1 0) 5.8
I 70

Chapter -7: Results (Part 1}
7.2 Summary of Adopt ion of NZ I n novat ions by the Case Study Farms
Figure 61 : Summary of Adoption of NZ Innovations by the Case Study Farms
1) Focus on Production per Hectare 1 1 1 1 1 2) Marked Importance to Pasture Production 0 . 25 1 0 .6 1 0 3) Quantitative Pasture Monitoring 0 .25 0 . 9 0 . 8 0 . 9 0 4) Utilization of Formal Pasture Budgets 0 1 0 . 9 1 0 5) Skilled and Motivated People Working on Farms 0 1 0 0 . 8 0 . 3 6) Less than 15 cows per Set o f Teat-cups 0.45 0 . 5 0 . 3 0 . 4 0 . 0 7) Seasonal Calving, One o r Two Calving Periods per year 0 . 1 7 1 0 1 1 B) New Zealand Genetics 0 .2 1 0 1 0 .67 9) Rearing o f Calves in Groups 0 . 1 1 1 1 1
1 1 7.0 1 0 3.9
0 . 5 0 3.4 0 0 2.90 1 1 4. 1
0 . 7 0 . 5 2.85
1 1 5.2 1 0 . 3 4.2 1 1 6.1
6.8
Figure 6 1 shows a summary of the innovat ions adopted by the case study farms. The bo ld numbers of the bottom of the figure are the sum
of all the innovat ions adopted by each of the farms. For example Farm 2 with 9 .4 innovat ions adopted (out of I 0 ) is the case study that
adopted more New Zealand innovat ions. The bo ld numbers at the extreme right of the figure are the sum of the different proportions of the
same innovat ion adopted by the case studies. For example the Focus on Production per Hectare ( innovat ion I ) was adopted by 7 (out of7)
of the case studies. I n the same way Farm I is the case study that less innovat ions adopted, and innovations 4 ( Utilization of Formal
Pasture Budgets) and 6 (Less than 15 coVI:s· per Set of Teat-cups) were the innovat ions less adopted by the case stud ies.
1 7 1

Chapter 7: Results (Part 1)
7 . 3 The Context : Perception of the Attributes of the
I nn ovations
I n order t o have a general idea of the perception o f some New Zealand innovations by
Argentine dairy farmers and consultants, an informal survey was done. The survey
asked about the perception of the interviewee of a group of defmed New Zealand
innovations. Each innovation was ranked for 4 characteristics, which were: "Level of
Advantage", "Level of Compatibility", "Level of Trialabilty", and "Level of Awareness
of Results" (these concepts are explained further on section 2 . 1 .3 . 1 ) . The ranking was
from " 1 " (very low) to "4" (very high).
I s important to mention that the questionnaires included 1 4 New Zealand innovations,
these were the innovations that were proposed in the beginning of the present study and
were then reduced to the fma1 1 0 innovations ( see section 6 . 1 ) .
I n total 29 questionnaires were answered b y three different groups of Argentine people:
1 ) The 7 case study farmers and some oftheir dairy farmers answered 1 4
questionnaires.
2 ) Four Argentine dairy farmers with no known relationship with New Zealand
innovations were surveyed.
3 ) And fmally 9 consulting o fficers were surveyed.
The average results of the perception survey are summarized in the following tab les for
each group:
1 72

Chapter 7: Results (Part 1)
Table 20: Results from the Perception Survey with Case Study
Farmers (n= 1 4)
Level of Level of Level of Level o f Advantage Compatibi l i ty Trialabi l i ty Observability
I ) Stocking rate decided taking in to account prices o f mi lk and supplements 3 3 3 3 2 ) I ntention to ra ise t he phosphate level of soi Is 3 4 4 3 3 ) I ntent ion to have pastures that last more than 4 years wi thout the need to replant t hem 4 3 3 3 4) Ut i l izat ion of adequate spec ies on pastures 3 3 3 3 5 ) Quantitative past ure mon itoring 4 4 3 4 6 ) Target pre and post grazing pasture covers 3 3 3 3 7 ) Ut i l izat ion of formal pastora l budgets 4 4 3 4 8 ) M ore "technology" and less working hours 4 4 4 3 9 ) Ski l led and mot ivated people working on farms 4 4 3 4 I 0 ) Worki ng contract s imi lar to ew Zea land share-mi lk ing contracts 3 3 3 4 1 1 ) Seasonal calving, one or two calving periods 4 3 3 3 1 2 ) New Zea land genetics
4 4 3 3 1 3 ) Rearing of ca lves in groups
4 4 4 4 1 4) Style of m i l k i ng shed and m i lk ing system 4 3 3 3
TOTAL 49 48 44 48
G EN ERAL TOTAL = 1 89
1 73
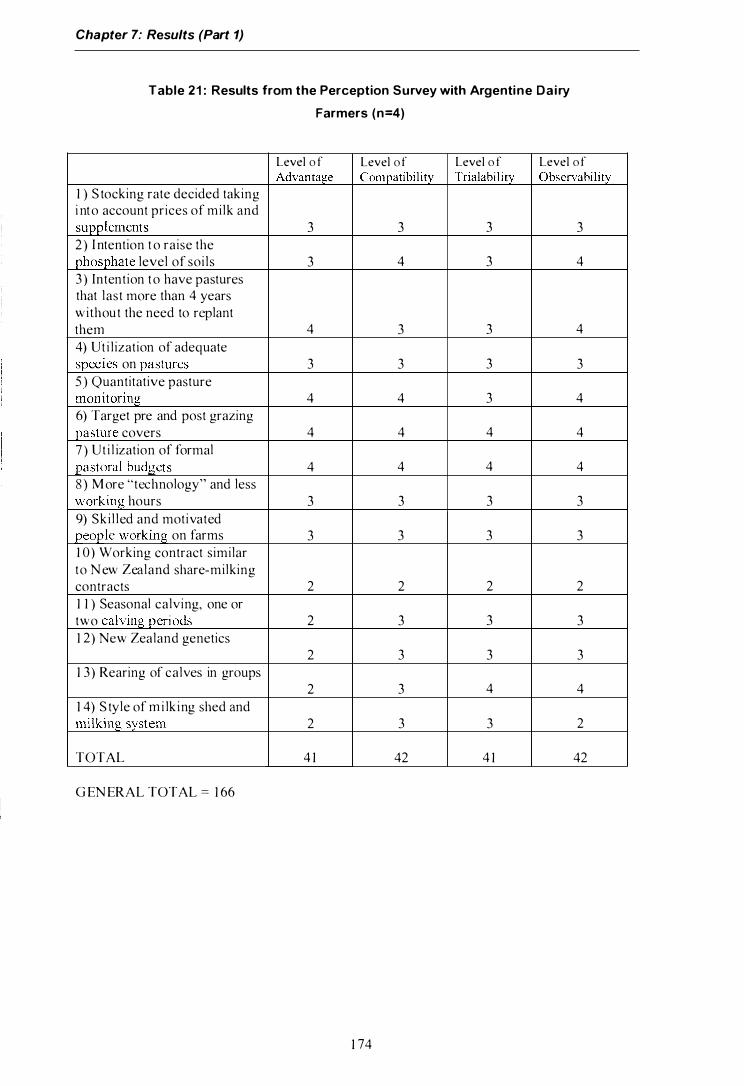
Chapter 7: Results (Part 1)
Table 21 : Results from the Perception Survey with Argentine Dairy
Farmers (n=4)
Level o f Level o f Level o f Level o f Advanta_ge Compatibi l i ty Trialabil i ty Observabil i ty_
1 ) S tocking rate decided taking i nto account prices of milk and supr_lements 3 3 3 3 2 ) I ntention t o raise the phosphate level of soi ls 3 4 3 4 3 ) Intention to have pastures that last more than 4 years without the need to replant them 4 3 3 4 4) Ut i l ization of adequate species on pastures 3 3 3 3 5 ) Quantitative pasture monitoring 4 4 3 4 6) Target pre and post grazing pasture covers 4 4 4 4 7 ) Ut i l ization of formal pastoral budgets 4 4 4 4 8 ) M ore "technology" and less working hours 3 3 3 3 9) Ski l led and motivated people working on farms 3 3 3 3 1 0 ) Working contract similar to N ew Zealand share-milking contracts 2 2 2 2 1 1 ) Seasonal calving, one or two calving periods 2 3 3 3 1 2) New Zealand genetics
2 3 3 3 1 3) Rearing of calves in groups
2 3 4 4 1 4) S tyle of m i lking shed and mi lking system 2 3 3 2
TOTAL 4 1 42 4 1 42
G EN ERAL TOTAL = 1 66
1 74

Chapter 7: Results (Part 1)
Table 22: Resu lts from the Perception Survey with Argentine Dairy
Consultants (n=9)
Level of Level of Level of Level of Advantage Compatibi l i ty Trialabi l i ty Observabi l i ty
I ) Stocking rate decided tak ing into account prices o f mi lk and supplements 3 3 3 3 2 ) Intent ion to ra i e the phosphate level of soi ls 4 4 3 4 3 ) Intent ion to have pastures that last more than 4 years without the need to replant them 3 3 3 3 4) Uti l izat ion of adequate species on pastures 3 3 3 3 5 ) Quant itative pasture mon itoring 4 3 4 3 6) Target pre and post grazing pasture covers 3 3 3 3 7 ) Uti l izat ion of formal
pastoral budgets 4 4 4 4 8 ) More "technology" and less work ing hours 3 3 3 3 9) Skil led and mot ivated people working on farms 4 4 3 4 I 0) Working contract s imi Jar to New Zealand share-mi lk i ng contracts 3 3 2 3 I I ) Seasonal cal ving. one or two calving periods 3 2 3 3 1 2) New Zealand genet ics
2 2 2 2 1 3 ) Rearing of calves in groups
3 3 3 3 1 4) Style of milking shed and mil king_ system 3 3 3 3
TOTAL 45 43 42 43
GENERAL TOTAL = 1 73
1 75

Chapter 8: Results (Part 2)
8 RESU LTS (Part 2)
8 .1 Performance of The Case Stud ies : Associat ion
with Adopt ion of New Zealand Innovations
I n this section some physical and financial indicators of the case study farms are
analysed and contrasted with typical New Zealand and Argentine farms.
8. 1. 1 Definition of the seasons to be analysed
Data from two seasons is presented for each farm. It is important to mention that the
seasons are considered in different ways by the farms (see Table 2 3 ).
The difTerences in the financial years meant data collected from Argentine farms varied
and this was especially the case with milk prices. The variation was exacerbated in 2002
by high inflation and by a significant devaluation of the Argentine currency. Therefore
when comparing the Argentine farms, the differences in financial years should be
remembered.
Table 23: Definition of the Financial Years of the Case Studies
Season 2002 S eason 2003
AR-150 (IFCN model) January 02 - December 02 January 03 December 03
AR-350 (IFCN model) January 02 - December 02 January 03 - December 03 AR-1400 ( IFCN model) January 02 - December 02 January 03 December 03 f(mn 1 July 0 I - J une 02 July 02 June 03 Farm 2 February 02 - January 03 February 03 - January 04 Farm 3 July 0 1 - June 02 July 02 June 03 Farm 4 July 01 - June 02 July 02 June 03 Farm 5 February 02 - January 03 Not enough data available Farm 6 Not enough data available Not enough data available Farm 7 Not enough data available July 02 -- June 03 NZ-239 ( IFCN model) J une 0 1 - May 02 June 02 - May 03 NZ-447 ( IFCN model) June 0 1 - May 02 June 02 May 03 NZ-835 (IFCN model) June 0 1 - May 02 June 02 May 03
B ased o n the financial years used by the Argentine farms, there are three distinct ive
t:,rroups for each season:
1 76

Chapter 8: Results (Part 2)
Season 2002
The first group is formed by the three typical Argent ine farms with original data from
January 2002 to December 2002. During this period the exchange rate changed from I
AR-$ per each US-$ at the beginning of January, to 3 . 5 A R-$ per each US-$ at the end
of December, with an average exchange rate of 3 . 1 A R-$ per each US-$ (FXHistory:
Historical currency exchange rates, 2005). The inflat ion during this period was 1 1 8%
(calculat ions based on the Wholesale Price I ndex I DEC, 2005). Argentine milk prices
during this period increased 2 .5 times in A R-$ (calculat ions based on Argentine M ilk
Prices).
The second group is formed by three case studies with original data from July 200 I to
June 2002 ; they are AR-6 1 50, AR- 1 754 and 1 483 (Farms 1, 3 and 4, respect ively).
These farms share six months in common with the farms o f the ftrst group. The
exchange rates during this period changed from I AR-$ per each US-$ in July 200 1 to
3 .63 AR-$ per each US-$ in June 2002, with an average exchange rate of 1 . 8 AR-$ per
each US-$ (FX/-fistOJy Historical currency exchange rates, 2005) . In flation during this
period was 88% (calculat ions based on the Who lesale Price Index I DEC, 2005).
Argent ine milk prices increased during this period 1 .4 t imes in AR-$ (calculat ions based
on Argent ine Milk Prices).
The third group is fom1ed by AR-2087 and AR-9 1 5 (Farms 2 and 5. respect ively).
These two farms have their financial year fi·om February 2002 to January 2003 . And
they differ only by one month from the financial year of the first group and share five
months in common with the financial year of the second group. The exchange rates
during this period changed from 2 AR-$ in February 2002 per each U S-$ to 3 . 3 AR-$
per each U S-$ in January 2003, with an average exchange rate of 3 . 3 AR-$ per each
US-$ (FXHistory: Historical currency exchange rates, 2005). Inflat ion during this
period was I 06% (calculat ions based on the Who lesale Price Index IN DEC, 2005) .
Argentine milk prices increased during this period 2 .5 t imes in AR-$ (calculat ions based
on Argent ine Milk Prices) .
The farms of the three d ifferent groups experienced quite d istinct changes in exchange
rates, inflat ion, and Argent ine milk prices. Therefore, for the 2002 season, financial
comparison across groups of farms were avoided and comparisons within groups were
done cautiously.
1 77

Chapter 8: Results (Part 2)
Season 2003
First group:
Formed by t he t hree typical Argentine farms.
Original data from January 2003 to December 2003 .
Exchange rate with little variat ion and average of3 AR-$ per each U S-$
(FXHistory: Historical currency exchange rates, 2005) .
Inflation for the period 2% (calculat ions based on the Wholesale Price Index
INDEC, 2005).
Argentine milk prices relat ively constant, with seasonal variations, in AR-$
(calculat ions based on Argentine M ilk Prices).
Second group:
Formed by AR-6350, AR- 1 700 and AR- 1 483 (Farms I , 3 and 4, respectively).
AR-400 (Farm 7) is added to this group in this season.
Original data from July 2002 to June 2003 .
Exchange rate of 3 . 6 AR-$ per each U S-$ in July 2002 to 3 AR-$ per each U S-$
in June 2003 , with an average of 3 . 3 AR-$ per each U S-$ (FXHistory: Historical
currency exchange rates, 2005).
Inflat ion for the period 8 . 1 % (calculations based on the Wholesale Price Index
I N DEC, 2005) .
Argentine milk prices increased I . 92 t imes in AR-$. M ilk prices for the first
group were, on average, 1 .29 t imes higher ( in US-$) than for this group
(calculat ions based on Argentine M ilk Prices).
Third group:
Only AR-2530 (Farm 2) forms this group in this season.
Original data from February 2003 to January 2004.
1 78

Chapter 8: Results (Part 2)
Exchange rate with l it t le variation and average of3 A R-$ per each U S-$
(FXHist01y: Historical currency exchange rates, 2005 ).
Inflat ion 1 . 2% (calculat ions based on the Who lesale Price I ndex IN DEC, 2005).
This group had a period of higher Argent ine milk prices than the other two
groups; milk prices were 1 .02 t imes higher (in US-$) than for the first group and
1 . 32 t imes higher ( in U S-$) than the for second group (calculations based on
Argent ine Milk Prices) .
Difference across the financial years is lower in this season than in 2002, especially for
the first and third groups, which experienced less variation in exchange rates and
infl at ion. Therefore, comparisons across the first and AR-2530 or Farm 2 (third group)
were done, taking into account t he small difference in the Argentine milk price between
the two financial years. And comparisons of farms of the second group with farms o f
the other two groups was made w ith caution, taking into account the difference in the
Argent ine milk price between the two financial years.
8. 1. 2 The Case Studies in IFCN Format
Basic descript ive data for the case study farms in 2003 are shown in Table I 0 (Chapter
5 ) . A simi lar format to that used in section 3 .2 to present the results from comparisons
between Argent ine and New Zealand typical farm models is used in this chapter to
present the results of analyses for the case study farms.
As shown in Table 1 9, Farm 6 is not presented because there were not enough data for
the analysis.
Fo llowing the I FCN format, farms are named with two letters of the country and the
average number of cows for that season (see Table 24).
1 79

Chapter 8: Results (Part 2)
Table 24: Names Given to the Case Study Farms on Figures
Season 2002 Season 2003
Farm 1 AR-6 1 50 AR-6350 Farm 2 AR-2087 AR-2530 Farm 3 AR- 1 754 AR- 1 700 Farm 4 AR- 1 375 AR- 1 483 Farm 5 AR-9 1 5 -Farm 7 - AR-400
As shown in Table 24, Farm 5 (AR-9 1 5) appears only in the analysis for the 2002
season, and Farm 7 (AR-400) appears only in the analysis for the 2003 season.
8. 1 .3 Financial Performance
M ilk Prices, Pro fits, Operating Profit Margin, and Returns on I nvestment ( ROI ) are
analysed in order to compare the fmancial performance of the Argentine farms. First the
indicators are analysed for 2002, and then 2003 . F inal ly, the level of financial
performance is related to the level o f adoption of N ew Zealand innovat ions.
Season 2002
20
1 8
� 16
� 14 """
E 1 2
Z' 10
8 8 -
- 6 ""'
4 -U) => 2
0
• •
g g
� � < <
•
8 ..-� <
Figure 62: Mi lk Price (season 2002)
Milk Price (season 2002)
• • •
• • • • •
g ,._ � M "' 0> � "' a:> a:> q; M M
� 0 ..- 'l' "i' 'l' � � 0:: '21 '21 '21 0:: < < < < <
M ilk prices are calcu lated, in the I FCN database, by dividing the milk returns by the
total k i lograms of milk (ECM) so ld.
The three Argentine typical farms ( first group) had similar milk prices, sl ightly
increasing wit h the farms' s ize.
1 80
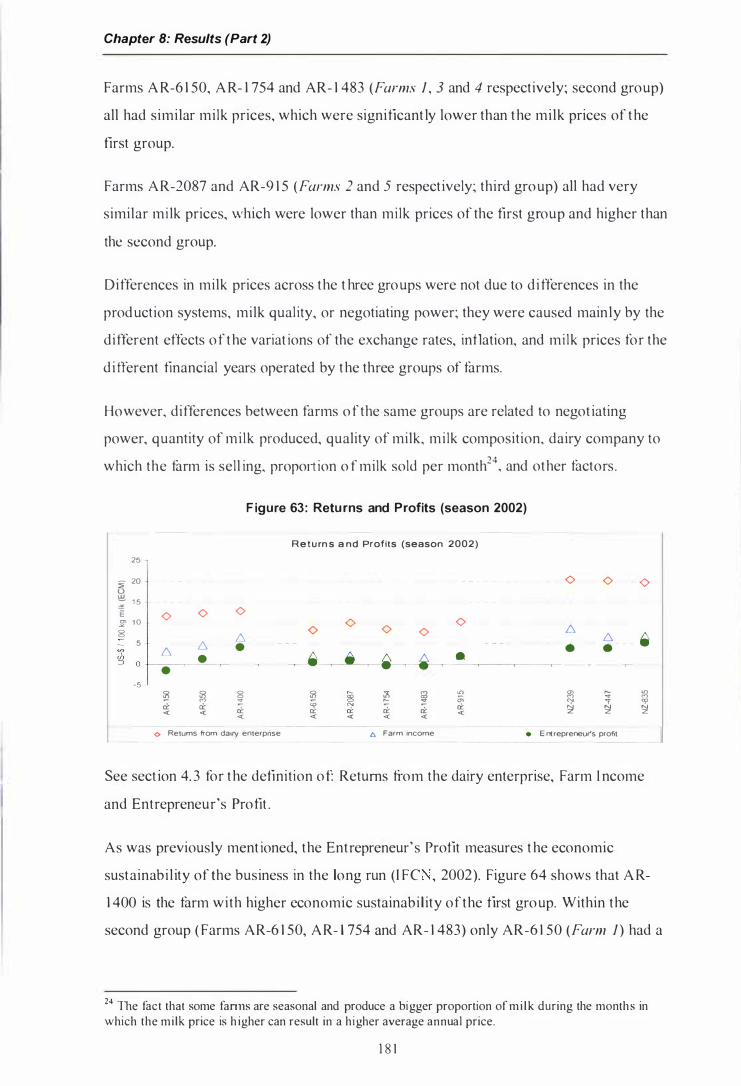
Chapter 8: Results (Part 2}
Farms A R-6 1 50, A R- 1 754 and AR- 1 483 (Farms 1 , 3 and 4 respectively; second group)
all had similar milk prices, which were significant ly lower than the milk prices of the
first group.
Farms AR-2087 and AR-9 1 5 (Farms 2 and 5 respect ively; third group) all had very
similar milk prices, which were lower than milk prices of the first group and higher than
the second group.
Differences in milk prices across the t hree groups were not due to d ifferences in the
production systems, milk qual ity, or negotiating power; they were caused mainly by the
different effects of the variat ions of the exchange rates, inflation, and mi lk prices for the
d ifferent financial years operated by the three groups of farms.
However, differences between farms of the same groups are related to negot iating
power, quantity of mi lk produced, quality of milk, mi lk composition, dairy company to
which the farm is sell ing, proport ion o f milk sold per month24, and other factors.
25
� 20 (.) w :; 1 5 E � 1 0 8
5
·5
<>
F igure 63: Returns and Profits (season 2002)
Return s a nd Profits (season 2002)
0 0 0 <> 0
0 0 0 /:::, /:::, /:::, •
• � ' � � • •
� ill � ill � � !i? "' a; M � c/:: c/:: do N do do c/:: <( <( c/:: <( <( <( <( <( <(
Retums from dairy enterpnse D. Farm income •
0 0 <>
/:::, /:::, � • •
"' ,.._ "' M :y M
� 'I' N N z z
E nt repreneur's profit
See sect ion 4. 3 for the definition of: Returns from the dairy enterprise, Farm I ncome
and Entrepreneur's Profit .
As was previously ment ioned, the Entrepreneur' s Profit measures t he economic
sustainabil ity of the business in the long run (I FC , 2002). Figure 64 shows that A R-
1 400 is the farm with higher economic sustainabil ity of the first group. Within the
second group ( Farms AR-6 1 50, AR- 1 754 and AR- 1 483) only AR-6 1 50 (Farm 1 ) had a
24 The fact that some fanns are seasonal and produce a bigger proportion of mi lk during the months in which the milk price is h igher can result in a higher average annual price.
1 8 1

Chapter 8: Results (Part 2)
posit ive Entrepreneurs ' Profit . And within the third group AR-9 1 5 (Farm 5) had h igher
Entrepreneurs Profit than AR-2087 (Farm 2) .
Figure 64: Operating Profit Margin (season 2002)
Operating Profit Margin (season 2002)
60°/o
r--50°/o
40°/o - ,.....,.,.- --
r-- -30°/o -
r-- - ,.----20%
- r--
10%
oolo �
fll fll � fll � :!? M .,., "' � .,., � a; M � � M <0 0 � ci:: � N ':± ':± ci:: '2! '2! <( <( ci:: ci:: <( <( <( <( <( <(
The Operating Profit Margin is calculated by dividing the Operating Profit (calcu lated
as Farm I ncome + Paid land rent + Paid I nterest on l iabi l it ies - Calculated cost for
unpaid family labour, see section 4 .3 ) by the Total Returns. As was previously
mentioned, the Operating Profit Margin is an indicator of the operating efficiency of the
dairy farms; it ind icates how well the farms have turned income into profit .
W ith in the first group ( the three typical Argent ine farms), the Operat ing Profit Margin
increased with the size of the farms. Within the second group (AR-6 1 50, AR- 1 754 and
AR- 1 483) , AR-6 1 50 (Farm 1 ) had the highest Operating Profit Margin. Within the third
group (AR-2087 and AR-9 1 5 ), AR-2087 had the highest Operating Profit Margin.
Figure 65: Return on Investment (season 2002)
Return on I nvest ment (season 2002)
1 82

Chapter 8: Results (Part 2)
The Return on Investment ( ROI ) is calculated by dividing the Operating Profit by t he
market value of all the assets invested in the business. I t is a relevant indicator for
people who want to invest in dairy farming.
Within the first group (the three typical Argentine farms), in season 2002, AR- 1 400 had
the highest ROI . Within the second group of farms ( Farms AR-6 1 50, AR- 1 754 and AR-
1 483), A R-6 1 50 (Farm I ) had the highest ROI . And within the third group AR-9 1 5
(Farm 5) had much higher ROI than AR-2087 (Farm 2); this is caused by the fact that
Farm 5 leased all the land and consequently had less total assets invested .
Season 2003
20 1 8
::E 1 6 0 !:!. 1 4
� 1 2
� 1 0
8 8
".' 6
3 4 2
0
•
F igure 66: M i lk Price (season 2003)
Milk Price (season 200 3)
• • • • • • • •
• •
For the 2003 season the average milk price for the typical Argent ine farms ( first group)
was 1 5 . 5 U S-$ per I 00 kilograms of milk ( ECM) . For the second group the average
milk price was 1 4 .7 US-$ per I 00 kilograms of milk ( ECM) for AR- 1 700, AR- 1 375 and
AR-400 (Farms 3, 4 and 7) and AR-6350 (Farm I ) had a lower milk price ( 1 2 . 6 U S-$
per I 00 kilograms of milk). AR-2530 (Farm 2), which is the only farm o f group three,
had a milk price o f 1 6 . 7 US-$ per I 00 kilograms of milk.
As was prev iously ment ioned differences in milk prices between farms of d ifferent
groups are mainly due to the dist inct ive financial years and differences between farms
of the same groups are related other factors.
Within the second group AR-6350 (Farm l). had a considerably lower price than the
average of the other three case studies. The causes are unknown but this could be related
to a difference in the way o f recording the financial information, because Farm 1 also
presented lower expenses than the other farms.
1 83

Chapter 8: Results (Part 2)
When analysing other financial indicators the fo llowing points should be remembered:
25
A R-2530 had the highest milk price received in this season ( 1 6. 7 US-$ per I 00
kilograms of milk).
A R-2530 milk price was 1 .25 , 1 . 1 2 and 1 .06 t imes higher than AR- 1 50, AR-350
and AR- 1 400, respect ively (first group).
A R-2530 milk price was 1 .40, 1 . 1 6, 1 . 1 7 and 1 .27 t imes higher than A R-6350,
A R 1 700, AR- 1 375 and A R-400, respect ively (second group).
Figure 67: Returns and Profits (season 2003)
Profits a n d Returns {2003)
::E 20 <> <> <> <> <> <> t.) <> <> UJ <> <> <> ;; 15
.E � 10 6. 6. 8 • 6. 6. - 5 6. • • � • � • 6. 6. "" • • (/) 0 .--�.- .--.-.--:::J
-5 fil fil 8 fil g 8 � 0 -;!, � "'
0 M
� eo;> ;! M "' ,._ M "' <')' � 0::: ci: 'I' <')' ci: ci: 0::: 'Zl 'Zl < < 0:: 0::: < < < < < < <) Returns from dairy enterprise t:. Farm income • E ntrepreneu(s profit
AR-350 had the highest Entrepreneurs' Profit within the first group of typical Argentine
farms. AR- 1 700 ( Farm 3) had the highest Entrepreneurs' Profit within the second group
(AR-63 50 or Farm I, AR- 1 375 or Farm 5 and AR-400 or Farm 7). AR-2530 or Farm 2
(third group) had an Entrepreneurs' Profit 1 .07 t imes of that of AR-350.
Figure 68: Operating Profit Margin (2003)
Operating Profit Marg i n {season 2003)
---.-r-
r- -� -
I""""'"" ,..,..,....,.r-� �
fil � 8 fil � � "' 8 -;!, ,._ � ,._ 'f � .,. M M "' <')' "'' 0::: � 'I' <)I � � 0:: !:;I !:;I !:;I < < 0::: 0:: < < < <( <( <(
1 84

Chapter 8: Results (Part 2)
Within the first group (the three typical Argentine farms), AR-350 had the h ighest
Operat ing Profit Margin. Within the second group (AR-6350, AR- 1 700, AR- 1 3 75 and
AR-400), AR- 1 700 (Farm 3) had the highest Operat ing Profit Margin. AR-350 had an
Operat ing Profit Margin 1 . 3 2 t imes higher than AR-2530 or Farm 2 ( third group).
Figure 69: Return on Investment (season 2003)
R et u rn on I n vestme n t (season 2003)
35°/o
30%
25%
20%
1 5%
10%
5%
0% 5S � 0 5S g 0 :!? � -;1, ,.._ :q � 0 .,.
<'> "' ,.._ <'> � 't 'I' rl: rl: rl: "' � :f rl: oc N N N < < oc oc < z z z < < < < <
Within the first group (the three typical Argent ine farms), AR- 1 400 had the highest
ROI . Within the second group (AR-6350, AR- 1 700, AR- 1 3 75 and AR-400), AR-400
(Farm 7) had the highest ROI ; this is caused by the fact that AR-400 leased al l the land,
and therefore, had less investment in the business. The second best ROI within the
second group was to AR-6350 (Farm 1 ) . AR-2530 or Farm 2 (th ird group) had an ROI
1 . 5 and I . 77 t imes higher than A R- 1 400 and AR-63 50 (Farm 1 ), respect ively.
Summary for Season 2002 :
Within the first group, AR- 1 400 had the highest Entrepreneurs' Pro fit, Operating Profit
Margin, and Return on Investment .
Within the second group, AR-6 1 50 ( Farm 1 ) had the highest Entrepreneurs ' Profit,
Operat ing Profit Margin, and Return on Investment.
Within the third group, AR-9 1 5 (Farm 5) had the highest Entrepreneurs' Profit ; and
AR-2087 ( Farm 2) had the highest Operat ing Profit Margin. The ROI o f A R-9 1 5 ( Farm
5) was much higher than that of AR-2087 ( Farm 2), due partly to the fact t hat AR-9 1 5
leased al l the land.
1 85

Chapter 8: Results (Part 2)
Summary for Season 2003:
Within the first group, A R-350 had the highest Entrepreneurs ' Profit and Operating
Profit M argin, but AR- 1 400 had the highest ROI .
W it hin the second group, AR- 1 700 (Farm 3) had the highest Entrepreneurs' Profit and
Operating Profit M argin. And AR-6350 (Farm 1 ) had the highest ROI of the farms on
owned land. A R-400 (Farm 7) had the highest R OI of all the farms of the second group
due to the fact that it leased all the land.
A R-2530 (Farm 2) had a higher Entrepreneurs ' Profit ( 1 .07 times) than AR-350,
however this could be influenced by the fact that AR-2530 received a milk price that is
1 . 1 2 t imes higher than the milk price received by A R-350. A R-2530 (Farm 2) had the
highest ROI, 1 . 5 and 1 . 77 times higher than A R- 1 400 and A R-6350 (Farm 1 ),
respectively. However it should be remembered that AR-2530 received a milk price
1 .06 and 1 . 1 6 t imes higher than AR- 1 400 and AR-6350 respectively.
General Analysis of F i nancial Performances:
For the first group, AR- 1 400 performed better in 2002 . And in 2003 , AR-350 and AR-
1 400 performed similarly.
For the second group, AR-6 1 50 (Farm 1 ) had the best performance in 2002 . And in
2003, AR- 1 700 (Farm 3) and AR-6350 (Farm 1 ) performed similarly.
For the third group, AR-9 1 5 (Farm 5) and A R-2087 (Farm 2) performed similarly. And
in 2 003, AR-2530 (Farm 2) performed better than any farm in Entrepreneurs' Profit and
ROI. The better performance of AR-2530 was helped by the fact that it had a financial
year in which the Argentine milk prices were higher.
Ado ption of New Zealand Innovations and F inancial Performance :
The number ofNew Zealand innovations adopted by the farms analysed in this section
are shown in the fo llowing table:
1 86

Chapter 8: Results (Part 2)
Table 25: Number of New Zealand Innovation Adopted (out of 1 0)
AR- 1 50 AR-350 AR- 1 400 Farm 1 Farm 2 Farm 3 Farm 4 Farm 5 Farm 7
0 0 0 3 .2 9 .4 5 .6 9. 1 5 .0
The fo llowing figures show the association between the level adoption ofNew Zealand
innovat ions and three financial indicators (Entrepreneurs ' Profit, Operating profit
Margin, and ROI ) . On the X-axis the number of innovat ions adopted are shown, and in
the Y -axis the values for the financial indicators are shown.
Figure 70: Number of New Zealand I nnovations Adopted and
Entrepreneurs' Profit (season 2003)
: I � t u � :r -"'
E �
: j
8 V> eh :::> J
0
NZ Adoption and Entreprenuers' Profit
(season 2003)
• R7 = 0 0069 •
•
6
NZ lnnovat1ons Adopted (number)
•
•
1 0
5 .8
No association was found between the number o f innovations adopted by the Argentine
farms and their Entrepreneur's Pro fit in 2003 . Farm 2 (AR-2087 in 2002, and A R-2530
in 2003) was one of the best performers and was the farm that adopted the highest
number of innovat ions (see Table 25) . However A R- 1 400, AR-350 and Farm 1 (AR-
6 1 50 and AR-6350) , had simi lar financial performances and adopted very few N ew
Zealand innovations (see Table 25) .
1 87

Chapter 8: Results (Part 2)
Figure 71 : Number of New Zealand Innovations Adopted and
Operating Profit M argin (season 2003)
60%
NZ Adoption a nd Operating Profit Margin (season 2003)
� 50% ___ _
c: g' 40% :; � 30% a. g' 20% ·� 8" 10%
• R'= 0.327 •
0% �----�------�----�------�----� 0 4 8 10
NZ Innovations Adopted (number)
An association was found between the number of innovat ions adopted by the Argentine
farms and their Operating Profit Margin in 2003. Figure 7 1 shows that, in general, the
farms that adopted more New Zealand innovat ions had lower Operat ing Profit Margin
in 2 003.
Figure 72: Number of New Zealand Innovations Adopted and
Return on Investment (season 2003)
35%
� 30%
c 25% Cl> E � 20% > E 15% 8 E 10% :J � 0: 5%
0% 0
NZ Adoption and R eturn on I nvestment
(season 2003)
R' = 02647
6
NZ Innovations Adopted (number)
•
10
An association was found between the number of innovations adopted by the Argent ine
farms and their Return on I nvestment in 2003. Figure 72 shows that, in general; the
farms that adopted more New Zealand innovations had higher Return on Investment in
2003 .
1 88

Chapter 8: Results (Part 2)
8. 1.4 Total Costs
30
25 � u !0!. 20 �
·e SI' 1 5 0 � <Q 10 (/) ::::>
5
0 � d: <(
Figure 73: Total Costs and Returns of the Dairy Enterprise (season
2002)
Tota l Costs and Return s of the Dairy E nterprise (season 2002)
o Opportunity costs
o Depreciation
• Cash costs
o Le-...el 2: Le� 1 • cull cow, cah.es. heifer + other returns
• Le-...el 1 : M ilk price
� 0 "" � cl: d: <(
<(
In 2002 (see Figure 73 ), within the farms of the ftrst group (the three typical Argent ine
farms) AR- 1 400 had the lowest Total Costs per I 00 kilograms of milk ( ECM)
produced. Within the second group ( Farms AR-6 1 50, AR- 1 754 and AR- 1 483) , AR-
6 1 50 (Farm / ) had the lowest Total Costs but this was only s l ight ly lower than for the
two other farms. Within the third group AR-9 1 5 (Farm 5) had lower Total Costs than
AR-2087 (Farm 2) .
The difference in Total Costs across the two groups o f case studies is lower than the
difference in Mi lk Prices across the same two gro ups. As was previously ment ioned the
Total Costs were less affected by the financial distortions than the Mi lk Prices. In
general Total Costs per I 00 kilograms of milk ( ECM) in 2002 were lower for the case
studies than for the typical farms.
30
- 25 :::;; u � 20
E � 1 5
8 :: 1 0 "' (/) ::::> 5
Figure 74: Total Costs and Returns of the Dairy Enterprise (season
2003)
Total Costs a n d Returns of the D a i ry E nterprise (season 2003)
1 89
o Opportunity costs -- ::J o Depreciation • Cash costs o Lel.<ll 2: Lelo<ll 1 + cull cow, cal,.,s. heifer + other retums • Lel.<ll 1: M ilk price

Chapter 8: Results (Part 2)
I n 2 003 (see Figure 74), within the farms of the first group (the three typical Argentine
farms) A R-350 had the lowest Total Costs per 1 00 ki lograms of milk (ECM) produced.
Within the second group (Farms AR-6350, AR- 1 700, AR- 1 375 and AR-400), AR-6350
(Farm 1) had the lowest Total Costs. AR-2530 or Farm 2 (third group) had lower Total
Costs than the typical farms (first group), and was very similar to A R-400 (Farm 7) of
the second group.
8. 1. 5 Costs of Milk Production Only, Non-milk Returns, Animal
Purchases, and Replacement and Mortality Rates
For all Argent ine farms, and for both seasons, the Costs of Milk Production Only per
l OO kilograms of milk were lower in Argentina than in New Zealand. As was previously
explained this started to happen after the devaluation of the Argent ine currency in
January 2002.
Season 2002
20 1 8
� 1 6 � 1 4 -"' ·E 12 � 10 g 8 ::: 6 '? 4 (f) ::::> 2
0 5'l � <(
� cC <(
Figure 75: Costs of M i lk Production Only (season 2002)
Costs of M ilk Prod uction Only (season 2002)
� g
� � <( <( � i!? &l "' o; .... N � � cC cC <( <( <( <(
• Costs from P&L account - non-milk returns 0 Opportunity cost (excl. quota)
• • •
"' ,_ � «> ....
� "'f � S!!
. Milk price
I n 2 002 (see Figure 75), within the farms of the first group (the three typical Argentine
farms), A R- 1 400 had the lowest Costs of M ilk Production Only per 1 00 ki lograms of
mi lk (ECM) produced. Within the second group (Farms AR-6 1 50, A R- 1 754 and AR-
1 483 ), A R-6 1 50 (Farm 1) had the lowest Costs of M ilk Production Only. Within the
third group AR-9 1 5 (Farm 5), had lower Costs of M ilk Production Only than AR-2087
(Farm 2) ; however Farm 2 had lower 'Costs from Profit & Loss Account - Non-milk
1 90

Chapter 8: Results (Part 2)
Returns' than Farm 5. The fact that Farm 5 had less Opportunity Costs is because this
case study farm leased a l l its l and.
2.50
a 2.00
\,!!. � 1 . 50
';: g 1 . 00
;;; 0.50 . ::::l
0.00
Cull cow receipts
2.5
- 2 0 :::; (.) \,!!. � 1 .5 E ';: § 1 .0
"? (f) ::::l 0.5
0.0
� � «: 0
Figure 76 : Non-milk Returns (season 2002)
N on-milk Returns (season 2002)
BEL � ,.._ Jl; M "'
CO � Z9 C) ,.._ q> � � � 0:: 0:: 0:: «: «: «: «: «: Surplus heifers 0 Sale of calves 0 Other retums
Figure 77 : Animal Purchases (season 2002)
A n imal Purchases (season 2002)
•• •
� ,.._ Jl; M "' CO CO q; Z9 � ,.._ "'"
� � 0:: 0:: 0:: «: «: «: «: «:
"' ,.._ "' M "'" M
� "i 'I' N N z z z
• Change in li�oestock
� N z
"' � N z
Figures 76 and 77 have to be analysed together because the Animal Purchases are not
deducted from Non-milk Returns, although this is relevant only for AR-6 1 50 and AR-
1 754.
Within the farms of the first group (the three typical Argentine farms) AR- 1 50 had the
highest Non-milk Returns per 1 00 kilograms of milk (ECM) produced. This is possibly
due to the fact that the other two typical farms have, on average, 1 .4 times more milk
production per cow.
Within the second group ( Farms AR-6 1 50, AR- 1 754 and AR- 1 483 ), AR-6 1 50 (Farm 1 )
had the highest Non-milk Returns; however i f the Animal Purchases are deducted then
it had the lowest Non-milk Returns. Farm 1 (AR-6 1 50) had so high Animal Purchases
1 9 1
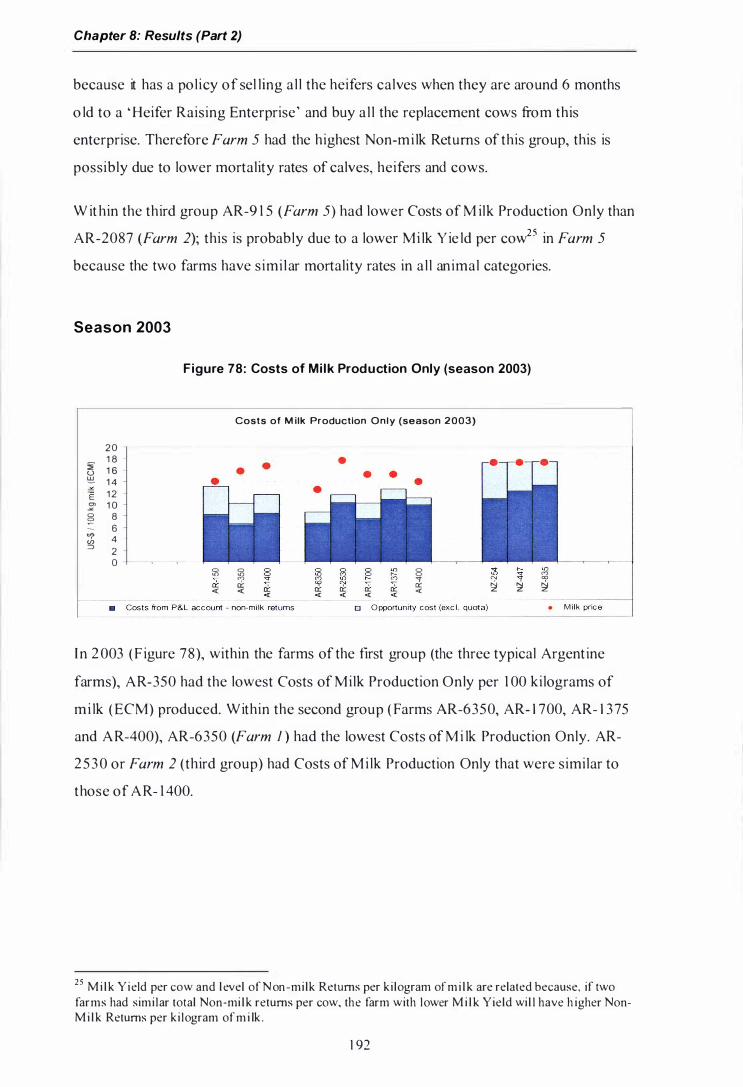
Chapter 8: Results (Part 2)
because it has a policy of sel ling al l the heifers calves when they are around 6 months
o ld to a ' Heifer Raising Enterprise' and buy a l l the replacement cows from this
enterprise. Therefore Farm 5 had the highest Non-mi lk Returns of this group, this is
possibly due to lower mortality rates of calves, heifers and cows.
W ithin the third group AR-9 1 5 (Farm 5) had lower Costs of M ilk Production Only than
AR-2087 (Farm 2); this is probably due to a lower Mi lk Yie ld per cow25 in Farm 5
because the two farms have simi lar mortality rates in al l animal categories.
Season 2003
Figure 78: Costs of Mi lk Production Only (season 2003)
Costs of M ilk Production Only (season 2003)
20 'i' 1 8 (.) 1 6 � 1 4 � E 1 2 :?} 1 0 0 8 � - 6 ., 4 en :::> 2
0 ss ss 8 y, �
"' '"' r:r '"? 't � � et: et: Si! <( <( <(
I n 2 003 (F igure 78), within the farms of the first group (the three typical Argentine
farms), AR-350 had the lowest Costs of Milk Production Only per 1 00 kilograms of
mi lk (ECM) produced. Within the second group ( Farms AR-6350, AR- 1 700, AR- 1 375
and AR-400), AR-6350 (Farm I ) had the lowest Costs of M i lk Production Only. AR-
2530 or Farm 2 (third group) had Costs of M ilk Production Only that were similar to
those of AR- 1 400.
2 5 Milk Yield per cow and l evel of Non-milk Returns per kilogram of mi lk are related because, if two farms had similar total Non-mi lk returns per cow, the farm with lower M i l k Yield wil l have h igher NonMi lk Returns per kilogram of m i lk .
1 92

Chapter 8: Results (Part 2)
Figure 79: Non-mi lk Returns (season 2003)
N on-milk Returns (season 2003)
4.00
� 3.50 � - -
0 3.00 !!:!. �
E 2.50
� 2.00 0
1 . 50 � - ,-=--..... 1 .00 en => 0.50
r--0.00
:1l :1l 0 :1l � � � 0 � � � � � M .,., M � "" "' '(f � <")' "' '(f 0:: N N N .. <( 0:: 0:: .. z z z <( <( <( <( <(
.. Cull cON receipts 0 Surplus heifers 0 Sale of calves 0 Other returns • Change in l i'l.oestock
Figure 80 : Animal Purchases (season 2003)
A n i m a l Purchases (season 2003)
4. 0
3. 5
:i" 3. 0 0 !!:!. -"' 2. 5 E ';: 2. 0
I § 1 . 5 -'? 1 . 0 en =>
0. 5
0.0 -� � § � [>l 12! .,., 8 s � :q ,_ '7 M � M .., <")' "" "' 0:: ci: � "' ci: "' 0:: N � N .. <( 0:: .. z z .. .. .. <( ..
Wthin the farms of the first group (the three typical Argentine farms), AR- 1 50 had the
highest on-milk Retums per I 00 kilograms o f milk ( ECM) produced (see Figures 79
and 80).
Within the second group (Farms AR-6350, AR- 1 700, AR- 1 3 75 and AR-400), AR-6350
(Farm / ) again had the lowest on-milk Retums when Animal Purchases was deducted.
Therefore, AR-400 (Farm 7) had the highest Non-milk Returns of this group, partly due
to the fact that has the lowest M ilk Y ield per cow of the group. AR- 1 3 75 (Farm 5) had
lower Non-milk Returns than AR-400 and A R- 1 700 because it had a replacement rate
of on ly I 0%. The Replacement Rate has an impact in the analysis, because for
Argentina the hei fers' sel ling price is usual ly lower than the cul l cows' sell ing price.
AR-2530 or Farm 2 (third group) had lower Non-milk Returns than the typical farms
(first group), mainly because it had lower Replacement Rates.
1 93

Chapter 8: Results (Part 2)
Adoption of New Zealand Genetics and Mortal ity Rates
No associat ion was found between the number of innovations adopted by the Argentine
farms and Cost of Production Only or the degree of Non-milk Returns.
However, there seems to be an association between the Mortality Rate and the adoption
of New Zealand genetics (see Table 26).
Replacement Rate Mortality Rate Cows Adoption of NZ Genet ics
Table 26: Level of New Zealand Genetics Adopted and Mortal ity
and Replacement Rates (seasons 2002 and 2003)
AR- AR- AR- Farm Farm Farm Farm Farm
1 50 350 1 400 1 2 3 4 5
26% 32% 28% 26% 2 1 % 35% 1 4% 2 1 %
4% 7% 6% 4% 3% 5 .5% 2.5% 3%
0 0 0 0 .2 I 0 I 0 .67
Farm
7
20%
3%
0 .3
The four farms that adopted more than 0 .25 of New Zealand genetics (Farms 2 , 4 , 5 and
6) had the lowest Replacement Rates ( lower than, or equal to, 2 1 %). The same farms
had the lowest Mortality Rates of cows ( lower than, or equal to, 3%). It is not possibl e
to know i f the adoption ofNew Zealand genetics i s the cause of lower Replacement and
Mortality Rates, however an association between these factors was found for the
Argentine farms stud ied in the 2002 and 2003 seasons. The fol lowing two figures
i l lustrate this association.
Figure 81 : Level of New Zealand Genetics Adopted and Mortality
Rate (seasons 2002 and 2003)
8% - 7% � 6%
New Zealand G enetics and Mortality Rate
(seasons 2002 and 2003)
.!! 5% -�---=;.-[2 4% � 3% 5 2% ::; 1%
0% �----�----�----�------�--� 0 0.2 0.4 0.6 0.8
Degree of Adoption of NZ Genentics (out of 1 )
1 94

Chapter 8: Results (Part 2)
Figure 82: level of New Zealand Genetics Adopted and
Replacement Rate (seasons 2002 and 2003)
New Zealand Genetics and Replacement Rate (seasons 2002 and 2003)
40% l 35% • V 30% ;;; ------0: 25% �----� � 20% � 1 5% � 10% & 5%
0% 0
•
0.2 0.4 0.6
R' = 0.6626
0.8 Degree of Adoption of NZ Genent1cs (out of 1 )
•
8. 1. 6 Costs Components (IFCN)
I n the fo l lowing sect ions, the different cost components are analysed. The components
of Total Costs defined by the I FCN are: Labour Costs, Land Costs, Capital Costs and
Costs as Means of Production (see sect ion 4 .3 ) .
1 00% 90% 80% 70% 60% 50% 40% 30%
1 0% 0 <() cr. <(
F igure 83: Costs Components as a Percentage of Total Costs
(season 2002)
Costs C o m p o n e n t s , as a p e rce n t a g e of Tot a l Costs (se a s o n 2 0 0 2 )
0 0 ..... ..,. M "' 0 "' � "' � ..,. 9 ..... q> cr. ":' cr. cr. 0:: 0:: 0:: <( <( <( <( <( <(
• Land costs 0 Labour costs 0 Capital costs o Cos t s for Means of Production
1 95

Chapter 8: Results (Part 2)
1 00% 90% 80% 70% 60% 50% 40% 30% 20% 1 0%
QO/o � ci: <(
Figure 84: Cost Components as a Percentage of Total Costs
(season 2003)
Costs C o m p o n e n t s , as a p e rcentage of Total Costs (season 2 003)
� 8 � g 8 .,., 8 0> r- (") (") ..,. (") .,., r- (") 'f N
ci: � � N � � 0:: si! <( 0:: ci: <( <( <( <( <( <(
,._ � �
Figures 83 and 84 simply give an idea of the contribution that each of the three cost
components make to the Total Costs. In general, for the New Zealand farms Capital
Costs are a bigger proportion of the Total Costs.
.,., (") <X) si!
The analysis of the Total Costs by each cost component (also called production factor)
can be done independent ly of the analysis of other indicators and provides an idea of
how each factor i s ut i l ised and how i t impacts on the general performance of the
business.
8. 1. 7 Labour
Season 2002
Figure 85: Labour Costs (season 2002)
Labour Costs (season 2002)
4.0
::E 3.5
0 3.0 l!!. �
"E' 2.5
:I: 2.0
8 1 .5 -� 1 .0 (/) :::::> 0.5
0.0 � � 8 � M ..,.
ri:. � <( <( <(
� ::0 "' 2 "' 0> � "' �
M � <0 C> ..... ..,. � "' � � !;21 ri:. ri:. <( <( <( <( <( • paid 0 Calc. costs for famity tabour
1 96

Chapter 8: Results (Part 2)
Labour Costs are the result of dividing al l the labour costs (paid wages and unpaid
family labour) by the ki lograms of milk (ECM) produced.
In 2002 (see F igure 85), within the farms of the fLrst group (the three typical Argent ine
farms), AR-350 had the lowest Labour Costs per 1 00 kilograms of milk (ECM)
produced. Within the second group (Farms AR-6 1 50, AR- 1 754 and A R- 1 483 ), AR-
1 483 (Farm 4) had the lowest Labour Costs. Within the third group AR-9 1 5 (Farm 5)
had sl ight ly lower Labour Costs than AR-2087 (Farm 2).
Figure 86: Average Wages on the Farm (season 2002)
Average Wages on the Farm (season 2002)
8.0
7.0 • • 6.0
� 5.0 E - 4.0 V> u, :::> 3.0 • •
2.0 • • • • • • 1 .0
0.0 ss ss 0 ss � i?i M "' 0 � � � M ... � ci: � � � <( <( ci: <( <( <( <( <( <(
Average Wages on the Farm is the ratio between all the costs of labour and the total
hours of work for the season of all the people that worked in the dairy enterprise.
•
� N z
Within the farms of the first group (the three typical Argentine farms), AR- 1 400 had the
highest Average Wages on the farm. Within the second group (Farms AR-6 1 50, AR-
1 754 and A R- 1 483) , AR- 1 754 (Farm 3) had the highest Average Wages on the farm.
Within the third group, AR-2087 (Farm 2) had slight ly higher Average Wages than AR-
9 1 5 (Farm 5) .
1 97
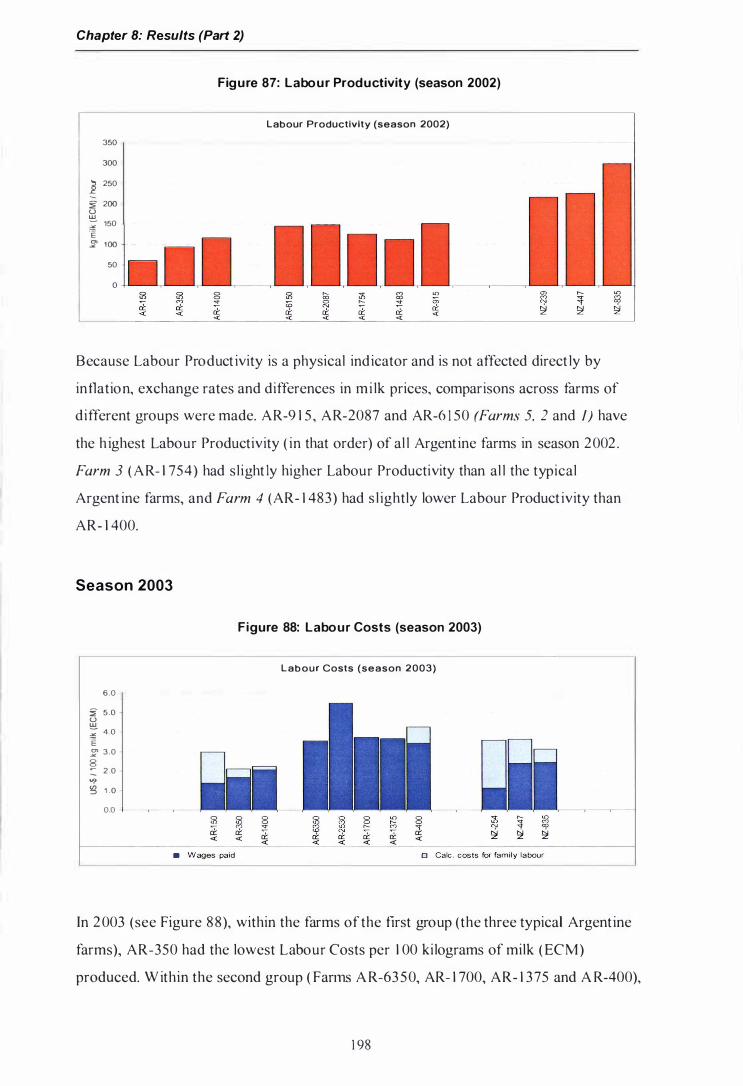
Chapter 8: Results (Part 2)
350
300
] 250
� 200 u w ;; 150 .E � 100
50
0
Figure 87: Labour Productivity (season 2002)
labour Productivity (season 2002)
Because Labour Product ivity is a physical indicator and is not affected direct ly by
inflation, exchange rates and differences in mi lk prices, comparisons across farms of
different groups were made. AR-9 1 5 , AR-2087 and AR-6 1 50 (Farms 5, 2 and 1) have
the h ighest Labour Productivity ( in that order) of al l Argent ine farms in season 2002 .
Farm 3 (AR- 1 754) had sl ight ly higher Labour Productivity than al l the typical
Argent ine farms, and Farm 4 (AR- 1 483) had s l ightly lower Labour Product ivity than
AR- 1 400.
Season 2003
6.0
� 5.0 u w ;; 4 0 .E � 3.0
8 ::: 2 . 0 "' � 1 .0
0.0 ·1--�-��
•
Figure 88: Labour Costs (season 2003)
labour Costs (season 2003)
In 2003 (see Figure 88), within the farms of the first group (the three typical Argentine
farms), AR-350 had the lowest Labour Costs per 1 00 kilograms of milk (ECM)
produced. Within the second group ( Farms A R-63 50, AR- 1 700, AR- 1 375 and A R-400),
1 98

Chapter 8: Results (Part 2)
A R-6350 (Farm 1 ) had the lowest Labour Costs. AR-2530 or Farm 2 (third group) had
Labour Costs considerably higher than all other Argent ine farms.
F igure 89: Average Wages on the Farm (season 2003)
- -- ----Average Wages on t h e Farm (season 2003)
10.0 -9.0 - . - • 8.0 • 7.0
., 6.0 0 • -'= -� 5.0 � 4.0
• • • • 3.0 • 2.0 • • 1 .0 0 .0
� � 0 � ?I 8 "' 0 Ji � "' � ,_ 0 '"'
Cf. � '"' )(] ,_ '"' 'r '":' op Cf. op ci: Cf. Cf. a:: � � � < < a:: < < < < < <
Wit hin the farms of the first group (the three typical Argentine farms) AR- 1 400 had the
highest Average Wages. Within the second group (Farms AR-6350, AR- 1 700, AR- 1 3 75
and AR-400), all o f them have very simi lar Average Wages. AR-2530 or Farm 2 (third
group) had considerably higher Average Wages than al l the other Argent ine farms in
this season.
350
300
., 250 _g � 200 u � 150 E ;: 100
50
0
-
Figure 90: Labour Productivity (season 2003)
Labour Prod uct ivity (season 2003)
� � 0 � ?I 8 � � Ji ,_ � Cf. '"' � � "' ,_ '"' '":' � op ci: Cf. � ;f ;f a:: � � � < < < __ < < < < <
Because Labour Productivity is a physical indicator as was previously mentioned,
comparisons across farms of different groups wi l l be made. AR-2530, AR-400 and A R-
6350 (Farms 2, 7 and 1) have the highest Labour Productivity ( in that order) of all
Argentine farms in season 2003. Farms 3 and 4 (AR- 1 700 and A R- 1 3 75 , respectively)
1 99

Chapter 8: Results (Part 2)
had s light ly h igher Labour Productivity than a l l the Argentine typical farms (Farm 3
sl ightly higher than Farm 4).
Summary for Labour (seasons 2002 and 2003)
The wages per hour of work increased in the farms, ofboth countries, from one season
to the other. I n the typical New Zealand farms, the wages increased approximately 27%.
In the typical Argentine farms, the wages increased 1 9%. In the Argentine case studies,
the wages increased between 59% in Farm 1, to 1 06% in Farm 4.
Farm 2 (AR-2087/2530), paid the h ighest average wages per hour in both seasons, and
had the second highest Labour Productivity in 2002 and the highest in 2 003 .
The Argentine case studies had, in general, h igher Labour Productivity, h igher Average
Wages, and h igher Labour Costs than the typical Argentine farms.
Ado ption of New Zealand Innovations and Labour Productivity
The factors that affect Labour Productivity are so numerous that is very difficult to
assess the impact of adopting New Zealand innovations on it . However nearly a l l the
case studies in both seasons (with the exception of AR- 1 483 in 2002) h ad Labour
Productivity h igher than a l l the typical Argentine farms. The fo l lowing figure (Figure
9 1 ) i l lustrates this. And interest ingly, the three farms that most ful ly adopted the sixth
innovat ion (Less than 15 co11c\' per Set of' Teat-cups, etc) had the h ighest Labour
Productivity (average of the two seasons) ; these farms were Farm 7, Farm 2 and Farm
I .
Fig u re 91 : Number of New Zealand Innovations Adopted and
Labour Productivity (seasons 2002 and 2003)
180 160 140 120 a
.c 100 -
� 80 E � 60
40 20
NZ Adoption and Labour Productivity
(seasons 2002 and 2003)
4 NZ <nno;at<ons Adopted (number)
200

Chapter 8: Results (Part 2)
8. 1. 8 Land
Season 2002
Land was, on average, 77% of total assets for the typical Argentine farms in 2002. For
case studies AR-6 1 50 ( Farm 1 ), AR-2087 (Farm 2), AR- 1 754 (Farm 3) and AR- 1 483
(Farm 4) , which are the case studies that own land, land was 69%, 65%, 6 1 % and 59%
of the total assets, respectively. For the typical N ew Zealand farms, land was, on
average, 56% of the total assets of the business.
F igure 92 : Land Costs (season 2002)
L a nd Costs (season 2002)
5 .0 4.5
� 4 .0 u '!:!- 3.5 �
E 3 .0 en 2.5 �
8 2 .0 - 1 .5 V> ,;, 1 .0 ::::>
0 .5 0 .0 >De .D.
0 "' 0> ,__ "'
h) ::: M 00
ci: <( � N N z z
• Land rents paid o Land rents calculated for land ovmed
I n 2002 (see Figure 92) , within the farms of the first group (the three typical Argentine
farms) AR- 1 400 had the lowest Land Costs per I 00 kilograms of milk (ECM) produced.
Within the second group (AR-6 1 50, AR- 1 754 and A R- 1 483) , AR- 1 754 (Farm 3) had
the lowest Land Costs. Within the third group, AR-9 1 5 (Farm 5) had lower Land Costs
than AR-2087 (Farm 2) .
6.000 -
5,000 -
4,000 - - - - - -_:'! � 3.000 - - - - -Vl ::::>
F igure 93: Market Val ue of Land
Market Value of Land (season 2002)
2,000 - - - - - - - - - - - - - - - - - - - - - - - - - - - - - - - - - - - - - - - - - - - - - - - - - -
1 ,000 -
� ci:: <(
20 1
- - - - - i

Chapter 8: Results (Part 2)
There are mainly four categories of Market Value of Land within the Argent ine farms:
300
250
200
100
50
0
The more valuable, and possibly the most productive land, is the land of AR-350
and Farm I (AR-6 1 50).
This is fo l lowed, in value, by the land of AR- 1 50.
Then, the land of AR- 1 400, which is similar to Farms 3 (AR- 1 754) and Farm 4
(AR- 1 483) .
Lastly, the land value of Farm 2 (AR-2087), Farm 5 (AR-9 1 5 only in season
2002) and Farm 7 (AR-400 only in season 2003).
Figure 94: Level of Land Rents (season 2002)
Level of land Rents (season 2002)
The Level of Land Rents is the value that was used as the opportunity cost for land, in
the farms that did not rent land ; and as a real land cost in the farms that leased land. The
Level o f Land Rents in 2002 was proportional to the Market Values of Land.
202

Chapter 8: Results (Part 2)
F ig u re 95: Land Productivity (season 2002)
Land Prod uctivity (season 2002}
1 6.000
1 4,000
1 2.000
� � 1 0.000
� 8. 000 -"'
.E 6.ooo
4,000
2.000
0
When comparing Land Productivity o f d ifferent farms it is important to take into
account the feeds that were brought in from other land that is not included in the
analysis:
For typical farms see section 4.4. 7 .
From the case stud ies, Farm I brought in 43% of total feeds, Farm 2 brought in
49% of total feeds, Farm 3 brought in 39% of total feeds, Farm 4 brought in
55% of total feeds, Farm 5 brought in 63% of total feeds, and Farm 7 brought in
40% of total feeds (the proportions are approximate). The typical Argentine
farms have a lower proportion of the total feeds brought in than the case stud ies
because in the typical farms the land used to produce feeds by the cropping
enterprises of the farms is included in the analysis. In the case studies, in
contrast, the dairy enterprises (the Farms) buy the feeds from the cropping
enterprises at market prices and the land used by the cropping enterprises is not
included in the analysis. These d ifferences in the methodology do not have any
impact on the Land Costs; however they make it more difficult to compare Land
Productivity between the Argent ine farms.
On Farm I. the land ut i l ized to raise the replacement heifers is not included in the
analysis because they sel l the heifers calves, and then buy back the replacement heifers.
This increases the Land Productivity because a category o f animals that does not
produce milk is not taken into account .
203

Chapter 8: Results (Part 2)
Due to differences in the proportion of feeds brought in, and d ifferences in
methodologies used, is not possible to accurately compare the land product ivity of the
farms.
Season 2003
Land was, on average, 8 1 % of total assets for the typical Argentine farms in 2003 . For
case studies AR-6350 (Farm 1 ), AR-2530 (Farm 2), AR- 1 375 (Farm 3) and AR- 1 375
(Farm 4), which are the case studies that own land, land was 69%, 62%, 73% and 62%
of the total assets, respectively. For the typical New Zealand farms, land was, on
average, 56% of the total assets of the business.
7.0
:i" 6.0 u !,!!_ 5.0 �
"E' 4.0
8 3.0
- 2.0 "" <J) => 1 .0
� � � � <( <(
• Land rents paid
F igure 96: Land Costs (season 2003)
L a n d Costs (season 2003)
8 � ?! 8 .,., 8 y, ,_ .,., ,_ � g ... <") .,., ,_ <") "'f � � "' � cr. cr. <r Sol Sol � <r <r <( <( <( <( <( <(
0 Land rents calc ulated for land owned
I n 2003 (see Figure 96), within the farms of the first group (the three typical Argent ine
farms) AR- 1 400 had the lowest Land Costs per 1 00 ki lograms of milk (ECM) produced.
Within the second group ( Farms AR-6350, AR- 1 700, AR- 1 375 and AR-400), AR- 1 375
(Farm 4) had the lowest Land Costs. AR-2530 or Farm 2 (third group) had the lowest
Land Costs of al l Argent ine farms.
204

Chapter 8: Results (Part 2)
Figure 97: Market Value of Land (season 2003)
Market Value of Land (season 2003)
1 0.000
9,000 � - - - - - - - - - - - - �
8.000 -
7,000 -
"' .c; 6.000 --
5,000 -v;> g 4,000 -
3.000
2,000
1 .000
0 � � 0 � g 0 "' 0 � � f2 ..... � � � "' � "' <')' � 'I' ci: � ci:: !:;;! <( <( "' <( <( <( <( <( <(
� --
� � op !:;;! !:;;!
j
The four categories of Market Value of Land within the Argentine farms described in
the 2002 season remained unchanged in 2003 . However, Market Value of Land
increased by 1 . 3 5 times in the Argentine farms between 2002 and 2003 .
Figure 98: Level of Land Rents (season 2003)
Level of Land Rents (season 2003)
450
400 -
350
300
.:g 250 -v;> 200 g
1 50
100
50
0
The Level of Land Rents in 2003 was proportional to the Market Values of Land,
ranging from 4 .8% {AR-350) to 7. 7% (AR- 1 400, AR-63 50, AR- 1 700, and AR- 1 375 ).
Figure 99: Land Productivity (season 2003)
L a n d Productivity (season 2003)
16.000
1 4,000 - - - - -
.:g 1 2,000
-10,000 Si:' (.)
!!;!. 8,000 "" ·e 6.000 �
4.000
2.000 - - - - -0
205
Chapter 8: Results (Part 2)
D ue to differences in the proportion of feeds brought in, and differences in
methodologies used, i t is not possible to accurately compare the land productivity of the
farms. However is important to show the L and Product ivity in order to understand the
L and Costs; as L and Costs ( US-$ I I 00 kilograms milk) are the result of Land Rents
(US -$ I ha) per hectare divided by the Land Productivity (kilograms milk I ha).
Summary for Land
The case study farms had, in general (with the exception of AR-400 in 2002) lower
L and Costs per kilogram o f milk produced than the typical Argentine farms.
I n season 2003 , when comparison across groups can be made more reliably, AR-2530
(Farm 2) had the lowest L and Costs followed by AR- 1 375 (farm 4) and then AR-6350
(Farm 1) .
Adoption of New Zealand Innovations and Land Costs
The case studies, a l l of which have adopted the first New Zealand innovation (Focus on
Production per Hectare), had lower Land Costs per kilogram of milk than the typical
Argentine farms in both seasons (with the exception of AR-400 in 2002) .
The two farms w ith lower Land Costs were also the two farms that adopted the highest
proportion ofNew Zealand innovations (Farms 2 and 4). This does not necessary imply
that the fact of adopting New Zealand innovations has an impact on Land Costs per
k ilogram of milk produced, however proves an association between the two factors (see
F igure 1 0 1 ).
206

Chapter 8: Results (Part 2)
Figure 1 00: Number of New Zealand Innovations Adopted and
Land Costs (season 2003}
� u !!:!. -" E � 8 ..... (/) :::>
5
4
2
1
NZ Adoption and Land Costs (seasons 2003)
•
NZ innovations Adopted (number) 10
8. 1. 9 Capital
2.0
1 .8
::1 1 .6
� 1 . 4
� 1 . 2 E If 1 .0
§ 0.8
� 0.6 (/) ::::> 0 . 4
::1 t) !,!!. -"' .E :;: § -..... �
0.2
0.0
3.0
2.5
2.0
1 . 5
1 .0
0.5
0.0
Figure 1 01 : Capital Costs ( land not included} (season 2002}
Capita l Costs ( land not incl uded) (season 2002)
••• , .. , .. . .• , ss � � M U")
� � � � � "' ci:: <( <( <( <( <(
F igure 1 02: Capital Costs (land not included} (season 2003}
Capital Costs ( land not in lcu ded) (season 2003)
- - - - -
- - - - - - -
- - - - -
ss � � � ci:: � <( <( <(
207
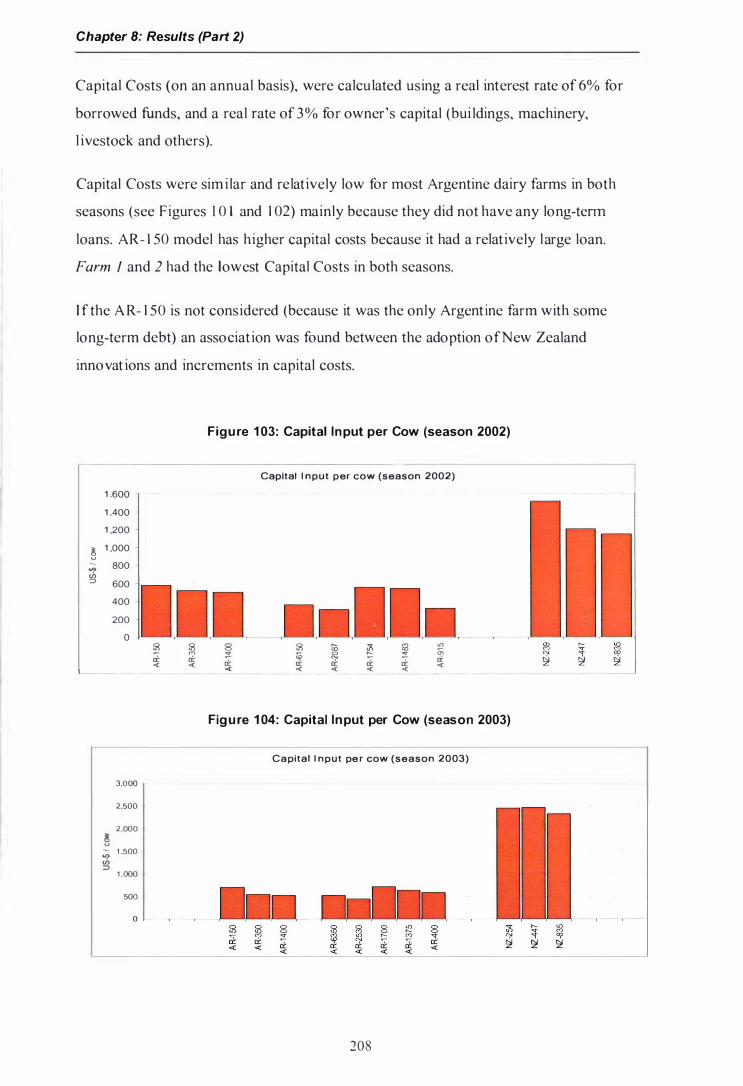
Chapter 8: Results (Part 2)
Capital Costs (on an annual basis), were calculated using a real interest rate of 6% for
borrowed funds, and a real rate of 3% for owner's capital (bui ldings, machinery,
l ivestock and others).
Capital Costs were sim i lar and relat ively low for most Argentine dairy farms in both
seasons (see Figures I 0 1 and 1 02) mainly because they did not have any long-term
loans. AR- 1 50 model has higher capital costs because it had a relat ively large loan.
Farm 1 and 2 had the lowest Capital Costs in both seasons.
I f the A R- 1 50 is not considered (because it was the only Argent ine farm with some
long-term debt) an associat ion was found between the adoption ofNew Zealand
innovat ions and increments in capital costs.
� -� (f) =>
1 ,600 1 ,400 1 ,200 1 ,000
800 600 400 200
0
3,000
2,500
2,000 � u ;;; 1 ,500
(f) => 1 ,000
500
2 2 � «> ri: <( <(
Figu re 1 03: Capital Input per Cow (season 2002)
Capital I nput per cow (season 2002)
Sl 2 :;; � � "'
� 0 a;
� � � � ri: <( <( <( <( <( <(
Figu re 1 04: Capital Input per Cow (season 2003)
Capital I nput pe r cow (season 2003)
o -1--�-�-
208

Chapter 8: Results (Part 2)
In Capital I nput per Cow, only the l ivestock, building and machinery assets are taken
into account. For New Zealand farms the co-operative shares are included in the 2003
season ( in season 2002 these were added to the land) . Because the value of the assets, in
US-$, were not significantly affected by the inflation, comparisons across groups of
farms were made for both seasons.
From the case studies, in season 2002, Farms 1, 2 and 5 (AR-6 1 50, A R-2087 and AR-
9 1 5 ) were under the U S-$ 400 of capital input per cow. And in season 2003, Farm 2
(AR-2530), AR- 1 400, and Farm I { AR-6350) had the lowest Capital I nput per Cow.
Farms 3 ( AR- 1 7541 1 700) and 4 (AR- 1 483/ 1 375) had the highest capital input per cow
of all the Argent ine farms in both seasons.
Increments in adopt ion of New Zealand innovations were associated with higher
investment in plant and machinery per cow.
1 6.000
1 4.000
V> V, 1 2.000 :::> 0 8 1 0. 000
� 6.000 u � 6. 000 -"'
E 4. 000 Z' 2,000
0
1 2.000
"' 1 0,000
g § 6.000
� 6, 000 u � -"' 4,000 .E if 2.000
Figure 1 05: Capital Productivity ( land not inc luded) (season 2002)
Ca pital Productivity ( land not inc luded) (season 2002)
5l 5l 0
� "' � ci: � <( <( <(
Figure 1 06: Capital Productivity (land not included ) (season 2003)
Capital Prod u ct ivity ( land not inc luded) (season 200 3 )
0 f----�-�-
209

Chapter 8: Results (Part 2)
Capital Productivity is calculated by dividing the total kilograms of milk produced by
the capital input (total assets minus land). I n both seasons Farm 2 had the highest
Capital Productivity; fo l lowed by Farm 1 in 2002 and by AR- 1 400 in 2003. The fact
that for Farm 1 the land ut i l ised for raising heifers is not included in the analysis
increases its Capita l Productivity. Capital Productivity is related to Capital input per
Cow and M ilk Y ie ld per Cow (Figures I 04 and I 05, and I 08 and 1 09, respectively).
The farms with relatively lower Capital I nput per Cow and relat ively high Milk Yield
per Cow had h igher Capital Productivity.
If the A R- 1 50 is not considered (because it was the only Argent ine farm with some
long-term debt) an association was found between the adoption ofNew Zealand
innovat ions and reduction in capital productivity.
8. 1. 10
6,000
5,000
"i 4,000 8 :ii 3,000 0 !t!. ;l!§ 2,000 E � 1 ,000
0
6,000
- 5,000 lll >.
i 4,000 u ;; 3,000 .E i3 2,000 w a>
� 1 ,000
Milk Yield
Figure 1 07: Mi lk Yield per Cow (season 2002)
Milk Yield per Cow (season 2002)
Figure 1 08: Mi lk Yield per Cow (season 2003)
M ilk Yield per Cow (season 2003 )
0 -l-�-�-·
2 1 0

Chapter 8: Results (Part 2)
Within the six case studies, Farm 3 (AR- 1 754 and AR- 1 700) has the highest milk yield
per cow in the two seasons analysed. Is important to mention that, on average, the cows
in Farm 3 are the second in size (see Table I 0) after the cows of Farm 1 (AR-6 1 50 and
AR-6350) . The production per cow of Farm 3 is higher than the three New Zealand
farms and lower than the two largest typical Argentine farms (AR- 1 400 and AR-350).
In general the case studies had Milk Y ields per Cow that were intermediate between the
typical Argent ine farms and the typical New Zealand farms.
However when the Milk Y ield is calculated by ki logram of l ive weight of the cows (see
Table 22), Farm 2 (AR-2087 and 2530) and Farm 4 (AR- 1 483 and AR- 1 3 75) had the
highest Milk Y ield in both seasons; these two farms have adopted the highest proportion
ofNew Zealand genetics in their herds. The fo l lowing table illustrates the associat ion
between the proportion New Zealand genet ics in the farms' herds and milk yield per
ki logram of l ive weight.
M ilk Yield I cow I year
Cull cow live weight M i lk Yield I kilograms LW Adoption o f N Z Genet ics
Table 27 : Level of New Zealand Genetics Adopted and Mi lk Yield
per ki logram of l ive weight (seasons 2003)
AR- AR- AR- Farm Far111 Farm Far111 Far111 1 50 350 1 400 I 2 3 4 5
3,865 5 ,284 5.453 4,684 4,890 5 ,200 4 ,87 1 4,099
550 500 560 605 424 500 400 442
7 .0 1 0 . 6 9 . 7 7 . 7 1 1 . 5 1 0.4 1 2 . 2 9 . 3
0 0 0 0 . 2 I 0 . 1 I 0 . 67
2 1 1
Farm
7
3, 894
442
9 .0
0 .3

Chapter 8: Results (Part 2)
8. 1. 1 1 Costs as Means of Production
Figure 1 09: Costs as Means of Production (season 2002)
1 2.0
10.0
� (.) \!;!. 8.0 X
E � 6.0 -� u;> 4.0
"' => 2.0
0.0
:iS :i <(
-
l!l 8 .... cl: :i <( <(
Costs as Means of Production (season 2002)
-
"' a; cl: <(
-
The means of production are the sum of the fo l lowing expenses: animal purchases, feed
expenses (purchase feed, fert i l iser, seed, pest icides), machinery expenses ( maintenance,
depreciation, contractor), fuel, energy, lubricants and water expenses, bui ldings
expenses (maintenance, depreciat ion), veterinarian and medicine expenses, insemination
expenses, insurance and taxes, and other inputs.
In 2002 (see Figure I 02 ), within the farms of the first group (the three typical Argentine
farms), AR- 1 400 had the lowest Costs as Means of Production per I 00 kilograms of
milk ( ECM) produced. Within the second group ( Farms AR-6 1 50, AR- 1 754 and AR-
1 48 3 ), AR- 1 483 (Farm 4) had the lowest Costs as Means of Production (sl ight ly lower
than AR-6 1 50 or Farm 1 ) . Within the third group AR-9 1 5 (Farm 5) had lower Costs as
Means of Production than AR-2087 (Farm 2).
Figure 1 1 0 : Costs as Means of Production (season 2003)
Costs as Mean s of Prod uction (season 2003)
�
1 2 .0 -
10.0 - - - - - - - - - - --
- - -(.) -:;- 8.0 - - - - - - - - - - - -,--:...
-
E
D i � � : : --
�d,b--d,--- 1==""'""'-'�..11---liJ-.d,bo-l\-�- ��___J'I---+ --��-1
2 1 2

Chapter 8: Results (Part 2)
I n 2003 ( see Figure 1 1 0), within the farms of the first group (the three typical Argentine
farms), AR- 1 50 had the lowest Costs as Means o f Production per 1 00 kilograms of milk
(ECM) produced. Within the second group (Farms AR-6350, AR- 1 700, AR- 1 3 75 and
AR-400), AR- 1 700 (Farm 3) had the lowest Costs as Means of Production, slightly
lower than AR-400 (Farm 7). AR-2530 or Farm 2 (third group) had the second highest
Costs as Means ofProduction of al l Argentine farms, after AR- 1 3 75 (Farm 4).
The levels ofCosts as Means of Production per 1 00 kilograms of milk produced are
d ifficult to analyse. I n some cases ( for example AR- 1 400 in 2002, and AR- 1 700 in
2003) the farms that had the lowest Costs as Means of Production were also farms that
performed wel l financially (relat ively h igh Entrepreneurs ' Profit, Operating Profit
Margin, and ROI) . And in other cases ( for example AR-350 in 2003 , and AR-2530 also
in 2003) farms with relatively high Costs as Means of Production per 1 00 kilograms of
mi lk were also farms that performed well financia l ly (relatively high Entrepreneurs'
Profit, Operating Profit Margin and, ROI) .
It seems that there is a sl ight associat ion between the adoption ofNew Zealand
innovat ions and the level of Costs as Means of Production. Becuase in 2003, the two
farms w ith the highest Costs as Means of Production (AR- 1 3 75 and A R-2530) are also
the two farms with the highest New Zealand innovations adopted; but the third farm in
Costs as Means of Production was AR- 1 400, a typical farm (which has not adopted any
ofthe innovations).
8.2 C hapter S ummary
• The case studies with the best financial performances were Farm 2 (AR-2087
and AR-2530), Farm 1 (AR-6 1 50 and A R-6350), Farm 5 (AR-9 1 5), and Farm 3
(AR- 1 754 and AR- 1 700) . The typical Argentine farms, which performed
s imilarly well, were AR-350 and AR- 1 400.
• An association between number ofNew Zealand innovations adopted and higher
Return on I nvestment was found.
• No clear association was found between number of innovations adopted and the
Entrepreneurs' Pro fit.
2 1 3

Chapter 8: Results (Part 2)
• H igher Operating Profit Margin seems to be associated with lower levels of
adoption ofNew Zealand innovations.
• No clear association was found between the number of innovations adopted and
the Costs of M ilk Production Only.
• An associat ion was found between the proportion of New Zealand genetics in
the farms' herds and milk yield per kilogram of live weight.
• From the nine farms analysed, the four farms that more fully adopted New
Zealand Genetics, had the lowest Mortality and Replacement rates in both
seasons.
• The case studies had higher Labour Costs per kilogram of milk produced, higher
Average Wages, and higher Labour Productivit ies than the typical farms in both
seasons. The three farms that more fully adopted the sixth New Zealand
innovation (Less than 1 5 cows per Set of Teat-cups, et c) had the highest Labour
Productivity.
• The case studies, all of which have adopted the first New Zealand innovat ion
(Focus on Production per Hectare), had lower Land Costs than the typical
Argentine farms in both seasons. The two farms with then lowest Land Costs per
k ilogram of milk were also the two farms that adopted the h ighest proportion of
New Zealand innovations.
• I f the A R- 1 50 is not considered (because it was the only Argentine farm w ith
some long-term debt) an association was found between the adoption of New
Zealand innovations and increments in capital costs, and also with reduction in
capital productivity. Additionally, increments in adoption ofNew Zealand
innovations were associated with higher investment in plant and machinery per
cow.
• A slight association was found between the adoption ofNew Zealand
innovations and higher Costs as Means of Production.
2 1 4

Chapter 9: Discussion
9 DISCUSSION
9.1 Competitiveness of Argent ine Dairy Farms
I n this section the compet itiveness26 of Argentine dairy farms i s addressed by d iscussing
the results from the comparison oftypical and real Argentine farms w ith New Zealand
typical farms.
New Zealand dairy farms were considered traditionally the most compet it ive in milk
production costs. However milk production costs in 2002 and 2003 on the Argent ine
dairy farms (typical and case study farms) were lower than on the New Zealand typical
farms. This was mostly explained by two factors: a) Argentine farms had lower labour
costs; and b) Argent ine farms had lower capital costs per kilogram of milk produced
than New Zealand farms.
In 2002, and possibly due to the devaluation ofthe Argentine currency, the typical
Argent ine farms became the most competitive in milk production costs (in U S-$) of all
the typical farms in the main milk production countries in the world ( I FCN, 2003) . ln
2003 the same happened ( I FCN, 2004). This implies that in Argent ina, during 2002 and
2003 , farmers produced milk at a lower milk price than in any other country in the
world. The exchange rate of the Argent ine currency averaged AR-$ 3 for each U S-$
since March 2003 (calculations based on FXHistory: Historical currency exchange
rates, 2005 ) and it is expected to continue at similar levels in 2005 (BCRA, 2005) .
Therefore, Argentina wi l l continue to produce milk at competitive costs during 2004
and will probably cont inue to do so in 2005 . However, the 8% inflation during 2004
(calculat ions based on the Wholesale Price I ndex INDEC, 2005) and the 5% to 8%
inflat ion expected for 2005, could erode this advantage.
This competitiveness, together with raise in international dairy products prices,
increased the export possibilit ies of Argentine dairy companies; during 2004 they
exported more than 20% of the total milk production, which was the second highest
level for the last 1 5 years (La Opinion, 2004).
26 Competitiveness is defined "as the ability to profitably create and deliver value at prices equal to or lower than those offered by other sellers in a specific market" ( Harrison & Kennedy, 1 997, p. l 6).
2 1 5

Chapter 9: Discussion
However, the fact that the Argentine dairy farms (typical and case studies) were able to
produce milk at lower costs than the typical New Zealand farms in 2002 and 2003, does
not necessarily mean that they had higher profitabil ity than the typical New Zealand
farms. On the contrary, the New Zealand typical farms had higher Entrepreneur' s Profit
per kilogram of milk produced than the typical Argentine farm at a similar management
level and relatively similar milk prices (for example comparing AR- 1 50 in 2002 w ith
NZ-239 in 2003 or A R- 1 50 in 2003 with NZ-254 in 2002, see Figures 1 0 and 1 1 ); and
the Return on I nvestment ( ROI ) of these Argentine and New Zealand farms (see Figures
1 4 and 1 5) .
The similar ROI of two comparable farms in different countries could probably be
explained by the fact that market values of assets tend to stabilize at levels at which
returns are acceptable. I n the case of the typical dairy farms in New Zealand and
Argentina, in which land is the main asset, this means that the market value of land will
tend to stabilize at values at which the returns of dairy farming are acceptable.
The advantage in labour costs of the typical Argentine farms was mainly due to much
lower average wages per hour of work than in the typical New Zealand farms (average
wages were between 3 and 4 t imes higher in New Zealand farms). At the same t ime it
was found that the N ew Zealand typical dairy farms had higher investment in plant and
machinery per cow ( investment in plant and machinery between 2 and 3 times h igher in
N ew Zealand farms), and much higher labour productivity than the typical Argentine
farms ( labour productivity approximately 3 t imes higher in New Zealand farms).
Therefore, the relationship between investment in plant and machinery and the cost per
hour of labour is probably the underlying force that has induced the New Zealand
typical farms have relatively high labour productivities, and made Argentine farms not
so focused on it.
The advantage in capital costs ofthe typical Argentine farms was mainly explained by
the lower level of debt utilized by them, and to a lesser degree by the lower investment
in plant and machinery per cow than the New Zealand typical farms. Argentine farms,
because they do not usually utilize long-term loans, have lower annual interest paid on
liabil ities than New Zealand farms. Argentine farmers do not usually utilize any k ind of
long-term fmancing because access to credit is usually l imited and because interest rates
are relatively high. I n marked contrast, in New Zealand farms, long-term loans are
utilized frequently to fmance the farm business. Relatively easy access to credit at
2 1 6

Chapter 9: Discussion
affordable rates is an advantage that New Zealand farmers have and that Argentine
farmers do not have. Concluding, the lower capital costs of the typical Argentine dairy
farms in 2002 and 2003 helped them to produce milk at the lowest cost . However
Argentine dairy farmers have an important disadvantage compared to New Zealand
dairy farmers; they are not able to utilize higher levels of debt.
The Argentine typical farms had lower labour and capital costs, however the New
Zealand typ ical farms had lower land costs than the Argentine typical farms. The latter
is true despite the fact that land is more expensive in New Zealand than in Argentina,
because the New Zealand typical farms achieved much higher land productivity.
The fo llowing section discusses how the adoption of New Zealand innovations can
assist Argent ine dairy farmers to increase their compet it iveness, especially in respect to
labour productivity and land costs.
9.2 Benefits of Adopt ing New Zealand Pri ncip les
I n this section the research question is d irectly addressed : Can Argentine dai1y.farmers
benefit by adopting New Zealand dai1y.farm ideas, practices and technologies?
The present study has shown that the answer to this question is: Yes, Argent ine dairy
farmers can benefit from adopting New Zealand innovations in many ways. These are
d iscussed briefly below in three sect ions: The first section summarizes the main
consequences, advantages, disadvantages and constraints of adopting New Zealand
innovations proposed by the case study farms and the dairy sector experts interviewed.
The second section addresses the association between level of adoption and increments
in ROI ; and the third section discusses the association between labour and New Zealand
innovations.
2 1 7

Chapter 9: Discussion
9.2. 1 Main Consequences, Advantages, Disadvantages and
Constraints of A dopting NZ Innovations
1 ) Focus on Production per Hectare
All of the seven case studies adopted this New Zealand innovation.
The main reason explained by the Argentine case study farmers for focusing on
production per hectare is because land is their most l imiting production factor. As one
of the farmers mentioned that capital and skilled labour are difficult to obtain, however
they are still easier to obtain than land. Therefore maximizing production per hectare,
Argentine farmers are trying to better utilise their most limiting production factor, land.
The two case studies that leased land also believed in the importance of maximizing
production per hectare, because rent was their main fixed cost and they have to dilute it
by producing the greatest volume of milk possible.
2) Give Marked Importance to Pasture Production
All except one ofthe case studies stated that pasture was their cheapest feed; therefore it
was important for them to maximize its production and utilizat ion.
Level of fert ilizer application was an indicator ofthe focus ofthe case study farms on
maximizing pasture product ion. Two of the farmers mentioned that Argentine experts
recommend increasing phosphate levels of soils up to 25 ppm for lucerne and up to 1 5
ppm for fescue. Four of the seven case studies were trying to reach the recommended
phosphate levels on their so ils. The two case studies that leased the land were fert i l izing
very little because they did not want to invest in land which they did not own, as they
were not sure whether they would renew the leasing contract with the landowner.
The adoption ofthis principle was related to the relative importance of pasture in the
total cows' annual requirements. For example, one of the farmers mentioned that grazed
grass was only 28% of the total feeding requirements of his farm and consequently, he
was not focused on pasture production whereas in another of the farms, for which grass
was the main feed, the farmer was focused on pasture production because grass was the
main driver of increments on production per hectare.
2 1 8

Chapter 9: Discussion
During the interviews one consultant and industry expert, mentioned that nowadays
most consultants and top farmers know that certain pastures need high phosphate levels
in soils and have high responses to nitrogen fertilizer. I n addition, other consultants and
farmers noted the beneficial effects of higher quantities of phosphate and nitrogen
fert il izers on Argentine dairy farms.
3) Quantitative Pasture Monitori ng
Three out of seven of the case study farms had fully adopted this New Zealand
innovation.
Nowadays in Argentina, many farmers and consultants are interested in pasture
monitoring. Further, some consultants are o ffering to implement pasture monitoring
recording programmes on dairy farms (researcher's experience in Argent ine dairy
industry).
Three of the case studies had a fonnal pasture-monitoring programme in place. It was
ment ioned that in order to manage pasture efficiently, constant monitoring is essent ial.
I n one ofthe farms, the farmer monitors the pasture cover and growth frequently,
especially in key moments of the year, in order to regulate the quantity of concentrates
that is being fed.
Another farmer mentioned that he finds that the adoption ofthis innovation has several
advantages: it helps them to better manage the cows' supplementation, it provides
useful information about the stock of grass available to be eaten in order to notice in
advance feed deficits (they calculate a ratio ofthe kilograms of dry matter available per
milking cow); and in some c ircumstances when it is necessary, it provides them with
useful data to redistribute hectares across the dairy farms of the company.
I n two of the case study farms, the person that was doing the monitoring was not the
dairy farmer, consequently the person that was monitoring, was not the person who was
deciding which paddock would be grazed. In typical New Zealand farms the same
person usually does both things. This difference could be quite significant, because
information and time are lost in the process of reporting the results of pasture
monitoring to the decision-maker.
2 1 9

Chapter 9: Discussion
I n contrast, one of the farmers mentioned that he was not doing quantitative pasture
monitoring because the importance of pasture for his production system was not so high
as to justifY the expenditure of time on pasture monitoring. Therefore, the adoption of
quantitative pasture monitoring is likely to be associated with the proportion of grazed
grass in the total annual requirements of the cows.
Two other farmers considered that they could manage the grazing ofthe cows without
the need of formal monitoring. These two farms were the smallest of all the case studies
and both farmers had experience in dairy farming. Therefore, experienced farmers
managing relatively small farms found the adoption of quantitative pasture monitoring
not very necessary nor advantageous.
4) Uti l ization of Formal Pasture Budgets
This innovation is c losely related to the previous one, the same three case study farms
that had fully adopted Quantitative Pasture Monitoring, had adopted also this New
Zealand innovation.
Pasture budgets are useful for detecting feed deficits and surplus, they are util ized to
decide when to buy feedstuffs, when to fertilise, or when to harvest grass surpluses.
Additionally, one of the case study farmers mentioned that he fmds pasture budgets
useful to detect differences in pasture production or utilization between the different
dairy farms of the company. Another farmer mentioned that he usually uses pasture
budgets to define stocking rates in the different farms that he manages.
I t is the opinion of the researcher that, without utilizing pasture budgets, it is difficult to
plan and to manage feeding in a dairy farm. Pasture budgets help farmers to better
utilize their grass, which general ly represents 5 0% of the annual feed requirements of
the cows in Argentine dairy farms.
5) Skil led and Motivated People Working on Farms
Four out of seven ofthe case study farms had fully adopted this New Zealand
innovation.
The main advantage mentioned of this innovation was the fact that educated, skilful,
and motivated people are able to manage the owner's farm (when the owner himself is
220

Chapter 9: Discussion
not operating it) without the need of constant supervision. Addit ionally more motivated
and educated people are usually more proactive in constantly searching for
opportunities and changes that can increase efficiency and profitability. Furthermore, as
most dairy farm owners in Argentina are relatively high educated (finished secondary
school and very often with a tertiary or university education), having educated people
operating the dairy farms facil itates communication between them and the people who
operate their dairy farms.
I t was found in the present study that the main reason why more motivated and educated
people do not operate Argent ine dairy farms is because working and job condit ions in
Argentine farms are not good enough to attract them.
Some of the case study farmers mentioned that they could see some advantages in
having more skil led and motivated people working in their dairy farms. However, they
ment ioned that they were not sure whether the benefits were higher than the costs. They
bel ieve that the transition, from tradit ional Argent ine dairy farming operating structure
to something similar to the New Zealand "sharemilk ing" structure, would be very
costly. A big investment would have to be made in buildings and machinery in order to
create an environment that would attract and retain educated and trained people.
Two couples, of what could be some of the first "Argent ine sharemilkers", were also
interviewed. They mentioned some reasons that constrain the employment of more
educated people on dairy farms. Firstly, they mentioned that most Argent ine landowners
are not willing to invest in buildings and machinery in order to improve the working
conditions on their dairy farms. Secondly, they mentioned that Argentine landowners
are probably not interested in changing an operating structure that is current ly working
fine for them. Thirdly, they mentioned that Argentine landowners think that if they
employ educated people on their farms they would lose part ofthe control over their
dairy farms.
I n contrast, dairy farm owners mentioned that is d ifficult to find young, skilled and
mot ivated people to work on dairy farms because young people do not want to work in
the countryside and because dairy farming is seen as a low-status activity. They also
mentioned that very often young people who were raised on dairy farms and who had
then achieved a tertiary or university education, are not willing to return to dairy
farming. A d isadvantage that farm owners found in highly educated young people was
22 1

Chapter 9: Discussion
that they are not accustomed to the working conditions of a dairy farm, even when there
has been an investment in buildings and machinery. Consequently they usually work in
dairy farming for a limited period of time to save money and then they look for a less
demanding job.
Both of the "Argentine sharemilkers" couple also mentioned that they agree with the
perception of some of the case study farmers, that to employ young university
graduates, who do not have experience in dairy farming, is very costly. However, all
four of them mentioned that, if in the future they had the opportunity to be the owners
of a dairy farm they would try to have skilful and motivated people managing their
dairy farms in the appropriate working conditions, because they believe that the extra
benefits would be bigger than the extra costs.
One important disadvantage that the "sharemilkers" found in Argentina in contrast to
New Zealand was the limited access to credit . This restricts their capacity to buy cows
and machinery in order to first ly rent a farm and then evolve towards farm ownership.
6) Less than 1 5 cows per Set of T eat-cups, and Other Innovations that Impact on Labour Productivity
This was the New Zealand innovation less adopted. The farm that adopted it the most
had 20 cows per set of teat-cups.
The number of cows milked per unit of teat-cups was found to be relatively constant
with each country, but markedly different between countries. Typical New Zealand
farms milked 1 5 cows per set of teat-cups, and Argentine farms (the three typical and
the seven case studies) milked around 25 cows per set of teat-cups. This means that in
Argentine typical farmers would have 40 units of teat-cups to milk 1 000 cows, in New
Zealand in contrast, typical farmers would have 67 units to milk the same number of
cows. This ratio (cows per set of teat-cups) is crucial for the organization of labour and
has a direct impact on labour productivity (calculated as milk produced per hour of
work). An important part of the difference in labour productivity between New Zealand
and Argentine typical farms ( labour productivity on New Zealand farms was nearly 3
higher than on Argentine farms) is related to the fact that Argentine dairy farms milk 1 .7
times more cows per set of teat-cups than New Zealand farms. This means that milking
must take much longer on Argentine farms probably by about 1 . 7 times, because of the
222

Chapter 9: Discussion
smaller number of teat-cups. Other causes for the difference in labour productivity are
probably the utilization of other practical technologies, motivation of the staff,
infrastructure ofthe country, and skilfulness ofthe staff.
I n the present study, an association was found between labour productivity and number
ofNew Zealand innovations adopted (see Figure 9 1 ) . Further, the three farms that most
fully adopted the sixth innovation ( less than 1 5 cows per set of teat-cups, etc) had the
highest labour productivity (average of the two seasons) .
The main advantage found was that, at constant average wages, increments in labour
productivity reduces labour costs per kilograms of milk produced, and can therefore
reduce milk production costs.
One of the farmers stated that the advantage that he found in increasing labour
productivity w as that he was able to pay better wages per person without increasing
total labour costs. By offering better wages, he was also able to have access to more
educated people.
The number of cows milked per set of teat-cups is related to the duration of each
milking, which is related to the time that people and cows spend in the milking shed at
each milking. In New Zealand is traditional to try not to milk for more than four hours
per day; probably because a person becomes tired after more than two continuous hours
of an act ivity that is relat ively demanding both physically and mentally. Furthermore,
the cows need to be grazing on the paddocks for as long as possible in order to eat all
the pasture they require. Another problem o f milking too many cows per set of teat-cups
is that farmers do not have enough t ime to do other activities on the farm, and also that
because cows spend too much time in the collection yard, they leave their urine and
faeces there instead of on the paddocks.
7) Seasonal Calving, One or Two Calving Periods per Year
Five out of seven ofthe case study farms had fully adopted this New Zealand
innovation.
The main advantages of seasonal calving mentioned by the case studies are the
follow ing:
223

Chapter 9: Discussion
Events occur in sequence, and consequently only one important task must be
done at the same t ime (calving, rearing of calves, mating and drying oft). This
enables the farmer to adopt a more orderly and planned approach to mating. For
example, to plan mating in advance, to do some special training or to learn new
advances in mating, then execute the plan, and fmally measure results.
Most of the cows have common requirements at a given time, which increases
the possibi l ity of feeding them better in those periods when they have higher
requirements (peak of lactation and mating).
Seasonal calving makes it possible to produce a higher proportion of milk
during the periods of the year when the milk price is h igher.
I n hot areas of the country, seasonal calving makes it possible to avoid the
calving of cows during summer, which can reduce the mortality rate of cows
and calves during calving and heat stress during lactat ion.
Seasonal calving faci l itates the cleaning, repair and maintenance of the dairy
farm plant, machinery, buildings and general structure.
Seasonal calving facil itates the organization of holidays for the staff and limits
the stress to only specific t imes in the year. It is important to mention that three
out of the four Argentine "sharemilkers" interviewed ranked seasonal calving as
one of the most important New Zealand innovations. Therefore, seasonal
calving could be related to the possibi l ity of attracting more educated people.
Seasonal calving usually results in a decrease in the age ofheifers at frrst
calving, because the fact that all the heifers are similar in age makes it possible
to rear them in a more simple and orderly fashion.
As one of the farms stated: 'everything is more simple if it is seasonal '.
The main disadvantages of seasonal calving mentioned by the case studies are the
fo l lowing:
The need for labour is seasonal, and this could compl icate the management of
human resources on some occasions.
224

Chapter 9: Discussion
Often larger milking sheds are needed in order to cope with the milking of a
larger number of cows, and with higher milk yield during peak lactation. I n
contrast, in all year around calving systems the number of cows and their milk
yields are relatively constant during the whole year. There is also the need for
more space to rear calves, however that space would only used for part of the
year.
One ofthe farmers stated that although the highest milk prices are usually paid
during winter, in some seasons that is not the case and consequently he finds it
risky to have a big proportion of milk produced in a short period oftime. One
expert added that in places with relatively unstable weather conditions it could
also be risky to have all the cows calving at the same time. These two risks
could be partially so lved by having two calving seasons.
The fact that Argent ine Holstein cows calve on average every 1 3 months (and
not 1 2 months) could be a constraint to the adoption of seasonal calving,
especially if farmers do not want to adopt New Zealand genetics. However there
are some Argent ine farms that adopted seasonal calving systems without the
adoption ofNew Zealand genetics: these farms have two calving seasons per
year, and very o ften each cow calves every 1 8 months.
Reasons for having two calving seasons in the same dairy farm or in two different dairy
farms of the same company:
Probably the most important cause is financial management, especial ly cash
flows, many expenses are all year round and farmers do not want to be forced to
use short-term loans. This is especially relevant for farms that lease land
because, added to all the other expenses, they have to pay the rent.
Another important reason could be util ization of the empty cows. Every farm
has a percentage of empty cows that are sometimes useful cows that, for some
reason, did not conceived. I n Argentina, prices for cull cows and heifers are
usually not very strong and farmers try to keep good cows and heifers if they
can, rather than sell ing them.
225

Chapter 9: Discussion
In Argentina, during the last months of summer, the milk price tradit ionally
increases. Therefore a second calving season in late spring or early summer can
be beneficial in order to capture those months of relatively high milk prices.
The same company could have two dairy farms in different regions. One of the
regions could have weather conditions that make it more suitable for dairy farms
with spring calving, and the other could be more suitable for autumn calving.
M ain constraints for seasonal calving in Argentina:
The main limiting factor for the adoption of seasonal calving in Argentina
proposed by the case farmers is the tacit opposition of the dairy companies.
There are some dairy farmers who produce milk seasonally and they have not
had any problem with the dairy industries so far. However, dairy companies are
unpredictable and therefore the consequences of adopting seasonal systems are
unknown.
Another constraint of seasonal calving is the fmancial management (especially
cash flows), which is very difficult when most of the milk is produced in a short
period oftime.
The adoption of two calving seasons could solve both of these constraints. But,
at the same t ime, some of the advantages of seasonal calving would be reduced.
8) New Zealand Genetics
Type and breed of cow is an ongoing debate among dairy farmers in Argent ina. Many
farmers believe what one of the experts stated: that there is some evidence that supports
the use ofbig (and usually North American genetics cows) in Argentine farms, but other
evidence supports the opposite.
Some advantages of New Zealand genetics mentioned by the case studies are the
following:
New Zealand genetics cows are selected in pastoral systems and are more
prepared to walk long distances than Argentine Holstein cows.
226

Chapter 9: Discussion
New Zealand genetics cows are able to calve every 1 2 months and therefore
enable farmers to have seasonal systems. One of the Argentine farmers stated
that it is not possible to have seasonal systems with North American cows.
Another farmer ment ioned that he likes New Zealand genetics cows because of
'their size, the strength of their legs and their udders '.
Other case study farmer mentioned that New Zealand genetics have been proved
to be able to be capable of being milked, especially the New Zealand Jersey.
One of the farmers found that the crossing ofNew Zealand Jersey w ith North
American Holstein reduced the mortality at calving and calving difficult ies. This
also had a general posit ive impact on the reproductive performance of the herd.
Addit ional ly, crossbreds (Argent ine Holstein and New Zealand Jersey) stayed
longer in the herd because they had fewer ferti l ity problems, fewer abortions,
lameness, and mast it is. Furthermore, crossbreds showed better temperament
during the milking, and they were lighter than Argent ine Holstein cows and
consequently caused less damage to pastures during wet weather.
The dairy company to which one of the farms sold its milk, preferred a higher
proport ion ofmilkso lids in milk because it costs less per kilogram of milkso lids
to transport and because it was easier to process. Therefore this company would
prefer milk from crossbred cows.
Some disadvantages of New Zeala nd genet ics ment ioned by the case studies are the fol lowing:
In one of the farms New Zealand Holstein Friesian genetics were used on
Argent ine Holstein cows for a number of years. B ut then they decided not to use
them anymore because the herd had udder and calving problems. In addition,
they did not like the appearance of the New Zealand Holstein Friesian.
I nterestingly, one of the Argentine dairy production experts interviewed
mentioned the same two reasons as d isadvantages of the New Zealand Holstein
Friesian cows.
A disadvantage ofNew Zealand genetics is that bull calves, especially Jerseys,
are very difficult to sell in the Argentine market; and there is no market for cows
and heifers ofNew Zealand genetics. However, it is important to take into
227

Chapter 9: Discussion
account that the selling of calves comprised less than 1 % of the total returns in
the typical Argentine dairy farms, and that the selling of heifers was less than
5% of the total returns. Additionally, many surplus heifers and cows are sold in
Argentina as beef to slaughterhouses and not for their genetics.
Another disadvantage mentioned was the fact that, in general, milk form New
Zealand cows has a higher proportion of milk-fat than the Argentine Holstein
cows, and in Argentina some dairy companies pay mainly for milk-protein.
Additionally, milk-fat is energetically more expensive to produce than milk
protein. It was also mentioned that in the future this trend towards preferring
milk-protein than milk-fat would continue. This is an interesting point and
further research should be done in order to measure the impact of the relation
fat/ protein in the milk payout. Within the New Zealand genetics, Holstein
Friesian cows have a fat/ protein ratio more similar to American Holstein than
the New Zealand Jersey. I n New Zealand breeding schemes, the breeding
companies are already putting a much higher economic value on milk protein
because the New Zealand dairy company-payment scheme includes a higher
payment for protein, a trend that will continue (Colin Holmes, personal
communication).
Another disadvantage ofNew Zealand genetics in Argentina is that New
Zealand semen is more expensive and more difficult to buy because it has to be
imported, and because New Zealand genetics companies do not offer many
services in Argentina.
Some additional points:
I t was mentioned that North American genetics (which have a big influence in
Argentine Holstein cows) are selected from a bigger population than in New
Zealand and have been selected for a larger number of years. The researcher
does not know if there are studies that support this statement.
However, the present study found an association between the adoption ofNew
Zealand innovations and lower mortality and replacement rates. Additionally,
the present study found an association between the adoption ofNew Zealand
genetics and higher milk yield per kilogram of live weight. These associations
228

Chapter 9: Discussion
suggest that New Zealand genetics do offer some real advantages for Argentine
dairy herds.
In conclusion another New Zealand farming principle should be mentioned: the cow
should.fit the system. Firstly farmers have to decide how they want to produce milk, and
then find a cow suitable for their system. It seems that Argentine farmers that want to
have seasonal systems would need some degree ofNew Zealand genet ics. Addit ionally
present research results suggest that New Zealand genetics cows are better suited to
typical Argent ine dairy systems, in which grazed pasture covers approximately 50% of
the total annual requirements of dairy animals. However, further research should be
done in order to assess which is the optimum type of cow for typical Argentine dairy
systems.
9) Reari ng of Calves in Groups
S ix out of seven of the case study farms had adopted this New Zealand innovat ion.
Some consensus was found, during the interviews, around the fact that rearing calves in
groups with calf-teats may not be the best system for everyone. There seem to be no
doubt that this kind of calf-rearing system saves t ime and can have excellent results.
However, if the person in charge of the rearing does not have the capacity to attend to
each calf individually, despite the fact that they are in groups, the mortality of calves
can be relat ively high.
It also seems that the transit ion from the tradit ional calf-rearing system to raising calves
in groups can be difficult; for example in one of the farms, the first time this group calf
rearing system was tried, very high mortality ocurred. However they are convinced of
the benefits of this system and they are considering trying it again.
M ain advantages mentioned by the case studies were:
Less time required in order to rear the same number of calves.
Enables the person in charge to devote more time to observe the calves, to see if
they are sick and to touch their navels to assess if they are infected. I n the
individual-rearing system, the person is so busy warming the milk, filling the
229

Chapter 9: Discussion
buckets and moving the stakes, that he or she does not have time to observe the
calves.
It allows the calves to socialize earlier and to get accustomed to belonging to a
group.
Calves can move freely and they can go to shade if it is too hot, or shelter from
the wind when it is too cold.
It seems that this system can be more enjoyable for the person in charge and is
also more "animal friendly".
1 0) Style of M i l king Shed and Milking System
All the case studies adopted this New Zealand innovation. Many of them are changing
from more traditional Argentine milking sheds and systems to the typical New Zealand
herringbones. The main cause for this widespread adoption is that these systems allow
more cows to be milked per set of teat-cups and more teat-cups to be handled per person
than in the traditional Argentine systems. Both of these combine to enable the staff to
milk more cows per person and per hour in the New Zealand herringbones. Another
advantage is that they require less capital input per set ofteat-cups than in the other
systems. At the same time, the New Zealand style milking sheds and milking systems, if
correctly built, can be very comfortable to work in and easy to clean.
9.2. 2 Return on Investment, Land, and Adoption of NZ
Innovations
The adoption of the New Zealand innovations was found to be associated with
increments in Return on I nvestment ( ROI) and decreases in land costs per kilogram of
milk. Addit ionally case study farmers mentioned that the adoption of the New Zealand
innovations could increase land productivity (milk produced per unit of capital invested
in land) .
The New Zealand innovations related to pasture production and pasture util ization
( increments of phosphate levels in soils, utilization of quantitative pasture monitoring,
230

Chapter 9: Discussion
and utilization of pasture budgets) were considered to be most strongly associated with
higher land productivity by the case study farmers.
Grazed pasture was one ofthe main sources of feed on the Argentine dairy farms.
Pasture covered between 30% and 68% of the total cows' annual requirements on the
case study farms, and between 52% and 6 1 % of the total cows' annual requirements on
the typical Argent ine farms. I n typical New Zealand farms, grazed pasture covered
between 70% and 82% of the total annual requirements of cows. The adoption ofNew
Zealand innovations were considered by the case studies to be related to increments in
pasture production and utilization per hectare, and consequently in overall land
productivity overall .
H igher land product ivity was probably the main reason why the adopters of New
Zealand innovations had lower land costs (capital invested in land per kilogram of milk
produced).
Additionally land was the main investment for the typical and real Argentine dairy
farms; this part ly explains why improvements in land productivity were associated to
increments in ROI .
ROI is possibly the ult imate ind icator of financial performance. ROI is calculated as the
operating profit (cal led Economic Farm Surplus in New Zealand) of a business as a
percentage of the total investment in the business. Dairy farms with higher ROI provide
to their owners a higher profit per dollar invested in the business. ROI is also useful to
compare the returns from the investment in a dairy farm with the potential returns from
other possible businesses.
9.2. 3 Labour and Adoption of NZ Innovations
The adoption ofNew Zealand innovations was found to be also associated w ith
increments in labour productivity. The main New Zealand principle associated to labour
productivity was having less than 1 5 cows milked per set ofteat-cups (or more than 67
teat-cups for every 1 000 cows to be milked). Other innovations related to improvements
in labour productivity were seasonal calving, rearing of calves in groups, and New
Zealand style milking sheds and systems. Despite their higher labour productivities,
23 1

Chapter 9: Discussion
farms that adopted New Zealand innovations had higher labour costs per kilogram of
milk produced because they also paid higher wages, and the difference in wages was
larger than the difference in labour productivity.
It is important to mention that none of the case studies fully adopted the New Zealand
innovation in relation to the number of cows per set of teat-cups. It is possible that some
of the case studies that had adopted many of the New Zealand innovations, including
more skilful and motivated people, would have had higher labour productivit ies if the
number of cows per set ofteat-cups had been decreased. This increase in labour
product ivity would have been associated with lower labour costs. However, some
capital invested have been required in order to increase the number of sets of teat-cups,
therefore capital costs would have increased.
Further research should be done in order to study the trade off between level of
investment in plant and machinery and the amount of labour needed for Argentine dairy
farms. There is probably a level at which typical Argentine farms would decrease their
labour costs at a rate which is higher than the rate of increment in capital costs. It is the
opinion of the researcher that the costs of add ing sets of teat-cups (up to certain level) to
Argentine dairy milking sheds, could be repaid by lower labour costs.
9.2.4 Capital (land not included) and Adoption of NZ
Innovations
An association was found between the adoption of New Zealand innovations and
increments in capital costs ( land costs not included), and also with a reduction in capital
productivity. Addit ionally, increments in adoption ofNew Zealand innovations were
associated w ith h igher investment in plant and machinery per cow. Further research
should be done in order fmd the explanations of these associations.
232

Chapter 9: Discussion
9.2. 5 Means of Production and A doption of NZ Innovations
A slight association was found between the adoption ofNew Zealand innovations and
higher "costs as means of production"27. The two farms that adopted the higher level of
New Zealand innovations had the highest costs of as means ofproduction. Additionally,
for these two farms costs as means of production represented the largest proportion of
total costs. On the other hand these two farms had the lowest land costs of all the farms,
in abso lute terms and also as proportion of total costs. Further research should be done
in order to better understand this association.
9.3 Non-d iffusion of New Zealand innovations i n
Argenti na
Many Argentine farmers that have been adopting some of the New Zealand principles
and practices on their farms, and many New Zealand consultants and researchers that
have travel led to Argentina to communicate the New Zealand dairy farming principles,
share the fo llowing question that motivated the present study: Why is it that New
Zealand practices and principles, despite the .fact that they appear to be so beneficial to
Argentine .farms, have not been widely adopted in A rgentina?
The Theory of Diffusion (reviewed in Chapter 3) stated that the four main factors that
influence the spread of innovations are: a) the perceived attributes of innovations, b) the
communication channels, c) the characteristics of the social system, d) and the extent of
change agents' promotion efforts. From these factors "the perceived attributes of
innovat ions" is the most important in influencing diffusion. The attributes are: relative
advantage, compatibility, complexity, trialability and observability ( Rogers, 2003) .
From these attributes, "perceived relative advantage", also called "perceived potential
benefits", was suggested by the literature to be the most important in influencing
adoption (Fliegel & Kivl in, 1 966a, 1 966b; Martin et al., 1 988; S inden & King, 1 990).
The fo l lowing it can be deduced from the Classical Diffusion Theory: innovations that
are perceived as advantageous by potential adopters d iffuse rapidly; and the higher the
2 7 Means of Production as defined by the IFCN are: animal purchases, feed (purchase feed, fertiliser, seed, pesticides), machinery (maintenance, depreciation, contractor), fuel, energy, lubricants, water, buildings (maintenance, depreciation), veterinarian and medicine, insemination, insurance and taxes, and other inputs.
233

Chapter 9: Discussion
advantage of a given innovation over the old ideas, the faster the d iffusion of that
innovation .
The fact that typical Argentine farms had similar Entrepreneur's P rofit to typical N ew
Zealand farms, and the fact that some typical Argentine farms performed as well as the
case studies that had adopted a large number ofN ew Zealand innovations, showed that
the advantage in Entrepreneur's Profit of the innovations over the traditional practices
was not so significant. This could be the main reason why New Zealand innovations
have not been widely adopted in Argentina. However, this is not the only reason, other
constraints can be related to compatibility issues or other factors proposed by the
D iffusion Theory.
Despite the fact that benefits of adoption were not so clearly seen in differences in
Entrepreneur's Profit, this study defmed a number of benefits from adopting New
Zealand innovations that should be considered by Argentine dairy farmers and
consultants. Additional ly, despite the fact that Entrepreneur's Profit is an important
indicator of profitability, some ofthe farmers mentioned that they were focused in
maximizing returns per hectare or per capital invested. Therefore their focus was on
ROI , in which increases were assoc iated with the adoption ofNew Zealand innovations.
234

Chapter 10: Conclusions
1 0 CONCLUSIONS
1 0 . 1 The Research Questions
Why New Zealand principles and practices, despite the .fact that they appear to be so
beneficial to Argentine.farmers, have not been widely adopted in A rgentine.farms?
Can A rgentine dairy.farmers benefit.from adopting New Zealand dairy.farm principles
and practices?
1 0 .2 Research Conclusions
Re lated t o Entreprene u r's Profit a n d Return on I n vestment
Higher levels of adoption of New Zealand innovations by a group of Argent ine dairy
farms28 were associated with higher levels of Return on Investment (ROI) . Although, no
associat ion was found between level of adoption of New Zealand innovations and the
level of Entrepreneur's Profit per kilogram of milk29 produced.
However ROI is increasingly been considered as a more relevant financial indicator for
dairy farmers in New Zealand (Nicola Shadbolt, personal communicat ion) and also
some of the Argentine farmers mentioned that they were focused in maximizing returns
oftheir investment.
Related to the Cost Component " Land"
H igher levels of adoption of New Zealand innovations by a group of Argentine dairy
farms were associated w ith reductions in land costs per kilogram of milk produced.
The main advantage of the adoption ofNew Zealand innovations found in the case
study farms (especially "increments of phosphate levels in soils", "utilization of
2 8 Seven real Argentine dairy farms and three typical Argentine dairy farms (IFCN) were studied for the 2002 and 2003 seasons. 29 All milk considered is Energy Converted Milk (ECM).
235

Chapter 10: Conclusions
quantitative pasture monitoring", and "utilization of pasture budgets"), was the
association between the level o f adoption and level of milk production per hectare30.
Related to the Cost Component " Labour"
H igher levels of adoption of N ew Zealand innovations by a group of Argentine dairy
farms were associated with higher levels of labour costs per kilogram of milk produced,
because ofhigher average wages paid per hour of work, and despite higher levels of
labour productivity3 1 •
The N ew Zealand principle "less than 1 5 cows milked per set ofteat-cups" was found to
be the innovation most closely associated with increases in labour productivity. Other
innovations adopted by the Argentine farmers that could be associated with increases in
labour productivity were: seasonal calving, rearing of calves in groups, and New
Zealand style milking sheds and systems.
Addit ionally, the adoption ofNew Zealand innovations was associated with increasing
levels o f formal education of people working on dairy farms, which was also associated
with higher wages paid.
Rel ated to the Cost Com ponent "Capital" ( land not i ncl uded)
A sl ight association was found between the level of adoption of N ew Zealand
innovations by a group of Argentine dairy farms and the level of capital costs per
kilogram of milk produced. Additionally the adoption ofNew Zealand innovations was
associated with reduction in capital product ivity32 .
Related to the Cost Component "Means of Production"
A sl ight association was found between the adoption ofNew Zealand innovations by a
group of Argentine farms and higher costs as means of production33 per kilogram of
milk produced.
30 Land productivity measured in kilograms of milk (ECM) per hectare. 3 1 Labour productivity measured in kilograms of milk (ECM) per hour of work, including all people that worked in the dairy enterprise (contract labour not included). 32 Capital productivity measured in kilograms of milk (ECM) produced per US-$ 1 000 invested on buildings, machinery, livestock, and others. 33 Means of Production as defined by the IFCN are: animal purchases, feed (purchase feed, fertiliser, seed, pesticides), machinery (maintenance, depreciation, contractor), fuel, energy, lubricants, water,
236

Chapter 10: Conclusions
Related to New Zealand Genetics
Cows ofNew Zealand genetics were believed to be necessary for the adoption of
seasonal calving, by the Argentine case study farmers and dairy sector experts. An
association was found between the adoption ofNew Zealand genetics and higher milk
yield per kilogram of live weight . Additionally, farms that adopted New Zealand
genetics had lower mortality and replacement rates than those that had not adopted
them.
1 0 .3 Assessment of the methodology
The present study had to deal w ith a general lack of accurate informat ion about the
Argentine production sector. No exhaustive survey of the population of Argentine dairy
farmers has been done. However, an extensive survey done by Gambuzzi et al. (2003)34
and the average and typical farms defined by the panel of Argentine dairy production
experts of the I FCN were very useful in order to place the case study farms within the
population of Argent ine dairy farms.
It should be mentioned that at the time when this research was completed no other study
on adoption ofNew Zealand innovations by Argentine farms could be found. Nor were
there any reliable information about the fo llowing: a list ofNew Zealand practices,
technologies and ideas that would be innovative and useful for Argent ine farmers; the
proportion, number or ident ity of the Argent ine dairy farmers that were adopting New
Zealand ideas; and the New Zealand ideas that had already been adopted by the farmers
in contact with the New Zealand dairy farm systems were also unknown.
Related to the Qual itative Data
The case study strategy in general, and the multiple and embedded case study in
particular, were found to be appropriate in order to meet the first four objectives of the
present study (see section 1 .2) . The chosen design was useful to define a group ofNew
buildings (maintenance, depreciation), veterinarian and medicine, insemination, insurance and taxes, and other inputs. 34 Gambuzzi et al. (2003) did a survey of 530 dairy farms on most of the main production areas of Argentina. However the sample was done randomly and therefore it is not known how representative it is. Additionally, not all the production areas of Argentina were surveyed (for example: there were no dairy farms representing the south east of Buenos Aires province).
237

Chapter 10: Conclusions
Zealand innovations that were potentially useful for Argentine dairy farms, to assess the
level of adoption of these innovations, and to identify the reasons for their adoption and
rejection.
I n order meet the fourth objective (assess the impact of the adoption ofNew Zealand
innovations on the performance of the case study farms), it was necessary to add some
typical Argentine farms to the case study farms. The typical Argentine farms from the
I FCN -which were assumed that had not adopted any New Zealand innovation- were
useful for comparison with the case studies -which had adopted different levels ofNew
Zealand innovations. Some associations were found between the level of adoption ofthe
innovations and the level of some physical and fmancial performances. However a
greater number of farms, and possibly data from several seasons, would have been
necessary in order to examine the possible relationships between the adoption ofNew
Zealand innovations and some physical and economical variables statist ical ly.
The fifth objective of the present study (assess which have been the main causes of the
non-spread ofNew Zealand innovations in Argentine dairy farms) was partially
accomplished by identifying, what was possibly the main cause for non-spread ofNew
Zealand innovations. However, it was not possible to investigate other issues related to
the diffusion of the innovat ions due to time constraints.
Related to the Quantitative Data
The IFCN database provided a valuable framework for the quantitative analysis, based
on four costs components ( land, labour, capital and means of production). This
framework was very helpful in assessing the impact of adopting New Zealand
innovations on the performance of the case study farms. This framework, which was
designed to contrast farms from different countries, enabled the comparisons between
the Argentine and New Zealand typical farms, and also between the typical and real
Argentine dairy farms. The I FCN database encloses some innovative physical and
fmancial indicators, as for example: "Costs of Milk Production Only" per kilogram of
mi lk produced; ''Non-milk Returns" per kilogram of milk produced; "Entrepreneur's
Profit" per kilogram of milk produced; and the ways of calculating the opportunity costs
of land, labour and capital. Additionally the computer spreadsheet T IP I -CAL was useful
to process the data from the case study farms and to illustrate the results in graphs.
238

Chapter 10: Conclusions
1 0 .4 Further Research
• The impact of adopting each N ew Zealand innovation on the performance of
Argentine dairy farms should be investigated further, for the impact on ROI ; on
Operating Profit per hectare; on productivities of land, labour and capital; and on
production costs.
• Further research should be done in order to study the trade off between level of
investment in plant and machinery in Argentine dairy farms (especially the
number of set of teat-cups) and total labour productivity. There should be a level
of investment for Argentine dairy farms when labour costs savings (per kilogram
of milk produced) are greater than the additional capital costs (per kilogram of
milk produced).
• Future research should be done in order to assess which is the optimum type of
cow for typical Argentine dairy systems. The similarit ies and differences
between the Argentine, the N ew Zealand and I rish dairy systems, in which New
Zealand genetics cows' performance is being investigated, should be explored.
• Further research invest igating the benefits of adopting New Zealand innovations
by farms with different proportions of grazed pasture in the total annual diet for
the herd.
• The main goals of Argentine dairy farmers should be stud ied. And also which
indicators should be taken into account by typical Argent ine farmers in order to
achieve their dairy farm goals.
• Further research should be done to assess the opportunit ies and constraints for
the diffusion of New Zealand innovations in the future. The Classic Theory of
Diffusion could provide a helpful framework in order to accomplish this
objective. This might lead to a more general study of advisory and extension
services requires in Argentina.
• The utilization of debt in dairy fanning in Argentina should be studied; and also
the possible returns of Argentine dairy farms and the risks involved at d ifferent
levels of debt.
239

240

Chapter 11: References
1 1 REFERENCES
AACREA. ( 1 986). Milk production 1 . I n Cuaderno de A ctualizaci6n Tecnica CREA .
ACHA (2000). Asociaci6n Criadores de Holando A rgentina. Retrieved 7/0 1 , 2005, from ht tp://www. v iarura I . co m. ar/v iarura l . com. ar/ganadcria/asocia c io ncs/ho lando/cl ho
landoargcnt inoO l . htm
Arnon, I . ( 1 989). Agricultural research and technology transfer. London, New York: Elsevier Applied Science.
BCRA. (2005) . Presentaci6n del Programa Monetario 2005 ante el Honorable Senado de la Naci6n. Retrieved 1 5/03 , 2005 , from ht tp: 1/www. bent. �o ,· . ar/hmOOOOOO. asp
Black, A. W. (2000). Extension theory and practice: a review. Australian Journal of Experimental Agriculture, 40, 493-502.
Bouma, G. D. (2000). The research process (4th ed.). Melbourne: Oxford University Press.
Campbell, A. , & Junor, B. ( 1 992). Land management extension in the '90s: Evo lut ion or emasculation? Australian Journal ofSuil and Water Conservation, 5(2).
Caplan, N . , & Nelson, S. D. ( 1 973). On B eing Useful: The Nature and Consequences of Psycho logical Research on Social Problems. American Psychologist, 28, 1 99-2 1 1 .
Carberry, P . S . , Hochman, Z., McCown, R . L., Dalgliesh, N . P., Foale, M . A., Poulton, P. L. , et al. (2002). The FARMSCAPE approach to decision support : Fanners', advisers', researchers', monitoring, s imulation, communicat ion and performance evaluat ion. Agricultural Systems, 74, 1 4 1 - 1 77.
Castignani, H . , & Zehnder, R . (2003). A nalisis de Empresas Tamberas de Cambio Rural de la Zona Centra de la Provincia de Santa Fe - Ana 200112002. Retrieved 1 0/2004, 2004, from http://www. inta.gov.ar/rataela/ info/documcntos/cconomia
Chambers, R . , & Ghildyal, B. P. ( 1 985). Agricultural-Research for Resource-Poor Farmers - the Farmer- ! st-and-Last Model. Agricultural Administration, 20( 1 ) , 1 -30.
Chambers, R . , & Jiggins, 1. ( 1 987). Agricultural-Research for Resource-Poor Farmers . 1 . Transfer-of-Technology and Farming Systems Research. Agricultural A dministration and Extension, 2 7( 1 ) , 35-52.
Chetty, S . ( 1 996). The Case Study Method for Research in Small- and Medium-sizes F irms. International Small Business Journal, 15, 73-85.
24 1

Chapter 1 1: References
CI L (2004). Exportaci6n de Productos Lacteos (detalle mensual). Retrieved 1 8/0 1 , 2004, from http://www.cil.org.ar/
Clark, D . A., Carter, W. , Walsh, B . , Clarkson, F . H . , & Waugh, C. D. ( 1 994). Effect of
winter pasture residuals and grazing off on subsequent milk production and pasture performance. Paper presented at the New Zealand Grasslands Association Conference.
Dexcel. (2003). Benchmarking Efficient Farm Systems.
E isenhardt, K. M. ( 1 989). Building Theories from Case-Study Research. Academy of Management Review, 14(4), 532-550.
E isenhardt, K. M. ( 1 99 1 ). Better Stories and B etter Constructs - the Case for R igor and Comparative Logic. Academy of Management Review, 1 6(3), 620-627 .
Euromonitor. (2004a). Argentina, Country Profile. Retrieved 25/08, 2004, from http:/www.euromonitor.com/gmid/printdata.asp
Euromonitor. (2004b). Countries Profiles. Retrieved l l /06, 2004, from http://www.euromonitor.co m/gmid/default. asp
Euromonitor. (2004c). New Zealand, Country Profile. Retrieved 1 4/06, 2004, from http:/www.euromonitor.com/gmid/printdata. asp
Fencepost.com. (2004, 2 1 107/2004). Fonterra Payout Lifts 2 Cents To $4. 25. Retrieved 20/0 1 , 2004, from http://www.fencepost .com/dairy/industry/detail .jhtml?Element lD=/dairy/news/r epository/2004072 1 090438 Fonterra Payout Lifts 2 Cents To 4 2 5.xml
Fliegel, F. C., & Kivlin, J. E . ( 1 966a). Attributes o f lnnovations as Factors in D iffusion. The American Journal of Sociology, 72(2), 235-248.
F l iegel, F. C., & Kivlin, J . E. ( 1 966b). Farmers' Perceptions of Farm Pract ice Attributes. Rural Sociology, 31 (2), 1 97-206.
FXHistory: Historical currency exchange rates. (2005). Retrieved 08/03, 2005
Gambuzzi, E. L. , Zehnder, R. , & Chimicz, J . (2003). A nalisis de Sistemas de
Producci6n Lechera. Retrieved September 1 7th, 2004, from http://www. inta.gov.ar/rafaelalinfo/documentos/economialanalisis sistemas pro d lechera.pdf
Garcia, S . C. ( 1 997). Milk Production in Argentina. Dairyfarming A nnual, 49, 86-9 1 .
Garcia, S . C., & Holmes, C. W. ( 1 999). Effects of time of calving on the productivity of pasture-based dairy systems: A review. New Zealand Journal of Agricultural Research, 42, 347-362.
Goldman, K. D. ( 1 994). Perceptions of lnnovations as Predictors of l mplementation Levels - the Diffusion of a N ationwide Health-Education Campaign. Health Education Quarterly, 21(4), 429-444.
242

Chapter 1 1: References
Goss, K. F . ( 1 979). Consequences of Diffusion o f lnnovations. Rural Sociology, 44, 754-772.
Gray, D. I . (200 1 ). The tactical management processes used by pastoral-based dairy farmers: A multiple-case study qf experts. Unpublished thesis presented in partial fulfi lment of the requirements for the degree of Doctor of Philosophy in Farm M anagement at Massey U niversity.
Guardini, E . , Labriola, S . , & Schaller, A. ( 1 999, July). Cadenas Alimentarias, Productos Lacteos. A limentos Argentinos.
Guerin, L. J . , & Guerin, T. F. ( 1 994) . Constraints to the Adoption of I nnovations in Agricultural-Research and Environmental-Management - a Review. A ustralian Journal of Experimental Agriculture, 34( 4), 549-57 1 .
Guerin, T. F. ( 1 999). An Australian perspective on the constraints to the transfer and adoption of innovations in land management. Environmental Conservation,
26(4), 289-304.
Gutman, G., Guiguet, E., & Rebolini, J . (2003 ) . Los Ciclos en el Complejo Lacteo Argentina. Analisis de Politicas Lecheras en Paises Seleccionados: SAGPyA.
Haider, M., & Kreps, G. L. (2004). Forty years of Diffusion of I nnovat ions: Ut ility and value in public health. Journal of Health Communication. 9(Suplement), 3- 1 1 .
Harrison, W. R . , & Kennedy, L. P. ( 1 997). A N eoclassical Economic and Strategic Management Approach to Evaluating G lobal Agribusiness Compet itiveness. Competitive Review. 7( 1 ), 1 4-27.
Hodgson, J. ( 1 990). Grazing management: Science into practice: Longman Scient ific & Technical.
Holmes, C. W. (2003a). For all systems (high and low inputs) , costs per kg milksolids must be appropriate for the system 's output qf kg milksolids per hectare. Palmerston North, NZ: Massey U niversity.
Holmes, C. W. (2003b). Low Cost Production qf Milkfrom Grazed Pastures: An outline
qf dairy production systems in New Zealand. Palmerston North, N .Z. : Massey University.
Holmes, C. W., Brooks, I. M., Garrick, D. J . , MacKenzie, D. D. S., Parkinson, T. J., & Wilson, G. F. (2002). Milk production from pasture. Palmerston North, N .Z. : Massey U niversity.
Hopkins, A. (2000). Grass: Its production and utilization (3rd ed.) . Oxford: B lackwel l Science.
Howden, P. , & Vanclay, F. (2000). Mythologization of farming styles in Australian broadacre cropping. Rural Sociology, 65(2) , 293-3 1 0.
I FCN. (2002). Dairy Report. Status and Prospects of Typical Dairy Farms World- Wide. (No. 1 6 1 0-434X). Braunschweig, Germany: I FCN { International Farm Comparison N etwork).
243

Chapter 1 1: References
I FCN. (2003). IFCN Dairy Report. For a Better Understanding of Dairy Farming World- Wide. (No. 1 6 1 0-434X): I FCN ( International Farm Comparison Network).
I FCN. (2004) . IFCN Dairy Report. For a Better Understanding of Dairy Farming World- Wide. : I FCN ( International Farm Comparison Network).
IFCN Dairy Report. For a Better Understanding of Dairy Farming World- Wide. (No. 1 6 1 0-434X)(2003). I FCN ( International Farm Comparison Network).
I NDEC. (2003). Encuesta Industrial Anual 2000 y 2001 . Retrieved 27/03, 2005, from http://www . a l i mcntosargent inos.gov. ar/estad ist icas/Encuesta I nd ustr ia l Anual
2 000-2 00 l . x ls
IN DEC. (2005). Sistema de Indices de Precios al por Mayor (SIPM). Retrieved 08/03, 2005
I sermeyer, K. , Debiitz, C. , Hemme, T., & Plessmann, F. (2004, March 2004). 20 Questions and Answers about IFCN. Retrieved 1 4/09/2004, 2004, from http://www. i fcnnetwork.org/Down loads/e-200mar04.pdf
Kaplan, A. W. ( 1 999). From passive to active about solar electricity: I nnovat ion decision process and photovoltaic interest generation. Technovation, 1 9(8), 467-48 1 .
Kincaid, L. D. (2004). From I nnovation to Social Norm: Bounded Nonnat ive Influence. Journal of Health Communication, 9(Suplement), 37-57.
La Opinion, R.-A. (2004). La exportaci6n de lacteos seria record. Retrieved 1 5/03, 2005, from http://www. laopi n ion-rafacla.eo m. ar/opi n ion/2004/ I 0/2 1 /p4a7 I 09. ht m
Lambourne, A. , & Betterridge, K. (2004). What is more Important - the Pasture or the Cow? Paper presented at the Dairy 3, Rotorua, New Zealand.
L IC. (2000/0 1 ). Dairy statistics. Hamilton, N .Z : Livestock Improvement Corporation.
LIC. (200 1 ). Company Profile I Strengths of Livestock Improvement New Zealand
Genetics Cattle. Retrieved 7/0 1 , 2005, from http://www. newzeal andgenet ics.com/main.cfm?id= I
LIC. (200 1 /02). Dairy statistics. Hamilton, N .Z : Livestock Improvement Corporat ion.
LIC. (2002/03) . Dairy statistics. Hamilton, N .Z . : Livestock Improvement Corporation.
LIC. (2003/04). Dairy statistics. Hamilton, N .Z. : Livestock Improvement Corporation.
Lievrouw, L. A. , & Pope, J . T. ( 1 994). Contemporary-Art as Aesthetic I nnovation Applying the Diffusion-Model in the Art World. Knowledge-Creation Diffusion Utilization, 1 5( 4), 373-395.
244

Chapter 1 1: References
Lockie, S . , Mead, A., Vanclay, F. , & Butler, B . ( 1 995). Factors encouraging the adoption of more sustainable crop rotations in south-east Australia: profit, sustainabi lity, risk and stabil ity. Journal of Sustainable Agriculture, 6( 1 ) .
Luna, F. ( 1 994/95 ). Historia integral de la A rgentina. Buenos Aires: P laneta.
Lynch, T., Gregor, S., & Midmore, D. (2000). Intell igent support systems in agriculture: how can we do better? A ustralian Journal qf Experimental Agriculture, 40( 4), 609-620.
MacDonald, K. A. , Penno, J . K., Nicho las, P. K. , Lile, J. A., Coulter, M., & Lancaster, J. A. S. (2001 ). Farm Systems - Impact qf Stocking Rate on Dairy Farm Efficiency. Paper presented at the New Zealand Grassland Association.
MAF. (2004 ) . Dairy Monitoring - Sector Overview. Retrieved 20/0 1 , 2004, from http://www. m a f govt. nz/ma fnct/rural- nz/stat ist ics- ancl - t()rccasts/tarmmo n itoring/2004/da i ry/dairy-03 . htm#TopO tPagc
Martin, R . J . , McMil lan, M. G. , & Cook, J . B . ( 1 988). Survey of Farm- Management Practices of the Northern Wheat Belt ofNew-South-Wales. A ustralian Journal q[Experimental Agriculture, 28(4), 499-509.
Mayne, S. ( 1 998). Selecting the correct dairy cow.for grazing systems. Paper presented at the Ruakura Farmers' Conference.
McCall, D. G . , & Sheath, G. W. ( 1 993, 8-2 1 February). Development qf Intensive Grassland Systems: From Science to Practice. Paper presented at the XVI I International Grassland Congress, New Zealand : Palmerston North, Hamilton and Linco ln; Australia: Rockhampton.
Mensch, B. S . , Bagah, D. , Clark, W. H . , & Binka, F. ( 1 999). The changing nature of adolescence in the Kassena-Nankana d istrict of northern Ghana. Studies in Family Planning, 30(2), 95- 1 1 1 .
Meyer, G. (2004). Diffusion Methodology: T ime to innovate? Journal qf Health Communication. 9(Suplement), 59-69.
M intzberg, H . ( 1 973). The nature qfmanagerial work. Englewood Cliffs, N .J . : PrenticeHall.
M itchell, N. (2002). The Dairy Industry in New Zealand - New Structure and Future. Paper presented at the I mplication of policy changes for the world dairy I ndustry. Proceedings ofthe Policy, Economics & Marketing Conference, I DF World Summit 200 1 NZ.
Molinuevo, H. A. (2001 ). Ajuste entre el potencial genetico-productivo y el sistema de produccion lechera. Retrieved 1 0/09/2004, 2004, from http://www. inta.gov.ar/balcarce/info/documentos/ganaderialbovinos/genet icalge netica.htm
Moo re, G. C . , & Benbasat, I . ( 1 99 1 ) . Development of an I nstrument to Measure the Perceptions of Adopting an I nformation Technology Innovation., Information
245

Chapter 1 1: References
Systems Research (Vol. 2, pp. 1 92): INFORMS: I nstitute for Operations Research.
Murray, P. (2000). Evaluating participatory extension programs: Challenges and problems. A ustralian Journal of Experimental Agriculture, 40( 4), 5 1 9-526.
Murthy, B. K., Dudhani, C. M., Jayaramaiah, K. M. , Veerabhadraiah, V., & Sethu Rao, M. K. ( 1 973 ). A scale to measure the differential perceptions of adapters and non-adapters. Mysore Journal of Agricultural Science, 7(2).
NZ-Biosecurity. ( 1 997). Code of Recommendations and Minimum Standards for the Welfare of Bobby Calves. Retrieved 1 3/03, 2005, from http://www.biosecurity.govt .nzJanimal-welfare/codes/bobby-calves/
Ostrowski, B . , & Deblitz, C. (200 1 ). La competitividad en produccion lechera de Ios
paises de Chile, Argentina, Uruguay y Brasil.
Pande, T. N. , Valentine, I . , Betteridge, K., MacKay, A., & Home, D. (2000). Pasture damage and regrowth from cattle treating. Paper presented at the New Zealand Grassland Association Conference.
Penno, J. ( 1 999). Stocking Rate for Optimum Profit. Paper presented at the South I sland Dairy Event .
Phill iber, S . G. , Schwab, G. , & S loss, S. ( 1 980). Social research . ltasca: F. E . Peacock Publishers.
R itson, C. ( 1 977). Agricultural economics: principles and policy. London: Crosby Lockwood Staples.
Rogers, E. M. (2003 ). Diffusion of innovations (5th ed.) . New York: Free Press.
Rogers, E. M. (2004). A prospective and retrospective look at the diffusion model. Journal of Health Communication, 9(Suplement), 1 3- 1 9.
Rogers, E. M. , & Kincaid, L. D. ( 1 98 1 ). Communication networks: toward a new paradigm for research . New York, London: Free Press; Collier Macmillan.
Rogers, E. M. , & Shoemaker, F. F. ( 1 97 1 ) . Communication of innovations; a crosscultural approach (2nd ed. ). New York: Free Press.
R6ling, N . G. ( 1 988). Extension science: lriformation systems in agricultural development. Cambridge; New York: Cambridge University Press.
R6ling, N . G. , Ascroft, J., & Wa Chege, F. ( 1 98 1 ). The Diffusion of l nnovations and The I ssue of Equity in Rural Development. I n B. R. Crouch & S. Chamala (Eds. ), Extension Education and Rural Development (Vol. 1 , pp. 225-236). Chichester, New York, Brisbane, Toronto.
Rougoor, C. W., Trip, G., Huirne, R. B. M., & Renkema, J . A. ( 1 998). To defme and study farmers' management capacity: theory and use in agricultural economics. Agricultural Economics, 18(3), 26 1 -272.
246

Chapter 1 1: References
Rowley, J . (2002). Using case studies in research. Management Research News, 25( 1 ), 1 6-27.
SAGPyA. (2003) . Jnforme de coyuntura de Lacteos No. 20. Retrieved 20/06, 2003 , from http: //www . a l i mcntosargent i no s. go v. ar/lactcos/dcfa u lt. asp
SAGPyA. (2004a) . Producci6n A rgentina de Leche. Retrieved 27/08, 2004, from ht tp://www . a l i m cntosargcnt inos . gov. ar/0-
3 /lactcos/02 aciona 1 /scric/Prod Anua I. ht m
SAGPyA. (2004b). Jn.forme de coyuntura de Lacteos No. 26. Retrieved 30/08, 2004, from http://w ww . a I i mcnto sargcnt inos. go v . ar/lact cos/d e t�w l t . asp
Sinden, J . A., & King, D. A. ( 1 990). A rticles and Notes: Adoption of Soil Conservation Measures in Manilla Shire, N ew South Wales. Review of Marketing and Agricultural Economics, 58(2-3), 1 79- 1 92.
Statistics-NZ. (2000) . Quickfacts Industries: Dairy products. Retrieved 30/06, 2004, from http: ;;,,.,,.,\ . . stats . govt . nz/domino/cxt crn a I; \V eb nzstorics. nst/09 7 cdcb 76cd5aa6b
cc256a tc00� I d �-k 'b � 8 rtn t2 aa3 753 3 9cc2 5 6 b I lDOOOcbc I ')Open Document
Statistics-NZ. (2003) . New Zealand External Trade Statistics. Retrieved 30/07, 2004, from ht tp: ', \\'\\'\\' . s t ats . go\'t . !1i� 'dom i no 1ext erna 1/w cb 'prod sen· . ns f/()97 cdeb 76cd5aa6b
cc2 5 6a tC008 I d8-k ca7ca�c00..f46 7 b49cc2 56c43 007c10b710� 7 4 F I L E N Z ETSDcc03 .pd f
Thomson, N. A., & al, e. ( 1 993). Winter grazing management; effects on pastures. Paper presented at the Dairyfarming Annual, Massey University.
Thomson, N. A., Roberts, A. H. C. , McCallum, D. A. , Judd, T. G., & Johnson, R. J . ( 1 993). How Much Phosphate Fertiliser is Enough ? Paper presented at the Ruakura Farmers Conference.
Tully, J . ( 1 98 1 ) . Changing Practices: A Case-study. In B. R. Crouch & S. Chamala (Eds.), Extension Education and Rural Development (Vol. 2, pp. 79-86). Chichester, New York, Brisbane, Toronto .
USDA. (2004a). Dairy Exports, Selected Countries (Butter, Non·:fat dry milk and Cheese) . Retrieved 20/08, 2004, from http://www. fas . usda.gov/psd/ intro. asp?c irc id= 1 1
USDA. (2004b, 1 9/07/2004). USDA . Retrieved 20/08/2004, from http://www. fas.usda.gov/psd/ intro .asp?c irc id= 1 1
Valente, T. W., & Rogers, E . M. ( 1 995). The Origins and Development ofthe D iffusion of lnnovations Paradigm as an Example of Scientific Growth. Science Communication, 1 6(3), 242-273.
Vanclay, F. (2004) . Social principles for agricultural extension to assist in the promotion of natural resource management. A ustralian Journal of Experimental
Agriculture, 44(3).
247

Chapter 11: References
Veerabhadraiah, V., Sethu Rao, M . K., & Dwarakinath, R . ( 1 973a) . I dentification of opinion leaders in a rural community and their characteristics. Mysore Journal of Agricultural Sciences, 7(2).
Veerabhadraiah, V., Sethu Rao, M. K., & Dwarakinath, R . ( 1 973b). In fluence of referents on adoption of farm practices in two villages of Dharwar community development block. Mysore Journal of Agricultural Sciences, 7(2).
Warner, K. ( 1 974). The need for some innovative concepts of innovation: an examination of research on the d iffusion of innovations. Policy Sciences, 5(4).
Y in, R. K. (2002). Case study research: design and methods (3rd ed.) . Thousand Oaks, California: Sage Publications.
Zaltman, G. (2003 ) . How customers think: Essential insights into the mind of the market. New York, London: McGraw-H ill.
248