
Mozambique- Maputo Municipal Development...
112
Document of The World Bank Report No: ICR4106 IMPLEMENTATION COMPLETION AND RESULTS REPORT (IDA-48110) ON A CREDIT IN THE AMOUNT OF SDR 33 MILLION (US$50 MILLION EQUIVALENT) TO THE REPUBLIC OF MOZAMBIQUE FOR A MAPUTO MUNICIPAL DEVELOPMENT PROGRAM II (MMDP II) December 21, 2017
Transcript of Mozambique- Maputo Municipal Development...
Document ofThe World Bank
Report No: ICR4106
IMPLEMENTATION COMPLETION AND RESULTS REPORT(IDA-48110)
ON A
CREDIT
IN THE AMOUNT OF SDR 33 MILLION(US$50 MILLION EQUIVALENT)
TO THE
REPUBLIC OF MOZAMBIQUE
FOR A
MAPUTO MUNICIPAL DEVELOPMENT PROGRAM II (MMDP II)
December 21, 2017
Social, Urban, Rural and Resilience Global Practice (GSURR)Country Department AFCS2 Africa Region
CURRENCY EQUIVALENTS(Exchange Rate Effective as November 4, 2017)
Currency Unit = New Meticais (MTn) US$1 = MTn 60.40
US$ 1 = SDR 1.42
FISCAL YEARJanuary 1 - December 31
ABBREVIATIONS AND ACRONYMS
APL Adjustable Program LoanCAS Country Assistance Strategy CCM City Council of MaputoCRC Citizen Report CardsDALY Disability-adjusted life yearDUAT Rights of Use and Access to Land EIA Environmental Impact AssessmentsEMP Environmental Management PlansERR Economic Rate of ReturnFM Financial ManagementGoM Government of MozambiqueIBRD International Bank for Reconstruction and DevelopmentICR Implementation Completion and Results ReportICT Information and Communication Technology ICT Information and Communication TechnologyIDA International Development AssociationIERR Internal Economic Rate of ReturnIPRA Real Estate TaxIRR Internal Rate of ReturnISR Implementation Status ReportKPI Key Performance IndicatorM&E Monitoring and EvaluationMICOA Ministry of Environmental CoordinationMMDP Maputo Municipal Development ProgramMTR Mid-Term ReviewNPV Net Present ValueOSID Office of Strategic and Institutional DevelopmentPAD Project Appraisal DocumentPDO Project Development ObjectivePRF Project Result FrameworkQEA Quality at Entry AssessmentRAP Resettlement Action PlanRAPSIGEM Resettlement Action Plans Integrated Municipal Management System
ii

Vice President: Makhtar DiopCountry Director: Mark Lundell
Senior Global Practice Director: Ede Jorge Ijjasz-VasquezSector Manager: Bernice van Bronkhorst
Project Team Leader: Andre HerzogICR Team Leader: Andre Herzog
iii
REPUBLIC OF MOZAMBIQUEMAPUTO MUNICIPAL DEVELOPMENT PROGRAM II (MMDP II)
CONTENTS
Data SheetA. Basic InformationB. Key DatesC. Ratings SummaryD. Sector and Theme CodesE. Bank StaffF. Results Framework AnalysisG. Ratings of Project Performance in ISRsH. Restructuring I. Disbursement Graph
1. Project Context, Development Objectives and Design2. Key Factors Affecting Implementation and Outcomes3. Assessment of Outcomes4. Assessment of Risk to Development Outcome5. Assessment of Bank and Borrower Performance6. Lessons Learned7. Comments on Issues Raised by Borrower/Implementing Agencies/PartnersAnnex 1. Project Costs and FinancingAnnex 2. Outputs by ComponentAnnex 3. Economic and Financial AnalysisAnnex 4. Bank Lending and Implementation Support/Supervision ProcessesAnnex 5. Summary of Borrower's ICR and/or Comments on Draft ICRAnnex 6. List of Supporting Documents
MAP IBRD 33451R2
iv
Data Sheet
A. Basic Information
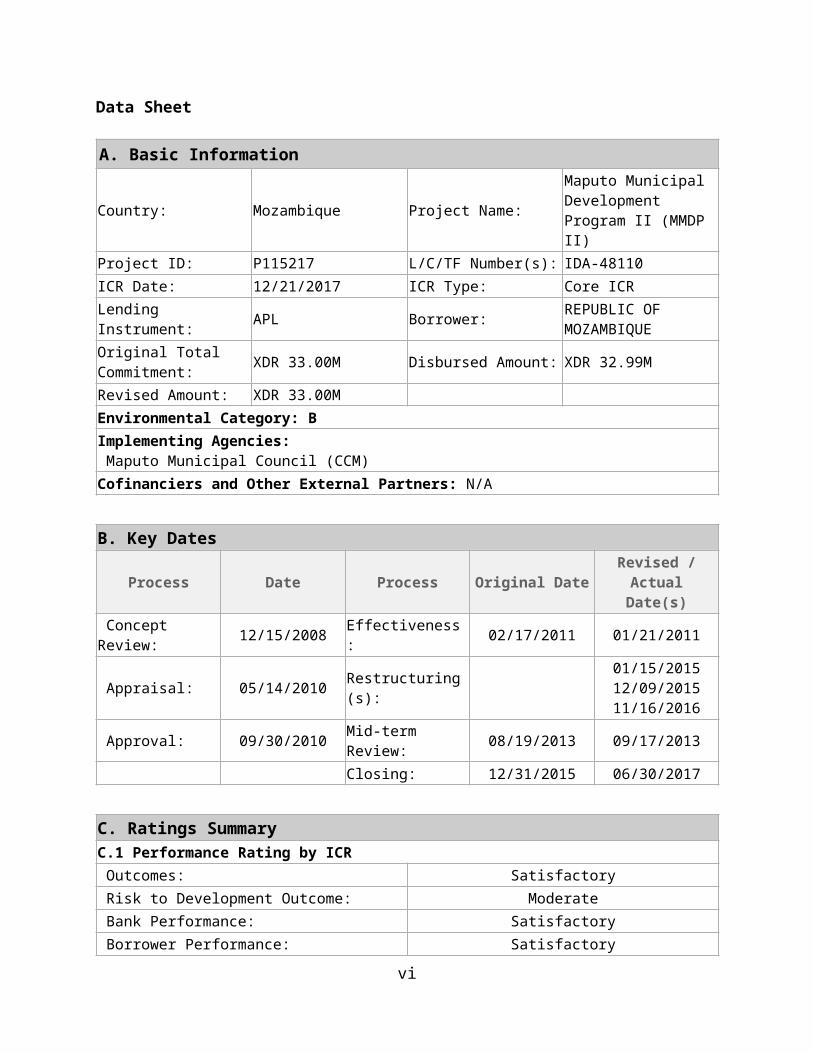
Country: Mozambique Project Name:Maputo Municipal Development Program II (MMDP II)
Project ID: P115217 L/C/TF Number(s): IDA-48110ICR Date: 12/21/2017 ICR Type: Core ICR
Lending Instrument: APL Borrower:REPUBLIC OF MOZAMBIQUE
Original Total Commitment:
XDR 33.00M Disbursed Amount: XDR 32.99M
Revised Amount: XDR 33.00MEnvironmental Category: BImplementing Agencies: Maputo Municipal Council (CCM)Cofinanciers and Other External Partners: N/A
B. Key Dates
Process Date Process Original Date Revised / Actual Date(s)
Concept Review: 12/15/2008 Effectiveness: 02/17/2011 01/21/2011
Appraisal: 05/14/2010 Restructuring(s):01/15/201512/09/201511/16/2016
Approval: 09/30/2010 Mid-term Review: 08/19/2013 09/17/2013 Closing: 12/31/2015 06/30/2017
C. Ratings Summary C.1 Performance Rating by ICR Outcomes: Satisfactory Risk to Development Outcome: Moderate Bank Performance: Satisfactory Borrower Performance: Satisfactory
C.2 Detailed Ratings of Bank and Borrower Performance (by ICR)Bank Ratings Borrower Ratings
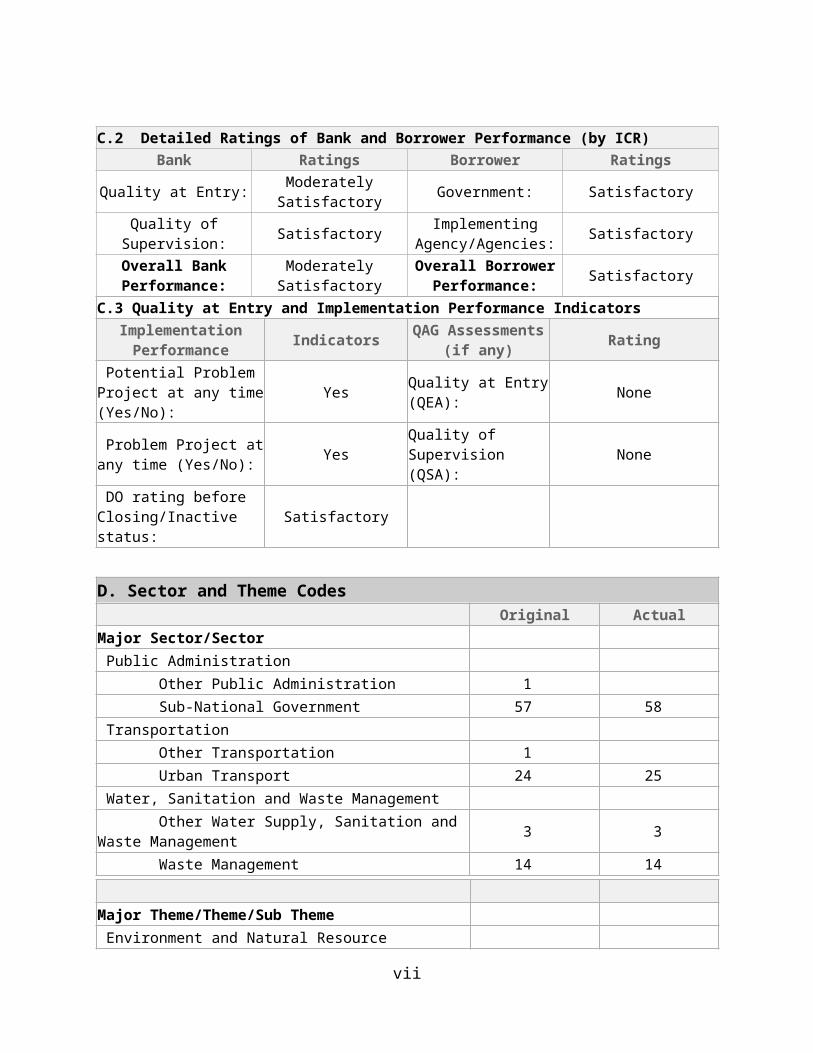
Quality at Entry: Moderately Satisfactory Government: SatisfactoryQuality of Supervision: Satisfactory Implementing Satisfactory
v
Agency/Agencies:Overall Bank Performance: Moderately Satisfactory Overall Borrower
Performance: Satisfactory
C.3 Quality at Entry and Implementation Performance IndicatorsImplementation
Performance Indicators QAG Assessments (if any) Rating
Potential Problem Project at any time (Yes/No):
YesQuality at Entry (QEA):
None
Problem Project at any time (Yes/No):
YesQuality of Supervision (QSA):
None
DO rating before Closing/Inactive status:
Satisfactory
D. Sector and Theme Codes Original Actual
Major Sector/Sector Public Administration Other Public Administration 1 Sub-National Government 57 58 Transportation Other Transportation 1 Urban Transport 24 25 Water, Sanitation and Waste Management Other Water Supply, Sanitation and Waste Management 3 3 Waste Management 14 14
Major Theme/Theme/Sub Theme Environment and Natural Resource Management Climate change 28 28 Adaptation 28 28 Finance Finance for Development 14 14 Housing Finance 14 14 Private Sector Development Public Private Partnerships 10 10 Public Sector Management Public Administration 14 14 Administrative and Civil Service Reform 6 6 Municipal Institution Building 14 14
vi
Urban and Rural Development Urban Development 32 32 Municipal Finance 11 11 Services and Housing for the Poor 9 9 Urban Infrastructure and Service Delivery 32 32 Urban Planning 14 14
E. Bank Staff Positions At ICR At Approval
Vice President: Makhtar Diop Obiageli K. Ezekwesili Country Director: Mark Lundell Luiz A. Pereira da Silva Practice Manager/ Manager:
Bernice van Bronkhorst Junaid Kamal Ahmad
Project Team Leader: Andre Herzog Uri Raich ICR Team Leader: Andre Herzog ICR Primary Author: Cecilia Zanetta
F. Results Framework Analysis
Project Development Objectives (from Project Appraisal Document)To improve the delivery and sustainability of priority municipal services in Maputo Municipality.
Revised Project Development Objectives (as approved by original approving authority)N/A
vii

(a) PDO Indicator(s)
Indicator Baseline Value
Original Target Values
(from approval
documents)
Formally Revised Target Values
Actual Value Achieved at Completion or Target Years
Indicator 1 Percentage of cumulative annual real increase in revenue from IPRA (Percentage)Value (quantitative or qualitative)
-- 288 281
Date achieved 2-Sep-10 31-Dec-15 31-Dec-16
Comments (incl. % achievement)
Substantially Achieved (98% level of achievement): CPI-adjusted annual IPRA collection increased by 281% from 2010 to end of 2016 thanks to an expanded IPRA tax-base through: i) reassessment of property values based on new IPRA legislation; and ii) additional 20,000 properties incorporated into the fiscal cadaster. The IPRA collection of the first six months of 2017 had already reached 236% at project closing in June, therefore, on track to achieve or surpass the end of project target.
Indicator 2 Number of people in urban areas provided with access to regular solid waste collection under the Project (Number)
Value (quantitative or qualitative)
729,264 1,041,545 1,136,568
Date achieved 2-Sep-10 31-Dec-15 30-June-2017Comments (incl. % achievement)
Achieved (109% level of achievement): Solid waste collection has reached 100% coverage in the contiguous districts of Maputo, which represent 90% of the municipality's total population.
Indicator 3 Households with secure land tenure formalized with Rights of Use and Access to Land - DUAT (Number)
Value (quantitative or qualitative)
- - 30,800 33,057
Date achieved 2-Sep-10 31-Dec-15 30-June-17Comments (incl. % achievement)
Achieved (107% level of achievement): This increase was the result of the implementation of a massive systematic land-tenure regularization campaign focused on peri-urban areas where the poor are more concentrated.
Indicator 4 Number of people in urban areas provided with access to all-season roads within a 500-meter range under the Project (Number)
Value (quantitative or qualitative)
60,000 300,000 968,963
Date achieved 2-Sep-10 31-Dec-15 31-Dec-16Comments (incl. % achievement)
Achieved (323% level of achievement): The substantial increase was the result of physical investments (i.e., the rehabilitation of key access and main arteries and improvements in secondary paved roads and peri-urban unpaved roads).
Indicator 5 Mean User Perception of Quality Public Services (Number) Value (quantitative or qualitative)
2.8 3.0 2.7
viii

Date achieved 2-Sep-10 31-Dec-15 31-Dec-15
Comments (incl. % achievement)
Not Achieved: Although the mean users’ perception remained largely stable and below target, disaggregated results provide some indication of improved perception in relation to solid waste collection and road and street conditions. December 2015 was the last time a Citizen Report Card was completed.
Indicator 6 Direct Project beneficiaries of which 51.5% are female (Number) Value (quantitative or qualitative)
729,264 1,041,545 1,136,568
Date achieved 2-Sep-10 31-Dec-15 30-June-17
Comments (incl. % achievement)
Achieved (109% level of achievement): While this number reflects the number of residents benefiting from solid waste collection, most residents have also benefited from improvements in other improved municipal services, including road and transit, drainage, licensing, and the issuing of DUATs.
(b) Intermediate Indicators
Indicator Baseline Value
Original Target Values (from
approval documents)
Formally Revised Target
Values
Actual Value Achieved at
Completion or Target Years
Component A - Institutional DevelopmentIndicator 1 Average processing time (days) for construction licenses (Number) Value quantitative or qualitative) 75 30 45 45
Date achieved 15-Jan-14 31-Dec-15 31-Dec-15 30-June-17Comments (incl. % achievement)
Achieved (100% level of achievement of revised target). The target was revised to reflect changes in the procedures.
Indicator 2 Timely public dissemination of clearly presented of Citizen Report Card (CRC) results (Text)
Value quantitative or qualitative) Yes Yes Yes
Date achieved 2-Sep-10 31-Dec-15 31-Dec-15
Comments (incl. % achievement)
Achieved: A public opinion survey among Maputo residents (i.e., CRC) was conducted every year between 2012 and 2014. Results were widely disseminated in line with the CRC Dissemination Plan.
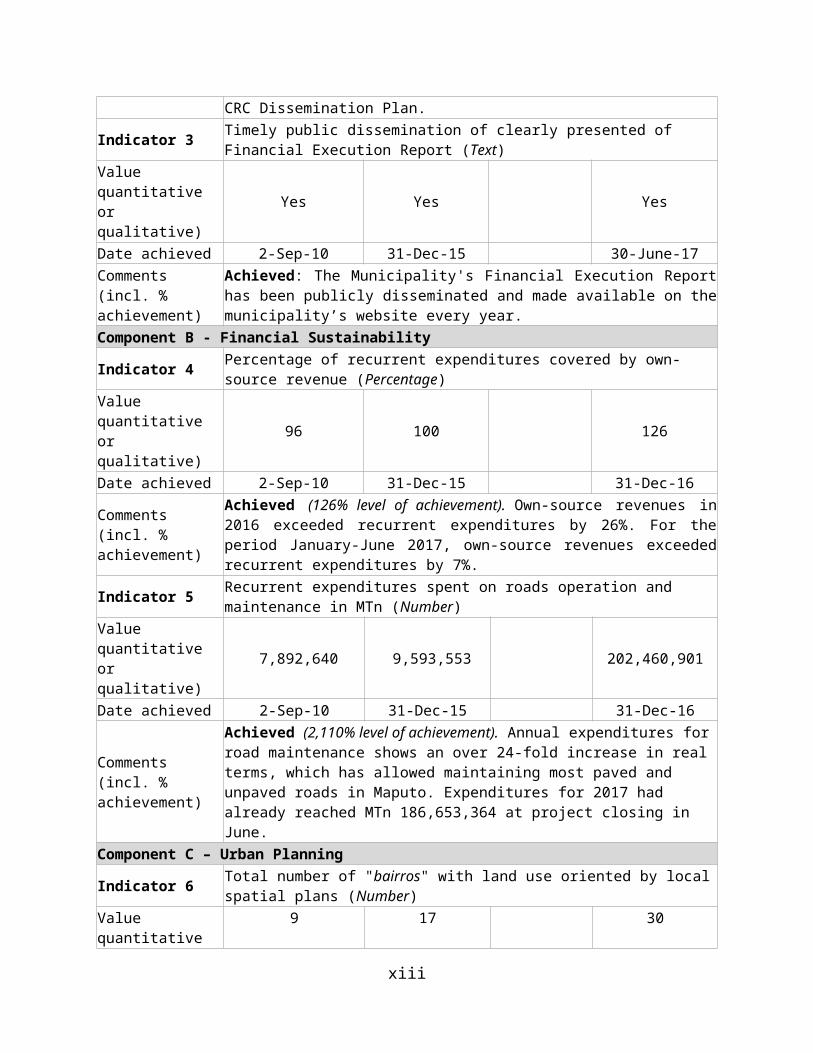
Indicator 3 Timely public dissemination of clearly presented of Financial Execution Report (Text)
Value quantitative or qualitative) Yes Yes Yes
Date achieved 2-Sep-10 31-Dec-15 30-June-17Comments (incl. % achievement)
Achieved: The Municipality's Financial Execution Report has been publicly disseminated and made available on the municipality’s website every year.
Component B - Financial SustainabilityIndicator 4 Percentage of recurrent expenditures covered by own-source revenue (Percentage) Value quantitative or qualitative) 96 100 126
Date achieved 2-Sep-10 31-Dec-15 31-Dec-16Comments (incl. % Achieved (126% level of achievement). Own-source revenues in 2016 exceeded
ix

achievement) recurrent expenditures by 26%. For the period January-June 2017, own-source revenues exceeded recurrent expenditures by 7%.
Indicator 5 Recurrent expenditures spent on roads operation and maintenance in MTn (Number)
Value quantitative or qualitative) 7,892,640 9,593,553 202,460,901
Date achieved 2-Sep-10 31-Dec-15 31-Dec-16
Comments (incl. % achievement)
Achieved (2,110% level of achievement). Annual expenditures for road maintenance shows an over 24-fold increase in real terms, which has allowed maintaining most paved and unpaved roads in Maputo. Expenditures for 2017 had already reached MTn 186,653,364 at project closing in June.
Component C – Urban PlanningIndicator 6 Total number of "bairros" with land use oriented by local spatial plans (Number) Value quantitative or qualitative) 9 17 30
Date achieved 2-Sep-10 31-Dec-15 30-June-17
Comments (incl. % achievement)
Achieved (117% level of achievement). 20 Spatial Development Plans have been prepared covering 30 “barrios”. The actual baseline was lower than the one reported in the PAD (i.e., nine versus 11 neighborhoods, respectively).
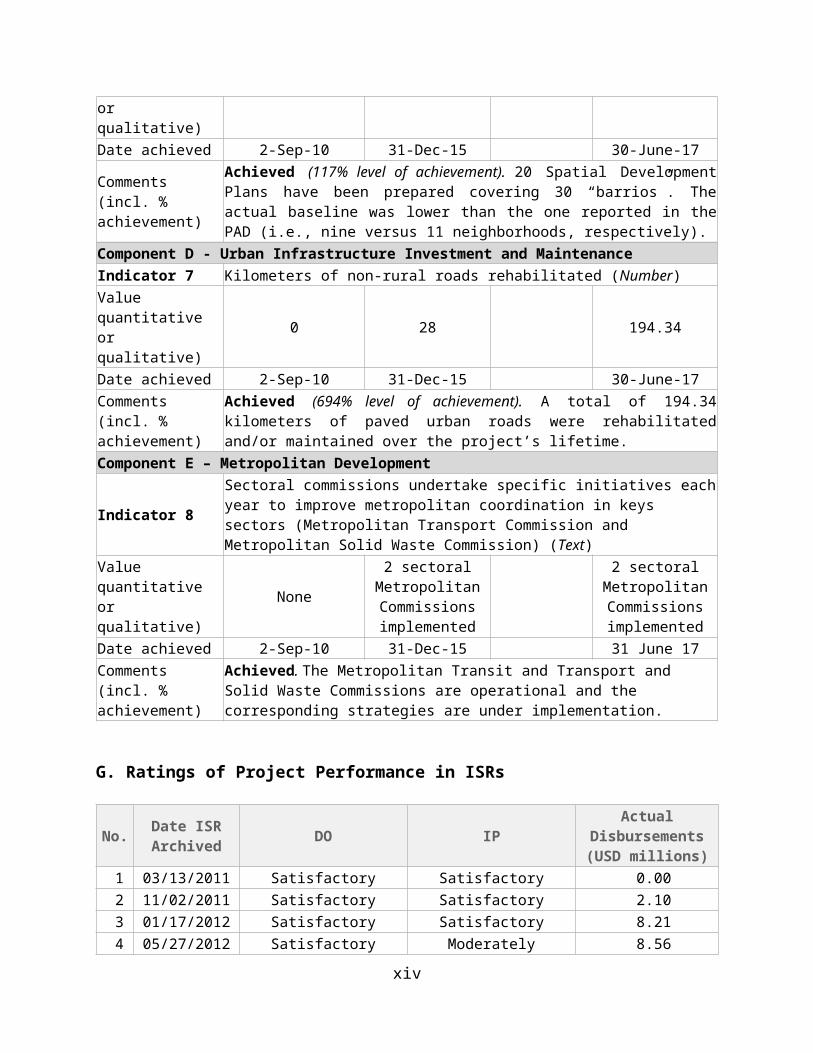
Component D - Urban Infrastructure Investment and MaintenanceIndicator 7 Kilometers of non-rural roads rehabilitated (Number) Value quantitative or qualitative) 0 28 194.34
Date achieved 2-Sep-10 31-Dec-15 30-June-17Comments (incl. % achievement)
Achieved (694% level of achievement). A total of 194.34 kilometers of paved urban roads were rehabilitated and/or maintained over the project’s lifetime.
Component E – Metropolitan Development
Indicator 8Sectoral commissions undertake specific initiatives each year to improve metropolitan coordination in keys sectors (Metropolitan Transport Commission and Metropolitan Solid Waste Commission) (Text)
Value quantitative or qualitative) None
2 sectoral Metropolitan Commissions implemented
2 sectoral Metropolitan Commissions implemented
Date achieved 2-Sep-10 31-Dec-15 31 June 17Comments (incl. % achievement)
Achieved. The Metropolitan Transit and Transport and Solid Waste Commissions are operational and the corresponding strategies are under implementation.
G. Ratings of Project Performance in ISRs
No. Date ISR Archived DO IP Actual Disbursements
(USD millions) 1 03/13/2011 Satisfactory Satisfactory 0.00 2 11/02/2011 Satisfactory Satisfactory 2.10 3 01/17/2012 Satisfactory Satisfactory 8.21 4 05/27/2012 Satisfactory Moderately Satisfactory 8.56
x

5 12/21/2012 Satisfactory Moderately Satisfactory 16.55 6 07/09/2013 Moderately Satisfactory Moderately Unsatisfactory 25.77 7 02/05/2014 Moderately Satisfactory Moderately Satisfactory 28.29 8 07/12/2014 Moderately Satisfactory Moderately Satisfactory 32.47 9 12/19/2014 Moderately Satisfactory Moderately Satisfactory 35.83
10 06/22/2015 Moderately Satisfactory Moderately Satisfactory 45.03 11 12/23/2015 Moderately Satisfactory Moderately Satisfactory 45.79 12 06/06/2016 Moderately Satisfactory Moderately Satisfactory 47.13 13 12/08/2016 Moderately Satisfactory Moderately Unsatisfactory 48.9014 05/17/2017 Satisfactory Satisfactory 48.90
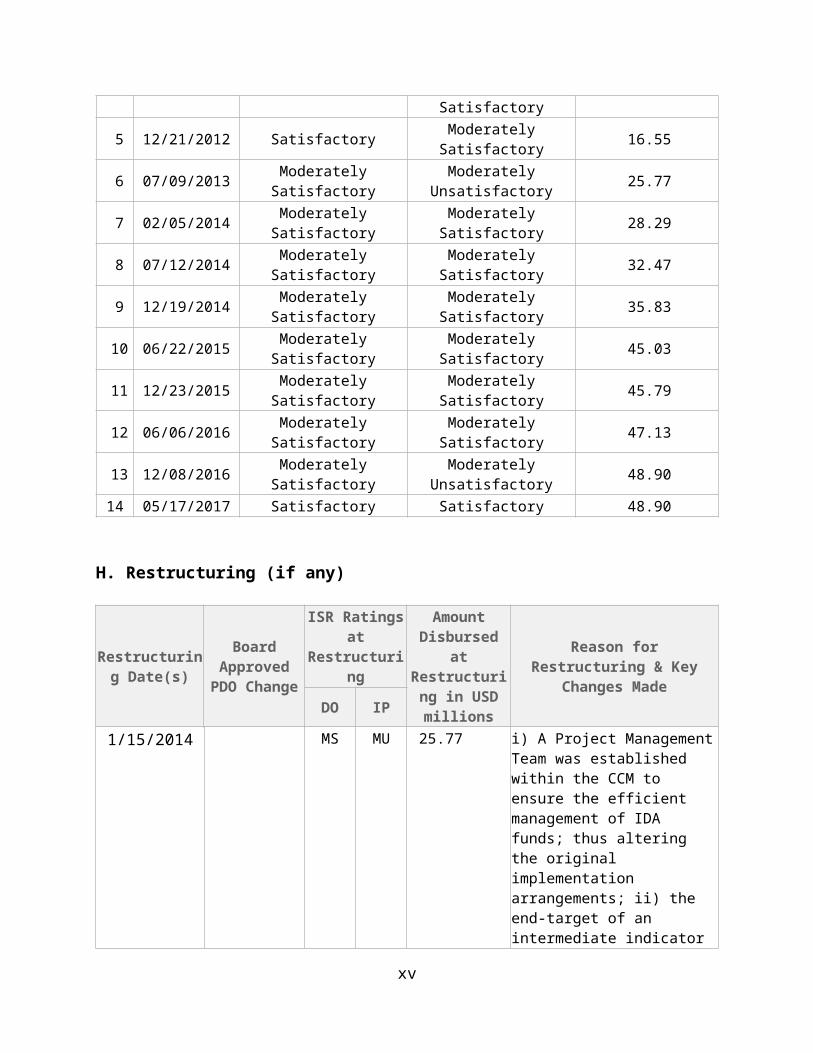
H. Restructuring (if any)
Restructuring Date(s)
Board Approved PDO
Change
ISR Ratings at Restructuring
Amount Disbursed at
Restructuring in USD millions
Reason for Restructuring & Key Changes MadeDO IP
1/15/2014 MS MU 25.77
i) A Project Management Team was established within the CCM to ensure the efficient management of IDA funds; thus altering the original implementation arrangements; ii) the end-target of an intermediate indicator was revised (i.e., average processing time for construction licenses increased from 30 to 45 days); iii) the increase of the Solid Waste Management (SWM) Fee was modified by combining two separate increases of 20 percent each by July 2013 and by December 2015 into one single fee adjustment of 40 percent by the end of 2014; and iv) Project proceeds were reallocated between disbursement categories.
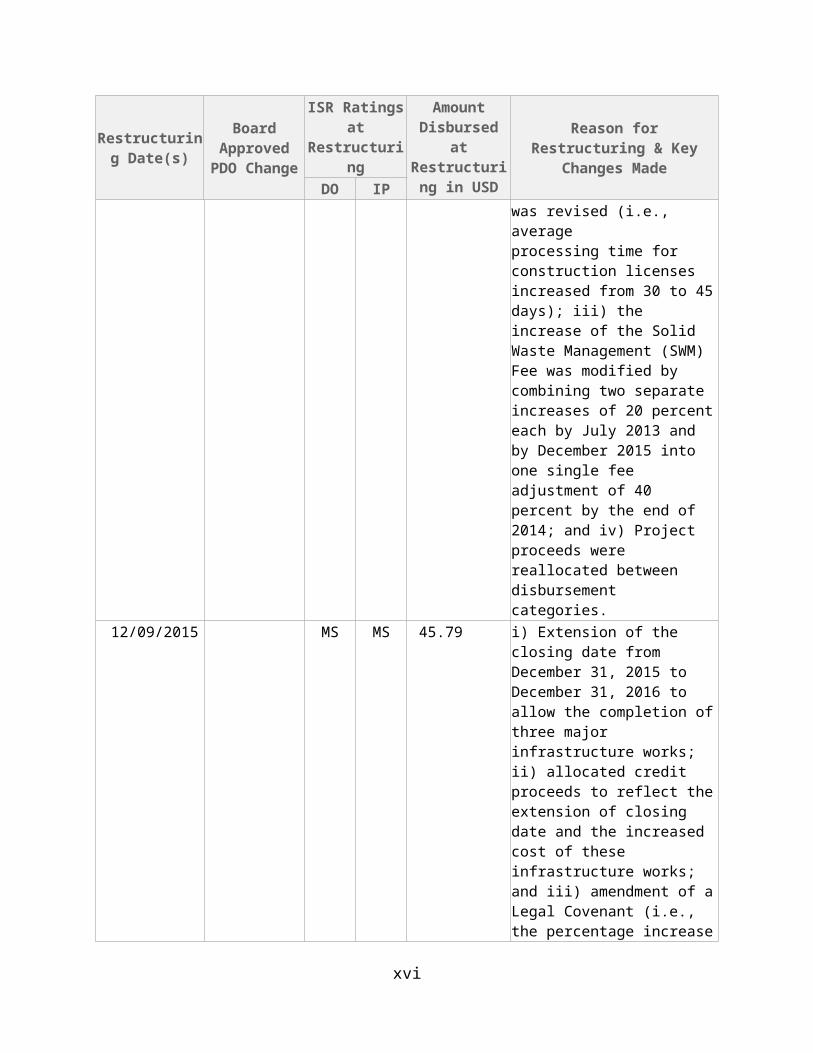
12/09/2015 MS MS 45.79 i) Extension of the closing date from December 31, 2015 to December 31, 2016 to allow the completion of three major infrastructure works; ii) allocated credit proceeds to reflect the extension of closing date and the increased cost of these infrastructure works; and iii) amendment of a Legal Covenant (i.e., the percentage increase in
xi

Restructuring Date(s)
Board Approved PDO
Change
ISR Ratings at Restructuring
Amount Disbursed at
Restructuring in USD millions
Reason for Restructuring & Key Changes MadeDO IP
SWM fee), which was achieved but in a different manner as originally envisioned.
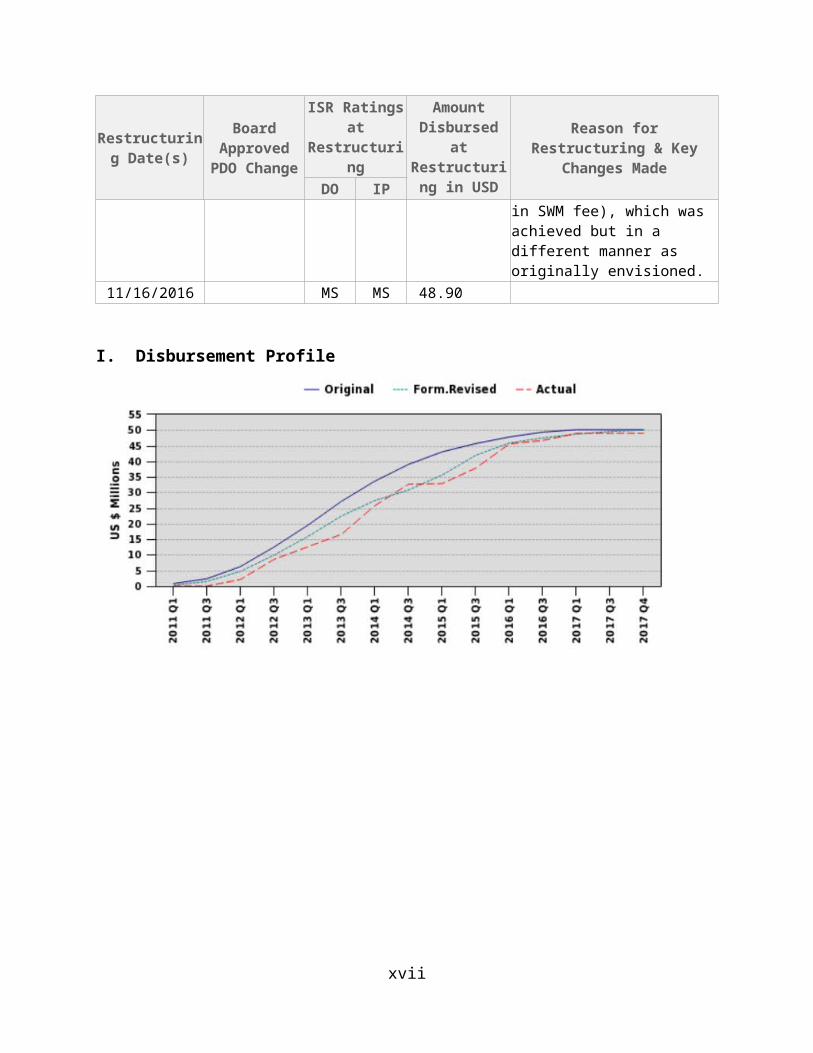
11/16/2016 MS MS 48.90
I. Disbursement Profile
xii
1. Project Context, Development Objectives and Design
1.1 Context at AppraisalMozambique, like most African countries, had been experiencing rapid urbanization which was being projected to continue. With over 30 percent of Mozambicans residing in urban areas in the mid-2000s and cities growing at about 3 percent a year, it was estimated that by 2030 the urban population would double to about 12 million people.
With 1.1 million residents in 2010, Maputo was Mozambique’s largest urban center. It was also the city of greatest economic importance, accounting for about 30 percent of the country’s gross domestic product. However, the city also faced enormous urban development challenges. In 2010, more than half (i.e., 54 percent) of its residents were living below the poverty line and 70 percent in informal settlements. Moreover, most residents lacked access to basic infrastructure services, including solid waste collection, drainage and adequately maintained unpaved and paved roads, respectively. The lack of physical infrastructure together with inefficient urban growth severely limited the city’s productivity, hindering its substantial potential to fuel economic growth for the entire country and to improve the lives of its residents, particularly the poor.
To successfully meet the mounting urban challenges, the City Council of Maputo (CCM) had to first achieve two critical preconditions. First, it was imperative to strengthen its institutional capacity. In 2005, only 7 percent of the CCM’s staff had technical training and only 1.5 percent had attended university. In addition, it lacked adequate management capacity as well as physical infrastructure. Moreover, municipal functions were still highly concentrated. Second, it was equally important to enhance the CCM’s fiscal capacity. In 2005, the total budget of the CCM amounted to US$6 per capita, below other urban areas in the region. On the revenue side, the CCM lacked an up-to-date property cadaster and other tools to assess and collect property taxes. As a result, only 5 percent of total properties in the city paid taxes each year. It also lacked the means to levy and collect other municipal taxes and fees. On the expenditure side, the CCM lacked the needed capacity to effective plan, execute, and control expenditures.
Maputo’s second elected mayor recognized the critical importance of overcoming these challenges and embarked on the development of an ambitious ten-year municipal development program—so-called “ProMaputo”. Its goal was to raise the quality of life of municipal residents and to create an environment conducive for investment and job creation. It would do this through improved delivery of services, the mobilization of citizens and coordinated action between diverse actors. ProMaputo, in turn, served as the basis for the Bank-financed Maputo Municipal Development Program (MMDP), an Adjustable Program Loan (APL) to be implemented in two phases. The first one corresponded to the First Maputo Municipal Development Program (MMDP I or ProMaputo I; P096332) that was approved by the Board on January 25, 2007 for a total of US$30 million and was closed on August 31, 2011. The MMDP I was evaluated under a separate Implementation Completion and Results Report (ICR) in February 2012. The second phase was supported under this operation—the Second Maputo Municipal Development Program – MMDP II or ProMaputo II).
In line with what had been envisaged, MMDP I had set in motion broad and deep institutional and financial reforms that were considered the foundation for sustainable municipal decentralized governance and service provision in urban areas. Once the
1
triggers pre-identified under MMDP I were substantially met1, the MMDP II was prepared to support the natural continuation of the reforms implemented under MMDP I under the overall umbrella of ProMaputo.
1.2 Original Project Development Objectives (PDO) and Key Indicators (as approved)The long-term objective of the APL was to strengthen the capacity of the CCM to finance, manage and maintain urban services and infrastructure. The specific PDO of MMDP II was to improve the delivery and sustainability of priority municipal services in Maputo Municipality.
The key PDO indicators were: (i) percent of cumulative annual real increase in revenue from property tax (IPRA) collections; (ii) annual coverage by priority municipal services (solid waste, land tenure, and access to all-seasons roads); (iii) mean user perception of quality of public services; and (iv) number of direct project beneficiaries, of which 51.5 percent are female.
1.3 Revised PDO (as approved by original approving authority) and Key Indicators, and reasons/justificationThe PDO and Key Indicators remained unchanged.
1.4 Main Beneficiaries The primary target beneficiaries were the inhabitants of Maputo city and its suburbs (estimated to be about 1.1 million people in 2010) that were expected to gain from improved urban services and infrastructure. Inhabitants of poor neighborhoods were expected to benefit relatively more from improved solid waste collection and access to roads. CCM staff was expected to benefit from expanded opportunities to upgrade their skills, better working conditions, and improved relations with the public. Finally, businesses were expected to benefit from an improved investment climate resulting from enhanced urban infrastructure and services.
1.5 Original ComponentsComponent A: Institutional Development (US$8.2 million, equivalent to 19.5 percent of the credit amount):2 It sought to strengthen municipal capacity to deliver services in response to citizen demand. Specifically, this component addressed two sorts of constraints: (a) limited technical and administrative capacity to carry out municipal functions; and (b) governance constraints that limited responsiveness and accountability by the municipality.
Component B: Financial Sustainability (US$3.8 million, equivalent to 9 percent of the credit amount): It sought to ensure the CCM’s financial sustainability by raising revenues and rationalizing expenditures with the support of an integrated financial management system.
1 Only one of the five triggers was not met, which corresponded to the development and implementation of an Integrated Financial Management System (SIGEF). Three triggers were fully met (i.e., percentage nominal increase in own-source revenues; amount of solid waste deposited in the waste dump; and additional km of unpaved roads in good condition per year. The remaining one was not fully met but exhibited significant progress (i.e., percentage of organizational units with the new staffing table defined and existing personnel redeployed). 2 The percentage was calculated in relation to the US$42 million that were allocated to the various components. The remaining US$8 million remained unallocated.
2
Component C: Urban Planning (US$11.9 million, equivalent to 28.3 percent of the credit amount): It sought to ensure the equitable and sustainable management of municipal land, mostly through improvements in land administration procedures, the establishment of a Geographic Information System (SIGEM) and limited neighborhood improvements.
Component D: Urban Infrastructure Investment and Maintenance (US$11.7 million, equivalent to 28 percent of the credit amount): It sought to ensure the construction and maintenance of key municipal road and drainage infrastructure.
Component E: Metropolitan Development (US$6.4 million, equivalent to 15.2 percent of the credit amount): It sought to introduce a metropolitan approach for the improvement of selected municipal services (i.e., urban transport and solid waste management).
1.6 Revised ComponentsN.A.
1.7 Other significant changesLevel-2 restructuring (January 15, 2014): This restructuring, which followed the 2013 MTR, introduced the following modifications: i) the original project implementation arrangement, which was fully mainstreamed into the municipal structures, was altered by shifting responsibility for FM and procurement functions to OSID (the CCM Office for Strategic and Institutional Development responsible for overall Project coordination) to ensure the efficient management of IDA funds; ii) the end-target of an intermediate indicator was revised (i.e., average processing time for construction licenses was increased from 30 to 45 days); iii) the increase of the solid waste management (SWM) fee was modified by combining two separate increases of 20 percent each by July 2013 and by December 2015 into one single fee adjustment of 40 percent by the end of 2014; and iv) the reallocation of credit proceeds between disbursement categories.
Level-2 restructuring (December 9, 2015): It introduced the following changes: i) extension of the Project closing date by 12 months from December 31, 2015 to December 31, 2016 to enable the completion of physical works under Components C and; the allocation of unallocated proceeds to reflect the extension of closing date and the increased cost of these infrastructure works; and iii) amend a Legal Covenant (the percentage increase in SWM fee), which was implemented in a manner that is slightly different from that in the previously amended credit agreement (see Section 2.2).
Level-2 restructuring (November 16, 2016): It extended the revised closing date by an additional six additional months, from December 31, 2016 to June 30, 2017 to address newly identified drainage problems in two major infrastructure works (i.e., the rehabilitation of Ave. Julius Nyerere and the informal settlement in Chamanculo C).
2. Key Factors Affecting Implementation and Outcomes
2.1 Project Preparation, Design and Quality at EntryBeing the natural continuation of its predecessor and the second phase of the APL, the Project design shares the strengths and some weaknesses of the MMDP I. The main strengths included:
3
Insertion within a medium-term, strategic vision – The ProMaputo vision and strategy provided a medium-term strategic framework for the reforms supported under the MMDP I and II. It also provided continuity despite changes in political leadership while, at the same time, offering enough flexibility to accommodate evolving political priorities.3
Project design grounded on strong evidence base – The design of the MMDP operations reflected the findings of a series of studies on CCM performance in critical areas (e.g., human resources, revenues and revenue potential, public private partnerships, CT infrastructure, and governance). In addition, solid waste collection and road maintenance were selected as primary targets for reform and service improvement based on the Citizens Report Card and consultations with stakeholders.
Right sequencing and mix of reforms – While the scope of the reform program supported under the two MMDP operations was rather ambitious, the areas of reform followed a logical sequencing that made them more manageable. MMDP I had a stronger focus on institutional and financial reform and capacity building, which were conceived as preconditions for the CCM’s ability to provide key municipal services in a sustainable manner. It also took the first steps toward improving service provision, solid waste collection in particular, to attain some tangible results to ensure sustained commitment. Building upon this foundation, MMDP II focused on the consolidation of institutional and financial reforms and the scaling up of service provision.
Correct identification of critical urban issues – In addition to focusing on ensuring the CCM’s institutional and financial sustainability of the municipality as prerequisites for viable service provision, the MMDP design correctly addressed two additional critical issues: i) the importance of addressing increasing demand for urban services, land regularization and the rehabilitation of informal settlements in peri-urban areas where most of the poor live; and ii) the importance to move towards the formation of the metropolitan area of greater Maputo for certain services and to provide the basic tools to begin planning and subsequently manage these services at the metropolitan level.
Strong support from municipal authorities and staff – The preparation and design of the MMDP I benefited from the personal commitment to the city of Maputo’s dynamic second elected mayor. Likewise, the preparation of the MMDP II benefited from the support of its successor, who was elected in May 2008 and based its government action plan on the ProMaputo strategy and the MMDP II in particular. The preparation of ProMaputo II also benefited from the strong working relation that the CCM and the Bank teams had forged during the implementation of the MMDP I.
Overall readiness – As its predecessor, the ProMaputo II constituted a clear road map for reform, with clear outputs and outcomes. The legal covenants were appropriate, helping ensure that key actions were implemented. A robust Project Result Framework (PRF) and M&E system were also in place.
Adequate choice of lending instrument – The APL format adequately supported the programmatic nature of the ProMaputo operations and provided the medium-term timeframe that was required for the MMDP to succeed.
There were, however, also weaknesses in the Project design, including:
3 The Pro-Maputo visioning exercise and the preparation of the MMDP I was done under the leadership of the previous mayor. The current mayor was first elected in 2008 and reelected to a second term in 2013.
4
Deficient technical design of the rehabilitation of Ave. Julius Nyerere – The engineering design of this road rehabilitation was prepared in the early 2000s, but the area was not sealed and continue to grow informally. Although the road design contemplated drainage interventions (mainly passages under the avenue), it did not include an in-depth analysis of the drainage basin, which later during the execution of the works became a serious issue. There was also scant attention to the social and economic impacts to the highly populated informal areas along the avenue, such as concerns about safety and gentrification. Given the fast urban growth of this area, the well-known problems with erosion and flooding, and the magnitude of the intervention, it is now clear that this road design should have been updated during project preparation and incorporated a more integrated approach to urban development.
Incomplete view of the solid waste service provision cycle – Component E of the Project focused primarily on solid waste collection, without adequate consideration to the whole SMW delivery chain, particularly disposal. Solid waste collection activities within the Project were conceived under the premise that a new sanitary landfill outside the Maputo municipality would be built by 2015 to allow the closure of the existing dumpsite in Maputo, which was already at its maximum capacity. However, this did not take place as conceived, showing that the risks that the construction of an alternative landfill be delayed were underestimated.
Overestimation of Municipal Institutional Capacity – In the original design, overall project implementation capacity (overall coordination, FM and procurement functions) were to be provided within the CCM’s own structure. However, in-house capacity proved to be insufficient in view of the large number of transactions, resulting in implementation delays during the first half of the Project’s lifetime, as reflected by the Project’s rating of Moderately Unsatisfactory by mid-2013. This weakness was fully addressed during the 2014 MTR and subsequent restructuring, partially modifying the original CCM own-systems implementation model by assigning these functions to the OSID.
2.2 ImplementationModifications to the original SWM fee – To improve financial sustainability of solid waste collection services, the MMDP II provided declining financing for the contracted services, with the remaining financing gap to be increasingly filled by anticipated increases in the SWM fee. As originally envisioned, there were two 20-percent increases to be put in place by July 2013 and by December 2015, respectively. After careful analysis of sustainability and willingness to pay, the CCM concluded that it could achieved the same adjustment by combining: i) a single 30 percent increase of the SWM fee; ii) a 10 percent reduction (i.e., from 15 to 5 percent) of the commission being charged by Mozambique’s Electric Company (Electricidade de Mocambique) for collecting of the SWM fee under the electricity bill; and iii) additional revenue from the increased number of commercial payers for SWM services. All these three measures were implemented in early 2015, resulting in the achievement of the sustainability target of 40 percent revenue increase.
Delays in the construction of the Maputo-Matola Landfill – The Project did not include any intervention to improve the existing landfill in Maputo as the Project was conceived under the premise that a new sanitary landfill would be built in the Municipality of Matola to cater for the needs from the Greater Maputo Area, and to allow the closure of Maputo’s solid waste dump, which was already close to its maximum capacity. While
5
financing has been secured from the Korean Export-Import Bank for the new landfill; its actual construction has not started, as there are still significant issues to be addressed, such as the resettlement of residents located on the site. The lack of an alternative landfill and the continuous generation of solid waste have increased the environmental risks, such as soil and air contamination, as well as health and safety risks of those who pick trash at the site.
Lack of completion of the Integrated Financial Management System (SIGEF). The development and implementation of SIGEF had been pending since the MMDP I. In April 2012, the Government of Mozambique (GoM) and the World Bank agreed that the new system would be financed through another World Bank supported program (Cities and Climate Change Project) implemented by the Ministry of State Administration and Public Function (MAEFP). The Bank accepted this proposal given that the Cities and Climate Change Project would cover 20 municipalities, resulting in economies of scale and greater impact. However, after significant delays in the conceptualization of the system (which was expanded from only a FM module to an overall municipal management system), and failure from a national ICT agency (CEDSIF) under the Ministry of Economy and Finance to put together a technical team, the Bank and the MAEFP decided to cancel this activity under the Cities and Climate Change Project. While the development and implementation of did not materialized, CCM developed a municipal revenue module under their own informational management system (SIGEM).
Execution problems, cost and time overruns in the rehabilitation of the Avenue Julius Nyerere.4 Problems during the execution of works forced the Municipality to suspend the contract with the construction consortium. Problems with the quality of the pavement appeared after the first heavy rains when large holes opened in the new pavement. The CCM requested tests in two different labs that demonstrated that the materials used for the works was of inferior quality. At the same time, financial problems with the original construction consortium led to complete stop of the works. Eventually, the CMM decided to terminate the original contract, pursue reparations, and open a new bidding for concluding the works. After extended negotiations, the original construction consortium agreed to refund the municipality to compensate for these execution problems. A new bidding was launched after the works design was revised (including the incorporation of additional drainage works), and supervision of work execution enhanced. The final cost for rehabilitating the Ave. Julius Nyerere was US$8 million more than originally estimated (equivalent to 68 percent of the anticipated cost) and required extending the Project’s closing date twice (for a total of 18 months).
Additional credit funds because of the devaluation of the local currency in 2016 – Due to the sharp devaluation of the Metical in relation to SDR and USD, the Project 'gained' a total of approximately USD 2 million as several contracts were signed in the national currency. These additional funds were utilized largely to finance infrastructure works that complemented the rehabilitation of the Av. Julius Nyerere, including the rehabilitation of a local market (i.e., Mercado Mucoreano).
2.3 Monitoring and Evaluation (M&E) Design, Implementation and Utilization
4 Although of much smaller magnitude, here were also drainage issues in the context of the rehabilitation of the access road into Chamanculo C neighborhood.
6
Design. The Project’s design benefitted from a solid PRF with clearly defined Key Outcome Indicators (KOI) that captured the various dimensions of the PDO. The PRF went beyond those indicators included in the PAD to include an extensive set of additional intermediate outcomes for each of the individual components. There were two exceptions in an otherwise remarkably strong PRF. One of them was the indicator focusing on residents’ overall perceptions regarding city services as reported in the Citizen Report Card (CRC), as it failed to specifically isolate changes in perceptions associated with service improvements supported under the Project. Another one was to omit the inclusion of the rate of cost recovery for solid waste collection within the PRF, which could have brought more visibility to it.
Several factors contributed to the robustness of the M&E system. First, it built upon the M&E system developed under ProMaputo I and, in the case of new indicators, operational definitions were defined jointly by the Bank team and each of the CCM units during preparation. There was also a remarkable ownership on the part of municipal authorities, as it reflected the ProMaputo municipal program and the government agenda of the two municipal administrations under which it was implemented.
As its predecessor, evaluation activities were also envisioned under the Project, which provided financial support for the continuous implementation of the CRC. The CRC surveys had been conducted annually since 2006 to assess the perceptions of Maputo residents with regards to the quality and the relative priorities assigned to ten municipal services. 5 As mentioned earlier, one of the KOIs was the aggregated level of satisfaction for all municipal services, the majority of which were not included under the Project.
Implementation. The M&E system was one of the factors contributing to the Project’s successful implementation, as it helped maintain focus and momentum across the various areas of intervention. The M&E indicators were utilized to track progress in the implementation of the ProMaputo program, which was financed by the Project, and the various municipal planning instruments. M&E indicators were integrated with other systems of administration. Collection of monitoring data was done within the CMM itself, with line managers of each directorate being responsible for collecting data in his/her area and providing them to OSID, which was responsible for overall Project coordination and monitoring. Independent consultants were responsible for evaluation instruments, including the CRC.
As part of CRC, randomly selected Maputo residents of the seven municipal districts were interviewed in an annual basis to capture their perceptions with respect to the quality of municipal services and their respective priorities. While sample sizes were large (e.g., 2,671 respondents under the 2012 CRC and 2,875 under the 2015 CRC), they seemed to have disproportionally captured the views of women (over 60 percent in both samples), students and the unemployed, as they may have been more readily available to be interviewed. If this was indeed a bias, it was constant across the various CRCs and, consequently, it is not likely to have a significant effect in annual variations in reported perceptions. Conversely, other external factors (i.e., highly publicized crimes, election
5 The services included under the CRC were the following ones: i) neighborhood safety; ii) garbage collection; iii) service provision at health centers; iv) supply and quality of drinking water; v) road surface conditions; vi) neighborhood cleaning; vii) public transport; viii) school vacancies; ix) electricity supply; and x) drainage.
7
campaigns, extreme weather, etc.) can be expected to unduly affect residents’ perceptions.6
Utilization: The CCM and Bank teams utilized the information from the M&E system to flag implementation challenges. In addition, the CCM used the M&E system to report to the mayor, the municipality’s consultative council, the municipal assembly and other stakeholders. The high visibility of the M&E system helped motivate CCM staff to both provide the necessary data and contribute to Project implementation.
CRC findings were disseminated in local newspapers and played an important role in identifying weaknesses in service provision and to determine investment priorities within the municipalities. In addition, municipal authorities held public forums to discuss CRC findings with city officials, which proved instrumental in strengthening the CCM’s accountability in relation to its residents.
2.4 Safeguard and Fiduciary ComplianceSafeguards: The Project was classified as Category B, and triggered four safeguard policies: Environment Assessment (OP 4.01); Involuntary Resettlement (OP 4.12); Natural Habitats (OP 4.04); and Physical Cultural Resources (OP 4.11), with the last two being triggered on a precautionary basis. The Project had no major compliance issues regarding environmental safeguards. The CCM prepared Environmental Impact Assessments (EIAs) and Environmental Management Plans (EMPs). Construction works were conducted in accordance with the EMPs and adequate staff and capacity was in place at CCM throughout project implementation. Compliance on social safeguards was uneven across individual activities. The implementation of the Resettlement Action Plans (RAPs) for the neighborhood upgrading interventions was satisfactory, with some notable good practices in George Dimitrov. However, the implementation of the RAP for the rehabilitation of Julius Nyerere Avenue faced some issues. Many informal vendors who used to occupy parts of the Ave. Julius Nyerere before its rehabilitation (when there was no through-traffic) refused to relocate from the street to the area provided in an existing market in the vicinity (Mercado Mucoreano). This challenge was overcome by using project funds to rehabilitate this market and improve its accessibility to make it more attractive for vendors and consumers. Another issue arose with the inclusion of emergency drainage works along Ravine 3 of Ave. Julius Nyerere that were identified as necessary during implementation to safeguard both the road investment and people living in its vicinity from erosion and flood risk. While the first part of these works did not have any impact on residents, the second part would have required the resettlement of some families living in an informal settlement along the drainage canal. The Bank did not approve the RAP presented by the CMM for these works as the proposed resettlement sites were deemed inadequate.7 As there was not enough time to find a more suitable location and execute the proposed works before project closing, it was decided that the works would be financed under Component 2 of the Cities and Climate Change Project (P123201), which is implemented by AIAS. As such, it was agreed that the necessary resettlement would be carried out by AIAS in coordination with the CMM based on a RAP acceptable to the Bank. However, before the new RAP could be prepared, the CMM
6 See, for example, UNICEF Citizen Report Card Manual: A social audit tool to monitor the progress of Vietnam’s socio-economic development plan, 2011. 7 The sites were far away from their original place of residence, in an area prone to flooding, and without access to basic infrastructure.
8
informed the Bank that the affected families had left the area in March 2017 upon payment of financial compensations by a private developer interested in the area. The Bank requested AIAS to undertake an audit to verify the compensation values and process followed, and to determine whether any additional or corrective actions would be needed to align the outcome of the process with Bank safeguards policies. The audit was not yet finalized when the ICR was prepared.
Financial management: FM performance exhibited weaknesses during the first half of project implementation. There were recurrent problems, such as slow disbursements, errors in the financial reports, excess payments in some disbursement categories, and delays in the submission of the audit reports and the respective management letters. To address these weaknesses and, as part of the changes in the Project’s implementation arrangements that were introduced under the MTR, a dedicated Financial Management Specialist was incorporated into the OSID for the overall coordination of FM aspects within the Project. FM performance improved significantly during the remainder of the Project’s lifetime, with IFRs being submitted timely and satisfactorily.
Procurement: Lack of adequate procurement capacity on the part of the CCM and the high volume of transactions resulted in an implementation bottleneck in early stages of the Project, creating substantial implementation delays during the first half of the Project’s lifetime. This challenge was overcome once a dedicated procurement analyst came on board a after the 2014 MTR. Thereafter there was notable improvement in performance and no major procurement problems were detected. In addition, the Project procurement team provided technical assistance and capacity building to the CCM’s procurement team, contributing to enhancing the CCM’s procurement capacity.
Legal covenants: Although in some cases with delays, the legal covenants were met. The only exception was the one referring to the increase in the SWM fee, which required two amendments to the Financial Agreement as it was implemented slightly differently than anticipated.
2.5 Post-completion Operation/Next PhaseWhile there were implementation challenges in the areas of FM and procurement, particularly before the creation of a PIU, the Project has helped strengthen the institutional capacity of CCM to effectively fulfill their responsibilities, including municipal finance management, urban planning and land management, as well as service delivery.
3. Assessment of Outcomes
3.1 Relevance of Objectives, Design and ImplementationRelevance of objectives: HighThe development objective of improving the delivery and sustainability of priority municipal services in Maputo Municipality was and continues to be highly relevant. As Mozambique’s largest city, Maputo has great potential for both economic growth and poverty reduction through improved urban living conditions and increases in productivity. Strengthening the capacity of the CCM as well as urban services and infrastructure are necessary preconditions to unleash the city’s ability to serve as the engine of economic growth for the country and enhance the productivity and living conditions of its residents.
9
The PDO is fully consistent with the Decentralization Policies and Legal Framework, which aim at devolving political, fiscal and administrative competencies to municipalities. It is also closely aligned with two of the five priorities of the Government’s Five Year Plan 2015-2019, namely, to promote employment and improve productivity and competitiveness and the development of economic and social infrastructure. It is also consistent with one of its three supporting pillars, namely, to consolidate the democratic rule of law, good governance, and decentralization. The PDO is also consistent with the country’s current Poverty Reduction Strategy, which focuses on employment creation by improving the business environment. Likewise, it is fully aligned with the Strategy for the Improvement of Business Environment 2013-2017, which, among other improvements, calls for a reduction in the processing times of business licenses.
The PDO is fully consistent with the Bank’s twin goals of ending extreme poverty and promoting shared prosperity. It also supports the Bank’s strategic priorities in Mozambique, as reflected in the Country Partnership Framework (CPF) 2017-2021 (Report No. 104733-MZ). It directly supports two of the three CPF focus areas, including: i) promoting diversified growth and enhanced productivity and the associated CPF goal of improving the business environment for job creation; and ii) enhancing sustainability and resilience and the corresponding CPF goals of increasing accountability and transparency of government institutions and promoting inclusive urbanization and decentralization.
Relevance of design: HighWhile there were some project-specific shortcomings, the operation’s overall design was and remains highly relevant and appropriate to support the substantial institutional reforms and capacity building required to enable the CCM to effectively deliver urban services and infrastructure. The design of the APL program was based on extensive consultations with stakeholders and on analytical work covering all aspects of the CCM’s functions and institutional organization. Consultations also served to identify priority services for the population (i.e., roads and solid waste collection). The statement of development objectives was clear. The PRF provided a logical link between the activities financed by the Project and the outputs and outcomes related to the attainment of the development objectives.
3.2 Achievement of Project Development ObjectivesRating: SubstantialThe PDO of improving the delivery and sustainability of priority municipal services in Maputo Municipality was achieved. There were substantial results in terms of enhancing municipal institutional and financial capacity, which, in turn, resulted in significant improvements in the delivery and sustainability of priority municipal services, roads and solid waste collection in particular. Overall, it is estimated that the Project has benefited nearly 1,137,000 residents, amply surpassing the original target for KOI 6 on direct project beneficiaries (i.e., 1,041,545). It is estimated that 51.5 percent of the Project beneficiaries are female. While these residents benefited from solid waste collection, most residents also benefited from improvements in other municipal services, including road and transit, drainage, licensing and the issuing of DUATs. Only one of the six main outcome indicators was not achieved, namely “Mean User Perception of Quality Public
10

Services”. However, as explained below, this indicator was not well formulated to capture improvements in urban services financed under the Project.
In terms of intermediate outcomes, the level of achievement was in line or above the anticipated targets. The main results are summarized below (for a detailed description of the Project’s inputs, intermediate outputs and main results, see Annex 2).
Strengthened municipal capacity for service delivery in response to citizen demand - Achieved Enhanced municipal capacity for service delivery is denoted in many ways, including
substantial increase in number of people who benefited from improved roads and from collection of solid waste, significant increase of households with secure tenure (Rights of Use and Access to Land certificates - DUATs). Improvements in institutional capacity was also notable through greater efficiency in many licensing, including: business license for microenterprises from 3 to 1 day; first-time mini-bus transport license from 4 weeks to 1 week; renewal of mini-bus transport licenses from 7 days to 48 hours; truck operation license from 1 week to 1 day; reduction in average processing times for issuing a DUAT from 150 to 45. The average processing time for construction licenses decreased from 75 to 45 days. This was the result of the adoption of strategic planning and management systems, improved management of human resources, capacity building activities, recruiting and remuneration practices and the provision of adequate physical infrastructure and equipment.
The Municipality's Financial Execution Report was publicly disseminated and made available on the website every year.
KOI 4 - Mean User Perception of Quality Public Services: Not Achieved. The objective improvements in the provision of priority services attained under MMDP II did not translate into higher perception of residents regarding the quality of municipal services as reported by residents under the Report Card, which has remained largely unchanged. This is not completely surprising, as residents’ perceptions are arguably not fully effective measures of service delivery, as they tend to be affected by exogenous factors (e.g., macroeconomic issues and national policy). Moreover, this KPI measured respondents’ satisfaction with overall municipal performance. However, when focusing solely on the two services that were the main focus of the Project, there are some indications suggesting that residents’ perceptions have improved. Specifically, the percentage of residents who expressed being unsatisfied with the conditions of the city’s roads and streets decreased from 43 to 35 percent in the 2011 and 2015 Report Cards. Likewise, the relative importance given to solid waste collection as a priority area for improved municipal performance decreased from 2nd to 4th place among CRC respondents between 2011 and 2015.
Enhanced financial sustainability of the CCM – Achieved. KOI 1 - Cumulative annual real increase in revenue from IPRA (Percentage): Achieved
(98 percent level of achievement): CPI-adjusted annual IPRA collection increased by 281 percent between 2010 and 2016. This increase was the result of an enhanced IPRA tax-base through: i) the reassessment of property values based on new IPRA legislation; and ii) the incorporation of an additional 20,000 properties into the fiscal cadaster. For financial year 2017, the IPRA collection had already reached 236% by June 30, 2017 (six months of tax collection in the fiscal year), indicating that the CCM is on track to achieving the targeted real increases in IPRA until December 2017.
11

The municipality maintained a solid fiscal balance overall. The ratio between current expenditures and own-source revenue increased from 96 percent for financial year 2010 to 126 percent for financial year 2016, amply exceeding the target of 100 percent. For the period from January to June 2017, the ratio stood at 107 percent.
Additional municipal revenues were consistently directed to service provision, as reflected in the increase in the municipal budget allocated to road maintenance, which increased over 24-fold in real terms between financial years 2010 and 2016.
More equitable and sustainable management of municipal land - Achieved KOI 3 - Households with secure land tenure formalized with DUAT: Achieved (107
percent level of achievement). This increase was the result of the implementation of a massive systematic land-tenure regularization campaign that resulted in the issuing of 33,057 DUATs, exceeding the original target (i.e., 30,800 DUATs). From a poverty perspective, it is important to emphasize that the primary focus were areas of expansion that are typically poorer and less regularized than consolidated areas of the city.
Expanded coverage of local urban plans, with 30 “bairros” (neighborhoods) being covered by 20 Spatial Development Plans prepared under the project (exceeding the target of 17 “bairros”).
Two informal settlements (Chamanculo C and George Dimitrov) were improved following an integrated methodology for neighborhood upgrading developed under the project.
Improved construction and maintenance of municipal infrastructure - Achieved KOI 4 - Number of people in urban areas provided with access to all-season roads
within a 500-meter range under the Project: Achieved (323 percent level of achievement). It is estimated that around 968,963 residents now have access to all-season roads, largely exceeding the original target of 60,000 residents per year.8 This was the result of extensive road rehabilitation and maintenance, with a total of 194.34 km of paved urban roads and over 519 of unpaved roads rehabilitated and/or maintained over the project’s lifetime, amply exceeding the original targets (i.e., 28 and 80 km over the project’s lifetime, respectively). This included the rehabilitation of key access and main arteries, including the Ave. Julius Nyerere, secondary paved roads as well as peri-urban unpaved roads.9
Metropolitan approach for the improvement of solid waste collection introduced - Achieved KOI 2 - Number of people in urban areas provided with access to regular solid waste
collection under the Project: Achieved (109 percent level of achievement). Solid waste collection reached 100 percent coverage in the contiguous districts of Maputo. This represents a drastic increase in service coverage, from 25 percent before the start of
8 As per the PAD, this indicator was to measure the number of people benefitting annually from improved maintenance of secondary peri-urban unpaved roads where access was frequently compromised due to damages induced during the rainy season, with a yearly target of 60,000 people (equivalent to 16km of roads rehabilitated each year) or 300,000 over the project’s lifetime. Over the project’s lifetime, the CMM expanded their annual road rehabilitation and maintenance program from benefiting an estimated 205,875 people in 2012 to ensuring access to all-season roads for 968,963 residents in 2016, going well beyond what was anticipated during appraisal. 9 The extensive road rehabilitation and maintenance went well beyond what originally anticipated under the Project because of the high priority that was assigned to it by both municipal and national authorities. Specifically, municipal current expenditures for road maintenance increased over 24-fold during the project’s lifetime. Likewise, the national government contributed an additional US$2 million than originally anticipated—equivalent to a 13.7 percent increase in funding.
12
MMDP I), to roughly 66 percent at the beginning of MMDP II to 100 percent at the end of 2016.10
The number of Maputo residents with access to solid waste collection increased by 56 percent between 2010 and 2016 (from 730,000 to 1,136,568 residents), amply surpassing the original target (i.e., 1,041,545 residents).
The SWM fee was increase to contribute toward sustainable cost recovery of solid waste collection services.
3.3 EfficiencyRating: SubstantialEfficiency of the project is considered substantial. Economic evaluations were conducted for key interventions under all components, except Component A (Institutional Development)11, selected based on their representativeness and available information. The interventions evaluated represent 64% of the overall investment cost. The evaluation conducted for the ICR followed the same approach as at appraisal but also expanded the scope by examining the economic efficiency of the upgrading investments in George Dimitrov and Chamanculo C neighborhoods which had not yet been defined at appraisal. The evaluation was based on actual achievements and actual costs, compared with those expected at the time of appraisal. The costs in nominal prices were transformed to 2010 prices to eliminate currency fluctuation and make them comparable to those foreseen at appraisal.
Cost-benefit analyses (CBA) were conducted for the integrated neighborhood improvements under Component C and the road rehabilitation under Component D. Economic benefits of the integrated neighborhood improvements were measured through property appreciation; those for the road rehabilitation were measured through travel time savings, which brings along reduction in vehicle operating costs. Results of the evaluation show that the interventions yielded significant economic benefits. The net present values (NPV) of benefits for the neighborhood improvement interventions in George Dimitrov and Chamanculo C are about US$ 4.3 million and US$ 4.1 million, respectively, and the economic rates of return (ERR) reached 125% for George Dimitrov and 299% for Chamanculo C. For the rehabilitation of Julius Nyerere Avenue, the NPV of economic benefits is about US$ 27.4 million and the ERR is 49%. Although the actual ERR in the case of Julius Nyerere Avenue is lower than that expected at appraisal, the ERR for all three investments are largely above the discount rate of 12% used at appraisal and the currently recommended threshold of 6%. Sensitivity analyses showed that the results are robust to more stringent assumptions. The economic results should also be viewed as a conservative lower bound value as other major benefits (such as benefits stemming from the reduction in flooding and erosion, installation of traffic signs, and property appreciation along the rehabilitated road; or improved health and social cohesion in the intervened neighborhoods) could not be quantified because of lack of data or their qualitative nature.
10 The five contiguous districts of Maputo represent 90 percent of the municipality’s total population. The remaining two districts (i.e., Katembe and Kanyaka) were not included under the Project, as they were more challenging to concession given that that are more sparsely populated and, being a peninsula and an island) not easily accessible from the mainland.11 Under Component A, activities to strengthen the municipal capacity for service delivery were implemented. Benefits attained from this component have been important for CCM and citizens, yet they could not be quantified due to lack of information.
13

As at appraisal, financial analyses were conducted for financial sustainability activities under Component B and investments in solid waste management under Component E. Financial benefits were measured as the increase in collecting revenue. Results show that Component B was viable with internal rates of return (IRR) of 46% for the increase in property tax revenues and 136% for the increase in CCM’s operating surplus. Even though the solid waste management interventions did not achieve full cost recovery as expected at appraisal12, results from the financial evaluation (NPV of US$ 0.09 million and IRR of 14%) show that CCM is better off with the intervention than without it and all residents of the contiguous districts of Maputo enjoy coverage of solid waste collection service.
Summary of Results. Expected and ActualExpected at appraisal Actual Results
NPV(million US$)
ERR/IRR %
NPV(million
US$)
ERR/IRR %
B. Financial Sustainability1. Increase of Property Tax 79% 5.2 46%2. Increase of operating surplus: 24.5 136%C. Urban Planning
Interventions not included Upgrading of George Dimitrov 4.3 125% Upgrading of Chamanculo C 4.1 299%D. Urban Infrastructure:
Rehabilitation of Julius Nyerere Ave From 1.5 to 10.4 million
500%-1,000% 27.4 49%
E. Metropolitan Development Solid Waste Management 0.09 14% Cost recovery 2016 100% by 2015 54%
3.4 Justification of Overall Outcome RatingRating: SatisfactoryThis operation had and continues to be highly relevant. It has met its development objectives, and, as such, efficacy is satisfactory. In addition, the economic benefits are high in relation to the financial resources allocated, for which its efficiency is considered to be substantial. Thus, the overall rating is deemed satisfactory.
3.5 Overarching Themes, Other Outcomes and Impacts
(a) Poverty Impacts, Gender Aspects, and Social DevelopmentThe MMDP II can be expected to have a significant positive impact on the poor. The expansion of urban services, particularly in areas beyond the city core (i.e., solid waste collection and rehabilitation of unpaved roads), contributed to enhancing the living conditions of the poor, which are estimated to be roughly half of Maputo’s population, amongst others by facilitating mobility and reducing travel time. In addition, two informal settlements were rehabilitated under the Project (Chamanculo C and George Dimitrov), which have significantly affected the lives of their residents. For example, the rehabilitation of George Dimitrov included new drainage systems, paved access roads, new recreational spaces, and improvements in solid waste collection. An estimated 12 Cost recovery for solid waste collection amounted to 81% in 2015 but only 54% in 2016. However, this gap can be expected to narrow again as some of the contracts with waste collection companies are in US dollars or include clauses for price adjustments and, as such, were affected by the depreciation of the Metical.
14
40,000 residents directly benefited from the upgrades, including 2,000 primary school children whose school has been totally rehabilitated. Improvements have also fueled the growth of local businesses that now include more than 800 people, mostly women. Overall, it is estimated that approximately 585,000 women had benefited from the operation (i.e., 51.5 percent of Maputo’s population).
(b) Institutional Change/StrengtheningThis operation, together with its predecessor, have drastically transformed the CCM, ensuring that it has a solid institutional and financial foundation to provide the services that can help enhance urban productivity and living conditions. Perhaps more important than the actual increase in service provision has been the development and adoption of the methodologies (e.g., establishment of a medium-term/multi-year expenditure/fiscal planning framework), processes (e.g., development and application of methodological manual for integrated interventions in informal settlements) and management tools (e.g., Integrated Municipal Management System - SIGEM) that supported them (see Annex 2 for a detailed description). Other important contributions include: the adoption of a metropolitan perspective in solid waste collection as well as transportation, shifting from an administrative-based to a system perspective; the deconcentration of service provision responsibilities to the municipal districts (i.e., street cleaning and maintenance of unpaved roads); and enhanced governance mechanisms; enhanced urban land and environmental management.
(c) Other Unintended Outcomes and Impacts (positive or negative)A basic training course was developed and offered under the Project to train public servants in the planning and management of informal settlements. Using this course as the core, the School of Architecture developed a Master's Program in Planning and Management of Informal Settlements. A total of 90 students have enrolled in the program so far, including 13 senior technical staff from the Municipality. The first two rounds were offered in Maputo and the third round in Nampula, as it was designed as a mix of online and in-classroom delivery.
Finally, it should be noted that the Team identified issues regarding gentrification associated with the works supported under the operation. It is recommended that these broader contextual issues be addressed strategically, via technical assistance, policy dialog and targeted interventions; and considered in contextual analyses of social risks in future urban operations in Maputo and other cities in the country.
3.6 Summary of Findings of Beneficiary Survey and/or Stakeholder WorkshopsN.A.
4. Assessment of Risk to Development Outcome Rating: ModerateAlthough the risks vary for the various areas of intervention, the overall risk to the development outcomes achieved under the operation is rated moderate. A key determinant of the success of the ProMaputo Program supported by the MMDP operations was the continuous support of municipal authorities. In that context and, as it is always the case in reform processes, the upcoming municipal elections (2018) introduce an element of uncertainty. The end of the Bank’s engagement with the CCM under the MMDP operations adds to that uncertainty. The new governance mechanisms
15
that were put in place, such as the CRCs, diminish the risks, as any potential backtracking in terms of service delivery and transparency would be highly visible. Some of the specific challenges being faced in the various areas of intervention can be summarized as follows:
Institutional capacity – Moderate. Improvements in capacity building supported under the Project are likely to be sustained, particularly because project implementation was mainstreamed within the CCM’s structure. However, challenges remain. While there have been significant advances toward the enhancement and rationalization of municipal human resources, it is still a work in progress that requires the sustained commitment of municipal authorities. In addition, the full absorption of new management tools by individual units, SIGEM in particular, is still pending and needs to be given a high priority by CCM authorities.13 In addition, it is important to ensure the strong culture of strategic monitoring and reporting that was developed under the MMDP operations by continuing to provide top-notch human resources and strong political support to OSID. Likewise, as the MMDP II and ProMaputo municipal program reach their conclusion, it is critical to fill the void left in terms of a medium-term strategic perspective. It is also worth noting that the expected approval of the Human Resources Classifier will be a critical step toward ensuring quality human resources, as it will allow the CCM to implement its own human resources policies, including remuneration.14 Its submission to the Central Government is expected before end of Project. In this regards, it is important to note that Maputo’s Classifier will be the first municipal classifier to be approved and, as such, will serve as the main reference for other municipalities in the country. Thus, it deserves scrutiny by both CCM and national authorities, as it will have a large impact in defining the structure of municipal human resources in the entire country.
Fiscal sustainability – Moderate. As demonstrated by the big increases in IPRA collections, CCM fiscal potential is large and remains largely untapped. Further progress will depend on the continuous expansion of the fiscal base (i.e., expansion and ongoing updating of the fiscal cadaster) and strengthening of tax administration. The development of SIGEF is still pending and constitutes a serious bottleneck to enhance the CCM’s financial administration.
Road infrastructure – Low to negligible. Road maintenance is likely to continue, as it is now the CCM’s current practice to establish annual budgets and work plans for this activity. In addition, the CCM has strengthened its capacity for managing routine maintenance contracts. District administrations have also been trained to undertake spot repairs to unpaved roads after each rainy season.
Solid waste collection – Substantial. Despite the expansion in coverage, important challenges remain. First, as proven during implementation, sustaining the provision of waste collection without a decline in the quality of services presents a significant challenge given the number of private providers and the complexities of monitoring compliance at the agreed levels of service. A second challenge is ensuring that the CCM does not overpay for the waste that is being collected. During implementation, the equipment utilized to weight the incoming garbage at Maputo’s dumpsite was not working for extended periods of time. Alternatively, volume-based estimates were used,
13 Geo-referenced Integrated Municipal Management System.14 Currently, the human resource policies of CMM and all municipalities in the country are being governed by the General Statute of Public Employees.
16

which lack the level of accuracy required given the large amounts the CCM pays to the private providers for solid waste collected. A third challenge is related to the construction of a sanitary landfill in Matola to replace Maputo’s dumpsite, which is urgently needed. Finally, although the CCM has already implemented an increase in SWM fees for solid waste services and negotiated a reduction in administrative collection fees with EDM, it is critical to ensure full cost recovery. Currently, revenues from SWC management fees do not recover the cost of solid waste collection as anticipated, amounting to 81 and 54 percent in 2015 and 2016, respectively. Although it can be expected that the gap will narrow again, this trend brings attention to the fragility of the financial sustainability of solid waste collection (and other municipal services in general) and the importance to continue to adjust service fees and improve collection rates.15
5. Assessment of Bank and Borrower Performance
5.1 Bank Performance (a) Bank Performance in Ensuring Quality at Entry Rating: Moderately SatisfactoryThe Bank’s overall performance in ensuring quality at entry was moderately satisfactory. The project design built on that of its predecessor and reflected its many strengths, including insertion within a medium-term, strategic vision; correct sequencing of the reforms and identification of priority services; and adequate choice of lending instrument. It also benefited from the procedures already in place for project implementation as well as a robust PRF, M&E and reporting arrangements. Except for procurement and FM, the preparation team correctly gauged the CCM’s implementation capacity and agreements were reached on the roles and responsibilities of the various directorates of the CCM in implementation. Procurement documents for the first-year activities were completed and ready for the start of project implementation. The Bank team also ensured the timely delivery and effectiveness of the project. There were, however, some weaknesses, including: i) overestimating the FM and procurement capacity of the CCM; ii) deficiencies in the technical design of Ave. Julius Nyerere (the largest investment under the operation), and iii) an incomplete view of the solid waste service provision cycle.
(b) Quality of Supervision Rating: SatisfactoryBank performance in supervision was satisfactory. The Bank team provided close implementation support throughout project implementation. The composition of the Bank team exhibited significant continuity, which contributed to having an effective supervision despite the Project’s complexity. The first task team leader (TTL)—from preparation to 2015—had already been member of the MMDP I team since preparation, subsequently becoming its TTL and relocating to Maputo, which helped provide daily support to the CCM. From 2015 to closing, the Project benefited from having two co-TTLs, which also helped ensure that the Project received the necessary attention. The Bank’s management team actively oversaw project implementation and provided strategic guidance to help ensure that it remained on track to meet its objectives. As noted by the Borrower, however, there was too much turnover of specialists in some areas (e.g., safeguards).
15 Some of the contracts are in dollars or include clauses for price adjustments and, as such, were affected by the depreciation of the Metical. Thus, the gap can be expected to narrow again.
17
The Bank team held regular implementation missions during the Project’s seven years of implementation and maintained fluid communication with the Borrower in between missions. Mission findings were thoroughly reported in the Aide Memoires and ISRs, which were comprehensive and candid and raised early flags on the main issues affecting project implementation. The Bank also exhibited flexibility and was proactive in adopting corrective measures, as in the case of rehabilitation of the Av. Julius Nyerere that required the processing of two extensions of the closing date. Although the Bank was proactive in addressing delays in the implementation of SIGEF and the construction of the new landfill, these were the result of factors external to the operation.
The MTR took place in September 2013, only a few weeks after originally planned. In preparation for the MTR, an independent evaluation of the MMDP II was prepared. In addition, both the client and Bank teams also prepared their own assessments of project performance. Overall, there was concurrence on the main strengths and weaknesses and on the areas that needed further support to ensure that all KOIs would be met by the end of the Program. The needed changes were introduced in the 2014 restructuring, effectively addressing the capacity bottlenecks that caused delays during the first three years of implementation. In retrospect, the KOI focusing on residents’ perceptions regarding should have been revisited and probably replaced with more effective measures of satisfaction in relation to the priority services supported under the operation.
The Bank Team effectively used ISR ratings to motivate the Borrower to act in critical issues. For example, the rating for Implementation Progress (IP) was downgraded from MS and MU in December 2016 to underscore the importance of addressing pending drainage issues in the rehabilitation of Julio Nyerere Ave. and Chamanculo C. Likewise, rather than upgrading the DO rating to Satisfactory to reflect the Project’s high level of attainment with respect to most indicators, an Moderately Satisfactory was maintained to motivate the CCM to further reduce the number of days required to process a construction licenses. Both ratings were subsequently upgraded to S in May 2017 once these issues had been satisfactorily addressed.
(c) Justification of Rating for Overall Bank PerformanceRating: Moderately Satisfactory Overall, the Bank’s performance is considered satisfactory to reflect its moderately satisfactory performance in ensuring quality at entry and satisfactory during supervision.
5.2 Borrower Performance(a) Government PerformanceRating: Satisfactory The performance of the GoM is considered satisfactory. The central government, particularly the Ministry of Finance and the Ministry of Environmental Coordination (then MICOA) played important roles in helping create the capacity of the CCM for municipal service delivery. Specifically, the Ministry of Finance generally provided its counterpart funds on time, facilitating smooth implementation. Moreover, the actual financial GoM contribution to the Project was larger than originally anticipated (i.e., US$16.9 million compared to US$15.3 million). Similarly, MICOA routinely reviewed the EIAs of infrastructure works. Finally, the Council of Ministers on December 27, 2010 approved a decree allowing revaluation of urban properties, which substantially increased the revenue potential for the CCM and other municipalities in the country.
18

(b) Implementing Agency or Agencies PerformanceRating: SatisfactoryThe overall performance of the CCM was satisfactory. Even though IP was rated MS throughout the Project’s lifetime, implementation accelerated towards the end successfully overcoming the main challenges that were still pending. The Project received full support from the mayor and city council throughout its lifetime. The OSID was responsible for coordination activities throughout implementation and, as envisioned in the original Program design, project implementation was fully mainstreamed into the municipal structures. In this context, individual departments fulfilled their responsibilities under the Project, contributing to the achievement of outcomes.
The only exception was in the areas of FM and procurement where capacity was lacking, resulting in substantive delays in budget execution and program implementation. Because of this, as part of the 2014 MTR and subsequent restructuring, the management of IDA funds and activities was separated from daily management of CMM’s funds. Individual consultants were hired to work in OSID to serve as a supplementary Financial Manager and Procurement Officer under the supervision of the OSID Director. This allowed a more efficient and effective program management and a more dedicated capacity building strategy for the municipal team. OSID addressed weaknesses in staff capacity by recruiting advisors with specific expertise as needed. In addition, it prepared quarterly progress reports on time, which reported on progress in implementation of activities and towards achieving outcomes. These monitoring reports utilized the traffic-light approach, which made clear whether progress and data reporting by individual areas was on track. The reports formed the basis for weekly staff discussions on implementation progress and for periodic presentations to the mayor, the municipality’s consultative council, the municipal assembly, and other stakeholders. The quality of the Borrower’s Final Evaluation Report is another indicator of the excellent performance of the OSID.
The CCM participated fully in the MTR, candidly assessing implementation weaknesses and being supportive of introducing the necessary changes under the subsequent restructuring. The CCM also ensured that the Project complied with environmental and social safeguards. The CCM provided counterpart funds on time, exceeding the original commitment (i.e., US$46 million compared to US$42.2 million). It complied with all legal covenants, although with some delays in the early years. Finally, it adopted a scheme to pay bonuses to high-performing staff, thereby attenuating the economic disincentive for qualified technical staff to work for government institutions.
(c) Justification of Rating for Overall Borrower PerformanceRating: SatisfactoryOverall, the Borrower’s performance is considered satisfactory to reflect the satisfactory performance of both the Government and the Implementing Unit. While the Project implementation was evaluated MS throughout most of the implementation phase, it overcame its main challenges, accelerated implementation progress towards the end and surpassed most of its expected results.
6. Lessons Learned
A medium-term strategic vision is necessary to effectively guide reform efforts. The ProMaputo program provided the strategic framework for the reforms supported under the MMDP I and II and help to provide continuity despite changes in political leadership.
19

Programmatic lending instruments offer a good match for reform processes. The APL adequately supported the programmatic nature of the MMDP operations and provided the medium-term timeframe that was required for its success. In turn, the successful application of the programmatic approach was the result of: i) having the right sequencing of activities under MMDP I and II; and ii) a true programmatic approach, with a more limited intervention at first followed by the subsequent scaling up as illustrated in the case of solid waste collection. Having lending tools that support long-term engagement is particularly important in the urban sector given the complexity of urban challenges.
Sound project design must be grounded in a strong evidence base. The design of the MMDP operations reflected the findings of studies on CCM performance in critical areas that identified main weaknesses and offered recommendations and potential solutions. In addition, the operations reflected the priorities of the city’s residents as revealed in public consultation processes and the results of the CRC.
Having the right mix and sequencing of reforms can help make them more palatable. While the MMDP I had a stronger focus on institutional and financial reform and capacity building, it also took the first steps toward improving service provision, solid waste collection in particular, to attain some tangible results to ensure sustained commitment on the part of both residents and municipal authorities. Building upon this foundation, the MMDP II focused on the consolidation of institutional and financial reforms and the scaling up of service provision while pursuing cost recovery through fee increases.
Strong support from municipal authorities is a critical determinant of the success of reform efforts. The MMDP II and its predecessor benefited from the commitment of the city’s mayor and city council as well as the national government, which guaranteed the political and financial support required for its success.
While mainstreaming project management helps build capacity of government entities, it is also critical to ensure that the required capacity for project implementation is in place. While relying on the CCM’s line departments helped develop key skills of the CCM staff, establishing Project-dedicated FM and procurement specialists after the MTR helped overcome a severe implementation bottleneck. These specialists have also provided support to the CCM’s administrative unit, contributing to their technical capacity.
A robust M&E system can be a critical determinant of an operation’s successful implementation. In the case of this operation, factors that contributed to a remarkably sound M&E system included: a) the fact that it built upon the M&E of the preceding operation; b) it was given high visibility within the CCM, being regularly presented at city council and directors' meetings; and most importantly c) it reflected the government agenda of the two mayors; thus there was strong ownership.
It is important to plan the financial sustainability of expanded service provision. To help ensure the financial sustainability of the expanded solid waste collection services, the MMDP II provided declining operating subsidies for the contracted services, requiring that the remaining financing gap be filled by increases in the SWM fee.
At preparation, it is critical to ensure that all elements of the service delivery process are in place. In the absence of the alternative landfill, the expanded solid waste collection put
20
extra pressure on the existing landfill, increasing the environmental risks. Ensuring the completion of the alternative landfill should have been a top priority addressed at the Project’s design stage.
Having key activities outside the orbit of the implementing agency pose additional implementation risks. The inability of the CCM to resolve implementation delays in the case of both SIGEF and the alternative landfill illustrate the risks of having key Project activities outside its area of influence.
Particularly in the case of fast growing urban areas, engineering designs of infrastructure works should be updated, reviewing dimensioning criteria, to ensure they address actual conditions. In the case of the rehabilitation of the Ave. Julius Nyerere, the engineering design of the road, including drainage, dated from the early 2000s. Thus, it failed to take into consideration the current traffic conditions and the additional drainage needs, resulting from fast urban growth.
While results of public opinion surveys can be useful in a myriad of ways, they are not the best KOIs. Instruments such as the CRCs measure respondents’ perceptions, which can be affected by exogenous factors, such as specific events and economic conditions. Thus, they are not appropriate for capturing objective improvements in service provision.
7. Comments on Issues Raised by Borrower/Implementing Agencies/Partners (a) Borrower/implementing agenciesA summary of the Borrower’s completion report (in Portuguese) is attached in Annex 5. The CMM reviewed the draft ICR and expressed its agreement with the conclusions and ratings of the ICR in a letter dated August, 21, 2017 (also attached in Annex 5).
(b) Cofinanciers – N/A.
(c) Other partners and stakeholders – N/A.
21
Annex 1. Project Costs and Financing
(a) Project Cost by Component (in USD Million equivalent)Components Appraisal Estimate
(USD millions)Actual/Latest Estimate
(USD millions)Percentage of
AppraisalA. Institutional Development 12.4 9.4 76B. Financial Sustainability 4.6 3.0 65C. Urban Planning 15.2 13.4 88 D. Urban Infrastructure 38.1 51.2 134E. Metropolitan Development 26.7 38.5 144 Total Baseline Cost 97.0
Unallocated 8.0
Total Project Costs 105.0 115.5 110
(b) Financing
Source of Funds Type of Co-financing
Appraisal Estimate
(USD millions)
Actual/Latest Estimate
(USD millions)
Percentage of Appraisal
CCM Municipal Budget 40.0 49.7 124.3
Government of Mozambique National Budget 15.0 16.9 112.7
International Development Association (IDA) Credit 50.0 48.9 97.8
22
Annex 2. Outputs by Component
Project Inputs Intermediate outcomes Main Results
A. Institutional Development
A.1 Municipal Management and Technical Capacity as an Intermediate Outcome
A.1.1 TA provided for the implementation of an Integrated Strategic and Operational Planning and Monitoring Methodology to ensure alignment between the Governance Objectives, the Five- Year Program and the Annual Activity Plans.
Results-based integrated planning system in place and operational. The Municipal Council has formally adopted this methodology and it is part of its routine operations.
Achieved - Enhanced performance of municipal staff denoted among other improvements in service provision, by the reductions in average processing times for various licenses and as well as the issuing of DUATs during the Project's lifetime between 2011 and 2016, including: Business license for
microenterprises from 3 to 1 day; First-time mini-bus transport
license from 4 weeks to 1 week; Renewal of mini-bus transport
licenses from 7 days to 48 hours; Truck operation license from 1
week to 1 day; Construction licenses from 75 to
60 days. Processing times were drastically cut at 47 days in the first quarter of 2017 (slightly above the 45-day target);
Issuing a DUAT from 150 to 45 days between 2010 and 2016.
Activities cancelled: The Organizational Development Program and the Document Management Information System; funds reoriented to other priorities.
A.1.2 TA provided for the design of a Municipal Management System (SIGEM), including the redesign of workflows for administrative procedures and the provision of services.
Streamlined administrative processes in operation. The SIGEM has been formally adopted and is operational.
A.1.3 TA provided for the implementation of new human resources management practices in line with HR Restructuring Plan developed under ProMaputo I, including: employee census, definition of roles and qualifications, review of human resources policies and dissemination, training and recruitment plans developed based on competency gaps, career development paths, and performance-based compensation scheme (results-based bonuses). In addition, a fully equipped Training Center was constructed that is used both for the training of municipal staff as well as third parties on a rental fee-basis. A total of 3,500 CCM staff received training.
The proportion of technical staff increased from 17.6 to 31.4 percent between 2007 and 2016.
The retention rate of qualified municipal staff (middle and higher level) by CMM increased from 95.4 to 99.6 percent between 2011 and 2016.
TA provided for the development of the Human Resources Classifier and corresponding revision of the recruitment, remuneration, career development and performance evaluation practices (ongoing).
Human Resources Classifier proposal submitted for approval to Central Government (expected before end of Project) that will permit the Municipality of Maputo to implement its own Human Resources policies, including remuneration. Activities cancelled: Development of
an Information System for Strategic Management of Human Resources; and Employee Satisfaction Survey.
A.1.4 Acquisition of ICT equipment Enhanced communication and
23
and software licenses; improvement in the data and communications network for CMM Headquarters Building; implementation of the Municipal Data and Communications Network linking all municipal functional units; Strategic Plan of Information Systems; Definition of Disaster location and operation solution recovery system.
access to ICT tools and applications that support productivity of municipal staff. The Municipal Data and Communications Network allowed for interconnection of all organizational units, as well as access to ICT (from the personal productivity tools to the specific applications of the CMM).
ICT maintenance budgets increased by 260 percent in real terms between 2012 and 2016 (although still considerable less than Project target).
Activities cancelled: Development of an Online Virtual Community; and implementation of ICT Maintenance Strategy.
A.1.5 Financial support for the purchase of furniture for municipal directorates; and rehabilitation works and purchase of furniture for municipal district offices.
Enhanced physical infrastructure and equipment, including at the municipal district level.
Maintenance budget for municipal vehicle fleet increased by 227 percent in real terms between 2012 and 2016 (although still considerably below Project target).
Activities cancelled: Rehabilitation of walls of CMM Headquarters; and implementation of municipal vehicle fleet maintenance strategy.
A.1.6 TA was provided to carry out AIDS/HIV prevention and testing campaigns among municipal personnel.
Enhanced awareness of AIDS/HIV prevention practices; additional cases oh AIDS/HIV diagnosed among municipal personnel.
A.2 Municipal Governance
A.2.1 TA assistance provided to carry out surveys of Maputo residents, governance related campaigns, and campaigns to increase citizens’ access to municipal information and citizen participation in municipal affairs.
A Communication Strategy was developed and implemented; open elections were conducted for President and Municipal Councilors of Municipal Districts (they were previously appointed by the Municipal president); a Participatory Budgeting methodology was developed and is being implemented; residents survey “Report Card” were conducted annually except for 2015; the Ombudsman's Office is operational; alternative channels of communication with citizenry are operational (e.g., CMM website and the Municipal President Facebook page); participatory sessions were conducted at the district level to seek input for the preparation of Five-Year Municipal Program, various assessments, the Deconcentration Plan and the Strategic Municipal District Plans.
Achieved - Enhanced responsiveness of the municipality to residents' demands as identified through the routine implementation of various participatory mechanisms. For example, the Report Cards have become a key input in determining municipal priorities.
Not Achieved - Aggregate results from the Report card (RC) have remained constant, not capturing objective increases in service provision. However, the Report Card measures residents' perceptions that, as such, are affected by other factors such as economic conditions.
A.2.2 TA provided for the gradual deconcentration of selected municipal functions to municipal districts, including planning, administration, implementation of small municipal investments as well as basic service delivery.
Decentralization Plan for the Provision of Services to Municipal Districts was developed and has been partially implemented (i.e., maintenance of unpaved roads, street cleaning and solid waste collection only); District
Achieved - Even though the deconcentration plan was only partially implemented, the services that were indeed deconcentrated were priority services. Moreover, districts have successfully assumed their responsibilities, resulting in
24
Administration Strategic Plans were developed, providing districts with a planning instrument that clarified their responsibilities and priorities under the deconcentrated scheme.
drastic increases in service coverage in street cleaning, maintenance of unpaved roads and solid waste collection.
A.2.3 Financing of small works to improve public infrastructure and services in municipal neighborhoods.
Carried out through Participatory Budgeting (PB) methodology. For example, in the 2012-2013 budget cycle, a total of 16 investment projects were identified and subsequently implemented for a total of 25 million MT, including the rehabilitation of primary schools and playgrounds.
Achieved - Participatory budgeting has promoted the active engagement of residents in budget allocation decisions, resulting in small neighborhood investments that reflect their priorities.
A.2.4 TA provided for the development of regulatory framework and promotion of private sector investment and public-private partnerships for purposes in the provision of municipal services.
The Municipality collaborated in the elaboration of the Law and the National Regulation of the PPP's and subsequently regulated its application within the municipality (Postura Municipal de PPPs); PPP Strategy developed; Investor Support Office established and investment opportunities identified and disseminated.
Achieved - Private investment in municipal infrastructure was mobilized through PPPs and an investment-friendly environment, including the rehabilitation of six public open spaces; rehabilitation of public kiosks and toilets in four locations; construction of six restaurants in municipal fairgrounds; and construction of infrastructure required to support cruise tourism in Portuguese’s Island.
A.2.5 TA provided for the dissemination of CMM’s policies, plans, budgets, and implementation reports.
The Municipality's Financial Execution Report was publicly disseminated and made available on the website every year.
Achieved - Enhanced transparency and accountability
Results from Report Card survey were publicly disseminated and made available on the website every year, with the exception of 2015, when it was not conducted.
B. Municipal Fiscal Performance
B.1 Increased Fiscal Revenues
B.1 TA provided for the following activities: expansion and updating of the information in the municipal integrated multi-purpose cadaster; updating the value of properties within the municipal jurisdiction; improving municipal billing and collection administration; the implementation of public information campaigns to increase municipal revenues; development and implementation of strategies to update municipal tax regulations and to resolve tax related disputes.
Drastic reassessment of property values in line with market prices based on 2010 IPRA legislation.
Achieved - CPI-adjusted IPRA collections increased by 281 percent between 2010 and 2016. In addition, own-source revenues increased by 118 percent in real terms between 2011 and 2016. On the expenditure side, service provision was a top priority for municipal spending. Overall, the municipality maintained a solid fiscal balance, with a ratio between own-source revenues and current expenditures equal to 126 percent in 2016.
Drastic expansion of the tax base through the implementation of a massive Land Rights Regularization Campaign produced 32,338 DUATs between 2012 and 2016, more than doubling the number of properties incorporated into the fiscal cadaster.
Enhanced tax administration, including Adoption of computerized tools by the Municipal Finance Department that allowed for easier identification of debtors; expansion of the collection network with stronger presence at the district level, thus reducing queues and bringing payment points closer to taxpayers; elimination of cash payments and the establishment of
25

payment mechanisms through the banking system; and creating internal capacity to reinforce the distribution of notifications to debtors. Despite drastic increase in the number of properties in the fiscal cadaster, collection rates were at above 80 percent in terms of both number of contributors and collection amount.
B.2 Improved Financial Management and Planning
B.2.1 Cancelled activities: Implementation of a Municipal Financial Administration System (SIGEF).
Not Achieved - The development of SIGEF is estimated to be at roughly 60 percent.
B.2.2 TA assistance provided to integrate the medium / short-term planning system into strategic planning
The Municipality has implemented an integrated (non-computerized) planning and budgeting system to generate long, medium and short-term plans and budgets. The Medium Term Expenditure Framework (MTEF) is one of the instruments of this system. It reflects Five Year Strategic Plan and is used in annual Planning and Budgeting. In general, the Municipal Budget is the financial expression of the Annual Operation Plan.
Achieved - The Municipality carries out comprehensive financial planning utilizing the MTEF, which, in turn, is linked to Municipality's strategic plans and annual budget cycles.
B.2.3 TA assistance provided to strengthen internal control mechanisms and annual audits of all municipal accounts.
The implementation of SIGEF would have had positive impacts on improving financial execution and implementing internal control mechanisms. Nevertheless, in order to improve the effectiveness and efficiency in financial execution, the CMM subjected its accounts to annual internal and external audits. These audits have contributed to improve financial processes due to the implementation of the recommendations from the audits.
Partially Achieved - Even though SIGEF was not implemented, there have been improvements in the Municipality’s FM practices.
B.3 Enhanced Procurement and Management of Municipal Real Estate Assets
B.3.1 TA provided for the strengthening of the Municipality's procurement function, including the consolidation of all CMM’s procurement units into a single department responsible for all municipal public procurement.
All municipal procurement processes are now managed by the Procurement Department. The centralization of the procurement function has allowed the elaboration of a single procurement plan and, as a result, better programming, rationalization and control of municipal expenditures.
Achieved - The percentage of procurement processes that result in contracts signed within the specified deadlines increased from 37 to 96 percent between 2012 and 2016.
B.3.2 Cancelled activities: TA for improving the management of municipal real estate assets.
Not Achieved.
C. Urban Planning
C.1 Enhanced Urban Land and Environmental Management
26
C.1.1 TA provided for the development of Partial Urbanization Plans.
A total of 15 Partial Urbanization Plans covering 20 neighborhoods were developed and approved.
Achieved - The Partial Urbanization Plans facilitate the management of urban land, including, among others, the regularization and issuing of DUATs, orderly development of municipal infrastructure, and the definition of streets and public spaces. In turn, enhanced land-use and environmental planning sets the foundations for more equitable and sustainable management of municipal land
.
TA provided for the development of environmental plans.
Four environmental plans were elaborated, focusing on: environmental zoning; climate change; pollution control; and slope maintenance. In addition, an environmental education plan is being implemented in schools, including the planting of trees.
C.1.2 TA was provided for the development of SIGEM to support land-use management.
The SIGEM was expanded and consolidated, including the development of additional modules, the processing of aerial photography to produce cartographic information and digital terrain models, the linkage of several organic units to the system, purchase of equipment, and employee training.
Achieved - The expansion and consolidation of SIGEM constituted an important step toward a unified register that utilizes same cartographic and alphanumeric information by all municipal functional units. It also improves the sharing of information as well as transparency, effectiveness and efficiency in information management. It also contributes to the improvement of municipal administrative services in both timeliness and quality, including the issuing of topographic profiles, IPRA collection notices and DUATs.
C.2 Neighborhood Improvements
C.2.1 TA and financing of small works, including the design and implementation of integrated methodologies for the improvement of informal settlements in high-density and spatially complex peri-urban neighborhoods, including integrated neighborhood plans, targeted improvements to local infrastructure, and services in support of the regularization of land tenure through a participatory, multi-sectoral approach.
A Methodological Manual for Integrated Interventions in Informal Settlements was developed. The methodology was developed in parallel with the intervention in the George Dimitrov neighborhood. This manual will serve as a guide for future interventions in informal neighborhoods in the Municipality of Maputo and can potentially be a reference for secondary cities in Mozambique and African cities in general.
Achieved - These manuals will serve as a guide for future interventions in informal neighborhoods in the Municipality of Maputo and can potentially be a reference for secondary cities in Mozambique and African cities in general.
A Methodological Manual for Environmental Impact Assessment (EIA) in the context of upgrading of informal settlements was also developed.
The integrated (i.e., physical, social and environmental) rehabilitation of the George Dimitrov neighborhood focused on the construction of the priority physical works identified by the community as having a potentially significant impact in improving the quality of life of the residents, including: drainage, access roads, public recreational areas, community center,
Achieved - The integrated (i.e., physical, social and environmental) rehabilitation of the George Dimitrov neighborhood reflects the applicability of the steps defined in the Methodological Manual and illustrates the potential impact of this type of intervention.
27
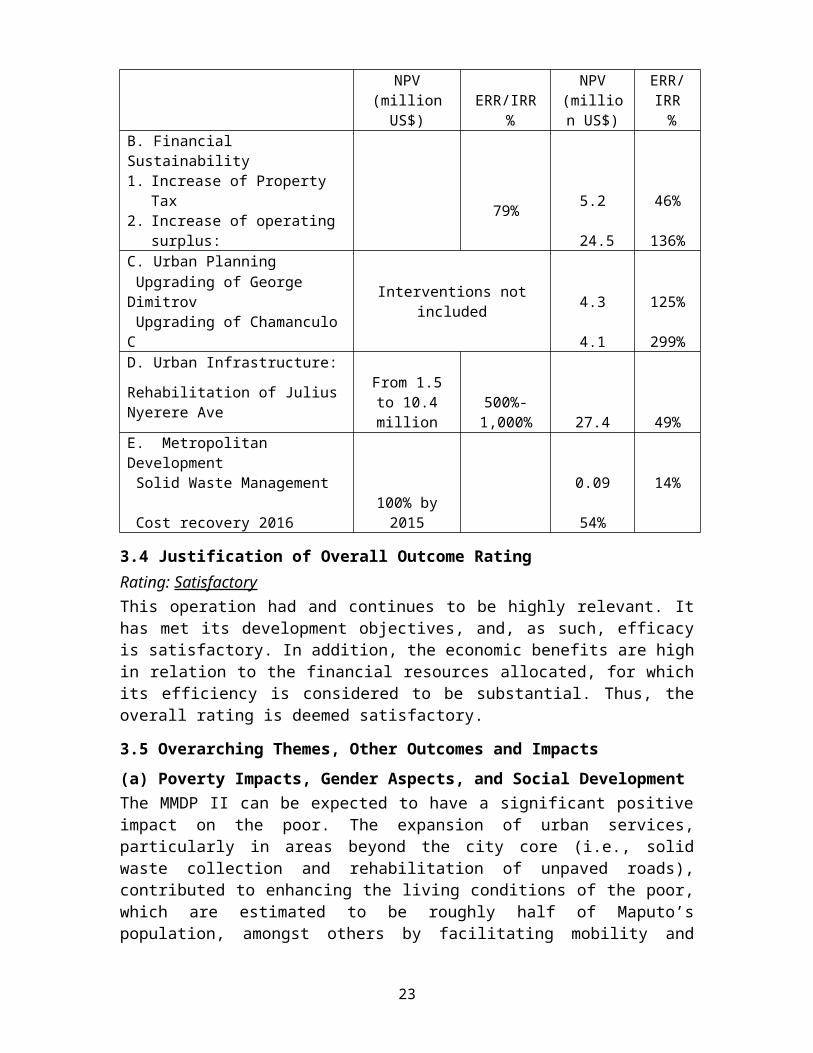
playground, public restrooms as well as the rehabilitation of the elementary school.
Concomitantly, it was implemented a Local Development Plan aimed at promoting the social and economic development of the neighborhood and the civic education of its residents. This plan focused on providing support for: local businesses including modular street stands, improved teaching methodologies for teachers, street cleaning, business development opportunities, community development, improved health conditions and sports. There were also preliminary steps toward future land-use regularization.
The Chamanculo C was rehabilitated, with a focused on: improving internal and external accessibility, drainage and conducting the preliminary work for the future regularization of land-use rights. The rehabilitation of the Amaral Matos Avenue was a central component of this intervention, as it constitutes the main access to the neighborhood.
Achieved - Although more focused in scope, the rehabilitation of the Chamanculo C neighborhood, particularly its access roads and drainage, illustrates the high impact of selective infrastructure upgrading in a neighborhood's living conditions.
C.2.2 Technical assistance for the development of the Integrated Methodology in Informal Settlements Course; financial support for ten scholarships for municipal technical staff, including eight additional months needed to complete the Master's level degreee; and a study tour in Brazil for five municipal managers and technical staff.
Using the basic training course developed under the Project as core, the School of Architecture developed a Master's Program in Planning and Management of Informal Settlements. A total of 38 students have completed the coursework so far, including 13 senior technical staff from the Municipality. The first two rounds was offered in Maputo and the third round in Nampula, as it has been designed as a mix of online and in-classroom delivery.
Achieved - Both the training course and Master's program provides professional staff with relevant knowledge and a robust set of skills to address informal settlements from a multi-disciplinary perspective. The study tour to four Brazilian cities offered students exposure to alternative modes of intervention in informal settlements despite the differences in the cultural and physical context of Brazilian favelas.
D. Urban Infrastructure Investment and Maintenance
D.1 Financial support for the rehabilitation of J. Nyerere Ave.
Although at a substantially higher cost and with delays, 4 km of the Avenue Julius Nyerere that had been destroyed by flooding in the year 2000 were reconstructed under the Project. It reconnected the central city to important peri-urban residential and commercial areas.
Achieved - Reductions in travel time despite massive increases in the number of vehicles (e.g., travel time between the Women's Detachment Square and the Combatants Square decreased from 45 to 7 minutes).
Activity cancelled: The second phase of the project to be financed by the CCM was not done. Instead, the Brazilian Government will finance it. Financial resources were assigned to other areas (e.g., maintenance of unpaved roads.
D. 2-3 Financial support for secondary road and drainage improvements rehabilitation of primary and secondary road networks in the city of Maputo, including new
A total of 114 km of paved roads were rehabilitated between 2010 and 2016, drastically exceeding the targets (i.e., 28 km). As anticipated, this activity was financed by the
Achieved - Between 2010 and 2016, the number of people in urban areas provided with access to all-season roads within a 500 meter range increased from 60,000 to 969,000,
28
collector roads and extensions of existing roadways, and drainage structure.
National Government and the CCM. equivalent to a 16-fold increase.
In real terms, the allocation of municipal current expenditures for road maintenance increased by more than 16 times.
D. 4 Financial support for maintenance and repairs of unpaved roads and local drainage structures to enhance access to residential neighborhoods after degradation due to annual rains and road use.
A total of 729 km of unpaved roads were rehabilitated between 2010 and 2016, drastically exceeding the target (i.e., 80 km, respectively).
D.5-6 Financial support for environmental and resettlement assessments and corresponding environmental and resettlement action plans in connection with the carrying out of the project.
A total of 102 households were affected in connection with the rehabilitation of the two informal settlements and the rehabilitation of the Julius Nyerere Av.
Achieved: A total of 102 families were compensated. Of these, 55 had to be resettled (the resettlement of 50 families has already been completed and the remaining five are still pending).
D.7 Financial support for the construction of the Michafutene Cemetery.
Construction of the cemetery and access road was completed.
Achieved: The cemetery is now operational.
E. Metropolitan Development
E.1 Financial support was provided for: improvements in CMM’s planning, operations, and monitoring of solid waste management; financing of solid waste collection and disposal services for CMM through declining operating subsidies for contracted collection based on the MMDP I sustainability strategy already under implementation; carrying out of education campaigns, events, and associated communication services in support of improved municipal sanitation and solid waste management; and developing studies, plans, and projects to ensure the environmental sustainability of solid waste management in the Maputo metropolitan area.
Between 2011 and 2016 there was a 36% increase in the number of tons of collected solid waste as a result of the increase in service coverage.
Achieved – Coverage of solid waste collection increased from 25% (before the start of PROMAPUTO I), to 66% at the beginning of PROMAPUTO II, to 100% coverage in the contiguous districts of Maputo at the end of 2016.
The number of people in urban areas provided with access to regular solid waste collection increased from 730,000 to 1,137,000, equivalent to a 56 percent increase between 2010 and 2016.
It is important to note that revenue from the cleaning fee covers 54 percent of the costs of all collection contracts; thus full cost recovery has not yet been achieved.
The municipality approved an increase of 30% of the solid waste collection tariff since January 2015, and a reduction from 15% to 5% in the commission paid to the Electricity Utility Company for collecting it - all this contributing to close the financial sustainability gap of waste management.
The Solid Waste Commission is operational and its strategies are under implementation.
E.2 Financial support was provided for development of a master plan for transit and transport across the Maputo metropolitan area, and implementation of management improvement interventions and targeted investments in the municipality and across the Maputo metropolitan area; establishment and consolidation of a municipal transport and transit directorate to be located in CMM; and strengthening the administrative and technical capacities of CMM’s traffic control room.
The Metropolitan Transit and Transport Commission (MTTC) is operational.
Elaboration and approval in 2013 of the Master Plan for Mobility and Transportation (financed by JICA).
Elaboration of the Management Model of the Integrated Transportation System for the Metropolitan Area, as well as financing mechanisms.
Achieved – A metropolitan perspective has been adopted for the provision of priority urban services (i.e., transport and solid waste collection).
29
Annex 3. Economic and Financial Analysis
This annex presents the economic and financial evaluation of the interventions (works and activities) implemented under the Maputo Municipal Development Program II. The project was the second phase of the Bank-financed Maputo Municipal Development Program, whose long-term objective was to strengthen the capacity of the CCM to finance, manage, and maintain urban services and infrastructure. The specific objective of this project was to improve the delivery and sustainability of priority municipal services in Maputo Municipality. Based on this objective, this evaluation examined the impact that the implemented interventions had on the economic development of Maputo city and its inhabitants.
Most of the activities and works foreseen under the five components designed at appraisal (A. Institutional Development; B. Financial Sustainability; C. Urban Planning; D. Urban Infrastructure; and E. Metropolitan Development) were in line with what was expected. However, some interventions, notably the improvements of the two informal neighborhoods of George Dimitrov, and Chamanculo C, were not yet defined at appraisal.
At time of appraisal, the economic analysis was conducted for the roads and maintenance investment under the Urban Infrastructure Component D. Expected works of Av. Julius Nyerere and rehabilitation of seven critical segments of the road network were evaluated. At that time, the evaluation was complemented with the financial analysis of the interventions under the Financial Sustainability Component B and the Solid Waste Collection service under the Metropolitan Development Component E.
This evaluation followed the same approach as at appraisal, but also went beyond and examined the economic efficiency of the neighborhood improvement investments in George Dimitrov and Chamanculo C that had not yet been defined at appraisal. It also made some adjustment to better comply with the guidelines of the World Bank for this kind of project. As during appraisal, Cost-Benefit Analysis (CBA) was used for urban infrastructure investments; and financial analyses was used for the financial sustainability and solid waste management activities. The method used for measuring the benefits varied according to the type of intervention. For the roads under component D, travel time saving was used; and for slum upgrading, property appreciation was applied. The same discount rate of 12% used at appraisal was applied. The evaluation was based on actual achievements and actual costs and compared with those expected at time of appraisal. The costs in nominal prices were transformed to 2010 prices, to eliminate currency fluctuation and make them comparable to those foreseen at appraisal.
Costs of Investment
At time of appraisal in 2010, the foreseen cost of investment was US$ 105M, from which US$ 8M were unallocated. the actual cost was US$ 115.5M, 10 percent higher than expected. The gap was wider in some components, such as urban infrastructure component, that presented 34% higher cost than expected; while others such as institutional development and financial sustainability, showed about 24% and 35% lower costs than expected.
30
Table A3. 1. Expected and Actual (Nominal prices) Investment Cost
(million US$) PADACTUAL
(Nominal prices) Actual/PADA. Institutional Development 12.4 9.4 76%B. Financial Sustainability 4.6 3.0 65%C. Urban Planning 15.2 13.4 88%D. Urban Infrastructure 38.1 51.2 134%E. Metropolitan Development 26.7 38.5 144% Unallocated 8.0 - TOTAL 105.0 115.5 110%
The differences between expected and actual costs are explained by several reasons, such as: a) currency fluctuation, especially important in Mozambique, that experienced 41% inflation during implementation period, variation in the exchange rate, which made the local currency appreciate and depreciate against the USD, as well as fluctuation of the XDR-US$; b) some interventions, such as slum upgrading were not included at appraisal, yet they were implemented; and c) and activities were adjusted along the implementation to better achieve the targets.
For this evaluation, actual investment costs expressed in nominal prices, were transformed to 2010 prices, to make them comparable with those expected at appraisal. For doing this the cost of each intervention was broken down per currency and date of occurrence. This is important as the disbursements of the loan were in USD, while the counterpart funds were in the local currency, the Metical. The disbursements were affected by the exchange rate; while the counterpart funds were affected by inflation. Their impact is different as follows: a) depreciation of the Metical against the USD, helped the project, as the Maputo city received more money in metical for the same amount of USD; appreciation of the Metical against the USD did the contrary and so it was disadvantageous to the city as it did receive less money for the same amount of USD16; and b) inflation means an increase in price of the goods, which negatively affected the project.
Nominal prices were transformed to 2010 prices as follows: a) disbursements in USD were transformed to Metical using the exchange rate at time of disbursement and then transformed to 2010 USD using the exchange rate at time of appraisal; and b) counterpart funds were transformed to 2010 prices deflecting the amount by the 2010 price index at the time of payment and then transformed to 2010 USD applying the exchange rate at time of appraisal.
From the time of the appraisal (2010) to the end of the project (December 2016), the inflation was 41%. The exchange rate went from MT 34: 1 USD to MT 75:1USD, yet it varied widely during the period (see figure below). From 2010 to 2014 the metical appreciated up to 18% in 2012, and then started depreciating, although by the end of 2014 it still showed 8% appreciation compared to 2010 level. From 2015 onwards, the depreciation continued to reach MT 75 to 1 USD at the end of 2016, or 120% depreciation since the time of appraisal.
16 This evaluation did not measure the impact of exchange rate variations servicing the debt.
31
Figure A3. 1. Actual Cost of Investment, Exchange Rate, and CPI.
60% of the IDA funds were used by the end of 2014 and so they were affected by the appreciation of the Metical. The 40% remnant were affected by the depreciation. In total, IDA financed 42 percent of the investment costs; CCM similar amount, and the GOM funded 15 percent.
Table A3.2. Actual Cost (Nominal Prices) of Investment per Source of FinancingActual Costs Total Per Year
(nominal prices) (000 US$) Share2011 to Dec
2013 2014 2015 2016 IDA17 48,843 42% 23,120 6,207 6,892 12,623 CMM 49,724 43% 19,566 7,570 12,143 10,446 GOM 16,933 15% 11,008 432 5,384 109 Total 115,500 100% 53,694 14,208 24,420 23,178 Share per year Total 2013 2014 2015 2016IDA 100% 47% 13% 14% 26%CMM 100% 39% 15% 24% 21%GOM 100% 65% 3% 32% 1%Total 100% 46% 12% 21% 20%
Results of the cost analysis show that actual investment costs at 2010 prices were just 2 percent higher than expected.
17 The figures do not match exactly to the date disbursements as these correspond to the date of usage of the funds.
32
Table A3. 3. Expected and Actual (Nominal and 2010 prices) Investment Cost ACTUAL 2010 prices
(million US$) PAD Million US$ Actual/PADA. Institutional Development 12.4 9.2 75%B. Financial Sustainability 4.6 2.8 60%C. Urban Planning 15.2 15.0 98%D. Urban Infrastructure 38.1 45.9 120%E. Metropolitan Development 26.7 34.7 130% Unallocated 8.0 TOTAL 105.0 107.5 102%
The costs expressed at 2010 prices were used in this evaluation.
Benefits of Interventions
A summary of the benefits attained with the intervention is as follows:
Table A3. 4. Interventions and BenefitsInterventions Benefits
A. Institutional Development
a) Improvement of services provided by CCM by the reduction in average processing times for various licenses (business, transportation, construction) and for issuing land-use rights.
b) Enhanced transparency and accountability
B. Financial Sustainability
a) Municipality’s own revenue increased and especially collected revenue from property tax, improving its fiscal balance.
b) Improved financial planning and contracting after procurement process.
C. Urban Planning
George Dimitrov
Residents improved their quality of life. Accessibility to neighborhoods improved, recreational areas were available, as well as public restroom. Conditions for students at elementary school improved; social and community life improved with more facilities to gather. go to an improved school.
Chamanculo C
Residents improved their quality of life. Accessibility to neighborhoods improved, especially with the rehabilitation of the Amaral Matos Ave, which is the main access to the neighborhood. Flooding decreased.
D. Urban Infrastructure Investment and Maintenance
Rehabilitation of Julius Nyerere Ave. a) Reduction in travel time b) Mitigation of the flooding and erosion risk in areas along the Julius Nyerere Ave.
Rehabilitation road network Reduction of travel time and better traveling conditions Construction of Michafutene Cemetery The Cemetery is operationalE. Metropolitan Development
Solid Waste Management 100% of households are covered by the solid waste collection service
Master Plan for Transit and transport CCM has better tool for planning the transport sector.
33

All components, but component A (institutional development) were evaluated. Specific interventions were selected for each component as those more representative and from which information was available. The cost of the interventions included in the evaluation corresponded to 64% of the total cost. The other interventions were not evaluated either because there was not information, or because the benefits were qualitative and could not be measured.
Table A3. 5. Components and Interventions Included in this evaluation (million US$) 2010 prices % of total costB. Financial Sustainability 2.8 C. Urban Planning C.2. Neighborhood Improvement Methodologies Informal Settlement 3.3 George Dimitrov 3.0Chamanculo C 0.5 D. Urban Infrastructure Rehabilitation of Julius Neyerere Ave. 23.2E. Metropolitan Development Solid Waste Management 32.4 TOTAL 65.2 64%
The benefits were measured using different approaches according to the specific intervention. Economic benefits were measured for road interventions under Component D and integrated neighborhood improvement interventions under Component C. Financial benefits were measured for the Financial Sustainability under Component B, and for the Solid Waste Management under Component E.
Economic benefits of road interventions were measured through the travel time savings approach, which brings along reduction in vehicle operating costs. Economic benefits of integrated neighborhood improvement interventions were measured through property appreciation. Financial benefits were measured as the increase in collecting revenue.
Rehabilitation of the Julius Nyerere Ave.
This intervention consisted of rehabilitation of 4km of the Julius Nyerere Ave. The works included drainage, repairs of concrete sidewalks, repair of existing pavement and paving and broadening a small dirt road section into a proper/full urban road. The Julius Nyerere Ave is one of the major avenues in Maputo and this section had been closed to traffic for 16 years after it was severely damaged in the floods of 2000. This section of the Ave links the center of the city with important outlying areas which are residential, industrial and commercial, and it offers a shorter exit route to the northeast of the city. The Master Plan of Urban transport conducted by Nikon-Koei in March 2014, identified the Av. Julius Nyerere as one of the roads with heavy traffic.
This intervention not only brought benefits related to transportation, but also those related to risk mitigation for floods and erosion in some of the areas along the rehabilitated section. The works included a comprehensive drainage system that brought slope stabilization benefiting residents in the area, who frequently suffered flooding and problems associated to fissures and cracks on the ground caused by heavy rains. Additionally, the installation of traffic lights will bring important benefits for pedestrians,
34
avoiding traffic accidents and deaths. In Maputo, traffic accidents occur regularly; accidents involving drivers and pedestrians are common, sometimes resulting in pedestrian casualty. An educational campaign is in place to show to pedestrian the benefits of following the traffic signs to cross the avenue at the right time.
There were two important benefits from this intervention: a) the reduction in travel time; and b) the reduction of flooding along the road. Unfortunately, no information was available to measure the benefits associated with the reduction of the probability of having the area flooded. Consequently, the works were evaluated as a regular transport intervention, and so the estimated benefits did not account for all benefits attained and results are under the lower side.
The benefits were measured as the value of travel time saved when the road was rehabilitated. In the case of the repaired section, the reduction of time occurred when this section opened to the traffic after being closed for so long. Previously, the traffic was diverted to alternate routes, which meant more distance traveled and more time spent to get to the same destination.
The benefits were related to the savings of travel time, which bring savings on the value of time and reduction of vehicle operation. To estimate the benefits, the following information was used: a) daily traffic count before and after the project; b) average travel time before and after the project; c) value of time, and d) vehicle operating cost.
Daily traffic count. For the without project scenario, the information of daily traffic was based on figures used at appraisal per alternate route used for diverting traffic. The traffic was counted on March 2010 according to type of vehicle. For the with project scenario, the figure was obtained from the Master Plan of Urban Transport conducted by Nikon Koei in March 2014 and corroborated with figures from the Direction of Transportation and Traffic of the CMM in August 2016 conducted at time that the implementation of traffic lights was being studied.
The traffic count at time of appraisal was measured in specific points of the alternate routes. It showed that the number of vehicles per day using these routes was in the range of 16,000 and 32,000. The average was approximately 23,000 vehicles per day. The PAD did not present information of how many of these vehicles would be using the Av. Julius Nyerere when it opened for traffic after rehabilitation. It is expected that some of these vehicles would keep using the alternate routes and never had to use the Av. Julius Neyere. Therefore, the traffic to be included in the evaluation had to be lower than 23,000 vehicles per day, yet no accurate figure was found in the PAD to be used for the without project scenario.
Table A3. 6. Daily Traffic before Rehabilitation of Julius Nyerere Av in alternate routes
Category of Vehicles
BusesSemi-
collectiveLight
Vehicle Trucks TotalInformation from the PAD At time of Appraisal Alternative 1 7,738 10,676 2,749 1,858 23,021 Alternative 2 14,667 10,661 3,762 2,545 31,635 Alternative 3 7,324 5,304 1,879 1,272 15,779
35
In 2014, a Master Plan of Urban Transport was conducted. In the study, the traffic was counted along the Ave. Julius Nyerere, and results showed that 18,353 vehicles crossed the avenue daily. This figure was corroborated with the count made by CCM in 2016 when conducting the study of traffic lights to install along the Ave. This figure was used for the with project scenario.
For the without project scenario, given that the PAD did not provide much information of number of vehicles at that time, the traffic count used for the with project scenario was discounted by the 3% annual growth rate of the traffic as projected by the Master Plan. The number of vehicles obtained for the without project scenario was 16,140 vehicles, which corresponded to about 70% of the average number of vehicles in the alternatives presented in the PAD.
Table A3. 7. Daily Traffic before and After the Rehabilitation of Julius Nyerere AvCategory of Vehicles
BusesSemi-
collectiveLight
Vehicle Trucks TotalAlternative 3 7,324 5,304 1,879 1,272 15,779Information from Master PlanAfter Intervention 540 7,029 9,649 1,135 18,353Before Intervention (discounting by 3% annually) 475 6,181 8,485 998 16,140
Average Time Traveled before and after the intervention. At time of the appraisal, it was estimated the distance of each alternative was 4.6 km, 7.4 km, and 18.8 km respectively. The time spent in each alternative was 45 min, 25 min, and 45 minutes respectively. The average distance traveled before the project was 9 km using alternate routes, and the average time spent in these routes was 36 min, caused by heavy traffic and narrow streets After the road was rehabilitated the distance reduced to 4 km and the time to 7 minutes.
The value of time was based on figures presented in the Master Plan of Urban Transport, which was estimated based on the per capita GDP in Maputo city. Nikon Koei used the growth rate of the per-capita GDP to project the value of time up to 2035. This evaluation uses the value of time for 2012 transformed to 2010 prices. No increase was included in the evaluation, even though it will increase with the GDP growth rate. However, given the uncertainties of growth rate on the economy, this evaluation kept the value constant to work on the conservative side.
Table A3. 8. Value of Time 2010 2012 2018 2020 2035
Value of time (US$/hour): 2013 Prices 0.78 1.07 1.17 2.05 2010 price (used in this evaluation) 0.65 0.65 0.65 0.65 0.65Source: 2013 prices, from Master Plan of Urban Transport. 2010 price Own calculation
Vehicle Operating Cost was estimated based on figures of price of vehicle, lifetime, and distance traveled per category of vehicle presented in the PAD. The price of gas was estimated based on fuel efficiency and price of gas at 2010 prices.
36
Table A3. 9. Vehicle Operating cost
BusesSemi-
collectiveLight
Vehicle Trucks (US$/km): 0.38 0.29 0.21 0.22 Source: Own calculation based on information presented in the PAD
Total Benefits. The flow of benefits was estimated for 20-year period for both scenarios: with and without intervention. Incremental benefit corresponded to the difference between both scenarios. Results show that present value of benefits is US$ 42 million, 42% of which corresponds to value of time saved, and 58% to vehicle operating costs.
Table A3. 10. Present Value of Benefits (000 US$)PV of flows (000 US$) %
Travel Time Savings Value of Travel time saved 17,851 42% Vehicle Operating Cost saved 24,242 58%Total Benefits 42,093 100%
The costs of the intervention at 2010 prices was US$ 23.2 million. The maintenance cost was based on actual costs of the CMM per km for this category of road, which was US$ 90,000 per km or US$ 360,000 per year for all 4km rehabilitated.
Table A3. 11. Cost of the Rehabilitation of the Julius Nyerere Road (000 US$)2010 Prices 2011 to Dec 2013 2014 2015 2016 Total
Actual investment cost 9,694 1,049 1,739 10,706 23,189
Results of the evaluation show positive benefits with 49% internal rate of return and net benefits as high as US$ 27 million. The intervention would still show positive benefits when only one category of benefits were included. If only the value of time saved were included the intervention show 25% return. On the other hand, if only the savings of vehicle operating cost were included, the intervention shows 32% return.
Table A3. 12. Results of the economic evaluation of the Julius Nyerere Ave.Net Benefit(000 US$)
IRR%
Benefits Included:1. Value of time and vehicle operating costs 27,365 49%
2. Only Value of Time Saving 3,123 25%3. Only Vehicle Operating Cost saved 9,514 32%
Sensitivity analysis shows that: a) if savings on operating costs are not included, the benefits of reduced time can decrease by 20% and still the intervention would be viable; b) if savings of time are not included, benefits from operating costs can reduce up to 41% and still the intervention would yield positive returns; c) if both benefits are included, they can reduce by 66% and the intervention would still show positive results.
37
The results are reassuring given that other significant benefits, such as the reduction of flooding and erosion in some areas along the rehabilitated road, was not included. Other benefits not included in the evaluation that may come along and will bring additional positive impact for the residents, are inter-alia the following: a) lower road accidents when pedestrians use appropriately the traffic signs installed; b) property appreciation of the houses along the road; and c) economic development in the area.
Actual Results compared to what was expected at appraisal. Actual net benefits obtained by the intervention were about three times higher than expected at appraisal. The internal rate of return is far higher than the discount rate used for the evaluation (12%) which makes the intervention very sound, Moreover, during implementation, the World Bank changed the guidelines for the discount rate to use for evaluation of this type of projects, and recommended a discount rate of about 6%. Results of this intervention are even better when the 6% discount rate is used for comparison. The internal rate of return found during appraisal was in the range of 500% to 1000%, which seems not realistic.
Table A3. 13. Expected and Actual Results of the Rehabilitation of Julius Nyerere Ave.
Net Benefit(million US$)
IRR %
Expected Results at PAD From 1.5 to 10.4 million 500%-1,000%Actual Benefits 27.4 49%
Slum Upgrading.
Two interventions improved the neighborhoods of George Dimitrov and Chamanculo C. In George Dimitrov, the intervention included: road paving, water drainage, playground, soccer field, construction of community center, school requalification, creation of sales tent, construction of cafeteria, construction of public toilets, and rehabilitation of the primary school. The intervention was complemented with environmental and social activities, such as: tree planting, introduction of municipal waste collection route, initiation of recycling system, teacher training, HIV and health awareness campaigns, microfinance, and cultural events. A local development plan was implemented to promote the social and economic development of the neighborhood and the civil education of its residents. In Chamanculo C, the intervention consisted of drainage, improvement of internal and external accessibility (roads), and preliminary work for the future regularization of land use rights. The rehabilitation of the Amaral Matos Avenue was a central component of this intervention, as it constitutes the main access to the neighborhood. These interventions were aligned/coordinated with other neighborhood upgrading interventions funded by other donors, notably Italy.
George Dimitrov Neighborhood is in the peri-urban area of Maputo, with an extension of 480 ha and 40,972 inhabitants. This neighborhood was chosen as a pilot area to test the methodology of integrated upgrading of informal settlements. The pilot area for the intervention consisted of 100 ha, 12,867 inhabitants, 1,360 plots18. The main problems that faced the neighborhood before the intervention were: lack of solid waste collection;
18 Each plot may have various constructions, such as: main house, an outside kitchen, a latrine, etc. It is estimated that there are about 2,200 constructions in the 1,360 plots benefited. This evaluation worked with number of plots as the property appreciation was measured per plot.
38
poor public lightening; poor water and electricity infrastructure; and high level of crime, consumption of alcohol and drugs.
Chamanculo C neighborhood has an extension of 138 ha, population of 26,179 inhabitants, which corresponds to 5,429 households. The area of intervention directly benefited 2,600 properties. The main problems that this area faced before the intervention were: regular flooding, and lack of connectivity internally and externally.
The interventions in both neighborhoods significantly improved the quality of life of their residents. Impacting the housing, the neighborhoods, and the individuals. The works implemented in George Dimitrov corresponded to an integral intervention and included not only infrastructure, but also social, economic, and environmental activities. In Chamanculo C the intervention consisted mostly of infrastructure, yet the works targeted the main problems related to flooding, and lack of connectivity.
In George Dimitrov, the benefits of housing are reflected in housing appreciation, ownership and titling, access to credit and infrastructure, and housing investment by owners. The neighborhood upgraded are reflected mostly in improvement of urban services. Sometimes in this type of project, the benefits are also seen on security, violence, and social and urban integration; which could be seen later in George Dimitrov. Individual outcomes will be likely reflected in income gains, health improvement, human capital, child development, and labor market insertion. In Chamanculo C, the benefits of housing are seeing in property’s appreciation; the neighborhood upgraded is seeing in improvement of connectivity and lower risk of flooding; the individuals will likely see income gains and health improvement due to better access to labor markets and better quality of life in the neighborhood.
For this evaluation, the approach selected to measure the benefits was the appreciation of properties, which was just one of many benefits attained from the interventions. The results are consequently on the conservative side. The best way to use properties’ appreciation is through hedonic price studies, which measure the relationship between the property value and the specific improvement attained from the intervention. Unfortunately, for this evaluation no hedonic price study was conducted; instead, properties’ values were used, taken information from the analytical work carried out during the study of Urban Poverty in Maputo by the World Bank e 201719.
From the World Bank study (2017) the following information was used: a) average price per dwelling in both neighborhoods at time when the project started; b) detailed information of prices of houses in 2016, differentiated per building materials (durable and non-durable) and size (number of rooms) for the whole district, and for the specific area intervened.
Prices before the project. Information of property values showed that in 2012, the average price of a house in George Dimitrov was MT 270,000, and in Chamanculo C. MT 210,000.
Prices by the end of the project. Properties values in 2016 were taken from two sources: a) CMM in the report of the evaluation of the project20, presents the properties’ appreciation in the areas of intervention in the two neighborhoods; and b) the data collected and analyzed by the World Bank’s team during elaboration of the study of 19 The World Bank. Report ACS22437. Republic of Mozambique. Maputo Urban Poverty and Inclusive Growth20 CCM. Evaluation of PROMAPUTO II. 2017
39

Urban Poverty in Maputo. The information used from this data corresponds to the properties’ value in the neighborhoods where the interventions were implemented. The values correspond to the average of the whole neighborhood and not only in the specific areas of intervention.
Prices in the Area Intervened. According to CCM, the properties in the areas where interventions were implememnted, appreciated differently according to distance of the intervention. In George Dimitrov the appreciation ranged from 8 times, three, and twice, respectively for those very close (or inside) the area, medium distance, and little farther. In Chamanculo C the appreciation was 6 times, 3, and twice according to distance. This meant that properties increased by 375% in average in George Dimitrov, and by 260% in average in Chamanculo.
Table A3.14. 2016 Average Price per House in the Areas Intervened.Area Intervened inGeorge Dimitrov
Area Intervened in Chamanculo C
Properties Value Properties Value # MT # MTLocation to the area: Very close 341 (25%) 2,160,000 260 (10%) 1,260,000 Medium distance 341 (25% 810,000 520 (20%) 630,000 Farther distance 680 (50%) 540,000 1,820 (70%) 420,000 Total 1,362 1,012,500 2,600 546,000
This increase cannot be attributed exclusively to the intervention, as other factors may have played a role in the variation of price, such as variation in the real estate market and inflation during the same period. Unfortunately, there was not information of the magnitude of the increase due to the intervention. Additional information was examined to find a more appropriate value.
To measure the possible variation of the real estate market, information of property values for the entire neighborhoods was obtained and results show that in average the price of a house in 2016 was MT 769,600 in George Dimitrov and MT 473,200 in Chamanculo C. That means that property value in the districts increased by 185% and 125% respectively from 2012 to 2016, which correspond to lower increases than those presented at intervened areas.
Table A3.15. 2016 Average price per house in the entire neighborhoods.George Dimitrov Chamanculo C
Properties values 2016 Value % of Houses Value % of Houses MT Total MT Total Durable Materials One Room 960,000 20% 375,000 20% Two Rooms 1,200,000 40% 750,000 50% Three or more Room 2,400,000 40% 1,254,000 30% Average Price 1,632,000 100% 23% 826,200 100% 20% Non-Durable Materials One Room 320,000 60% 200,000 50% Two Rooms 400,000 20% 400,000 30% Three or more Room 1,200,000 20% 825,000 20% Average Price 512,000 100% 77% 385,000 100% 80%
40
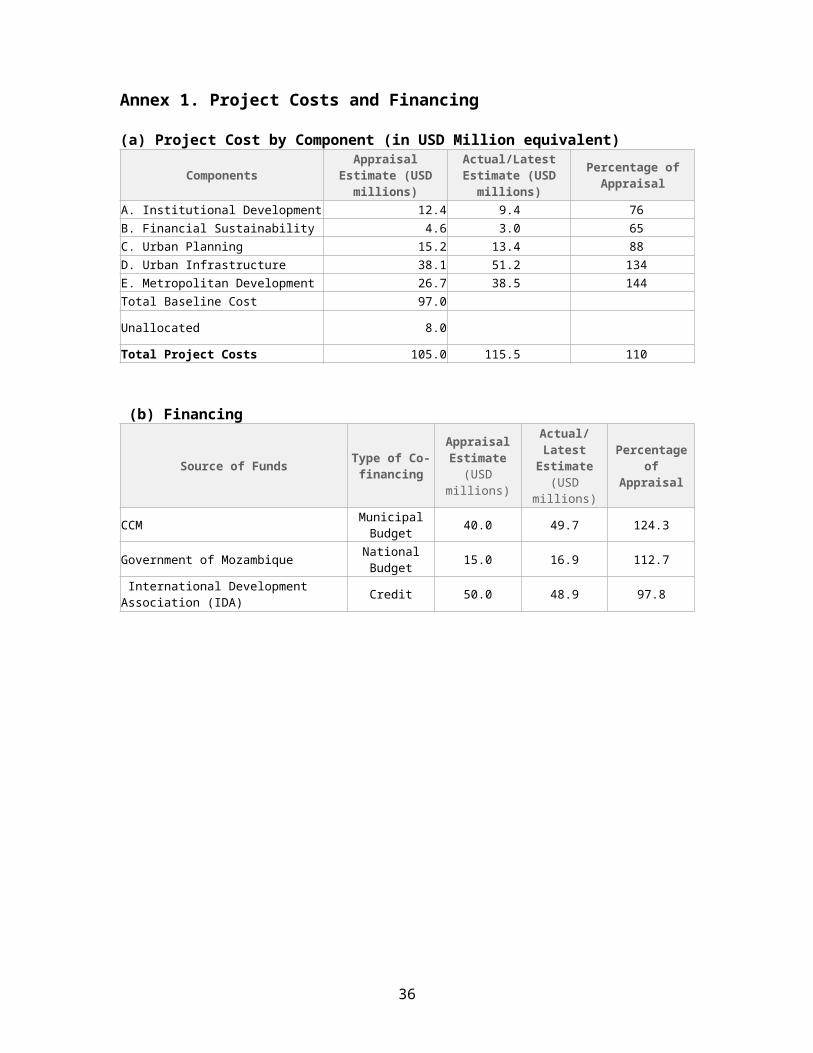
Total Average 769,600 100% 473,240 100%The difference between the price in the whole neighborhood and the area intervened in the same neighborhood, it is likely to be attributable to the intervention. This difference was used in this evaluation to estimate the benefits.
All the prices were transformed to 2010. After adjusting the prices with inflation, results show that even though the properties in the pilot area of George Dimitrov increased in real terms by 275%, the increase due to the intervention was about half of it, that is 124%. In Chamanculo C, the total increase in real terms was 160%, yet the increase attributed to the intervention was 56%.
Table A3.16. 2016 Appreciation of properties attributed to the intervention.George Dimitrov Chamanculo C
Average Price of house Average Price of house
MT 2010
pricesUS$ 2010
pricesMT 2010
prices US$ 2010
prices Entire Neighborhood When implementation started 217,099 6,385 164,446 4,837 By the end of implementation 544,273 16,008 334,682 9,844 Total Appreciation 327,173 9,623 170,236 5,007 Increase of property value 151% 104% 104% Only in the rehabilitated area When implementation started 217,099 6,385 164,446 4,837 By the end of implementation 814,122 23,945 427,561 12,575 Total Appreciation 597,023 17,559 263,114 7,739 Increase of property value 275% 160%Increase due to intervention Total Appreciation 269,849 7,937 92,878 2,732 Increase of property value 124% 56%
The benefits from property appreciation were applied to direct beneficiaries from interventions, that is, 1.360 in George Dimitrov, and 2,600 in Chamanculo C. Results show that the interventions yielded significant benefits. The intervention in George Dimitrov shows a net present value of benefit of US$ 4.3 million and economic rate of return of 125%. The intervention in Chamanculo C presents net benefit of US$ 4.1 million and 299% economic rate of return. Both interventions show net present value of benefit of US$ 8.4 million and 169% return.
The interventions still show sound results if all the costs of the activities carried out under Sub-Component C2 that is, the methodology for planning informal settlement, which was applied to the pilots. Both interventions show net benefits of US$ 5 million and 68% return.
Table A3. 17. Actual Results of the Economic evaluation of Slum UpgradingGeorge Dimitrov Chamanculo C Both interventions
NPV Benefit
(000 US$)ERR %
NPV Benefit
(000 US$)ERR %
Net Benefit
(000 US$)ERR %
Investment included:1. Only cost of
rehabilitation 4,323 125% 4,110 299% 8,434 169%2. Also, the cost of 3,314 74% 2,183 61% 5,497 68%
41

methodology informal settlements
The evaluation was complemented with a sensitivity analysis which tested the minimum increase in the property value needed to make the interventions economically worthy. Results show if property appreciation in George Dimitrov had been just 35% and 10% in Chamanculo C, the intervention of rehabilitation of these areas would have shown positive benefits and return of 16%. If the cost of the methodology of planning informal settlement were included, a 50% appreciation of the properties in George Dimitrov would be needed and 35% appreciation in Chamanculo.
Table A3. 18. Minimum increase of property value needed to make the intervention of Slum Upgrading economically viable.
Both Interventions George Dimitrov Chamanculo CNPV
Benefit(000 US$)
ERR %
Minimum Increase Minimum increase
%US$ per house % US$ per house
Investment included:1. Only cost of
rehabilitation 75 16% 35% 2,235 10% 4842. Also, the cost of
methodology informal settlements 243 17% 50% 3,193 35% 1,693
Results are assuring, as the increase of property value could have been far smaller than they were, and still the intervention would have shown economic benefits. The evaluation assumed that property appreciation captured most of the benefits associated with better quality of life given by: improved neighborhood, reduction of flooding, better accessibility, better basic services. Moreover, other benefits could apply as well and they are not accounted for, such as: health improvement, better social integration, potentially reduction of use of drugs and violence, etc.
Financial Sustainability.
The objective of this component was to increase financial sustainability of the CCM, raising revenues and rationalizing expenditure with the support of an integrated financial management system. Three indicators were chosen to measure the achievement of the objective; the first as a PDO indicator and the other two as intermediate indicators: a) cumulative annual real increase in revenue from IPRA (Property Tax); b) percent of own-source revenues vs recurrent expenditures; and c) recurrent expenditures spent annually on roads operation and maintenance.
A financial analysis conducted during appraisal showed that benefits from the increase of property taxes made the intervention financially viable with 79% return.
The evaluation for this ICR enhanced the financial analysis and examined not only the net benefits generated from the increase of property taxes, but also from net benefits generated by a more sustainable financial position of the CCM.
Financial situation of the City of Maputo. At time of the appraisal the financial situation of the city of Maputo showed that current expenditures were just covered by own revenues, yet there was no room for any capital expenditure or any uncertainty. The project was needed to strengthen the financial position of the City of Maputo.
42
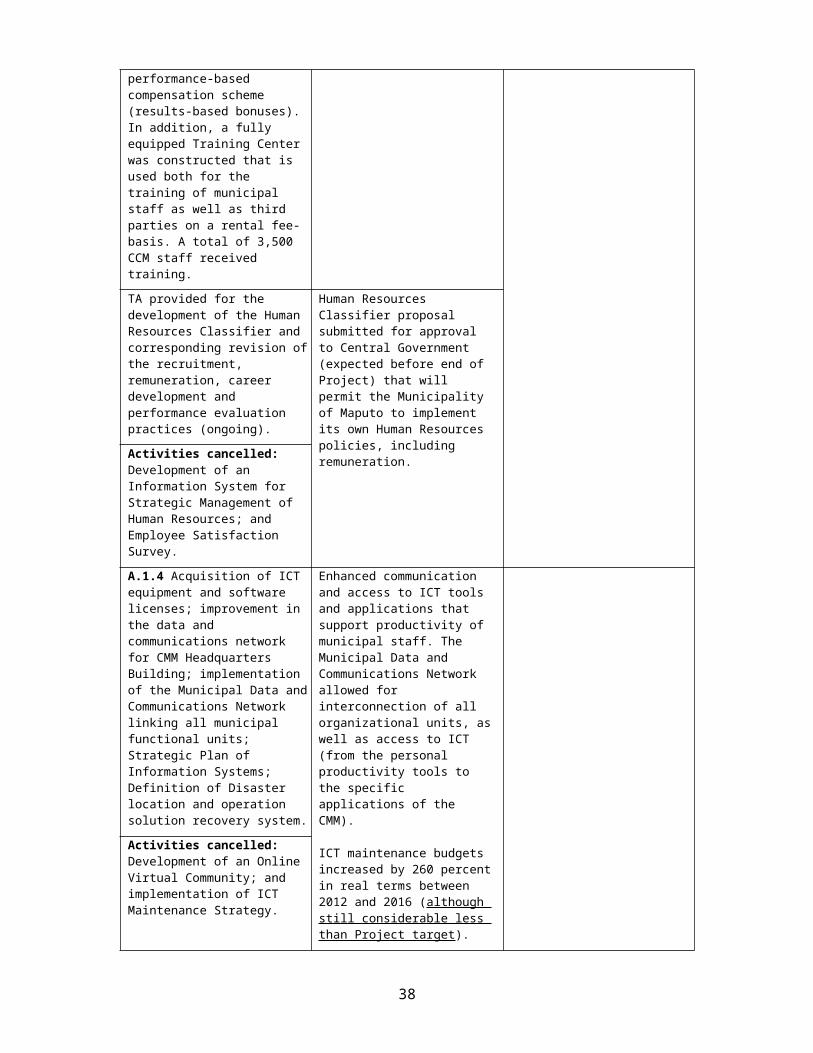
Financial results improved significantly since the start of implementation. By 2015, own revenues increased fourfold, while the increase of current expenditures was half of it. In 2015 there was a change in the accounting system. Expenses previously registered as expenditures of capital, such as technical assistance and supervision of works, were transferred to current expenses. This change made the 2015 current expenses increased by 2.5 times compared to 2014.
Table A3.19. Fiscal Situation of the City of Maputo 2009, 2012-2016.
(000 MT) 2009
Baseline 2012 2013 2014 2015 2016Own Revenues Property Tax 35,913 86,045 110,613 137,752 176,757 169,799 Other tax revenues 116,003 243,755 281,191 338,211 351,181 504,334 Licenses and Permits - 167,141 201,773 225,641 268,068 281,977 Fee/Service charge 69,537 101,587 142,331 159,242 208,813 186,835 Others 187,501 347,091 426,134 497,167 521,839 528,306
Total Own Revenues 408,954 945,619 1,162,042 1,358,0131,526,65
8 1,671,25
0 Expenses Personnel costs 230,110 401,272 435,978 478,496 527,617 590,791 Goods and services 73,254 146,180 148,159 169,022 163,958 232,959 TA, supervision, 747,884 492,578 Others 89,362 42,934 42,836 33,979 85,157 54,065
Total Expenses 392,727 590,385 626,973 681,4981,524,61
6 1,370,39
3 Current Surplus 16,227 355,233 535,069 676,515 2,042 300,857
Other Revenues Governmental Transfer 72,361 565,358 691,159 731,972 785,580 250,764 Loans - - - 5,524 5,546 7,503 Others 26,365 46,170 26,606 75,655 53,852 72,596 Total other revenues 98,726 611,528 717,765 813,151 844,977 330,862 Capital Expenditures 419,091 826,423 1,228,523 1,254,811 850,317 774,103
Primary Balance (320,365) (214,895) (510,758) (441,659) (5,339) (443,241
)
Net Cash Flow (304,138) 140,338 24,312 234,855 (3,297) (142,38
4)
The cost recovery indicator improved from 96% at appraisal to 190% in 2016 (without including the changes made in the accounting system). Even if all expenditures were included, total expenditures were totally covered by own revenues as expected at appraisal. In 2016 cost recovery ratio was 122%. These results show improvements far higher than expected at appraisal.
Table A3. 20 Financial Indicators of the financial statements of CCM 2012-2016
43

Benefits attained by implementing activities in Component B surpassed by far the expected targets. The sound fiscal position of CCM allows to have better financial planning and improve the services provided to its population.
Increase of Property Tax Revenue. During implementation, the billing process of property tax was reinforced. The cadaster improved, the charges reviewed, and the revenue collection rate increased. In 2009, the revenue collected from property tax was MT 36 million and by 2016, this figure was about five times higher. The number of properties billed and pay their billed more than double, and the collection efficiency rate increased to 96% in 2016.
Table A3. 21. Property Tax Revenues and 2012-2016.
Million MT2009
Baseline 2012 2013 2014 2015 2016Property Tax Nominal prices 35.91 86.0 110.6 137.8 176.8 169.8 2010 Prices 35.91 69.2 86.6 103.5 129.4 120.1 Cumulative increase 93% 141% 188% 260% 234%Number of Properties: Properties that pay 18,000 N/A 21,540 29,108 32,390 40,684 Billed properties N/A N/A 34,161 37,453 39,279 42,302 % Collected/billed N/A N/A 63% 78% 82% 96%
The revenue from property tax was transformed to 2010 prices for this evaluation. The revenue was projected for the without project scenario, assuming that values when the project started implementation remained constant; while for the with project scenario, actual values were included and remained constant after 2016. The flows were projected for five more years.
The investment cost included in the evaluation corresponded to the whole cost of component B, which in 2010 prices was US$ 2.67 million, or about MT 90 million.
Results are reassuring as benefits are four times higher than the costs and the return is 55%. Expected return at appraisal was 79% as higher number of properties were expected to be billed at the end of the project.
Financial Sustainability. The financial analysis was complemented including as benefits the surplus obtained when current expenditures are subtracted from own revenues. The
44
Indicators 2009 2012 2013 2014 2015 2016
Cum2012-2016
Actual Figures Increase of own revenues 131% 23% 17% 12% 9% 309% Increase own expenditure 50% 6% 9% 124% -10% 249% % of recurrent expenses covered by own revenues 96% 160% 185% 199% 100% 122% % of recurrent expenses (w/o expenses of TA, supervision, and SWM) covered by own revenues 96% 160% 185% 199% 197% 190%Expected% of recurrent expenses covered by own revenues 96% 97% 98% 99% 100%
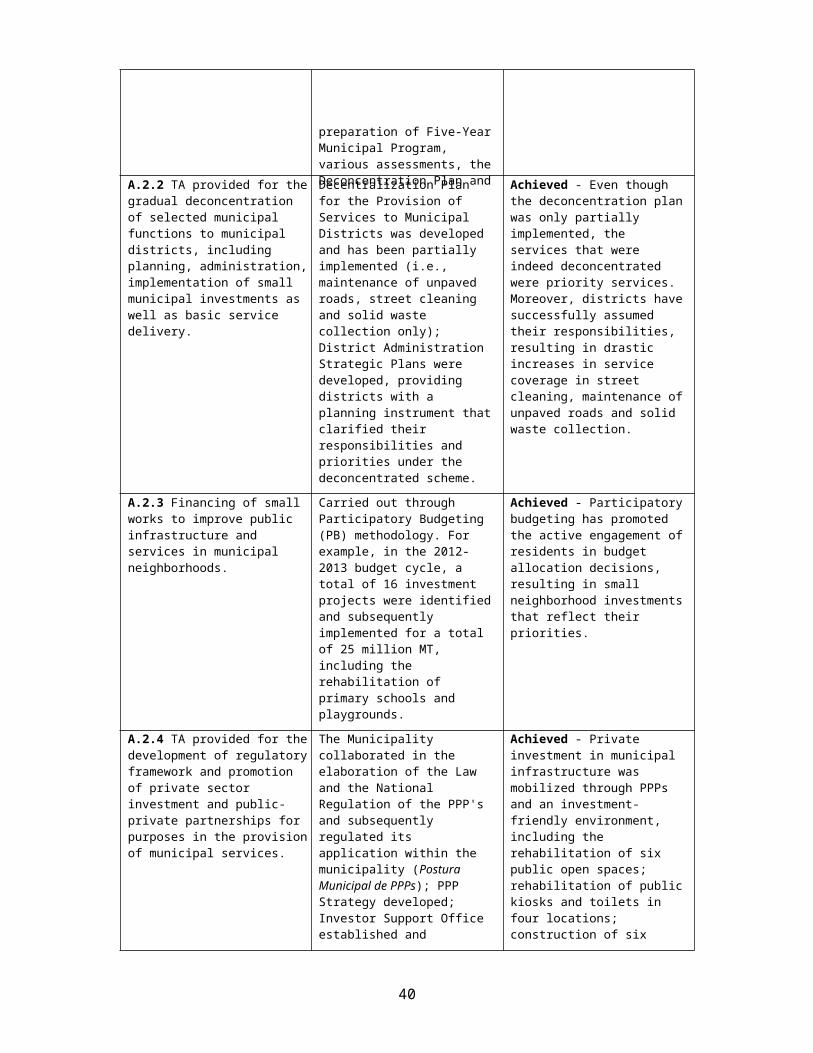
without project scenario was built keeping constant the surplus level at time of appraisal. The with project scenario was built including benefits obtained from increase of actual surplus (at 2010 price).
Results are reassuring as the intervention yielded an internal rate of return as high as 136%. Present value of net benefits was US$ 24 million, which could even pay for investment of other interventions not evaluated, such as Component A. Institutional Development, whose investment was about US$ 9 million.
Table A3. 22. Results of the Financial Analysis of Financial SustainabilitySummary Present Value (000 US$) Expected (000 USD) Costs Benefit Net Benefit IRR PADIncrease of Property Tax 4,556 9,729 5,173 46% 79%Increase of operating surplus: 4,556 29,040 24,485 136%
Solid Waste Management.
This intervention belongs to the Component E, Metropolitan Development, which aimed to improve selected municipal services: solid waste management, and urban transport. Under the Solid Waste Management Sub-component, the designed activities focused primarily on solid waste collection.
The financial analysis conducted at appraisal showed that by 2015 the solid waste collection service would achieve full cost recovery. However, when the new landfill started operation expected by 2015, the service would increase the operational cost, delaying the target of cost recovery to 2017. The Expected increase of coverage was 95% by 2015 from the 66% in 2010, this corresponded to a beneficiary population of 1.1 million.
To improve financial sustainability, it was envisioned at appraisal, two 20-percent increases to put in place by July 2013 and by December 2015. During implementation, the CCM changes the strategy, to get the same results. In early 2015, it applied a single 30 percent increase of the SW collection service fee; a 10 percent reduction (from 15 to 5 percent) of the commission paid to Mozambique’s Electric Company for collecting the SW service fee in the electricity bill; and it increased the revenue from additional commercial clients of SW collection service. These measures were expected to reach the sustainability target of 40 percent increase of revenue.
Actual revenues during the implementation period were transformed to 2010 prices and the real increase was indeed 41%.
Table A3. 23. Revenues and beneficiaries from Solid Waste 2010-2016.Million MT 2010 2012 2013 2014 2015 2016Revenues Solid Waste Nominal prices 84.6 99.7 102.9 112.9 146.4 149.1 2010 Prices 74.8 80.1 80.6 84.8 107.2 105.5 Cumulative increase 7% 8% 13% 43% 41%Beneficiaries: Population served 729,264 1,136,568
45
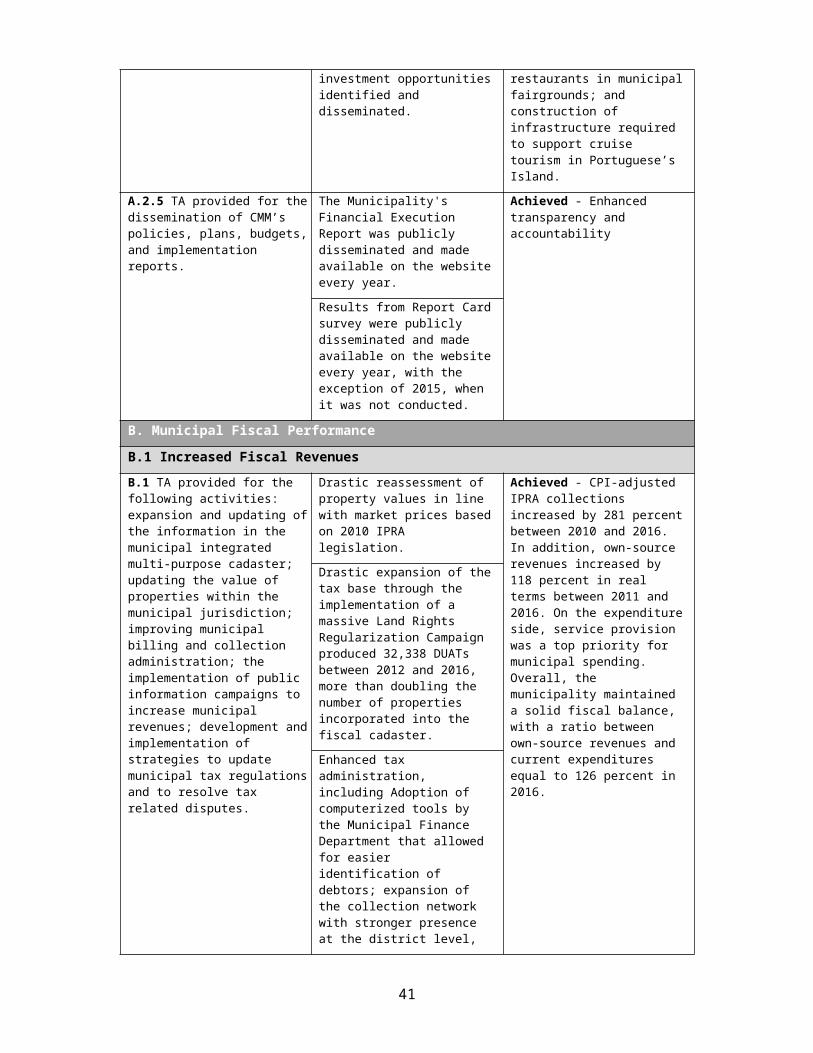
Households (estimate) 121,544 189,428 Monthly fee/hh 58 66
Source: 2012-2016 Financial Information provided by CCM. (2010 was estimated based on 2009 figureHouseholds were estimated using 6 people per household
Actual coverage of 100% and number of beneficiaries of 1,136,568 surpassed the targets of 95% and 1,004545 respectively.
Table A3. 24. Cost coverage Solid Waste 2012-2016.Million MT 2010 2012 2013 2014 2015 2016Revenues Solid Waste Nominal prices 84.6 99.7 102.9 112.9 146.4 149.1 2010 Prices 74.8 80.1 80.6 84.8 107.2 105.5 Expenditures Solid Waste Nominal prices 147.4 122.9 180.2 274.2 2010 Prices 147.4 92.3 132.0 193.9 Operating margin Nominal prices (62.8) (10.0) (33.8) (125.0) 2010 Prices (72.6) (7.5) (24.8) (88.4)Operating Cost Coverage 51% 92% 81% 54%
Source: Revenues Financial Information provided by CCM. Expenditures. In 2010 from the PAD. 2013: from the previous financial evaluation. 2014-2016 from CMM report.
Despite that revenues increased in real terms by 41% as it was expected at appraisal, financial sustainability was not attained as expected. Cost coverage of 100% expected by 2015 (without the operation of the landfill) was not achieved; instead, actual cost recovery was just 54% in 2016, which was similar to the level existent at time of appraisal.
The financial analysis was complemented comparing how the situation had been if the project had not been implemented, to the actual situation, in which the project was implemented. This allowed to examine if CCM is better off with the intervention than without it, despite of not having achieved all the targets.
The scenarios with and without intervention were built for a 10-year period. For the with project scenario, the flow of costs corresponded to actual costs of investment and operating costs. The flow of revenues to actual revenues. All the prices were transformed to 2010 prices. The without project scenario was built as if revenues and operating costs at time of appraisal remained.
Table A3. 25. Results of the Financial Analysis of Solid Waste ManagementPresent Value (000 US$)
Costs Benefit Net BenefitIncluding only O&M 4,967 5,060 93
Results show that the CCM is better off with the intervention that without it. When only operating costs are included, results show that the present value of incremental benefit for
46
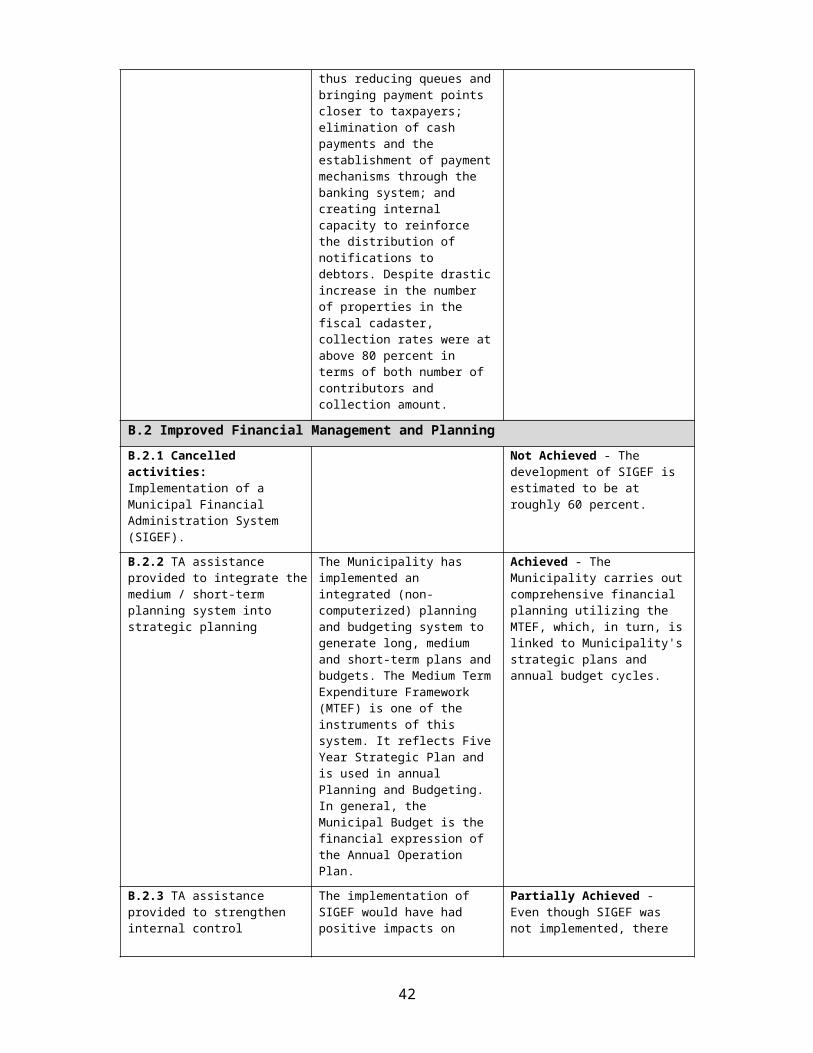
the CCM is US$ 93,000. Moreover, the residents are enjoying better quality of live as they do not face with solid waste in the neighborhood.
Investment cost of this intervention was US$ 30.8 million at 2010 prices, however, given that the investment was funded by the GoM it is not included as a financial payment of the CCM.
47
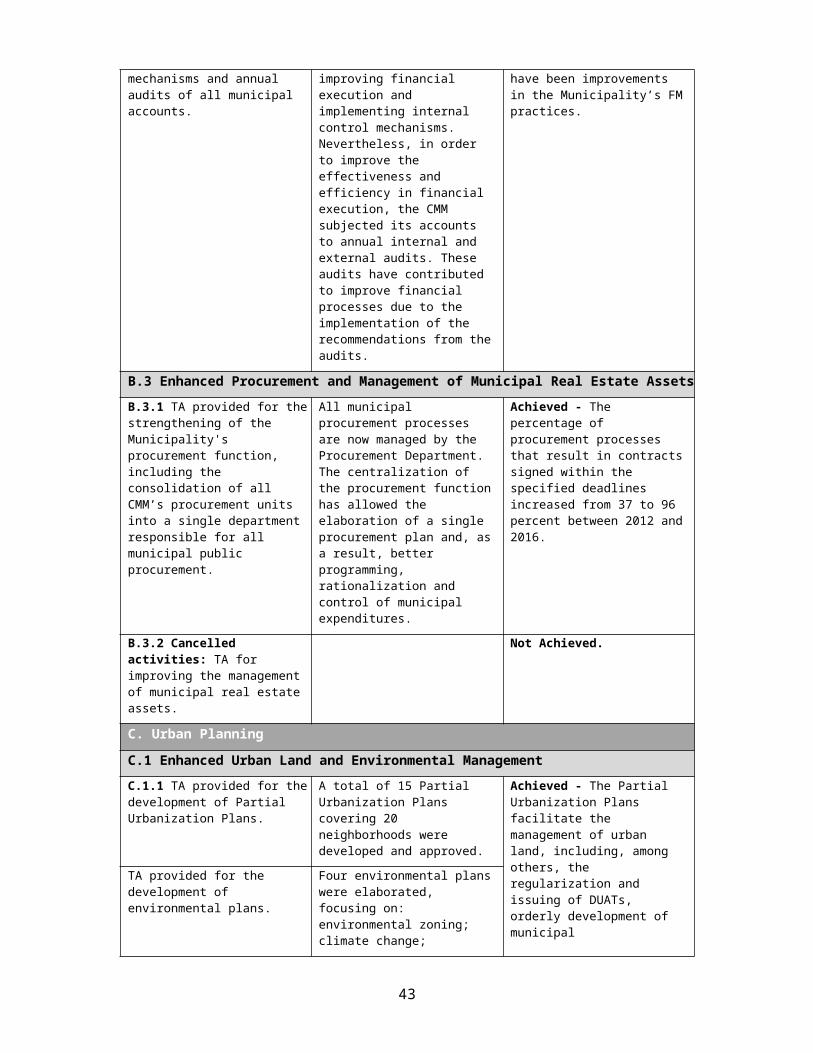
Annex 4. Bank Lending and Implementation Support/Supervision Processes
(a) Task Team members
Names Title Unit Responsibility/Specialty
Lending Ali Alwahti Urban Specialist GSU10
Eduardo Brito Senior Counsel LEGAF-HIS
Cary Anne Cadman Senior Environmental Specialist GEN2A Antonio Laquene Chamuco Senior Procurement Specialist GGO07 Nilsa Ricardina Joao Come Program Assistant AFCS2 Louis Helling HQ Consultant ST GSU13
Katherine Kuper Sr Urban Spec. AFTU1 - HIS
Suzanne F. Morris Senior Finance Officer CTRFC-His
Jose N. Nascimento HQ Consultant ST GSURR
Jonathan Nyamukapa Sr Financial Management Specia AFTME - HIS
Rildo Santos Language Program Assistant GSU13Supervision/ICRAndre Herzog Task Team Leader GSU13Antonio Laquene Chamuco Senior Procurement Specialist GGO07Elvis Teodoro Bernado Langa Financial Management Specialist GGO26Arlete Quiteria Comissario Nkamate Program Assistant AFCS2
Kristine Schwebach Safeguards Specialist GSU07Paulo Jorge Temba Sithoe Environmental Specialist GEN01Rildo Santos Language Program Assistant GSU19Cary Anne Cadman Sr. Forestry Specialist AFTSGLuz Meza-Bartrina Senior Counsel LEGAFUri Raich Sr. Urban Specialist GSU12
Paula Dias Pini Sr. Urban Development Specialist AFTU1-HIS
Bontje Marie Zangerling Urban Specialist GSU19Maria Angelica Sotomayor Lead Urban Specialist GWAGPCheikh A. T. Sagna Senior Social Development Specialist GSU01
Julia Anna Oberreiter Jr Professional Officer GURDR-HIS
Louis Helling Consultant AFTU1-HIS
Sebastian Alexander Muller Consultant AFTU1_HIS
Jose N. Nascimento Consultant GSURRAdrienne Acioly Urban Development Consultant GSU13Augusto Mendonca Environment Specialist Consultant GEN04Peter Cohen Social Safeguards Consultant OPSPF
48
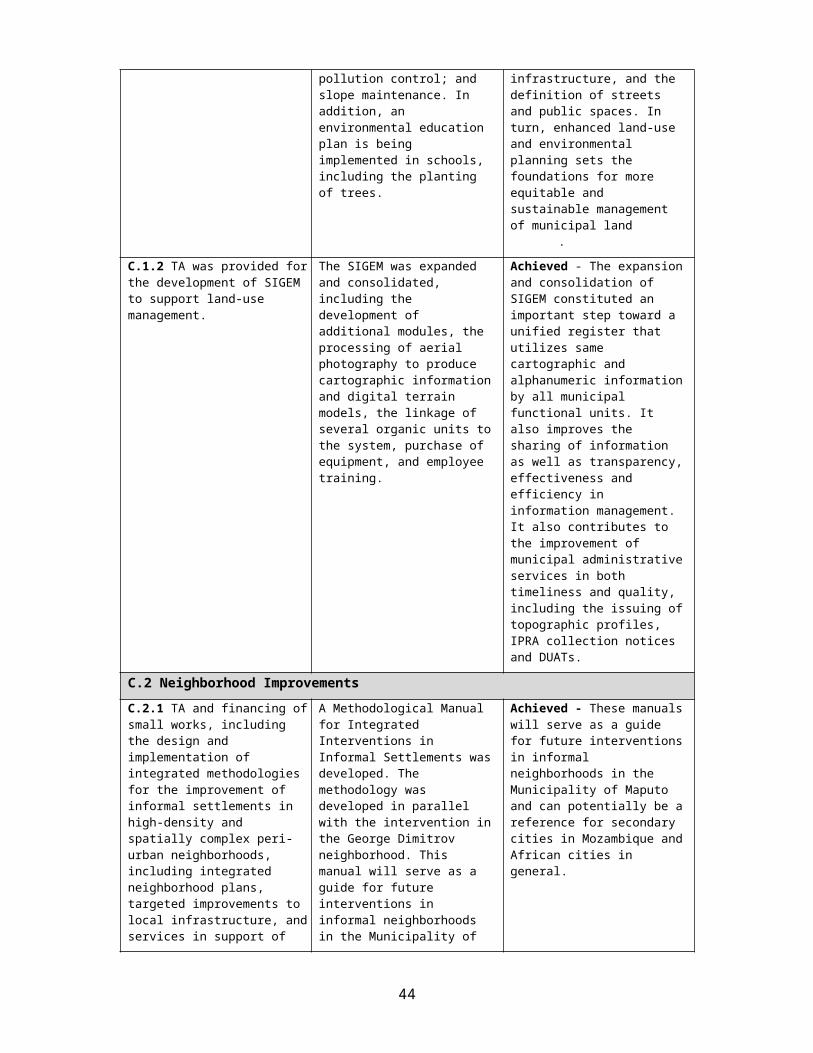
Wagner Hawthorne Drainage Consultant GWASO
(b) Staff Time and Cost
Stage of Project CycleStaff Time and Cost (Bank Budget Only)
No. of staff weeks USD Thousands (including travel and consultant costs)
LendingFY09 6.78 24.37FY10 47.13 270.01FY11 11.65 49.65Total: 65.56 344.03
Supervision/ICRFY11 18.63 121.40FY12 17.19 81.08FY13 14.60 113.77FY14 43.05 202.59FY15 28.55 209.71FY16 13.90 125.37FY17 20.09 199.93Total: 155.41 1,053.85
49
Annex 5. Summary of Borrower's ICR and/or Comments on Draft ICR
50
51
CONSELHO MUNICIPAL DE MAPUTO
PROGRAMA DE DESENVOLVIMENTO MUNICIPAL DE MAPUTO – FASE 2 (PROMAPUTO II)
RELATÓRIO DE AVALIAÇÃO INTERNA DO
PROMAPUTO II - ICR
Aprovado na 9a Sessão Ordinária do CMM (Realizada no Dia 21 de Março de 2017)
Maputo, 21 de Março de 2017
O Programa. O Programa de Desenvolvimento Municipal de Maputo – Fase 2, abreviadamente PROMAPUTO II, constitui a segunda fase de um Empréstimo de Programa Adaptável (APL) que compreende um total de 80 milhões de USD (30 milhões de USD para PROMAPUTO I e 50 milhões de USD para PROMAPUTO II). Além do crédito da IDA, o PROMAPUTO II foi desenhado prevendo financiamento por fundos do Governo Central (15 milhões de USD) e contribuições próprias do Conselho Municipal de Maputo (CMM) (40 milhões de USD), com um custo total de 105 milhões de USD.
O Objectivo de Desenvolvimento do PROMAPUTO II (Project Development Objective – PDO) é melhorar a oferta e sustentabilidade dos serviços municipais prioritários no Município de Maputo. PROMAPUTO II iniciou (efectividade) em 1 de Janeiro de 2011, com data inicial de término 31.12.2015. Durante o ano de 2015, a data de término foi alterada para 31.12.2016. Posteriormente, durante o ano de 2016 a data de término foi prorrogada para 30.06.2017.
Avaliação Interna. Este Relatório apresenta a Avaliação Interna do CMM ao Programa. O seu objectivo é apresentar informação de avaliação do desempenho do Programa, analisando 4 variáveis chave: eficácia, relevância, apropriação e sustentabilidade e tendo em consideração os resultados definidos no Project Appraisal Document (PAD) e reestruturações do Programa (2013 e 2015).
Obrigações Legais. Foram cumpridas as obrigações legais estabelecidas no Acordo de Financiamento.
Eficácia. Até final de 2016 tinham sido alcançados 6 dos 7 indicadores obrigatórios do Programa (indicadores de PDO), alcançados 3 dos 4 indicadores intermédios, bem como 10 dos 12 indicadores complementares. Destacam-se ganhos importantes, nomeadamente: a) o aumento real cumulativo das receitas do IPRA (383% em 2015 comparado com a meta de 288%); b) a emissão de 31,760 títulos de DUAT`s (comparado com a meta de 30,800); c) o aumento da cobertura de RSU de 66% (PAD) para 100% em 2016 permitindo ultrapassar a meta do indicador no de pessoas com acesso regular aos serviços de recolha de RSU.
O único indicador obrigatório não alcançado é percepção dos utilizadores sobre a
52
qualidade dos serviços públicos prestados pelo CMM que tinha uma meta de 3.0 numa escala de 1 a 5 e foi alcançada a pontuação 2.7 nesta escala. Relativamente aos indicadores intermédios apenas não foi alcançado o tempo médio para a concessão das licenças de construção que, apesar da melhoria registada entre 2015 e 2016 não se conseguiu alcançar a meta de 45 dias. despesa.
A nível das actividades das Componentes, registam-se os seguintes principais alcances e não alcances:
Componente A. Os principais alcances são: a) a implementação do Sistema de Planeamento e Monitoria Estratégica e operacional integrada no CMM; b) o investimento de mais de 600 mil USD na capacitação de gestores e técnicos; c) a realização regular do report card como importante instrumento de monitoria do desempenho municipal; e) a reabilitação de infra-estruturas das Administrações dos Distritos Municipais foi relevante pois proporcionou melhores condições de trabalho e de atendimento aos munícipes.
Componente B. Os principais alcances são: a) o alargamento do cadastro do IPRA de 20 mil para 40 mil registos; b) a reavaliação dos imóveis – ambos com impactos significativos no aumento da receita do IPRA. O principal não alcance é a não implementação de um Sistema de Gestão Financeira, que constitui ainda um desafio importante para a gestão do CMM.
Componente C. Os principais alcances são: a) o desenvolvimento e a implementação de uma metodologia integrada de requalificação de assentamentos informais; b) a requalificação do Bairro George Dimitrov; c) as obras de pavimentação e drenagem no Bairro de Chamanculo C d) o desenvolvimento e a realização do 1o Mestrado em Planeamento e Gestão de Assentamentos
Informais no País; e) o desenvolvimento e implementação da metodologia de regularização massiva de DUAT`s resultando em mais de 31 mil DUAT`s atribuidos; f) a continuação do desenvolvimento do Sistema Integrado de Gestão Municipal (SIGEM) como ferramenta de suporte a processos de planeamento e gestão do solo urbano.
Componente D. Os principais alcances são: a) a reabilitação da 1a Fase da Av. Julius Nyerere; b) a manutenção de 700 km de estradas de terra e 114 km de estradas pavimentadas – com benefícios importantes para melhorar a transitabilidade e fluidez de tráfego em várias vias; c) a construção do Cemitério de Michafutene (Marracuene). Nesta Componente, o principal não alcance (tendo em conta o planeado) foi a não realização da 2a fase da reabilitação da Av. Julius Nyerere.
Componente E Sub-componente E1: Os principais alcances a nível da gestão dos resíduos sólidos foram: a) o aumento da cobertura de 66% (2010) para 100%; b) o aumento da quantidade de RSU recolhida e depositada na lixeira: de 650 ton/dia (2010) para cerca de 885 ton/dia no final de 2016; c) o custeio integral dos serviços de RSU pelo CMM (com recurso à receita da taxa de limpeza e a outras receitas municipais) a partir de meados do ano de 2013. No âmbito da implementação da Estratégia Metropolitana para os serviços de RSU, apesar do atraso em comparação com o cronograma estabelecido no PAD, estão em curso actividades associadas à construção do Aterro Sanitário.
53
Componente E Sub-componente E2: O principal alcance foi a elaboração e a aprovação do Plano Director de Mobilidade e Transporte para a área metropolitana. A abordagem metropolitana para o transporte é um conceito que está a evoluir no enquadramento legal e institucional, sendo que já se prevê a criação formal da Agência Metropolitana de Transportes em 2017 pelo Conselho de Ministros. Esta Agência será responsável pela implementação do Plano Director e respectivos Projectos estruturantes.
Execução orçamental. Até 31 de Dezembro de 2016 foram desembolsados 108.9 milhões de USD sendo 45.99 milhões de USD comparticipação do CMM (5.99 milhões acima do compromisso do Acordo de Crédito), 16.8 milhões de USD comparticipação do Governo Central (1.8 milhões acima do compromisso do Acordo de Crédito), e 46 milhões de USD do IDA. As contribuições do CMM e do Governo Central foram totalmente cumpridas.
Com relação ao IDA, destacam-se as seguintes principais constatações gerais: a) face às flutuações do USD/SDR (Special Drawing Right) e Metical/USD, o valor total de fundos IDA passou a ser 49.1 milhões de USD (reflectindo uma perda de cerca de 900 mil USD); b) deste montante global, o valor comprometido até 10 de Fevereiro de 2017 é de 47.7 milhões de USD (96,5%); c) nesta data (10 de Fevereiro), o valor disponível para novos compromissos é de 1.3 milhões de USD.
Ainda com relação aos fundos IDA, destaca-se o facto de a Componente D ter absorvido cerca de 20 milhões de USD (40% do valor total) como resultado do aumento do valor investido na reabilitação da 1a fase da Av. Julius Nyerere em comparação com o estimado no PAD.
Relevância. O PROMAPUTO II manteve-se relevante desde o seu desenho até ao presente momento pelo facto de: a) a demanda, as expectativas e a pressão por serviços no Município de Maputo ter aumentado; b) as receitas próprias do CMM continuarem a estar aquém do necessário para melhorar a abrangência e a qualidade da prestação de serviços municipais aos 1.2 milhões de habitantes. Assim, destacam-se intervenções relevantes: a) o aumento das receitas próprias do CMM com particular incidência no IPRA; b) a requalificação de assentamentos informais incluindo drenagem com impactos positivos na qualidade de vida dos residentes; c) a atribuição de mais de 31 mil títulos de DUAT`s o que elimina a insegurança dos munícipes no direito de utilização dos seus talhões; d) o fortalecimento de competências no planeamento e gestão de assentamentos informais, problemática prevalecente no Município; e) a reabilitação da 1a fase da Av. Julius Nyerere que trouxe benefícios na redução do tempo de viagem, de 45 para 7 minutos, entre a Praça do Destacamento Feminino e a Praça dos Combatentes e na redução no desgaste para um potencial de 70 mil viaturas diariamente; f) a reabilitação de estradas de terra e pavimentadas com impactos positivos na transitabilidade e fluidez de tráfego; g) a construção de um cemitério (Michafutene em Marracuene) face ao recente esgotamento e fecho do maior cemitério da Cidade (Lhanguene); h) a institucionalização e priorização pelo CMM do pagamento da recolha de RSU com fundos próprios.
Value for Money (valor acrescentado) e Sustentabilidade. A análise económico-financeira de 3 intervenções (seguindo a abordagem realizada no PAD) indica que:
. a) A obra da reabilitação da 1a Fase da Av. Julius Nyerere tem um potencial de value
54

for money (valor acrescentado numa análise custo-benefício) de 35.2 milhões de USD (acima dos 16.6 milhões de USD previstos no PAD) em função do aumento significativo do parque de viaturas da Cidade;
. b) O investimento feito na Componente B produziu uma receita líquida positiva. O valor de receita adicional depois de pagar o investimento na Componente B foi de cerca de 14.3 Milhões de USD; ou seja, o diferencial positivo na colecta dos impostos e taxas em virtude da intervenção supriu o investimento na Componente B em 14.3 milhões de USD. Este número ficou, no entanto, abaixo dos de 22 Milhões de USD estimados no PAD;
. c) Em termos da sustentabilidade dos serviços de recolha e deposição de RSU, em 2016 a receita de taxa de limpeza foi de 2.4 milhões de USD, valor abaixo do estimado dos 8.5 milhões de USD estimados no PAD. Por consequência, em 2016 a receita de taxa de limpeza cobriu apenas 54% dos custos de recolha e deposição de RSU, abaixo dos 97% previstos no PAD. No entanto, apesar de os serviços de recolha e deposição de RSU não serem totalmente cobertos pela taxa de limpeza, é de ressaltar que desde meados de 2013, o CMM assume integralmente o pagamento dos serviços de RSU no Município – um ganho significativo face ao cenário anterior a 2010.
Para além dos três aspectos acima, é de referir que o CMM registou um aumento significativo das suas receitas próprias muito por conta do aumento nominal de 460% na colecta do IPRA. A continuidade do investimento com vista ao incremento da colecta do IPRA (como maior fonte de receita própria) será relevante para fortalecer a sustentabilidade financeira do Município.
A análise complementar de value for money estima benefícios económicos muito positivos resultantes de outras obras: Regularização Massiva de DUAT`s - RMD (213 milhões de USD); requalificação do Bairro George Dimitrov (16,2 milhões de USD); reabilitação da Av. Amaral Matos no Chamanculo C (9,8 milhões de USD); benefícios económicos adicionais da reabilitação da 1a fase da Av. Julius Nyerere associados com a valorização de talhões próximos (49,1 milhões de USD); aumento da cobertura dos serviços de RSU (35,7 milhões de USD). Para além de benefícios económicos quantificáveis, estão ilustrados no relatório outros benefícios económicos não fàcilmente quantificáveis.
Apropriação. Determinados processos desenvolvidos durante o PROMAPUTO II (ou produtos obtidos) têm um elevado nível de apropriação (com maior ou menor necessidade de Assistência Técnica para a sua continuidade), nomeadamente: a) Report Card – cuja metodologia, importância e resultados foram apropriados pelo CMM; b) PPP`s – que são cada vez mais uma opção considerada na operação de determinados serviços municipais; c) Processos e metodologias de alargamento do cadastro do IPRA – que estão bastante internalizados pelo CMM e têm um elevado potencial de continuidade; d) Planos Parciais de Urbanização e Planos de Pormenor – cuja importância é cada vez mais reconhecida sendo os produtos utilizados como instrumentos de gestão e ordenamento territorial.
Por outro lado, outros processos ou produtos – ainda que considerados relevantes pelo
55

CMM – terão mais desafios técnicos para a sua plena apropriação pelas unidades orgânicas, nomeadamente: a) Metodologia de planeamento estratégico e operacional – apesar dos ganhos obtidos na consolidação do sistema de planeamento, existe ainda esforço a realizar para uma completa apropriação de um paradigma de gestão por resultados no CMM; b) Gestão estratégica de Recursos Humanos – existem ainda o desafio da mudança de paradigma de uma administração do pessoal para uma abordagem mais abrangente focada para a gestão estratégica e desenvolvimento de recursos humanos; c) Implementação do cadastro unificado – que requererá ainda um esforço importante, mas que tem grande potencial para o incremento da receita do IPRA; d) Sistema integrado de gestão financeira – cuja implementação irá requerer ainda um elevado compromisso, priorização no investimento e esforço de apropriação por parte de todas as Unidades Orgânicas. Exemplos adicionais são apresentados em Secção específica deste Relatório.
Boas práticas e lições aprendidas. As principais boas práticas do desenho e da implementação do PROMAPUTO II são: a) a flexibilidade na alocação de fundos (nas sucessivas revisões ao orçamento do Programa) que permitiu focar em actividades relevantes e prioritárias; b) o apoio à sustentabilidade financeira do CMM; c) a redução gradual no financiamento aos resíduos sólidos e institucionalização da abordagem de terceirização dos serviços pelo CMM; d) o investimento em sistemas de informação; e) a experimentação de novas metodologias na área dos assentamentos informais.
Por outro lado, face às não implementações (ex: Sistema Integrado de Gestão Financeira - SIGEF, 2a fase da Av. Julius Nyerere) e constrangimentos enfrentados (atrasos de implementação e problemas de qualidade do 1o Empreiteiro da obra de reabilitação da Av. Julius Nyerere), as lições aprendidas para futuros Programas/Projectos são: a) necessidade de evitar uma larga abrangência de intervenção e ter mais foco programático; b) necessidade de reforçar a sustentabilidade da Assistência Técnica; c) necessidade de reforçar a monitoria de indicadores do Programa.
Avaliação geral dos três financiadores. O CMM faz uma avaliação satisfatória do desempenho do Banco Mundial ao longo da implementação do Programa com observações a considerar em futuros Programas/Projectos. O CMM faz uma avaliação altamente satisfatória ao Governo Central tendo em consideração o compromisso integral das comparticipações financeiras previstas até Novembro de 2015 (antes da data inicial de término do Programa). Com relação ao seu próprio desempenho, o CMM faz uma avaliação satisfatória tendo em consideração o balanço entre todos os ganhos obtidos e os não alcances já mencionados.
56

Annex 6. List of Supporting Documents
Independent Evaluation Group. 2013. Maputo Municipal Development Program I, ICR Review. Washington, DC: World Bank. (http://documents.worldbank.org/curated/en/236821474502981118/pdf/000020051-20140625155147.pdf)
Maputo Municipal Council. 2017. Relatório de avaliação interna do ProMaputo II. Maputo.
World Bank. 2017. Mozambique - Country partnership framework for the period FY17 - FY21. Washington, D.C.: World Bank Group.
———. 2010–17. Mozambique - Maputo Municipal Development Program II, Implementation Status Results Reports, Sequence 1–13. Washington, DC: World Bank.
———. 2012. Maputo Municipal Development Program I, Implementation Completion Report. Washington, DC: World Bank. (http://documents.worldbank.org/curated/en/548861468285902658/pdf/ICR22730P096330Official0Use0Only090.pdf)
———. 2010. Mozambique - Maputo Municipal Development Program II (MMDP I. Washington, DC: World Bank. (http://documents.worldbank.org/curated/en/416761468057840955/pdf/532850PAD0P1151Official0use0Only191.pdf)
———. 2006. Mozambique - Maputo Municipal Development Program I. Washington, DC: World Bank. (http://documents.worldbank.org/curated/en/909551468059080025/pdf/375350IDA1R20071000411.pdf )
----------. 2016. Restructuring Paper on a proposed Project Restructuring of Maputo Municipal Development Program II (MMDP II), Report No. RES25479. Washington, DC: World Bank (http://documents.worldbank.org/curated/en/730661485437985433/pdf/IL-RESDATA-EXT-P115217-11-16-2016-1479312284545.pdf)
List of People Interviewed during ICR Mission
Adelino Jame da Cruz – Director OSIDAlda Romão Saúte Saíde – Assessora de Planificação e MonitoriaMárcia de Oliveira – Assessora do Planeamento Urbano e Assentamentos InformaisAugusto Macie – Especialista de ProcurementCândido Quaresma – Oficial de ProgramaDomingas Benfica – Oficial de Gestão FinanceiraAdul Sacoor – consultor-facilitador da Avaliação Interna do CMMVíctor Fonseca – Vereador da Direcção Municipal de Infra-estruturasRodrigues Vidigal - Director da Direcção Municipal de Infra-estruturasLuís Nhaca – Vereador da Direcção Municipal de Planeamento Urbano e Meio AmbienteTeresa Tchissequere – Directora Adjunta da Direcção Municipal de Planeamento Urbano e Meio Ambiente e responsável pelo SIGEM Julião de Melo Júnior – Assistente do Vereador para o Projecto de Requalificação do Bairro
57
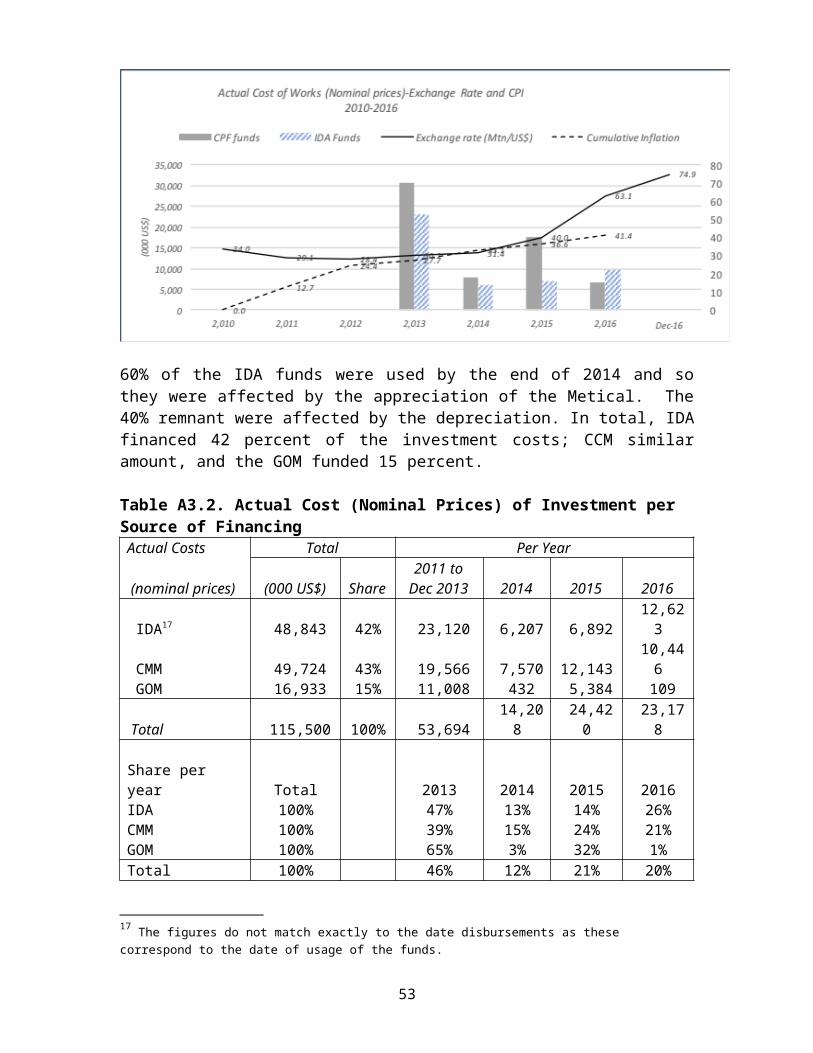
George DimitrovSílvia Cabrita – Assessora do Projecto de Requalificação do Chamanculo CRogério Nuvunga – Supervisor urbanístico ambientalJoão Sitoe – Engenheiro gestor das obras, representante da DMICélia Cumbe – Vereadora da Direcção Municipal das FinançasAnanias Couana – Director da Direcção Municipal das FinançasGraça Manguele – Directora Adjunta para Receita da da Direcção Municipal das FinançasFlorentino Ferreira – Vereador da Direcção Municipal de Salubridade e CemitériosAlbertina Tivane – Vereadora da Direcção Municipal dos Recursos HumanosArmando Novo – Director da Direcção Municipal dos Recursos HumanosJoão Matlombe – Vereador da Direcção Municipal dos Transportes e TrânsitoIsabel Vaz – Engenheira Civil da CONSULTECKemal Vaz – Verde AzulLuís Lage – Ex- Director da Faculdade de Arquitecura e Planeamento Físico – Universidade Eduardo Mondlane e docentre do curso de mestradoAna Anjos – Gestor do curso de Mestrado em Planeamento Físico e Assentamentos Informais na Faculdade de Arquitecura e Planeamento Físico – Universidade Eduardo MondlaneAna Oliveira – AFAPLANFerdinade Escova Adriano Escova – Gabriel CoutoFelisbela Materrula – Supervisora social da AVSI no Projecto de Requalificação do Chamanculo CÂngela Mabuiangue – Técnica social da AVSI no Projecto de Requalificação do Bairro George DimitrovIva Garrine - Técnica social da AVSI no Projecto de Requalificação do Bairro George DimitrovRodrigues Alexandre Lamussene – Chefe de Quarteirão, membro do Comité de acompanhamento do Projecto e Pbras e representante substitute do Secretário do Bairro Chamanculo COlívio Sidumo – Pai escola da Escola Primária Completa Unidade 29Xavier Chume – Professor da Escola Primária Completa Unidade 29 Emília Macha – Professora da Escola Primária Completa Unidade 29Djuma Sónia Miambo – Aluno da escola Primária Completa Unidade 29Estevão Machaíla - Secretário do Bairro George DimitrovGraça João Cuco - Vendedeira e beneficiária das barracas- piloto do Bairro George DimitrovHelena Dimande – membro da comissão de sáude no projecto de Desenvolvimento LocalBoaventura Chilambo - membro da comunidade do Bairro George DimitrovAntónio Fabião Busse - membro da comunidade do Bairro George Dimitrov
58

MAP
59

I N S E R T
M A P
H E R E
AFTER APPROVAL BY SENIOR GLOBAL PRACTICE DIRECTOR
AN ORIGINAL MAP OBTAINED FROM GSD MAP DESIGN UNIT
SHOULD BE INSERTED
MANUALLY IN HARD COPY
BEFORE SENDING A FINAL ICR TO THE PRINT SHOP.
NOTE: To obtain a map, please contact
the GSD Map Design Unit (Ext. 31482)
A minimum of a one week turnaround is required
60