Clojure in the Cloud Everett Toews Developer JavaOne Sept. 29, 12:30 pm.

ORIGINAL ARTICLE
Morphological and genomic comparisons of Hawaiian andJapanese Black-footed Albatrosses (Phoebastria nigripes)using double digest RADseq: implications for conservationElisa G. Dierickx,1,2,* Allison J. Shultz,1,* Fumio Sato,3 Takashi Hiraoka3 and Scott V. Edwards1
1 Department of Organismic and Evolutionary Biology and Museum of Comparative Zoology, Harvard University, Cambridge, MA, USA
2 Department of Zoology, University of Cambridge, Cambridge, UK
3 Yamashina Institute for Ornithology, Abiko, Japan
Keywords
Black-footed Albatross, conservation
genomics, double digest RADseq, gene flow,
integrative taxonomy, Izu-Torishima, Midway
Island, Phoebastria nigripes, population
differentiation, subspecies.
Correspondence
Scott V. Edwards, Department of Organismic
and Evolutionary Biology and Museum of
Comparative Zoology, Harvard University, 26
Oxford Street, Cambridge, MA 02138, USA.
Tel.: +1-617-3848082;
fax: +1-617-4955667;
e-mail: [email protected]
*These authors contributed equally to this
paper.
Received: 23 December 2014
Accepted: 14 April 2015
doi:10.1111/eva.12274
Abstract
Evaluating the genetic and demographic independence of populations of threa-
tened species is important for determining appropriate conservation measures,
but different technologies can yield different conclusions. Despite multiple stud-
ies, the taxonomic status and extent of gene flow between the main breeding
populations of Black-footed Albatross (Phoebastria nigripes), a Near-Threatened
philopatric seabird, are still controversial. Here, we employ double digest RADseq
to quantify the extent of genomewide divergence and gene flow in this species.
Our genomewide data set of 9760 loci containing 3455 single nucleotide poly-
morphisms yielded estimates of genetic diversity and gene flow that were gener-
ally robust across seven different filtering and sampling protocols and suggest a
low level of genomic variation (h per site = ~0.00002–0.00028), with estimates of
effective population size (Ne = ~500–15 881) falling far below current census
size. Genetic differentiation was small but detectable between Japan and Hawaii
(FST � 0.038–0.049), with no FST outliers. Additionally, using museum speci-
mens, we found that effect sizes of morphological differences by sex or popula-
tion rarely exceeded 4%. These patterns suggest that the Hawaiian and Japanese
populations exhibit small but significant differences and should be considered
separate management units, although the evolutionary and adaptive conse-
quences of this differentiation remain to be identified.
Introduction
Given limited resources for nature conservation, it is
important to develop criteria for the prioritization of spe-
cies protection efforts and a taxonomy that adequately
reflects underlying genetic diversity. The concepts of evolu-
tionary significant units (ESUs) and management units
(MUs) were proposed nearly 30 years ago (Ryder 1986) as
heuristics to guide such efforts. Definitions of the ESUs
and MUs vary depending on the biological and legislative
context, but in general, an ESU recognizes that the focal
population has been isolated in the past and is therefore
likely to possess distinct evolutionary potential. Additional
criteria for recognition of ESUs emphasize the history of
selection of genetic variation and the potential for future
adaptation (Crandall et al. 2000). By contrast, recognizing
MUs typically involves understanding the extent of allele
frequency differences and the importance of demographic
distinctness between units (Moritz 1994; Palsboll et al.
2007). Both concepts evolve as new methods for quantify-
ing neutral and adaptive genetic diversity and distinctness
in the study of natural populations.
Different types of genetic data can be used to determine
and delimit ESUs and MUs, each with its own set of advan-
tages and disadvantages. Each marker will estimate the
demographic history of that marker, and, as a result, find-
ings and implications for conservation may differ from
marker to marker (Fay and Wu 1999). Different markers,
whether organellar, sex-linked, or autosomal, reflect differ-
ent aspects of population history (Funk and Omland 2003;
Chan and Levin 2005; Toews and Brelsford 2012; Yaacov
et al. 2012). Additionally, different technologies yield
© 2015 The Authors. Evolutionary Applications published by John Wiley & Sons Ltd. This is an open access article under the terms of the Creative
Commons Attribution License, which permits use, distribution and reproduction in any medium, provided
the original work is properly cited.
1
Evolutionary Applications ISSN 1752-4571
Evolutionary Applications
markers of different types, such as linked sites for mtDNA
and nuclear DNA sequencing of the PCR era, dominant or
co-dominant fragments in methods such as AFLPs or mi-
crosatellites, or single nucleotide polymorphisms (SNPs) in
the case of next-generation sequencing methods such as
RADseq (Brumfield et al. 2002; Buburuzan et al. 2007;
Brito and Edwards 2009; Peterson et al. 2012). Although
not without controversy (Zink and Barrowclough 2008;
Edwards and Bensch 2009), the field of conservation genet-
ics and phylogeography is in general agreement that the
large numbers of loci available in the nuclear genome are
superior to the single locus provided by mtDNA in delimit-
ing species and populations for conservation and for esti-
mating historical population parameters with greater
precision with increasing numbers of loci (Felsenstein
2006; Carling and Brumfield 2007; McCormack et al. 2011;
Harris et al. 2014). Additionally, recent theory (Hedrick
2005; Jakobsson et al. 2013) as well as studies in nonmodel
species (Ryynanen et al. 2007; V€ali et al. 2008; Coates et al.
2009) and in humans (Rosenberg et al. 2002; Li et al.
2008) reveal different patterns of resolution by different
markers: for example, FST values between pairs of popula-
tions are often lower when based on microsatellites than
when based on sequence-based markers, with the latter bet-
ter reflecting population subdivision when it exists or being
less constrained due to heterozygosity or statistical effects.
Conservation genetics has adopted different methods for
assaying and analysing genetic variation, and has histori-
cally grappled with the different implications of each
method for discovering neutral or adaptive variation, as
well as optimal sampling schemes for studying endangered
populations. A recent approach that takes advantage of
next-generation sequencing technology is restriction site-
associated DNA sequencing (RADseq; Baird et al. 2008;
Etter et al. 2011; Narum et al. 2013) and its refinements
(Peterson et al. 2012), which use restriction enzymes to
digest throughout the genome and then sequence inwardly
from the cut sites of each fragment. RADseq offers a num-
ber of tangible advantages over other genotyping tech-
niques, making it a useful tool for delimiting ESUs and for
resolving conservation questions. The large number of
genotyped markers, usually in the thousands, reflects the
evolutionary history of the whole genome. Furthermore, it
does not require the design of species-specific primers and
hence, no prior sequence knowledge about the genome of
the focal species is needed. As a result, RADseq is particu-
larly suitable for endangered and nonmodel species
(Catchen et al. 2013a,b; Hohenlohe et al. 2013; Rheindt
et al. 2013; Senn et al. 2013). Another advantage of RAD-
seq is that, because of the high number of SNPs produced,
population genetic parameters and structure may require a
relatively small number of individuals, depending on the
demographic history (Felsenstein 2006; Carling and Brum-
field 2007; Green et al. 2010; Rheindt et al. 2013), making
it particularly relevant for species that are rare or difficult
to access. Finally, the cost of RADseq is relatively low and
individuals can be multiplexed in a single sequencing lane,
facilitating the sampling of multiple populations across
broader geographical ranges. Taking all these factors into
consideration, RADseq appears particularly well suited for
population genetic studies of threatened and endangered
species.
The Black-footed Albatross (Phoebastria nigripes; Audu-
bon 1839) is a seabird endemic to the North Pacific, with
an age of first breeding of 6–7 years and a demographic
generation time of approximately 18 years (Niel and Lebr-
eton 2005; BirdLife International 2014). After fledging and
in the nonbreeding season, individuals range throughout
the North Pacific Ocean, but those individuals that are re-
sighted display strong nest fidelity and natal philopatry
upon reaching reproductive maturity and in subsequent
breeding seasons (Cousins and Cooper 2000). Currently,
the estimated census size is 66 140 pairs, with 98% of the
population breeding in the Hawaiian archipelago, 1.9% in
Japan and 0.1% on offshore Mexican islands (Cousins and
Cooper 2000; Flint 2007; Naughton et al. 2007; BirdLife
International 2014).
In the past 200 years, the species has suffered from a
number of threats: feather and egg collecting in the late
1800s and early 1900s, high-sea driftnet by-catch between
1978 and 1992, and, most recently, long line fisheries.
Today, the population size of the Black-footed Albatross
has stabilized thanks to a series of mitigation measures due
to the species’ ‘Vulnerable’ status on the IUCN Red List of
Threatened Species (Cousins and Cooper 2000; Lewison
and Crowder 2003; BirdLife International 2014). As a result
of these successes, in 2013, the species was downlisted from
Vulnerable to Near-Threatened (IUCN 2013). However,
natural phenomena predicted as consequences of climate
change such as storms, rising sea levels (Storlazzi et al.
2013) and volcanic eruptions (Harrison 1990) will likely
threaten the species’ breeding grounds. Despite current
breeding ground protection against anthropological threats
(Naughton et al. 2007), little can be performed against
these natural phenomena. However, Hawaii and Japan
might be affected differently by rising sea levels and
increased frequency of storms. Recent climatic events have
already made apparent the vulnerability of the Hawaiian
islands. In 2011, a 1.5 m wave completely submerged Spit
Island in Midway Atoll, killing 110 000 Black-footed and
Laysan Albatross chicks and 2000 adults (Hutcherson
2011). Indeed, these islands, where 98% of the Black-footed
Albatrosses breed, are only 2–5 m above sea level (Naugh-
ton et al. 2007). The Japanese and Mexican islands have
higher elevations and might be less at risk of being affected
by the predicted consequences of climate change. In Japan,
2 © 2015 The Authors. Evolutionary Applications published by John Wiley & Sons Ltd
Albatross conservation genomics using Radseq Dierickx et al.

Izu-Torishima has an elevation of 394 m, Haha-jima of
462 m and Senkaku of 383 m. Guadalupe Island off the
coast of Mexico has an elevation of 1297.5 m (Google
Maps 2014).
With this in mind, Black-footed Albatross conservation
action plans (COSEWIC 2006, Naughton et al. 2007) rec-
ommend that efforts be made to develop the smaller alba-
tross colonies outside of Hawaii and to encourage the
natural colonization of new islands such as Wake and Gua-
dalupe. However, these measures might need to be altered
if there is underlying population structure among the
breeding grounds. As a result, it is important to know
whether the two largest populations located in Hawaii and
Japan are genetically and morphologically distinguishable
as has been previously suggested (Cousins and Cooper
2000; Walsh and Edwards 2005).
In May 2013, the Agreement on the Conservation of
Albatrosses and Petrels’ (ACAP) taxonomy working group
rejected a petition for these Japanese and Hawaiian popula-
tions to be considered separate subspecies due to a lack of
supporting data (ACAP 2013). Morphologically, the Japa-
nese Black-footed Albatrosses are thought to be smaller
than their Hawaiian counterparts (Cousins and Cooper
2000), but this notion seems to solely rest on a personal
communication that spread through the literature without
strong supporting evidence. Molecular studies of genetic
variation in Black-footed Albatrosses have come to varied
conclusions regarding levels of genetic variation, levels of
gene flow and the direction of gene flow, depending on the
markers used and sampling scheme. One study involving
mtDNA (Walsh and Edwards 2005) suggested significant
differentiation between Japan and Hawaii, negligible gene
flow and a higher genetic diversity in Hawaii. On the other
hand, Eda et al. 2008 found that populations within Japan,
from Izu-Torishima and the Bonin Islands, did not differ
significantly in mtDNA and that the Bonin Islands had
levels of genetic diversity similar to those found in Hawaii.
Most recently, based on data from 10 microsatellite mark-
ers, Ando et al. (2014) suggested that birds from Hawaii
and Japan are genetically differentiated and have similar
levels of genetic diversity, but that there is strong asymmet-
rical gene flow from Japan to Hawaii. Given these diverse
conclusions, additional studies with new types of data are
warranted.
In the current project, we investigate the seeming con-
tradictions between these previous studies using a compre-
hensive nuclear data set obtained through double digest
RADseq. For the reasons discussed above, we argue that
this methodology can provide more reliable population
parameter estimates for conservation purposes than other
markers. Our principal aim, partially motivated by the need
to provide the ACAP with the additional information
required to determine the phylogenetic status of the
Japanese population, is to resolve whether and to what
extent the Hawaiian and Japanese populations of the
Black-footed Albatross represent two distinct populations.
Based on previous studies and high levels of breeding
philopatry (Cousins and Cooper 2000), our hypothesis is
that the Hawaiian and Japanese populations of the Black-
footed Albatross are clearly morphologically and genetically
distinct. Genetically, we predict significant differentiation
with low levels of gene flow. Morphologically, we predict
the Japanese population to be significantly smaller than
their Hawaiian counterparts, as has been previously
implied (Cousins and Cooper 2000; Walsh and Edwards
2005). Our alternative hypothesis is that the Hawaiian and
Japanese populations are panmictic or nearly so, showing
high levels of gene flow between the island groups. A study
by Friesen et al. (2007) found that populations sharing the
nonbreeding range (as is the case for the Black-footed Alba-
tross) are less likely to be genetically differentiated. Given
the extensive foraging range of the Black-footed Albatross,
during both breeding and nonbreeding periods (Cousins
and Cooper 2000), it is likely that a few individuals per
generation may join a colony other than their natal colony.
The recent founding of colonies on Guadalupe Island and
Wake Island (COSEWIC 2006) supports this idea. How-
ever, it is not clear whether these occasional events consti-
tute enough gene flow to maintain panmixia. In contrast to
the findings of Ando et al. (2014), if gene flow exists
between Japan and Hawaii, we would expect it to be mainly
from Hawaii towards Japan, as the Hawaiian population is
much larger than the Japanese population. The Hawaiian
population is statistically more likely to produce immi-
grants, and any alleles brought in by Japanese birds would
have less impact on the Hawaiian gene pool than vice
versa.
Albatrosses have been the subject of a number of
population genetic studies, mostly involving mtDNA,
microsatellites and AFLPs (Burg and Croxall 2001; Abbott
and Double 2003a,b; Friesen et al. 2007; Milot et al. 2007,
2008). One paradigm emerging from these studies is that
the high rates of natal philopatry often appear inconsis-
tent with rates of gene flow as measured by molecular
markers (Edwards et al. 2001; Friesen et al. 2007; Milot
et al. 2008). We suggest that the RADseq approach is use-
ful to investigate these questions because it reflects varia-
tion across the whole genome, arguably better than the
small number of microsatellite markers often used (Zink
2010). Indeed, results based on RADseq and microsatel-
lites have been known to differ. For example, Lozier
(2014) compared the levels of genetic diversity of two
species of American bumble bees, the common Bombus
impatiens and the declining Bombus pensylvanicus, and his
RADseq data suggest that levels of genetic diversity in
these two species are in fact much more similar than pre-
© 2015 The Authors. Evolutionary Applications published by John Wiley & Sons Ltd 3
Dierickx et al. Albatross conservation genomics using Radseq
vious microsatellite analyses had indicated. The current
project can hence also serve as a model for how new
methods can be used to complement and advance knowl-
edge based on older methods. In addition to our genetic
investigation, we took an integrative taxonomic approach
by using museum specimens of known provenance to
examine the claim that Japanese Black-footed Albatrosses
are smaller than their Hawaiian counterparts (Cousins
and Cooper 2000; Walsh and Edwards 2005). Our mor-
phological comparison of the two breeding populations
complements the genetic data obtained through RADseq
and sheds light from a different perspective on the ques-
tion. By combining these molecular and non-molecular
methods, we were able to take an integrated approach to
the taxonomy of the Black-footed Albatross.
Materials and methods
Field and laboratory work
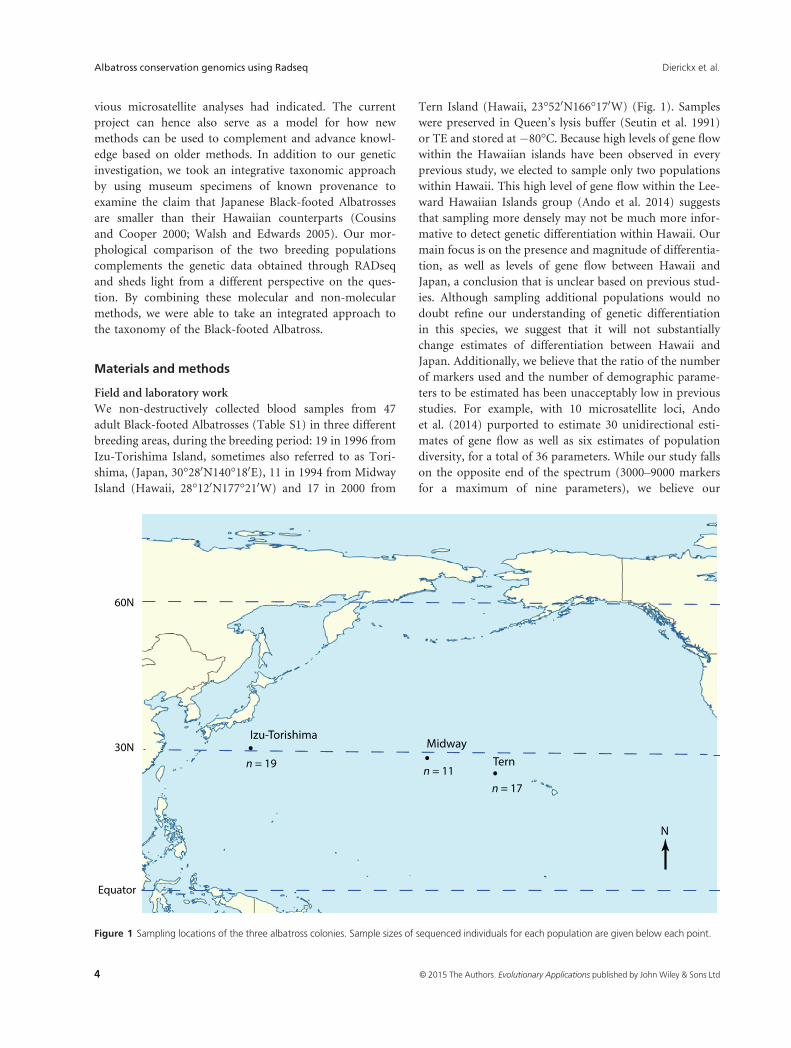
We non-destructively collected blood samples from 47
adult Black-footed Albatrosses (Table S1) in three different
breeding areas, during the breeding period: 19 in 1996 from
Izu-Torishima Island, sometimes also referred to as Tori-
shima, (Japan, 30°280N140°180E), 11 in 1994 from Midway
Island (Hawaii, 28°120N177°210W) and 17 in 2000 from
Tern Island (Hawaii, 23°520N166°170W) (Fig. 1). Samples
were preserved in Queen’s lysis buffer (Seutin et al. 1991)
or TE and stored at �80°C. Because high levels of gene flow
within the Hawaiian islands have been observed in every
previous study, we elected to sample only two populations
within Hawaii. This high level of gene flow within the Lee-
ward Hawaiian Islands group (Ando et al. 2014) suggests
that sampling more densely may not be much more infor-
mative to detect genetic differentiation within Hawaii. Our
main focus is on the presence and magnitude of differentia-
tion, as well as levels of gene flow between Hawaii and
Japan, a conclusion that is unclear based on previous stud-
ies. Although sampling additional populations would no
doubt refine our understanding of genetic differentiation
in this species, we suggest that it will not substantially
change estimates of differentiation between Hawaii and
Japan. Additionally, we believe that the ratio of the number
of markers used and the number of demographic parame-
ters to be estimated has been unacceptably low in previous
studies. For example, with 10 microsatellite loci, Ando
et al. (2014) purported to estimate 30 unidirectional esti-
mates of gene flow as well as six estimates of population
diversity, for a total of 36 parameters. While our study falls
on the opposite end of the spectrum (3000–9000 markers
for a maximum of nine parameters), we believe our
Izu-TorishimaMidway
Tern
N
n = 19n = 11
n = 17
Equator
30N
60N
Figure 1 Sampling locations of the three albatross colonies. Sample sizes of sequenced individuals for each population are given below each point.
4 © 2015 The Authors. Evolutionary Applications published by John Wiley & Sons Ltd
Albatross conservation genomics using Radseq Dierickx et al.

sampling scheme presents a more robust, or at least an
alternative, framework for estimating broad demographic
parameters in this and other species.
DNA was extracted from the blood samples using the
Qiagen DNeasy (Qiagen, Venlo, the Netherlands) and
Omega E.Z.N.A (Omega Bio-Tek, Norcross, GA, USA).
DNA extraction kits, following the manufacturers’ proto-
cols for blood samples, except for an increased enzyme
digestion time (overnight). DNA concentrations were
measured with fluorometric quantification (Qubit 2.0 HS
DNA assay; Invitrogen, Life Technologies, Carlsbad, CA,
USA). Double digest RAD sequencing libraries for each
individual sample were prepared according to the proto-
col of Peterson et al. (2012), using enzymes SphI and
EcoR1. Each Black-footed Albatross individual was
assigned a 5-base pair (bp) inline barcode, and equimolar
concentrations of eight uniquely barcoded individuals
were pooled and double-indexed by 16 cycles of high-
fidelity PCR (KAPA Hot Start Long Range PCR kit;
KAPA Biosystems, Wilmington, MA, USA) with Illumina
barcodes, resulting in a unique combination of inline and
Illumina barcodes for each individual. The PCR products
were pooled in equimolar quantities and sequenced in
one lane of a rapid run of an Illumina HiSeq 2500
sequencer at the Bauer Core facility at Harvard Univer-
sity, producing 100-bp paired-end reads.
Sequence processing and alignment
We used Geneious 6.1.7 (Biomatters 2013) to sort sequence
reads by barcode and trim the restriction sites; we explored
different strategies for trimming the sequences and found
that they made no difference for the results. The sequences
were then processed with the program process_radtags in
Stacks 1.06 (Catchen et al. 2011, 2013b). The paired-end
reads were then merged into a single file per individual,
before a de novo assembly was performed with de-
novo_map.pl in Stacks using parameters –m 3 –M 3 –n 3 –p2. At this stage, we eliminated four individuals (two from
Izu-Torishima, one from Midway, one from Tern) due to
low sequence coverage. Finally, we used the populations
module in Stacks to create data matrices (referred to as
‘data sets’, Tables S2 and S3) for subsequent analyses, with
a minimum stack depth of 30. To study the effects on
genetic estimates of different SNP filtering protocols,
removal of low-frequency alleles and differences in sample
sizes among populations, we analysed seven different data
sets (numbered 1 through 7) produced from different SNP
filtering protocols (Tables S2 and S3) with varying num-
bers of individuals and minor allele frequency (MAF) and
heterozygosity requirements (Table 1). Specifically, we var-
ied the number of SNPs per locus (to avoid SNPs in poten-
tial high linkage disequilibrium), removal of SNPs with
heterozygosity >0.75 and a MAF >0.05 (to avoid potential
low-frequency SNP miscalls) and data set completeness.
Because no genome is currently available from a close
relative of the Black-footed Albatross, we used BLASTN
2.2.29+ (Altschul et al. 1997) to map the consensus
sequences of polymorphic loci from data set 1 to the two
most complete bird genomes available online, the chicken
(Gallus gallus) with Ensembl assembly number 4.0 (Hillier
et al. 2004) and the Zebra Finch (Taeniopygia guttata) with
Ensembl assembly number 3.2.4 (Warren et al. 2010), to
understand the distribution of sequenced loci across the
avian genome. Finally, we used the program KING (Manic-
haikul et al. 2010) to verify that we had not sampled any
related individuals that could bias the analyses.
Population differentiation
In addition to the summary statistics estimated with Stacks,
we estimated additional related population genetic esti-
mates both to confirm trends suggested by Stacks and to
provide additional resolution to the demographic history.
We first used STRUCTURE 2.3.4 (Pritchard et al. 2000) on
data sets 1–3 to determine the number of genetic groups,
or ‘clusters’ (K) that best fit the data, and assign individuals
to cluster(s). STRUCTURE was run three times with each
data set for K = 1–8 under an assumption of admixture,
with 100 000 cycles of burn-in (BURNIN = 100 000) and
300 000 Markov chain Monte Carlo samples (NUM-
REPS = 300 000). We combined the replicate result files
using CLUMPP v 1.1.2 (Jakobsson and Rosenberg 2007),
implemented in STRUCTURE HARVESTER (Earl and
vonHoldt 2012), and visualized the combined result file
using distruct v. 1.1 (Rosenberg 2004). To examine popula-
tion differentiation in a multivariate framework, we used R
3.0.2 to run a discriminant analysis of principal compo-
nents (DAPC) on all data sets using the adegenet package
(Jombart and Ahmed 2011). With the hierfstat package in
R (Goudet 2005), we calculated pairwise FST values among
the three populations for data set 1 and tested their signifi-
cance by running 99 random permutations of individuals
to obtain null distributions. Finally, using methods out-
lined in Wakeley (2008), we estimated linkage disequilib-
rium (r2) between sites for loci in data set 1 with more than
one SNP, to determine the level of non-independence of
SNPs. For these calculations, we randomly chose eight indi-
viduals from each population because an imbalanced sam-
ple size can bias the calculation of r2.
Analysis of gene flow
For all seven data sets, we used BayeScan 2.1 (Foll and
Gaggiotti 2008) to search for possible FST outliers among
the SNPs and estimated gene flow among populations with
© 2015 The Authors. Evolutionary Applications published by John Wiley & Sons Ltd 5
Dierickx et al. Albatross conservation genomics using Radseq

multiple runs of the software MIGRATE 3.6.5 (Beerli and
Felsenstein 2001; Beerli 2006, 2009). The MIGRATE
analysis was run in Bayesian mode and assumed either
nonsymmetric or symmetric migration rates between the
three populations. We investigated the effect of analysing
only polymorphic loci versus all loci, including invariant
ones, and found little effect on the demographic estimates
(Table 2). To obtain MIGRATE estimates of diversity com-
parable to those estimated by Stacks, we assumed that each
SNP was embedded in a 90-bp sequence of otherwise
invariant sites. As another window into recent gene flow,
we conducted population assignment tests using Genodive
(Meirmans and Van Tienderen 2004), using data set 2 for
this purpose (see Tables S2 and S3).
Table 2. RADseq run information per population (Tern, Midway, Torishima or all) for all positions (both variant and fixed), based on data set 1.
Populations All
Total number of 100-bp reads produced by the RADseq run 78 803 224
Number of loci in Stacks catalogue before filtering in populations 115 359
Number of loci retained in Stacks catalogue after filtering in populations 9760
Total number of RAD sites 879 856
Number of detected SNPs (data set completeness: 80.4%) 3455
Number of polymorphic RAD loci with ≥1 SNP 2769
Populations Tern Midway Torishima
Average number of individuals per population across loci 13.9927 7.80374 13.8236
Stack depth of coverage Mean = 180.9
SD = 150.8
Mean = 120.3
SD = 128.2
Mean = 203.2
SD = 148.3
Total number of RAD sites present in all individuals 873 713 787 400 857 790
Total number of polymorphic RAD sites present in all individuals 2647 1871 2066
Number of variant sites 3426 3154 3385
Observed heterozygosity 0.00063 0.00063 0.00059
Observed homozygosity 0.99937 0.99937 0.99941
Expected heterozygosity 0.00062 0.00060 0.00058
Expected homozygosity 0.99935 0.99936 0.99940
p (nucleotide diversity) 0.00065 0.00064 0.00060
SNP, single nucleotide polymorphism.
Table 1. Description of data sets 1–7 and the single nucleotide polymorphism (SNP) filtering procedures used to create them.
Data set
number
Number of
individuals
per population
Total number
of individuals SNP Filtering
Data set completeness
requirement for locus
inclusion
Data set
completeness
Total
number
of SNPs
1 Tern: 17
Midway: 11
Izu-Torishima: 19
43 None At least 50% of individuals in at
least 2 populations
80% 3455
2 Tern: 17
Midway: 11
Izu-Torishima: 19
43 1 SNP per locus At least 50% of individuals in at
least 2 populations
80% 2769
3 Tern: 17
Midway: 11
Izu-Torishima: 19
43 1 SNP per locus, loci required
to have heterozygosity <0.75
and MAF >0.05
At least 50% of individuals in at
least 2 populations
80% 2672
4 9 27 1 SNP per locus At least 50% of individuals in at
least 2 populations
80% 2998
5 9 27 1 SNP per locus, loci required
to have heterozygosity <0.75
and MAF >0.05
At least 50% of individuals in at
least 2 populations
80% 2996
6 9 27 1 SNP per locus At least 85% of individuals in all 3
populations
94% 672
7 9 27 1 SNP per locus All individuals in all 3 populations 100% 81
MAF, minor allele frequency.
6 © 2015 The Authors. Evolutionary Applications published by John Wiley & Sons Ltd
Albatross conservation genomics using Radseq Dierickx et al.

Morphological data
We obtained morphological data from 43 museum speci-
mens belonging to seven different museum collections
(Table S4). To minimize bias due to different people
performing the measurements, we took great care to
describe the measuring protocol to the measurer in detail.
Specimens were classified as belonging to either the Hawai-
ian or Japanese population, and as male or female. A speci-
men was assigned to a given population if it had been
ringed there as a chick or caught there as an adult during
the Black-footed Albatross’ breeding period (November to
June). Birds caught at sea or caught at locations of interest
outside of the breeding period were excluded from the
analysis. The aim was to obtain measurements of wing
chord, beak width, culmen length and tarsus length for all
specimens, but, depending on the preparation method, cer-
tain measurements could sometimes not be taken. Sample
sizes for wing chord, tarsus length, culmen length and beak
width, respectively, are as follows: Japan males: 8, 9, 9, 9;
Japan females: 7, 7, 8, 8; Hawaii males: 9, 8, 9, 8; and
Hawaii females: 9, 10, 8, 7 (Table S4).
We used R Commander 2.0–3 to perform a factorial
analysis of variance (ANOVA) to determine whether Japanese
Black-footed Albatrosses differed significantly in size from
Hawaiian Black-footed Albatrosses for the different mea-
sures, controlling for sex.
Results
Characterization of RADseq data
We obtained a total of 78 803 224 paired-end reads, each
100 bp, across 47 individuals in the three albatross popula-
tions. The catalogue built from Stacks contained a raw total
of 115 359 loci. Filtering procedures in populations with
the criteria specific to each of the seven data sets resulted in
levels of completeness ranging from 80% to 100%
(Table 1). After filtering in populations for a minimum
stack depth of 30, and presence in at least 50% of the indi-
viduals of two populations, 9760 loci were retained (data
set 1). From this set of loci, a total of 3455 SNPs (variable
sites) were found among 2769 (28.4%) of the loci, resulting
in a data matrix that was 80.4% complete across all SNPs
and individuals (Figure S1). Of these 2769 loci, 2234 had
only one SNP, 418 had two, 91 had three, 21 had four, and
5 had five or more. Additional information on the results
based on data set 1 can be found in Table 2.
When these loci were mapped to the chicken and Zebra
Finch genomes, respectively, 10.8% and 16.3% mapped
only once with an e-value less than �20. Of the loci, 88.8%
and 80.2% did not map at all to the chicken and Zebra
Finch genomes, respectively. The remaining loci (0.4% and
3.5%) mapped more than once. The higher percentage of
mapped loci to the Zebra Finch genome is likely because
the Black-footed Albatross and Zebra Finch share a more
recent common ancestor than either does with the chicken
(Hackett et al. 2008). If the e-value is relaxed to �10,
40.3% of the loci map once to the Zebra Finch genome.
The number of hits per chromosome is significantly corre-
lated with the length of the chromosome (R2 = 0.961, P-
value <0.0001), suggesting that the SNPs are randomly dis-
tributed across the avian genome (Fig. 2, panel A). There
0.00
0.25
0.50
0.75
1.00
0 25 50 75Distance between SNPs (base pairs)
r v
alue
2
PopulationTernMidwayTorishima
Chromosome length (Mbp)
Num
ber o
f loc
i
050
100
150
200
250
0 50 100 150
(A)
(B)
Figure 2 Panel A shows the chromosomal distribution of data set 1 sin-
gle nucleotide polymorphisms (SNPs) as mapped to the Zebra Finch gen-
ome with an e-value <�10. Chromosome length is significantly
correlated with the number of SNPs (R2 = 0.961, P-value <0.0001). The
red dot corresponds to the Z chromosome loci. Panel B shows linkage
disequilibrium as measured by r2 (Wakeley 2008) between pairs of SNPs
found on the same RADseq locus. For eight randomly chosen individuals
from each population, the LOESS smoothed r2 value (solid lines) plus
95% SE confidence intervals (Wickham 2009) are shown for each SNP
distance.
© 2015 The Authors. Evolutionary Applications published by John Wiley & Sons Ltd 7
Dierickx et al. Albatross conservation genomics using Radseq

were fewer loci mapping to the Zebra Finch Z chromosome
than expected given its length (Fig. 2, panel A).
Linkage disequilibrium among sites within loci declined
gradually with distance along the sequence for all three
populations, with sites close together (<10 bp) exhibiting r2
values averaging 0.4–0.5 and sites >75 bp away exhibiting
values closer to 0.2–0.3 (Fig. 2, panel B). The program
KING (Manichaikul et al. 2010) confirmed that we had not
sampled any close relatives (results not shown). The kin-
ship values ranged from �0.2807 to 0.0831, with 822 indi-
vidual comparisons ≤0 and 80 positive comparisons. All
values were below the 2nd-degree relationship cut-off value
of 0.0884.
Genetic diversity
Estimates for genetic diversity as calculated by Stacks in
each population for data set 1, examining polymorphic loci
only, were as follows: pTern = 0.165, pMidway = 0.160 and
pTorishima = 0.152. Examining both variant and invariant
loci, values varied from pTorishima = 0.00060 to
pTern = 0.00065 (Table S2). All other data sets also had pvalues of 0.0006, except data set 7, for which p = 0.0008
(Fig. 3, Table S2). Pairwise FST values calculated for data
set 1 varied between 0.022 (FST-Midway-Tern) and 0.040
(FST-Midway-Torishima; Table S3). Pairwise FST values were
consistent among data sets, with FST-Midway-Tern always
being lower than the two other FST values (Fig. 3,
Table S3). The among-locus distributions of observed pair-
wise FST values between islands in data set 1 are shown in
Fig. 4(panels A–C). The null distribution of FST values pro-
duced from permutation tests indicate that FST values
between Torishima and Midway or Tern are significantly
higher than would be expected at random, but not between
Midway and Tern (Fig. 4, panels D–F). BayeScan did not
detect any FST outliers in any of the data sets, suggesting
that the loci assayed in this study are likely to be evolving
neutrally and that demographic processes predominantly
influence the distribution of RADseq variation in this spe-
cies. All in all, the different filtering procedures had very lit-
tle impact on the population genetics summary statistics
(Tables S2 and S3).
Population differentiation
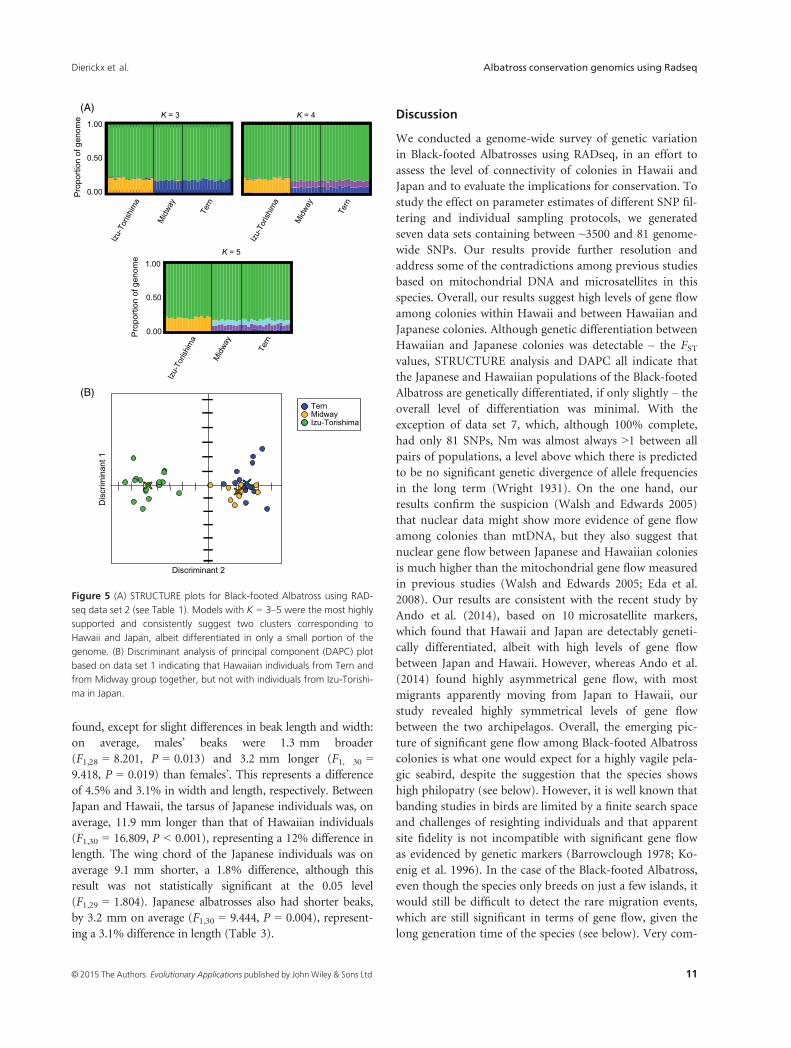
Here, we report the STRUCTURE results for data set 2 (1
SNP per locus), because STRUCTURE can be sensitive to
linked loci. The results of the other six data sets were quali-
tatively similar. The log-likelihood of the model was very
similar across K = 1–5 (not shown), but maximized at
K = 3 clusters, whereas K = 5 was favoured by the Delta K
test (Earl and vonHoldt 2012; Fig. 5A). Models with K = 3,
4 or 5 showed evidence of two major clusters dividing
Japan and Hawaii, albeit for a small portion of the genome
(Fig. 5A). Despite the high amount of shared SNP varia-
tion genome-wide between Izu-Torishima and the Hawai-
ian islands, STRUCTURE detected more differentiation
between Japan and Hawaii than between the two Hawaiian
islands (Fig. 5A).
For data sets 1–6, using the first three PC axes and two
discriminant axes, the DAPC plot shows that individuals
from Hawaii cluster together as one population, while the
Japanese individuals cluster as a distinct population
(Fig. 5B). Eigenvalues for data set 1, which were similar
across all data sets, were 321.34 for the first discriminant
and 3.13 for the second, suggesting that most of the varia-
tion exists between the Japan and Hawaii populations.
Because DAPC is based on a dimension reduction of the
data using principal component analysis (PCA) followed
by a linear discriminant analysis, the choice of the number
of PCA axes to be retained at this stage needs to be evalu-
ated. Here, the results were robust when considering differ-
ent numbers of retained PC axes. Data set 7 was the only
data set for which the three DAPC clusters were not clearly
distinguishable; however, this is probably a result of the
low total number of loci (Table 1).
Estimates of gene flow and effective population size
Using MIGRATE, estimates of genetic diversity (Θ = 4Nl)varied depending on the model and on the data set used,
ranging from 0.025 (0.00028 per bp; data set 1, Tern, sym-
metric model) to 0.0029 (0.00002 per bp; data set 7, Tori-
shima, nonsymmetric model; Table S3). In general, in
contrast to the results for p from Stacks, Θ decreased with
the number of SNPs in the data set. However, results are
consistent in that they all indicate similar levels of genetic
diversity in all three populations. Across data sets and
models, there was no population with consistently lower or
higher estimates of Θ. Estimates of Θ for the entire species
were sometimes higher but sometimes lower than estimates
for individual populations, and ranged from 0.0102 to
0.0067, with a mean of 0.0088 (0.0001 per bp). Even the
highest estimates of Θ suggest a low level of genetic diver-
sity in the species as a whole.
Using standard population genetic theory for a single
population at equilibrium, we estimated the effective popu-
lation size of the species from our estimates of p and Θ,because under neutrality, both of these parameters estimate
4Nl. Assuming a mutation rate for noncoding DNA in
birds of 1.5 9 10�9 per site per year (Ellegren 2007) and a
value of ~18 years per generation (Niel and Lebreton 2005)
yields a mutation rate of 2.7 9 10�8 per generation. From
this value, we calculate estimates of N ranging from 500 to
15 881, depending on our assumptions about generation
time (Table S5).
8 © 2015 The Authors. Evolutionary Applications published by John Wiley & Sons Ltd
Albatross conservation genomics using Radseq Dierickx et al.

Maximum-likelihood estimates of gene flow measured
on the scale of mutations (m/l) for all data sets varied from
10.0 (data set 7; Midway-Torishima) to 210.0 (data set 7;
Midway -> Torishima) (Fig. 3; Table S3). Multiplying
estimates of the gene flow parameter by Θ of the receiving
population (or by the average of Θ in the case of symmetric
migration) yielded estimates of gene flow (Nm) of 0.02–4.5birds per generation across all pairs of islands and models
assumed (Table S3). Estimates of gene flow were consis-
tently lower for data set 7, likely a result of its small size
Θ
Population
Tern
Midway
Izu-Torishima
All
0.00
0.01
0.02
0.03
0.04
0.05
FST
0
50
100
150
200
117,10,16
3455Dataset
M
Comparison
Tern-Midway
Midway-Izu-Torishima
Izu-Torishima-Tern
Comparison
Tern-Midway
Midway-Izu-Torishima
Izu-Torishima-Tern
(A)
(B)
(C)
217,10,16
2769
317,10,16
1572
49,9,92998
59,9,92154
69,9,9672
79,9,9
81
Dataset #Individuals
SNPs
0.0000
0.0002
0.0004
0.0006
0.0008
1 72 3 6
1 2 3 4 6 7
1 2 3
4 5
5
4 5 6 7
Population
Tern
Midway
Izu-Torishima
All
(D)
(Stacks)
(Stacks)
(Migrate)
(Migrate)
0.0000
0.0004
0.0002
Figure 3 Estimates of genetic differentiation and gene flow estimated from the seven data sets listed in Tables S2 and S3. p (panel A) and h (panel
B) are reported per base pair. FST (panel C) was calculated in Stacks as described. M (panel D) is the estimate of m/l in MIGRATE. m/l is interpreted as
the relative number of migration events per mutation across a given data set. When multiplied by the appropriate h, it can be interpreted as the tradi-
tional estimate of gene flow, Nm.
© 2015 The Authors. Evolutionary Applications published by John Wiley & Sons Ltd 9
Dierickx et al. Albatross conservation genomics using Radseq

(Table S3), and higher for data set 1. For all other data sets,
all Nm values were consistently close to or >1 bird per gen-
eration. Averaging Nm for each pair of populations across
all data sets and nonsymmetric models, we obtained an
estimate of 1.59 birds per generation moving from Hawaii
to Japan and 1.34 birds per generation moving from Japan
to Hawaii, indicating highly symmetric gene flow patterns
between the two colonies.
Population assignment tests
We performed a population assignment analysis on data
set 2 using the program Genodive with 100 replicated data
sets with a total of 4274 resampled individuals. The inferred
population membership for each individual, inferred by
calculating likelihoods coming from each population,
showed strong evidence for two populations as in other
analyses (not shown). All Izu-Torishima individuals were
assigned to a single population, and almost all individuals
from both Tern and Midway were assigned to the Midway
population, with two of the Midway individuals assigned
to Tern. Overall, these results corroborate the pattern of
high gene flow between Japanese and Hawaiian colonies,
with little differentiation within Hawaii.
Morphological measurements
Our morphological data satisfied the necessary requirements
for a factorial ANOVA (normality of residuals, equality of pop-
ulation variances, independence of residuals). No statistically
significant differences in size between males and females were
Tern versus Izu-Torishima
FST
–0.2 0.0 0.2 0.4 0.6
010
030
050
070
0
Midway versus Izu-Torishima
FST
–0.2 0.0 0.2 0.4 0.6 0
500
1000
1500
Tern versus Midway
Tern versus Midway
FST
Freq
uenc
y
–0.2 0.0 0.2 0.4 0.6
020
040
060
080
0 Per locus FST:
FST
Freq
uenc
y
–0.01 0.00 0.01 0.02 0.03 0.04
05
1015
20
Midway versus Izu-Torishima
FST
–0.01 0.00 0.01 0.02 0.03 0.04
05
1015
20
Tern versus Izu-Torishima
FST
–0.01 0.00 0.01 0.02 0.03 0.04
05
1015
2025
30
Permutated overall FST:
(A) (B) (C)
(F)(E)(D)
Figure 4 Panels A, B and C show distributions of observed per locus pairwise FST values calculated with data set 1 between Tern and Midway (A),
Izu-Torishima and Midway (B) and Izu-Torishima and Tern (C). Panels D, E and F show pairwise FST values generated by 99 random permutations of
all individuals compared to the pairwise population FST values estimated with our genetic data, given by the red arrow. Comparisons between the
two Hawaiian islands, Tern and Midway (D), is not significant because it falls within the null distribution of FST values. FST values between Izu-Torishi-
ma and Midway (E) and Izu-Torishima and Tern (F) are significantly higher than expected at random.
10 © 2015 The Authors. Evolutionary Applications published by John Wiley & Sons Ltd
Albatross conservation genomics using Radseq Dierickx et al.
found, except for slight differences in beak length and width:
on average, males’ beaks were 1.3 mm broader
(F1,28 = 8.201, P = 0.013) and 3.2 mm longer (F1, 30 =9.418, P = 0.019) than females’. This represents a difference
of 4.5% and 3.1% in width and length, respectively. Between
Japan and Hawaii, the tarsus of Japanese individuals was, on
average, 11.9 mm longer than that of Hawaiian individuals
(F1,30 = 16.809, P < 0.001), representing a 12% difference in
length. The wing chord of the Japanese individuals was on
average 9.1 mm shorter, a 1.8% difference, although this
result was not statistically significant at the 0.05 level
(F1,29 = 1.804). Japanese albatrosses also had shorter beaks,
by 3.2 mm on average (F1,30 = 9.444, P = 0.004), represent-
ing a 3.1% difference in length (Table 3).
Discussion
We conducted a genome-wide survey of genetic variation
in Black-footed Albatrosses using RADseq, in an effort to
assess the level of connectivity of colonies in Hawaii and
Japan and to evaluate the implications for conservation. To
study the effect on parameter estimates of different SNP fil-
tering and individual sampling protocols, we generated
seven data sets containing between ~3500 and 81 genome-
wide SNPs. Our results provide further resolution and
address some of the contradictions among previous studies
based on mitochondrial DNA and microsatellites in this
species. Overall, our results suggest high levels of gene flow
among colonies within Hawaii and between Hawaiian and
Japanese colonies. Although genetic differentiation between
Hawaiian and Japanese colonies was detectable – the FSTvalues, STRUCTURE analysis and DAPC all indicate that
the Japanese and Hawaiian populations of the Black-footed
Albatross are genetically differentiated, if only slightly – the
overall level of differentiation was minimal. With the
exception of data set 7, which, although 100% complete,
had only 81 SNPs, Nm was almost always >1 between all
pairs of populations, a level above which there is predicted
to be no significant genetic divergence of allele frequencies
in the long term (Wright 1931). On the one hand, our
results confirm the suspicion (Walsh and Edwards 2005)
that nuclear data might show more evidence of gene flow
among colonies than mtDNA, but they also suggest that
nuclear gene flow between Japanese and Hawaiian colonies
is much higher than the mitochondrial gene flow measured
in previous studies (Walsh and Edwards 2005; Eda et al.
2008). Our results are consistent with the recent study by
Ando et al. (2014), based on 10 microsatellite markers,
which found that Hawaii and Japan are detectably geneti-
cally differentiated, albeit with high levels of gene flow
between Japan and Hawaii. However, whereas Ando et al.
(2014) found highly asymmetrical gene flow, with most
migrants apparently moving from Japan to Hawaii, our
study revealed highly symmetrical levels of gene flow
between the two archipelagos. Overall, the emerging pic-
ture of significant gene flow among Black-footed Albatross
colonies is what one would expect for a highly vagile pela-
gic seabird, despite the suggestion that the species shows
high philopatry (see below). However, it is well known that
banding studies in birds are limited by a finite search space
and challenges of resighting individuals and that apparent
site fidelity is not incompatible with significant gene flow
as evidenced by genetic markers (Barrowclough 1978; Ko-
enig et al. 1996). In the case of the Black-footed Albatross,
even though the species only breeds on just a few islands, it
would still be difficult to detect the rare migration events,
which are still significant in terms of gene flow, given the
long generation time of the species (see below). Very com-
emonegfo
noitroporP 0.00
1.00
0.50
(B)
(A)
Tern
Izu-TorishimaMidway
Dis
crim
inan
t 1
Discriminant 2
K = 3
Tern
Mid
way
Izu-
Toris
him
a
Izu-
Toris
him
a
Mid
way
Tern
K = 5
emonegfo
noitroporP 0.00
1.00
0.50
K = 4
Izu-
Toris
him
a
Mid
way
Tern
Figure 5 (A) STRUCTURE plots for Black-footed Albatross using RAD-
seq data set 2 (see Table 1). Models with K = 3–5 were the most highly
supported and consistently suggest two clusters corresponding to
Hawaii and Japan, albeit differentiated in only a small portion of the
genome. (B) Discriminant analysis of principal component (DAPC) plot
based on data set 1 indicating that Hawaiian individuals from Tern and
from Midway group together, but not with individuals from Izu-Torishi-
ma in Japan.
© 2015 The Authors. Evolutionary Applications published by John Wiley & Sons Ltd 11
Dierickx et al. Albatross conservation genomics using Radseq
plete data spanning many decades would be needed to
measure dispersal rates accurately.
The microsatellite data from Ando et al. (2014) also sug-
gest similar levels of genetic diversity between Japan and
Hawaii, in agreement with the cytochrome b data from Eda
et al. (2008), but differing from the mitochondrial DNA
results of Walsh and Edwards (2005). Our study finds trends
more similar to Eda et al. (2008): both our p and Θ values,
calculated with Stacks and MIGRATE, respectively, suggest
similar levels of diversity in all colonies. The RADseq results
are indeed consistent with the suggestion that the Japanese
colony, despite harbouring vastly fewer birds than those in
Hawaii, possesses as much SNP variability across the gen-
ome. Indeed, the similar levels of genetic diversity when con-
sidering all individuals in a single population, as well as the
uniformly low FST values, suggest that most of the genetic
variation in the entire species can be found within any one
population that we sampled. The amount of genetic varia-
tion we found was low: although few studies have been con-
ducted with the RADseq method, we found an amount of
genetic variation that is about 10 times lower than that in
the human species, which is notorious for being depauperate
in genetic variation (Rosenberg et al. 2002).
For all populations, our estimates of genetic diversity are
likely biased downward because the RADseq approach can-
not score genotypes where one chromosome is missing the
relevant restriction site (Arnold et al. 2013). However, we
can still compare our estimates of diversity to those of
other studies using similar methodologies. Published
estimates of genetic diversity in birds using the RADseq
approach are rare (Harvey and Brumfield 2015), although
several recent bird studies have used RADseq to study
hybridization (Rheindt et al. 2013; Taylor et al. 2014a,b),
and, using simulations, Harvey et al. (2015) suggested that
5000 SNPs should be adequate for estimating demographic
parameters. Despite recently colonizing previously glaci-
ated areas in North America, genetic diversity of threespine
sticklebacks (Teleosti Gasterosteus aculeatus) was ten times
that in our study (~0.001–0.004, including all sites; Catchenet al. 2013a). Our estimates of Ne, ranging 500–15881, are4–100 times lower than the census size for this species. The
estimate of generation time made by Niel and Lebreton
(2005) came from an average age of first breeding of
8.6 years (Cousins and Cooper 2000) and estimates of
adult survivorship and the population growth rate. The
value for the mutation rate we used would have to be many
times higher to account for the discrepancy between effec-
tive and census size. Although our estimates of Ne are
imprecise, they reflect the low level of RADseq diversity
found in this species. The downward bias in diversity
incurred by the RADseq method (Arnold et al. 2013)
means that our estimate of Ne is also likely downwardly
biased from the true value. Still, the magnitude of the bias
is likely not sufficient to reconcile the effective and census
sizes in this species.
The estimates of FST from our study are significantly
lower than that found between sister species of other birds
measured with RADseq, such as closely related flycatcher
and chickadee species (Rheindt et al. 2013; Taylor et al.
2014b). The BayeScan analysis did not reveal any FST out-
liers, suggesting that the loci in this study are likely to be
evolving neutrally. However, despite the large number of
SNPs detected in our study, the density of SNP detection
by RADseq, even for a small avian genome, may not be
high enough to be influenced by genomic sites under selec-
tion. Frequently, SNPs showing unusual levels of differenti-
ation are located near genes influenced by natural selection
and may be of particular use in the functional understand-
ing of genetic variation in threatened species (Storz 2005).
Seabirds are an evolutionarily old lineage and may show
less evidence of ongoing natural selection than other birds.
Indeed, marine vertebrates in general have been suggested
to evolve slowly at genes experiencing natural selection in
other groups (Slade 1992). Although our RADseq data are
not fine enough to detect any signals of selection in alba-
tross genomes, our data might hint at the possibility that
the evolutionary potential, or the ability of albatrosses to
evolve in response to changing environmental pressures, is
relatively low, given the apparent lack of loci under natural
selection as compared to other RADseq studies where out-
liers are routine (Catchen et al. 2013a; Moore et al. 2014;
Taylor et al. 2014a). Transcriptome studies, which focus on
variation in coding regions, might produce more evidence
of loci under natural selection. Although our RADseq loci
Table 3. Results of a factorial ANOVA for four measurements of Black-footed Albatrosses. Effects significant at the 0.01 level are in bold.
Measurement
Total sample
size
Mean for
all birds (mm)
MeanHawaii –
MeanJapan (mm)
Absolute
difference of
location effect (%)
Effect of
location (P-value)
Effect of
sex (P-value)
Interaction between
sex and location
Bill width 32 30.2 �0.8 2.6 0.1151 0.0078 0.3470
Culmen 34 103.3 3.2 3.1 0.0044 0.0045 0.7994
Tarsus 34 98.5 �11.9 12 0.0003 0.2021 0.8391
Wing chord 33 494.2 9.1 1.8 0.1896 0.9207 0.4507
12 © 2015 The Authors. Evolutionary Applications published by John Wiley & Sons Ltd
Albatross conservation genomics using Radseq Dierickx et al.
often mapped reliably to individual sites in the Zebra Finch
genome, nearly all of these sites were in noncoding regions,
which may be less subject to natural selection.
Our results are applicable to other albatross species, due
to distinctive shared life-history traits that can influence
evolutionary rates. For example, albatrosses have an excep-
tionally long life expectancy that is 20–40 times higher than
that of a typical songbird. Among albatross species other
than Phoebastria nigripes, some, such as the Shy Albatross
(Thalassarche cauta), exhibit genetically very distinct breed-
ing populations with little dispersal between sites (Abbott
and Double 2003a,b), while others, such as the White-
capped Albatross (Thalassarche steadi; Abbott and Double
2003a,b) and the Wandering Albatross (Diomedea exulans;
Milot et al. 2008; but see Burg and Croxall 2004) show very
little genetic structure and significant migration between
populations. The Black-footed Albatross’ closest relative,
the Laysan albatross (Phoebastria immutabilis), falls in this
second category, according to a study by Young based on
mitochondrial DNA (2010). Nunn and Stanley (2000)
found that rates of cytochrome b evolution were lower in
large bodied Procellariformes such as albatrosses, suggest-
ing that slow rates of molecular evolution might be part of
a general syndrome of this clade.
After evaluating the genetic differentiation between the
Japanese and Hawaiian Black-footed Albatrosses, we com-
pared these two populations morphologically. In particular,
we tested the claim that Japanese individuals are smaller
than their Hawaiian counterparts. Contrary to what is com-
monly found in the literature, we did not find Japanese
Black-footed Albatrosses to be uniformly smaller than their
Hawaiian counterparts. We did find some statistically signif-
icant morphological differences among geographical catego-
ries of birds (longer tarsus in Japan, longer culmen in
Hawaii; Table 3), but they were generally small and were not
consistent in direction between Japanese and Hawaiian
birds. Some of the morphological differences we found were
within the range of differences that might accumulate in
museum specimens over time, especially if curated under
different conditions in different museums (Bjordal 1983;
Kuczy�nski et al. 2002). Although some of the differences we
found were statistically significant, the biological significance
of these differences is questionable until further studies, ide-
ally involving live birds of known age, are conducted.
In summary, our results indicate that the absolute level of
genetic differentiation between the Hawaiian and Japanese
Black-footed Albatross population is small, that estimated
levels of gene flow are high and that individuals from the
two populations do not differ markedly in size. Despite this,
our study does show that the Japanese and Hawaiian popu-
lations are detectably genetically differentiated. These results
illustrate the challenges faced when interpreting population
dynamics estimates based on genetic data for the purpose of
species management. From an evolutionary perspective,
which focuses on long timescales, the two populations are
unlikely to constitute separate ESUs, especially considering
our estimate of gene flow, which is high enough to prevent
genetic drift and population divergence (Wright 1931). This
conclusion remains true despite the seeming small number
of migrants per generation: >1 migrant per 18 years does
not seem like high rates of exchange, yet, as a general rule,
such a level would impede strong divergence in the long
term. However, from a conservationist’s perspective, which
focuses on shorter timescales, even a small amount of
genetic differentiation could prove to be important for pop-
ulation management purposes, especially if two populations
are demographically independent, showing, for example,
different life histories, breeding schedules or population
growth rates (Oostermeijer et al. 2003; Ohara et al. 2006;
Angeloni et al. 2014; Palkovacs et al. 2014). Because of this
possibility, and because the Hawaiian and Japanese breeding
grounds are likely to be differentially affected by climate
change for geographical reasons (Storlazzi et al. 2013), we
suggest that the Japanese and Hawaiian populations of the
Black-footed Albatross be considered separate biological
MUs. A more widespread species is inherently more resil-
ient to extinction; hence, it is worthwhile to preserve as
much of a species’ range as possible, given predicted threats
such as climate change and rising sea levels.
Nevertheless, because of low levels of genetic and mor-
phological differentiation, we reject our initial hypothesis
that the Japanese population is sufficiently differentiated
to deserve subspecific status, and support the ACAP’s
decision not to consider the Japanese population a sepa-
rate subspecies of the Black-footed Albatross. Radio
telemetry or banding data on individual birds’ move-
ments between the different Black-footed Albatross colo-
nies would help refine our understanding of gene flow in
this species and patterns of philopatry. Between 1980 and
2007, 13 854 chicks were banded on Tern Island, and
recaptures of breeding birds in Hawaii started in 1992
(V�eran et al. 2007). Remarkably, however, only two birds
known to have been banded as chicks in Japan have been
observed to be breeding in Midway, Hawaii, in 2014 and
2015 (K. Yoshiyashu and S. Doell, pers. comm.). Appar-
ently, these two migratory events are the only ones
recorded thus far (B. Flint, pers. comm.). Over time,
exchanges of banding and recapture data between Hawai-
ian and Japanese researchers could allow for detection of
these rare migration events to estimate direct migration
rates between the two populations, but this would require
a highly concerted and large-scale effort. These data, in
concert with genetic analysis of adaptively evolving loci,
would provide insight into the mechanisms through
which the subtle genetic and morphological differences
within the Black-footed Albatross arise.
© 2015 The Authors. Evolutionary Applications published by John Wiley & Sons Ltd 13
Dierickx et al. Albatross conservation genomics using Radseq

Acknowledgements
We thank the Yamashina Institute for Ornithology and the
Burke Museum of Natural History and Culture for the
generous tissue loan, and the Museum of Comparative
Zoology (Harvard University), the Bernice Pauahi Bishop
Museum, the American Museum of Natural History, the
Los Angeles County Museum, the Yamashina Institute for
Ornithology, the Santa Barbara Museum of Natural His-
tory and the Field Museum for providing morphological
measurements of museum specimens. Members of the
Edwards laboratory group provided helpful discussion in
the early phases of the project. Elizabeth Flint, K. Yoshiya-
shu and Shirly Doell provided helpful information on
banding records. Jennifer Couget and Christian Daly gave
advice and assistance with the Illumina sequencing. Vicki
Friesen engaged in helpful dialogue about the interpreta-
tion of results. Peter Beerli helped with data formatting for
Migrate-N and gave useful discussion of results. Two anon-
ymous reviewers, Associate Editor Louis Bernatchez and
Michael Brooke provided helpful comments on earlier
drafts. The Conservation Science and Behavioural Ecology
groups at the University of Cambridge helped frame the
results in the context of conservation. Research in Scott
Edwards’ laboratory is supported by grants from the
National Science Foundation.
Data archiving statement
Data available from the Dryad Digital Repository: http://
dx.doi.org/10.5061/dryad.71gt8.
Literature cited
Abbott, C. L., and M. C. Double 2003a. Phylogeography of shy and
white-capped albatrosses inferred from mitochondrial DNA
sequences: implications for population history and taxonomy. Molec-
ular Ecology 12:2747–2758.
Abbott, C. L., and M. C. Double 2003b. Genetic structure, conservation
genetics and evidence of speciation by range expansion in shy and
white-capped albatrosses. Molecular Ecology 12:2953–2962.
Agreement on the Conservation of Albatrosses and Petrels (ACAP) 2013.
http://www.acap.aq/index.php/en/news/latest-news/1393-american-
and-japanese-populations-of-the-Black-footed-albatross-not-consid-
ered-to-warrant-sub-specific-status (accessed on 24 March 2014).
Altschul, S., T. Madden, A. Schaffer, J. Zhang, Z. Zhang, W. Miller, and
D. Lipman 1997. Gapped BLAST and PSI-BLAST: a new generation of
protein database search programs. Nucleic Acids Research 25:3389.
Ando, H., L. Young, M. Naughton, H. Suzuki, T. Deguchi, and Y. Isagi
2014. Predominance of unbalanced gene flow from the Western to
Central North Pacific colonies of the Black-footed Albatross (Phoeba-
stria nigripes). Pacific Science 38:309–318.
Angeloni, F., P. Vergeer, C. A. M. Wagemaker, and N. J. Ouborg 2014.
Within and between population variation in inbreeding depression in
the locally threatened perennial Scabiosa columbaria. Conservation
Genetics 15:331–342.
Arnold, B., R. B. Corbett-Detig, D. Hartl, and K. Bomblies 2013.
RADseq underestimates diversity and introduces genealogical biases
due to nonrandom haplotype sampling. Molecular Ecology
22:3179–3190.
Baird, N. A., P. D. Etter, T. S. Atwood, M. C. Currey, A. L. Shiver, Z. A.
Lewis, E. U. Selker et al. 2008. Rapid SNP Discovery and genetic
mapping using sequenced RAD markers. PLoS One 3:e3376.
Barrowclough, G. F. 1978. Sampling bias in dispersal studies based on
finite area. Bird-Banding 49:333–341.
Beerli, P., and J. Felsenstein 2001. Maximum likelihood estimation of a
migration matrix and effective population sizes in n subpopulations
by using a coalescent approach. Proceedings of the National Academy
of Sciences of the USA 98:4563–4568.
Beerli, P. 2006. Comparison of Bayesian and maximum likelihood infer-
ence of population genetic parameters. Bioinformatics 22:341–345.
Beerli, P. 2009. How to use migrate or why are Markov chain Monte Carlo
programs difficult to use? In G. Bertorelle, M. W. Bruford, H. C. Hau-
ffe, A. Rizzoli, and C. Vernesi, eds. Population Genetics for Animal
Conservation, pp. 42–79. Cambridge University Press, Cambridge, UK.
Biomatters 2013. Geneious version 6.1.6. http://www.geneious.com/
(accessed on 22 July 2013).
BirdLife International 2014. http://www.birdlife.org/datazone/species-
factsheet.php?id=3957 (accessed on 24 March 2014).
Bjordal, H. 1983. Effects of deep freezing, freeze-drying and skinning on
body dimensions of house sparrows Passer domesticus. Fauna Norveg-
ica Series C Cinclus 62:105–108.
Brito, P. H., and S. V. Edwards 2009. Multilocus phylogeography and
phylogenetics using sequence-based markers. Genetica 135:439–455.
Brumfield, R., D. Nickerson, P. Beerli, and S. V. Edwards 2002. The util-
ity of single nucleotide polymorphisms in inferences of population
history. Trends in Ecology and Evolution 18:249–256.
Buburuzan, L., L. D. Gorgan, and I. I. B�ara 2007. Types of DNA used in
speciation and phylogeny studies. Analele S�tiint�ifice ale Universit�at�iiAlexandru Ioan Cuza 8:25–30.
Burg, T. M., and J. P. Croxall 2001. Global relationships amongst black-
browed and grey-headed albatrosses: analysis of population structure
using mitochondrial DNA and microsatellites. Molecular Ecology
10:2647–2660.
Burg, T. M., and J. P. Croxall 2004. Global population structure and tax-
onomy of the wandering albatross species complex. Molecular Ecology
13:2345–2355.
Carling, M. D., and R. T. Brumfield 2007. Gene sampling strategies for
multi-locus population estimates of genetic diversity (theta). PLoS
One 2:e160.
Catchen, J., A. Amores, P. Hohenlohe, W. Cresko, and J. Postlethwait
2011. Stacks: building and genotyping loci de novo from short-read
sequences. G3: Genes, Genomes, Genetics 1:171–182.
Catchen, J., S. Bassham, T. Wilson, M. Currey, C. O’Brien, Q. Yeates,
and W. A. Cresko 2013a. The population structure and recent coloni-
zation history of Oregon threespine stickleback determined using
restriction-site associated DNA-sequencing. Molecular Ecology
22:2864–2883.
Catchen, J., P. Hohenlohe, S. Bassham, A. Amores, and W. Cresko
2013b. Stacks: an analysis tool set for population genomics. Molecular
Ecology 22:3124–3140.
Chan, K. M. A., and S. A. Levin 2005. Leaky prezygotic isolation and
porous genomes: rapid introgression of maternally inherited DNA.
Evolution 59:720–729.
Coates, B. S., D. V. Sumerford, N. J. Miller, K. S. Kim, T. W. Sappington,
B. D. Siegfried, and L. C. Lewis 2009. Comparative performance of
14 © 2015 The Authors. Evolutionary Applications published by John Wiley & Sons Ltd
Albatross conservation genomics using Radseq Dierickx et al.

single nucleotide polymorphism and microsatellite markers for popu-
lation genetic analysis. Journal of Heredity 100:556–564.
COSEWIC 2006. COSEWIC assessment and status report on the Black-
footed Albatross Phoebastria nigripes in Canada. Committee on the
Status of Endangered Wildlife in Canada, ix + 59 pp.
Cousins, K., and J. Cooper 2000. The Population Biology of the
Black-footed Albatross in Relation to Mortality Caused by Long-Line
Fishing. Western Pacific Regional Fishery Management Council,
Honolulu.
Crandall, K. A., O. R. P. Bininda-Emonds, G. M. Mace, and R. K. Wayne
2000. Considering evolutionary processes in conservation biology.
Trends in Ecology and Evolution 15:290–295.
Earl, D. A., and B. M. vonHoldt 2012. STRUCTURE HARVESTER: a
website and program for visualizing STRUCTURE output and
implementing the Evanno method. Conservation Genetics Resources
4:359–361.
Eda, M., K. Kawakami, H. Chiba, H. Suzuki, K. Horikoshi, and H. Koike
2008. Genetic characteristics of the Black-footed albatross Diomedea
nigripes on the Bonin Islands and their implications for the species’
demographics history and population structure. Ornithological
Science 7:109–116.
Edwards, S. V., M. C. Silva, T. Burg, V. Friesen, and K. I. Warheit 2001.
Molecular genetic markers in the analysis of seabird bycatch
populations. In E. Melvin, and J. Parrish, eds. Seabird Bycatch:
Trends, Roadblocks and Solutions, pp. 115–140. Alaska Seagrant
Program, Fairbanks, AK.
Edwards, S., and S. Bensch 2009. Looking forwards or looking backwards
in avian phylogeography? A comment on Zink and Barrowclough
2008. Molecular Ecology 18:2930–2933.
Ellegren, H. 2007. Molecular evolutionary genomics of birds. Cytogenet-
ics and Genome Research 117:120–130.
Etter, P. D., S. Bassham, P. A. Hohenlohe, E. A. Johnson, and W. A.
Cresko 2011. SNP discovery and genotyping for evolutionary genetics
using RAD sequencing. Methods in Molecular Biology 772:157–178.
Fay, J. C., and C. Wu 1999. A human population bottleneck can account
for the discordance between patterns of mitochondrial versus nuclear
DNA variation. Molecular Biology and Evolution 16:1003–1005.
Felsenstein, J. 2006. Accuracy of coalescent likelihood estimates: do we
need more sites, more sequences, or more loci? Molecular Biology and
Evolution 23:691–700.
Flint, E. 2007. Annual nest counts through hatch year. Hawaiian Islands
National Wildlife Refuge and Midway Atoll National Wildlife Refuge.
Foll, M., and O. Gaggiotti 2008. A genome-scan method to identify
selected loci appropriate for both dominant and codominant markers:
a Bayesian perspective. Genetics 180:977–993.
Friesen, V. L., T. M. Burg, and K. D. McCoy 2007. Mechanisms of
population differentiation in seabirds. Molecular Ecology 16:
1765–1785.
Funk, D. J., and K. E. Omland 2003. Species level paraphyly and poly-
phyly: frequency, causes, and consequences, with insights from animal
mitochondrial DNA. Annual Review of Ecology Evolution and
Systematics 34:397–423.
Google Maps. https://maps.google.co.uk/ (accessed on 6 November
2014).
Goudet, J. 2005. Hierfstat, a package for R to compute and test hierarchi-
cal F-statistics. Molecular Ecology Notes 5:184–186.
Green, R. E., J. Krause, A. W. Briggs, T. Maricic, U. Stenzel, M. Kircher,
N. Patterson et al. 2010. A draft sequence of the Neandertal genome.
Science 328:710–722.
Hackett, S. J., R. T. Kimball, S. Reddy, R. C. Bowie, E. L. Braun, M. J.
Braun, J. L. Chojnowski et al. 2008. A phylogenomic study of birds
reveals their evolutionary history. Science 320:1763–1768.
Harris, R. B., M. D. Carling, and I. J. Lovette 2014. The influence of sam-
pling design on species tree inference: a new relationship for the New
World Chickadees (Aves: Poecile). Evolution 68:501–513.
Harrison, C. S. 1990. Seabirds of Hawaii: Natural History and Conserva-
tion. Cornell University Press, Ithaca and London.
Harvey, M. G., and R. T. Brumfield 2015. Genomic variation in a wide-
spread Neotropical bird (Xenops minutus) reveals divergence, popula-
tion expansion, and gene flow. Molecular Phylogenetics and
Evolution 83:305–316.
Harvey, M. G., C. D. Judy, G. F. Seeholzer, J. M. Maley, G. R. Graves,
and R. T. Brumfield 2015. Similarity thresholds used in DNA sequence
assembly from short reads can reduce the comparability of population
histories across species. PeerJ 3:e895.
Hedrick, P. W. 2005. A standardized genetic differentiation measure.
Evolution 59:1633–1638.
Hillier, L. W., W. Miller, E. Birney, W. Warren, R. C. Hardison, C. P.
Ponting, P. Bork et al. 2004. Sequence and comparative analysis of the
chicken genome provide unique perspectives on vertebrate evolution.
Nature 432:695–716.
Hohenlohe, P., M. D. Day, S. J. Amish, M. R. Miller, N. Kamps-Hughes,
M. C. Boyer, C. C. Muhlfeld et al. 2013. Genomic patterns of
introgression in rainbow and westslope cutthroat trout illuminated by
overlapping paired-end RAD sequencing. Molecular Ecology 22:3002–
3013.
Hutcherson, K. 2011. Tsunami washes away feathered victims west of
Hawaii. CNN. http://edition.cnn.com/2011/US/03/18/tsu-
nami.birds.deaths/ (accessed on 7 November 2014).
IUCN 2013. IUCN Red List of Threatened Species. Version 2013.2.
http://www.redlist.org/ (accessed on 24 March 2014).
Jakobsson, M., M. D. Edge, and N. A. Rosenberg 2013. The relationship
between FST and the frequency of the most frequent allele. Genetics
193:515–528.
Jakobsson, M., and N. A. Rosenberg 2007. CLUMPP: a cluster matching
and permutation program for dealing with label switching and mul-
timodality in analysis of population structure. Bioinformatics
23:1801–1806.
Jombart, T., and I. Ahmed 2011. Adegenet 1.3-1: new tools for the analy-
sis of genome-wide SNP data. Bioinformatics 27:3070–3071.
Koenig, W. D., D. Van Vuren, and P. N. Hooge 1996. Detectability,
philopatry and the distribution of dispersal distances in vertebrates.
Trends in Ecology and Evolution 11:514–517.
Kuczy�nski, L., P. Tryjanowski, M. Antczak, M. Skoracki, and M. Hro-
mada 2002. Repeatability of measurements and shrinkage after skin-
ning: the case of the great grey shrike Lanius excubitor. Bonner
Zoologische Beitr€age 51:127–130.
Lewison, R. L., and L. B. Crowder 2003. Estimating fishery bycatch and
effects on a vulnerable seabird population. Ecological Applications
13:743–753.
Lozier, J. D. 2014. Revisiting comparisons of genetic diversity in stable
and declining species: assessing genome-wide polymorphism in North
American bumble bees using RAD sequencing. Molecular Ecology
23:788–801.
Li, J. Z., D. M. Absher, H. Tang, A. M. Southwick, A. M. Casto, S. Rama-
chandran, H. M. Cann et al. 2008. Worldwide human relationships
inferred from genome-wide patterns of variation. Science 319:1100–
1104.
© 2015 The Authors. Evolutionary Applications published by John Wiley & Sons Ltd 15
Dierickx et al. Albatross conservation genomics using Radseq
Manichaikul, A., J. Mychaleckyj, S. Rich, K. Daly, M. Sale, and W. Chen
2010. Robust relationship inference in genome-wide association stud-
ies. Bioinformatics 26:2867–2873.
McCormack, J. E., S. M. Hird, A. J. Zellmer, B. C. Carstens, and R. T.
Brumfield 2011. Applications of next-generation sequencing to phy-
logeography and phylogenetics. Molecular Phylogenetics and Evolu-
tion 66:526–538.
Meirmans, P. G., and A. P. H. Van Tienderen 2004. GENOTYPE and
GENODIVE: two programs for the analysis of genetic diversity of
asexual organisms. Molecular Ecology Notes 4:792–794.
Milot, E., H. Weimerskirch, and L. Bernatchez 2008. The seabird paradox:
dispersal, genetic structure and population dynamics in a highly mobile,
but philopatric albatross species. Molecular Ecology 17:1658–1673.
Milot, E., H. Weimerskirch, P. Duchesne, and L. Bernatchez 2007. Sur-
viving with low genetic diversity: the case of the albatross. Proceedings
of the Royal Society B: Biological Sciences 274:779–787.
Moore, J.-S., V. Bourret, M. Dionne, I. Bradbury, P. O’Reilly, M. Kent,
G. Chaput et al. 2014. Conservation genomics of anadromous Atlantic
salmon across its North American range: outlier loci identify the same
patterns of population structure as neutral loci. Molecular Ecology
23:5680–5697.
Moritz, C. 1994. Defining “Evolutionary Significant Units” for conserva-
tion. Trends in Ecology and Evolution 10:373–375.
Naughton, M. B., M. D. Romano, and T. S. Zimmerman 2007. A conser-
vation action plan for Black-footed albatross (Phoebastria nigripes)
and Laysan albatross (P. immutabilis), version 1.0. https://alaskafisher-
ies.noaa.gov/protectedresources/seabirds/albatross_action_-
plan1007.pdf (accessed on 14 May 2015).
Narum, S. R., C. A. Buerkle, J. W. Davey, M. R. Miller, and P. A. Hohen-
lohe 2013. Genotyping-by-sequencing in ecological and conservation
genomics. Molecular Ecology 22:2841–2847.
Niel, C., and J. Lebreton 2005. Using demographic invariants to detect
overharvested bird populations from incomplete data. Conservation
Biology 19:826–835.
Nunn, G., and S. Stanley 2000. Body size effects and rates of cyto-
chrome-b evolution in tube-nosed seabirds. Molecular Biology and
Evolution 15:1360–1371.
Oostermeijer, J. G. B., S. H. Luijten, and J. C. M. den Nijs 2003. Integrat-
ing demographic and genetic approaches in plant conservation. Bio-
logical Conservation 113:389–398.
Ohara, M., H. Tomimatsu, T. Takada, and S. Kawano 2006. Importance
of life history studies for conservation of fragmented populations: a
case study of the understory herb, Trillium camschatcense. Plant Spe-
cies Biology 21:1–12.
Palkovacs, E. P., D. J. Hasselman, E. E. Argo, S. R. Gephard, K. E. Lim-
burg, D. M. Post, T. F. Schultz et al. 2014. Combining genetic and
demographic information to prioritize conservation efforts for anad-
romous alewife and blueback herring. Evolutionary Applications
7:212–226.
Palsboll, P. J., M. Berube, and F. W. Allendorf 2007. Identification of
management units using population genetic data. Trends in Ecology
and Evolution 22:11–16.
Peterson, B. K., J. N. Weber, E. H. Kay, H. S. Fisher, and H. E. Hoekstra
2012. Double digest RADseq: an inexpensive method for de novo SNP
discovery and genotyping in model and non-model species. PLoS One
7:e37135.
Pritchard, J. K., M. Stephens, and P. Donnelly 2000. Inference of popula-
tion structure using multilocus genotype data. Genetics 155:945–959.
Rheindt, F. E., M. K. Fujita, P. R. Wilton, and S. V. Edwards 2013. Intro-
gression and phenotypic assimilation in Zimmerius flycatchers (Tyran-
nidae): population genetic and phylogenetic inferences from genome-
wide SNPs. Systematic Biology 63:134–152.
Rosenberg, N. A. 2004. DISTRUCT: a program for the graphical display
of population structure. Molecular Ecology Notes 4:137–138.
Rosenberg, N. A., J. K. Pritchard, J. L. Weber, H. M. Cann, K. K. Kidd,
L. A. Zhivotovsky, and M. W. Feldman 2002. Genetic structure of
human populations. Science 298:2381–2385.
Ryder, O. A. 1986. Species conservation and systematics: the dilemma of
subspecies. Trends in Ecology and Evolution 1:9–10.
Ryynanen, H. J., A. Tonteri, A. Vasemagi, and C. R. Primmer 2007. A
comparison of biallelic markers and microsatellites for the estimation
of population and conservation genetic parameters in Atlantic salmon
(Salmo salar). Journal of Heredity 98:692–704.
Senn, H., R. Ogden, T. Cezard, K. Gharbi, Z. Iqbal, E. Johnson, N.
Kamps-Hughes et al. 2013. Reference-free SNP discovery for the Eur-
asian beaver from restriction site–associated DNA paired-end data.
Molecular Ecology 22:3112–3123.
Seutin, G., B. N. White, and P. T. Boag 1991. Preservation of avian blood
and tissue samples for DNA analysis. Canadian Journal of Zoology
69:82–90.
Slade, R. W. 1992. Limited MHC polymorphism in the southern ele-
phant seal: implications for MHC evolution and marine mammal
population biology. Proceedings of the Royal Society of London. Ser-
ies B: Biological Sciences 249:163–171.
Storlazzi, C. D., P. Berkowitz, M. H. Reynolds, and J. B. Logan 2013.
Forecasting the Impact of Storm Waves and Sea-Level Rise on Midway
Atoll and Laysan Island Within the Papah€Anaumoku€Akea Marine
National Monument – A Comparison of Passive Versus Dynamic
Inundation Models. U.S. Geological Survey Open-File Report 2013–
1069, 78 p. http://pubs.usgs.gov/of/2013/1069/ (accessed on 14 May
2015).
Storz, J. F. 2005. Using genome scans of DNA polymorphism to infer
adaptive population divergence. Molecular Ecology 14:671–688.
Taylor, S. A., T. A. White, W. M. Hochachka, V. Ferretti, R. L. Curry,
and I. Lovette 2014a. Climate-mediated movement of an avian hybrid
zone. Current Biology 24:671–676.
Taylor, S. A., R. L. Curry, T. A. White, V. Ferretti, and I. Lovette 2014b.
Spatiotemporally consistent genomic signatures of reproductive isola-
tion in a moving hybrid zone. Evolution 68:3066–3081.
Toews, D. P. L., and A. Brelsford 2012. The biogeography of mitochon-
drial and nuclear discordance in animals. Molecular Ecology 21:3907–
3930.
V€ali, U., A. Einarsson, L. Waits, and H. Ellegren 2008. To what extent do
microsatellite markers reflect genome-wide genetic diversity in natural
populations? Molecular Ecology 17:3808–3817.
V�eran, S., O. Gimenez, E. Flint, W. Kendall, P. Doherty, and J.-D. Lebr-
eton 2007. Quantifying the impact of longline fisheries on adult sur-
vival in the Black-footed Albatross. Journal of Applied Ecology
44:942–952.
Walsh, H. E., and S. V. Edwards 2005. Conservation genetics and pacific
fisheries bycatch: mitochondrial differentiation and population
assignment in the Black-footed Albatrosses (Phoebastria nigripes).
Conservation Genetics 6:289–295.
Wakeley, J. 2008. Coalescent Theory: An Introduction. Roberts & Com-
pany Publishers, Greenwood Village, Colorado.
Warren, W., D. F. Clayton, H. Ellegren, A. P. Arnold, L. W. Hillier, A.
K€unstner, S. Searle et al. 2010. The genome of a songbird. Nature
464:757–762.
Wickham, H. 2009. ggplot2: Elegant Graphics for Data Analysis.
Springer, New York.
16 © 2015 The Authors. Evolutionary Applications published by John Wiley & Sons Ltd
Albatross conservation genomics using Radseq Dierickx et al.
Wright, S. 1931. Evolution in Mendelian populations. Genetics 16:97–
159.
Yaacov, D. B., K. Arbel-Thau, Y. Zilka, O. Ovadia, A. Bouskila, and D.
Mishmar 2012. Mitochondrial DNA variation, but not nuclear DNA,
sharply divides morphologically identical chameleons along an ancient
geographic barrier. PLoS One 7:e31372.
Young, L. C. 2010. Inferring colonization history and dispersal patterns
of a long-lived seabird by combining genetic and empirical data. Jour-
nal of Zoology 281:232–240.
Zink, R. M., and G. F. Barrowclough 2008. Mitochondrial DNA under
siege in avian phylogeography. Molecular Ecology 17:2107–2121.
Zink, R. M. 2010. Drawbacks with the use of microsatellites in phyloge-
ography: the song sparrow Melospiza melodia as a case study. Journal
of Avian Biology 41:1–7.
Supporting Information
Additional Supporting Information may be found in the online version
of this article:
Figure S1. RADseq data set completeness plot for data set 1.
Table S1. List of specimens used in the genetic study.
Table S2. Estimates of genetic diversity using different data filtering
criteria.
Table S3. Estimates of FST and migration rates using different data fil-
tering criteria.
Table S4. List of specimens used in the morphological study.
Table S5. Estimates of effective population size from RADseq data
using a range of estimated generation times.
© 2015 The Authors. Evolutionary Applications published by John Wiley & Sons Ltd 17
Dierickx et al. Albatross conservation genomics using Radseq