Morgan Stanley Compensation & Governance Practices · Morgan Stanley Compensation & Governance...
19
Morgan Stanley Compensation & Governance Practices April 2016
Transcript of Morgan Stanley Compensation & Governance Practices · Morgan Stanley Compensation & Governance...

Morgan Stanley Compensation & Governance PracticesApril 2016
2
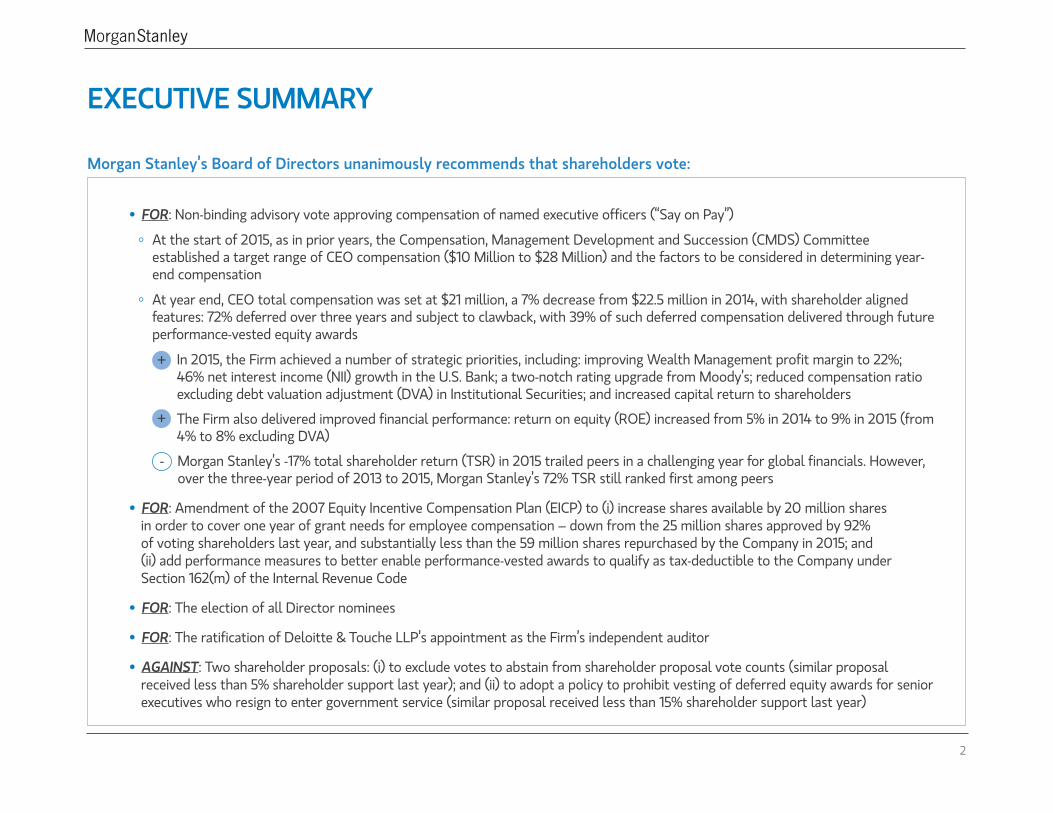
EXECUTIVE SUMMARY
Morgan Stanley’s Board of Directors unanimously recommends that shareholders vote:
• FOR: Non-binding advisory vote approving compensation of named executive officers (“Say on Pay”)
°° At the start of 2015, as in prior years, the Compensation, Management Development and Succession (CMDS) Committee established a target range of CEO compensation ($10 Million to $28 Million) and the factors to be considered in determining year-end compensation
°° At year end, CEO total compensation was set at $21 million, a 7% decrease from $22.5 million in 2014, with shareholder aligned features: 72% deferred over three years and subject to clawback, with 39% of such deferred compensation delivered through future performance-vested equity awards
+ In 2015, the Firm achieved a number of strategic priorities, including: improving Wealth Management profit margin to 22%; 46% net interest income (NII) growth in the U.S. Bank; a two-notch rating upgrade from Moody’s; reduced compensation ratio excluding debt valuation adjustment (DVA) in Institutional Securities; and increased capital return to shareholders
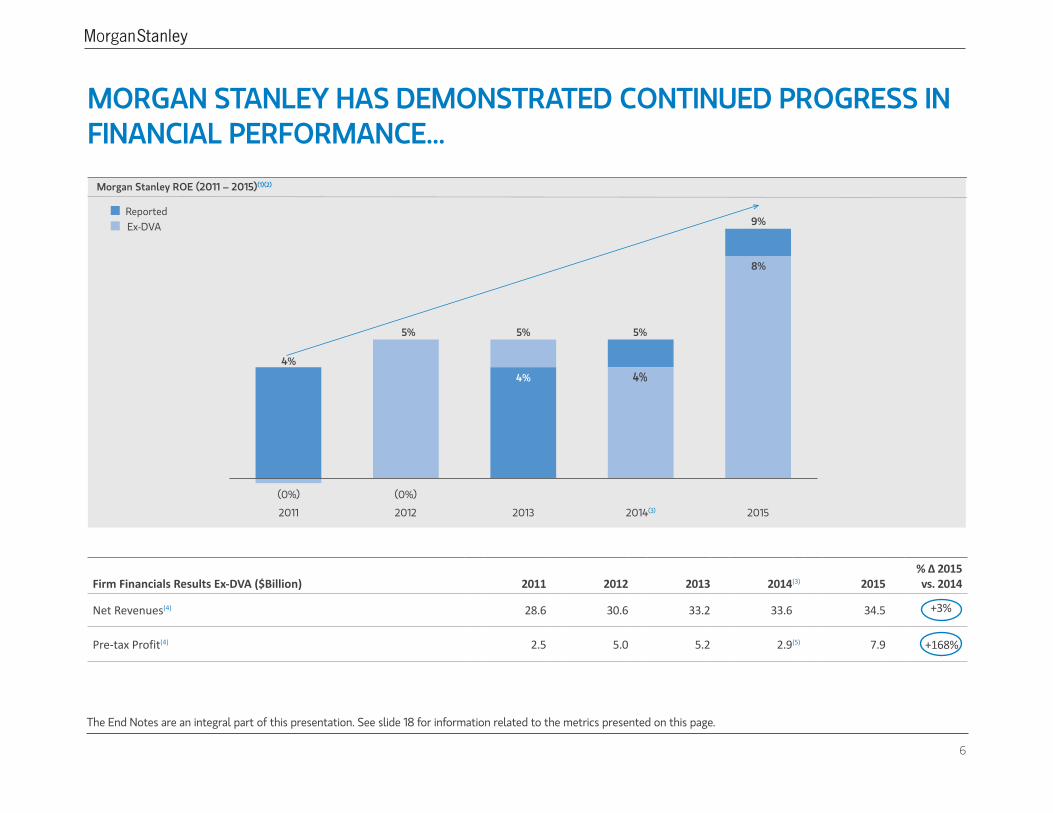
+ The Firm also delivered improved financial performance: return on equity (ROE) increased from 5% in 2014 to 9% in 2015 (from 4% to 8% excluding DVA)
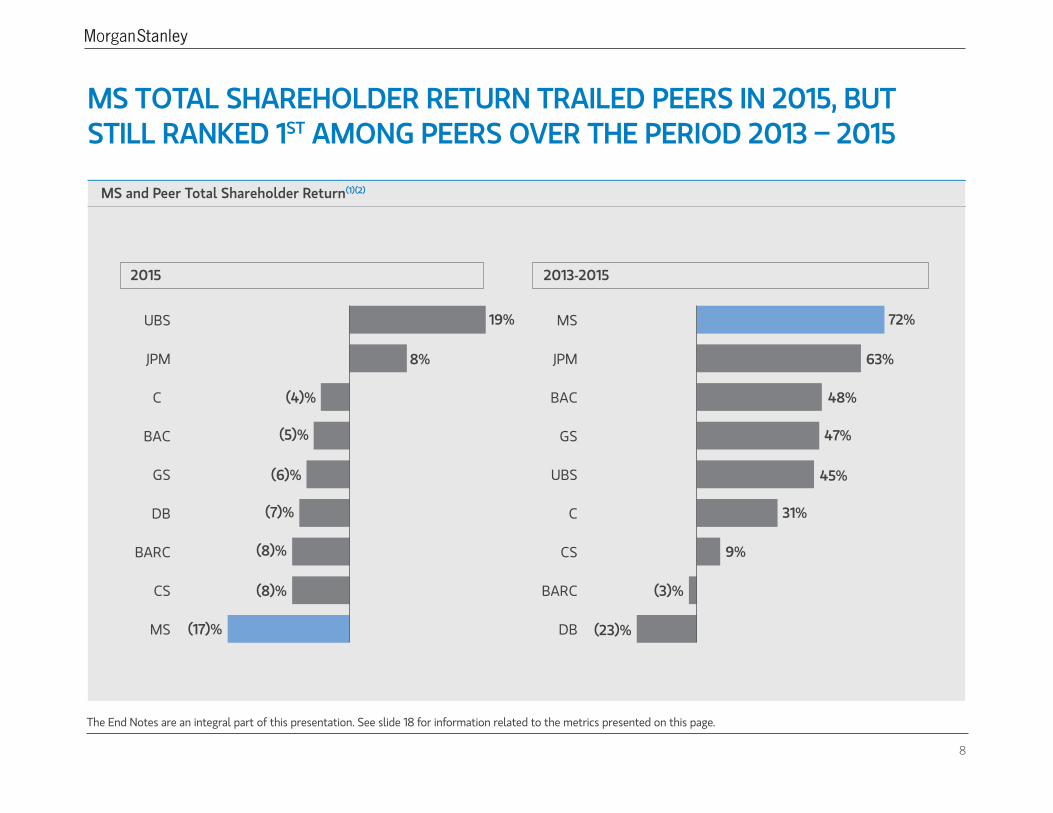
- Morgan Stanley’s -17% total shareholder return (TSR) in 2015 trailed peers in a challenging year for global financials. However, over the three-year period of 2013 to 2015, Morgan Stanley’s 72% TSR still ranked first among peers
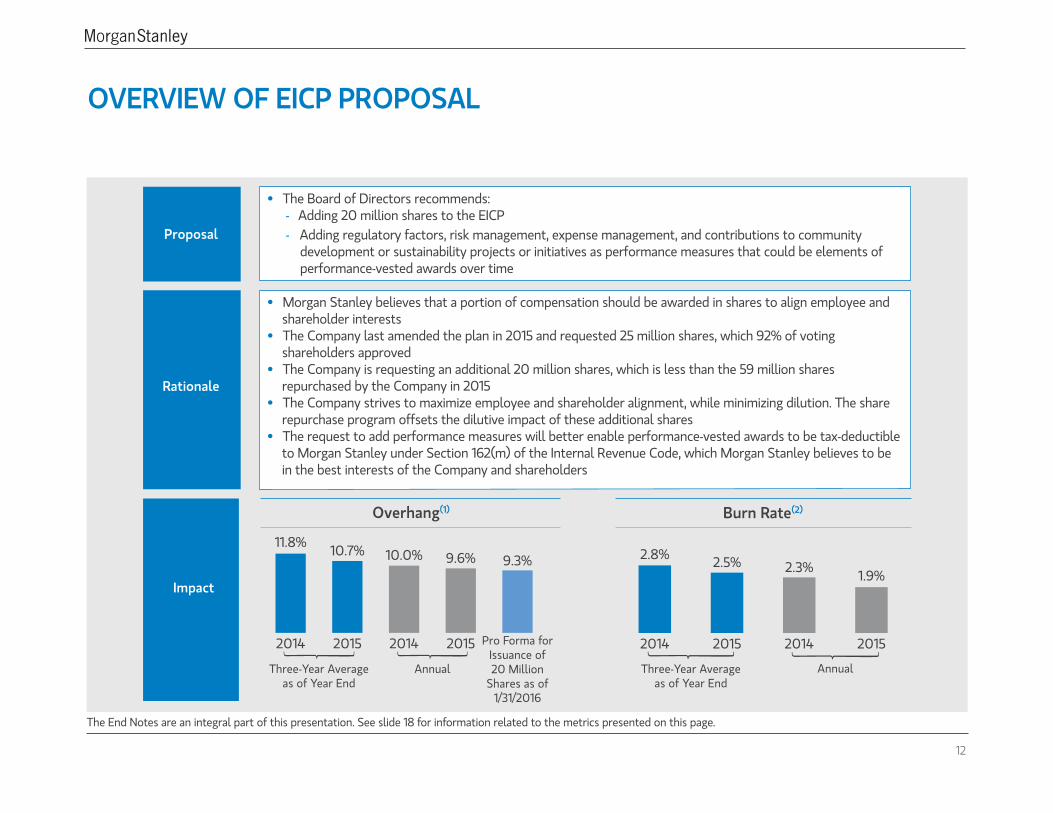
• FOR: Amendment of the 2007 Equity Incentive Compensation Plan (EICP) to (i) increase shares available by 20 million shares in order to cover one year of grant needs for employee compensation – down from the 25 million shares approved by 92% of voting shareholders last year, and substantially less than the 59 million shares repurchased by the Company in 2015; and (ii) add performance measures to better enable performance-vested awards to qualify as tax-deductible to the Company under Section 162(m) of the Internal Revenue Code
• FOR: The election of all Director nominees
• FOR: The ratification of Deloitte & Touche LLP’s appointment as the Firm’s independent auditor
• AGAINST: Two shareholder proposals: (i) to exclude votes to abstain from shareholder proposal vote counts (similar proposal received less than 5% shareholder support last year); and (ii) to adopt a policy to prohibit vesting of deferred equity awards for senior executives who resign to enter government service (similar proposal received less than 15% shareholder support last year)

3
COMPENSATION PROGRAM IS WELL ALIGNED WITH BEST PRACTICES IN GOVERNANCE, RISK MANAGEMENT, AND REGULATORY PRINCIPLESKey Features of Compensation Program New Ownership Requirements
1. Deferred incentive compensation • Significant deferrals support retention objectives and mitigate excessive risk-taking
2. Performance-vested long-term equity incentive award
• Ties meaningful portion of compensation to the Company’s long-term financial performance and reinforces accountability for achievement of future financial and strategic goals
3. Equity-based compensation • Equity awards align employee interests with those of shareholders
4. Clawbacks • Clawback applies to all awards and covers material adverse outcomes, even absent misconduct
5. Share ownership and retention requirements
• New ownership requirements introduced for CEO and NEOs (10x and 6x base salary, respectively)
• NEOs and other Operating Committee members must retain a high percentage of equity awards granted
6. No pledging, hedging, selling short, or trading derivatives
• NEOs and other executive officers are prohibited from these activities with respect to company securities
7. Double trigger vesting • No automatic vesting on change-in-control; double trigger in place
8. No excise tax gross-up • No NEO is entitled to excise tax protection upon a change-in-control of Morgan Stanley
9. Annual risk review of incentive compensation programs
• Chief Risk Officer annually evaluates compensation programs from a risk perspective and findings are reviewed with CMDS Committee and independent compensation consultant
10. Independent compensation consultant • CMDS Committee retains an independent compensation consultant to assist in collecting and evaluating external market data and to advise on current best practices

4
FRAMEWORK FOR DETERMINING CEO PAY
Establish a Target Range of Compensation
• The CMDS Committee establishes the CEO target compensation range at the beginning of each year
• The CMDS Committee considers prior year CEO compensation at peer firms, among other factors
Determine Compensation Based on Performance
• The Board sets performance priorities (financial and non-financial) at the beginning of each year to guide its evaluation of Firm and executive performance
• Compensation is determined at year-end based on an evaluation of CEO and Firm performance, including progress in achieving the Company’s strategic and financial objectives
MS CEO Compensation Range and Pay for Performance ApproachCompensation range informed by prior year CEO pay levels at 13 Financial Peer Companies (including 5 Large U.S. Banks)(1)
$28 Million or More
$10 Million or Less
• CEO performance exceeds expectations• Strong Firm performance and shareholder
returns
• CEO performance meets expectations • Firm performance and shareholder returns
generally in line with peers with room for continued progress
• CEO performance needs improvement• Firm performance and shareholder returns
are below expectations
Expected Range of Salary and Cash Bonus + Deferred Incentive Compensation+Performance-Vested Long-Term EquityIncentive Compensation
The End Notes are an integral part of this presentation. See slide 17 for information related to the peer group presented on this page.

5
MORGAN STANLEY CONTINUED TO MAKE PROGRESS ON IMPORTANT STRATEGIC OBJECTIVES IN 2015
The End Notes are an integral part of this presentation. See slide 17 for information related to the metrics presented on this page.
1. Ongoing Wealth Management upside through additional margin improvement
• Achieved FY 2015 22% pre-tax margin, up from 20% in 2014(1)
• One of leading Wealth Management platforms with ~$2Tn in client assets and ~16,000 financial advisors
2. Continued execution of U.S. Bank(2) strategy in Wealth
Management and Institutional Securities• Achieved 46% NII growth in U.S. Bank versus 2014 in a flat rate
environment(3)
• Increased Wealth Management lending in U.S. Bank by 31% versus 2014(3)
3. Progress in Fixed Income and Commodities ROE • Failed to meet objective and subsequently initiated major restructuring
• Completed exit of physical oil business
4. Maintain leadership in Institutional Equities and Investment Banking
• Ranked 1st in Institutional Equities revenue market share for the second consecutive year(4)
• Ranked 1st in Global IPOs, 2nd in Global Announced M&A, and 2nd in Global Equity(4)
5. Tailwind from lower funding costs • Continued to benefit as new debt issued at tighter spreads than maturing debt
6. Maintain focus on expense management • Achieved 37% Institutional Securities compensation ratio down from 48% (42% excluding deferred compensation adjustments) in 2014(5)
• Firmwide expense initiatives underway
7. Rating upgrade • Received two-notch upgrade from Moody’s: Morgan Stanley’s long-term senior debt rating increased from Baa2 to A3
8. Steadily increase capital return to shareholders • Received non-objection from the Federal Reserve Board to the 2015 Capital Plan, which included an increase in authorized share repurchase to $3.1 billion from $1.0 billion in the 2014 Capital Plan and the quarterly common stock dividend to $0.15 per share from $0.10 per share in the 2014 Capital Plan
6
MORGAN STANLEY HAS DEMONSTRATED CONTINUED PROGRESS IN FINANCIAL PERFORMANCE...
Firm Financials Results Ex-DVA ($Billion) 2011 2012 2013 2014(3) 2015% ∆ 2015 vs. 2014
Net Revenues(4) 28.6 30.6 33.2 33.6 34.5 +3%
Pre-tax Profit(4) 2.5 5.0 5.2 2.9(5) 7.9 +168%
The End Notes are an integral part of this presentation. See slide 18 for information related to the metrics presented on this page.
4%4%
5% 5%
4%
5%
9%
8%
(0%)(0%)
2011
Morgan Stanley ROE (2011 – 2015)(1)(2)
2012 2013 2014(3) 2015
ReportedEx-DVA
7
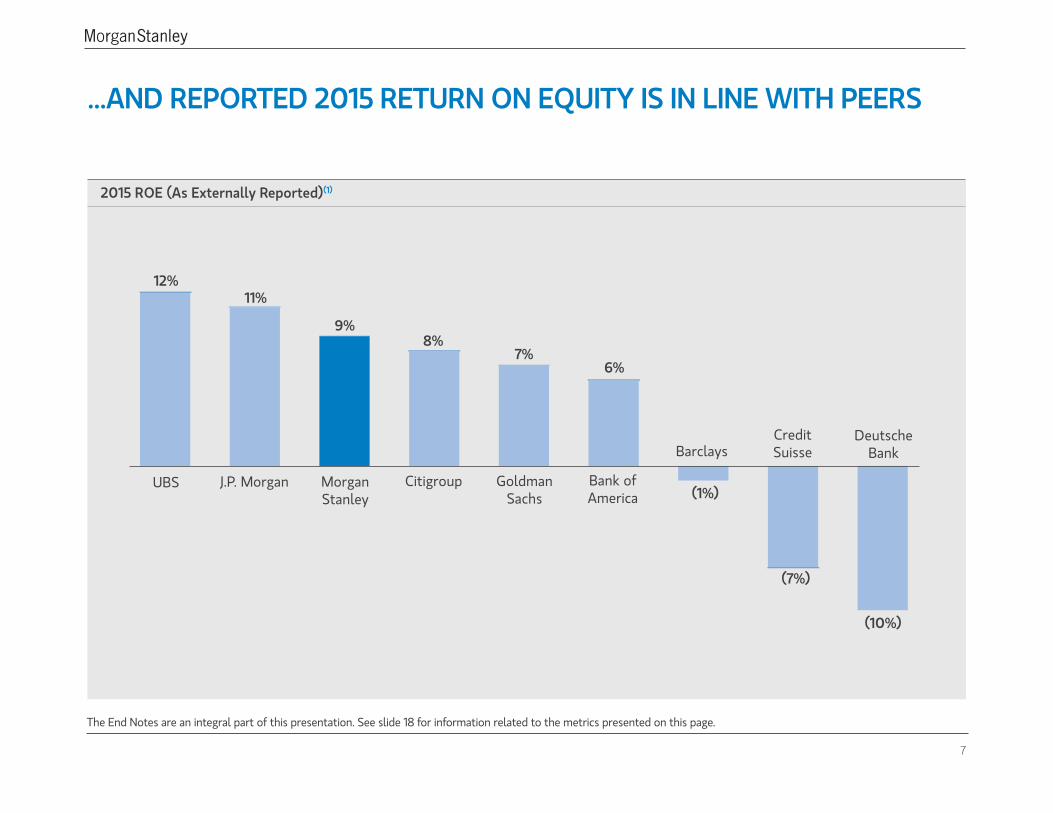
...AND REPORTED 2015 RETURN ON EQUITY IS IN LINE WITH PEERS
12%11%
(10%)
(7%)
6%7%
8%9%
(1%)UBS J.P. Morgan Citigroup
Barclays
GoldmanSachs
Bank ofAmerica
CreditSuisse
DeutscheBank
MorganStanley
2015 ROE (As Externally Reported)(1)
The End Notes are an integral part of this presentation. See slide 18 for information related to the metrics presented on this page.
8
The End Notes are an integral part of this presentation. See slide 18 for information related to the metrics presented on this page.
MS TOTAL SHAREHOLDER RETURN TRAILED PEERS IN 2015, BUT STILL RANKED 1ST AMONG PEERS OVER THE PERIOD 2013 – 2015
MS and Peer Total Shareholder Return(1)(2)
MS
CS
BARC
DB
GS
BAC
C
JPM
UBS
DB
BARC
CS
C
UBS
GS
BAC
JPM
MS19% 72%
63%
48%
47%
45%
31%
9%
8%
(4)%
(5)%
(6)%
(7)%
(8)%
(8)% (3)%
(23)%(17)%
2015 2013-2015

9
2015 CEO COMPENSATION WAS BASED ON THE CMDS COMMITTEE’S ASSESSMENT OF CEO AND MORGAN STANLEY’S PERFORMANCE
MS CEO Compensation Range Evaluating MS CEO Performance 2015 MS CEO Compensation Decision
$28 Million or More
$10 Million or Less
Expected Range of Salary and Cash Bonus + Deferred Incentive Compensation+ Performance-Vested Long-TermEquity IncentiveCompensation
$28 Million or More
$10 Million or Less
2014:$22.5 Million
2015:$21.0 Million
(7%)
• CEO performance exceedsexpectations
• Strong Firm performance andshareholder returns
• CEO performance meets expectations
• Firm performance and shareholder returns generally in line with peers with room for continued progress
• CEO performance needsimprovement
• Firm performance and shareholder returns are below expectations
Strong CEO performanceas MS continued tosuccessfully execute strategy approved by the Board
Financial performance in line with peers, with room for continued improvement on Return on Equity
Morgan Stanley’s 2015 shareholder return trailed peers in a challenging year for global financials
+
+
–

10
72% OF 2015 CEO COMPENSATION DEFERRED; 39% OF DEFERRED COMPENSATION LINKED TO FUTURE PERFORMANCE
MS 2015 CEO Compensation Elements
$ Million
$21.0 Million
72%Deferred
2015 Total Compensation
28%Current
5.9
4.6
1.5
39%
% of Deferred % of Total
Performance-Vested
Long-Term Equity
Incentive Compensation
31%Deferred
Equity
4.6
4.4Cash Bonus
Base Salary
Deferred Cash31%
Performance-Vested Long-Term Incentive Compensation
• Realizable value determined after three years (2016-2018), based equally on two performance metrics: target average ROE of 10% and shareholder returns relative to the S&P Financials Index
• Shares delivered can range from 0 – 1.5x target, depending on performance relative to target. TSR portion will not exceed 1.0x, if there is negative TSR for the performance period
• Subject to cancellation and clawback
Deferred Incentive Compensation
Deferred Cash and Deferred Equity • Deferred over three years• Subject to cancellation and clawback
Current Compensation
Base Salary and Cash Bonus• Cash bonus was awarded consistent with the Firmwide deferral
schedule

11
MANAGEMENT CONDUCTED SHAREHOLDER OUTREACH AND IMPLEMENTED ENHANCEMENTS BASED ON FEEDBACK
Shareholder Feedback Morgan Stanley Response
• Generally supportive• Interested in minimum share
ownership requirements
• Introduced minimum share ownership requirements for CEO and NEOs (10x and 6x base salary, respectively)
Proxy Access• Many shareholders are supportive
of proxy access• The Board approved amendments to the Company’s
Bylaws effective October 2015 to implement proxy access
Disclosure• Suggested improvements to the
proxy statement to enhance readability
• Refresh of proxy design to include a proxy summary, more visuals, and clearer disclosure of considerations and decisions regarding pay
Shareholder Dilution
• Shareholders remain focused on potential shareholder dilution resulting from equity compensation
• The Firm issued 36 million shares in 2015, less than the 59 million shares repurchased in 2015
2
3
4
Executive Compensation1
12
OVERVIEW OF EICP PROPOSAL
The End Notes are an integral part of this presentation. See slide 18 for information related to the metrics presented on this page.
Proposal
• The Board of Directors recommends:- Adding 20 million shares to the EICP
Rationale
• Morgan Stanley believes that a portion of compensation should be awarded in shares to align employee and shareholder interests
• The Company last amended the plan in 2015 and requested 25 million shares, which 92% of voting shareholders approved
• The Company is requesting an additional 20 million shares, which is less than the 59 million shares repurchased by the Company in 2015
• The Company strives to maximize employee and shareholder alignment, while minimizing dilution. The share repurchase program offsets the dilutive impact of these additional shares
• The request to add performance measures will better enable performance-vested awards to be tax-deductible to Morgan Stanley under Section 162(m) of the Internal Revenue Code, which Morgan Stanley believes to be in the best interests of the Company and shareholders
Impact
- Adding regulatory factors, risk management, expense management, and contributions to community development or sustainability projects or initiatives as performance measures that could be elements of performance-vested awards over time
Overhang(1)
2014
11.8% 10.7% 10.0% 9.6% 9.3%
2015 2014 2015 Pro Forma for Issuance of20 Million
Shares as of 1/31/2016
Three-Year Average as of Year End
Annual
Burn Rate(2)
2014
2.8% 2.5% 2.3% 1.9%
2015 2014 2015
Three-Year Averageas of Year End
Annual

13
MORGAN STANLEY’S BOARD OF DIRECTORS HAS RELEVANT AND DIVERSE EXPERIENCE
The End Notes are an integral part of this presentation. See slide 18 for information related to the content presented on this page.
Board Members Select Experience(1)
James Gorman Chairman and CEO (2010)
• Previously President of MS, President of MS Wealth Management and Co-Head of Strategic Planning
Erskine B. Bowles Independent Lead Director (2005)
• Previously Co-Chair of National Commission on Fiscal Responsibility and Reform, President of University of North Carolina, White House Chief of Staff
Alistair Darling Director (2016)
• Currently Member of House of Lords in the British Parliament
• Previously Chancellor of the Exchequer, Member of House of Commons, and served in the Government of the United Kingdom
Thomas H. Glocer Operations & Technology Chair (2013)
• Previously CEO of Thomson Reuters Corporation and M&A lawyer at Davis Polk & Wardwell LLP
Robert H. Herz Audit Chair (2012)
• Currently President of Robert H. Herz LLC• Previously Chairman of Financial Accounting
Standards Board and member of the International Accounting Standards Board
Nobuyuki Hirano Director (2015)
• Currently President and CEO of Mitsubishi UFJ Financial Group (MUFG) and Chairman of The Bank of Tokyo-Mitsubishi UFJ (BTMU)
Klaus Kleinfeld Director (2012)
• Currently CEO of Alcoa Inc.• Previously President and COO of Alcoa Inc., CEO and
President of Siemens AG
Board Members Select Experience(1)
Jami Miscik Director (2014)
• Currently Co-CEO and Vice Chair of Kissinger Associates, Inc.
• Previously Global Head of Sovereign Risk at Lehman Brothers, Deputy Director for Intelligence at the CIA
Donald T. Nicolaisen Risk Chair (2006)
• Previously Chief Accountant for the SEC, Partner at PricewaterhouseCoopers
Hutham S. Olayan CMDS Chair (2006)
• Currently Principal and director of The Olayan Group and President & CEO of The Olayan Group’s U.S. operations
James W. Owens Nominating & Governance Chair (2011)
• Previously Chairman and CEO of Caterpillar Inc.
Ryosuke Tamakoshi Director (2011)
• Currently Senior Advisor of BTMU• Previously Chairman of MUFG
Perry M. Traquina Director (2015)
• Previously Chairman, CEO, and Managing Partner of Wellington Management Company LLP
Rayford Wilkins, Jr. Director (2013)
• Previously CEO of Diversified Businesses of AT&T Inc.
= New Director in 2015-2016(Year) = Year Director joined Board
14
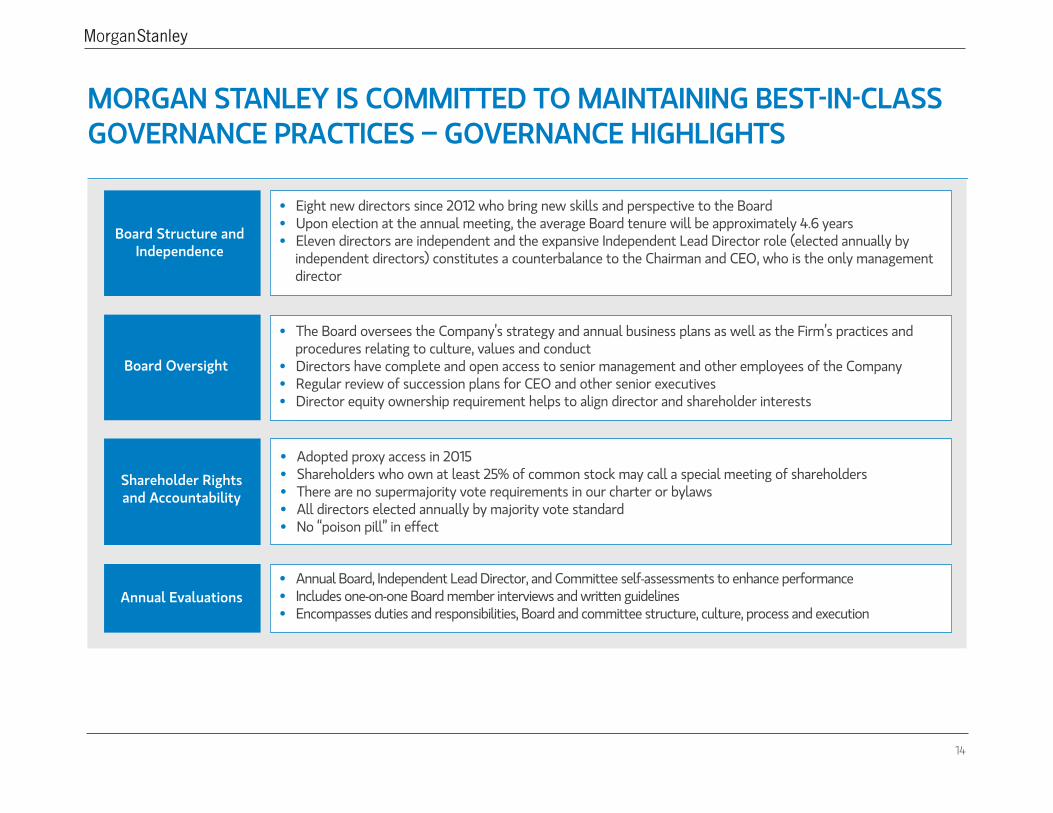
MORGAN STANLEY IS COMMITTED TO MAINTAINING BEST-IN-CLASS GOVERNANCE PRACTICES – GOVERNANCE HIGHLIGHTS
• Eight new directors since 2012 who bring new skills and perspective to the Board • Upon election at the annual meeting, the average Board tenure will be approximately 4.6 years• Eleven directors are independent and the expansive Independent Lead Director role (elected annually by
independent directors) constitutes a counterbalance to the Chairman and CEO, who is the only management director
Board Structure and Independence
Board Oversight
• The Board oversees the Company’s strategy and annual business plans as well as the Firm’s practices and procedures relating to culture, values and conduct
• Directors have complete and open access to senior management and other employees of the Company• Regular review of succession plans for CEO and other senior executives• Director equity ownership requirement helps to align director and shareholder interests
Shareholder Rights and Accountability
• Adopted proxy access in 2015• Shareholders who own at least 25% of common stock may call a special meeting of shareholders • There are no supermajority vote requirements in our charter or bylaws• All directors elected annually by majority vote standard• No “poison pill” in effect
Annual Evaluations• Annual Board, Independent Lead Director, and Committee self-assessments to enhance performance • Includes one-on-one Board member interviews and written guidelines• Encompasses duties and responsibilities, Board and committee structure, culture, process and execution

15
MORGAN STANLEY’S BOARD OF DIRECTORS RECOMMENDS SHAREHOLDERS VOTE AGAINST PROPOSAL TO EXCLUDE VOTES TO ABSTAIN FROM SHAREHOLDER PROPOSAL VOTE COUNTS
Reasons to Vote “Against”
• We clearly explain our vote counting standards in our proxy statement. Our methodology honors the intent of shareholders who consciously “abstain” and expect their abstentions to be counted in the manner described in the proxy statement
• Our vote counting methodology applies equally to Company-sponsored proposals and shareholder proposals and is consistent with the default treatment of abstentions under Delaware law. We also clearly disclose that abstentions have no impact on director elections, which we believe is consistent with best corporate governance and applies equally to candidates nominated by the Company or a shareholder
• We do not believe there is justification for the proponent’s request to treat Company-sponsored and shareholder proposals differently. Our Board believes that as a matter of good governance a majority of shareholders should affirmatively vote “for” an item for it to pass
• A vote counting proposal similar to the proponents’ proposal (but which would have applied to both Company-sponsored and shareholder proposals) received less than 5% shareholder support at our 2015 annual meeting

16
MORGAN STANLEY’S BOARD OF DIRECTORS RECOMMENDS SHAREHOLDERS VOTE AGAINST PROPOSAL TO ADOPT A POLICY TO PROHIBIT VESTING OF DEFERRED EQUITY AWARDS FOR SENIOR EXECUTIVES WHO RESIGN TO ENTER GOVERNMENT SERVICE
Reasons to Vote “Against”
• Vesting and payout of deferred compensation when an employee leaves Morgan Stanley to enter government service occurs only in the event that an employee is required by his or her new government employer to eliminate Morgan Stanley deferred award holdings to avoid a conflict of interest
• Even after payout, awards remain subject to clawback for the full deferral period if the employee triggers a cancellation event, including competitive activity
• Our Governmental Service Termination clause reinforces our culture of public service and is aligned with the long-term interests of Morgan Stanley and our shareholders in attracting and retaining talented employees
• A proposal by the proponent requesting a report on vesting of deferred equity compensation for senior executives due to government service received less than 15% shareholder support at our 2015 annual meeting

17
The following notes are an integral part of the Company’s financial and operating performance described in this presentation:
General• A detailed analysis of the Company’s financial and operational performance for 2015 is contained in the Management’s Discussion and Analysis of Financial Condition and Results
of Operations in Part II, Item 7 of the Company’s Annual Report on Form 10-K for the year ended December 31, 2015 (2015 Form 10-K).• Revenues excluding the impact of DVA, pre-tax margin, return on equity, and return on equity excluding the impact of DVA are non-GAAP financial measures that the Company
considers useful measures for investors to assess operating performance. For further information regarding these measures, see pages 41 – 45 of the 2015 Form 10-K.• DVA represents the change in fair value of certain of the Company’s long-term and short-term borrowings outstanding resulting from the fluctuation in the Company’s credit
spreads and other credit factors. The Company believes that most investors assess its operating performance exclusive of DVA.
Page 41. For this purpose, peer group includes (i) five large U.S. banks: Bank of America, Citigroup, Goldman Sachs, JPMorgan Chase, and Wells Fargo; and (ii) other financial companies in
S&P 100 index: AIG, Allstate, American Express, BNY Mellon, Capital One, Mastercard, MetLife, and US Bancorp.
Page 51. Pre-tax margin is calculated as income (loss) from continuing operations before taxes as a percentage of net revenues. Pre-tax margin is a non-GAAP financial measure that the
Company considers useful for investors to assess operating performance.2. U.S. Bank refers to the Company’s U.S. Bank operating subsidiaries Morgan Stanley Bank, N.A. and Morgan Stanley Private Bank, National Association, and excludes transactions
with affiliated entities.3. Net interest income (NII) growth in U.S. Bank represents the total year-over-year NII percentage increase for the Company’s U.S. Bank operating subsidiaries. The increase in
Wealth Management lending reflects the year-over-year growth in securities-based, tailored, and residential real estate loans conducted through the U.S. Bank. 4. Institutional Equities revenue market share and resulting rank are based on the sum of the reported net revenues for the equity sales and trading businesses of Morgan
Stanley and the following peers: Bank of America, Citigroup, Goldman Sachs, JPMorgan Chase, UBS, Deutsche Bank, Credit Suisse, and Barclays; where applicable, the reported net revenues exclude DVA. Equity sales and trading net revenues, ex-DVA is a non-GAAP financial measure that the Company considers useful for investors to allow better comparability of period to period operating performance. The Company’s capital markets rankings are reported by Thomson Reuters as of January 4, 2016 for the period of January 1, 2015 to December 31, 2015.
5. Institutional Securities compensation ratios, ex-DVA of 37% and 48% for 2015 and 2014, respectively, represent the segment’s compensation and benefits expense (2015: $6,467 million; 2014: $7,786 million) as a percentage of net revenues, ex-DVA (2015: $17,335 million, excluding the positive impact of $618 million from DVA; 2014: $16,220 million, excluding the positive impact of $651 million from DVA). The 2014 compensation ratio of 42% also excludes $904 million of compensation and benefits expense associated with the 2014 compensation actions. For further information regarding the discretionary incentive compensation actions taken in 2014, see page 68 of the 2015 Form 10-K. The Institutional Securities compensation ratio, ex-DVA and the impact of the 2014 compensation actions, are non-GAAP financial measures the Company considers useful for investors to assess operating performance.
END NOTES

18
Page 61. The calculation of ROE uses net income applicable to Morgan Stanley less preferred dividends as a percentage of average common equity. To determine ROE, ex-DVA both
the numerator and denominator were adjusted to exclude the impacts of DVA. ROE and ROE, ex-DVA are non-GAAP financial measures that the Company considers useful for investors to assess operating performance.
2. ROE, ex-DVA is one of the measures the CMDS Committee utilizes to evaluate the Company’s financial performance. The 2015 ROE, ex-DVA of 8.0% differs from the operating ROE, ex-DVA measure of 7.0% referred to by the Company in the January 19, 2016 Strategic Update. The calculation of operating ROE excludes the impacts of DVA and net discrete tax benefits recognized by the Company in both the numerator and denominator. The impact of net discrete tax benefits on ROE, ex-DVA was: 0.8% in 2015; 3.3% in 2014; 0.6% in 2013; 0.2% in 2012; and 0.8% in 2011.
3. ROE, ex-DVA in 2014 includes the after tax impact of the costs and charges discussed in note (5) and net discrete tax benefits of $2,226 million. For further information regarding these items, see pages 39 and 40 of the 2015 Form 10-K.
4. Net revenues and pre-tax profit exclude the impact of DVA for each of the years presented. Positive (negative) revenues from DVA were: $618 in 2015; $651 million in 2014; ($681) million in 2013; ($4,402) million in 2012; and $3,681 million in 2011. Net revenues and pre-tax profit, ex-DVA are non-GAAP financial measures that the Company considers useful for investors to assess operating performance.
5. Pre-tax profit in 2014 includes litigation costs related to residential mortgage-backed securities and credit crisis matters of $3,083 million, 2014 compensation actions of approximately $1,137 million, and a funding valuation adjustment (FVA) implementation charge of $468 million. For further information regarding these items, see page 39 of the 2015 Form 10-K.
Page 71. Source for Peer Companies: Company Filings.
Page 81. TSR represents the change in share price over a period of time plus the dividends paid during such period, expressed as a percentage of the share price at the beginning of
such period. 2. Source for Peer Companies: Bloomberg.
Page 121. Overhang represents the number of shares underlying outstanding equity awards and available for future equity awards as a percent of weighted average common shares
outstanding for the period.2. Burn rate represents the number of shares granted per year pursuant to equity awards as a percent of weighted average common shares outstanding for the period.
Page 131. For a detailed description of each director’s professional experience and qualifications, skills and attributes, see “Director Nominees” in the 2016 Proxy Statement.
END NOTES (CONT’D)

19
The information provided herein may include certain non-GAAP financial measures. The definition of such financial measures and/or the reconciliation of such measures to the comparable GAAP figures are included in the Company’s Annual Report on Form 10-K for the year ended December 31, 2015, which is available on www.morganstanley.com, or within this presentation. The endnotes on pages 17 and 18 are an integral part of this presentation.
This presentation may contain forward-looking statements. You are cautioned not to place undue reliance on forward-looking statements, which speak only as of the date on which they are made, which reflect management’s current estimates, projections, expectations or beliefs and which are subject to risks and uncertainties that may cause actual results to differ materially. For a discussion of risks and uncertainties that may affect the future results of the Company, please see the Company’s Annual Report on Form 10-K for the year ended December 31, 2015.
The statements in this presentation are current only as of their respective dates.
NOTICE