Morgan Stanley Compensation & Governance Practices · 2020-06-14 · MORGAN STANLEY’S BOARD OF...
16
Morgan Stanley Compensation & Governance Practices April 2020
Transcript of Morgan Stanley Compensation & Governance Practices · 2020-06-14 · MORGAN STANLEY’S BOARD OF...

Morgan Stanley Compensation &Governance PracticesApril 2020

MORGAN STANLEY’S BOARD OF DIRECTORS RECOMMENDSSHAREHOLDERS VOTE:
• FOR: Three Management Proposals
1 Approve the compensation of named executive officers (Say on Pay non-binding advisory vote)
– At the start of 2019, as in prior years, the Compensation, Management Development and Succession (CMDS)Committee established a target range of CEO compensation as well as the factors to be considered in determiningyear-end compensation
– Based on an evaluation of full-year 2019 Firm and CEO performance, the CMDS Committee set CEO totalcompensation at $27 million, with shareholder aligned features
– Under Mr. Gorman’s leadership, the Firm achieved record 2019 revenues of $41Bn and net income of $9Bn and met allstated performance objectives. Despite these accomplishments, CEO compensation was down 7% from the prior year inlight of the Firm’s focus on expense discipline, including with respect to discretionary compensation, and the employeereduction at the end of the year
– Consistent with previous years and shareholder feedback, 75% of CEO incentive compensation is deferred and subjectto clawback over three years, 100% of CEO deferred incentive compensation is delivered in equity awards and 50% ofCEO incentive compensation is delivered in a performance-vested long-term equity incentive award
2 Elect all Director nominees
3 Ratify Deloitte & Touche LLP’s appointment as the Firm’s independent auditor
2
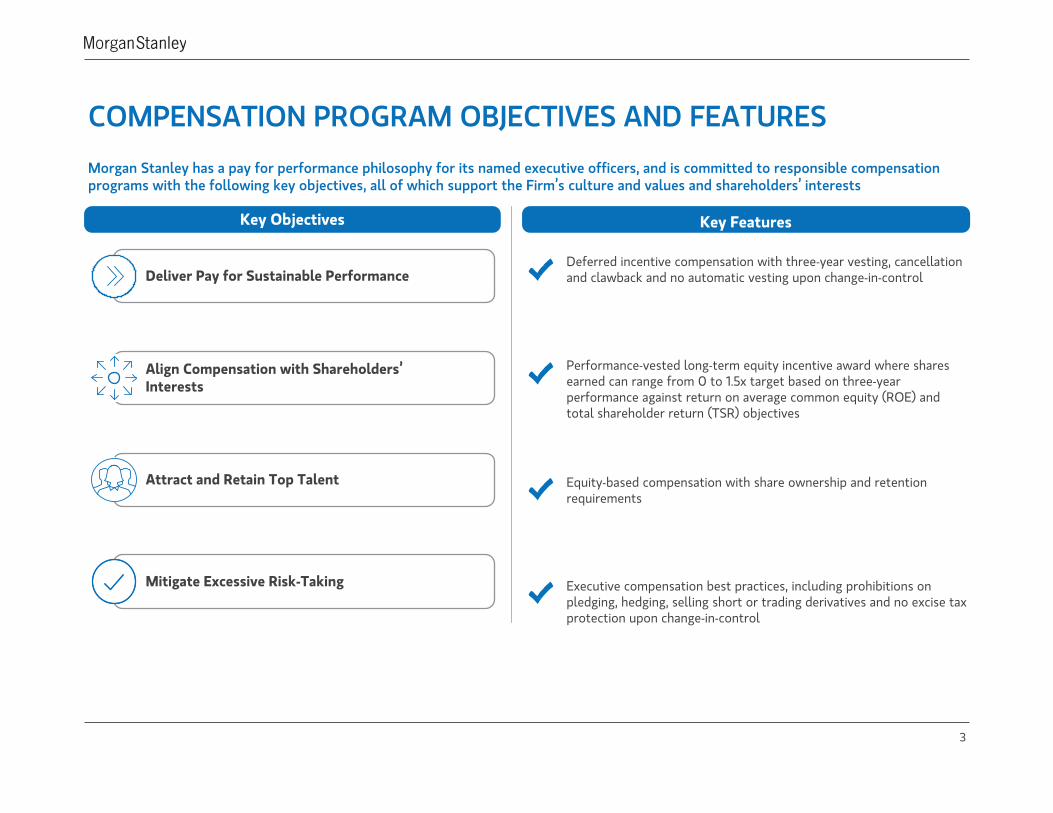
COMPENSATION PROGRAM OBJECTIVES AND FEATURES
Morgan Stanley has a pay for performance philosophy for its named executive officers, and is committed to responsible compensationprograms with the following key objectives, all of which support the Firm’s culture and values and shareholders’ interests
Key Objectives Key Features
Deliver Pay for Sustainable Performance
Align Compensation with Shareholders’Interests
Attract and Retain Top Talent
Mitigate Excessive Risk-Taking
Deferred incentive compensation with three-year vesting, cancellationand clawback and no automatic vesting upon change-in-control
Performance-vested long-term equity incentive award where sharesearned can range from 0 to 1.5x target based on three-yearperformance against return on average common equity (ROE) andtotal shareholder return (TSR) objectives
Equity-based compensation with share ownership and retentionrequirements
Executive compensation best practices, including prohibitions onpledging, hedging, selling short or trading derivatives and no excise taxprotection upon change-in-control
3

FRAMEWORK FOR DETERMINING CEO COMPENSATIONMorgan Stanley has a robust process that supports and reinforces the pay for performance philosophy that incorporates the following keysteps:
Set Performance Priorities
In the context of the Firm’sstrategic objectives, the Board setsannual performance priorities
Priorities include both financialand non-financial performancemetrics for the Firm and itsbusiness segments
Establish TargetCompensation Range
Assess Performance
The CMDS Committee determinesCEO compensation after year endbased on its performanceassessment and discussion withthe Board
The CMDS Committee determinesCEO compensation elements thatsupport the Firm’s keycompensation objectives
Determine Compensation
The CMDS Committee establishesthe target CEO compensationrange
The range is informed by prioryear CEO compensation atpeer financial firms, amongother factors
Guidelines for performanceassessment are outlined
The CMDS Committee assessesFirm and executive performance atyear end, including:
Progress in achieving the Firm’sstrategic objectives and annualperformance priorities
The CEO’s overall leadership
1 2 3 4
CEO performance exceeds expectations
Strong Firm performance and shareholder returns
CEO performance meets expectations
Firm performance and shareholder returns generally in line with peers with roomfor continued progress
CEO performance below expectations
Firm performance and shareholder returns are below expectations
$28 Million or More
$10 Million or Less
Target Compensation Range(1)
The End Notes are an integral part of this presentation. See slide 13 for information related to the content presented on this page.
4

STRATEGIC OBJECTIVES: MARK TO MARKET(1)
2018 – 2019 Objectives 2019 Results
1 Deliver Wealth Mgmt. Pre-Tax Margin(2)
of 26 – 28%✓ Pre-Tax Margin(2) of 27.2%
2 Expand ISG Penetration and Leadership ✓Revenues of $20.4Bn; solid performance
despite mixed market backdrop
3 Position Investment Management forGrowth ✓ Revenues of $3.8Bn; AUM up 19% with
net long-term flows(3)
4 Realize Firm Expense Efficiency Ratio(4)
of ≤73% ✓ Expense Efficiency Ratio(4) of 73%
5 Maintain Attractive Capital Return Profile ✓ Increased aggregate distribution to $7.5Bn(up 10% vs. 2018)(5)
Medium Term 2019 Results
ROE(6): 10 – 13%ROTCE(7): 11.5% – 14.5% ✓
ROE(6): 11.2%ROTCE(7): 12.9%
The End Notes are an integral part of this presentation. See slide 13 for information related to the content presented on this page.
5
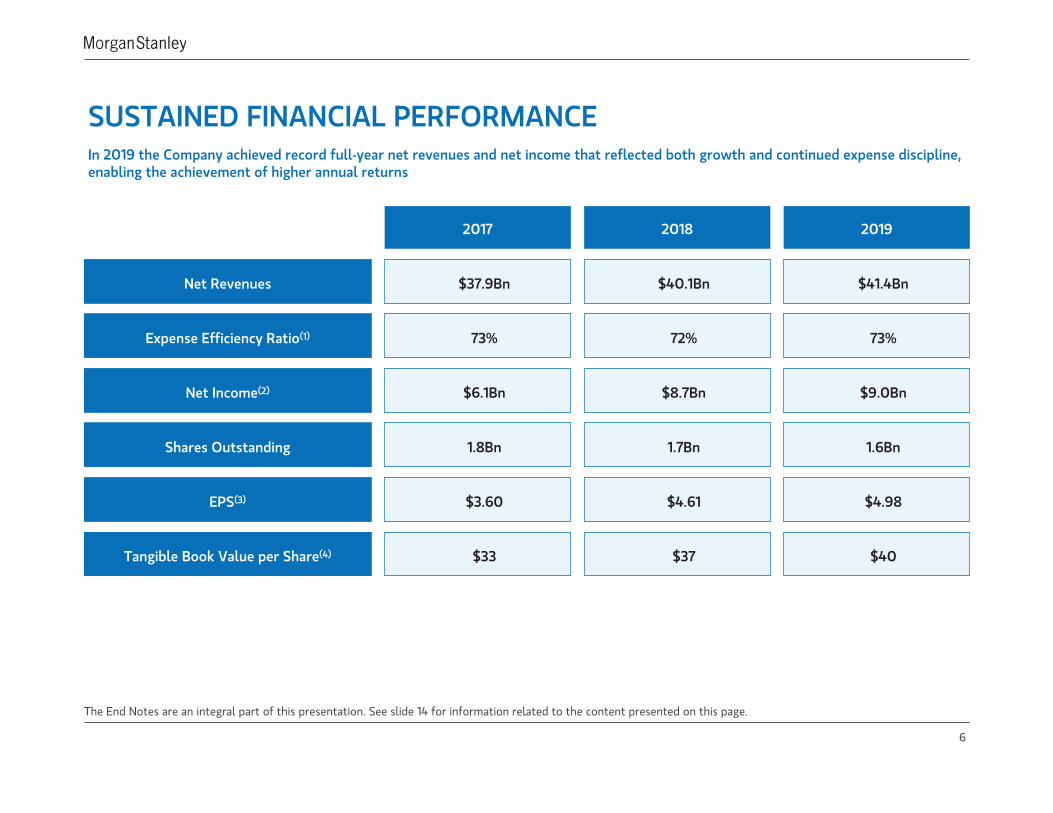
SUSTAINED FINANCIAL PERFORMANCEIn 2019 the Company achieved record full-year net revenues and net income that reflected both growth and continued expense discipline,enabling the achievement of higher annual returns
2017 2018 2019
Net Revenues $37.9Bn $40.1Bn $41.4Bn
Expense Efficiency Ratio(1) 73% 72% 73%
Net Income(2) $6.1Bn $8.7Bn $9.0Bn
Shares Outstanding 1.8Bn 1.7Bn 1.6Bn
EPS(3) $3.60 $4.61 $4.98
Tangible Book Value per Share(4) $33 $37 $40
The End Notes are an integral part of this presentation. See slide 14 for information related to the content presented on this page.
6

STRONG RETURNS AND SUFFICIENT CAPITAL SUPPORT FUTUREINVESTMENT
Attractive Capital Return Profile Ability to Invest for Growth
Capital Return(1)
(Calendar Year – $Bn)Capital(3)
(End of Period – $Bn)
1.7
5.4 1.9
3.84.9
2.2
5.4
6.87.5
2017 2018 2019
Dividend
Buyback
60 63 64
6972 73
2017 2018 2019
Capital Sufficient
CommonEquityTangible
CommonEquity(4)
Return on Equity and Return onTangible Common Equity (%)(2)
9.411.5
11.2
10.8
12.913.2
2017 2018 2019
ROE
ROTCE
The End Notes are an integral part of this presentation. See slide 14 for information related to the content presented on this page.
7

EXECUTION OF STRATEGIC OBJECTIVES GENERATES CONSISTENTSHAREHOLDER RETURN
1-Year (2019) TSR(1)(2) 3-Year (2017-2019) TSR(1)(2)(3) 5-Year (2015-2019) TSR(1)(2)(4)
MorganStanley
S&P 500Fin. Index
Avg. GlobalPeers(3)
14%
30%
40%
32%33%31%
MorganStanley
S&P 500Fin. Index
Avg. GlobalPeers(3)
28%
47%
70%
MorganStanley
S&P 500Fin. Index
Avg. GlobalPeers(5)
The End Notes are an integral part of this presentation. See slide 14 for information related to the content presented on this page.
8

CEO COMPENSATION DETERMINATIONAt year end, the CMDS Committee assessed CEO and Firm performance, discussed that assessment with the Board, and established 2019CEO compensation
MS 2019 Performance Evaluation
Record performance in 2019driven by strong revenue growth
+
Significant progress on 2018 –2019 strategic objectives andstrong focus on the next phaseof shareholder value
+
Outstanding leadership, includingwith respect to Company culture,and among clients, shareholders,regulators, and employees
+
Company’s focus on expensediscipline, including with respectto discretionary compensation,and the employee reduction atthe end of the year
-
2019 CEO Compensation Elements ($MM)
50%
25%
25%
$27MM
100%EquityIncentiveCompensation
1.5
% of IncentiveCompensation
12.8Performance-Vested Long-TermEquity IncentiveCompensation
Base Salary
6.4Cash Bonus
6.4Time-VestedDeferred EquityIncentiveCompensation
Proxy Summary Compensation Table View: $31.6MM(Current year cash + prior year stock awards)(1)
The End Notes are an integral part of this presentation. See slide 15 for information related to the content presented on this page.
9

MORGAN STANLEY IS COMMITTED TO MAINTAINING BEST INCLASS GOVERNANCE PRACTICES
Board Oversight
• Oversees Firm’s strategy, annual business plans, Enterprise Risk Management (ERM) framework, andculture, values and conduct
• Reviews succession plans for CEO and senior executives and strategic progress• Conducts annual offsite with management to review long-term strategy
Shareholder Rightsand Accountability
• Adopted proxy access• Shareholders who own at least 25% of common stock may call special meeting of shareholders• All directors elected annually by majority vote• No “poison pill” in effect
Annual Evaluations
• Board, Independent Lead Director and Committee self-assessments• One-on-one Board member interviews and written guidelines• Encompasses duties and responsibilities, individual director performance, Board and committee
structure, culture, process and execution
Sustainability andGiving Back
• Advance sustainable investing through our businesses• Enhanced management of our carbon footprint and environmental and social risk• Committed to giving back, one of our core values
ShareholderEngagement
• Board and management values the views of shareholders• Investor input has led to proxy access and enhanced proxy disclosure of: Board evaluations, director
orientation/education, succession planning, Environmental, Social, and Governance matters andalignment of compensation and performance
10

BOARD OF DIRECTORS HAS RELEVANT AND DIVERSE EXPERIENCEBoard Tenure Balance Board Independence
3-6 years: 5
6-8 years: 3
< 3 years: 4
> 8 years: 2
Average Tenure: 5.4 years*
* Average tenure of directors is calculated based on length of completedBoard service from date of initial election through the date of the annualmeeting and prior Board service, as appropriate.
Non-Management: 13
Management: 1
All Board committees are comprised of non-management directors,and the Board benefits from an engaged Independent Lead Director(1)
with expansive responsibilities
International Experience Director Experience, Qualifications, Attributes and Skills
Asia
Middle East
Australia
Europe
North America
Leadership(including,
strategic planning)(14)
International /Global
Perspective(12)
Financial Services/ Market
Experience(10)
Finance /AccountingExpertise
(11)
Risk Management(10)
Operations /Technology
(10)
Talent(management
development andsuccession)
(11)
Public Policy /Sustainability
(6)
Public CompanyExperience /Corporate
Governance(11)
Board Succession and Diversity
4 new directors since the beginningof 2018
4 female directors10 directors who are current orformer CEOs
6 directors born outside the UnitedStates
The End Notes are an integral part of this presentation. See slide 15 for information related to the content presented on this page.
11

THE MORGAN STANLEY BOARD OF DIRECTORSThe Board continues to recruit directors to bring new skills and perspectives into the Boardroom
Board Members Select Experience(1)
James GormanChairman and CEO(2010)
• Previously President of MS, President of MS WealthManagement and Co-Head of Strategic Planning
Elizabeth CorleyDirector (2018)
• Previously Senior Advisor, non-executive Vice Chair and globalCEO of Allianz Global Investors (U.K.) Ltd.
Alistair DarlingDirector (2016)
• Currently Member of House of Lords in the British Parliament• Previously Chancellor of the Exchequer, Member of House of
Commons, and served in the Government of the UnitedKingdom
Thomas H. GlocerIndependent LeadDirector (2013)
• Previously CEO of Thomson Reuters Corporation and M&Alawyer at Davis Polk & Wardwell LLP
Robert H. HerzAudit Chair (2012)
• Currently President of Robert H. Herz LLC• Previously Chairman of Financial Accounting Standards Board
and member of the International Accounting Standards Board
Nobuyuki HiranoDirector (2015*)
• Currently Chairman of Mitsubishi UFJ Financial Group, Inc.(MUFG) and Director of MUFG Bank, Ltd. (MUFG Bank)
• Previously President and Group CEO of MUFG and Chairman ofMUFG Bank
Stephen LuczoDirector (2019)
• Chairman of the Board at Seagate Technology; previouslyExecutive Chairman and CEO
* Previously served as a director of Morgan Stanley from 2009 to 2011
Board Members Select Experience(1)
Jami MiscikOperations &Technology Chair(2014)
• Currently CEO and Vice Chair of Kissinger Associates, Inc.• Previously Global Head of Sovereign Risk at Lehman Brothers
and Deputy Director for Intelligence at the CIA
Dennis M. NallyDirector (2016)
• Previously Chairman of PricewaterhouseCoopers InternationalLtd.
Takeshi OgasawaraDirector (2019)
• Currently Advisor to MUFG Bank• Previously Deputy President of MUFG Bank
Hutham S. OlayanCMDS Chair (2006)
• Currently Chair and principal and director of The OlayanGroup
• Previously President & CEO of the Olayan Group’s U.S.Operations
Mary L. SchapiroDirector (2018)
• Currently Vice Chair for Public Policy and Special Advisor tothe Founder and Chairman of Bloomberg L.P.
• Previously Chair of U.S. Securities and Exchange Commission,Chair and CEO of Financial Industry Regulatory Authority andChair of the Commodity Futures Trading Commission
Perry M. TraquinaRisk Chair (2015)
• Previously Chairman, CEO and Managing Partner ofWellington Management Company LLP
Rayford Wilkins, Jr.Nominating &Governance Chair(2013)
• Previously CEO of Diversified Businesses of AT&T Inc.
(Year) = Year Director joined Board � = New Director in 2018-2019
The End Notes are an integral part of this presentation. See slide 15 for information related to the content presented on this page.
12
END NOTES
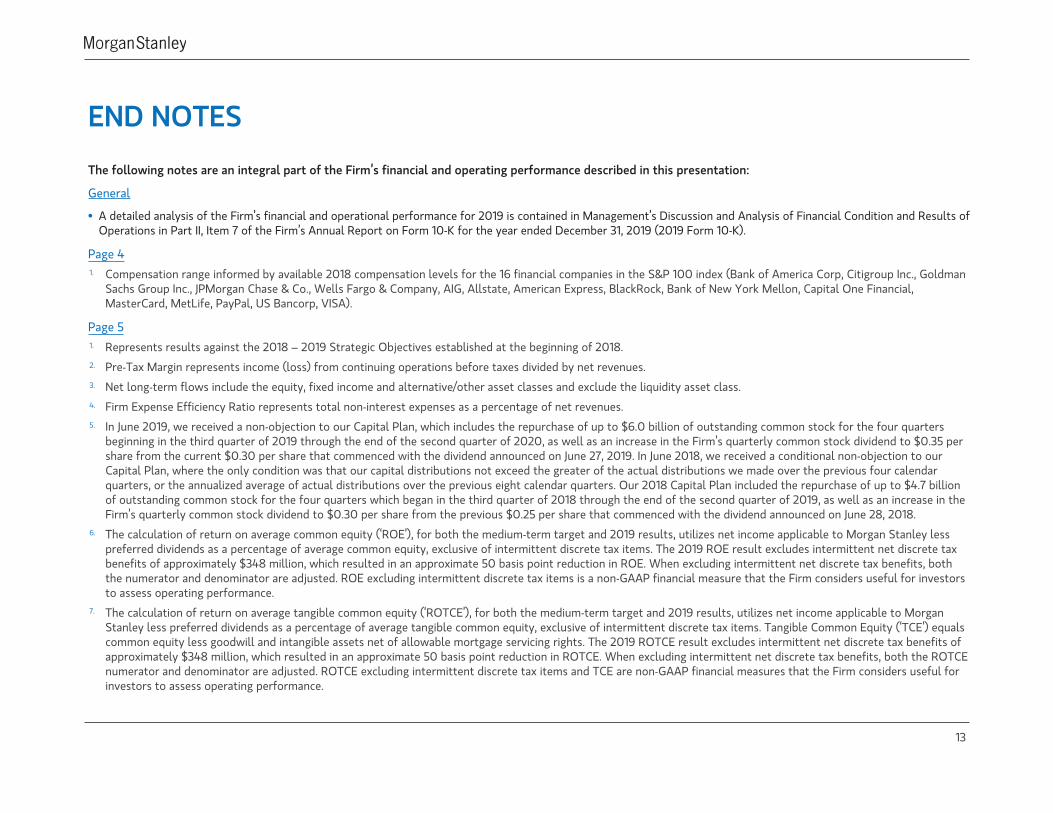
The following notes are an integral part of the Firm’s financial and operating performance described in this presentation:
General
• A detailed analysis of the Firm’s financial and operational performance for 2019 is contained in Management’s Discussion and Analysis of Financial Condition and Results ofOperations in Part II, Item 7 of the Firm’s Annual Report on Form 10-K for the year ended December 31, 2019 (2019 Form 10-K).
Page 41. Compensation range informed by available 2018 compensation levels for the 16 financial companies in the S&P 100 index (Bank of America Corp, Citigroup Inc., Goldman
Sachs Group Inc., JPMorgan Chase & Co., Wells Fargo & Company, AIG, Allstate, American Express, BlackRock, Bank of New York Mellon, Capital One Financial,MasterCard, MetLife, PayPal, US Bancorp, VISA).
Page 51. Represents results against the 2018 – 2019 Strategic Objectives established at the beginning of 2018.
2. Pre-Tax Margin represents income (loss) from continuing operations before taxes divided by net revenues.
3. Net long-term flows include the equity, fixed income and alternative/other asset classes and exclude the liquidity asset class.
4. Firm Expense Efficiency Ratio represents total non-interest expenses as a percentage of net revenues.
5. In June 2019, we received a non-objection to our Capital Plan, which includes the repurchase of up to $6.0 billion of outstanding common stock for the four quartersbeginning in the third quarter of 2019 through the end of the second quarter of 2020, as well as an increase in the Firm’s quarterly common stock dividend to $0.35 pershare from the current $0.30 per share that commenced with the dividend announced on June 27, 2019. In June 2018, we received a conditional non-objection to ourCapital Plan, where the only condition was that our capital distributions not exceed the greater of the actual distributions we made over the previous four calendarquarters, or the annualized average of actual distributions over the previous eight calendar quarters. Our 2018 Capital Plan included the repurchase of up to $4.7 billionof outstanding common stock for the four quarters which began in the third quarter of 2018 through the end of the second quarter of 2019, as well as an increase in theFirm’s quarterly common stock dividend to $0.30 per share from the previous $0.25 per share that commenced with the dividend announced on June 28, 2018.
6. The calculation of return on average common equity (‘ROE’), for both the medium-term target and 2019 results, utilizes net income applicable to Morgan Stanley lesspreferred dividends as a percentage of average common equity, exclusive of intermittent discrete tax items. The 2019 ROE result excludes intermittent net discrete taxbenefits of approximately $348 million, which resulted in an approximate 50 basis point reduction in ROE. When excluding intermittent net discrete tax benefits, boththe numerator and denominator are adjusted. ROE excluding intermittent discrete tax items is a non-GAAP financial measure that the Firm considers useful for investorsto assess operating performance.
7. The calculation of return on average tangible common equity (‘ROTCE’), for both the medium-term target and 2019 results, utilizes net income applicable to MorganStanley less preferred dividends as a percentage of average tangible common equity, exclusive of intermittent discrete tax items. Tangible Common Equity (‘TCE’) equalscommon equity less goodwill and intangible assets net of allowable mortgage servicing rights. The 2019 ROTCE result excludes intermittent net discrete tax benefits ofapproximately $348 million, which resulted in an approximate 50 basis point reduction in ROTCE. When excluding intermittent net discrete tax benefits, both the ROTCEnumerator and denominator are adjusted. ROTCE excluding intermittent discrete tax items and TCE are non-GAAP financial measures that the Firm considers useful forinvestors to assess operating performance.
13

END NOTES (CONT.)
Page 61. Efficiency Ratio represents total non-interest expenses as a percentage of net revenues.2. Net Income represents net income applicable to Morgan Stanley.
3. The calculation of EPS uses Net Income applicable to Morgan Stanley less preferred dividends divided by Average diluted common shares outstanding. EPS for 2017,2018 and 2019 exclude the impact of intermittent net discrete tax items of $(968)MM, $203MM and $348MM respectively. EPS excluding intermittent net discrete taxitems is a non-GAAP measure that the Firm considers useful for analysts, investors and other stakeholders to assess operating performance.
4. Tangible Book Value per Common Share (‘Tangible Book Value per Share’) equals reported Tangible Common Equity divided by period end common shares outstanding.Tangible Book Value per Share is a non-GAAP financial measure that the Firm considers useful for analysts, investors and other stakeholders to assess operatingperformance.
Page 71. Capital Return represent actual shares repurchased and dividends distributed during the year noted, representing a blend of two sequential CCAR cycles.2. The calculations of ROE and ROTCE for each year utilize net income applicable to Morgan Stanley less preferred dividends as a percentage of average common equity
and average tangible common equity, respectively, exclusive of intermittent discrete tax items. The 2019 ROE and ROTCE percentages exclude intermittent net discretetax benefits of approximately $348 million (an approximate 50 basis point reduction). For reconciliations of ROE and ROTCE, excluding intermittent discrete tax itemsfor 2017 and 2018, see pages 27 and 28 of the 2019 Form 10-K. When excluding intermittent net discrete tax items, both the ROE and ROTCE numerators anddenominators are adjusted. Beginning in 2017, income tax consequences associated with employee share-based awards are recognized in the provision for income taxes inthe income statement, but are excluded from the intermittent net discrete tax items adjustment, as we anticipate conversion activity each year. ROE and ROTCE,excluding intermittent discrete tax items, are non-GAAP financial measures that the Firm considers useful for investors to assess year-over-year operating performance.
3. The 2019 Common Equity and Tangible Common Equity exclude intermittent net discrete tax benefits of approximately $348 million. For reconciliations of CommonEquity and Tangible Common Equity, excluding intermittent discrete tax items for 2017 and 2018, see pages 27 and 28 of the 2019 Form 10-K. Common Equity andTangible Common Equity, excluding intermittent discrete tax items, are non-GAAP financial measures that the Firm considers useful for investors to assess capitaladequacy.
4. Tangible Common Equity (‘TCE’) equals common equity less goodwill and intangible assets net of allowable mortgage servicing rights. TCE is a non-GAAP financialmeasure that the Firm considers useful for investors to assess capital adequacy.
Page 81. Total Shareholder Return represents the change in share price over a period of time plus the dividends paid during such period, expressed as a percentage of the share
price at the beginning of such period (defined herein as “TSR”).2. Source: Bloomberg.3. Share prices pulled as of 12/30/2016 and 12/31/2019 to calculate 3-year TSR.4. Share prices pulled as of 1/31/2014 and 12/31/2019 to calculate 5-year TSR.5. Global peers include: Goldman Sachs, JP Morgan Chase, Bank of America, Citigroup, Barclays, UBS Group, Deutsche Bank, and Credit Suisse.
14

END NOTES (CONT.)
Page 91. Pursuant to SEC rules, the Summary Compensation Table in the Firm’s proxy statement is required to include for a particular year, only those equity awards granted
during the year, rather than awards granted after year end that were awarded for performance in that year. Our annual equity awards relating to performance in a yearare made shortly after year end. Therefore, the Summary Compensation Table that appears in the Firm’s 2020 proxy statement includes not only non-equitycompensation awarded for service in 2019, but also stock awards and forward-looking performance vested compensation in respect of performance in 2018, in each casegranted in 2019.
Page 11
1. As part of his or her formal duties and responsibilities, the Independent Lead Director shall:
– Preside at all meetings of the Board at which the Chairman is not present;
– Have the authority to call, and lead, Non-Management Director Sessions and Independent Director Sessions;
– Help facilitate communication among the Chairman, the CEO and the non-employee and independent directors, including serving as liaison between the Chairman andthe Independent directors;
– Solicit the non-employee directors for advice on agenda items for meetings of the Board;
– Communicate with the Chairman and the CEO between meetings and act as a “sounding board” and advisor;
– Advise the Chairman and the CEO of the Board’s informational needs;
– Approve the types and forms of information sent to the Board;
– Collaborate with the Chairman and the CEO in developing the agenda for meetings of the Board and approve Board meeting agendas and the schedule of Boardmeetings to assure that there is sufficient time for discussion of all agenda items and may request inclusion of additional agenda items;
– Be available, if requested, to meet with the Firm’s primary regulators;
– Be available, if requested by major shareholders, for consultation and direct communication in accordance with the Board Communication Policy;
– Lead the annual evaluation of the performance and effectiveness of the Board;
– Consult with the Chair of the Nominating and Governance Committee on Board succession planning and Board Committee appointments;
– Interview candidates for the Board; and
– Consult with the Chair of the CMDS Committee on the annual evaluation of the performance of the CEO
Page 121. For a detailed description of each director’s professional experience and qualifications, skills and attributes, see “Director Nominees” of the 2020 Proxy Statement.
15

NOTICE
The information provided herein may include certain non-GAAP financial measures. The definition of such financial measures and/or thereconciliation of such measures to the comparable GAAP figures are included in the Firm’s Annual Report on Form 10-K for the year endedDecember 31, 2019, which is available on www.morganstanley.com, or within this presentation. The endnotes on pages 13-15 are an integralpart of this presentation.
This presentation may contain forward-looking statements. You are cautioned not to place undue reliance on forward-looking statements,which speak only as of the date on which they are made, which reflect management’s current estimates, projections, expectations or beliefsand which are subject to risks and uncertainties that may cause actual results to differ materially. For a discussion of risks and uncertaintiesthat may affect the future results of the Firm, please see the Firm’s Annual Report on Form 10-K for the year ended December 31, 2019.
The statements in this presentation are current only as of their respective dates.
16