
INDIACHINA TIGERS PART IIFinal - IBEF · Morgan Stanley Dean Witter Asia Limited...
92
June 2006
Transcript of INDIACHINA TIGERS PART IIFinal - IBEF · Morgan Stanley Dean Witter Asia Limited...
June 2006

JM MORGAN STANLEY
India and China: New Tigers of Asia, Part II Chetan Ahya JM Morgan Stanley Securities Private Limited [email protected]
Andy Xie Morgan Stanley Dean Witter Asia Limited [email protected]
Stephen S. Roach Morgan Stanley & Co. Incorporated [email protected]
Mihir Sheth JM Morgan Stanley Securities Private Limited [email protected]
Denise Yam Morgan Stanley Dean Witter Asia Limited [email protected]
June 2006

5
JM MORGAN STANLEY
M O R G A N S T A N L E Y R E S E A R C H
June 2006 India and China: New Tigers of Asia – Part II
Preface This report is the second part of “India and China: New Tigers of Asia”. The first, published in July 2004, assessed the long-term outlook for the two economies during a period of rapid globalization. We highlighted how the rise of India and China is the most significant economic force in the world economy and their growing presence will continue to change the rules that underpin the structure of global manufacturing and services output. In “New Tigers of Asia, Part II”, we focus on the challenges the two economies now face to maintain their growth trajectories beyond the current boom.
Our longer term view on India and China has been reaffirmed over the past two years. The huge surplus in India’s and China’s working-age populations has forced the world economy to recognize their roles in the global competitive dynamic. Both markets are increasingly integral to the business strategies of multinational companies and are viewed as structural drivers for global productivity and disinflation. By 2015, we forecast India’s GDP will cross the US$2 trillion mark while China’s will surpass US$6 trillion, driven by the powerful combination of favorable demographics, structural reforms and globalization. We expect the two economies to be the dominant secular growth stories for the next 30 years.
In the short to medium term, however, there will be challenges for both economies. Before these are addressed, we expect some slowdown in the growth momentum. India and China are at a critical juncture where they need to reassess their growth models and initiate difficult policy reforms for the current strong growth trend to be sustained. We see the greatest challenge as the need to balance the economic contribution of investment and consumption. India requires an aggressive investment and export thrust while cooling consumption; China needs to slow its investment and export drive in favor of consumption.
Headwinds common to both economies include the need to reduce unemployment, poverty, and inequality and to improve education. In addition, each country has a unique set of challenges: India has to strengthen its infrastructure, improve public finances; reform its labor laws and augment its resources through higher FDI inflows and privatization. China needs to revamp its financial system, move to a flexible currency regime, and reform its institutional framework.
Both countries require political reform to lift them to the next level of economic development. While policymakers are increasingly aware of this need, they still have to demonstrate their willingness to tackle the issues head on. In this report, we assess this willingness by analyzing the social and economic conditions in the two countries that form the backdrop to the interplay of political will and economic need.
Chetan Ahya Mumbai June 2006

6
JM MORGAN STANLEY
M O R G A N S T A N L E Y R E S E A R C H
June 2006 India and China: New Tigers of Asia – Part II
7
JM MORGAN STANLEY
M O R G A N S T A N L E Y R E S E A R C H
June 2006 India and China: New Tigers of Asia – Part II
Contents Preface ....................................................................................................................................................................5 A Tale of Two Asias ................................................................................................................................................8 Beyond the Cyclical Boom ....................................................................................................................................11 Why India and China Matter..................................................................................................................................14 Challenges Facing India and China - Some Are Similar.......................................................................................19 Transition in the Growth Model - India ..................................................................................................................20 Transition in the Growth Model - China.................................................................................................................24 Unemployment Scales New Heights.....................................................................................................................27 Poverty and Inequality...........................................................................................................................................30 Education Attainment Is Key .................................................................................................................................36 India’s Specific Challenges ...................................................................................................................................39 Infrastructure Deficiencies.....................................................................................................................................40 Weak Public Finances...........................................................................................................................................43 Outmoded Labor Laws..........................................................................................................................................48 The Need to Encourage FDI Inflows……..............................................................................................................50 ………and Privatization.........................................................................................................................................53 China’s Specific Challenges..................................................................................................................................55 Weak Banking Sector............................................................................................................................................56 Shifting to a New Currency Regime ......................................................................................................................60 The Need to Improve the Institutional Framework ................................................................................................63 Chart Scan ............................................................................................................................................................67 Growth Trends: China’s Fast Track vs. India’s Gradualism Model .......................................................................68 Consumption - Macro: China Spends Twice As Much As India............................................................................70 Consumption - Micro: Markets for Most Products in India Are a Third to a Tenth of China’s...............................72 Investments: China’s Total Capex Is More than Four Times India’s ....................................................................74 External Trade: China’s Share in Global Exports Is Six Times India’s .................................................................76 Appendices............................................................................................................................................................79 Appendix 1: Summary of Key Reforms in India and China...................................................................................80 Appendix 2: Fact Sheet .........................................................................................................................................85 Appendix 3: Key Economic Indicators – India.......................................................................................................88 Appendix 4: Key Economic Indicators – China .....................................................................................................89 Glossary ................................................................................................................................................................90
8
JM MORGAN STANLEY
M O R G A N S T A N L E Y R E S E A R C H
June 2006 India and China: New Tigers of Asia – Part II
A Tale of Two Asias Stephen S. Roach At a Critical Juncture The China-India comparison is central to the Asia debate. It is also of great importance to the rest of the world. In the end, it may not be an either/or consideration. While the Chinese economy has outperformed India by a wide margin over the past 15 years, there are no guarantees that past performance is indicative of what lies ahead. Each of these dynamic economies is now at a critical juncture in its development challenge – facing the choice of whether to stay the course or alter the strategy. The outcome of these choices has profound implications – not just for the 40% of the world’s population residing in China and India but also for the future of Asia and the broader global economy.
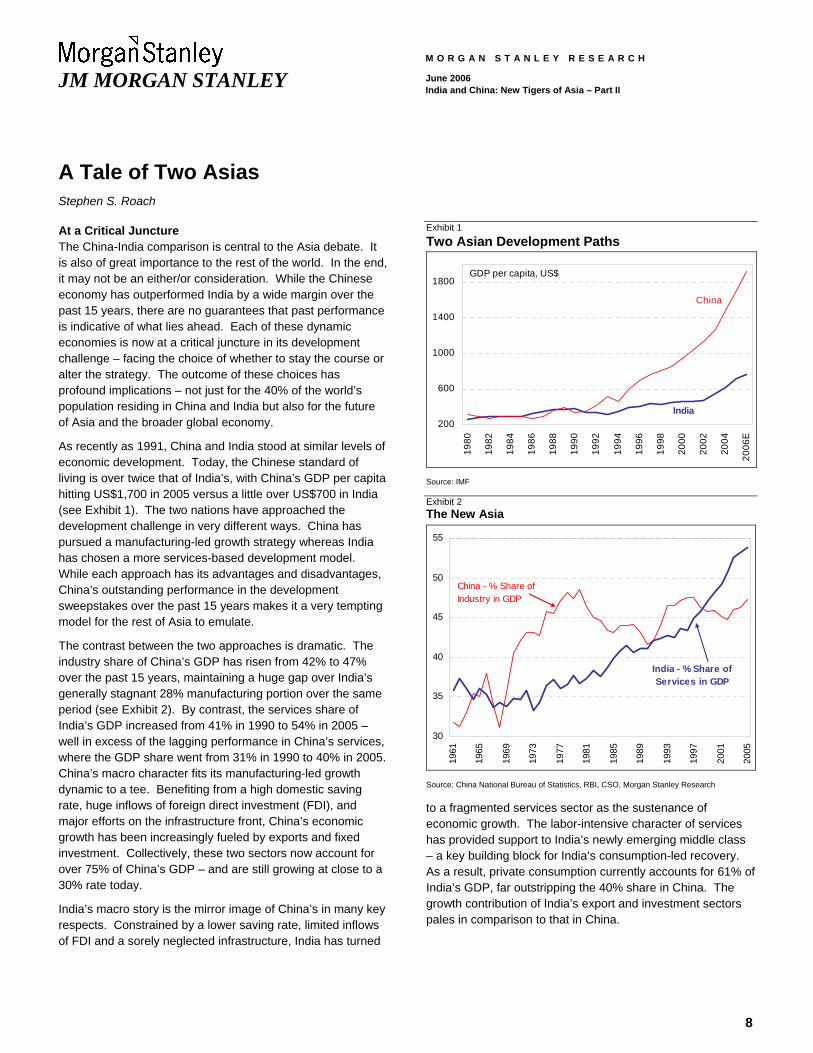
As recently as 1991, China and India stood at similar levels of economic development. Today, the Chinese standard of living is over twice that of India’s, with China’s GDP per capita hitting US$1,700 in 2005 versus a little over US$700 in India (see Exhibit 1). The two nations have approached the development challenge in very different ways. China has pursued a manufacturing-led growth strategy whereas India has chosen a more services-based development model. While each approach has its advantages and disadvantages, China’s outstanding performance in the development sweepstakes over the past 15 years makes it a very tempting model for the rest of Asia to emulate.
The contrast between the two approaches is dramatic. The industry share of China’s GDP has risen from 42% to 47% over the past 15 years, maintaining a huge gap over India’s generally stagnant 28% manufacturing portion over the same period (see Exhibit 2). By contrast, the services share of India’s GDP increased from 41% in 1990 to 54% in 2005 – well in excess of the lagging performance in China’s services, where the GDP share went from 31% in 1990 to 40% in 2005. China’s macro character fits its manufacturing-led growth dynamic to a tee. Benefiting from a high domestic saving rate, huge inflows of foreign direct investment (FDI), and major efforts on the infrastructure front, China’s economic growth has been increasingly fueled by exports and fixed investment. Collectively, these two sectors now account for over 75% of China’s GDP – and are still growing at close to a 30% rate today.
India’s macro story is the mirror image of China’s in many key respects. Constrained by a lower saving rate, limited inflows of FDI and a sorely neglected infrastructure, India has turned
Exhibit 1 Two Asian Development Paths
200
600
1000
1400
1800
1980
1982
1984
1986
1988
1990
1992
1994
1996
1998
2000
2002
2004
2006
E
GDP per capita, US$
China
India
Source: IMF Exhibit 2 The New Asia
30
35
40
45
50
55
1961
1965
1969
1973
1977
1981
1985
1989
1993
1997
2001
2005
China - % Share of Industry in GDP
India - % Share of Services in GDP
Source: China National Bureau of Statistics, RBI, CSO, Morgan Stanley Research
to a fragmented services sector as the sustenance of economic growth. The labor-intensive character of services has provided support to India’s newly emerging middle class – a key building block for India’s consumption-led recovery. As a result, private consumption currently accounts for 61% of India’s GDP, far outstripping the 40% share in China. The growth contribution of India’s export and investment sectors pales in comparison to that in China.

9
JM MORGAN STANLEY
M O R G A N S T A N L E Y R E S E A R C H
June 2006 India and China: New Tigers of Asia – Part II
Anything You Can Do, I Can Do Interestingly enough, as both of developing Asia’s largest economies look to the future, they do so with an eye toward emulating the other. China is focused on a rebalancing of its growth dynamic – moving away from exports and investment and more toward an Indian-style consumer-led model. This is more by necessity than by choice. A continuation of the export surge is a recipe for protectionism, while pushing an already excessive investment binge risks capacity overhangs and deflation.
At the same time, China aspires to match India’s progress on reforms. India currently has over 25 world-class companies, well-developed capital markets, a modern banking system, and a deeply entrenched rule of law. China is lacking in all of those key respects, and wants to move in those directions. China is also seeking to implement an Indian-style expansion of labor-intensive services in an effort to provide job and income support to its nascent consumer sector. However, given the high degree of precautionary saving sparked by massive layoffs arising from state-owned enterprise reforms, China may well encounter considerable difficulty in establishing a broad-based consumer culture.
Similarly, India aims to equal China’s effort on the manufacturing front. India’s political leadership is convinced that manufacturing is the answer to high unemployment in impoverished rural areas. Whenever I go to India, I always have the same debate with its politicians and policymakers. I take the side that the inherent labor-saving bias of capital-intensive global manufacturing platforms promises little hope for Indian employment. I have seen this first-hand on my visits to Indian manufacturing companies – factory floors more heavily populated by robots than by human workers.
India’s leaders have a different vision of manufacturing. They have seen what China can do and hope to achieve a similar outcome. Earlier this year, at the World Economic Forum in Davos, I pressed senior Indian officials on the specifics of this strategy, asking them to identify the potential sources of manufacturing-led job creation. Their answer: food, textiles, and leather – potentially high-volume industries that could well offer gainful employment opportunities to relatively poor, under-educated, young rural workers. Unlike the Chinese, the Indian leadership is not enamored of the job-creating potential of labor-intensive services. In particular, they point out that IT-enabled services – the crown jewel of India’s “new economy” – mainly offers employment to the elite graduates of India’s prestigious institutions of higher education.
What comes out of this debate is that both China and India are at important inflection points in their development experiences. They are focused on broadening out their bases of economic support. China wants to push more into services and establish a consumption-based growth dynamic. India would like to enlarge its manufacturing footprint by putting greater emphasis on infrastructure and FDI. In both cases, the growth objectives are focused on solving a difficult rural unemployment and poverty problem. For China, there is the added complication of its daunting ownership transition from a state- to a privately owned economy.
Interplay of Politics and Economics All this is not without rising political tensions. Reflecting understandable concerns over social stability, the interplay of politics and economics is clearly having an important influence on the execution of the respective “broadening out” strategies. There are equally profound questions for the rest of the world: If India is to services as China is to manufacturing, what role does that leave for the high-cost developed world? If India also succeeds in pushing into manufacturing while China makes successful forays into services, the same question becomes all the more challenging to the world’s major industrial economies.
Protectionism is the biggest risk. IT-enabled globalization is pushing economic development into manufacturing and services at a breakneck pace. Moreover, IT-enabled connectivity has increasingly transformed once non-tradable services into tradables – and has moved rapidly up the value chain and occupational hierarchy in doing so. The result is a mounting sense of economic insecurity in the developed world that has become a lightning rod for political action, which, unfortunately, has been manifested in the form of an increasingly worrisome protectionist backlash.
This is not the experience that orthodox economics understands. The win-win theory of globalization – workers in poor countries getting rich through trade and then buying products from rich countries – just isn’t working. Both the speed and scope of an IT-enabled globalization have broken the mold of the classic theory of comparative advantage. In days of yore, it was fine – albeit painful – for rich countries to give up market share in tradable manufactured products. Highly educated knowledge workers could seek refuge and shelter in non-tradable services. However, with non-tradables becoming tradable and with educational attainment and skill sets rising rapidly in the developing world, the security of the old way no longer exists. Sadly, that provides both the justification and the opening for protectionists.
10
JM MORGAN STANLEY
M O R G A N S T A N L E Y R E S E A R C H
June 2006 India and China: New Tigers of Asia – Part II
Conclusion China and India represent the future of Asia – and quite possibly the future for the global economy. Yet both economies now need to fine-tune their development strategies by expanding their economic power bases. If these mid-course corrections are well executed – and there is good reason to believe that will be the case – China and India should play an increasingly powerful role in driving the global growth dynamic for years to come. With that role, however, come equally important consequences.
IT-enabled globalization has introduced an unexpected complication into the process – a time compression of economic development that has caught the rich industrial world by surprise. The resulting heightened sense of economic insecurity that has stoked an increasingly dangerous protectionist backlash could well pose yet another major challenge to China and India – learning how to live with the consequences of their successes.

11
JM MORGAN STANLEY
M O R G A N S T A N L E Y R E S E A R C H
June 2006 India and China: New Tigers of Asia – Part II
Beyond the Cyclical Boom Andy Xie Retaining the Fruits of Globalization Annual GDP growth has averaged 10% in China in the past three years and 8% in India. During the same period, the global economy has enjoyed the biggest boom in decades, averaging 4.5% growth a year. The unprecedented economic expansion is due to rising productivity growth from globalization and information technology. China and India have been at the center of increasing global integration and have done well in keeping the fruits of globalization at home to fuel their economies.
The two economies have used different approaches to retain some of the globalization benefits. China has pursued the typical East Asian model of recycling export revenue into fixed investment. As capacity expands in line with rapid export growth, the domestic economy does not suffer from high inflation, merely floating upward with the global economy. Indeed, inflation in China is less than 2% despite 33% annual growth in exports for the past three years. This reflects the excessive savings and investment bias of the political system.
In addition to the traditional East Asian investment/export approach, China has taken advantage of its strong government and the country’s size to achieve unprecedented economies of scale for productivity gains. In infrastructure, for example, the economies of scale have cut capital costs in transportation, telecommunications, and electricity to below those of any other economy. In the production and distribution of consumer goods, the economies of scale that China has achieved are unmatched elsewhere in the global economy. The increase in scale economies has also contributed to low inflation.
India has also achieved a breakthrough in trade. Exports grew 25% a year in 2002-05 compared with 10.5% in the ten-year period prior to this. However, India’s export base at 19.5% of GDP in 2005 is much lower than that for China (38%) and so its export success is not sufficient to drive the economy’s strong growth. India has taken advantage of its flexible financial markets to attract foreign capital to fund its growth.
Consumer credit, funded substantially by foreign capital inflows into its capital markets, has given the Indian economy a strong consumption anchor in this boom. India’s credit rose by 25% a year over 2002-05 versus 19% growth in fixed investment. In contrast, China’s credit increased by 17% and
fixed investment by 27% in the same period, even though the share of China’s fixed investment in GDP is one third higher than India’s.
India’s growth model bears more resemblance to the Anglo-Saxon than the East Asian model. Its external accounts have evolved in a similar fashion. Its current account balance deteriorated to a deficit equivalent to 1.7% of GDP in 2005 from 1.5% of GDP in surplus in 2003. In contrast, China’s current account surplus improved to 7.2% of GDP in 2005 from 2.8% in 2003.
While China and India have different growth models, they have both captured the opportunities from the current wave of globalization. Productivity gains have benefited from a low-base effect. As the production chain becomes fully integrated across the world in the coming years, the low-base effect will disappear and the tailwinds from globalization for China and India will weaken. How to sustain fast productivity growth beyond the current boom is a major challenge for both economies.
The Need to Clear Away the Thorns … At present, the two countries appear to favor a muddling-through approach, i.e., deal with an issue only if it appears to be an imminent threat to growth. Failure to heed long-term implications in crafting macro policy is a global phenomenon, however. The best example is the lack of consideration for balance sheet problems by all major central banks even though economic history teaches us that the great economic crises have all been due to overstretching the balance sheet. In that regard, China and India are just joining the crowd.
… in India The threat to India’s growth over the next two years is its poor infrastructure. To address the problem, India needs to mobilize capital more effectively and streamline the process for the implementation of infrastructure development, objectives that require strong government. Coalition politics, as now prevailing in India, tend not to produce strong governments. Since India has been able to achieve high growth in the past three years even with a poor infrastructure, the hope is for continuation of the same for the next two years.
Another challenge to India’s growth is the potential bursting of its asset bubble. India has experienced enormous growth in its stock and property markets, mainly through price
12
JM MORGAN STANLEY
M O R G A N S T A N L E Y R E S E A R C H
June 2006 India and China: New Tigers of Asia – Part II
appreciation in response to low real interest rates. In this low interest rate environment, the most important factors are an increase in foreign capital inflow and a rise in import competition, which have contributed to low inflation. However, both factors have limited lifespans.
First, the foreign capital inflow is a component of the financial globalization that has kept risk appetite high and rising. The increase in globalization has resulted in low inflation and strong liquidity – the backdrop for the current euphoria surrounding high-risk assets. As globalization matures, global liquidity conditions will normalize, and money can no longer be expected to rush to India in the same quantities under the same terms.
Second, increasing import competition forces local producers to accept lower prices. Low inflation in India, as in the rest of the world, is due to globalization benefits from a low base. As production responds to new prices, imports no longer are as effective in keeping inflation low.
Buoyant asset markets have had a massive wealth effect on consumption while the low cost of capital has encouraged more capital investment. This is probably the reason for India’s growth rate surpassing its historical trend. The appropriate policy would be to raise interest rates aggressively to contain the cost when the bubble bursts. However, as politics favor ‘keeping the party going for as long as possible’, preemptive measures are not being taken.
Increasing scale economies is also a source of productivity growth for India and should offset any waning in foreign capital inflows to sustain economic expansion. The modernization of India’s consumer sector, in particular, could accelerate productivity growth. To achieve this, India needs to build a transportation system that supports modern logistics and retool the regulatory infrastructure to support large-scale production.
We see three steps India can take to accelerate growth beyond the current cyclical boom:
1) Introduce legislation that allows the implementation process for infrastructure projects to cut through the current maze of regulations and to acquire land quickly.
2) Set up several special economic zones along the coast in areas without land title disputes. These SEZs could be cities with their own streamlined regulatory and bureaucratic infrastructure. (The current SEZs are project-based tax breaks for export production, which will probably not lead to
the formation of new cities – a must for India to accelerate urbanization.)
3) Sell state-owned assets to jump-start a 100 billion-dollar infrastructure program as the core of India’s modernization.
… and China The challenges to China in sustaining its high growth are quite different. The fundamental weakness of the economy is low consumption. Household consumption at 40% of GDP is exceptionally low by any standard. The excessive dependence on investment and exports makes China vulnerable to the global economic cycle. The dominant role of the government in the economy, its bureaucratic bias towards investment, and lack of organized forces in society to check government excesses have led to macro vulnerabilities.
Excessive liquidity due to low consumption and foreign speculation on a possible renminbi revaluation has resulted in rapid growth in the property market in terms of both production and price. The rise in property prices has become another deterrent to consumption, as Chinese households hunker down to shelter from escalating living costs. This further sustains the liquidity boom that feeds the property sector. This sort of dynamic increases the imbalance in the economy.
China’s cyclical risk and structural imbalance are one and the same. Unless China is able to rebalance its economy, it could suffer from mounting appreciation pressure on its currency and deflationary conditions at the same time. The required reforms in China would not be hard to implement. China just needs to find ways to give money to households.
To rebalance the economy, China has to address the wealth, income, and security issues that have caused the household sector to shrink relative to the overall economy.
1) On wealth, the government owns land, natural resources, and state monopolies. As these assets are not on the household balance sheet, consumption remains below what national wealth can support. Government wealth has to be shifted to the household sector to balance the economy.
2) On income, the labor surplus has kept the rise in wages below that in labor productivity. This causes labor income to contract relative to the economy and contributes to insufficient consumption, excessive liquidity, and speculative mania. Such imbalances occurred in the West during its industrialization, and the rise of labor unions eventually
13
JM MORGAN STANLEY
M O R G A N S T A N L E Y R E S E A R C H
June 2006 India and China: New Tigers of Asia – Part II
helped wages to move up in line with labor productivity growth.
China’s surplus labor is likely to linger for another two decades. There is little chance that market forces will address this imbalance. Local governments have been raising minimum wages and giving wage growth guidance to enterprises. It is too early to tell if government persuasion will be sufficient to deal with this issue.
Promoting collective bargaining between labor and business could be more effective. China has one government-controlled labor union. It usually sides with business as the government fears the effect of labor unions on job creation. This view is not accurate, in my opinion. If wages rise in line with productivity, the resulting consumption has a high multiplier effect on job creation, which more than offsets the direct and negative impact on job creation of higher wages. Labor unions that are not independent tend to evolve into organizations that simply set wage standards.
3) The escalation of household expenditures on education, healthcare, and housing and concern about future related costs have led to precautionary savings and depressed consumption. Some issues in these three sectors are complex and take time to address. Others are easier to resolve.
First, a public housing system should be re-introduced. As the housing market has become entirely for profit, it has led to rapid price inflation. As local governments control all the land, they are effectively monopolies in the market. Local governments want to maximize land sale revenue to fund rapid economic development; hence, a high property price is a development tax on local residents. However, it is a regressive tax and can cause social instability. I believe China should adopt a public housing program similar to that in Singapore.
Second, the Chinese government has ample financing capability and can issue bonds to fund basic healthcare and education. The fear of debt has caused the government to be cautious in issuing bonds and eager to expand revenues. In an economy with insufficient consumption, it makes good sense for fiscal debt to fund recurrent expenditures.
Third, China should introduce competition into education and healthcare beyond the basic level. Chinese healthcare and education establishments are government-owned monopolies that maximize revenues to benefit the staff. This system has
the negative aspects of both public and private systems – low quality and high cost – without the favorable aspects – low price and high quality. More competition in government-dominated sectors could improve consumption, in my view.
The resistance to reform lies in the massive bureaucratic infrastructure that thrives on fixed investment. Further, the emergence of a private sector that profits from state-led investment projects, especially in property development, has intensified resistance to balancing the economy.
Doing the Right Thing Is Difficult While we can argue about what China and India should or should not do, the reality is that both are pursuing a muddling-through approach. This is the key for investors to understand how policies are likely to be formulated and asset markets will probably behave in the short term.
India is likely to try to keep interest rates as low as possible, improve foreign access to its asset markets for funds to fund the current account deficit that results from the low interest rate, and allow the currency to appreciate to contain the inflationary pressure. In short, India will probably pursue policies that encourage the expansion of the asset bubble rather than contain it.
We can expect China to crack down periodically on excessive credit growth and property speculation. However, the government will probably not do enough to curb either for long because such policies would not address the root cause of the surplus liquidity problem or cool either credit or property demand permanently. Continuation of these imbalances could seriously weaken the economy. China’s approach is, in effect, to slow the speed at which the imbalances grow.
In terms of the currency, China is likely to stick to a gradual appreciation path of 2-3% a year. The political system dislikes shock therapy – as a major currency move would be viewed. The gradualist approach to currency reform is likely to sustain speculation in the currency, keep liquidity artificially high, and spread speculation into property and local stock markets.
‘Doing the right thing’ is difficult in the best of circumstances. It is much more difficult when the economies of China and India are booming. Tough reforms usually happen in hard times. When the current cycle cools and growth in the two economies loses momentum, the governments may then embark on the required reforms.

14
JM MORGAN STANLEY
M O R G A N S T A N L E Y R E S E A R C H
June 2006 India and China: New Tigers of Asia – Part II
Why India and China Matter Chetan Ahya Increasing Global Productivity and Growth Participation in globalization is raising productivity and growth rates for India and China. The two economies together represent 40% of the global labor supply but their share in global output is only 6.7% in nominal dollar terms (21% in PPP terms). The economic trend of globalization – that is, the cashing in of global labor arbitrage – is improving the utilization of their work forces. Indeed, their participation in the world economy as a result of globalization is redefining the macro theory applied during the era of closed economies.
The two countries will continue to boost global productivity as long as the supply and stock of unemployed and ‘able’ working-age population remain high. We define ‘able’ as the part of the population that is not only skilled and capable of competing in the global market place but that also has an enabling environment provided through the government’s structural reforms, i.e., removal of obstacles and provision of infrastructure/platforms. The world economy does not seem to be close to the point where this labor arbitrage no longer plays out in view of the current low levels of wages, large stock of surplus labor and the expected additions to the labor pools in India and China.
Interplay of Three Macro Factors China and India are achieving high growth rates through the powerful interplay of three key macro factors: demographics, reforms and globalization – what we call DRG factors. First, age dependency has fallen (the share of the working population in the total has risen) in both countries since the late 1970s with a much sharper drop in China than in India.
Second, structural reforms have improved the utilization of the working-age population, a key resource. A positive demographic trend may be a necessary condition for strong growth but it is not a sufficient one. Favorable demographics need to be converted into a virtuous cycle. A critical step in this process is the opening up of productive job opportunities through reforms. The pace of such reforms has been aggressive in China and gradual but progressive in India.
Third, a backdrop of strong globalization has enabled growth in these job opportunities to be accelerated. As India and China opted to be a part of this globalization trend, this
Exhibit 3 China and India: GDP Statistics 1990 2005 India China India China Nominal (US$ Bn) 313 388 773 2225 PPP Basis (US$ Bn) 1145 1633 3633 9412 Growth (CAGR for trailing 5 yrs) --Nominal 7.5% 4.9% 11.0% 13.2% --PPP Basis 9.6% 11.3% 8.5% 12.0% Share in World GDP --Nominal 1.4% 1.7% 1.7% 5.0% --PPP 4.3% 6.1% 5.9% 15.4% Share in World GDP Growth (trailing 5 yrs average) --Nominal 0.6% 2.6% 2.5% 8.0% --PPP 5.4% 8.8% 7.7% 25.6% Source: IMF, Morgan Stanley Research Exhibit 4 China and India: Combined Share in World GDP
6%
9%
12%
15%
18%
21%
1980
1985
1990
1995
2000
2005
2.5%
3.5%
4.5%
5.5%
6.5%
7.5%
Combined share on PPP basis, LS
Combined share on nominal US$ basis, RS
Source: IMF, Morgan Stanley Research Exhibit 5 China’s Share in World Goods Exports & India’s Share in World Services Exports
0.0%
1.6%
3.2%
4.8%
6.4%
8.0%
1970
1975
1980
1985
1990
1995
2000
2005
China
India
Source: WTO, Morgan Stanley Research
15
JM MORGAN STANLEY
M O R G A N S T A N L E Y R E S E A R C H
June 2006 India and China: New Tigers of Asia – Part II
proved to be a key trigger for their exports to GDP ratios to surge – in the late 1970s for China and the early 1990s for India (Exhibit 7). This interplay of demographics, reforms and globalization is crucial for the virtuous cycle of faster growth in productive job creation – income growth – savings – investments – higher growth.
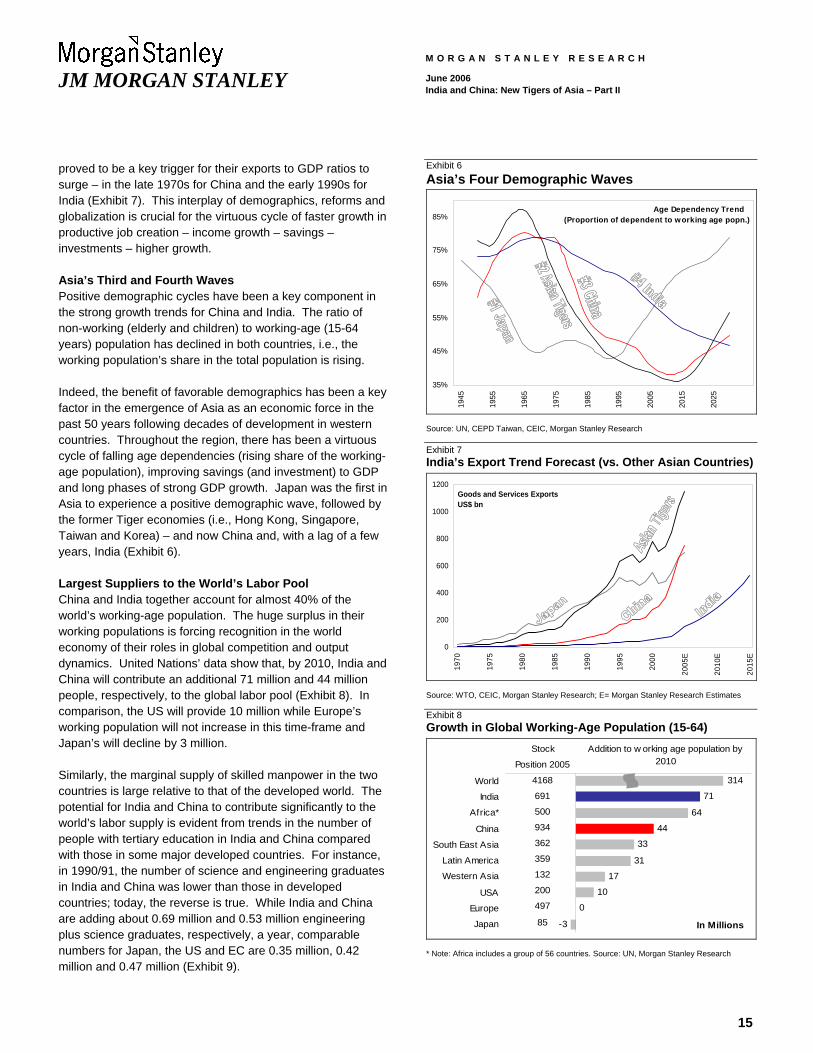
Asia’s Third and Fourth Waves Positive demographic cycles have been a key component in the strong growth trends for China and India. The ratio of non-working (elderly and children) to working-age (15-64 years) population has declined in both countries, i.e., the working population’s share in the total population is rising.
Indeed, the benefit of favorable demographics has been a key factor in the emergence of Asia as an economic force in the past 50 years following decades of development in western countries. Throughout the region, there has been a virtuous cycle of falling age dependencies (rising share of the working-age population), improving savings (and investment) to GDP and long phases of strong GDP growth. Japan was the first in Asia to experience a positive demographic wave, followed by the former Tiger economies (i.e., Hong Kong, Singapore, Taiwan and Korea) – and now China and, with a lag of a few years, India (Exhibit 6).
Largest Suppliers to the World’s Labor Pool China and India together account for almost 40% of the world’s working-age population. The huge surplus in their working populations is forcing recognition in the world economy of their roles in global competition and output dynamics. United Nations’ data show that, by 2010, India and China will contribute an additional 71 million and 44 million people, respectively, to the global labor pool (Exhibit 8). In comparison, the US will provide 10 million while Europe’s working population will not increase in this time-frame and Japan’s will decline by 3 million.
Similarly, the marginal supply of skilled manpower in the two countries is large relative to that of the developed world. The potential for India and China to contribute significantly to the world’s labor supply is evident from trends in the number of people with tertiary education in India and China compared with those in some major developed countries. For instance, in 1990/91, the number of science and engineering graduates in India and China was lower than those in developed countries; today, the reverse is true. While India and China are adding about 0.69 million and 0.53 million engineering plus science graduates, respectively, a year, comparable numbers for Japan, the US and EC are 0.35 million, 0.42 million and 0.47 million (Exhibit 9).
Exhibit 6 Asia’s Four Demographic Waves
35%
45%
55%
65%
75%
85%
1945
1955
1965
1975
1985
1995
2005
2015
2025
Age Dependency Trend(Proportion of dependent to working age popn.)
Source: UN, CEPD Taiwan, CEIC, Morgan Stanley Research Exhibit 7 India’s Export Trend Forecast (vs. Other Asian Countries)
0
200
400
600
800
1000
1200
1970
1975
1980
1985
1990
1995
2000
2005
E
2010
E
2015
E
Goods and Services ExportsUS$ bn
Source: WTO, CEIC, Morgan Stanley Research; E= Morgan Stanley Research Estimates Exhibit 8 Growth in Global Working-Age Population (15-64)
71
64
44
33
31
17
10
0
-3
314World
India
Africa*
China
South East Asia
Latin America
Western Asia
USA
Europe
Japan
Stock
Position 2005
4168
691
500
934
362
359
132
200
497
85
Addition to w orking age population by 2010
In Millions
* Note: Africa includes a group of 56 countries. Source: UN, Morgan Stanley Research

16
JM MORGAN STANLEY
M O R G A N S T A N L E Y R E S E A R C H
June 2006 India and China: New Tigers of Asia – Part II
On a stock basis, the numbers for India and China are staggering when compared with those for developed countries. The combined strength of the population educated to secondary level and above in India and China is almost twice that of the US, major European countries and Japan combined (see Exhibit 10). Over the past five years, India and China would have added about 16 million and 24 million of secondary-level and above educated people to the working-age population compared with 14 million in the US.
China Overshadows India Today…. China has managed to convert its advantage of a growing working population into a virtuous loop of creating productive jobs for its expanding work force and translating this into higher savings, investment and growth. China’s age dependency (share of non-working to working population) peaked in 1965 at 80%. Since then, its working population has been rising sharply. Its age-dependency ratio fell to 67% in 1980 and further to 46% in 2000 and 41% in 2005.
At the same time, the government has been able to increase productive employment opportunities and, in turn, generate higher savings. China’s savings rate increased from about 25% in the mid-1960s to 35% in 1980 and further to 50% in 2005, providing the financing for the acceleration in the growth of physical capital accumulation and GDP.
Real GDP growth in China averaged 9.5% a year over the past 25 years compared with 5.8% in India. During this period, China’s GDP grew 7.5 times to US$2.2 trillion whereas that for India expanded 4.5 times to US$800 billion. China’s exports (including services) surged 41 times over this period to US$840 billion while India’s exports increased 13 times to about US$150 billion.
The lag in India’s performance, in our view, was due to the lower level of support from demographic, reform and globalization factors. India’s demographic cycle is trailing China’s. Although the two had similar age-dependency ratios in the late 1970s, China has far outpaced India in the past 20 years (Exhibit 11).
China was also well ahead of India in initiating structural reforms, introducing them in the 1980s versus the 1990s in India. The depth of the reforms also varies. In the context of structural reform, we believe that there are two major roles for the government of an emerging economy. First, the government needs to reduce its interference in the real economy, allowing factors of production to operate more freely (i.e. deregulation of economic activities). Second,
Exhibit 9 Delta in Global Supply of Science & Engineering Students Graduating in a Year* ('000s)
0
200
400
600
800
Japan US EuropeanCommunity
China India***
1990/1991 2002/2004In '000s
* Includes people with first university degree in science and engineering; *** Note: India data do not include engineering diploma holders; the data are for the latest year available, i.e. the current data for different countries range over various years from 2002 to 2004; Source: National Science Foundation, NASSCOM, Morgan Stanley Research. Exhibit 10 Educational Attainment Levels (total population breakdown)
61
386
258
255
70
163
315
183
578
42
71
28
14
36
110
131
49
40
35
81
0 200 400 600 800 1000 1200
Japa
n(2
000)
Maj
orEu
rope
anC
ount
ries*
USA
(200
4)In
dia
(200
1)C
hina
(200
3)
Illiterate
Primary and below Tertiary
Secondary
Below 15
In Millions
* Includes United Kingdom, Germany, France and Italy for latest available year (1999-2004). Source: China Statistical Yearbook, CEIC, Census of India, DFES (UK), France Census data, Eurostat, ISTAT, Population Division - U.S. Census Bureau, Morgan Stanley Research Exhibit 11 China and India: Savings and Age-Dependency Trends 1960s 1970s 1980s 1990s 2000-05India Age Dependency1 77.8% 76.8% 71.7% 67.0% 61.8%Savings2 13.0% 18.0% 19.9% 23.8% 26.3%Investments3 15.1% 18.1% 21.8% 25.2% 26.0%China Age Dependency1 79.0% 74.8% 57.4% 48.1% 43.6%Savings2 25.6% 34.7% 35.4% 38.5% 39.8%Investments3 26.1% 34.8% 34.8% 40.6% 42.2% 1. Ratio of non-working to working population. 2. Gross national savings rate. 3. Gross capital formation. Source: UN, CIEC, CSO, Morgan Stanley Research

17
JM MORGAN STANLEY
M O R G A N S T A N L E Y R E S E A R C H
June 2006 India and China: New Tigers of Asia – Part II
the government is required to play an active role as a productive public sector in certain areas to enable factors of production to operate more effectively. For instance, the government is best positioned to invest in building public infrastructure and providing basic services such as education and healthcare for the rural poor. While the Indian government has been reasonably successful in the first role, its performance is significantly lacking compared to that of China’s government in the second role.
India was also late in deciding to participate in globalization as reflected in the import tariff trend (Exhibit 13). India’s integration with the global economy started to accelerate in the early 1990s while China’s integration began in the early 1980s. Indeed, we can see from Exhibit 14 that India is following the same path as China when we compare their exports to GDP ratios, keeping the starting points for both as the years in which they initiated the liberalization that allowed their resources to interact with those of the rest of the world.
But India Has the Potential to Catch Up Over the next 10 years, as China’s growth rate moderates from a high base, India’s economic growth has the potential to accelerate to a sustained 8%-plus rate, breaking out of its average growth band of 6-6.5% for the past 10 years. We calculate nominal GDP will cross the US$2 trillion mark by 2015, up from an estimated US$773 billion in 2005. We believe that the path to a higher level of growth will be supported by further improvement in demographics, structural reforms and globalization.
India is following the East Asian economic model but with some differences. The East Asian high-growth model is driven by a virtuous link of improving demographics, strong growth in high-saving-potential export income, an increase in the savings-to-GDP ratio to above 35-40% for a sustained period and a matching rise in investments. While India is following a similar virtuous link, peak growth rates for India may be lower than those achieved by East Asian countries as India’s age-dependency ratio bottoms out at higher levels than in East Asian economies. However, at the same time, India could have the advantage of maintaining its high-growth phase for longer than in East Asia as UN data show that its age dependency will continue to decline (i.e., the share of the working-age population will continue to rise) until 2035. Indeed, United Nations’ projections show that India will be the only large country still enjoying favorable demographics after 2010 (Exhibit 12). Japan, Europe and the US (in that order) will witness a significant rise in their ageing populations.
Exhibit 12 India’s Demographics vs. G7 and China
35%
45%
55%
65%
75%
85%
1950
1960
1970
1980
1990
2000
2010
2020
2030
2040
2050
China India G7
Age dependency (Prop. of non-w orking to w orking population)
Source: UN Exhibit 13 China and India: Customs Duty Collections as % of Imports
0%
15%
30%
45%
60%
1981
1983
1985
1987
1989
1991
1993
1995
1997
1999
2001
2003
India
China
Source: CEIC, RBI, Morgan Stanley Research Exhibit 14 Exports to GDP: India vs. China since Start of Reforms
5%
11%
17%
23%
29%
35%
0 2 4 6 8 10 12 14 16 18 20 22 24 26
Number of years since liberalization
Exports as % of GDP
China
India
For India year 0 = 1991; For China year 0 = 1978
Source: WTO, Morgan Stanley Research
18
JM MORGAN STANLEY
M O R G A N S T A N L E Y R E S E A R C H
June 2006 India and China: New Tigers of Asia – Part II
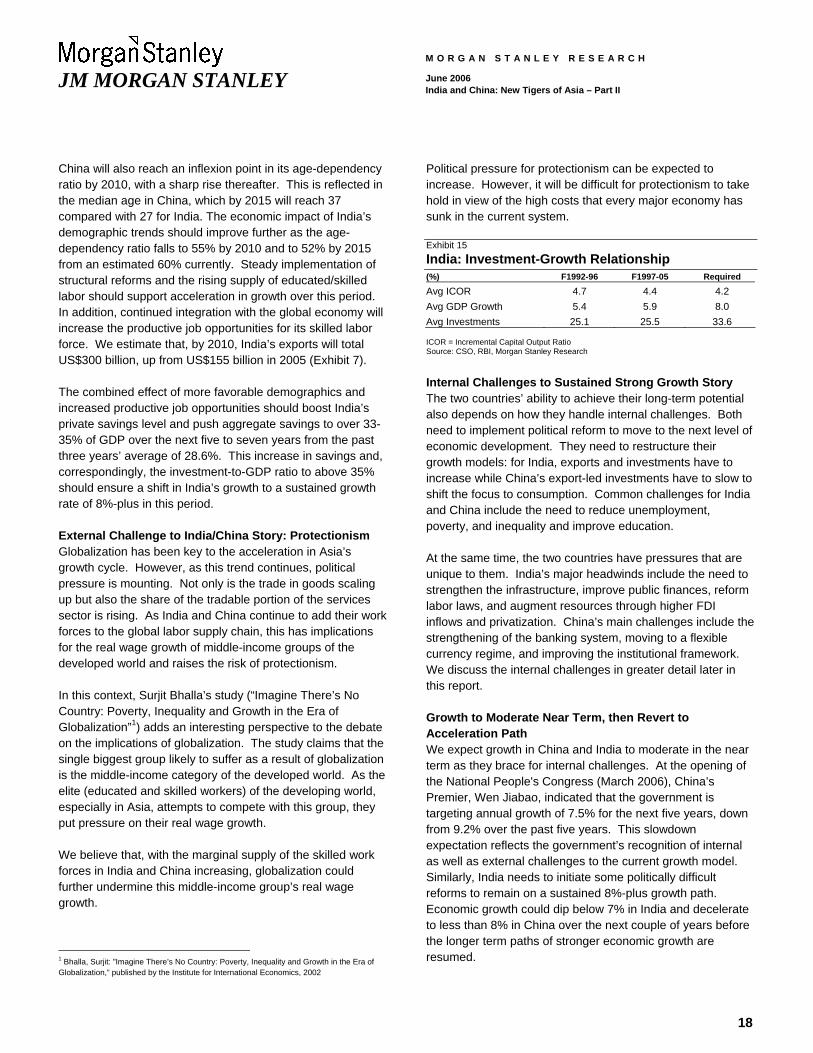
China will also reach an inflexion point in its age-dependency ratio by 2010, with a sharp rise thereafter. This is reflected in the median age in China, which by 2015 will reach 37 compared with 27 for India. The economic impact of India’s demographic trends should improve further as the age-dependency ratio falls to 55% by 2010 and to 52% by 2015 from an estimated 60% currently. Steady implementation of structural reforms and the rising supply of educated/skilled labor should support acceleration in growth over this period. In addition, continued integration with the global economy will increase the productive job opportunities for its skilled labor force. We estimate that, by 2010, India’s exports will total US$300 billion, up from US$155 billion in 2005 (Exhibit 7).
The combined effect of more favorable demographics and increased productive job opportunities should boost India’s private savings level and push aggregate savings to over 33-35% of GDP over the next five to seven years from the past three years’ average of 28.6%. This increase in savings and, correspondingly, the investment-to-GDP ratio to above 35% should ensure a shift in India’s growth to a sustained growth rate of 8%-plus in this period.
External Challenge to India/China Story: Protectionism Globalization has been key to the acceleration in Asia’s growth cycle. However, as this trend continues, political pressure is mounting. Not only is the trade in goods scaling up but also the share of the tradable portion of the services sector is rising. As India and China continue to add their work forces to the global labor supply chain, this has implications for the real wage growth of middle-income groups of the developed world and raises the risk of protectionism.
In this context, Surjit Bhalla’s study (“Imagine There’s No Country: Poverty, Inequality and Growth in the Era of Globalization”1) adds an interesting perspective to the debate on the implications of globalization. The study claims that the single biggest group likely to suffer as a result of globalization is the middle-income category of the developed world. As the elite (educated and skilled workers) of the developing world, especially in Asia, attempts to compete with this group, they put pressure on their real wage growth.
We believe that, with the marginal supply of the skilled work forces in India and China increasing, globalization could further undermine this middle-income group’s real wage growth.
1 Bhalla, Surjit: ”Imagine There’s No Country: Poverty, Inequality and Growth in the Era of Globalization,” published by the Institute for International Economics, 2002
Political pressure for protectionism can be expected to increase. However, it will be difficult for protectionism to take hold in view of the high costs that every major economy has sunk in the current system.
Exhibit 15 India: Investment-Growth Relationship (%) F1992-96 F1997-05 Required
Avg ICOR 4.7 4.4 4.2 Avg GDP Growth 5.4 5.9 8.0 Avg Investments 25.1 25.5 33.6 ICOR = Incremental Capital Output Ratio Source: CSO, RBI, Morgan Stanley Research
Internal Challenges to Sustained Strong Growth Story The two countries’ ability to achieve their long-term potential also depends on how they handle internal challenges. Both need to implement political reform to move to the next level of economic development. They need to restructure their growth models: for India, exports and investments have to increase while China’s export-led investments have to slow to shift the focus to consumption. Common challenges for India and China include the need to reduce unemployment, poverty, and inequality and improve education.
At the same time, the two countries have pressures that are unique to them. India’s major headwinds include the need to strengthen the infrastructure, improve public finances, reform labor laws, and augment resources through higher FDI inflows and privatization. China’s main challenges include the strengthening of the banking system, moving to a flexible currency regime, and improving the institutional framework. We discuss the internal challenges in greater detail later in this report.
Growth to Moderate Near Term, then Revert to Acceleration Path We expect growth in China and India to moderate in the near term as they brace for internal challenges. At the opening of the National People's Congress (March 2006), China’s Premier, Wen Jiabao, indicated that the government is targeting annual growth of 7.5% for the next five years, down from 9.2% over the past five years. This slowdown expectation reflects the government’s recognition of internal as well as external challenges to the current growth model. Similarly, India needs to initiate some politically difficult reforms to remain on a sustained 8%-plus growth path. Economic growth could dip below 7% in India and decelerate to less than 8% in China over the next couple of years before the longer term paths of stronger economic growth are resumed.

19
JM MORGAN STANLEY
M O R G A N S T A N L E Y R E S E A R C H
June 2006 India and China: New Tigers of Asia – Part II
Challenges Facing India and China - Some Are Similar
20
JM MORGAN STANLEY
M O R G A N S T A N L E Y R E S E A R C H
June 2006 India and China: New Tigers of Asia – Part II
Transition in the Growth Model - India
India Needs a Stronger Supply Response Summary While China’s growth model is driven by supply (investment), India’s is underpinned by demand (consumption). In the current economic cycle, a sharp fall in real interest rates driven by high global liquidity has boosted consumption more than investment in India. There are many challenges emerging from this consumption-driven growth, posing risks to macro stability. We believe a commensurate rise in the supply side is critical for ensuring a sustained acceleration in the growth cycle. The government needs to implement measures to stimulate the supply-side response by investing in infrastructure, implementing labor reforms, improving the management of government finances and strengthening the administrative framework.
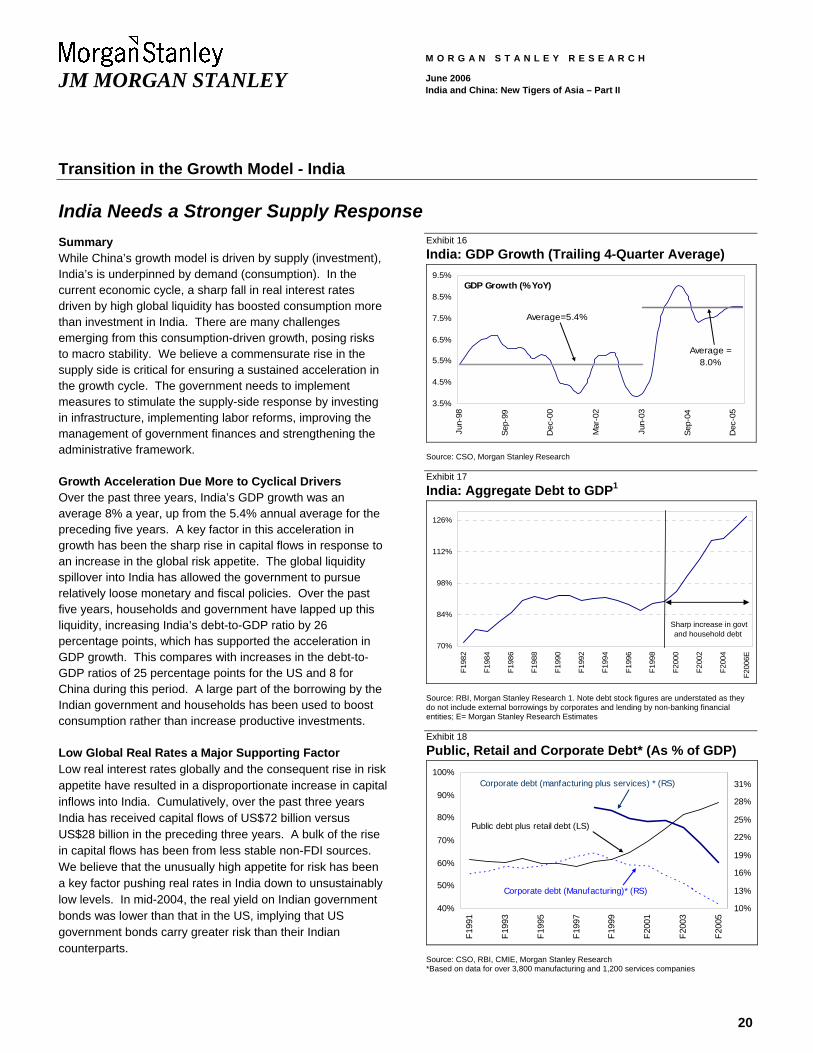
Growth Acceleration Due More to Cyclical Drivers Over the past three years, India’s GDP growth was an average 8% a year, up from the 5.4% annual average for the preceding five years. A key factor in this acceleration in growth has been the sharp rise in capital flows in response to an increase in the global risk appetite. The global liquidity spillover into India has allowed the government to pursue relatively loose monetary and fiscal policies. Over the past five years, households and government have lapped up this liquidity, increasing India’s debt-to-GDP ratio by 26 percentage points, which has supported the acceleration in GDP growth. This compares with increases in the debt-to-GDP ratios of 25 percentage points for the US and 8 for China during this period. A large part of the borrowing by the Indian government and households has been used to boost consumption rather than increase productive investments.
Low Global Real Rates a Major Supporting Factor Low real interest rates globally and the consequent rise in risk appetite have resulted in a disproportionate increase in capital inflows into India. Cumulatively, over the past three years India has received capital flows of US$72 billion versus US$28 billion in the preceding three years. A bulk of the rise in capital flows has been from less stable non-FDI sources. We believe that the unusually high appetite for risk has been a key factor pushing real rates in India down to unsustainably low levels. In mid-2004, the real yield on Indian government bonds was lower than that in the US, implying that US government bonds carry greater risk than their Indian counterparts.
Exhibit 16 India: GDP Growth (Trailing 4-Quarter Average)
3.5%
4.5%
5.5%
6.5%
7.5%
8.5%
9.5%
Jun-
98
Sep-
99
Dec
-00
Mar
-02
Jun-
03
Sep-
04
Dec
-05
Average=5.4%
GDP Growth (% YoY)
Average = 8.0%
Source: CSO, Morgan Stanley Research Exhibit 17 India: Aggregate Debt to GDP1
70%
84%
98%
112%
126%
F198
2
F198
4
F198
6
F198
8
F199
0
F199
2
F199
4
F199
6
F199
8
F200
0
F200
2
F200
4
F200
6E
Sharp increase in govt and household debt
Source: RBI, Morgan Stanley Research 1. Note debt stock figures are understated as they do not include external borrowings by corporates and lending by non-banking financial entities; E= Morgan Stanley Research Estimates Exhibit 18 Public, Retail and Corporate Debt* (As % of GDP)
40%
50%
60%
70%
80%
90%
100%
F199
1
F199
3
F199
5
F199
7
F199
9
F200
1
F200
3
F200
5
10%
13%
16%
19%
22%
25%
28%
31%
Public debt plus retail debt (LS)
Corporate debt (Manufacturing)* (RS)
Corporate debt (manfacturing plus services) * (RS)
Source: CSO, RBI, CMIE, Morgan Stanley Research *Based on data for over 3,800 manufacturing and 1,200 services companies
21
JM MORGAN STANLEY
M O R G A N S T A N L E Y R E S E A R C H
June 2006 India and China: New Tigers of Asia – Part II
Although Indian interest rates have corrected significantly over the past 12 months, the real 10-year government securities yield is still at levels similar to those in the US, indicating that global risk appetite remains high.
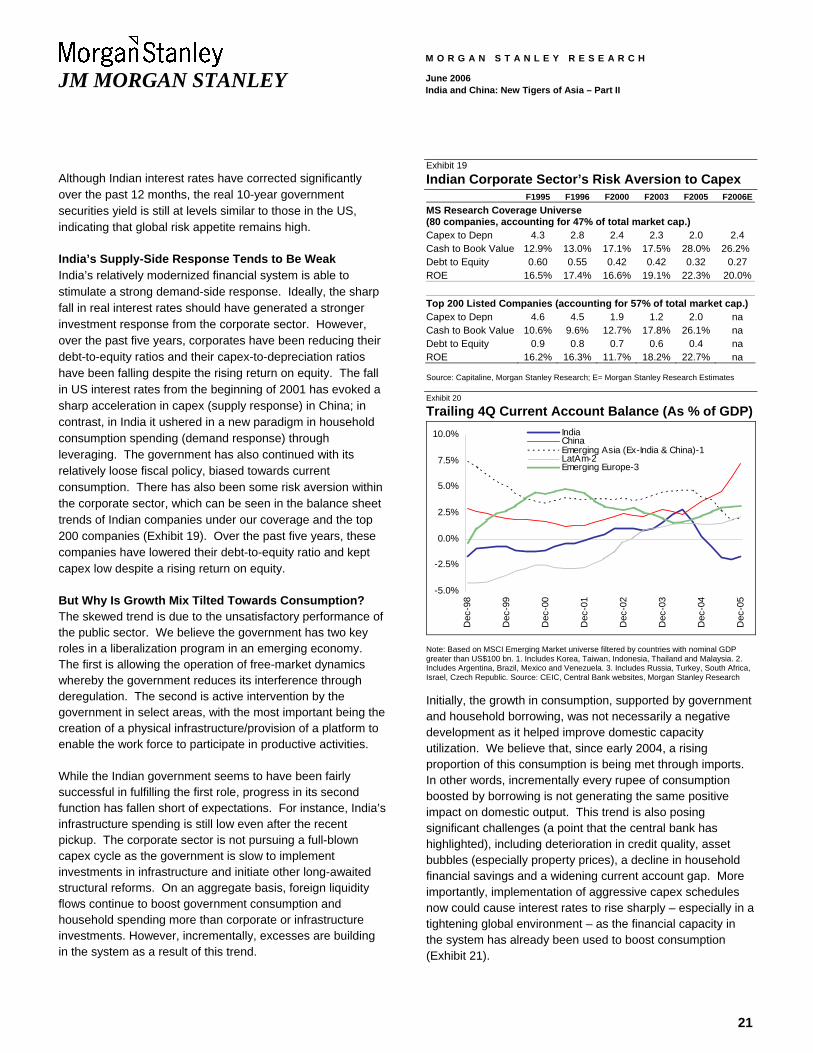
India’s Supply-Side Response Tends to Be Weak India’s relatively modernized financial system is able to stimulate a strong demand-side response. Ideally, the sharp fall in real interest rates should have generated a stronger investment response from the corporate sector. However, over the past five years, corporates have been reducing their debt-to-equity ratios and their capex-to-depreciation ratios have been falling despite the rising return on equity. The fall in US interest rates from the beginning of 2001 has evoked a sharp acceleration in capex (supply response) in China; in contrast, in India it ushered in a new paradigm in household consumption spending (demand response) through leveraging. The government has also continued with its relatively loose fiscal policy, biased towards current consumption. There has also been some risk aversion within the corporate sector, which can be seen in the balance sheet trends of Indian companies under our coverage and the top 200 companies (Exhibit 19). Over the past five years, these companies have lowered their debt-to-equity ratio and kept capex low despite a rising return on equity.
But Why Is Growth Mix Tilted Towards Consumption? The skewed trend is due to the unsatisfactory performance of the public sector. We believe the government has two key roles in a liberalization program in an emerging economy. The first is allowing the operation of free-market dynamics whereby the government reduces its interference through deregulation. The second is active intervention by the government in select areas, with the most important being the creation of a physical infrastructure/provision of a platform to enable the work force to participate in productive activities.
While the Indian government seems to have been fairly successful in fulfilling the first role, progress in its second function has fallen short of expectations. For instance, India’s infrastructure spending is still low even after the recent pickup. The corporate sector is not pursuing a full-blown capex cycle as the government is slow to implement investments in infrastructure and initiate other long-awaited structural reforms. On an aggregate basis, foreign liquidity flows continue to boost government consumption and household spending more than corporate or infrastructure investments. However, incrementally, excesses are building in the system as a result of this trend.
Exhibit 19 Indian Corporate Sector’s Risk Aversion to Capex F1995 F1996 F2000 F2003 F2005 F2006EMS Research Coverage Universe (80 companies, accounting for 47% of total market cap.) Capex to Depn 4.3 2.8 2.4 2.3 2.0 2.4 Cash to Book Value 12.9% 13.0% 17.1% 17.5% 28.0% 26.2% Debt to Equity 0.60 0.55 0.42 0.42 0.32 0.27 ROE 16.5% 17.4% 16.6% 19.1% 22.3% 20.0% Top 200 Listed Companies (accounting for 57% of total market cap.) Capex to Depn 4.6 4.5 1.9 1.2 2.0 na Cash to Book Value 10.6% 9.6% 12.7% 17.8% 26.1% na Debt to Equity 0.9 0.8 0.7 0.6 0.4 na ROE 16.2% 16.3% 11.7% 18.2% 22.7% na Source: Capitaline, Morgan Stanley Research; E= Morgan Stanley Research Estimates Exhibit 20
Trailing 4Q Current Account Balance (As % of GDP)
-5.0%
-2.5%
0.0%
2.5%
5.0%
7.5%
10.0%
Dec
-98
Dec
-99
Dec
-00
Dec
-01
Dec
-02
Dec
-03
Dec
-04
Dec
-05
IndiaChinaEmerging Asia (Ex-India & China)-1LatAm-2Emerging Europe-3
Note: Based on MSCI Emerging Market universe filtered by countries with nominal GDP greater than US$100 bn. 1. Includes Korea, Taiwan, Indonesia, Thailand and Malaysia. 2. Includes Argentina, Brazil, Mexico and Venezuela. 3. Includes Russia, Turkey, South Africa, Israel, Czech Republic. Source: CEIC, Central Bank websites, Morgan Stanley Research
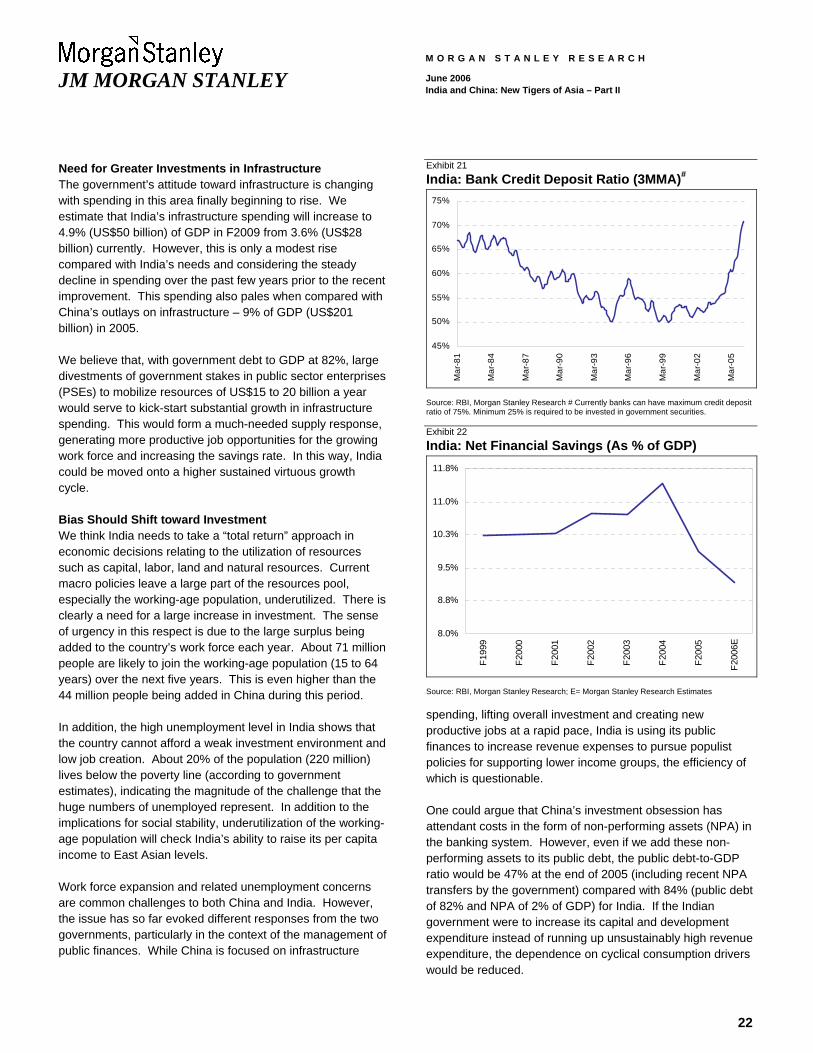
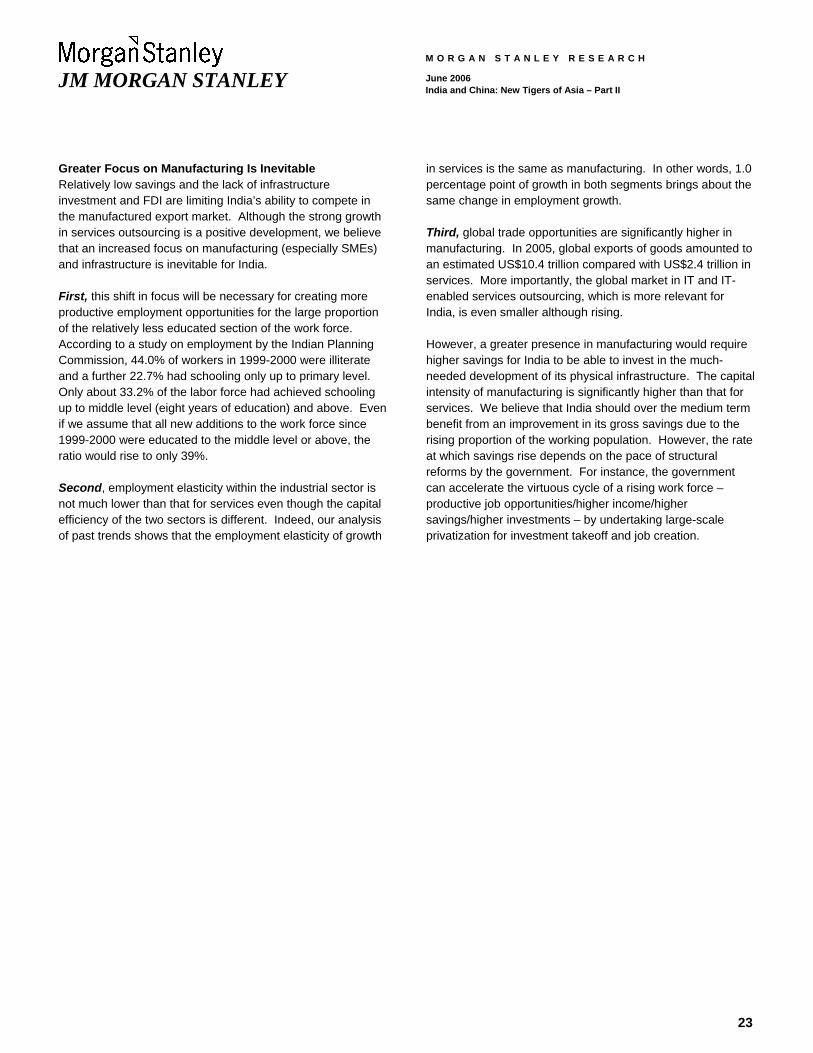
Initially, the growth in consumption, supported by government and household borrowing, was not necessarily a negative development as it helped improve domestic capacity utilization. We believe that, since early 2004, a rising proportion of this consumption is being met through imports. In other words, incrementally every rupee of consumption boosted by borrowing is not generating the same positive impact on domestic output. This trend is also posing significant challenges (a point that the central bank has highlighted), including deterioration in credit quality, asset bubbles (especially property prices), a decline in household financial savings and a widening current account gap. More importantly, implementation of aggressive capex schedules now could cause interest rates to rise sharply – especially in a tightening global environment – as the financial capacity in the system has already been used to boost consumption (Exhibit 21).
22
JM MORGAN STANLEY
M O R G A N S T A N L E Y R E S E A R C H
June 2006 India and China: New Tigers of Asia – Part II
Need for Greater Investments in Infrastructure The government’s attitude toward infrastructure is changing with spending in this area finally beginning to rise. We estimate that India’s infrastructure spending will increase to 4.9% (US$50 billion) of GDP in F2009 from 3.6% (US$28 billion) currently. However, this is only a modest rise compared with India’s needs and considering the steady decline in spending over the past few years prior to the recent improvement. This spending also pales when compared with China’s outlays on infrastructure – 9% of GDP (US$201 billion) in 2005.
We believe that, with government debt to GDP at 82%, large divestments of government stakes in public sector enterprises (PSEs) to mobilize resources of US$15 to 20 billion a year would serve to kick-start substantial growth in infrastructure spending. This would form a much-needed supply response, generating more productive job opportunities for the growing work force and increasing the savings rate. In this way, India could be moved onto a higher sustained virtuous growth cycle.
Bias Should Shift toward Investment We think India needs to take a “total return” approach in economic decisions relating to the utilization of resources such as capital, labor, land and natural resources. Current macro policies leave a large part of the resources pool, especially the working-age population, underutilized. There is clearly a need for a large increase in investment. The sense of urgency in this respect is due to the large surplus being added to the country’s work force each year. About 71 million people are likely to join the working-age population (15 to 64 years) over the next five years. This is even higher than the 44 million people being added in China during this period.
In addition, the high unemployment level in India shows that the country cannot afford a weak investment environment and low job creation. About 20% of the population (220 million) lives below the poverty line (according to government estimates), indicating the magnitude of the challenge that the huge numbers of unemployed represent. In addition to the implications for social stability, underutilization of the working-age population will check India’s ability to raise its per capita income to East Asian levels.
Work force expansion and related unemployment concerns are common challenges to both China and India. However, the issue has so far evoked different responses from the two governments, particularly in the context of the management of public finances. While China is focused on infrastructure
Exhibit 21 India: Bank Credit Deposit Ratio (3MMA)#
45%
50%
55%
60%
65%
70%
75%
Mar
-81
Mar
-84
Mar
-87
Mar
-90
Mar
-93
Mar
-96
Mar
-99
Mar
-02
Mar
-05
Source: RBI, Morgan Stanley Research # Currently banks can have maximum credit deposit ratio of 75%. Minimum 25% is required to be invested in government securities. Exhibit 22 India: Net Financial Savings (As % of GDP)
8.0%
8.8%
9.5%
10.3%
11.0%
11.8%F1
999
F200
0
F200
1
F200
2
F200
3
F200
4
F200
5
F200
6E
Source: RBI, Morgan Stanley Research; E= Morgan Stanley Research Estimates
spending, lifting overall investment and creating new productive jobs at a rapid pace, India is using its public finances to increase revenue expenses to pursue populist policies for supporting lower income groups, the efficiency of which is questionable.
One could argue that China’s investment obsession has attendant costs in the form of non-performing assets (NPA) in the banking system. However, even if we add these non-performing assets to its public debt, the public debt-to-GDP ratio would be 47% at the end of 2005 (including recent NPA transfers by the government) compared with 84% (public debt of 82% and NPA of 2% of GDP) for India. If the Indian government were to increase its capital and development expenditure instead of running up unsustainably high revenue expenditure, the dependence on cyclical consumption drivers would be reduced.
23
JM MORGAN STANLEY
M O R G A N S T A N L E Y R E S E A R C H
June 2006 India and China: New Tigers of Asia – Part II
Greater Focus on Manufacturing Is Inevitable Relatively low savings and the lack of infrastructure investment and FDI are limiting India’s ability to compete in the manufactured export market. Although the strong growth in services outsourcing is a positive development, we believe that an increased focus on manufacturing (especially SMEs) and infrastructure is inevitable for India.
First, this shift in focus will be necessary for creating more productive employment opportunities for the large proportion of the relatively less educated section of the work force. According to a study on employment by the Indian Planning Commission, 44.0% of workers in 1999-2000 were illiterate and a further 22.7% had schooling only up to primary level. Only about 33.2% of the labor force had achieved schooling up to middle level (eight years of education) and above. Even if we assume that all new additions to the work force since 1999-2000 were educated to the middle level or above, the ratio would rise to only 39%.
Second, employment elasticity within the industrial sector is not much lower than that for services even though the capital efficiency of the two sectors is different. Indeed, our analysis of past trends shows that the employment elasticity of growth
in services is the same as manufacturing. In other words, 1.0 percentage point of growth in both segments brings about the same change in employment growth.
Third, global trade opportunities are significantly higher in manufacturing. In 2005, global exports of goods amounted to an estimated US$10.4 trillion compared with US$2.4 trillion in services. More importantly, the global market in IT and IT-enabled services outsourcing, which is more relevant for India, is even smaller although rising.
However, a greater presence in manufacturing would require higher savings for India to be able to invest in the much-needed development of its physical infrastructure. The capital intensity of manufacturing is significantly higher than that for services. We believe that India should over the medium term benefit from an improvement in its gross savings due to the rising proportion of the working population. However, the rate at which savings rise depends on the pace of structural reforms by the government. For instance, the government can accelerate the virtuous cycle of a rising work force – productive job opportunities/higher income/higher savings/higher investments – by undertaking large-scale privatization for investment takeoff and job creation.
24
JM MORGAN STANLEY
M O R G A N S T A N L E Y R E S E A R C H
June 2006 India and China: New Tigers of Asia – Part II
Transition in the Growth Model - China
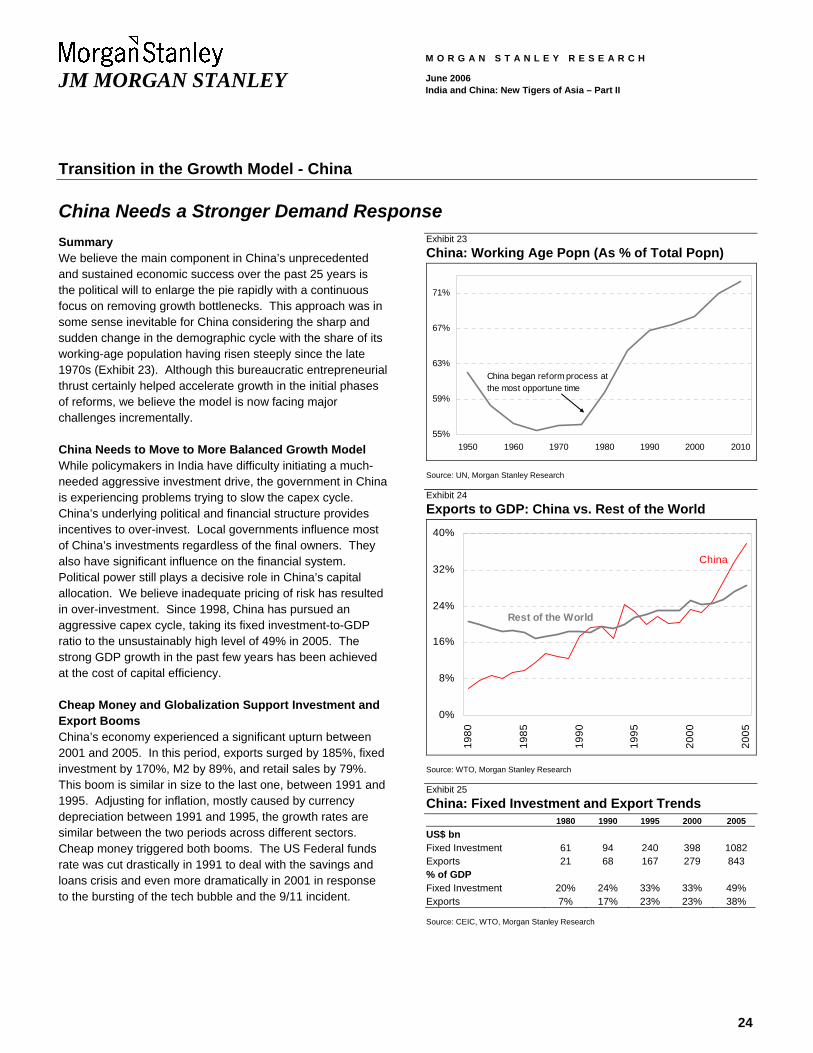
China Needs a Stronger Demand Response Summary We believe the main component in China’s unprecedented and sustained economic success over the past 25 years is the political will to enlarge the pie rapidly with a continuous focus on removing growth bottlenecks. This approach was in some sense inevitable for China considering the sharp and sudden change in the demographic cycle with the share of its working-age population having risen steeply since the late 1970s (Exhibit 23). Although this bureaucratic entrepreneurial thrust certainly helped accelerate growth in the initial phases of reforms, we believe the model is now facing major challenges incrementally.
China Needs to Move to More Balanced Growth Model While policymakers in India have difficulty initiating a much-needed aggressive investment drive, the government in China is experiencing problems trying to slow the capex cycle. China’s underlying political and financial structure provides incentives to over-invest. Local governments influence most of China’s investments regardless of the final owners. They also have significant influence on the financial system. Political power still plays a decisive role in China’s capital allocation. We believe inadequate pricing of risk has resulted in over-investment. Since 1998, China has pursued an aggressive capex cycle, taking its fixed investment-to-GDP ratio to the unsustainably high level of 49% in 2005. The strong GDP growth in the past few years has been achieved at the cost of capital efficiency.
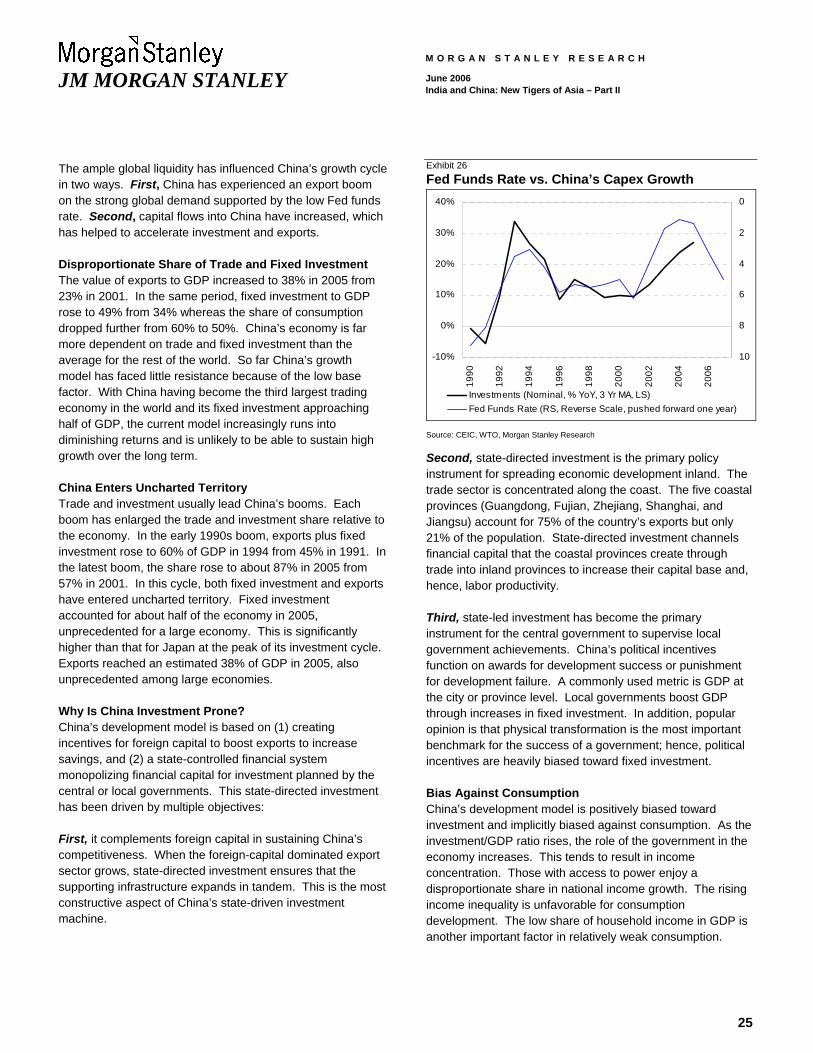
Cheap Money and Globalization Support Investment and Export Booms China’s economy experienced a significant upturn between 2001 and 2005. In this period, exports surged by 185%, fixed investment by 170%, M2 by 89%, and retail sales by 79%. This boom is similar in size to the last one, between 1991 and 1995. Adjusting for inflation, mostly caused by currency depreciation between 1991 and 1995, the growth rates are similar between the two periods across different sectors. Cheap money triggered both booms. The US Federal funds rate was cut drastically in 1991 to deal with the savings and loans crisis and even more dramatically in 2001 in response to the bursting of the tech bubble and the 9/11 incident.
Exhibit 23 China: Working Age Popn (As % of Total Popn)
55%
59%
63%
67%
71%
1950 1960 1970 1980 1990 2000 2010
China began reform process at the most opportune time
Source: UN, Morgan Stanley Research Exhibit 24 Exports to GDP: China vs. Rest of the World
0%
8%
16%
24%
32%
40%
1980
1985
1990
1995
2000
2005
China
Rest of the World
Source: WTO, Morgan Stanley Research Exhibit 25 China: Fixed Investment and Export Trends 1980 1990 1995 2000 2005 US$ bn Fixed Investment 61 94 240 398 1082 Exports 21 68 167 279 843 % of GDP Fixed Investment 20% 24% 33% 33% 49% Exports 7% 17% 23% 23% 38% Source: CEIC, WTO, Morgan Stanley Research
25
JM MORGAN STANLEY
M O R G A N S T A N L E Y R E S E A R C H
June 2006 India and China: New Tigers of Asia – Part II
The ample global liquidity has influenced China’s growth cycle in two ways. First, China has experienced an export boom on the strong global demand supported by the low Fed funds rate. Second, capital flows into China have increased, which has helped to accelerate investment and exports.
Disproportionate Share of Trade and Fixed Investment The value of exports to GDP increased to 38% in 2005 from 23% in 2001. In the same period, fixed investment to GDP rose to 49% from 34% whereas the share of consumption dropped further from 60% to 50%. China’s economy is far more dependent on trade and fixed investment than the average for the rest of the world. So far China’s growth model has faced little resistance because of the low base factor. With China having become the third largest trading economy in the world and its fixed investment approaching half of GDP, the current model increasingly runs into diminishing returns and is unlikely to be able to sustain high growth over the long term.
China Enters Uncharted Territory Trade and investment usually lead China’s booms. Each boom has enlarged the trade and investment share relative to the economy. In the early 1990s boom, exports plus fixed investment rose to 60% of GDP in 1994 from 45% in 1991. In the latest boom, the share rose to about 87% in 2005 from 57% in 2001. In this cycle, both fixed investment and exports have entered uncharted territory. Fixed investment accounted for about half of the economy in 2005, unprecedented for a large economy. This is significantly higher than that for Japan at the peak of its investment cycle. Exports reached an estimated 38% of GDP in 2005, also unprecedented among large economies.
Why Is China Investment Prone? China’s development model is based on (1) creating incentives for foreign capital to boost exports to increase savings, and (2) a state-controlled financial system monopolizing financial capital for investment planned by the central or local governments. This state-directed investment has been driven by multiple objectives:
First, it complements foreign capital in sustaining China’s competitiveness. When the foreign-capital dominated export sector grows, state-directed investment ensures that the supporting infrastructure expands in tandem. This is the most constructive aspect of China’s state-driven investment machine.
Exhibit 26 Fed Funds Rate vs. China’s Capex Growth
-10%
0%
10%
20%
30%
40%
1990
1992
1994
1996
1998
2000
2002
2004
2006
0
2
4
6
8
10
Investments (Nominal, % YoY, 3 Yr MA, LS)Fed Funds Rate (RS, Reverse Scale, pushed forward one year)
Source: CEIC, WTO, Morgan Stanley Research
Second, state-directed investment is the primary policy instrument for spreading economic development inland. The trade sector is concentrated along the coast. The five coastal provinces (Guangdong, Fujian, Zhejiang, Shanghai, and Jiangsu) account for 75% of the country’s exports but only 21% of the population. State-directed investment channels financial capital that the coastal provinces create through trade into inland provinces to increase their capital base and, hence, labor productivity.
Third, state-led investment has become the primary instrument for the central government to supervise local government achievements. China’s political incentives function on awards for development success or punishment for development failure. A commonly used metric is GDP at the city or province level. Local governments boost GDP through increases in fixed investment. In addition, popular opinion is that physical transformation is the most important benchmark for the success of a government; hence, political incentives are heavily biased toward fixed investment.
Bias Against Consumption China’s development model is positively biased toward investment and implicitly biased against consumption. As the investment/GDP ratio rises, the role of the government in the economy increases. This tends to result in income concentration. Those with access to power enjoy a disproportionate share in national income growth. The rising income inequality is unfavorable for consumption development. The low share of household income in GDP is another important factor in relatively weak consumption.
26
JM MORGAN STANLEY
M O R G A N S T A N L E Y R E S E A R C H
June 2006 India and China: New Tigers of Asia – Part II
Currency Appreciation Is Not the Answer China is taking tentative steps towards reforming its exchange rate. Many analysts have argued that China should revalue its currency to boost consumption. We believe that reforming the currency is not a sufficient condition. Currency appreciation can help boost consumption in a completely market-oriented economy. China is not yet a full-fledged market economy. Unless changes are made to the political economy, a strong currency would cause growth to slow.
The Hard Road to Balanced Growth We believe that China needs to undertake five fundamental reforms to achieve balanced growth.
First, decrease the role of government in the economy. The government has controlled a large proportion of economic resources and directed them in a way that ensures strong economic growth. This has helped China in the initial stages to take a “total return” approach in economic decision-making to improve utilization of all resources, i.e., capital, labor, land and natural resources. However, incrementally this model may pose systemic challenges. Although, China has initiated major deregulatory measures, the government’s control and influence over economic resources remain high. China should reduce the dominance of government ownership to improve market discipline.
Second, improve the institutional framework and corporate governance. Agency costs associated with excessive local government influence on economic activities are high. China needs to focus on improving the institutional framework to provide a structure that encourages the efficient allocation of capital to lay the foundation for sustaining the current strong growth trend. Financial sector reforms are an important part of these overall reforms aimed at reducing the government role. Under the current structure, state-owned banks are not able to effectively discharge their role of ensuring corporate governance.
Third, return assets to the people. The government owns land, natural resources, and numerous state-owned enterprises. Households, therefore, have a lower share of the country’s wealth. The return of assets to the people could provide support for household consumption growth. We believe that reforming the role of the government in the economy would also be necessary for better income distribution.
Fourth, reform the healthcare and education sectors to reduce households’ cost concerns. Healthcare and education, in theory, are still under government control; however, these sectors usually raise funds from students and patients through a range of unofficial levies and charges. Adequate funds are not provided to local authorities for running these social programs. China does not enjoy either the benefits of efficient private ownership or the low costs of public ownership. In addition, the high cost of health and education adversely influences household behavior toward consumption.
Fifth, boost supply of affordable housing. Property is the most important expenditure item for a typical family. High property prices are a secular force against consumption. Some cities have witnessed a significant rise in property prices. Many analysts argue that rising property prices are good for consumption. This is true in the short term only and at the expense of long-term consumption. A rise in property prices in a country where home ownership is still low can cause social tension and make people save more from a sense of insecurity.
Conclusion The path to balanced development is challenging but the government appears to be initiating steps towards this corrective path. The recent announcements by the Premier that the government will target development of the countryside, reduce inequality and improve the share of consumption in GDP are moves in that direction. However, executing the plan will likely remain a challenge.
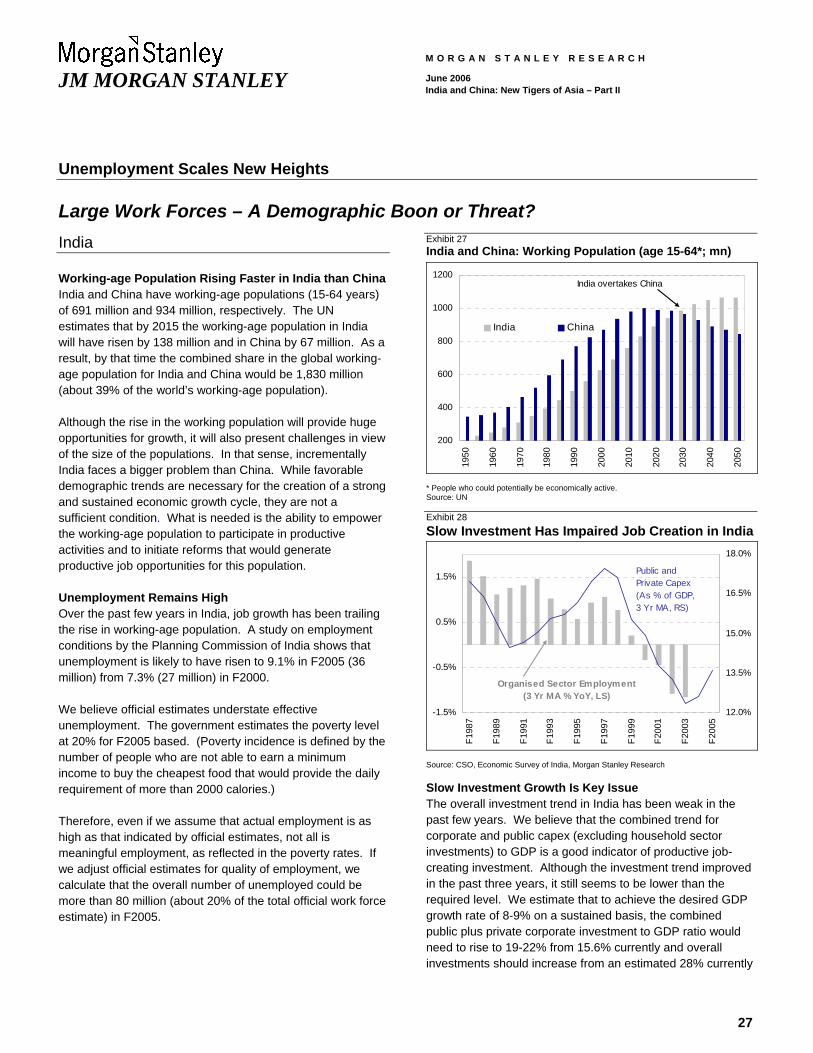
27
JM MORGAN STANLEY
M O R G A N S T A N L E Y R E S E A R C H
June 2006 India and China: New Tigers of Asia – Part II
Unemployment Scales New Heights
Large Work Forces – A Demographic Boon or Threat? India
Working-age Population Rising Faster in India than China India and China have working-age populations (15-64 years) of 691 million and 934 million, respectively. The UN estimates that by 2015 the working-age population in India will have risen by 138 million and in China by 67 million. As a result, by that time the combined share in the global working-age population for India and China would be 1,830 million (about 39% of the world’s working-age population).
Although the rise in the working population will provide huge opportunities for growth, it will also present challenges in view of the size of the populations. In that sense, incrementally India faces a bigger problem than China. While favorable demographic trends are necessary for the creation of a strong and sustained economic growth cycle, they are not a sufficient condition. What is needed is the ability to empower the working-age population to participate in productive activities and to initiate reforms that would generate productive job opportunities for this population.
Unemployment Remains High Over the past few years in India, job growth has been trailing the rise in working-age population. A study on employment conditions by the Planning Commission of India shows that unemployment is likely to have risen to 9.1% in F2005 (36 million) from 7.3% (27 million) in F2000.
We believe official estimates understate effective unemployment. The government estimates the poverty level at 20% for F2005 based. (Poverty incidence is defined by the number of people who are not able to earn a minimum income to buy the cheapest food that would provide the daily requirement of more than 2000 calories.)
Therefore, even if we assume that actual employment is as high as that indicated by official estimates, not all is meaningful employment, as reflected in the poverty rates. If we adjust official estimates for quality of employment, we calculate that the overall number of unemployed could be more than 80 million (about 20% of the total official work force estimate) in F2005.
Exhibit 27 India and China: Working Population (age 15-64*; mn)
200
400
600
800
1000
1200
1950
1960
1970
1980
1990
2000
2010
2020
2030
2040
2050
India China
India overtakes China
* People who could potentially be economically active. Source: UN Exhibit 28 Slow Investment Has Impaired Job Creation in India
-1.5%
-0.5%
0.5%
1.5%
F198
7
F198
9
F199
1
F199
3
F199
5
F199
7
F199
9
F200
1
F200
3
F200
512.0%
13.5%
15.0%
16.5%
18.0%
Organised Sector Employment (3 Yr MA % YoY, LS)
Public and Private Capex (As % of GDP, 3 Yr MA, RS)
Source: CSO, Economic Survey of India, Morgan Stanley Research
Slow Investment Growth Is Key Issue The overall investment trend in India has been weak in the past few years. We believe that the combined trend for corporate and public capex (excluding household sector investments) to GDP is a good indicator of productive job-creating investment. Although the investment trend improved in the past three years, it still seems to be lower than the required level. We estimate that to achieve the desired GDP growth rate of 8-9% on a sustained basis, the combined public plus private corporate investment to GDP ratio would need to rise to 19-22% from 15.6% currently and overall investments should increase from an estimated 28% currently

28
JM MORGAN STANLEY
M O R G A N S T A N L E Y R E S E A R C H
June 2006 India and China: New Tigers of Asia – Part II
to 33-37% of GDP (assuming an average capital output ratio of 4.2 compared with an average of 4.4 since F1997).
Intensity of Employment Growth Diminishing The unemployment problem is compounded by the decline in the elasticity of employment growth observed in recent years. This stems from modernization and a greater focus on efficiency. Employment elasticity fell to 0.16 (i.e., for every 1% increase in GDP, employment rises by 0.16%) in F1994-2000 from 0.52 in F1983-1994. According to the study on employment by the Planning Commission of India, this trend is unlikely to change significantly as there is still scope for improving efficiency in some of the traditional large sectors such as electricity, mining, agriculture and government services.
Strong Macro Plan Needed Unless India initiates a well-planned program to increase GDP growth to 8-9% on a sustained basis, we believe that the expanding work force could become an increasing threat to social stability. We think such a program should entail a sharp rise in investment, especially in infrastructure. A second issue requiring government attention is labor flexibility. India’s labor laws are outmoded and do not encourage employee flexibility. Indeed, labor legislation is an area where India’s performance during the past 15 years of liberalization has been especially unsatisfactory.
Under current legislation, all employers of more than 100 people must seek approval from the government through a complex process before retrenching employees. In practice, these laws have been a deterrent to employers, forcing them to choose capital-intensive methods of production, even if they would have otherwise preferred labor-intensive options. The laws that have been introduced to protect labor are in practice working against it. We discuss this issue in greater detail in the section titled, “Some Challenges Are Unique to India: Outmoded Labor Laws”.
China China Suffers from Similar Pressures China’s demographic shift has meant unparalleled changes in global working-age population growth. In 2005, China accounted for an estimated 22% of the global working-age population. Its age-dependency (ratio of non-working-age to working-age population) peaked in 1965 at 80%. Since then, the working population has increased sharply. The age-dependency ratio fell to 67% in 1980 and further to 46% in 2000. Its working-age population (15–64 years) increased to
Exhibit 29 India: Employment Trends Unit F2000 F2002 F2005 Population Mn 1015 1051 1097 Growth p.a. % 3.3 1.8 1.4 Labor Force Mn 363 378 399 Employed Mn 337 345 363 Unemployed Mn 27 34 36 Unemployment rate % 7.3 8.9 9.1 Poverty Rate # % 36 na na Source: Planning Commission of India, Morgan Stanley Research # International poverty line = Population living below US$1 PPP per day. na = not available Exhibit 30 China: Employment Trends Unit 1999 2001 2004 Population Mn 1258 1276 1300 Growth p.a. % 0.8 0.7 0.6 Labor Force Mn 728 744 768 Employed Mn 714 730 752 Unemployed Mn 14 14 16 Unemployment rate % 1.9 1.9 2.1 Poverty Rate # % 17.8 16.6 na Source: CEIC, World Bank, Morgan Stanley Research; # International poverty line = Population living below US$1 PPP per day. na = not available Exhibit 31 China Urban Employment: Changing Mix of SOE vs. Private Sector
0
40
80
120
160
200
1991
1992
1993
1994
1995
1996
1997
1998
1999
2000
2001
2002
2003
2004
Private Sector
SOEs and Collective Units
In Millions
Source: CEIC, Morgan Stanley Research
934 million in 2005 from 596 million in 1980. Despite strong economic growth of an average 9.7% in the 1980s and 10% in the 1990s, China’s unemployment problem remains challenging. Its official urban unemployment rate at the end of 2005 was an estimated 4.2% (8.4 million). The government does not disclose official statistics on rural unemployment. According to the Organization for Economic Cooperation and Development (OECD) (2002), the rural hidden unemployment level in China could be as high as 150-275 million.
29
JM MORGAN STANLEY
M O R G A N S T A N L E Y R E S E A R C H
June 2006 India and China: New Tigers of Asia – Part II
Substantial Job Creation in Urban Areas but Not Enough Official data indicate that overall annual employment growth between 1990 and 2005 was 1.1%. Most of the job creation was in urban areas. Rural employment grew at an average 0.2% a year in this period compared with 3.2% in the urban sector. Breaking down employment trends in two distinct phases during 1990-2004 provides a perspective on the government’s efforts to manage the employment growth mix.
During the period 1990–96, the government’s focus was to ease the pressure on the agriculture sector. In this period, China achieved strong GDP expansion of 12%. Robust growth in manufacturing (secondary) and services (tertiary) helped offset the decline in employment in the agriculture (primary) sector. Pressure from job losses due to the reform of state-owned enterprises (SOE) was limited. While employment in the private sector increased, the SOE sector continued to carry surplus labor.
Between 1996 and 2004, the focus was to shift the responsibility of job creation to the private sector. During this period, average GDP growth slowed to 9% and, at the same time, the government accelerated the process of reforming SOEs and collectives. In this period, total secondary sector employment grew only 0.5% a year. The stock of people employed in SOEs and collectives declined by 67 million during 1996-2004. Non-SOE sector job creation, however, was strong enough to ease the burden of job losses in the SOE sector.
Exhibit 32 China: Changing Employment Growth Mix (CAGR) 1990-1996 1996-2004 1990-2004 GDP Growth Primary 4.3% 3.3% 3.8% Secondary 16.5% 9.9% 12.7% Tertiary 10.6% 9.8% 10.1% Overall 11.9% 8.8% 10.1% Employment Growth Primary -1.8% 0.2% -0.8% Secondary 2.6% 0.5% 1.5% Tertiary 7.0% 3.2% 5.1% Overall 1.1% 1.1% 1.1% Rural 0.5% -0.1% 0.2% Urban 2.6% 3.6% 3.2% -- SOE 0.4% -7.6% -4.2% -- Non SOE 10.3% 16.2% 13.7% Source: CEIC, Morgan Stanley Research
Slower Growth in Working Population Should Ease Pressure The UN estimates China’s working population growth will decelerate sharply over the next 10 years from an average 1.4% a year in the five-year period ended 2005 to 0.7% over the 10 years ending 2015. However, the problem of the stock of surplus labor, particularly in the rural sector, will continue to be a macro challenge. As of 2005, official data showed that 490 million people (65% of the total) were employed in the rural sector.
Conclusion We believe that unless the two countries – India in particular – initiate a well-planned program to create adequate employment, the rising work force may increase the risks of social instability.

30
JM MORGAN STANLEY
M O R G A N S T A N L E Y R E S E A R C H
June 2006 India and China: New Tigers of Asia – Part II
Poverty and Inequality
Globalization Success Stories but Human Development Lags Slow Progress in Broad Human Development Measures While India and China have been major beneficiaries of globalization in terms of acceleration in GDP growth, their track records in improving human development have been less impressive. We believe that, while both countries are likely to remain on the globalization path, their governments need to intervene constructively in the economy to empower lower income groups.
The Poverty Challenge What Is Poverty? Poverty has been defined in many ways. The Indian government defines the poverty ratio as that proportion of the population that is unable to purchase the minimum amount required to meet the daily food need of 2,000 calories. The World Bank defines the international poverty ratio as the percentage of the population living on less than US$1 a day at 1993 international prices. We believe a more appropriate measure would be one that is broader by definition. For instance, the UN looks at income as well as non-income factors (human development index), which include rankings on education and health parameters. Nobel laureate Amartya Sen has also argued that poverty is not just about low income but deprivation of basic capabilities.
Elaborating on this point, the United Nations Committee on Economic, Social and Cultural Rights has similarly defined poverty as "a human condition characterized by the sustained or chronic deprivation of the resources, capabilities, choices, security and power necessary for the enjoyment of an adequate standard of living and other civil, cultural, economic, political and social rights." The challenges facing the two nations would be even more serious if this broader definition of poverty were to be considered.
Significant Reduction of Income Poverty but Not Enough Both India and China have been able to cut income poverty rates (share of population living below US$1/day in PPP terms) at a reasonable pace over the past 15 years. The World Bank estimates the two countries have witnessed significant declines in income poverty rates over the past 10-15 years. A reduction in poverty is dependent on income growth in a country and the extent to which that income growth is distributed to the poor. Acceleration in growth has been the key factor that has allowed the two countries to
Exhibit 33 India and China: Human Development Index
0.40
0.48
0.56
0.64
0.72
0.80
197
5
198
0
198
5
199
0
199
5
200
0
200
3
India
China
Source: UN’s Human Development Report, Morgan Stanley Research Exhibit 34 Poverty Rate (% of population living below US$1 PPP per day)
0%
15%
30%
45%
60%
1985
1986
1987
1988
1989
1990
-91
1992
1993
1994
1995
1996
1997
1998
1999
2001
1985 - 381 Mn
1995 - 472 Mn
1999 - 359 Mn
1985 - 254 Mn 1995 -
290 Mn 2001 - 212 Mn
1990-91 -357 Mn
1990-91 -375 Mn
India
China
Source: World Bank, Morgan Stanley Research
lower their poverty levels, particularly in China. According to World Bank data, in China the poverty rate declined to 17% (212 million people) in 2001 from 33% (375 million) in 1990. Similarly, the poverty rate in India dropped to 36% (359 million) in 1999 from 42% (357 million) in 1990.
Despite this reduction, India and China together accounted for about 55% of the world’s poor in 2001. An improvement in the poverty rate should have continued even after 2001 but the absolute size of the population below the poverty line in both countries is likely still to be huge (in the range of 250 to
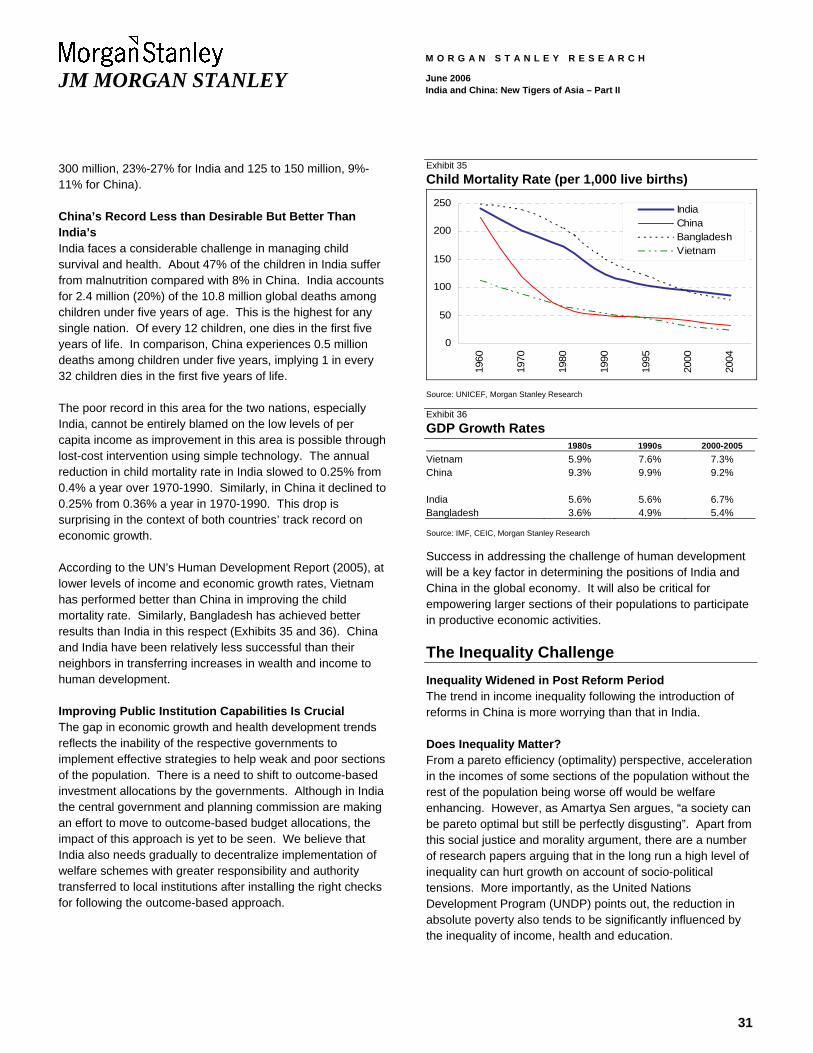
31
JM MORGAN STANLEY
M O R G A N S T A N L E Y R E S E A R C H
June 2006 India and China: New Tigers of Asia – Part II
300 million, 23%-27% for India and 125 to 150 million, 9%-11% for China).
China’s Record Less than Desirable But Better Than India’s India faces a considerable challenge in managing child survival and health. About 47% of the children in India suffer from malnutrition compared with 8% in China. India accounts for 2.4 million (20%) of the 10.8 million global deaths among children under five years of age. This is the highest for any single nation. Of every 12 children, one dies in the first five years of life. In comparison, China experiences 0.5 million deaths among children under five years, implying 1 in every 32 children dies in the first five years of life.
The poor record in this area for the two nations, especially India, cannot be entirely blamed on the low levels of per capita income as improvement in this area is possible through lost-cost intervention using simple technology. The annual reduction in child mortality rate in India slowed to 0.25% from 0.4% a year over 1970-1990. Similarly, in China it declined to 0.25% from 0.36% a year in 1970-1990. This drop is surprising in the context of both countries’ track record on economic growth.
According to the UN’s Human Development Report (2005), at lower levels of income and economic growth rates, Vietnam has performed better than China in improving the child mortality rate. Similarly, Bangladesh has achieved better results than India in this respect (Exhibits 35 and 36). China and India have been relatively less successful than their neighbors in transferring increases in wealth and income to human development.
Improving Public Institution Capabilities Is Crucial The gap in economic growth and health development trends reflects the inability of the respective governments to implement effective strategies to help weak and poor sections of the population. There is a need to shift to outcome-based investment allocations by the governments. Although in India the central government and planning commission are making an effort to move to outcome-based budget allocations, the impact of this approach is yet to be seen. We believe that India also needs gradually to decentralize implementation of welfare schemes with greater responsibility and authority transferred to local institutions after installing the right checks for following the outcome-based approach.
Exhibit 35 Child Mortality Rate (per 1,000 live births)
0
50
100
150
200
250
1960
1970
1980
1990
1995
2000
2004
IndiaChinaBangladeshVietnam
Source: UNICEF, Morgan Stanley Research Exhibit 36 GDP Growth Rates 1980s 1990s 2000-2005 Vietnam 5.9% 7.6% 7.3% China 9.3% 9.9% 9.2% India 5.6% 5.6% 6.7% Bangladesh 3.6% 4.9% 5.4% Source: IMF, CEIC, Morgan Stanley Research
Success in addressing the challenge of human development will be a key factor in determining the positions of India and China in the global economy. It will also be critical for empowering larger sections of their populations to participate in productive economic activities.
The Inequality Challenge Inequality Widened in Post Reform Period The trend in income inequality following the introduction of reforms in China is more worrying than that in India.
Does Inequality Matter? From a pareto efficiency (optimality) perspective, acceleration in the incomes of some sections of the population without the rest of the population being worse off would be welfare enhancing. However, as Amartya Sen argues, “a society can be pareto optimal but still be perfectly disgusting”. Apart from this social justice and morality argument, there are a number of research papers arguing that in the long run a high level of inequality can hurt growth on account of socio-political tensions. More importantly, as the United Nations Development Program (UNDP) points out, the reduction in absolute poverty also tends to be significantly influenced by the inequality of income, health and education.
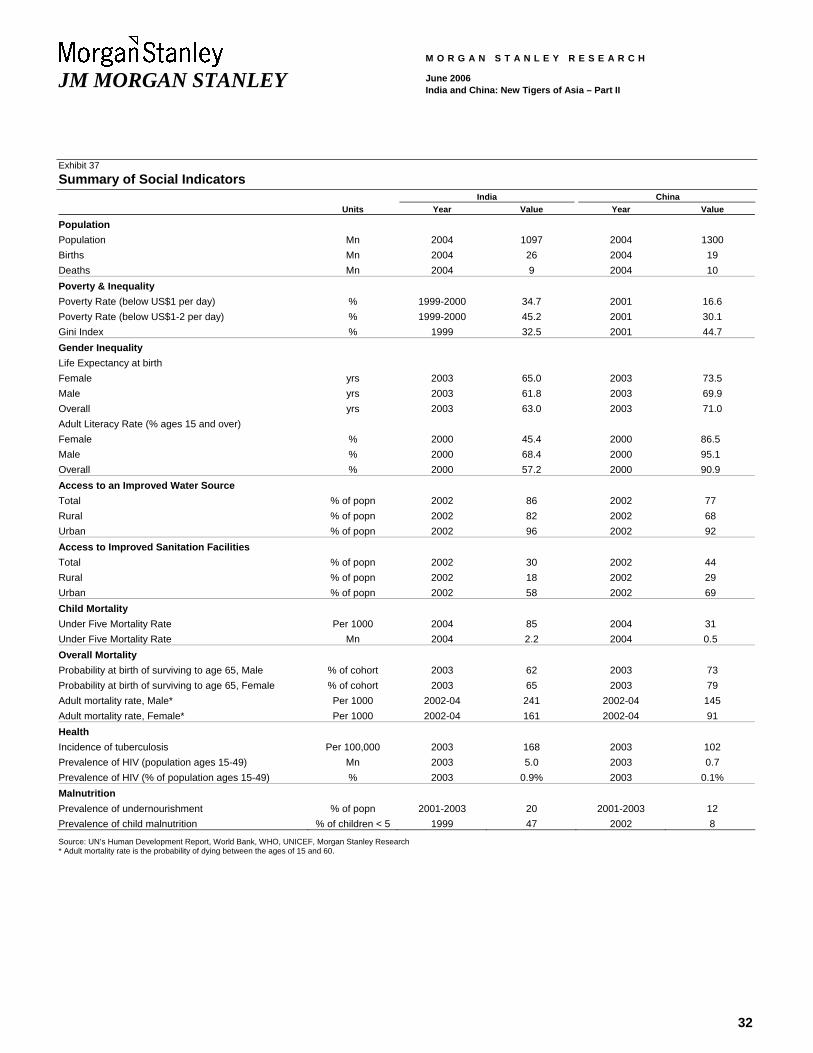
32
JM MORGAN STANLEY
M O R G A N S T A N L E Y R E S E A R C H
June 2006 India and China: New Tigers of Asia – Part II
Exhibit 37 Summary of Social Indicators India China Units Year Value Year Value
Population Population Mn 2004 1097 2004 1300 Births Mn 2004 26 2004 19 Deaths Mn 2004 9 2004 10 Poverty & Inequality Poverty Rate (below US$1 per day) % 1999-2000 34.7 2001 16.6 Poverty Rate (below US$1-2 per day) % 1999-2000 45.2 2001 30.1 Gini Index % 1999 32.5 2001 44.7 Gender Inequality Life Expectancy at birth Female yrs 2003 65.0 2003 73.5 Male yrs 2003 61.8 2003 69.9 Overall yrs 2003 63.0 2003 71.0 Adult Literacy Rate (% ages 15 and over) Female % 2000 45.4 2000 86.5 Male % 2000 68.4 2000 95.1 Overall % 2000 57.2 2000 90.9 Access to an Improved Water Source Total % of popn 2002 86 2002 77 Rural % of popn 2002 82 2002 68 Urban % of popn 2002 96 2002 92 Access to Improved Sanitation Facilities Total % of popn 2002 30 2002 44 Rural % of popn 2002 18 2002 29 Urban % of popn 2002 58 2002 69 Child Mortality Under Five Mortality Rate Per 1000 2004 85 2004 31 Under Five Mortality Rate Mn 2004 2.2 2004 0.5 Overall Mortality Probability at birth of surviving to age 65, Male % of cohort 2003 62 2003 73 Probability at birth of surviving to age 65, Female % of cohort 2003 65 2003 79 Adult mortality rate, Male* Per 1000 2002-04 241 2002-04 145 Adult mortality rate, Female* Per 1000 2002-04 161 2002-04 91 Health Incidence of tuberculosis Per 100,000 2003 168 2003 102 Prevalence of HIV (population ages 15-49) Mn 2003 5.0 2003 0.7 Prevalence of HIV (% of population ages 15-49) % 2003 0.9% 2003 0.1% Malnutrition Prevalence of undernourishment % of popn 2001-2003 20 2001-2003 12 Prevalence of child malnutrition % of children < 5 1999 47 2002 8
Source: UN’s Human Development Report, World Bank, WHO, UNICEF, Morgan Stanley Research * Adult mortality rate is the probability of dying between the ages of 15 and 60.
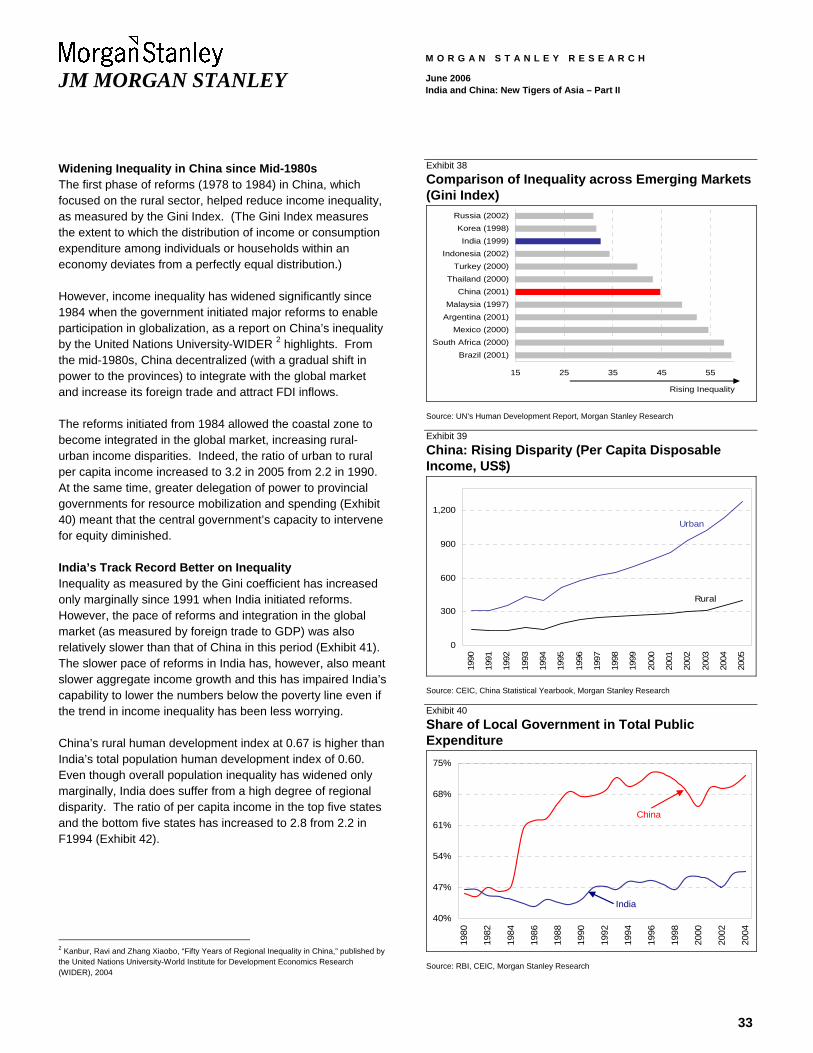
33
JM MORGAN STANLEY
M O R G A N S T A N L E Y R E S E A R C H
June 2006 India and China: New Tigers of Asia – Part II
Widening Inequality in China since Mid-1980s The first phase of reforms (1978 to 1984) in China, which focused on the rural sector, helped reduce income inequality, as measured by the Gini Index. (The Gini Index measures the extent to which the distribution of income or consumption expenditure among individuals or households within an economy deviates from a perfectly equal distribution.)
However, income inequality has widened significantly since 1984 when the government initiated major reforms to enable participation in globalization, as a report on China’s inequality by the United Nations University-WIDER 2 highlights. From the mid-1980s, China decentralized (with a gradual shift in power to the provinces) to integrate with the global market and increase its foreign trade and attract FDI inflows.
The reforms initiated from 1984 allowed the coastal zone to become integrated in the global market, increasing rural-urban income disparities. Indeed, the ratio of urban to rural per capita income increased to 3.2 in 2005 from 2.2 in 1990. At the same time, greater delegation of power to provincial governments for resource mobilization and spending (Exhibit 40) meant that the central government’s capacity to intervene for equity diminished.
India’s Track Record Better on Inequality Inequality as measured by the Gini coefficient has increased only marginally since 1991 when India initiated reforms. However, the pace of reforms and integration in the global market (as measured by foreign trade to GDP) was also relatively slower than that of China in this period (Exhibit 41). The slower pace of reforms in India has, however, also meant slower aggregate income growth and this has impaired India’s capability to lower the numbers below the poverty line even if the trend in income inequality has been less worrying.
China’s rural human development index at 0.67 is higher than India’s total population human development index of 0.60. Even though overall population inequality has widened only marginally, India does suffer from a high degree of regional disparity. The ratio of per capita income in the top five states and the bottom five states has increased to 2.8 from 2.2 in F1994 (Exhibit 42).
2 Kanbur, Ravi and Zhang Xiaobo, “Fifty Years of Regional Inequality in China,” published by the United Nations University-World Institute for Development Economics Research (WIDER), 2004
Exhibit 38 Comparison of Inequality across Emerging Markets (Gini Index)
15 25 35 45 55
Brazil (2001)South Africa (2000)
Mexico (2000)Argentina (2001)Malaysia (1997)
China (2001)Thailand (2000)
Turkey (2000)Indonesia (2002)
India (1999)Korea (1998)
Russia (2002)
Rising Inequality
Source: UN’s Human Development Report, Morgan Stanley Research Exhibit 39 China: Rising Disparity (Per Capita Disposable Income, US$)
0
300
600
900
1,200
1990
1991
1992
1993
1994
1995
1996
1997
1998
1999
2000
2001
2002
2003
2004
2005
Rural
Urban
Source: CEIC, China Statistical Yearbook, Morgan Stanley Research Exhibit 40 Share of Local Government in Total Public Expenditure
40%
47%
54%
61%
68%
75%
1980
1982
1984
1986
1988
1990
1992
1994
1996
1998
2000
2002
2004
China
India
Source: RBI, CEIC, Morgan Stanley Research
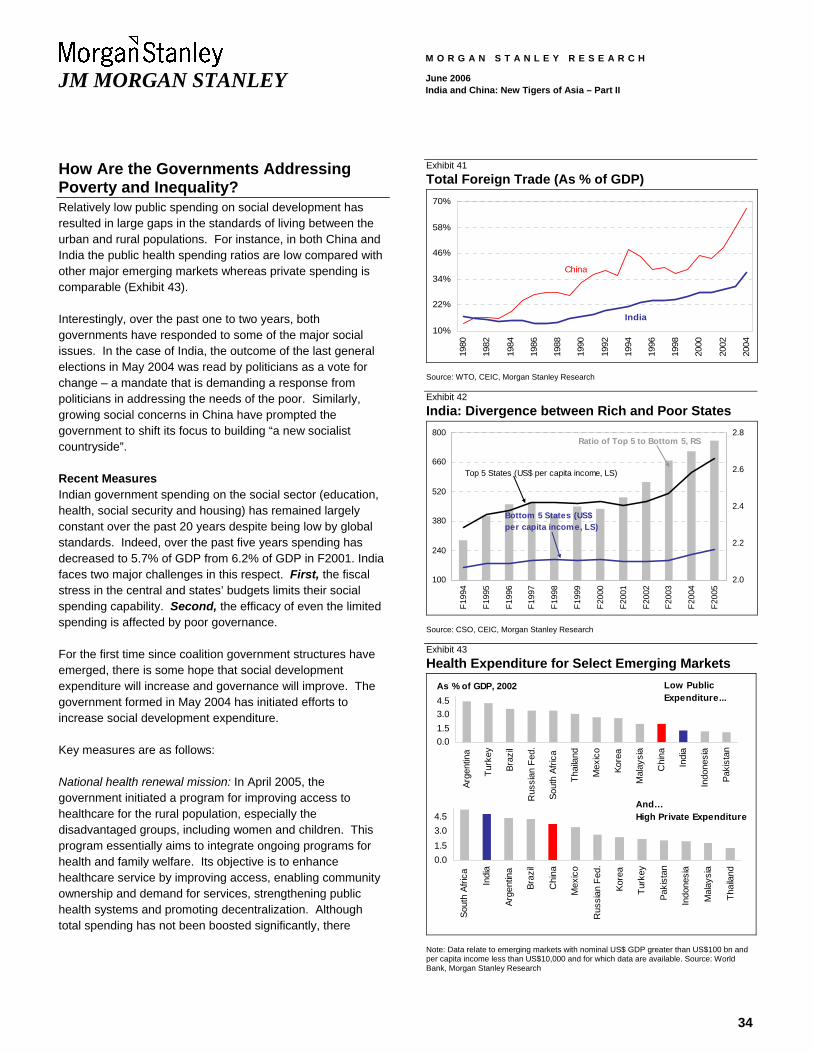
34
JM MORGAN STANLEY
M O R G A N S T A N L E Y R E S E A R C H
June 2006 India and China: New Tigers of Asia – Part II
How Are the Governments Addressing Poverty and Inequality? Relatively low public spending on social development has resulted in large gaps in the standards of living between the urban and rural populations. For instance, in both China and India the public health spending ratios are low compared with other major emerging markets whereas private spending is comparable (Exhibit 43).
Interestingly, over the past one to two years, both governments have responded to some of the major social issues. In the case of India, the outcome of the last general elections in May 2004 was read by politicians as a vote for change – a mandate that is demanding a response from politicians in addressing the needs of the poor. Similarly, growing social concerns in China have prompted the government to shift its focus to building “a new socialist countryside”.
Recent Measures Indian government spending on the social sector (education, health, social security and housing) has remained largely constant over the past 20 years despite being low by global standards. Indeed, over the past five years spending has decreased to 5.7% of GDP from 6.2% of GDP in F2001. India faces two major challenges in this respect. First, the fiscal stress in the central and states’ budgets limits their social spending capability. Second, the efficacy of even the limited spending is affected by poor governance.
For the first time since coalition government structures have emerged, there is some hope that social development expenditure will increase and governance will improve. The government formed in May 2004 has initiated efforts to increase social development expenditure.
Key measures are as follows:
National health renewal mission: In April 2005, the government initiated a program for improving access to healthcare for the rural population, especially the disadvantaged groups, including women and children. This program essentially aims to integrate ongoing programs for health and family welfare. Its objective is to enhance healthcare service by improving access, enabling community ownership and demand for services, strengthening public health systems and promoting decentralization. Although total spending has not been boosted significantly, there
Exhibit 41 Total Foreign Trade (As % of GDP)
10%
22%
34%
46%
58%
70%
1980
1982
1984
1986
1988
1990
1992
1994
1996
1998
2000
2002
2004
China
India
Source: WTO, CEIC, Morgan Stanley Research Exhibit 42 India: Divergence between Rich and Poor States
100
240
380
520
660
800
F199
4
F199
5
F199
6
F199
7
F199
8
F199
9
F200
0
F200
1
F200
2
F200
3
F200
4
F200
5
2.0
2.2
2.4
2.6
2.8Ratio of Top 5 to Bottom 5, RS
Top 5 States (US$ per capita income, LS)
Bottom 5 States (US$ per capita income, LS)
Source: CSO, CEIC, Morgan Stanley Research Exhibit 43 Health Expenditure for Select Emerging Markets
0.01.53.04.5
Arge
ntin
a
Turk
ey
Braz
il
Rus
sian
Fed
.
Sout
h Af
rica
Thai
land
Mex
ico
Kore
a
Mal
aysi
a
Chi
na
Indi
a
Indo
nesi
a
Paki
stan
As % of GDP, 2002
0.01.53.04.5
Sout
h Af
rica
Indi
a
Arge
ntin
a
Braz
il
Chi
na
Mex
ico
Rus
sian
Fed
.
Kore
a
Turk
ey
Paki
stan
Indo
nesi
a
Mal
aysi
a
Thai
land
Low Public Expenditure...
And…High Private Expenditure
Note: Data relate to emerging markets with nominal US$ GDP greater than US$100 bn and per capita income less than US$10,000 and for which data are available. Source: World Bank, Morgan Stanley Research
35
JM MORGAN STANLEY
M O R G A N S T A N L E Y R E S E A R C H
June 2006 India and China: New Tigers of Asia – Part II
appears to be a greater focus on improving the outcomes from current outlays.
Unemployment program: In view of the rise in rural unemployment, the government introduced the National Rural Employment Guarantee Act (NREGA), which promises wage employment to every rural household where adult members volunteer to do unskilled manual work. The minimum daily wage provided under this Act is the minimum wage fixed by the respective state government for agricultural laborers (about US$1.5-2 per day) and the job is provided for a minimum of 100 days in a year.
In the first stage, the government aims to cover 200 districts (about 30-35% of the total population). The program is expected to cost Rs400 billion (US$9 billion, 1.1% of GDP). However, not all of this spending will be fresh allocations by the government for the purpose. The government will close several existing employment schemes, releasing funds for NREGA; hence, the additional cost of implementing NREGA is likely to be about Rs150 billion (US$3.3 billion).
Increased allocation for education: The central government has increased the spending on education over the past two years. The government has levied a special cess for augmenting revenues for funding education, especially primary. Central government spending on education is estimated to rise to 0.6% of GDP in F2007 from 0.5% in F2006 and 0.4% in F2005.
Indeed, the central government’s spending has doubled from 0.3% of GDP in F2000. However, the concern is that spending by state governments, which accounts for over 80% of total spending, has been declining, to 2.3% in F2006 from 2.4% in F2005 and 2.9% in F2000. This unsatisfactory performance by state governments is offsetting the positive effort by the central government, leaving overall education spending almost stagnant.
In summary, we believe that while the central government is beginning to make a fresh attempt to increase social development expenditure and improve governance, the effective execution of this plan remains a challenge. Moreover, a significant part of the execution responsibility is with the state governments and, hence, we believe that there is a need for the central government to build in incentive systems for ensuring effective participation by local-level institutions.
China’s New Plan Focuses on Rural Economy China has also initiated several measures to reduce inequality and rural poverty. The government has decided to increase its rural spending plan. In March 2006, Premier Wen Jiabao announced that the government would make a concerted effort to build “a new socialist countryside” over the next five years. The government’s objective is to improve living standards and enhance productivity levels. The government announced a 14% increase in its 2006 rural budget to Rmb340 billion (US$42 billion, 1.7% of GDP). Some of the measures announced recently for rural development are as follows:
Rural infrastructure spending: The government intends to increase rural infrastructure spending. About US$148 billion (average per annum spending of US$29.6 billion, 1.3% of 2005 GDP) will be spent on rural roads during the five-year period ending 2010. Increased spending on irrigation is also planned.
Removal of agriculture tax: The government has rescinded the agriculture tax nationwide, which will save the country's farmers a total of Rmb125 billion (US$15.5 billion, 0.7% of GDP).
Increase in rural education spending: Rural education has significantly lagged that in the urban areas in recent years. This has been the most important constraint on the upward mobility of rural youth. During 2006-2010, the China’s central and local governments will spend Rmb218.2 billion (US$ 27.1 billion) for rural education over and above the existing spend.
Healthcare: Most villages do not have modern healthcare services. They tend to be too expensive and of poor quality. The government plans to develop and consolidate rural cooperative medicare systems over the next three years. The central government has budgeted Rmb4.7 billion for 2006 or seven times that in the previous year to finance rural medical cooperatives.
As in India, China’s efforts to execute a plan for improving living standards of the rural population will be challenged by the lack of an effective institutional framework although, on an overall basis, China’s track record is better than India’s. We believe that reforms to improve governance at local levels are urgently needed in both countries to ensure governments get the “best bang for their buck” in terms of social development spending.

36
JM MORGAN STANLEY
M O R G A N S T A N L E Y R E S E A R C H
June 2006 India and China: New Tigers of Asia – Part II
Education Attainment Is Key
Education Is Crucial for Breaking Vicious Cycle of Poverty and Inequality China’s Track Record in Basic Education Is Better China implemented free nine-year compulsory education (six years of primary and three years of junior high school) in 1986. This rule was passed to ensure that rural areas, which had only four to six years of compulsory schooling, were brought in line with their urban counterparts. This enabled a dramatic increase in literacy levels in the country, especially in rural areas. However, in India literacy has lagged because the government has put relatively less emphasis on primary education until recently. This is evident from historical trends in public expenditure on education. Per capita expenditure was higher in India (in US dollar terms) than in China in the early 1990s, but China has since left India well behind.
Illiteracy Levels in India Still Relatively High The increased expenditure on education enabled the reduction in illiteracy rates in China from almost 33% in 1980 to just 9% in 2000 (Exhibit 44). While India has also reduced the illiteracy level, from 59% in 1980 to 39% in 2000, it is still significantly higher than that in China. This is despite the more rigorous definition of literacy in China. In India, a person is literate if he or she can write his/her name, while in China such a person must also be able to read.
Superior Support for Primary and Secondary Education in China China ranks higher on all parameters for primary education in a comparison with India. While both countries have a gross primary school enrolment ratio of 100%, India ranks poorly on completion ratios. The condition of primary education facilities is also inferior in India when compared with China. The pupil-teacher ratio (number of students per teacher) for primary education in China is 21 compared with 40 in India.
Similarly, India does not rank well on secondary schooling parameters. UNESCO estimates for 2004 that the secondary school (entrance age of 10 years) enrolment ratio (percentage of relevant age group receiving full-time education) was lower in India at 54% versus 73% in China. The pupil-teacher ratio for secondary schooling in India is 32 compared with 19 in China. We believe that the government should provide new initiatives to train this large part of the population who will otherwise enter the work force without adequate education.
Exhibit 44 Adult Illiteracy Rate
0%
14%
28%
42%
56%
70%
1970 1980 1990 1995 2000-2001
China India
Source: World Banks’ Education Statistics Database Exhibit 45 China and India: Education Data Comparison As of China India Primary Schooling Gross Enrollment Ratio (%) 2004 118 116 Drop-Outs (%) 2003 1 21 Pupil/Teacher Ratio 2004 21 40 Secondary Schooling Gross Enrollment Ratio (%) 2004 73 54 Pupil/Teacher Ratio 2004 19 32 Source: UNESCO, Morgan Stanley Research
In India, 200 million children were in the 6- to 14-year age group in 2000 but about 42 million of this total were not at school although the government has recently introduced measures to improve primary education. The government initiated a drive to bring school-age children not attending school back to school. As a result, school-age children not in school fell to 9.5 million in 2005 of about 210 million children in that age bracket.
However, the effectiveness of this effort is still less than desirable. A recent survey led by Pratham, a non-government organization, indicated that, while net enrolment has increased, the quality of education (outcome of the government effort) is not yet satisfactory. The survey indicated that the percentage of children in the 7- to 14-year age group that cannot read a small paragraph and conduct mathematical operations is 35% (over 60 million children) and 41% (over 70 million), respectively. The survey indicated
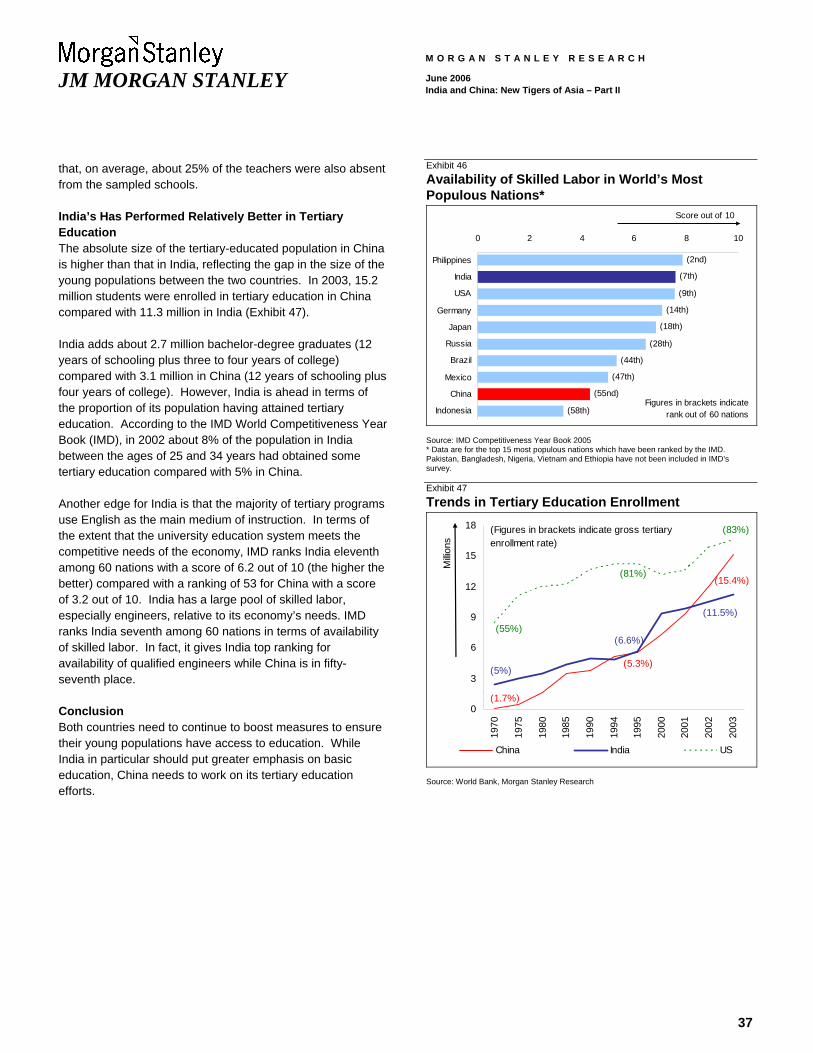
37
JM MORGAN STANLEY
M O R G A N S T A N L E Y R E S E A R C H
June 2006 India and China: New Tigers of Asia – Part II
that, on average, about 25% of the teachers were also absent from the sampled schools.
India’s Has Performed Relatively Better in Tertiary Education The absolute size of the tertiary-educated population in China is higher than that in India, reflecting the gap in the size of the young populations between the two countries. In 2003, 15.2 million students were enrolled in tertiary education in China compared with 11.3 million in India (Exhibit 47).
India adds about 2.7 million bachelor-degree graduates (12 years of schooling plus three to four years of college) compared with 3.1 million in China (12 years of schooling plus four years of college). However, India is ahead in terms of the proportion of its population having attained tertiary education. According to the IMD World Competitiveness Year Book (IMD), in 2002 about 8% of the population in India between the ages of 25 and 34 years had obtained some tertiary education compared with 5% in China.
Another edge for India is that the majority of tertiary programs use English as the main medium of instruction. In terms of the extent that the university education system meets the competitive needs of the economy, IMD ranks India eleventh among 60 nations with a score of 6.2 out of 10 (the higher the better) compared with a ranking of 53 for China with a score of 3.2 out of 10. India has a large pool of skilled labor, especially engineers, relative to its economy’s needs. IMD ranks India seventh among 60 nations in terms of availability of skilled labor. In fact, it gives India top ranking for availability of qualified engineers while China is in fifty-seventh place.
Conclusion Both countries need to continue to boost measures to ensure their young populations have access to education. While India in particular should put greater emphasis on basic education, China needs to work on its tertiary education efforts.
Exhibit 46 Availability of Skilled Labor in World’s Most Populous Nations*
(58th)
(55nd)
(47th)
(44th)
(28th)
(18th)
(14th)
(9th)
(7th)
(2nd)
0 2 4 6 8 10
Philippines
India
USA
Germany
Japan
Russia
Brazil
Mexico
China
Indonesia
Score out of 10
Figures in brackets indicate rank out of 60 nations
Source: IMD Competitiveness Year Book 2005 * Data are for the top 15 most populous nations which have been ranked by the IMD. Pakistan, Bangladesh, Nigeria, Vietnam and Ethiopia have not been included in IMD’s survey. Exhibit 47 Trends in Tertiary Education Enrollment
0
3
6
9
12
15
18
1970
1975
1980
1985
1990
1994
1995
2000
2001
2002
2003
China India US
Milli
ons
(5%)
(6.6%)
(11.5%)
(1.7%)
(5.3%)
(15.4%)
(55%)
(81%)
(83%)(Figures in brackets indicate gross tertiary enrollment rate)
Source: World Bank, Morgan Stanley Research

38
JM MORGAN STANLEY
M O R G A N S T A N L E Y R E S E A R C H
June 2006 India and China: New Tigers of Asia – Part II

39
JM MORGAN STANLEY
M O R G A N S T A N L E Y R E S E A R C H
June 2006 India and China: New Tigers of Asia – Part II
India’s Specific Challenges
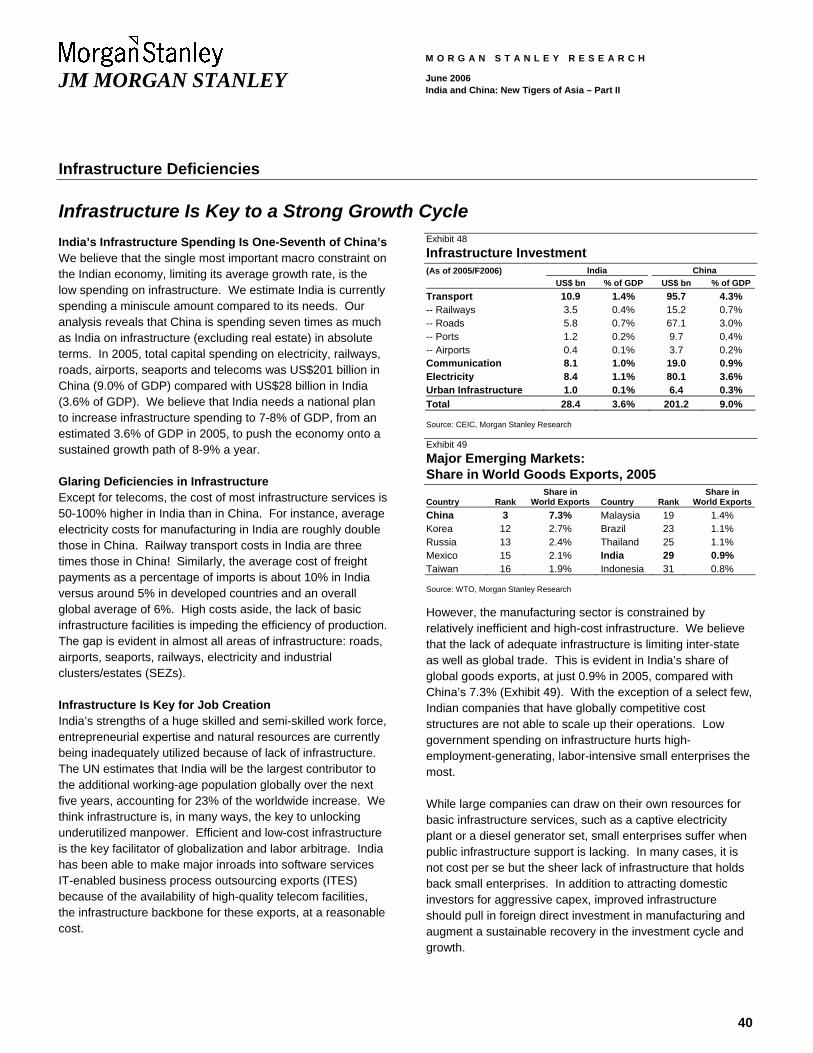
40
JM MORGAN STANLEY
M O R G A N S T A N L E Y R E S E A R C H
June 2006 India and China: New Tigers of Asia – Part II
Infrastructure Deficiencies
Infrastructure Is Key to a Strong Growth Cycle India’s Infrastructure Spending Is One-Seventh of China’s We believe that the single most important macro constraint on the Indian economy, limiting its average growth rate, is the low spending on infrastructure. We estimate India is currently spending a miniscule amount compared to its needs. Our analysis reveals that China is spending seven times as much as India on infrastructure (excluding real estate) in absolute terms. In 2005, total capital spending on electricity, railways, roads, airports, seaports and telecoms was US$201 billion in China (9.0% of GDP) compared with US$28 billion in India (3.6% of GDP). We believe that India needs a national plan to increase infrastructure spending to 7-8% of GDP, from an estimated 3.6% of GDP in 2005, to push the economy onto a sustained growth path of 8-9% a year.
Glaring Deficiencies in Infrastructure Except for telecoms, the cost of most infrastructure services is 50-100% higher in India than in China. For instance, average electricity costs for manufacturing in India are roughly double those in China. Railway transport costs in India are three times those in China! Similarly, the average cost of freight payments as a percentage of imports is about 10% in India versus around 5% in developed countries and an overall global average of 6%. High costs aside, the lack of basic infrastructure facilities is impeding the efficiency of production. The gap is evident in almost all areas of infrastructure: roads, airports, seaports, railways, electricity and industrial clusters/estates (SEZs).
Infrastructure Is Key for Job Creation India’s strengths of a huge skilled and semi-skilled work force, entrepreneurial expertise and natural resources are currently being inadequately utilized because of lack of infrastructure. The UN estimates that India will be the largest contributor to the additional working-age population globally over the next five years, accounting for 23% of the worldwide increase. We think infrastructure is, in many ways, the key to unlocking underutilized manpower. Efficient and low-cost infrastructure is the key facilitator of globalization and labor arbitrage. India has been able to make major inroads into software services IT-enabled business process outsourcing exports (ITES) because of the availability of high-quality telecom facilities, the infrastructure backbone for these exports, at a reasonable cost.
Exhibit 48 Infrastructure Investment (As of 2005/F2006) India China US$ bn % of GDP US$ bn % of GDPTransport 10.9 1.4% 95.7 4.3% -- Railways 3.5 0.4% 15.2 0.7% -- Roads 5.8 0.7% 67.1 3.0% -- Ports 1.2 0.2% 9.7 0.4% -- Airports 0.4 0.1% 3.7 0.2% Communication 8.1 1.0% 19.0 0.9% Electricity 8.4 1.1% 80.1 3.6% Urban Infrastructure 1.0 0.1% 6.4 0.3% Total 28.4 3.6% 201.2 9.0% Source: CEIC, Morgan Stanley Research Exhibit 49 Major Emerging Markets: Share in World Goods Exports, 2005
Country Rank Share in
World Exports Country Rank Share in
World ExportsChina 3 7.3% Malaysia 19 1.4% Korea 12 2.7% Brazil 23 1.1% Russia 13 2.4% Thailand 25 1.1% Mexico 15 2.1% India 29 0.9% Taiwan 16 1.9% Indonesia 31 0.8% Source: WTO, Morgan Stanley Research
However, the manufacturing sector is constrained by relatively inefficient and high-cost infrastructure. We believe that the lack of adequate infrastructure is limiting inter-state as well as global trade. This is evident in India’s share of global goods exports, at just 0.9% in 2005, compared with China’s 7.3% (Exhibit 49). With the exception of a select few, Indian companies that have globally competitive cost structures are not able to scale up their operations. Low government spending on infrastructure hurts high-employment-generating, labor-intensive small enterprises the most.
While large companies can draw on their own resources for basic infrastructure services, such as a captive electricity plant or a diesel generator set, small enterprises suffer when public infrastructure support is lacking. In many cases, it is not cost per se but the sheer lack of infrastructure that holds back small enterprises. In addition to attracting domestic investors for aggressive capex, improved infrastructure should pull in foreign direct investment in manufacturing and augment a sustainable recovery in the investment cycle and growth.
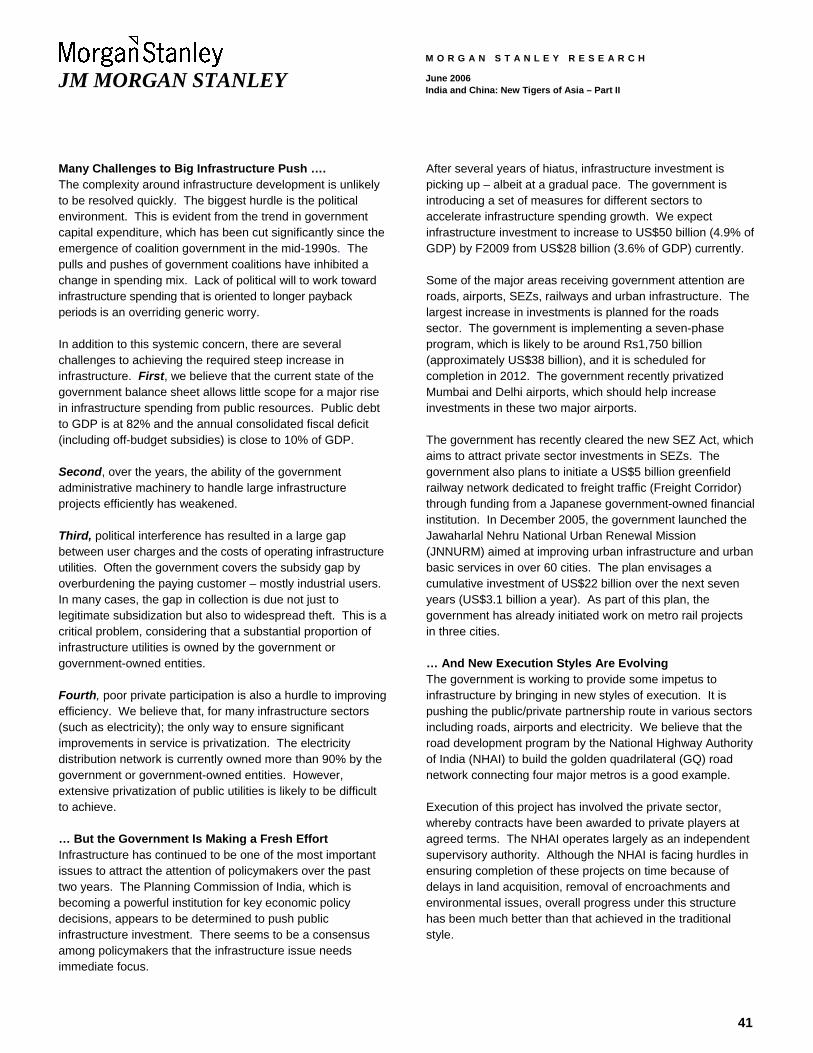
41
JM MORGAN STANLEY
M O R G A N S T A N L E Y R E S E A R C H
June 2006 India and China: New Tigers of Asia – Part II
Many Challenges to Big Infrastructure Push …. The complexity around infrastructure development is unlikely to be resolved quickly. The biggest hurdle is the political environment. This is evident from the trend in government capital expenditure, which has been cut significantly since the emergence of coalition government in the mid-1990s. The pulls and pushes of government coalitions have inhibited a change in spending mix. Lack of political will to work toward infrastructure spending that is oriented to longer payback periods is an overriding generic worry.
In addition to this systemic concern, there are several challenges to achieving the required steep increase in infrastructure. First, we believe that the current state of the government balance sheet allows little scope for a major rise in infrastructure spending from public resources. Public debt to GDP is at 82% and the annual consolidated fiscal deficit (including off-budget subsidies) is close to 10% of GDP.
Second, over the years, the ability of the government administrative machinery to handle large infrastructure projects efficiently has weakened.
Third, political interference has resulted in a large gap between user charges and the costs of operating infrastructure utilities. Often the government covers the subsidy gap by overburdening the paying customer – mostly industrial users. In many cases, the gap in collection is due not just to legitimate subsidization but also to widespread theft. This is a critical problem, considering that a substantial proportion of infrastructure utilities is owned by the government or government-owned entities.
Fourth, poor private participation is also a hurdle to improving efficiency. We believe that, for many infrastructure sectors (such as electricity); the only way to ensure significant improvements in service is privatization. The electricity distribution network is currently owned more than 90% by the government or government-owned entities. However, extensive privatization of public utilities is likely to be difficult to achieve.
… But the Government Is Making a Fresh Effort Infrastructure has continued to be one of the most important issues to attract the attention of policymakers over the past two years. The Planning Commission of India, which is becoming a powerful institution for key economic policy decisions, appears to be determined to push public infrastructure investment. There seems to be a consensus among policymakers that the infrastructure issue needs immediate focus.
After several years of hiatus, infrastructure investment is picking up – albeit at a gradual pace. The government is introducing a set of measures for different sectors to accelerate infrastructure spending growth. We expect infrastructure investment to increase to US$50 billion (4.9% of GDP) by F2009 from US$28 billion (3.6% of GDP) currently.
Some of the major areas receiving government attention are roads, airports, SEZs, railways and urban infrastructure. The largest increase in investments is planned for the roads sector. The government is implementing a seven-phase program, which is likely to be around Rs1,750 billion (approximately US$38 billion), and it is scheduled for completion in 2012. The government recently privatized Mumbai and Delhi airports, which should help increase investments in these two major airports.
The government has recently cleared the new SEZ Act, which aims to attract private sector investments in SEZs. The government also plans to initiate a US$5 billion greenfield railway network dedicated to freight traffic (Freight Corridor) through funding from a Japanese government-owned financial institution. In December 2005, the government launched the Jawaharlal Nehru National Urban Renewal Mission (JNNURM) aimed at improving urban infrastructure and urban basic services in over 60 cities. The plan envisages a cumulative investment of US$22 billion over the next seven years (US$3.1 billion a year). As part of this plan, the government has already initiated work on metro rail projects in three cities.
… And New Execution Styles Are Evolving The government is working to provide some impetus to infrastructure by bringing in new styles of execution. It is pushing the public/private partnership route in various sectors including roads, airports and electricity. We believe that the road development program by the National Highway Authority of India (NHAI) to build the golden quadrilateral (GQ) road network connecting four major metros is a good example.
Execution of this project has involved the private sector, whereby contracts have been awarded to private players at agreed terms. The NHAI operates largely as an independent supervisory authority. Although the NHAI is facing hurdles in ensuring completion of these projects on time because of delays in land acquisition, removal of encroachments and environmental issues, overall progress under this structure has been much better than that achieved in the traditional style.
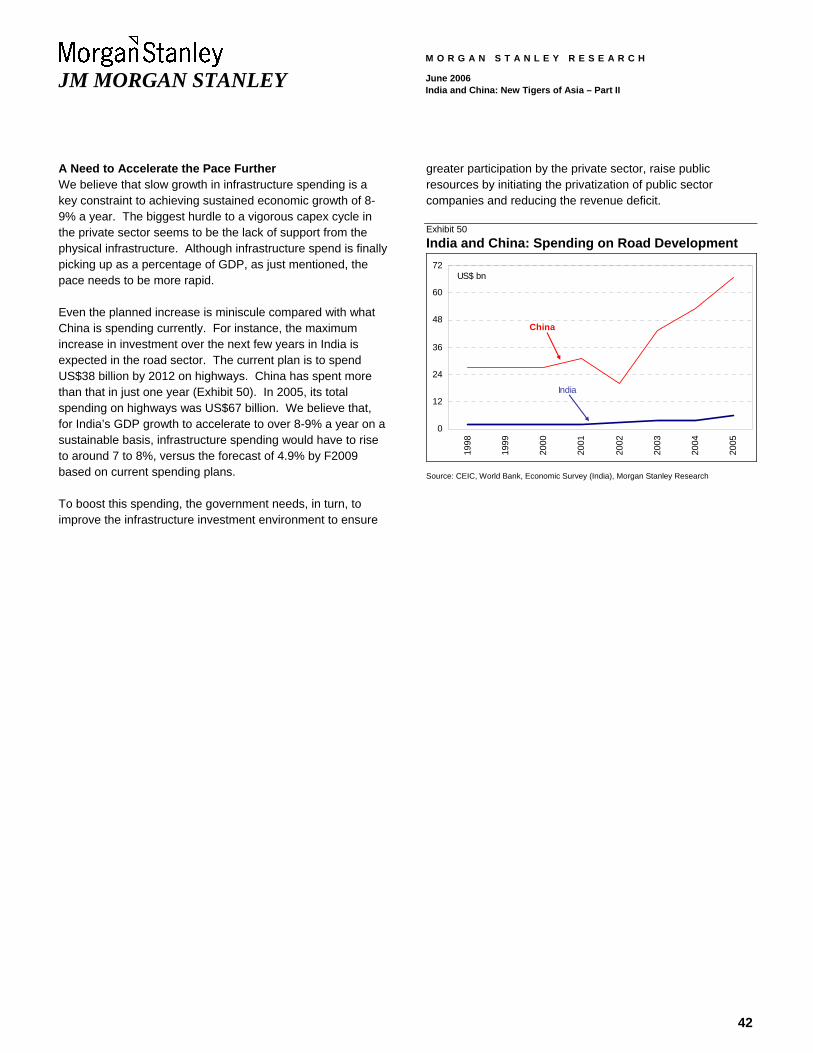
42
JM MORGAN STANLEY
M O R G A N S T A N L E Y R E S E A R C H
June 2006 India and China: New Tigers of Asia – Part II
A Need to Accelerate the Pace Further We believe that slow growth in infrastructure spending is a key constraint to achieving sustained economic growth of 8-9% a year. The biggest hurdle to a vigorous capex cycle in the private sector seems to be the lack of support from the physical infrastructure. Although infrastructure spend is finally picking up as a percentage of GDP, as just mentioned, the pace needs to be more rapid.
Even the planned increase is miniscule compared with what China is spending currently. For instance, the maximum increase in investment over the next few years in India is expected in the road sector. The current plan is to spend US$38 billion by 2012 on highways. China has spent more than that in just one year (Exhibit 50). In 2005, its total spending on highways was US$67 billion. We believe that, for India’s GDP growth to accelerate to over 8-9% a year on a sustainable basis, infrastructure spending would have to rise to around 7 to 8%, versus the forecast of 4.9% by F2009 based on current spending plans.
To boost this spending, the government needs, in turn, to improve the infrastructure investment environment to ensure
greater participation by the private sector, raise public resources by initiating the privatization of public sector companies and reducing the revenue deficit.
Exhibit 50 India and China: Spending on Road Development
0
12
24
36
48
60
72
1998
1999
2000
2001
2002
2003
2004
2005
China
India
US$ bn
Source: CEIC, World Bank, Economic Survey (India), Morgan Stanley Research
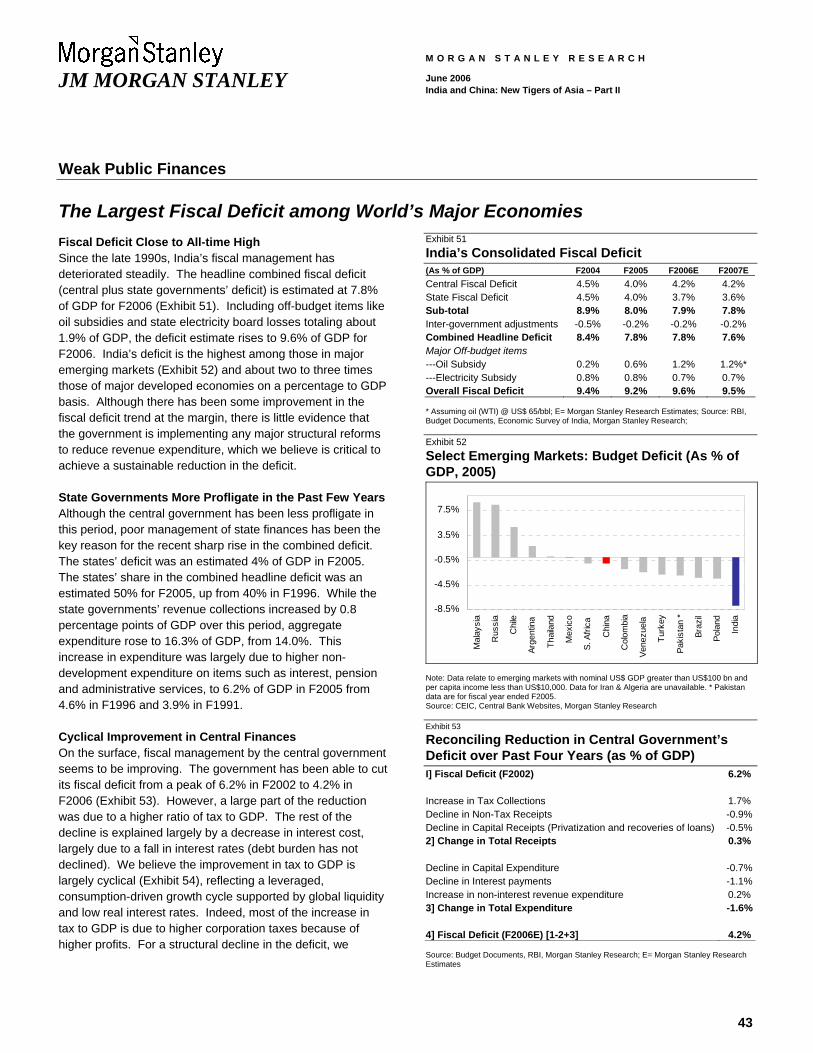
43
JM MORGAN STANLEY
M O R G A N S T A N L E Y R E S E A R C H
June 2006 India and China: New Tigers of Asia – Part II
Weak Public Finances
The Largest Fiscal Deficit among World’s Major Economies Fiscal Deficit Close to All-time High Since the late 1990s, India’s fiscal management has deteriorated steadily. The headline combined fiscal deficit (central plus state governments’ deficit) is estimated at 7.8% of GDP for F2006 (Exhibit 51). Including off-budget items like oil subsidies and state electricity board losses totaling about 1.9% of GDP, the deficit estimate rises to 9.6% of GDP for F2006. India’s deficit is the highest among those in major emerging markets (Exhibit 52) and about two to three times those of major developed economies on a percentage to GDP basis. Although there has been some improvement in the fiscal deficit trend at the margin, there is little evidence that the government is implementing any major structural reforms to reduce revenue expenditure, which we believe is critical to achieve a sustainable reduction in the deficit.
State Governments More Profligate in the Past Few Years Although the central government has been less profligate in this period, poor management of state finances has been the key reason for the recent sharp rise in the combined deficit. The states’ deficit was an estimated 4% of GDP in F2005. The states’ share in the combined headline deficit was an estimated 50% for F2005, up from 40% in F1996. While the state governments’ revenue collections increased by 0.8 percentage points of GDP over this period, aggregate expenditure rose to 16.3% of GDP, from 14.0%. This increase in expenditure was largely due to higher non-development expenditure on items such as interest, pension and administrative services, to 6.2% of GDP in F2005 from 4.6% in F1996 and 3.9% in F1991.
Cyclical Improvement in Central Finances On the surface, fiscal management by the central government seems to be improving. The government has been able to cut its fiscal deficit from a peak of 6.2% in F2002 to 4.2% in F2006 (Exhibit 53). However, a large part of the reduction was due to a higher ratio of tax to GDP. The rest of the decline is explained largely by a decrease in interest cost, largely due to a fall in interest rates (debt burden has not declined). We believe the improvement in tax to GDP is largely cyclical (Exhibit 54), reflecting a leveraged, consumption-driven growth cycle supported by global liquidity and low real interest rates. Indeed, most of the increase in tax to GDP is due to higher corporation taxes because of higher profits. For a structural decline in the deficit, we
Exhibit 51 India’s Consolidated Fiscal Deficit (As % of GDP) F2004 F2005 F2006E F2007E Central Fiscal Deficit 4.5% 4.0% 4.2% 4.2% State Fiscal Deficit 4.5% 4.0% 3.7% 3.6% Sub-total 8.9% 8.0% 7.9% 7.8% Inter-government adjustments -0.5% -0.2% -0.2% -0.2% Combined Headline Deficit 8.4% 7.8% 7.8% 7.6% Major Off-budget items ---Oil Subsidy 0.2% 0.6% 1.2% 1.2%* ---Electricity Subsidy 0.8% 0.8% 0.7% 0.7% Overall Fiscal Deficit 9.4% 9.2% 9.6% 9.5% * Assuming oil (WTI) @ US$ 65/bbl; E= Morgan Stanley Research Estimates; Source: RBI, Budget Documents, Economic Survey of India, Morgan Stanley Research; Exhibit 52 Select Emerging Markets: Budget Deficit (As % of GDP, 2005)
-8.5%
-4.5%
-0.5%
3.5%
7.5%
Mal
aysi
a
Rus
sia
Chi
le
Arge
ntin
a
Thai
land
Mex
ico
S. A
frica
Chi
na
Col
ombi
a
Vene
zuel
a
Turk
ey
Paki
stan
*
Braz
il
Pola
nd
Indi
a
Note: Data relate to emerging markets with nominal US$ GDP greater than US$100 bn and per capita income less than US$10,000. Data for Iran & Algeria are unavailable. * Pakistan data are for fiscal year ended F2005. Source: CEIC, Central Bank Websites, Morgan Stanley Research Exhibit 53
Reconciling Reduction in Central Government’s Deficit over Past Four Years (as % of GDP) I] Fiscal Deficit (F2002) 6.2% Increase in Tax Collections 1.7%Decline in Non-Tax Receipts -0.9%Decline in Capital Receipts (Privatization and recoveries of loans) -0.5%2] Change in Total Receipts 0.3% Decline in Capital Expenditure -0.7%Decline in Interest payments -1.1%Increase in non-interest revenue expenditure 0.2%3] Change in Total Expenditure -1.6% 4] Fiscal Deficit (F2006E) [1-2+3] 4.2% Source: Budget Documents, RBI, Morgan Stanley Research; E= Morgan Stanley Research Estimates

44
JM MORGAN STANLEY
M O R G A N S T A N L E Y R E S E A R C H
June 2006 India and China: New Tigers of Asia – Part II
believe that the government would have to initiate expenditure reforms but there is no sign of such a move yet. Indeed, since F2002, non-interest revenue expenditure has risen by 0.2 percentage point of GDP.
Internal Debt Burden Remains High The size of the deficit is reflected in the rise in the public debt to GDP ratio to 82% as of March 2006 from 65% in March 2000 and 59% in March 1997. Since 1997, internal debt has grown at a compound annual growth rate of 15% compared with 11% growth in nominal GDP. The main driver of this steep rise in internal debt has been the more rapid deterioration in state governments’ finances, with their internal debt having grown at 17% in the period compared with growth of 14% for the central government. This high level of debt-to-GDP stock has resulted in a large preemption of revenues for payment of interest. The combined (central plus state government) interest payments increased to an estimated 6% of GDP in F2006 from 5.1% in F1997 and 4.3% in F1991.
Rising Off-budget Burden The off-budget burden for both the central and state governments has also been rising significantly over the past few years. Although no aggregate data are published by the government, anecdotal evidence suggests a rapid rise. Some of the major areas where the off-budget burden is increasing are pension dues for government employees, debt of state electricity boards, oil subsidies and special-purpose vehicles for investment in infrastructure created by the government. In addition to these off-budget liabilities, both central and state governments have built up contingent liabilities, amounting to 10.6% of GDP in the form of government guarantees.
Reasons for the Large Deficit We believe that this deterioration in public finances reflects three key factors.
• Weaker political environment – The declining share for the single largest political party (due to the emergence of smaller regional parties) has been reflected in the fall in development expenditure. The central government has not been able to enforce strict fiscal discipline on state governments. This has resulted in a gradual decline in development expenditure, especially by state governments. Total development expenditure dropped to an estimated 14.2% of GDP in F2006 from 17.1% in F1991.
Exhibit 54 Cyclical Improvement in Central Government Tax Collections
5.5%
5.9%
6.3%
6.7%
7.1%
7.5%
Jun-
98
Jun-
99
Jun-
00
Jun-
01
Jun-
02
Jun-
03
Jun-
04
Jun-
05
Jun-
06
0.0%
2.2%
4.4%
6.6%
8.8%
11.0%IIP (RS, % YoY 3MMA,
pushed fwd six months)
Trailing 12M Tax Revenues (As % of GDP, LS)
Source: Ministry of Finance, Morgan Stanley Research Exhibit 55 India Public Debt (External + Internal), as % of GDP
40%
48%
56%
64%
72%
80%
F198
1
F198
6
F199
1
F199
6
F200
1
F200
6E
Source: RBI, CSO, Morgan Stanley Research; E= Morgan Stanley Research Estimates
Exhibit 56 Coalition Politics Had Adverse Effect on Development Expenditure in the Past
13.0%
15.0%
17.0%
19.0%
F198
2
F198
5
F198
8
F199
1
F199
4
F199
7
F200
0
F200
3
F200
6BE
20%
38%
56%
74%
Government's development expenditure (As % of GDP, LS)
Share of the single-largest policital party in seats of the Lower House of Parliament (RS)
BE= Government Budget estimates Source: Election Commission of India, RBI, Morgan Stanley Research
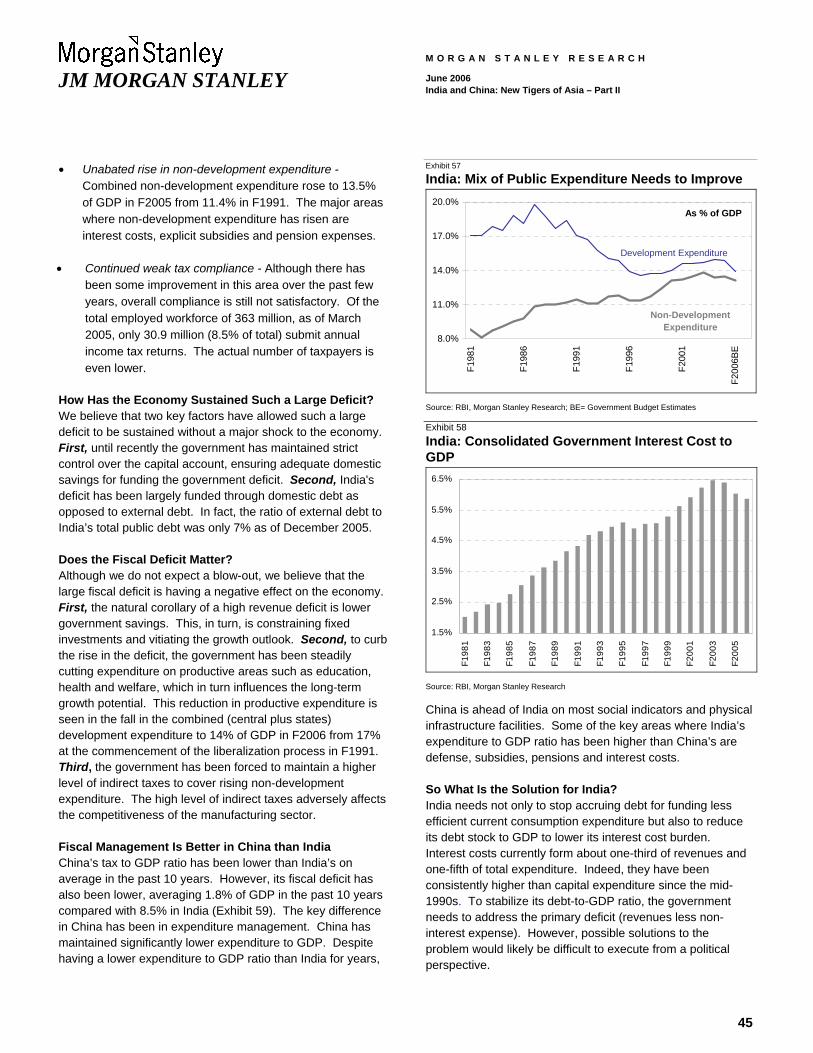
45
JM MORGAN STANLEY
M O R G A N S T A N L E Y R E S E A R C H
June 2006 India and China: New Tigers of Asia – Part II
• Unabated rise in non-development expenditure - Combined non-development expenditure rose to 13.5% of GDP in F2005 from 11.4% in F1991. The major areas where non-development expenditure has risen are interest costs, explicit subsidies and pension expenses.
• Continued weak tax compliance - Although there has been some improvement in this area over the past few years, overall compliance is still not satisfactory. Of the total employed workforce of 363 million, as of March 2005, only 30.9 million (8.5% of total) submit annual income tax returns. The actual number of taxpayers is even lower.
How Has the Economy Sustained Such a Large Deficit? We believe that two key factors have allowed such a large deficit to be sustained without a major shock to the economy. First, until recently the government has maintained strict control over the capital account, ensuring adequate domestic savings for funding the government deficit. Second, India's deficit has been largely funded through domestic debt as opposed to external debt. In fact, the ratio of external debt to India’s total public debt was only 7% as of December 2005.
Does the Fiscal Deficit Matter? Although we do not expect a blow-out, we believe that the large fiscal deficit is having a negative effect on the economy. First, the natural corollary of a high revenue deficit is lower government savings. This, in turn, is constraining fixed investments and vitiating the growth outlook. Second, to curb the rise in the deficit, the government has been steadily cutting expenditure on productive areas such as education, health and welfare, which in turn influences the long-term growth potential. This reduction in productive expenditure is seen in the fall in the combined (central plus states) development expenditure to 14% of GDP in F2006 from 17% at the commencement of the liberalization process in F1991. Third, the government has been forced to maintain a higher level of indirect taxes to cover rising non-development expenditure. The high level of indirect taxes adversely affects the competitiveness of the manufacturing sector.
Fiscal Management Is Better in China than India China’s tax to GDP ratio has been lower than India’s on average in the past 10 years. However, its fiscal deficit has also been lower, averaging 1.8% of GDP in the past 10 years compared with 8.5% in India (Exhibit 59). The key difference in China has been in expenditure management. China has maintained significantly lower expenditure to GDP. Despite having a lower expenditure to GDP ratio than India for years,
Exhibit 57
India: Mix of Public Expenditure Needs to Improve
8.0%
11.0%
14.0%
17.0%
20.0%
F198
1
F198
6
F199
1
F199
6
F200
1
F200
6BE
Non-Development Expenditure
Development Expenditure
As % of GDP
Source: RBI, Morgan Stanley Research; BE= Government Budget Estimates Exhibit 58 India: Consolidated Government Interest Cost to GDP
1.5%
2.5%
3.5%
4.5%
5.5%
6.5%F1
981
F198
3
F198
5
F198
7
F198
9
F199
1
F199
3
F199
5
F199
7
F199
9
F200
1
F200
3
F200
5
Source: RBI, Morgan Stanley Research
China is ahead of India on most social indicators and physical infrastructure facilities. Some of the key areas where India’s expenditure to GDP ratio has been higher than China’s are defense, subsidies, pensions and interest costs.
So What Is the Solution for India? India needs not only to stop accruing debt for funding less efficient current consumption expenditure but also to reduce its debt stock to GDP to lower its interest cost burden. Interest costs currently form about one-third of revenues and one-fifth of total expenditure. Indeed, they have been consistently higher than capital expenditure since the mid-1990s. To stabilize its debt-to-GDP ratio, the government needs to address the primary deficit (revenues less non-interest expense). However, possible solutions to the problem would likely be difficult to execute from a political perspective.
46
JM MORGAN STANLEY
M O R G A N S T A N L E Y R E S E A R C H
June 2006 India and China: New Tigers of Asia – Part II
First, the government could initiate major expenditure reforms and move effectively to outcome-based expenditure management from the current outlay-based system to cut non-interest revenue expenditure. We believe that a sustainable reduction in the primary deficit would require expenditure reforms. We do not think the recent improvement in the primary deficit is sustainable as this has been achieved through a cyclical improvement in the corporate tax to GDP ratio and an understating of the oil subsidy burden over the past three years.
Second, the government could reduce the debt burden in a short period by stripping out its assets in the form of large public sector entities (PSEs). The government could sell stakes in PSEs worth, say, US$15 to 20 billion a year in the next five years to invest in infrastructure, which in turn would help accelerate GDP growth and the tax to GDP ratio on a sustainable basis and, thereby, reduce the primary deficit as well as debt to GDP.
Fiscal Responsibility Act – Will It Help? After a long period of debate, the government passed legislation to improve fiscal management. In 2000, the government set up a committee to recommend draft legislation for fiscal responsibility. It introduced the Fiscal Responsibility and Budget Management (FRBM) Bill in
December 2000 after taking into consideration the recommendations of the committee. After receiving the assent of the President, it became an Act in August 2003. The Act, along with the rules, was notified in July 2004. Note that this legislation is only applicable to management of central government finances.
While on paper the Act is expected to improve fiscal balances significantly, implementation has been inadequate. Although the reduction in the headline deficit of the central government appears to be line with that targeted by the FRBM Act, we do not think it is a structural reduction in the deficit. There has been very little action on expenditure reforms. As discussed earlier, the government has benefited from a cyclical rise in the tax-to-GDP ratio, and there has also been an understating of the subsidy burden on oil products, reducing headline revenue and the fiscal deficit.
Conclusion: No Easy Solution Over the past five years, the government has paid little attention to stabilizing the debt-to-GDP ratio. We believe that a heavy fiscal deficit burden is one of the major hurdles to the government achieving its GDP growth target of 8-10% on a sustainable basis. A sustainable reduction in the government’s deficit would have to entail difficult and politically sensitive measures, in our view.
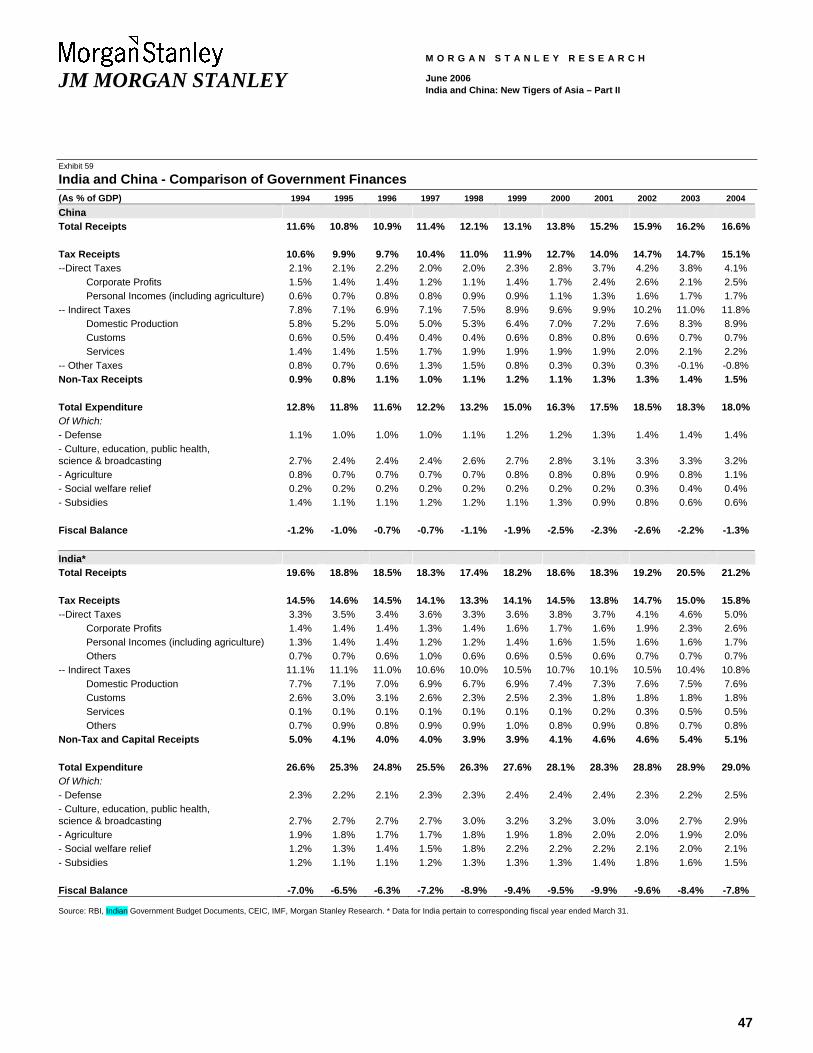
47
JM MORGAN STANLEY
M O R G A N S T A N L E Y R E S E A R C H
June 2006 India and China: New Tigers of Asia – Part II
Exhibit 59
India and China - Comparison of Government Finances (As % of GDP) 1994 1995 1996 1997 1998 1999 2000 2001 2002 2003 2004 China Total Receipts 11.6% 10.8% 10.9% 11.4% 12.1% 13.1% 13.8% 15.2% 15.9% 16.2% 16.6% Tax Receipts 10.6% 9.9% 9.7% 10.4% 11.0% 11.9% 12.7% 14.0% 14.7% 14.7% 15.1%--Direct Taxes 2.1% 2.1% 2.2% 2.0% 2.0% 2.3% 2.8% 3.7% 4.2% 3.8% 4.1% Corporate Profits 1.5% 1.4% 1.4% 1.2% 1.1% 1.4% 1.7% 2.4% 2.6% 2.1% 2.5% Personal Incomes (including agriculture) 0.6% 0.7% 0.8% 0.8% 0.9% 0.9% 1.1% 1.3% 1.6% 1.7% 1.7% -- Indirect Taxes 7.8% 7.1% 6.9% 7.1% 7.5% 8.9% 9.6% 9.9% 10.2% 11.0% 11.8% Domestic Production 5.8% 5.2% 5.0% 5.0% 5.3% 6.4% 7.0% 7.2% 7.6% 8.3% 8.9% Customs 0.6% 0.5% 0.4% 0.4% 0.4% 0.6% 0.8% 0.8% 0.6% 0.7% 0.7% Services 1.4% 1.4% 1.5% 1.7% 1.9% 1.9% 1.9% 1.9% 2.0% 2.1% 2.2% -- Other Taxes 0.8% 0.7% 0.6% 1.3% 1.5% 0.8% 0.3% 0.3% 0.3% -0.1% -0.8% Non-Tax Receipts 0.9% 0.8% 1.1% 1.0% 1.1% 1.2% 1.1% 1.3% 1.3% 1.4% 1.5% Total Expenditure 12.8% 11.8% 11.6% 12.2% 13.2% 15.0% 16.3% 17.5% 18.5% 18.3% 18.0%Of Which: - Defense 1.1% 1.0% 1.0% 1.0% 1.1% 1.2% 1.2% 1.3% 1.4% 1.4% 1.4% - Culture, education, public health, science & broadcasting 2.7% 2.4% 2.4% 2.4% 2.6% 2.7% 2.8% 3.1% 3.3% 3.3% 3.2% - Agriculture 0.8% 0.7% 0.7% 0.7% 0.7% 0.8% 0.8% 0.8% 0.9% 0.8% 1.1% - Social welfare relief 0.2% 0.2% 0.2% 0.2% 0.2% 0.2% 0.2% 0.2% 0.3% 0.4% 0.4% - Subsidies 1.4% 1.1% 1.1% 1.2% 1.2% 1.1% 1.3% 0.9% 0.8% 0.6% 0.6% Fiscal Balance -1.2% -1.0% -0.7% -0.7% -1.1% -1.9% -2.5% -2.3% -2.6% -2.2% -1.3% India* Total Receipts 19.6% 18.8% 18.5% 18.3% 17.4% 18.2% 18.6% 18.3% 19.2% 20.5% 21.2% Tax Receipts 14.5% 14.6% 14.5% 14.1% 13.3% 14.1% 14.5% 13.8% 14.7% 15.0% 15.8%--Direct Taxes 3.3% 3.5% 3.4% 3.6% 3.3% 3.6% 3.8% 3.7% 4.1% 4.6% 5.0% Corporate Profits 1.4% 1.4% 1.4% 1.3% 1.4% 1.6% 1.7% 1.6% 1.9% 2.3% 2.6% Personal Incomes (including agriculture) 1.3% 1.4% 1.4% 1.2% 1.2% 1.4% 1.6% 1.5% 1.6% 1.6% 1.7% Others 0.7% 0.7% 0.6% 1.0% 0.6% 0.6% 0.5% 0.6% 0.7% 0.7% 0.7% -- Indirect Taxes 11.1% 11.1% 11.0% 10.6% 10.0% 10.5% 10.7% 10.1% 10.5% 10.4% 10.8% Domestic Production 7.7% 7.1% 7.0% 6.9% 6.7% 6.9% 7.4% 7.3% 7.6% 7.5% 7.6% Customs 2.6% 3.0% 3.1% 2.6% 2.3% 2.5% 2.3% 1.8% 1.8% 1.8% 1.8% Services 0.1% 0.1% 0.1% 0.1% 0.1% 0.1% 0.1% 0.2% 0.3% 0.5% 0.5% Others 0.7% 0.9% 0.8% 0.9% 0.9% 1.0% 0.8% 0.9% 0.8% 0.7% 0.8% Non-Tax and Capital Receipts 5.0% 4.1% 4.0% 4.0% 3.9% 3.9% 4.1% 4.6% 4.6% 5.4% 5.1% Total Expenditure 26.6% 25.3% 24.8% 25.5% 26.3% 27.6% 28.1% 28.3% 28.8% 28.9% 29.0%Of Which: - Defense 2.3% 2.2% 2.1% 2.3% 2.3% 2.4% 2.4% 2.4% 2.3% 2.2% 2.5% - Culture, education, public health, science & broadcasting 2.7% 2.7% 2.7% 2.7% 3.0% 3.2% 3.2% 3.0% 3.0% 2.7% 2.9% - Agriculture 1.9% 1.8% 1.7% 1.7% 1.8% 1.9% 1.8% 2.0% 2.0% 1.9% 2.0% - Social welfare relief 1.2% 1.3% 1.4% 1.5% 1.8% 2.2% 2.2% 2.2% 2.1% 2.0% 2.1% - Subsidies 1.2% 1.1% 1.1% 1.2% 1.3% 1.3% 1.3% 1.4% 1.8% 1.6% 1.5% Fiscal Balance -7.0% -6.5% -6.3% -7.2% -8.9% -9.4% -9.5% -9.9% -9.6% -8.4% -7.8% Source: RBI, Indian Government Budget Documents, CEIC, IMF, Morgan Stanley Research. * Data for India pertain to corresponding fiscal year ended March 31.
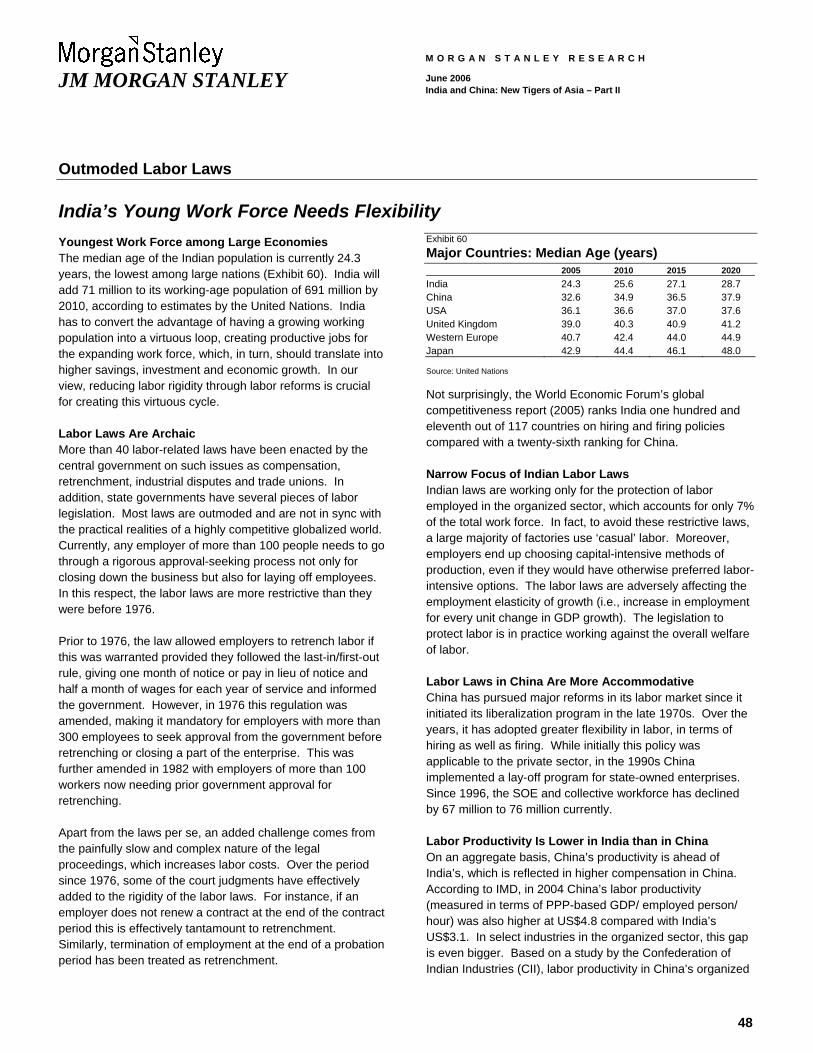
48
JM MORGAN STANLEY
M O R G A N S T A N L E Y R E S E A R C H
June 2006 India and China: New Tigers of Asia – Part II
Outmoded Labor Laws
India’s Young Work Force Needs Flexibility Youngest Work Force among Large Economies The median age of the Indian population is currently 24.3 years, the lowest among large nations (Exhibit 60). India will add 71 million to its working-age population of 691 million by 2010, according to estimates by the United Nations. India has to convert the advantage of having a growing working population into a virtuous loop, creating productive jobs for the expanding work force, which, in turn, should translate into higher savings, investment and economic growth. In our view, reducing labor rigidity through labor reforms is crucial for creating this virtuous cycle.
Labor Laws Are Archaic More than 40 labor-related laws have been enacted by the central government on such issues as compensation, retrenchment, industrial disputes and trade unions. In addition, state governments have several pieces of labor legislation. Most laws are outmoded and are not in sync with the practical realities of a highly competitive globalized world. Currently, any employer of more than 100 people needs to go through a rigorous approval-seeking process not only for closing down the business but also for laying off employees. In this respect, the labor laws are more restrictive than they were before 1976.
Prior to 1976, the law allowed employers to retrench labor if this was warranted provided they followed the last-in/first-out rule, giving one month of notice or pay in lieu of notice and half a month of wages for each year of service and informed the government. However, in 1976 this regulation was amended, making it mandatory for employers with more than 300 employees to seek approval from the government before retrenching or closing a part of the enterprise. This was further amended in 1982 with employers of more than 100 workers now needing prior government approval for retrenching.
Apart from the laws per se, an added challenge comes from the painfully slow and complex nature of the legal proceedings, which increases labor costs. Over the period since 1976, some of the court judgments have effectively added to the rigidity of the labor laws. For instance, if an employer does not renew a contract at the end of the contract period this is effectively tantamount to retrenchment. Similarly, termination of employment at the end of a probation period has been treated as retrenchment.
Exhibit 60 Major Countries: Median Age (years) 2005 2010 2015 2020 India 24.3 25.6 27.1 28.7 China 32.6 34.9 36.5 37.9 USA 36.1 36.6 37.0 37.6 United Kingdom 39.0 40.3 40.9 41.2 Western Europe 40.7 42.4 44.0 44.9 Japan 42.9 44.4 46.1 48.0 Source: United Nations
Not surprisingly, the World Economic Forum’s global competitiveness report (2005) ranks India one hundred and eleventh out of 117 countries on hiring and firing policies compared with a twenty-sixth ranking for China.
Narrow Focus of Indian Labor Laws Indian laws are working only for the protection of labor employed in the organized sector, which accounts for only 7% of the total work force. In fact, to avoid these restrictive laws, a large majority of factories use ‘casual’ labor. Moreover, employers end up choosing capital-intensive methods of production, even if they would have otherwise preferred labor-intensive options. The labor laws are adversely affecting the employment elasticity of growth (i.e., increase in employment for every unit change in GDP growth). The legislation to protect labor is in practice working against the overall welfare of labor.
Labor Laws in China Are More Accommodative China has pursued major reforms in its labor market since it initiated its liberalization program in the late 1970s. Over the years, it has adopted greater flexibility in labor, in terms of hiring as well as firing. While initially this policy was applicable to the private sector, in the 1990s China implemented a lay-off program for state-owned enterprises. Since 1996, the SOE and collective workforce has declined by 67 million to 76 million currently.
Labor Productivity Is Lower in India than in China On an aggregate basis, China’s productivity is ahead of India’s, which is reflected in higher compensation in China. According to IMD, in 2004 China’s labor productivity (measured in terms of PPP-based GDP/ employed person/ hour) was also higher at US$4.8 compared with India’s US$3.1. In select industries in the organized sector, this gap is even bigger. Based on a study by the Confederation of Indian Industries (CII), labor productivity in China’s organized
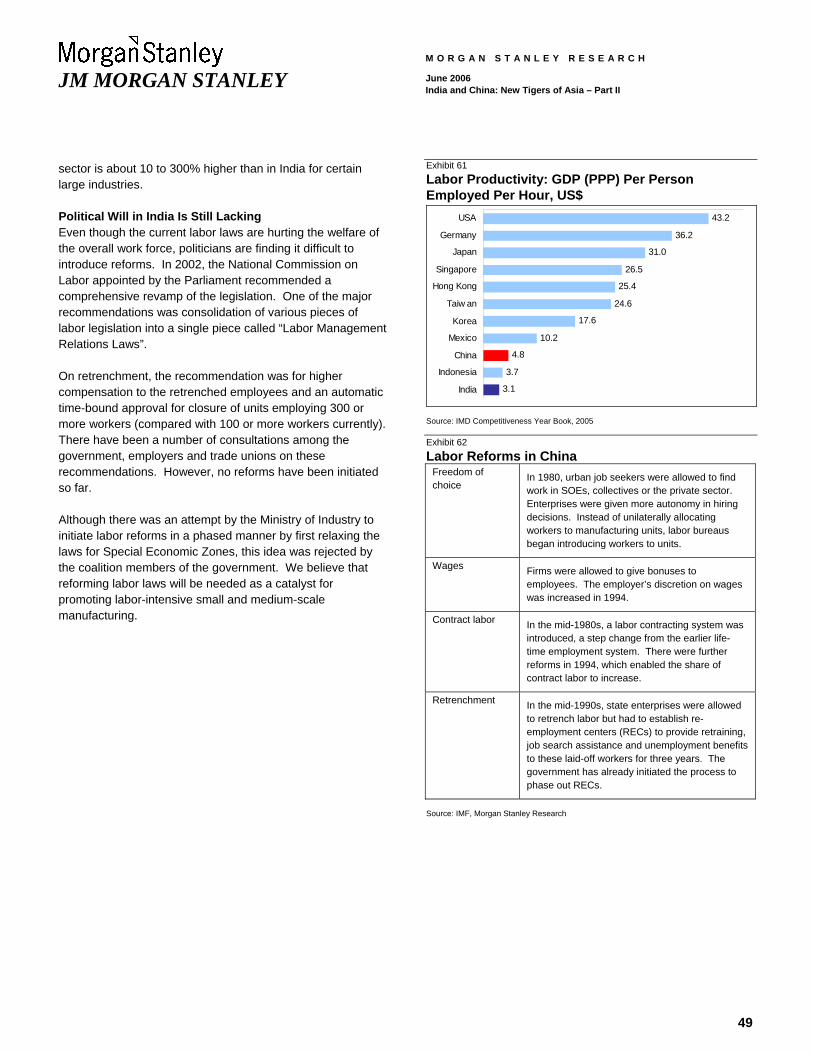
49
JM MORGAN STANLEY
M O R G A N S T A N L E Y R E S E A R C H
June 2006 India and China: New Tigers of Asia – Part II
sector is about 10 to 300% higher than in India for certain large industries.
Political Will in India Is Still Lacking Even though the current labor laws are hurting the welfare of the overall work force, politicians are finding it difficult to introduce reforms. In 2002, the National Commission on Labor appointed by the Parliament recommended a comprehensive revamp of the legislation. One of the major recommendations was consolidation of various pieces of labor legislation into a single piece called “Labor Management Relations Laws”.
On retrenchment, the recommendation was for higher compensation to the retrenched employees and an automatic time-bound approval for closure of units employing 300 or more workers (compared with 100 or more workers currently). There have been a number of consultations among the government, employers and trade unions on these recommendations. However, no reforms have been initiated so far.
Although there was an attempt by the Ministry of Industry to initiate labor reforms in a phased manner by first relaxing the laws for Special Economic Zones, this idea was rejected by the coalition members of the government. We believe that reforming labor laws will be needed as a catalyst for promoting labor-intensive small and medium-scale manufacturing.
Exhibit 61 Labor Productivity: GDP (PPP) Per Person Employed Per Hour, US$
43.2
36.2
31.0
26.5
25.4
24.6
17.6
10.2
4.8
3.7
3.1
USA
Germany
Japan
Singapore
Hong Kong
Taiw an
Korea
Mexico
China
Indonesia
India
Source: IMD Competitiveness Year Book, 2005 Exhibit 62 Labor Reforms in China
Freedom of choice
In 1980, urban job seekers were allowed to find work in SOEs, collectives or the private sector. Enterprises were given more autonomy in hiring decisions. Instead of unilaterally allocating workers to manufacturing units, labor bureaus began introducing workers to units.
Wages
Firms were allowed to give bonuses to employees. The employer’s discretion on wages was increased in 1994.
Contract labor
In the mid-1980s, a labor contracting system was introduced, a step change from the earlier life-time employment system. There were further reforms in 1994, which enabled the share of contract labor to increase.
Retrenchment
In the mid-1990s, state enterprises were allowed to retrench labor but had to establish re-employment centers (RECs) to provide retraining, job search assistance and unemployment benefits to these laid-off workers for three years. The government has already initiated the process to phase out RECs.
Source: IMF, Morgan Stanley Research
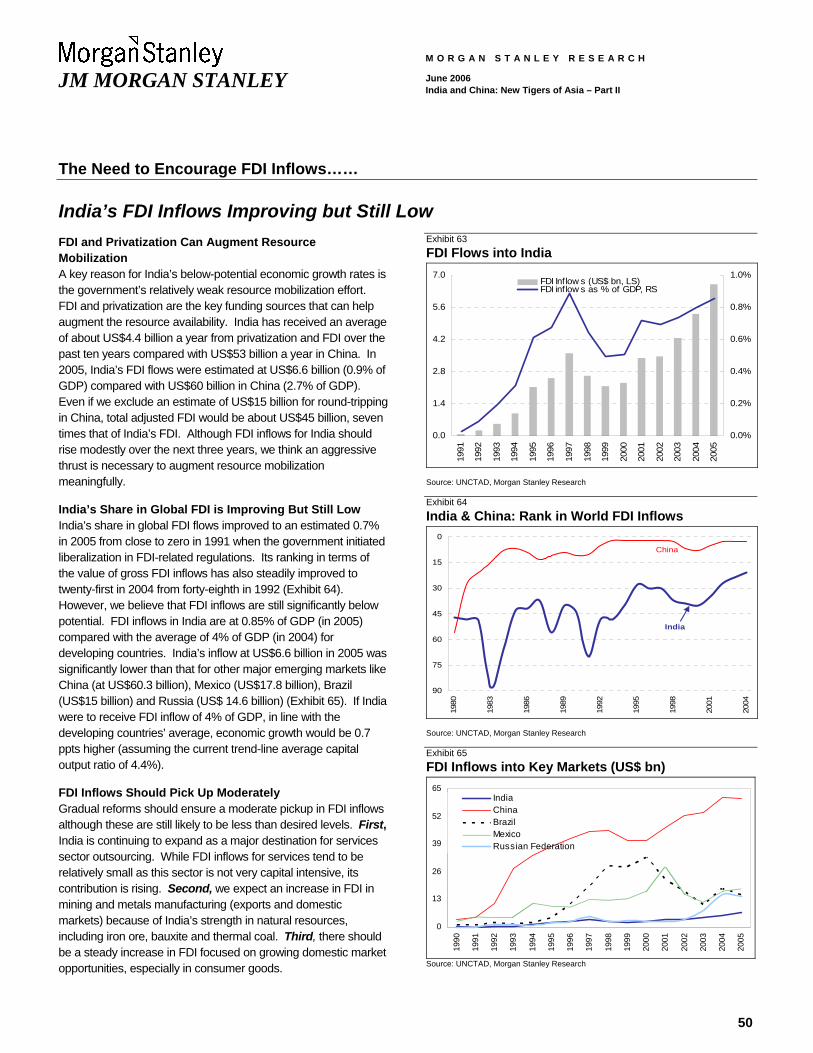
50
JM MORGAN STANLEY
M O R G A N S T A N L E Y R E S E A R C H
June 2006 India and China: New Tigers of Asia – Part II
The Need to Encourage FDI Inflows……
India’s FDI Inflows Improving but Still Low FDI and Privatization Can Augment Resource Mobilization A key reason for India’s below-potential economic growth rates is the government’s relatively weak resource mobilization effort. FDI and privatization are the key funding sources that can help augment the resource availability. India has received an average of about US$4.4 billion a year from privatization and FDI over the past ten years compared with US$53 billion a year in China. In 2005, India’s FDI flows were estimated at US$6.6 billion (0.9% of GDP) compared with US$60 billion in China (2.7% of GDP). Even if we exclude an estimate of US$15 billion for round-tripping in China, total adjusted FDI would be about US$45 billion, seven times that of India’s FDI. Although FDI inflows for India should rise modestly over the next three years, we think an aggressive thrust is necessary to augment resource mobilization meaningfully.
India’s Share in Global FDI is Improving But Still Low India’s share in global FDI flows improved to an estimated 0.7% in 2005 from close to zero in 1991 when the government initiated liberalization in FDI-related regulations. Its ranking in terms of the value of gross FDI inflows has also steadily improved to twenty-first in 2004 from forty-eighth in 1992 (Exhibit 64). However, we believe that FDI inflows are still significantly below potential. FDI inflows in India are at 0.85% of GDP (in 2005) compared with the average of 4% of GDP (in 2004) for developing countries. India’s inflow at US$6.6 billion in 2005 was significantly lower than that for other major emerging markets like China (at US$60.3 billion), Mexico (US$17.8 billion), Brazil (US$15 billion) and Russia (US$ 14.6 billion) (Exhibit 65). If India were to receive FDI inflow of 4% of GDP, in line with the developing countries’ average, economic growth would be 0.7 ppts higher (assuming the current trend-line average capital output ratio of 4.4%).
FDI Inflows Should Pick Up Moderately Gradual reforms should ensure a moderate pickup in FDI inflows although these are still likely to be less than desired levels. First, India is continuing to expand as a major destination for services sector outsourcing. While FDI inflows for services tend to be relatively small as this sector is not very capital intensive, its contribution is rising. Second, we expect an increase in FDI in mining and metals manufacturing (exports and domestic markets) because of India’s strength in natural resources, including iron ore, bauxite and thermal coal. Third, there should be a steady increase in FDI focused on growing domestic market opportunities, especially in consumer goods.
Exhibit 63 FDI Flows into India
0.0
1.4
2.8
4.2
5.6
7.0
1991
1992
1993
1994
1995
1996
1997
1998
1999
2000
2001
2002
2003
2004
2005
0.0%
0.2%
0.4%
0.6%
0.8%
1.0%FDI Inflow s (US$ bn, LS)FDI inflow s as % of GDP, RS
Source: UNCTAD, Morgan Stanley Research Exhibit 64 India & China: Rank in World FDI Inflows
0
15
30
45
60
75
90
1980
1983
1986
1989
1992
1995
1998
2001
2004
China
India
Source: UNCTAD, Morgan Stanley Research Exhibit 65 FDI Inflows into Key Markets (US$ bn)
0
13
26
39
52
65
1990
1991
1992
1993
1994
1995
1996
1997
1998
1999
2000
2001
2002
2003
2004
2005
IndiaChinaBrazilMexicoRussian Federation
Source: UNCTAD, Morgan Stanley Research
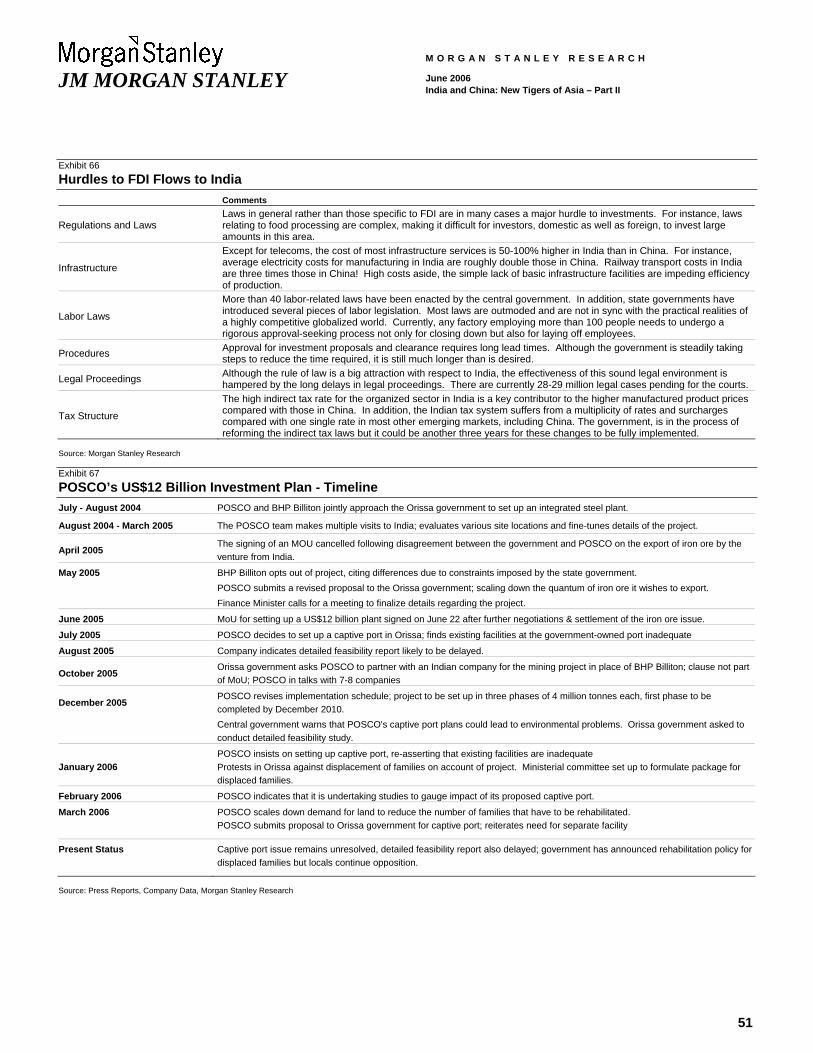
51
JM MORGAN STANLEY
M O R G A N S T A N L E Y R E S E A R C H
June 2006 India and China: New Tigers of Asia – Part II
Exhibit 66 Hurdles to FDI Flows to India Comments
Regulations and Laws Laws in general rather than those specific to FDI are in many cases a major hurdle to investments. For instance, laws relating to food processing are complex, making it difficult for investors, domestic as well as foreign, to invest large amounts in this area.
Infrastructure
Except for telecoms, the cost of most infrastructure services is 50-100% higher in India than in China. For instance, average electricity costs for manufacturing in India are roughly double those in China. Railway transport costs in India are three times those in China! High costs aside, the simple lack of basic infrastructure facilities are impeding efficiency of production.
Labor Laws
More than 40 labor-related laws have been enacted by the central government. In addition, state governments have introduced several pieces of labor legislation. Most laws are outmoded and are not in sync with the practical realities of a highly competitive globalized world. Currently, any factory employing more than 100 people needs to undergo a rigorous approval-seeking process not only for closing down but also for laying off employees.
Procedures Approval for investment proposals and clearance requires long lead times. Although the government is steadily taking steps to reduce the time required, it is still much longer than is desired.
Legal Proceedings Although the rule of law is a big attraction with respect to India, the effectiveness of this sound legal environment is hampered by the long delays in legal proceedings. There are currently 28-29 million legal cases pending for the courts.
Tax Structure
The high indirect tax rate for the organized sector in India is a key contributor to the higher manufactured product prices compared with those in China. In addition, the Indian tax system suffers from a multiplicity of rates and surcharges compared with one single rate in most other emerging markets, including China. The government, is in the process of reforming the indirect tax laws but it could be another three years for these changes to be fully implemented.
Source: Morgan Stanley Research Exhibit 67 POSCO’s US$12 Billion Investment Plan - Timeline July - August 2004 POSCO and BHP Billiton jointly approach the Orissa government to set up an integrated steel plant.
August 2004 - March 2005 The POSCO team makes multiple visits to India; evaluates various site locations and fine-tunes details of the project.
April 2005 The signing of an MOU cancelled following disagreement between the government and POSCO on the export of iron ore by the venture from India.
May 2005 BHP Billiton opts out of project, citing differences due to constraints imposed by the state government. POSCO submits a revised proposal to the Orissa government; scaling down the quantum of iron ore it wishes to export. Finance Minister calls for a meeting to finalize details regarding the project.
June 2005 MoU for setting up a US$12 billion plant signed on June 22 after further negotiations & settlement of the iron ore issue.
July 2005 POSCO decides to set up a captive port in Orissa; finds existing facilities at the government-owned port inadequate
August 2005 Company indicates detailed feasibility report likely to be delayed.
October 2005 Orissa government asks POSCO to partner with an Indian company for the mining project in place of BHP Billiton; clause not part of MoU; POSCO in talks with 7-8 companies
December 2005 POSCO revises implementation schedule; project to be set up in three phases of 4 million tonnes each, first phase to be completed by December 2010.
Central government warns that POSCO's captive port plans could lead to environmental problems. Orissa government asked to conduct detailed feasibility study.
January 2006 POSCO insists on setting up captive port, re-asserting that existing facilities are inadequate Protests in Orissa against displacement of families on account of project. Ministerial committee set up to formulate package for displaced families.
February 2006 POSCO indicates that it is undertaking studies to gauge impact of its proposed captive port.
March 2006 POSCO scales down demand for land to reduce the number of families that have to be rehabilitated. POSCO submits proposal to Orissa government for captive port; reiterates need for separate facility
Present Status Captive port issue remains unresolved, detailed feasibility report also delayed; government has announced rehabilitation policy for displaced families but locals continue opposition.
Source: Press Reports, Company Data, Morgan Stanley Research

52
JM MORGAN STANLEY
M O R G A N S T A N L E Y R E S E A R C H
June 2006 India and China: New Tigers of Asia – Part II
Fourth, recent liberalization measures implemented by the government should result in a gradual rise in FDI in the real estate sector. We expect FDI investments to rise from US$6.6 billion currently to US$10 billion (1% of GDP) by 2008.
Why FDI Flows Are Relatively Low We do not think the disappointing response of FDI investors to India is necessarily due to the constraint of foreign investment limits. Many of the hurdles faced by foreign investors are the same as those suffered by domestic entrepreneurs. Significant coverage has been given in the foreign media to delays in increasing foreign investment limits in some of the politically sensitive sectors such as insurance and banking. In our view, regulations in India on foreign investment limits on an overall basis are not rigorous compared with those in some other emerging markets that have higher shares than India of total FDI flows to developing countries. For instance, the foreign investment limit in India for most manufacturing sectors has been 100% for the past few years.
We think FDI in India is deterred by the general business environment rather than specific FDI regulations. The main obstacles are inadequate infrastructure facilities throughout the country, rigid labor laws, bureaucratic controls and procedures and long delays in legal proceedings (Exhibit 66). For instance, although POSCO has shown keen interest in setting up a steel plant in the state of Orissa, translating that intent into investments is taking an unusually long time (Exhibit 67). POSCO initially faced hurdles in identifying mines and negotiating the terms with the government for accessing those mines. Later it encountered problems in acquiring land for the plant and ports. POSCO first announced its investment plan in July 2004 but it appears that meaningful investment will start flowing only from 2007.
Similarly, the government has liberalized FDI rules in real estate recently but the domestic regulations relating to the Urban Land Ceiling Regulation Acts (ULCRA) and other laws and procedures remain impediments to rapid expansion in construction investment by foreign companies. Many large states have yet to repeal the ULCRA. Such obstacles prevail in many sectors and, unless the general investment environment improves, there is likely to be only a gradual increase in FDI investment.
Are China’s FDI Figures Overstated vs. India’s? It has been argued that FDI inflows into China are overstated compared with those in India. The most common argument is that favorable tax laws for foreign investors in China have
encouraged a lot of round-tripping. Even if we exclude such investments, China’s net inflows at US$45 billion in 2005 would still make it the largest recipient of FDI among developing countries. Another popular argument in India is that, unlike China, India’s FDI figures have not in the past included reinvested earnings as per the International Finance Corporation (IFC) norm. However, the Reserve Bank of India (RBI) has now started releasing FDI figures for India, including reinvested earnings. In this report, we include reinvested earnings in India’s FDI figures.
FDI Outflows Are Rising Relaxation of capital controls by the government has induced Indian companies to invest abroad. In 2003, the RBI further liberalized the regulations on FDI investment by Indian companies in other countries. FDI outflows from India rose to US$2.0 billion in 2004 from US$0.5 billion in 2000. This is in line with the trend for other major developing markets generally. Aggregate outflows from developing countries rose to US$40 billion in 2004 from US$16 billion in 2002.
Low Net FDI Inflows Result in India Relying More on Relatively Less Stable Flows Capital flows into India have risen sharply since 2003, at US$65 billion compared with US$30 billion in the preceding three years. However, net FDI flows totaled only about US$11 billion in this period. Most of the improvement in total capital inflows has been due to higher non-FDI flows. Cumulatively, for the past three years non-FDI flows accounted for about 83% of total capital flows in India compared with 32% for the top emerging markets (Exhibit 68). One of the most important non-FDI sources for India has been portfolio investment. Of the total capital flows of US$65 billion received over the past three years, US$29 billion were in the form of portfolio inflows. Indeed, in 2005 portfolio flows accounted for about 45% of the total capital flows in India. India has been one of the most favored markets over the past three years, representing an estimated 20%-25% of total portfolio flows into developing markets.
Exhibit 68 Composition of Capital Flows for Top 10 Emerging Markets1
(Data for 2003-2005) EM Basket (Ex-India) India
Total Net FDI Flows* (US$ bn) 250 11 Total Capital Flows (US$ bn) 366 65 % Share of FDI Flows 68% 17% % Share of Non-FDI Flows 32% 83% 1. Includes Russia, Mexico, India, Turkey, Indonesia, South Africa, China, Korea, Brazil and Taiwan; * FDI inflows less outflows; Source: IMF, Central Bank Websites, CEIC, Morgan Stanley Research
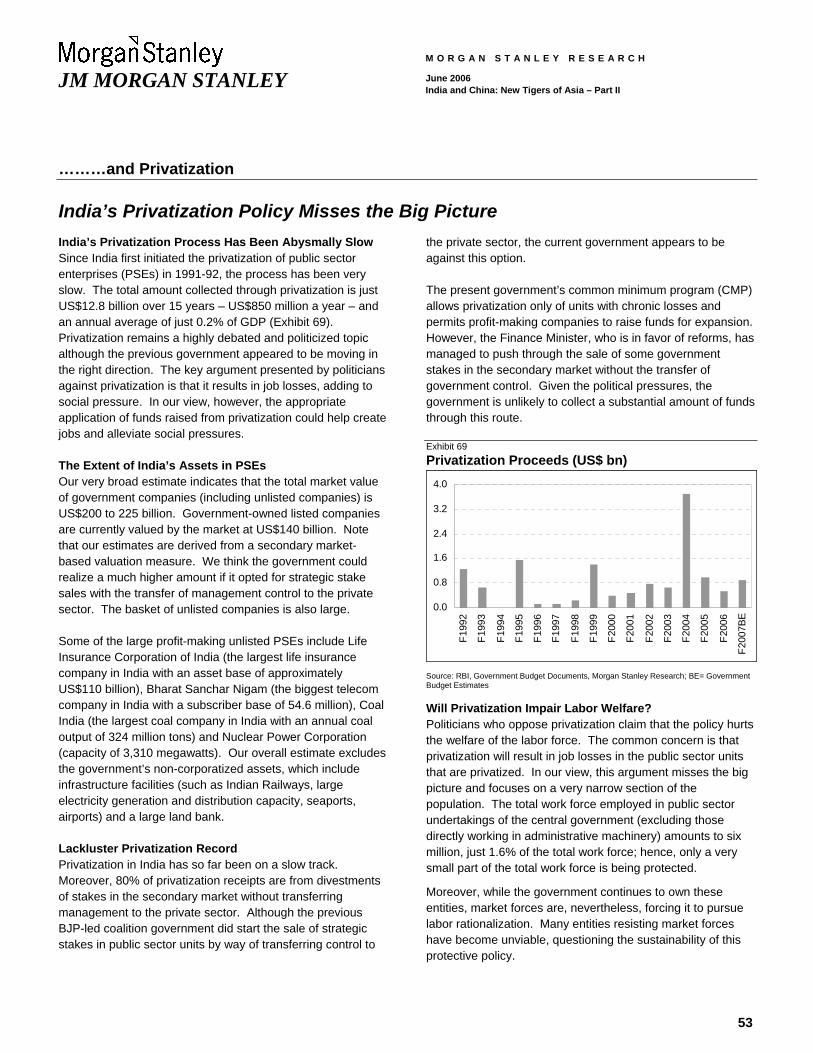
53
JM MORGAN STANLEY
M O R G A N S T A N L E Y R E S E A R C H
June 2006 India and China: New Tigers of Asia – Part II
………and Privatization
India’s Privatization Policy Misses the Big Picture India’s Privatization Process Has Been Abysmally Slow Since India first initiated the privatization of public sector enterprises (PSEs) in 1991-92, the process has been very slow. The total amount collected through privatization is just US$12.8 billion over 15 years – US$850 million a year – and an annual average of just 0.2% of GDP (Exhibit 69). Privatization remains a highly debated and politicized topic although the previous government appeared to be moving in the right direction. The key argument presented by politicians against privatization is that it results in job losses, adding to social pressure. In our view, however, the appropriate application of funds raised from privatization could help create jobs and alleviate social pressures.
The Extent of India’s Assets in PSEs Our very broad estimate indicates that the total market value of government companies (including unlisted companies) is US$200 to 225 billion. Government-owned listed companies are currently valued by the market at US$140 billion. Note that our estimates are derived from a secondary market-based valuation measure. We think the government could realize a much higher amount if it opted for strategic stake sales with the transfer of management control to the private sector. The basket of unlisted companies is also large.
Some of the large profit-making unlisted PSEs include Life Insurance Corporation of India (the largest life insurance company in India with an asset base of approximately US$110 billion), Bharat Sanchar Nigam (the biggest telecom company in India with a subscriber base of 54.6 million), Coal India (the largest coal company in India with an annual coal output of 324 million tons) and Nuclear Power Corporation (capacity of 3,310 megawatts). Our overall estimate excludes the government’s non-corporatized assets, which include infrastructure facilities (such as Indian Railways, large electricity generation and distribution capacity, seaports, airports) and a large land bank.
Lackluster Privatization Record Privatization in India has so far been on a slow track. Moreover, 80% of privatization receipts are from divestments of stakes in the secondary market without transferring management to the private sector. Although the previous BJP-led coalition government did start the sale of strategic stakes in public sector units by way of transferring control to
the private sector, the current government appears to be against this option.
The present government’s common minimum program (CMP) allows privatization only of units with chronic losses and permits profit-making companies to raise funds for expansion. However, the Finance Minister, who is in favor of reforms, has managed to push through the sale of some government stakes in the secondary market without the transfer of government control. Given the political pressures, the government is unlikely to collect a substantial amount of funds through this route.
Exhibit 69 Privatization Proceeds (US$ bn)
0.0
0.8
1.6
2.4
3.2
4.0
F199
2
F199
3
F199
4
F199
5
F199
6
F199
7
F199
8
F199
9
F200
0
F200
1
F200
2
F200
3
F200
4
F200
5
F200
6
F200
7BE
Source: RBI, Government Budget Documents, Morgan Stanley Research; BE= Government Budget Estimates
Will Privatization Impair Labor Welfare? Politicians who oppose privatization claim that the policy hurts the welfare of the labor force. The common concern is that privatization will result in job losses in the public sector units that are privatized. In our view, this argument misses the big picture and focuses on a very narrow section of the population. The total work force employed in public sector undertakings of the central government (excluding those directly working in administrative machinery) amounts to six million, just 1.6% of the total work force; hence, only a very small part of the total work force is being protected.
Moreover, while the government continues to own these entities, market forces are, nevertheless, forcing it to pursue labor rationalization. Many entities resisting market forces have become unviable, questioning the sustainability of this protective policy.
54
JM MORGAN STANLEY
M O R G A N S T A N L E Y R E S E A R C H
June 2006 India and China: New Tigers of Asia – Part II
Right Application of Privatization Funds Is Critical The government has so far not been able to demonstrate any visible gain from privatization, in our view. The small amounts that have been collected from privatization have been used to fund the deficit. Indeed, over the past 15 years, the government has cut development expenditure as a percentage of GDP to 13.9% (in F2006) from 17.1% (in F1991).
We think the government should direct funds collected from privatization to productive areas through special-purpose vehicles in a transparent manner, clearly demonstrating the benefits of privatization. The government should allocate these funds directly to fresh investments in rural and urban infrastructure and/or other development expenditure, both of
which we believe are critical for accelerating growth and would, we believe, help create jobs for the semi-skilled, less-educated sections of the work force. We believe that potential job creation from investments in infrastructure could more than offset job losses due to privatization.
Although key policymakers clearly appreciate the urgent need for investments in infrastructure but are short of funds with the current national fiscal deficit (including off-budget items) being close to 10% of GDP. Funding constraints are currently limiting the government’s annual spending on infrastructure to US$28 billion. We estimate the government could increase infrastructure spending by at least US$15 to 20 billion (1.5% to 2% of GDP) a year for the next three to four years through privatization.
55
JM MORGAN STANLEY
M O R G A N S T A N L E Y R E S E A R C H
June 2006 India and China: New Tigers of Asia – Part II
China’s Specific Challenges

56
JM MORGAN STANLEY
M O R G A N S T A N L E Y R E S E A R C H
June 2006 India and China: New Tigers of Asia – Part II
Weak Banking Sector
Strengthening China’s Banking System Is Key to Sustainable Growth China’s Banking System 8.5 Times Larger Than India’s Although, China’s GDP is about three times India’s, its banking system (in terms of loan assets) is 8.5 times larger. India’s credit to GDP ratio at 39% is significantly lower than China’s 113% (Exhibit 70). Although one of the key differences between the two economies that explain the huge variation in the sizes of the banking systems is their savings to GDP ratios, we believe that China’s credit growth has run ahead of the sustainable trend. China’s credit-to-GDP ratio is far higher relative to its per capita income when compared with other Asia/Pacific markets (Exhibit 71).
Issues Facing the Chinese Banking System Improving the efficiency of the banking system is critical for China as total savings stock in the form of bank deposits is large at 165% of GDP. The institutional framework of the Chinese banking system is in a formative stage when compared with international standards. The following are some of the key challenges it faces:
Government’s excessive influence on resource allocation and weak governance: China’s growth model has provided incentives to local governments as major owners with strong influence over the banking system and companies within their provinces. The four large banks, which account for about 54% of the total assets of the banking system, have been traditionally operating under the strong influence of government bureaucracy and mandates, including credit allocation decisions. This has resulted in multiple and mixed business goals for banks. Large banks’ ownership structure and corporate governance have adversely affected their ability to evolve a self-managing risk-assessment system. Even after SOE managers have been granted increased autonomy, the incentive system is aligned in a way that encourages them to over-invest. The high level of NPAs in the banking system is to a very large extent a reflection of this incentive structure.
Weak credit appraisal systems: The system of internal assessment and credit rating mechanisms in Chinese banks is not robust. There is a lack of adequate data collection with regard to borrowers and facilities, which serve as a basis for a quantitative approach to measure and to manage credit risk. The Chinese banks are gradually trying to overhaul their credit appraisal processes to bring them in line with international best practices.
Exhibit 70 India and China: Banks – A Snapshot (As of end-2005, US$ bn) China India Deposits 3706 436 --As % of GDP 165% 57% Credit 2554 304 --As % of GDP 113% 39% Credit-Deposit Ratio 69% 70% --Consumer Credit 271 81 --As % of GDP 12% 11% Investments na 159 --As % of GDP na 21% Gross NPL Ratio* 8.9% 5.2% --As % of GDP* 6.7% 1.9% Source: CEIC, CBRC, RBI, Morgan Stanley Research * Data for India as of March 2005, due to unavailability of latest data. Data for China are as published by CBRC and do not include all banks Exhibit 71 Asia: Credit Penetration vs. Per Capita Income
KoreaThailand
Singapore
China
India
TaiwanHong Kong
Malaysia
Indonesia
Australia
20%
50%
80%
110%
140%
0 5000 10000 15000 20000 25000 30000 35000
Loan
to G
DP
GDP Per Capita (US$)
(As of 2005)
Source: CEIC, Morgan Stanley Research Exhibit 72 Credit Growth (% YoY, 3MMA)
10%
15%
20%
25%
30%
Mar
-98
Mar
-99
Mar
-00
Mar
-01
Mar
-02
Mar
-03
Mar
-04
Mar
-05
Mar
-06
India
China
Source: CEIC, RBI, Morgan Stanley Research
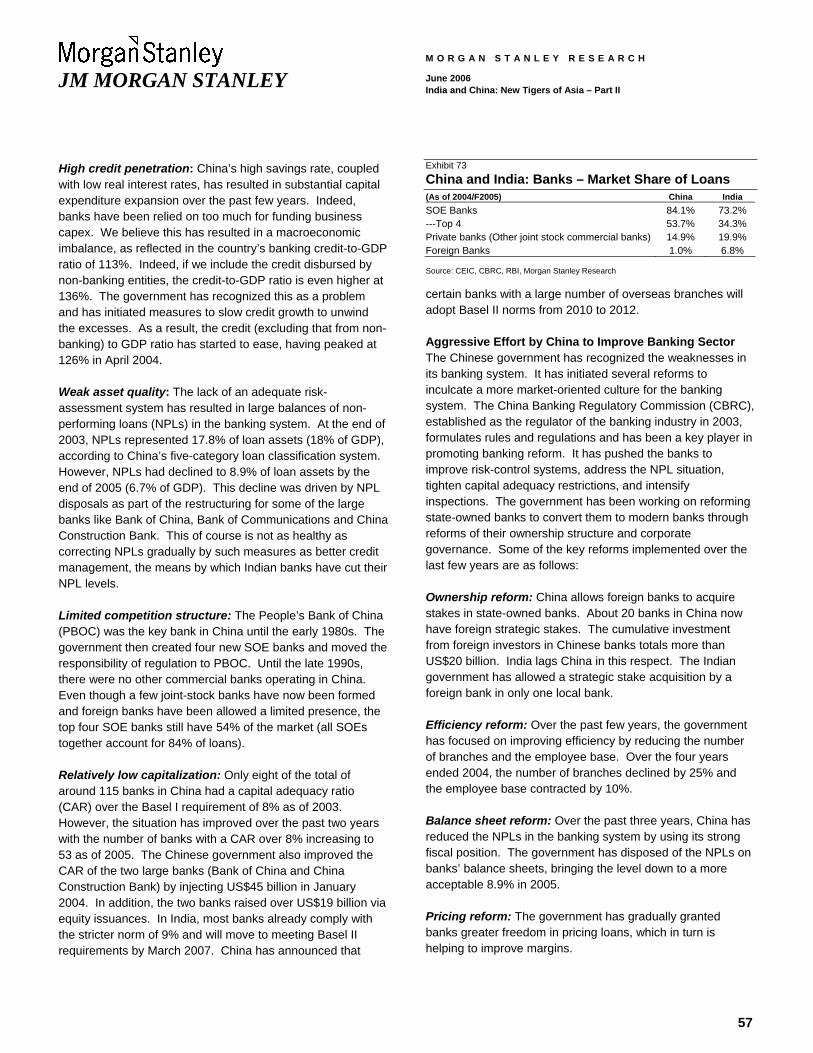
57
JM MORGAN STANLEY
M O R G A N S T A N L E Y R E S E A R C H
June 2006 India and China: New Tigers of Asia – Part II
High credit penetration: China’s high savings rate, coupled with low real interest rates, has resulted in substantial capital expenditure expansion over the past few years. Indeed, banks have been relied on too much for funding business capex. We believe this has resulted in a macroeconomic imbalance, as reflected in the country’s banking credit-to-GDP ratio of 113%. Indeed, if we include the credit disbursed by non-banking entities, the credit-to-GDP ratio is even higher at 136%. The government has recognized this as a problem and has initiated measures to slow credit growth to unwind the excesses. As a result, the credit (excluding that from non-banking) to GDP ratio has started to ease, having peaked at 126% in April 2004.
Weak asset quality: The lack of an adequate risk-assessment system has resulted in large balances of non-performing loans (NPLs) in the banking system. At the end of 2003, NPLs represented 17.8% of loan assets (18% of GDP), according to China’s five-category loan classification system. However, NPLs had declined to 8.9% of loan assets by the end of 2005 (6.7% of GDP). This decline was driven by NPL disposals as part of the restructuring for some of the large banks like Bank of China, Bank of Communications and China Construction Bank. This of course is not as healthy as correcting NPLs gradually by such measures as better credit management, the means by which Indian banks have cut their NPL levels.
Limited competition structure: The People’s Bank of China (PBOC) was the key bank in China until the early 1980s. The government then created four new SOE banks and moved the responsibility of regulation to PBOC. Until the late 1990s, there were no other commercial banks operating in China. Even though a few joint-stock banks have now been formed and foreign banks have been allowed a limited presence, the top four SOE banks still have 54% of the market (all SOEs together account for 84% of loans).
Relatively low capitalization: Only eight of the total of around 115 banks in China had a capital adequacy ratio (CAR) over the Basel I requirement of 8% as of 2003. However, the situation has improved over the past two years with the number of banks with a CAR over 8% increasing to 53 as of 2005. The Chinese government also improved the CAR of the two large banks (Bank of China and China Construction Bank) by injecting US$45 billion in January 2004. In addition, the two banks raised over US$19 billion via equity issuances. In India, most banks already comply with the stricter norm of 9% and will move to meeting Basel II requirements by March 2007. China has announced that
Exhibit 73 China and India: Banks – Market Share of Loans (As of 2004/F2005) China India SOE Banks 84.1% 73.2% ---Top 4 53.7% 34.3% Private banks (Other joint stock commercial banks) 14.9% 19.9% Foreign Banks 1.0% 6.8% Source: CEIC, CBRC, RBI, Morgan Stanley Research
certain banks with a large number of overseas branches will adopt Basel II norms from 2010 to 2012.
Aggressive Effort by China to Improve Banking Sector The Chinese government has recognized the weaknesses in its banking system. It has initiated several reforms to inculcate a more market-oriented culture for the banking system. The China Banking Regulatory Commission (CBRC), established as the regulator of the banking industry in 2003, formulates rules and regulations and has been a key player in promoting banking reform. It has pushed the banks to improve risk-control systems, address the NPL situation, tighten capital adequacy restrictions, and intensify inspections. The government has been working on reforming state-owned banks to convert them to modern banks through reforms of their ownership structure and corporate governance. Some of the key reforms implemented over the last few years are as follows:
Ownership reform: China allows foreign banks to acquire stakes in state-owned banks. About 20 banks in China now have foreign strategic stakes. The cumulative investment from foreign investors in Chinese banks totals more than US$20 billion. India lags China in this respect. The Indian government has allowed a strategic stake acquisition by a foreign bank in only one local bank.
Efficiency reform: Over the past few years, the government has focused on improving efficiency by reducing the number of branches and the employee base. Over the four years ended 2004, the number of branches declined by 25% and the employee base contracted by 10%.
Balance sheet reform: Over the past three years, China has reduced the NPLs in the banking system by using its strong fiscal position. The government has disposed of the NPLs on banks’ balance sheets, bringing the level down to a more acceptable 8.9% in 2005.
Pricing reform: The government has gradually granted banks greater freedom in pricing loans, which in turn is helping to improve margins.
58
JM MORGAN STANLEY
M O R G A N S T A N L E Y R E S E A R C H
June 2006 India and China: New Tigers of Asia – Part II
India’s Banking System – On a Better Footing In comparison, the Indian banks are in a much better position in terms of risk-assessment systems, NPLs, capital base and effective central bank supervision.
Relatively better risk-assessment systems: In India, the risk-appraisal system has improved significantly over the past few years. This is especially the case with the private sector and foreign banks, which have implemented IT solutions, enabling a centralized credit-appraisal system. For public sector banks, risk-assessment systems are relatively inferior to those at private and foreign banks but are improving at the margin.
Adequate capitalization: The RBI has implemented a much stricter capital requirement norm, with the minimum CAR of 9% for Indian banks versus the Basel requirement of 8%. This has resulted in a relatively strong capital base in India, with the average CAR at 12.8% as of end-March 2005. The Indian banks, especially the state-owned banks, were helped in this regard in 2002 to 2004 by the continued decline in interest rates, which resulted in higher treasury earnings on large government bond portfolios.
Stricter supervision by the central bank: The RBI has been at the forefront in terms of laying out strict norms to ensure stability of the Indian banking system. Some of the key regulations, apart from the higher CAR requirement, are as follows:
• Setting an investment fluctuation reserve of 5%, which all banks had to maintain by March 2006. This helps the banks in the event of adverse movements in interest rates.
• Changing the NPL recognition norm to 90 days in March 2004 from 180 days previously, to ensure continuing sound asset quality at banks.
• Ensuring that only banks with a strong capital base and good asset quality are allowed to pay dividends.
• Banks are required to comply with Basel II norms by March 2007, which requires adoption of more stringent risk management. Under the new regime, banks will be required to set aside capital for operational risk.
Manageable level of NPAs: The asset quality of Indian banks has strengthened significantly over the past few years, with the official gross NPL ratio improving to 5.2% in March 2005 from 15.7% in March 1997. As a percentage of GDP,
too, official gross NPLs are just 1.9%. This turnaround has been brought about by the better credit-appraisal methods adopted by the Indian banks and an improvement in the business cycle, which has resulted in older NPLs turning into performing assets. However, we believe that the underlying levels of NPAs could be rising again in view of recent strong credit growth. Even if NPAs are higher than official levels, they are likely to be manageable for the banking system.
Competition: In the mid-1990s, the RBI allowed the private sector to open new banks, which increased the level of competition. In fact, in F2005 the share of SOE banks in system loans was 73% compared with almost 85% in F1996. The increased competition has also created a need for SOE banks to implement technology solutions as they have lost market share in deposits, fees and advances to private sector banks because of inadequate infrastructure in the form of ATMs and networked branches. Competition from foreign banks has also increased over the past few years.
Indian Banks’ Own Set of Challenges Although on an overall measure Indian banks are much better placed than the Chinese, we believe the former also face some structural challenges. The first and biggest risk to the Indian banking system, in our view, is its high level of exposure to long-tenure government bonds. On average, about 30% of their total assets are in government bonds. Indian public-sector banks, which account for almost three-fourths of total deposits, chose to increase the average maturity of their government securities investment portfolios even as interest rates dropped below sustainable levels. Although the average maturity of Indian banks’ bond portfolio is not available, we believe it has increased significantly. The government raised the average maturity of its debt to 9.6 years in F2006 from 6.3 years in F1999. We believe that, if there is a sudden and sharp rise in interest rates to the extent of 250-300 bps in 10-year paper, it would pose a big threat to the health of the Indian banking system.
The second problem for Indian banks is in respect of the mandatory lending to priority sectors. Banks have to lend 40% of their overall loans to agriculture, small-scale industries and other weaker sections of society. Such lending has historically increased the NPLs in the banking system and reduces banks’ operational freedom.
The third problem is restricted access to foreign capital, which is capped at 20% for SOE banks and 74% for private banks. Until 2009, foreign banks cannot take a strategic stake in excess of 5% unless the domestic bank is categorized as ‘weak’. This restricted access to foreign
59
JM MORGAN STANLEY
M O R G A N S T A N L E Y R E S E A R C H
June 2006 India and China: New Tigers of Asia – Part II
capital in India, especially for SOE banks, which form a large part of the system, is constraining the availability of growth capital. China is much more liberal in this respect. China’s total foreign ownership cap on a strategic basis (excluding shares listed overseas for portfolio/individual investors) is 25% with maximum ownership of one single entity limited to 20%.
The fourth problem is the low capability of the government’s balance sheet to absorb banking system losses, if these occur. In India, public debt to GDP is already high, at 82%, compared with around 27% in China. This restricts the government’s ability to bear the burden of any significant write-offs of banking sector bad debts or inject capital; hence, maintaining strict controls on the banking system is imperative for the government.
Conclusion A strong banking sector is one of the key ingredients for faster and stable economic growth for transition economies. An efficient financial sector can promote savings and enable the flow of a larger share of savings into productive investments. The efficiency of the banking sector will be important for the stability of the financial system. Indeed, a weak banking sector was the genesis of many of the financial crises in transition economies in the 1980s and 1990s. While China’s real economy has moved far ahead of India’s, its banking system lags that of India’s. Recent efforts by the Chinese government are encouraging but the path to a truly market-oriented stable financial system is long and challenging.

60
JM MORGAN STANLEY
M O R G A N S T A N L E Y R E S E A R C H
June 2006 India and China: New Tigers of Asia – Part II
Shifting to a New Currency Regime
Open Economy but Relatively Inflexible Exchange Rate Structure India Has Led China in Exchange Rate System Reform India has had a greater focus than China on building soft infrastructure (institutional framework). The government initiated calibrated reforms in both the banking sector and exchange rate regime from the early 1990s. These reforms were to a large extent an outcome of the 1991 balance of payments crisis, which brought to the fore the risks of continuing with controlled systems that eventually cause shocks. The exchange rate and banking sector reforms were a part of the broader liberalization program whereby India adopted an open-economy model.
India made its first move to the transition from a fixed to a managed floating exchange rate regime in 1992. Prior to that, it had followed a de facto peg against the US dollar, which was adjusted periodically. The first step was to have a dual exchange rate along with other broader macro economic reforms. Under the dual exchange rate system, the government accepted the existence of two exchange rates –the official exchange rate, which was controlled, and the market rate, which was allowed to fluctuate with prevailing market conditions. Only 60% of export earnings could be realized at the market rate and the balance of 40% had to be surrendered at the official exchange rate.
At the second stage, the government took the most important step towards full convertibility on the current account by unifying the two exchange rates. However, the central bank intervened actively in the foreign exchange market. Over the years, India has continued to strengthen the banking sector and financial markets in general. The flexible exchange rate regime has survived three distinct periods of volatility: 1995-1996, post the Mexican crisis; 1997-1999, a period of major disturbing events such as the Asian crisis and nuclear tests by India; and 2001 after the 9/11 incident in the United States. The central bank now follows a clearly specified policy of intervening to check volatility but has been less aggressive in influencing the direction of the exchange rate.
China Lagging in Reforming Exchange Rate Regime Over the past 20 years, China has witnessed massive transformation from a centrally planned economy to a market-oriented economy. The progress in foreign trade and improvement in the external balance sheet is the most impressive. Foreign trade expanded from US$75 billion (24% of GDP) in 1985 to US$1.6 trillion (72% of GDP) in 2005. The
sharp increase in capital flows pushed its foreign exchange reserves to US$875 billion in March 2006 from US$3 billion in 1985. However, its exchange rate policy reforms have lagged the overall progress in the economy.
Traditionally, the government has determined the exchange rate based on a composite set of factors, including an international consumer price comparison, the weighted average values of a basket of major currencies, and foreign exchange settlement for overseas Chinese remittances, tourist expenses, transportation and other non-trade transactions.3 Prior to 1979, China imposed strict controls on exchange transactions. Although exchange controls have been relaxed gradually since then, the government still has significant capital account controls and its exchange regime remains fairly inflexible.
Slow Transition to Flexible Exchange Rate Regime Although the fixed exchange rate regime and capital controls proved to be a source of strength for China during the Asian crisis, the government is increasingly facing pressure from the external world, especially the US, to implement a flexible exchange rate regime. Several issues are being debated, including whether the renminbi is overvalued and should China opt for a one-time adjustment in its currency.
There are several entities in the camp that argues that the renminbi is undervalued and that China should allow greater flexibility in its exchange rate. The argument is based on China’s large trade surplus and its rising bank of foreign exchange reserves. A statement by G7 finance ministers and central bank governors emphasized that “Greater exchange rate flexibility is desirable in emerging economies with large current account surpluses, especially China, for necessary adjustments to occur”.
The Chinese government, however, has always been cautious about changing its exchange rate regime in view of the position of its financial system, the potential threat of destabilization and, more importantly, the implications for employment growth. However, international pressure is continuing for China to move faster on its currency regime.
3 Lin, Guijun. “On the Exchange Rate of the RMB;” University of International Business and Economics Press, China, 1997
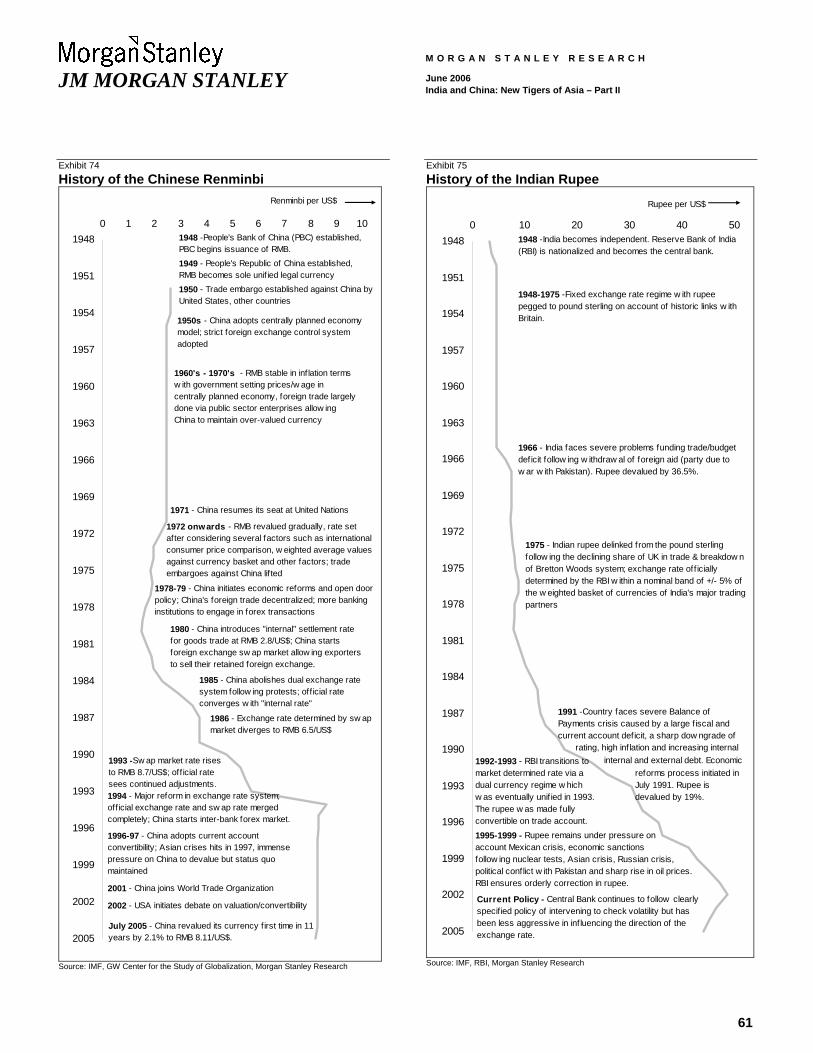
61
JM MORGAN STANLEY
M O R G A N S T A N L E Y R E S E A R C H
June 2006 India and China: New Tigers of Asia – Part II
Exhibit 74 History of the Chinese Renminbi
1948
1951
1954
1957
1960
1963
1966
1969
1972
1975
1978
1981
1984
1987
1990
1993
1996
1999
2002
2005
0 1 2 3 4 5 6 7 8 9 101948 -People's Bank of China (PBC) established, PBC begins issuance of RMB.
1949 - People's Republic of China established, RMB becomes sole unif ied legal currency
1950 - Trade embargo established against China by United States, other countries
1950s - China adopts centrally planned economy model; strict foreign exchange control system adopted
1960's - 1970's - RMB stable in inf lation terms w ith government setting prices/w age in centrally planned economy, foreign trade largely done via public sector enterprises allow ing China to maintain over-valued currency
1971 - China resumes its seat at United Nations
1972 onwards - RMB revalued gradually, rate set after considering several factors such as international consumer price comparison, w eighted average values against currency basket and other factors; trade embargoes against China lif ted
1978-79 - China initiates economic reforms and open door policy; China's foreign trade decentralized; more banking institutions to engage in forex transactions
1980 - China introduces "internal" settlement rate for goods trade at RMB 2.8/US$; China starts foreign exchange sw ap market allow ing exporters to sell their retained foreign exchange.
1985 - China abolishes dual exchange rate system follow ing protests; off icial rate converges w ith "internal rate"
1986 - Exchange rate determined by sw ap market diverges to RMB 6.5/US$
1993 -Sw ap market rate rises to RMB 8.7/US$; off icial rate sees continued adjustments.1994 - Major reform in exchange rate system; off icial exchange rate and sw ap rate merged completely; China starts inter-bank forex market.
1996-97 - China adopts current account convertibility; Asian crises hits in 1997, immense pressure on China to devalue but status quo maintained
July 2005 - China revalued its currency f irst time in 11 years by 2.1% to RMB 8.11/US$.
2001 - China joins World Trade Organization
2002 - USA initiates debate on valuation/convertibility
Renminbi per US$
Source: IMF, GW Center for the Study of Globalization, Morgan Stanley Research
Exhibit 75 History of the Indian Rupee
1948
1951
1954
1957
1960
1963
1966
1969
1972
1975
1978
1981
1984
1987
1990
1993
1996
1999
2002
2005
0 10 20 30 40 501948 -India becomes independent. Reserve Bank of India (RBI) is nationalized and becomes the central bank.
1966 - India faces severe problems funding trade/budget deficit follow ing w ithdraw al of foreign aid (party due to w ar w ith Pakistan). Rupee devalued by 36.5%.
1975 - Indian rupee delinked from the pound sterling follow ing the declining share of UK in trade & breakdow n of Bretton Woods system; exchange rate off icially determined by the RBI w ithin a nominal band of +/- 5% of the w eighted basket of currencies of India's major trading partners
1991 -Country faces severe Balance of Payments crisis caused by a large f iscal and current account deficit, a sharp dow ngrade of
rating, high inf lation and increasing internal internal and external debt. Economic
reforms process initiated in July 1991. Rupee is devalued by 19%.
1992-1993 - RBI transitions to market determined rate via a dual currency regime w hich w as eventually unif ied in 1993. The rupee w as made fully convertible on trade account.1995-1999 - Rupee remains under pressure on account Mexican crisis, economic sanctions follow ing nuclear tests, Asian crisis, Russian crisis, political conflict w ith Pakistan and sharp rise in oil prices. RBI ensures orderly correction in rupee.
Current Policy - Central Bank continues to follow clearly specified policy of intervening to check volatility but has been less aggressive in inf luencing the direction of the exchange rate.
1948-1975 -Fixed exchange rate regime w ith rupee pegged to pound sterling on account of historic links w ith Britain.
Rupee per US$
Source: IMF, RBI, Morgan Stanley Research
62
JM MORGAN STANLEY
M O R G A N S T A N L E Y R E S E A R C H
June 2006 India and China: New Tigers of Asia – Part II
Why China Needs a Flexible Exchange Rate Our global currency economist, Stephen L. Jen, lists the arguments in favor of greater flexibility for an economy like China. First, a flexible exchange rate regime would allow China to have a more independent monetary policy. With the capital account in the process of being liberalized, China’s monetary policy will move more closely in line with the Fed’s actions if the renminbi remains linked to the US dollar. As the economy matures in the coming years and the domestic sector almost certainly becomes more important relative to the external sector, China will need its own monetary policy. For instance, continued intervention and inadequate sterilization have resulted in an excessive investment problem. The Principle of the Impossible Trinity stipulates that central banks cannot have all three of the following: (1) an independent monetary policy, (2) an open capital account free of controls, and (3) a target on the exchange rate. Essentially, China is replacing (3) with (1) and (2).
Second, with gradual liberalization of the capital account and greater integration with the global economy, a more flexible exchange rate regime would be better able to handle the powerful ebbs and flows of global capital that will inevitably impinge on the economy. A more flexible exchange rate could help the economy cope with real external shocks, without exerting so much pressure on wages and prices for adjustment.
If China has to shift towards a market-oriented financial system, then moving to a more flexible exchange rate would be essential.
First Step to Change in Currency Regime On July 21, 2005, China decided to change its currency regime. The renminbi was revalued by 2.1% and from that day fluctuations of 0.3% have been allowed on either side of the central rate, announced by the central bank on the previous day (i.e., the currency is able to crawl by 0.3% a day at a maximum). The central bank refers to a basket of currencies to manage the currency. The renminbi has appreciated by a further 1.1% since July 21, 2005. While this move, in our view, is relatively modest, it was intended to counter international pressure on China and lay the foundation for improving monetary policy over time.
Why Has the Renminbi Not Moved Much So far? First, technically, China does not have a basket peg; it has a managed float regime guided by a basket currency reference
index. Therefore, the PBoC does not need to strictly adhere to the index though the USD/RMB rate is likely to move in the same direction as the underlying index. Second, while the market is more focused on the nominal bilateral exchange rate of USD/RMB, in real effective exchange rate (REER) terms, the renminbi has already appreciated significantly. For instance, in 2005 while the renminbi appreciated against the US dollar by 3%, its REER appreciated by 9.7%. Third, and more importantly, China’s monetary system is not yet in a state where a complete shift away from the exchange rate-based policy platform is possible. The financial system needs to build matching flexibility and risk-management capabilities before the transition to a flexible exchange rate is fully operative.
Need to Develop an Interest Rate Market What China needs now is to further develop and refine the interest rate market. The yield curve in China has to be a meaningful reflection of the underlying supply and demand conditions. It also has to be a good indicator of investors’ expectations of China’s future growth and inflation paths. In general, the PBoC will need to bring the monetary system to a point where the monetary transmission mechanism in China allows the PBoC to start to conduct monetary policy in an orthodox manner. China’s monetary system is built on administrative directives and not one where the price of liquidity/credit (i.e., interest rates) is endogenously determined by supply and demand. To move to a market-based monetary system, much work needs to be done. Until then, the USD/RMB rate will remain relatively more stable than most think, in our view.
Complementary Reforms Will Be Necessary In addition to further capital account liberalization and banking sector reforms, it is important that the onshore forward market and derivatives instruments are developed to provide currency hedging for local firms. Currency flexibility necessarily leads to uncertainty and risk. Chinese firms will need to master management of risk, but the hedging instruments and hedging markets will have to be developed in tandem. At the same time, both policymakers and the private sector will need to learn to treat changing exchange rates not as an irritant but as a critical source of information about the state of the Chinese and global economy.
(Part of this section draws from research by our global currency economics team.)
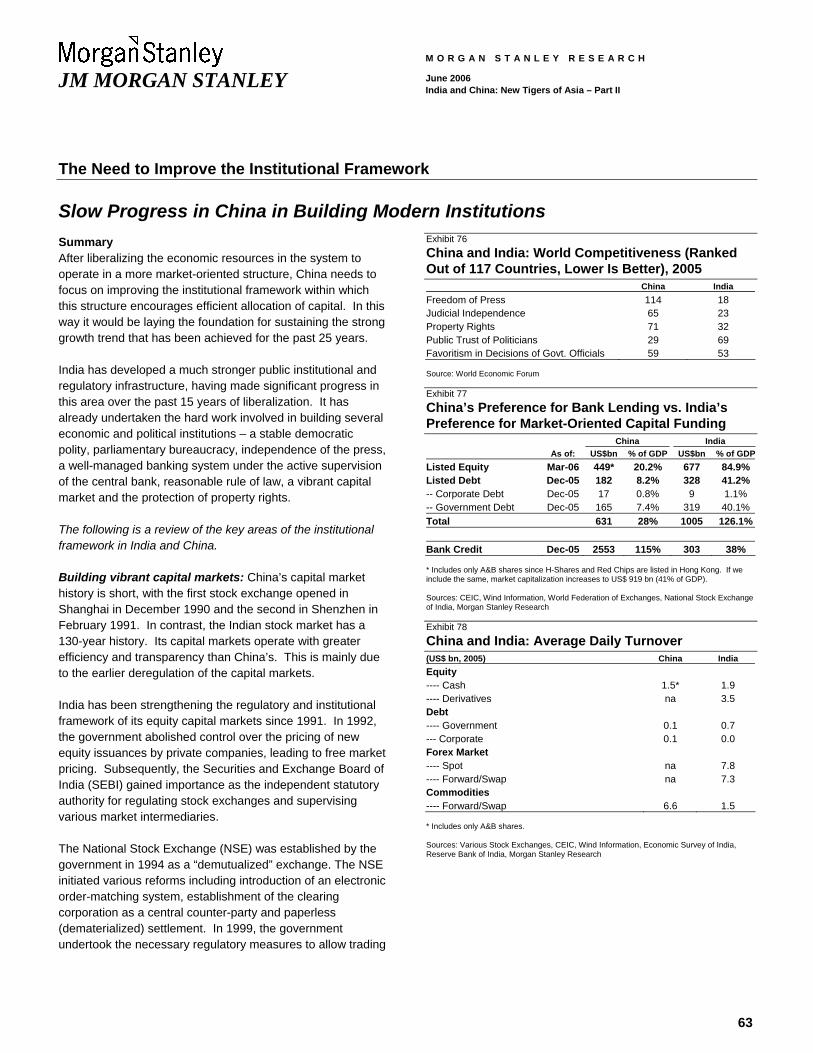
63
JM MORGAN STANLEY
M O R G A N S T A N L E Y R E S E A R C H
June 2006 India and China: New Tigers of Asia – Part II
The Need to Improve the Institutional Framework
Slow Progress in China in Building Modern Institutions Summary After liberalizing the economic resources in the system to operate in a more market-oriented structure, China needs to focus on improving the institutional framework within which this structure encourages efficient allocation of capital. In this way it would be laying the foundation for sustaining the strong growth trend that has been achieved for the past 25 years.
India has developed a much stronger public institutional and regulatory infrastructure, having made significant progress in this area over the past 15 years of liberalization. It has already undertaken the hard work involved in building several economic and political institutions – a stable democratic polity, parliamentary bureaucracy, independence of the press, a well-managed banking system under the active supervision of the central bank, reasonable rule of law, a vibrant capital market and the protection of property rights.
The following is a review of the key areas of the institutional framework in India and China.
Building vibrant capital markets: China’s capital market history is short, with the first stock exchange opened in Shanghai in December 1990 and the second in Shenzhen in February 1991. In contrast, the Indian stock market has a 130-year history. Its capital markets operate with greater efficiency and transparency than China’s. This is mainly due to the earlier deregulation of the capital markets.
India has been strengthening the regulatory and institutional framework of its equity capital markets since 1991. In 1992, the government abolished control over the pricing of new equity issuances by private companies, leading to free market pricing. Subsequently, the Securities and Exchange Board of India (SEBI) gained importance as the independent statutory authority for regulating stock exchanges and supervising various market intermediaries.
The National Stock Exchange (NSE) was established by the government in 1994 as a “demutualized” exchange. The NSE initiated various reforms including introduction of an electronic order-matching system, establishment of the clearing corporation as a central counter-party and paperless (dematerialized) settlement. In 1999, the government undertook the necessary regulatory measures to allow trading
Exhibit 76 China and India: World Competitiveness (Ranked Out of 117 Countries, Lower Is Better), 2005 China India Freedom of Press 114 18 Judicial Independence 65 23 Property Rights 71 32 Public Trust of Politicians 29 69 Favoritism in Decisions of Govt. Officials 59 53 Source: World Economic Forum Exhibit 77 China’s Preference for Bank Lending vs. India’s Preference for Market-Oriented Capital Funding China India As of: US$bn % of GDP US$bn % of GDPListed Equity Mar-06 449* 20.2% 677 84.9% Listed Debt Dec-05 182 8.2% 328 41.2% -- Corporate Debt Dec-05 17 0.8% 9 1.1% -- Government Debt Dec-05 165 7.4% 319 40.1% Total 631 28% 1005 126.1% Bank Credit Dec-05 2553 115% 303 38% * Includes only A&B shares since H-Shares and Red Chips are listed in Hong Kong. If we include the same, market capitalization increases to US$ 919 bn (41% of GDP). Sources: CEIC, Wind Information, World Federation of Exchanges, National Stock Exchange of India, Morgan Stanley Research Exhibit 78 China and India: Average Daily Turnover (US$ bn, 2005) China India Equity ---- Cash 1.5* 1.9 ---- Derivatives na 3.5 Debt ---- Government 0.1 0.7 --- Corporate 0.1 0.0 Forex Market ---- Spot na 7.8 ---- Forward/Swap na 7.3 Commodities ---- Forward/Swap 6.6 1.5 * Includes only A&B shares. Sources: Various Stock Exchanges, CEIC, Wind Information, Economic Survey of India, Reserve Bank of India, Morgan Stanley Research
64
JM MORGAN STANLEY
M O R G A N S T A N L E Y R E S E A R C H
June 2006 India and China: New Tigers of Asia – Part II
in derivative securities. Both cash and derivative turnover levels have increased sharply over the past few years. Cash turnover rose twofold to US$473 billion in 2005 from US$249 billion in 2001 while derivative turnover surged over 100-fold to US$887 billion in 2005 from US$8 billion. In contrast, the Chinese equity markets are relatively underdeveloped and lack depth. Cash turnover, currently at US$383 billion, has been largely stagnant since 2001 while the derivative market is virtually non-existent.
China has used the Hong Kong stock exchange as a near-term solution with mainland companies accounting for US$470 billion of the market capitalization (as of March 2006) listed on that exchange. However, this is clearly not the optimal solution for China since its own retail and institutional investors are restricted from buying shares in these companies. China is initiating more measures to improve the breadth, depth and efficiency of its equity, government debt, corporate debt and foreign exchange market.
Flexibility in financial markets: The government also needs to improve the availability of risk management instruments and trading efficiency in financial markets, particularly corporate, government bonds, and foreign exchange. Similarly, effective hedging instruments are not operative in most of its markets. Although this is also an issue in India, the latter has been ahead in initiating changes to address it. With a well-established cash foreign exchange market, the central bank has been steadily encouraging an improvement in the depth of the forward exchange market. Cash trading in government securities markets has improved already. The RBI recently allowed intra-day short selling in government bonds.
The government is now focusing on developing the corporate bond market. In December 2005, a government-appointed committee submitted its recommendations. Key among them were the revamping of the stamp duty structure for corporate bonds, providing incentives to market makers, developing an efficient secondary market, allowing repos in corporate bonds (to improve liquidity) and simplifying various other norms for listing. In February 2006, the Finance Minister announced that the government had accepted the recommendations and it would now take steps to create a single, unified exchange-traded market for corporate bonds.
Corporate governance: The establishing of non-governmental civil organizations does not seem to have been given priority by the Chinese government. The pace of reforms needs to be accelerated to create institutional mechanisms that influence corporate behavior in a
transparent manner to improve overall efficiency. The government has initiated several measures over the past few years to strengthen corporate governance, making changes in the laws to protect public investors’ interest, in company laws (such as requiring the appointment of independent directors and the imposition of the legal responsibility of directors), in accounting policies and disclosure norms.
However, we believe that for corporate governance-related laws to be effective, ownership reforms to reduce government influence on companies are needed. Unless there is a credible threat of market failure such as bankruptcy or a hostile takeover, the overall corporate governance environment is unlikely to be effective as the corporate sector has no incentive to be disciplined.
Judiciary systems: Although the Chinese legal system has developed substantially in the past two decades (for instance, with the number of lawyers in China increasing from just 5,500 in 1981 to around 142,500 in 2003), its overall progress in this regard remains far behind that of India. The World Economic Forum ranks China sixty-fifth out of a total of 117 countries surveyed on judicial independence.
India is ranked twenty-third. India has strong legal remedies although there are some questions on the efficacy of the legal system. In India, court cases take unduly long to be resolved, resulting in a large number of pending cases. For instance, in 2004 around 3.2 million cases were pending in the high courts.
IPR protection: China has been slow to initiate measures to protect intellectual property rights. The Office of the US Trade Representative placed China on a priority watch list in April 2005. According to the USTR report, the efforts by China have not been sufficient and the administration would use WTO instruments “whenever appropriate”.
Presence of the media: A relatively independent media is important for transparency and the monitoring of the performance of public institutions. India is already witnessing benefits of an active and independent media, exposing poor performance of public institutions. Both India and China were closed to the foreign media until the beginning of the 1990s. However, since then, India has made rapid strides in opening up the sector, while China continues to lag.
The Indian government allowed satellite television in India in 1990-91, and, since then, there has been a rapid proliferation of television media. It permits foreign channels to transmit different genres of content, including news. With regard to
65
JM MORGAN STANLEY
M O R G A N S T A N L E Y R E S E A R C H
June 2006 India and China: New Tigers of Asia – Part II
print media, the government allowed facsimile (exact replicas) of foreign newspapers to be published and circulated in the country in 2005.
In China, there are stringent regulations governing the media sector. The government also actively blocks access to certain websites. An example of the government’s restrictive measures is its recent effort to control the access of Google search. Google.com has agreed to censor certain websites/keywords on its search services for Chinese users after pressure from the government.
Conclusion Although one could argue that the efficacy of many of the public institutions in India is less than satisfactory, the country’s progress in developing the required infrastructure is still commendable. While India has been slow to develop the physical infrastructure, it has steadily accelerated the pace of establishing the soft infrastructure of the institutional framework. While China’s government has initiated a number of measures to improve this soft infrastructure, we believe it is one of the major challenges for the country in the near to medium term.

66
JM MORGAN STANLEY
M O R G A N S T A N L E Y R E S E A R C H
June 2006 India and China: New Tigers of Asia – Part II

67
JM MORGAN STANLEY
M O R G A N S T A N L E Y R E S E A R C H
June 2006 India and China: New Tigers of Asia – Part II
Chart Scan
68
JM MORGAN STANLEY
M O R G A N S T A N L E Y R E S E A R C H
June 2006 India and China: New Tigers of Asia – Part II
Growth Trends: China’s Fast Track vs. India’s Gradualism Model Acceleration in growth in the post-reform period: China’s economic growth has averaged 9.4% a year since 1978. Taking
advantage of a sharp rise in the working population ratio in the early 1970s, the government initiated major structural reforms in 1978, which allowed the virtuous interplay of labor and capital. India’s economic growth underwent a structural shift at the start of the 1980s. Over the decade, the government made an attitude shift in favor of the private sector. Economic growth averaged 5.7% a year in the 1980s versus 3.5% in the prior three decades. Since 1991 the government has initiated major liberalization measures, adopting the open-economy model. India has achieved average growth of 6% a year since 1991 and in the past five years, growth has averaged a higher rate of 6.7%.
The emphasis for China remains manufacturing and for India, services: In terms of segment growth mix, China has followed a model similar to that of other Asian countries, relying on manufactured exports as a key anchor for sustainable acceleration in growth and integration with the global market place. As a result, China’s manufacturing sector has recorded real growth of 11.5% a year since 1978. Growth in services and agriculture averaged 10.6% and 4.6%, respectively, over the period. India’s growth mix, however, has been significantly different from that of China. Over the past 15 years (since the start of India’s reforms), India’s services sector growth has averaged 7.9% a year compared with 6.0% for manufacturing and 2.5% for agriculture. In comparison, China’s manufacturing growth has been about 12.6% a year over this period versus 10.1% for services and 3.8% for agriculture.
Differing focus on exports and fixed investments as growth drivers: China has been over-reliant on exports for stimulating growth compared with India. Its export (goods plus services) to GDP ratio has increased to 38% from 7% in 1980. India’s exports to GDP ratio has risen to 19% from 6% in 1980. Similarly, China’s investment-to-GDP ratio has increased to 49% from 20% in 1980 compared with a rise in India’s investment share of GDP to 30% from 21% in 1980.
Accounting for growth differences: A simplistic way to account for growth in a country would be to consider the contributions from the three basic drivers: (1) labor force inputs, (2) capital inputs and (3) total factor productivity. Total factor productivity (TFP) is that part of non-factor inputs that enables higher growth with less application of factor inputs. It encompasses the contribution of technology and managerial aspects to the growth of real output. The two major areas where India’s growth suffers compared with that of China are capital accumulation and lower productivity growth (Exhibit 84). In the past 10 years, on average, more than 4.5 percentage points of China’s GDP growth was accounted for by capital accumulation, which was supported by its high national savings rate. In comparison, capital accumulation in India, contributed only about 2.1 percentage points of GDP growth. For India, a large proportion of its growth is accounted for by total factor productivity although it was lower than that for China on average in the past ten years.
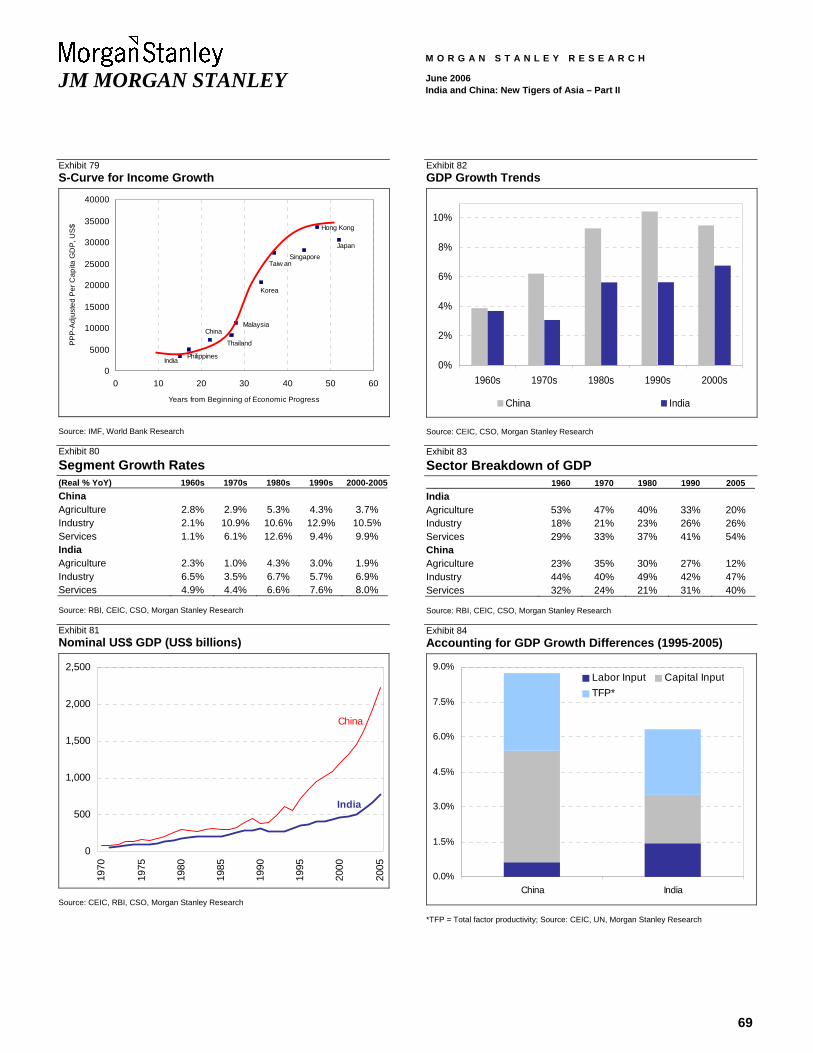
69
JM MORGAN STANLEY
M O R G A N S T A N L E Y R E S E A R C H
June 2006 India and China: New Tigers of Asia – Part II
Exhibit 79 S-Curve for Income Growth
0
5000
10000
15000
20000
25000
30000
35000
40000
0 10 20 30 40 50 60
Years from Beginning of Economic Progress
PPP
-Adj
uste
d P
er C
apita
GD
P, U
S$
India Philippines
Malaysia
Korea
Taiw an
Japan
Hong Kong
China
Singapore
Thailand
Source: IMF, World Bank Research Exhibit 80 Segment Growth Rates (Real % YoY) 1960s 1970s 1980s 1990s 2000-2005China Agriculture 2.8% 2.9% 5.3% 4.3% 3.7% Industry 2.1% 10.9% 10.6% 12.9% 10.5% Services 1.1% 6.1% 12.6% 9.4% 9.9% India Agriculture 2.3% 1.0% 4.3% 3.0% 1.9% Industry 6.5% 3.5% 6.7% 5.7% 6.9% Services 4.9% 4.4% 6.6% 7.6% 8.0% Source: RBI, CEIC, CSO, Morgan Stanley Research Exhibit 81 Nominal US$ GDP (US$ billions)
0
500
1,000
1,500
2,000
2,500
1970
1975
1980
1985
1990
1995
2000
2005
China
India
Source: CEIC, RBI, CSO, Morgan Stanley Research
Exhibit 82 GDP Growth Trends
0%
2%
4%
6%
8%
10%
1960s 1970s 1980s 1990s 2000s
China India
Source: CEIC, CSO, Morgan Stanley Research Exhibit 83 Sector Breakdown of GDP 1960 1970 1980 1990 2005 India Agriculture 53% 47% 40% 33% 20% Industry 18% 21% 23% 26% 26% Services 29% 33% 37% 41% 54% China Agriculture 23% 35% 30% 27% 12% Industry 44% 40% 49% 42% 47% Services 32% 24% 21% 31% 40% Source: RBI, CEIC, CSO, Morgan Stanley Research Exhibit 84 Accounting for GDP Growth Differences (1995-2005)
0.0%
1.5%
3.0%
4.5%
6.0%
7.5%
9.0%
China India
Labor Input Capital InputTFP*
*TFP = Total factor productivity; Source: CEIC, UN, Morgan Stanley Research
70
JM MORGAN STANLEY
M O R G A N S T A N L E Y R E S E A R C H
June 2006 India and China: New Tigers of Asia – Part II
Consumption - Macro: China Spends Twice As Much As India India’s consumption-to-GDP ratio is higher than China’s: Although in nominal US dollar terms India’s GDP is 35% of
China’s size, India’s consumption spending is about 45% of China’s. India’s overall consumption-to-GDP ratio was 72% in 2004 compared with 54% for China. Not all the difference in consumption-to-GDP ratio is explained by the demographic position (as defined by the age-dependency ratio) of the two countries. Indeed, China’s consumption ratio was lower than India’s even while its demographic position was similar to India’s in 1975 (Exhibit 88). India’s active consumerism culture, populist attitude of the government and the larger share of household income in GDP are the key reasons for consumption’s relatively higher share of GDP.
China’s consumption growth rate is higher than India’s: Although China’s share of consumption in GDP is lower than India’s, its absolute spending on consumption was US$1,074 billion in 2004 compared with India’s US$498 billion. China’s consumption growth has also been higher at 7.6% over the past 10 years (compared with India’s 5.8%), driven by its higher per capita income.
Both India and China are witnessing a shift in the consumption mix: In India and China, rising per capita income, changing demographics (rising young population), rapidly emerging modern retail format and increased access to financing are bringing about a change in the consumption basket. The share of organized sector products is increasing while that of primary products is declining. The Indian consumption basket is still relatively primitive currently and biased towards such products as food, beverages and tobacco. An average Indian spends about 49% of his/her expenditure on products other than food, beverages and tobacco compared with the average for China of 67% (Exhibit 87).
Reforming the retail distribution network: China has already built a modern retail distribution system to a large extent while India has just initiated such a network. The new retail format is beginning to drive a change on the supply side in India. This is a reverse of the process in China where the supply chain was relatively modernized for exports before the shift was initiated in retail distribution. We believe this change in the retail sector could lead to a significant transformation in India’s small & medium manufacturing as well as farming segments. This, in turn, could provide India with the opportunity to participate in the global export market for low-ticket manufactured goods.

71
JM MORGAN STANLEY
M O R G A N S T A N L E Y R E S E A R C H
June 2006 India and China: New Tigers of Asia – Part II
Exhibit 85 Consumption: Basic Facts (As of 2004/F2005) China India GDP (Nominal US$bn) 1979 694 Consumption (Nominal US$bn) 1074 498 ---Private consumption 788 420 ---Government consumption 286 78 Consumption (as % of GDP) 54.3% 71.8% ---Private consumption 39.8% 60.6% ---Government consumption 14.5% 11.3% Consumption per capita (US$) 826 457 ---Private consumption 606 385 ---Government consumption 220 72 Source: CEIC, Morgan Stanley Research Exhibit 86 Real Total Consumption Growth Trends
2%
4%
6%
8%
10%
12%
1987
1990
1993
1996
1999
2002
2005
China
India
% YoY, 3Yr MA
Source: CEIC, Morgan Stanley Research Exhibit 87 Consumption Basket Components As of 2004 China India Food, beverages and tobacco 33% 51% Transport & Communications 18% 15% Housing 10% 12% Leisure and education 12% 4% Clothing and footwear 8% 5% Household goods and services 7% 3% Health 6% 9% Hotels and catering 5% 2% Miscellaneous goods and services 7% 9% Source: Euromonitor, Morgan Stanley Research
Exhibit 88 Share of Consumption in GDP Tracking Demographics
40%45%50%55%60%65%70%75%80%50%
58%
66%
74%
82%
90%
Con
sum
ptio
n as
% o
f GD
P
Age Dependency
China
India
Source: UN, CEIC, CSO, Morgan Stanley Research Exhibit 89 Consumption per Capita Trends (Nominal US$)
100
260
420
580
740
90019
81
1983
1985
1987
1989
1991
1993
1995
1997
1999
2001
2003
2005
China India
Source: CEIC, Morgan Stanley Research Exhibit 90 India and China: Share in World Nominal US$ Consumption
2.5%
3.0%
3.5%
4.0%
4.5%
5.0%
1986
1988
1990
1992
1994
1996
1998
2000
2002
2004
Source: CEIC, CSO, Morgan Stanley Research
72
JM MORGAN STANLEY
M O R G A N S T A N L E Y R E S E A R C H
June 2006 India and China: New Tigers of Asia – Part II
Consumption - Micro: Markets for Most Products in India Are a Third to a Tenth of China’s Consumer product penetration rates higher in China: Penetration rates and per capita consumption are higher in China
than in India for most broad-based manufactured consumption items because China’s per capita income is 2.4 times that of India. In fact, real per capita private consumption expenditure in China has increased by an average of 7.3% a year over the past 10 years compared with 5.3% in India.
China’s consumer product market is significantly larger than India’s: Not only is China well ahead of India in terms of exports, its domestic market for consumer products is also much bigger. For consumer non-durables as well as durables China’s market (annual sales) is about three to ten times that of India. Among durables, annual sales in China for products like cell phones are about double those in India whereas at the other extreme are items such as televisions where annual sales in China are about seven times those in India (Exhibit 94).For non-durables, India’s market is of similar size to China’s in basic products like soaps but lags in products such as detergents, skin care products and bottled water (Exhibit 91).
India lags China in per capita consumption of key items by a range of 4 to 11 years, depending on the product: Even if it manages a big shift in growth rates and follows China’s trend, India is likely to remain 4 to 11 years behind China across different products. To approximate the amount of time the market size for the various consumer products in India will take to reach China’s current market size, we performed a regression analysis with China’s and India’s per capita consumption of various products being dependent on their respective per capita income levels. Based on this regression analysis, we arrived at India’s and China’s respective per capita consumption to income slope levels, which explain the penetration trend to per capita trend relationship, as shown in Exhibits 92 and 95. These slopes help explain the relationship between past growth in per capita consumption and the increase in per capita income levels. We have projected per capita consumption and, in turn, the market size in India based on two scenarios: 1) India will continue to follow its own past slope i.e., it follows its past penetration to per capita income trend; we call this Type I; and 2) India will shift to China’s slope i.e., it follows China’s penetration to per capita income trend; we call this Type II. We have also provided alternative calculations, assuming two real GDP growth scenarios, 7% and 8% a year. We have forecast the number of years India will take to reach China’s market size under these growth scenarios and under the two slope functions – one using India’s past trend and the other using a shift to China’s past trend. Our nominal GDP growth forecasts for India assume constant real GDP growth of 7-8% a year. For per capita calculations, we have used the population growth projections of the United Nations.
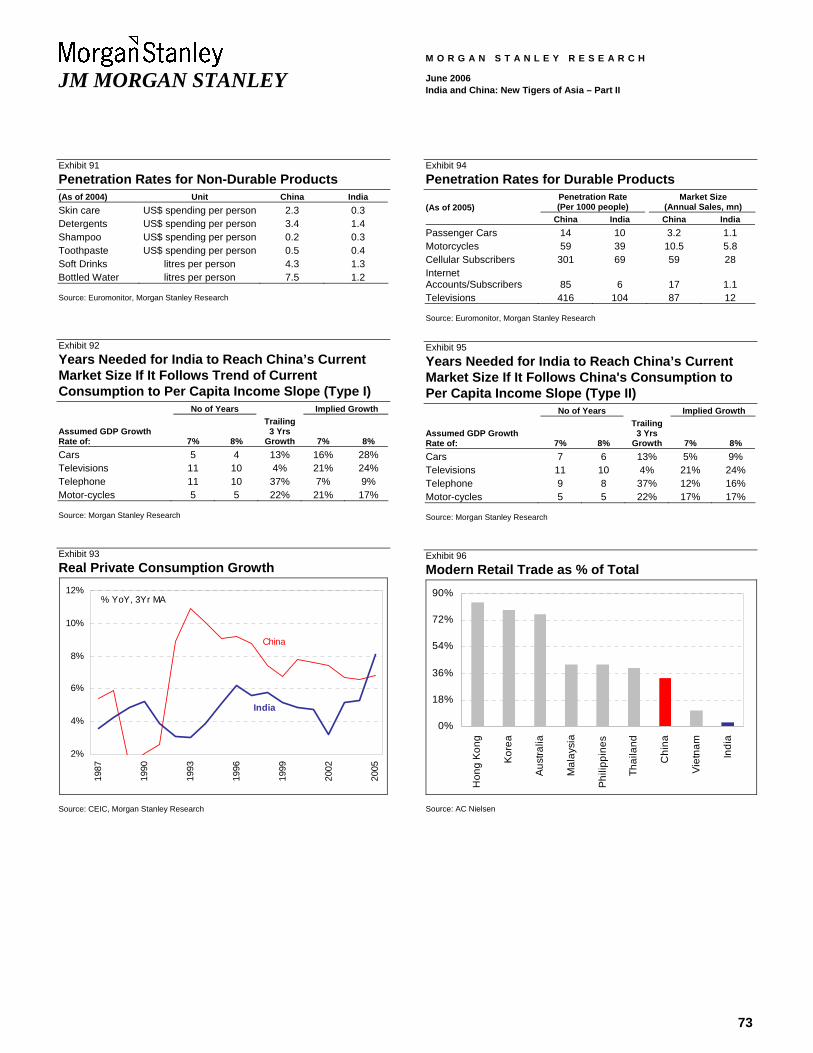
73
JM MORGAN STANLEY
M O R G A N S T A N L E Y R E S E A R C H
June 2006 India and China: New Tigers of Asia – Part II
Exhibit 91 Penetration Rates for Non-Durable Products (As of 2004) Unit China India Skin care US$ spending per person 2.3 0.3 Detergents US$ spending per person 3.4 1.4 Shampoo US$ spending per person 0.2 0.3 Toothpaste US$ spending per person 0.5 0.4 Soft Drinks litres per person 4.3 1.3 Bottled Water litres per person 7.5 1.2 Source: Euromonitor, Morgan Stanley Research Exhibit 92 Years Needed for India to Reach China’s Current Market Size If It Follows Trend of Current Consumption to Per Capita Income Slope (Type I) No of Years Implied Growth
Assumed GDP Growth Rate of: 7% 8%
Trailing 3 Yrs
Growth 7% 8% Cars 5 4 13% 16% 28% Televisions 11 10 4% 21% 24% Telephone 11 10 37% 7% 9% Motor-cycles 5 5 22% 21% 17% Source: Morgan Stanley Research Exhibit 93 Real Private Consumption Growth
2%
4%
6%
8%
10%
12%
1987
1990
1993
1996
1999
2002
2005
China
India
% YoY, 3Yr MA
Source: CEIC, Morgan Stanley Research
Exhibit 94 Penetration Rates for Durable Products
(As of 2005) Penetration Rate (Per 1000 people)
Market Size (Annual Sales, mn)
China India China India Passenger Cars 14 10 3.2 1.1 Motorcycles 59 39 10.5 5.8 Cellular Subscribers 301 69 59 28 Internet Accounts/Subscribers 85 6 17 1.1 Televisions 416 104 87 12 Source: Euromonitor, Morgan Stanley Research Exhibit 95 Years Needed for India to Reach China’s Current Market Size If It Follows China's Consumption to Per Capita Income Slope (Type II) No of Years Implied Growth
Assumed GDP Growth Rate of: 7% 8%
Trailing 3 Yrs
Growth 7% 8% Cars 7 6 13% 5% 9% Televisions 11 10 4% 21% 24% Telephone 9 8 37% 12% 16% Motor-cycles 5 5 22% 17% 17% Source: Morgan Stanley Research Exhibit 96 Modern Retail Trade as % of Total
0%
18%
36%
54%
72%
90%
Hon
g Ko
ng
Kor
ea
Aust
ralia
Mal
aysi
a
Phili
ppin
es
Thai
land
Chi
na
Viet
nam
Indi
a
Source: AC Nielsen
74
JM MORGAN STANLEY
M O R G A N S T A N L E Y R E S E A R C H
June 2006 India and China: New Tigers of Asia – Part II
Investments: China’s Total Capex Is More than Four Times India’s China’s investment-to-GDP ratio is 1.6 times that of India: In 2005, China’s investment was 49% of GDP (US$1,082 billion)
while India’s was an estimated 30% of GDP (US$240 billion). The key driver for China’s high investment rate is a higher domestic savings rate. FDI accounts for about 5.5% of total investment in China versus 2.7% for India. Indeed, China’s capex to GDP is now 2.7 times that of the US and it accounts for about 11% of global investment.
Rising share in global capex: While the world investment to GDP ratio has been constant over the past 10 years, the ratios for India and China have increased; hence, the combined share for the two in global investment rose significantly to 13.4% in 2005 from 7.2% in 2000 and 3.0% in 1990.
China’s huge infrastructure bias: One of the major areas of difference in the capex of the two countries is in investment for infrastructure. In 2005, China infrastructure investments were an estimated US$201 billion (9.0% of GDP) compared with US$28 billion (3.6%) for India. Another key variation is in investment in property. In 2005, China’s investment in housing construction was US$224 billion (10.1% of GDP) versus an estimated US$33 billion (4.1%) in India.
Manufacturing, services and agriculture mix: Not surprisingly, while China’s investments are biased towards manufacturing, India’s investments are evenly spread between manufacturing and services. Both countries have cut the share of agriculture in total investment.
India’s poor penetration in fixed investment-dependent products: Steel and cement demand reflects the differences in spending on capex. China’s steel and cement demand is about 10.5 and 7.5 times that for India, respectively. However, the growth in demand for these products in India should accelerate as its investment-to-GDP ratio rises further, reflecting an improvement in savings to GDP.
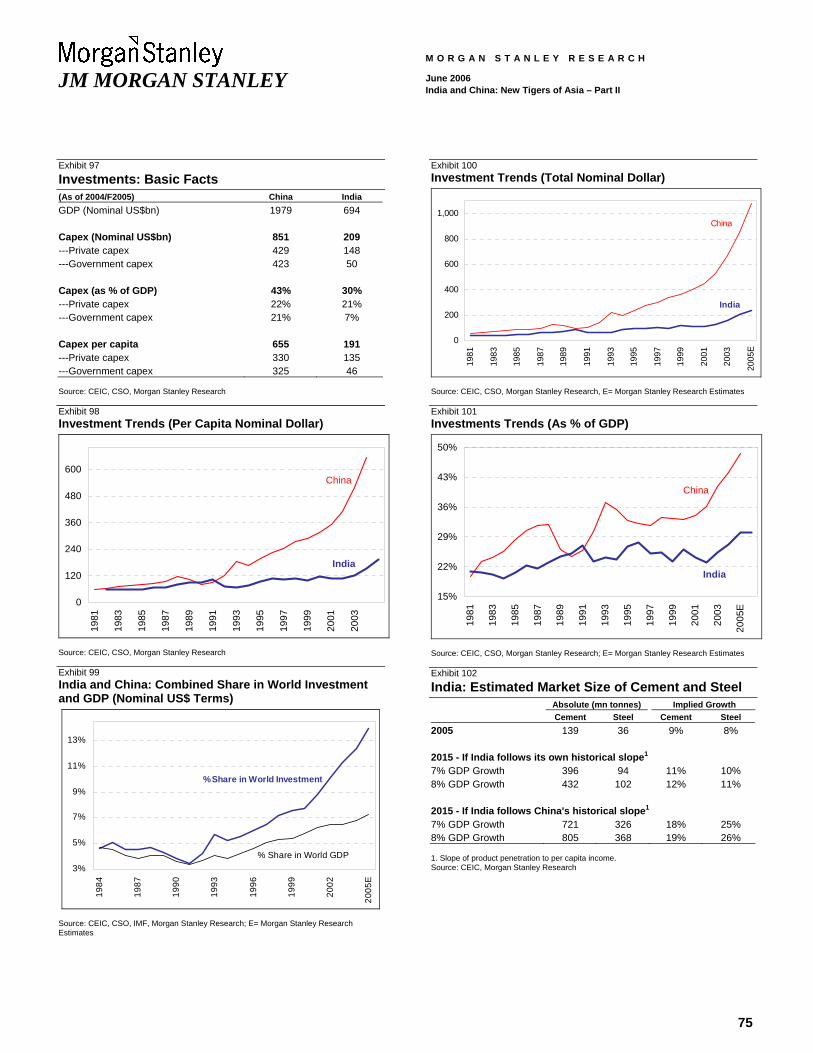
75
JM MORGAN STANLEY
M O R G A N S T A N L E Y R E S E A R C H
June 2006 India and China: New Tigers of Asia – Part II
Exhibit 97 Investments: Basic Facts (As of 2004/F2005) China India GDP (Nominal US$bn) 1979 694 Capex (Nominal US$bn) 851 209 ---Private capex 429 148 ---Government capex 423 50 Capex (as % of GDP) 43% 30% ---Private capex 22% 21% ---Government capex 21% 7% Capex per capita 655 191 ---Private capex 330 135 ---Government capex 325 46 Source: CEIC, CSO, Morgan Stanley Research Exhibit 98 Investment Trends (Per Capita Nominal Dollar)
0
120
240
360
480
600
1981
1983
1985
1987
1989
1991
1993
1995
1997
1999
2001
2003
China
India
Source: CEIC, CSO, Morgan Stanley Research Exhibit 99 India and China: Combined Share in World Investment and GDP (Nominal US$ Terms)
3%
5%
7%
9%
11%
13%
1984
1987
1990
1993
1996
1999
2002
2005
E
% Share in World GDP
% Share in World Investment
Source: CEIC, CSO, IMF, Morgan Stanley Research; E= Morgan Stanley Research Estimates
Exhibit 100 Investment Trends (Total Nominal Dollar)
0
200
400
600
800
1,000
1981
1983
1985
1987
1989
1991
1993
1995
1997
1999
2001
2003
2005
E
China
India
Source: CEIC, CSO, Morgan Stanley Research, E= Morgan Stanley Research Estimates Exhibit 101 Investments Trends (As % of GDP)
15%
22%
29%
36%
43%
50%
1981
1983
1985
1987
1989
1991
1993
1995
1997
1999
2001
2003
2005
E
China
India
Source: CEIC, CSO, Morgan Stanley Research; E= Morgan Stanley Research Estimates Exhibit 102 India: Estimated Market Size of Cement and Steel Absolute (mn tonnes) Implied Growth Cement Steel Cement Steel 2005 139 36 9% 8% 2015 - If India follows its own historical slope1 7% GDP Growth 396 94 11% 10% 8% GDP Growth 432 102 12% 11% 2015 - If India follows China's historical slope1 7% GDP Growth 721 326 18% 25% 8% GDP Growth 805 368 19% 26% 1. Slope of product penetration to per capita income. Source: CEIC, Morgan Stanley Research
76
JM MORGAN STANLEY
M O R G A N S T A N L E Y R E S E A R C H
June 2006 India and China: New Tigers of Asia – Part II
External Trade: China’s Share in Global Exports Is Six Times India’s India lags China substantially despite an improvement in the trend over the past few years: While India had a 2.2%
share of global goods exports in 1948, this position has been steadily eroded, reaching a low of 0.4% in 1981 and around 0.9% currently. Even if we consider services, India’s combined share in goods and services was 1.1% in 2005 versus 0.4% in 1990 and 1980. In contrast, China’s combined share in goods and services rose sharply to 6.6% in 2005 from 1.6% in 1990 and 0.9% in 1980.
India takes the lead in high-end commercial services: On an aggregate basis, China’s share in world commercial services exports is 3.3% versus India’s 2.3%. However, this includes tourism and transport revenues. China’s total services exports are about US$81 billion compared with US$57 billion for India. The mix, however, is very different. India has a bias toward scaleable IT software services and IT-enabled business process services (IT and ITES). IT and ITES currently account for 37% of India’s total services exports. We expect IT and ITES exports to rise to US$60 billion by 2010 from US$21 billion in 2005. Due to strong growth in IT and ITES, India’s commercial services exports have grown 29% a year in the past five years compared with 21% for China. We believe that India’s aggregate share in the global commercial services trade will start to outpace China’s share in the next five to six years.
Relatively less supportive business environment constrains India’s manufacturing: China’s success in manufacturing is well demonstrated by its 7.3% share of global goods exports compared with 0.9% for India in 2005. China’s goods exports recorded a CAGR of 18% from 1990 to 2005 versus India’s 11%. We believe that India needs a further overhaul of its manufacturing business environment to follow China’s lead in manufacturing. The key factors constraining manufacturing so far are lack of world-class infrastructure, rigid labor laws, inefficient tax laws and government interference.
With gradual implementation of reforms and a rise in its savings rate, India is beginning to make inroads into manufactured exports. India’s top ten exports are currently biased towards products that are high in labor intensity and natural resources (Quadrant I in Exhibit 108). However, incrementally, India’s exports will move towards high capital/infrastructure intensity sectors (Quadrant II and III in Exhibit 108). India is already beginning to compete well in complex manufacturing such as chemicals, engineering goods and machinery, automobiles and auto components.
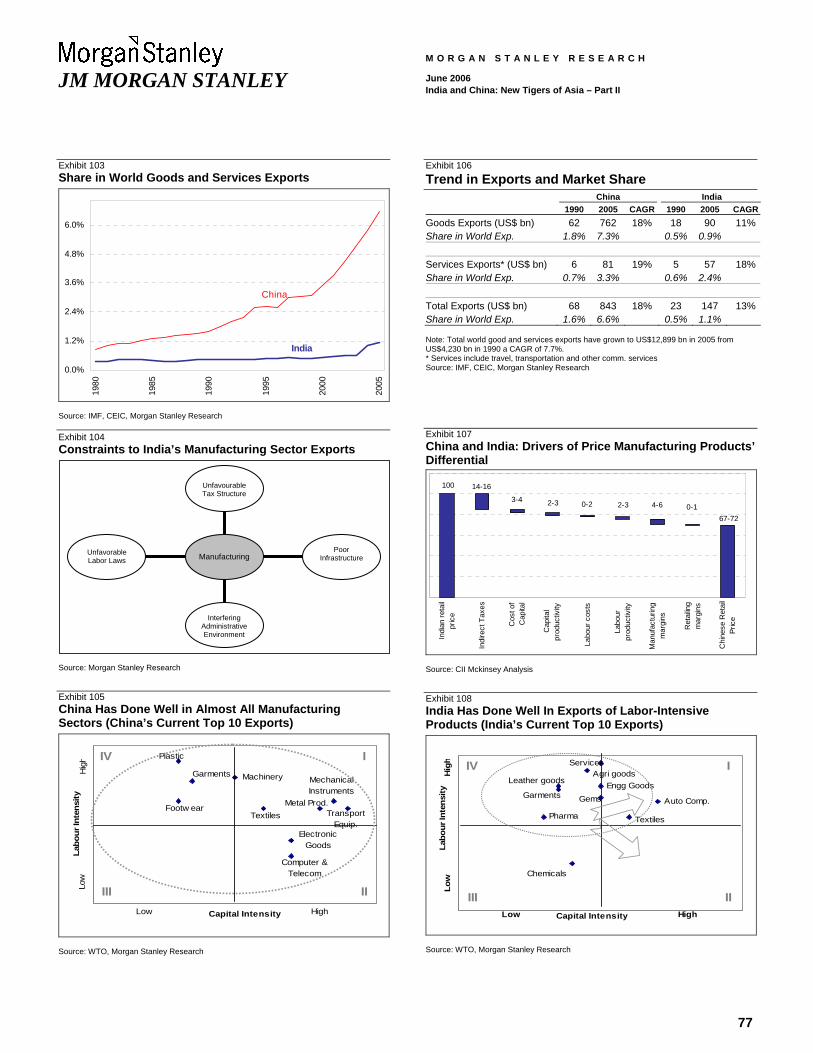
77
JM MORGAN STANLEY
M O R G A N S T A N L E Y R E S E A R C H
June 2006 India and China: New Tigers of Asia – Part II
Exhibit 103 Share in World Goods and Services Exports
0.0%
1.2%
2.4%
3.6%
4.8%
6.0%
1980
1985
1990
1995
2000
2005
China
India
Source: IMF, CEIC, Morgan Stanley Research Exhibit 104 Constraints to India’s Manufacturing Sector Exports
Source: Morgan Stanley Research Exhibit 105 China Has Done Well in Almost All Manufacturing Sectors (China’s Current Top 10 Exports)
Plastic
Garments
Footw ear
Machinery
Textiles
Electronic Goods
Computer & Telecom
Mechanical Instruments
Metal Prod.Transport
Equip.
Labo
ur In
tens
ity
Capital IntensityLow
Hig
hLo
w
High
I
IIIII
IV
Source: WTO, Morgan Stanley Research
Exhibit 106 Trend in Exports and Market Share China India 1990 2005 CAGR 1990 2005 CAGRGoods Exports (US$ bn) 62 762 18% 18 90 11%Share in World Exp. 1.8% 7.3% 0.5% 0.9% Services Exports* (US$ bn) 6 81 19% 5 57 18%Share in World Exp. 0.7% 3.3% 0.6% 2.4% Total Exports (US$ bn) 68 843 18% 23 147 13%Share in World Exp. 1.6% 6.6% 0.5% 1.1% Note: Total world good and services exports have grown to US$12,899 bn in 2005 from US$4,230 bn in 1990 a CAGR of 7.7%. * Services include travel, transportation and other comm. services Source: IMF, CEIC, Morgan Stanley Research Exhibit 107 China and India: Drivers of Price Manufacturing Products’ Differential
67-720-14-62-30-22-33-4
14-16100
Indi
an re
tail
pric
e
Indi
rect
Tax
es
Cos
t of
Cap
ital
Cap
ital
prod
uctiv
ity
Labo
ur c
osts
Labo
urpr
oduc
tivity
Man
ufac
turin
gm
argi
ns
Ret
ailin
gm
argi
ns
Chi
nese
Ret
ail
Pric
e
Source: CII Mckinsey Analysis Exhibit 108 India Has Done Well In Exports of Labor-Intensive Products (India’s Current Top 10 Exports)
ServicesAgri goods
Pharma
GemsGarmentsAuto Comp.
Chemicals
Leather goods
Textiles
Engg Goods
Labo
ur In
tens
ity
Capital IntensityLow
Hig
hLo
w
High
I
IIIII
IV
Source: WTO, Morgan Stanley Research
Unfavorable Labor Laws
Interfering Administrative Environment
Poor Infrastructure
Unfavourable Tax Structure
Manufacturing
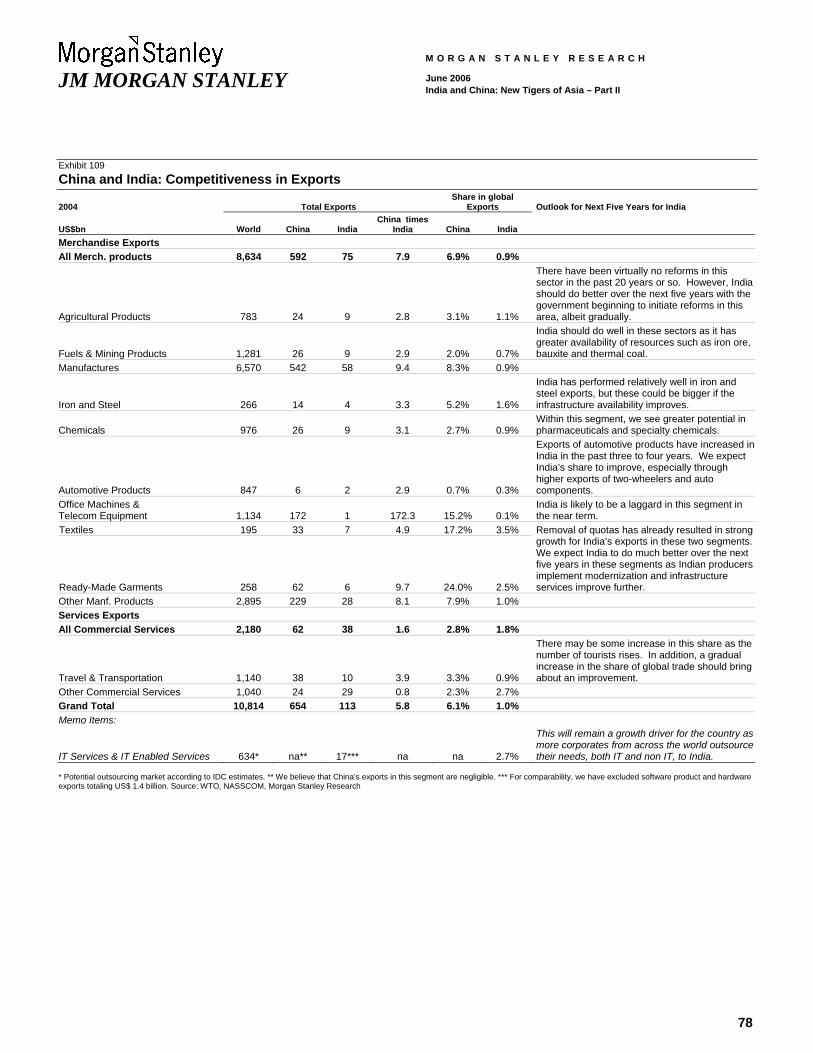
78
JM MORGAN STANLEY
M O R G A N S T A N L E Y R E S E A R C H
June 2006 India and China: New Tigers of Asia – Part II
Exhibit 109 China and India: Competitiveness in Exports
2004 Total Exports Share in global
Exports Outlook for Next Five Years for India
US$bn World China India China times
India China India Merchandise Exports All Merch. products 8,634 592 75 7.9 6.9% 0.9%
Agricultural Products 783 24 9 2.8 3.1% 1.1%
There have been virtually no reforms in this sector in the past 20 years or so. However, India should do better over the next five years with the government beginning to initiate reforms in this area, albeit gradually.
Fuels & Mining Products 1,281 26 9 2.9 2.0% 0.7%
India should do well in these sectors as it has greater availability of resources such as iron ore, bauxite and thermal coal.
Manufactures 6,570 542 58 9.4 8.3% 0.9%
Iron and Steel 266 14 4 3.3 5.2% 1.6%
India has performed relatively well in iron and steel exports, but these could be bigger if the infrastructure availability improves.
Chemicals 976 26 9 3.1 2.7% 0.9% Within this segment, we see greater potential in pharmaceuticals and specialty chemicals.
Automotive Products 847 6 2 2.9 0.7% 0.3%
Exports of automotive products have increased in India in the past three to four years. We expect India’s share to improve, especially through higher exports of two-wheelers and auto components.
Office Machines & Telecom Equipment 1,134 172 1 172.3 15.2% 0.1%
India is likely to be a laggard in this segment in the near term.
Textiles 195 33 7 4.9 17.2% 3.5%
Ready-Made Garments 258 62 6 9.7 24.0% 2.5%
Removal of quotas has already resulted in strong growth for India’s exports in these two segments. We expect India to do much better over the next five years in these segments as Indian producers implement modernization and infrastructure services improve further.
Other Manf. Products 2,895 229 28 8.1 7.9% 1.0% Services Exports All Commercial Services 2,180 62 38 1.6 2.8% 1.8%
Travel & Transportation 1,140 38 10 3.9 3.3% 0.9%
There may be some increase in this share as the number of tourists rises. In addition, a gradual increase in the share of global trade should bring about an improvement.
Other Commercial Services 1,040 24 29 0.8 2.3% 2.7% Grand Total 10,814 654 113 5.8 6.1% 1.0% Memo Items:
IT Services & IT Enabled Services 634* na** 17*** na na 2.7%
This will remain a growth driver for the country as more corporates from across the world outsource their needs, both IT and non IT, to India.
* Potential outsourcing market according to IDC estimates. ** We believe that China’s exports in this segment are negligible. *** For comparability, we have excluded software product and hardware exports totaling US$ 1.4 billion. Source: WTO, NASSCOM, Morgan Stanley Research

79
JM MORGAN STANLEY
M O R G A N S T A N L E Y R E S E A R C H
June 2006 India and China: New Tigers of Asia – Part II
Appendices
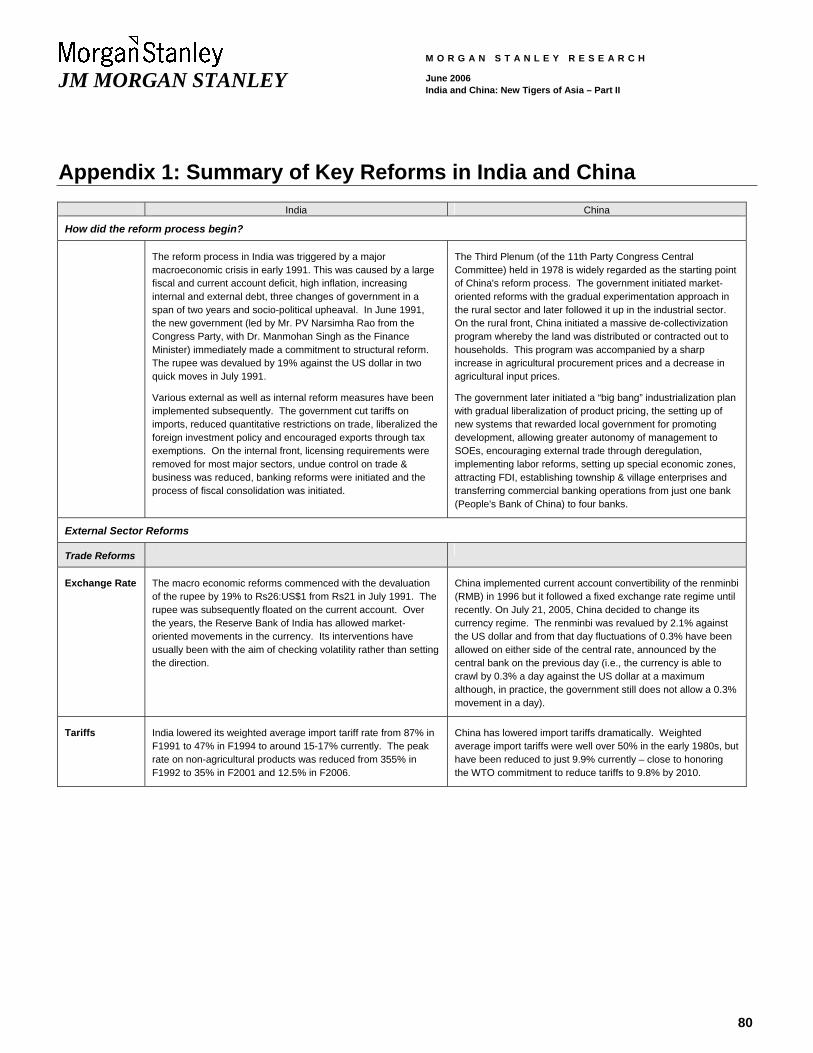
80
JM MORGAN STANLEY
M O R G A N S T A N L E Y R E S E A R C H
June 2006 India and China: New Tigers of Asia – Part II
Appendix 1: Summary of Key Reforms in India and China India China
How did the reform process begin?
The reform process in India was triggered by a major macroeconomic crisis in early 1991. This was caused by a large fiscal and current account deficit, high inflation, increasing internal and external debt, three changes of government in a span of two years and socio-political upheaval. In June 1991, the new government (led by Mr. PV Narsimha Rao from the Congress Party, with Dr. Manmohan Singh as the Finance Minister) immediately made a commitment to structural reform. The rupee was devalued by 19% against the US dollar in two quick moves in July 1991.
Various external as well as internal reform measures have been implemented subsequently. The government cut tariffs on imports, reduced quantitative restrictions on trade, liberalized the foreign investment policy and encouraged exports through tax exemptions. On the internal front, licensing requirements were removed for most major sectors, undue control on trade & business was reduced, banking reforms were initiated and the process of fiscal consolidation was initiated.
The Third Plenum (of the 11th Party Congress Central Committee) held in 1978 is widely regarded as the starting point of China's reform process. The government initiated market-oriented reforms with the gradual experimentation approach in the rural sector and later followed it up in the industrial sector. On the rural front, China initiated a massive de-collectivization program whereby the land was distributed or contracted out to households. This program was accompanied by a sharp increase in agricultural procurement prices and a decrease in agricultural input prices.
The government later initiated a “big bang” industrialization plan with gradual liberalization of product pricing, the setting up of new systems that rewarded local government for promoting development, allowing greater autonomy of management to SOEs, encouraging external trade through deregulation, implementing labor reforms, setting up special economic zones, attracting FDI, establishing township & village enterprises and transferring commercial banking operations from just one bank (People's Bank of China) to four banks.
External Sector Reforms
Trade Reforms
Exchange Rate The macro economic reforms commenced with the devaluation of the rupee by 19% to Rs26:US$1 from Rs21 in July 1991. The rupee was subsequently floated on the current account. Over the years, the Reserve Bank of India has allowed market-oriented movements in the currency. Its interventions have usually been with the aim of checking volatility rather than setting the direction.
China implemented current account convertibility of the renminbi (RMB) in 1996 but it followed a fixed exchange rate regime until recently. On July 21, 2005, China decided to change its currency regime. The renminbi was revalued by 2.1% against the US dollar and from that day fluctuations of 0.3% have been allowed on either side of the central rate, announced by the central bank on the previous day (i.e., the currency is able to crawl by 0.3% a day against the US dollar at a maximum although, in practice, the government still does not allow a 0.3% movement in a day).
Tariffs India lowered its weighted average import tariff rate from 87% in F1991 to 47% in F1994 to around 15-17% currently. The peak rate on non-agricultural products was reduced from 355% in F1992 to 35% in F2001 and 12.5% in F2006.
China has lowered import tariffs dramatically. Weighted average import tariffs were well over 50% in the early 1980s, but have been reduced to just 9.9% currently – close to honoring the WTO commitment to reduce tariffs to 9.8% by 2010.
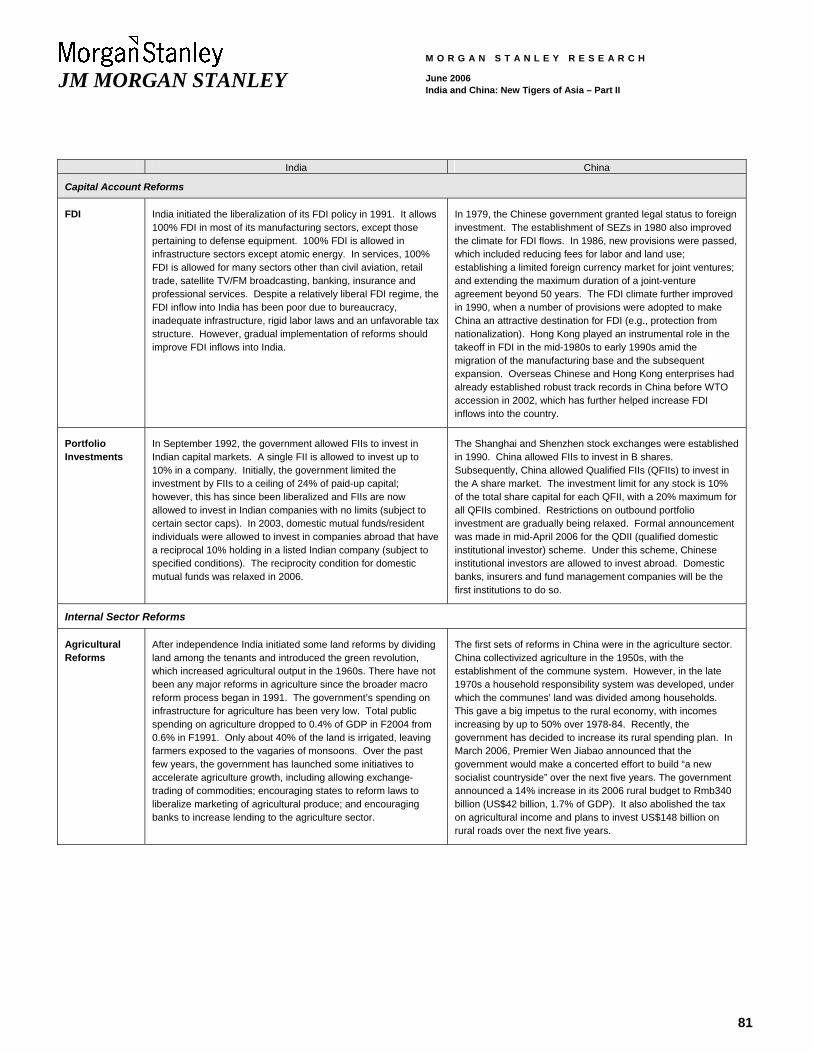
81
JM MORGAN STANLEY
M O R G A N S T A N L E Y R E S E A R C H
June 2006 India and China: New Tigers of Asia – Part II
India China
Capital Account Reforms
FDI India initiated the liberalization of its FDI policy in 1991. It allows 100% FDI in most of its manufacturing sectors, except those pertaining to defense equipment. 100% FDI is allowed in infrastructure sectors except atomic energy. In services, 100% FDI is allowed for many sectors other than civil aviation, retail trade, satellite TV/FM broadcasting, banking, insurance and professional services. Despite a relatively liberal FDI regime, the FDI inflow into India has been poor due to bureaucracy, inadequate infrastructure, rigid labor laws and an unfavorable tax structure. However, gradual implementation of reforms should improve FDI inflows into India.
In 1979, the Chinese government granted legal status to foreign investment. The establishment of SEZs in 1980 also improved the climate for FDI flows. In 1986, new provisions were passed, which included reducing fees for labor and land use; establishing a limited foreign currency market for joint ventures; and extending the maximum duration of a joint-venture agreement beyond 50 years. The FDI climate further improved in 1990, when a number of provisions were adopted to make China an attractive destination for FDI (e.g., protection from nationalization). Hong Kong played an instrumental role in the takeoff in FDI in the mid-1980s to early 1990s amid the migration of the manufacturing base and the subsequent expansion. Overseas Chinese and Hong Kong enterprises had already established robust track records in China before WTO accession in 2002, which has further helped increase FDI inflows into the country.
Portfolio Investments
In September 1992, the government allowed FIIs to invest in Indian capital markets. A single FII is allowed to invest up to 10% in a company. Initially, the government limited the investment by FIIs to a ceiling of 24% of paid-up capital; however, this has since been liberalized and FIIs are now allowed to invest in Indian companies with no limits (subject to certain sector caps). In 2003, domestic mutual funds/resident individuals were allowed to invest in companies abroad that have a reciprocal 10% holding in a listed Indian company (subject to specified conditions). The reciprocity condition for domestic mutual funds was relaxed in 2006.
The Shanghai and Shenzhen stock exchanges were established in 1990. China allowed FIIs to invest in B shares. Subsequently, China allowed Qualified FIIs (QFIIs) to invest in the A share market. The investment limit for any stock is 10% of the total share capital for each QFII, with a 20% maximum for all QFIIs combined. Restrictions on outbound portfolio investment are gradually being relaxed. Formal announcement was made in mid-April 2006 for the QDII (qualified domestic institutional investor) scheme. Under this scheme, Chinese institutional investors are allowed to invest abroad. Domestic banks, insurers and fund management companies will be the first institutions to do so.
Internal Sector Reforms
Agricultural Reforms
After independence India initiated some land reforms by dividing land among the tenants and introduced the green revolution, which increased agricultural output in the 1960s. There have not been any major reforms in agriculture since the broader macro reform process began in 1991. The government’s spending on infrastructure for agriculture has been very low. Total public spending on agriculture dropped to 0.4% of GDP in F2004 from 0.6% in F1991. Only about 40% of the land is irrigated, leaving farmers exposed to the vagaries of monsoons. Over the past few years, the government has launched some initiatives to accelerate agriculture growth, including allowing exchange-trading of commodities; encouraging states to reform laws to liberalize marketing of agricultural produce; and encouraging banks to increase lending to the agriculture sector.
The first sets of reforms in China were in the agriculture sector. China collectivized agriculture in the 1950s, with the establishment of the commune system. However, in the late 1970s a household responsibility system was developed, under which the communes’ land was divided among households. This gave a big impetus to the rural economy, with incomes increasing by up to 50% over 1978-84. Recently, the government has decided to increase its rural spending plan. In March 2006, Premier Wen Jiabao announced that the government would make a concerted effort to build “a new socialist countryside” over the next five years. The government announced a 14% increase in its 2006 rural budget to Rmb340 billion (US$42 billion, 1.7% of GDP). It also abolished the tax on agricultural income and plans to invest US$148 billion on rural roads over the next five years.
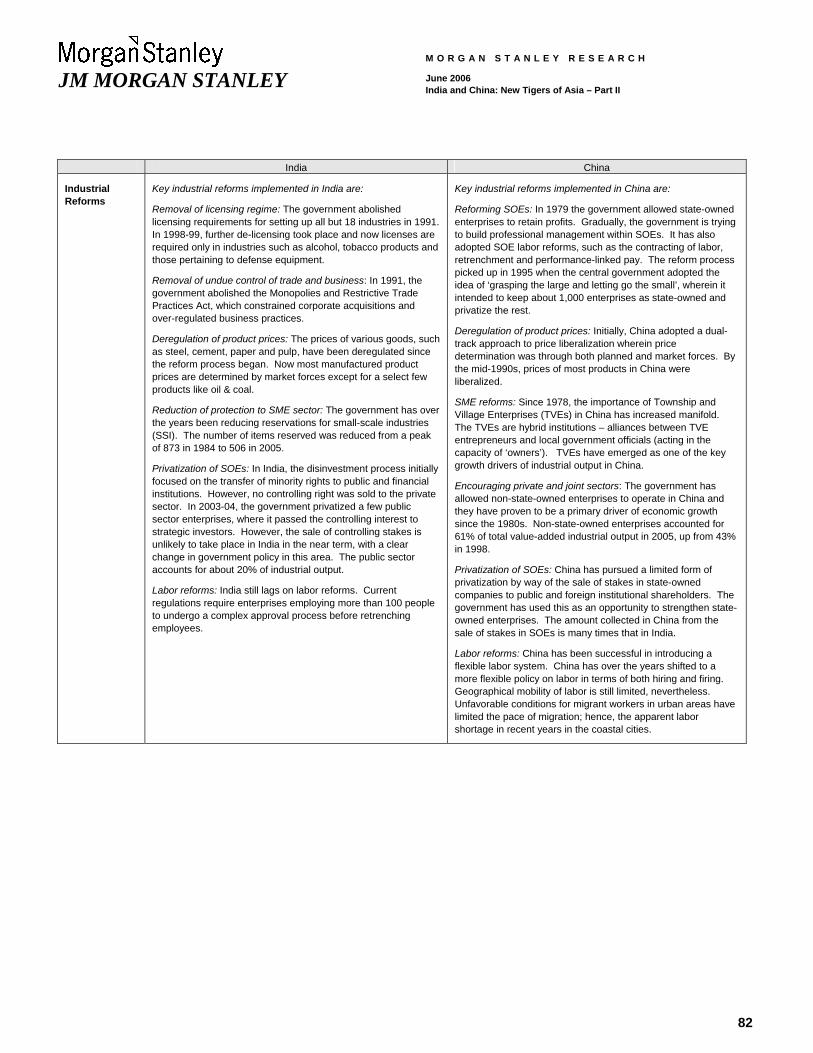
82
JM MORGAN STANLEY
M O R G A N S T A N L E Y R E S E A R C H
June 2006 India and China: New Tigers of Asia – Part II
India China
Industrial Reforms
Key industrial reforms implemented in India are:
Removal of licensing regime: The government abolished licensing requirements for setting up all but 18 industries in 1991. In 1998-99, further de-licensing took place and now licenses are required only in industries such as alcohol, tobacco products and those pertaining to defense equipment.
Removal of undue control of trade and business: In 1991, the government abolished the Monopolies and Restrictive Trade Practices Act, which constrained corporate acquisitions and over-regulated business practices.
Deregulation of product prices: The prices of various goods, such as steel, cement, paper and pulp, have been deregulated since the reform process began. Now most manufactured product prices are determined by market forces except for a select few products like oil & coal.
Reduction of protection to SME sector: The government has over the years been reducing reservations for small-scale industries (SSI). The number of items reserved was reduced from a peak of 873 in 1984 to 506 in 2005.
Privatization of SOEs: In India, the disinvestment process initially focused on the transfer of minority rights to public and financial institutions. However, no controlling right was sold to the private sector. In 2003-04, the government privatized a few public sector enterprises, where it passed the controlling interest to strategic investors. However, the sale of controlling stakes is unlikely to take place in India in the near term, with a clear change in government policy in this area. The public sector accounts for about 20% of industrial output.
Labor reforms: India still lags on labor reforms. Current regulations require enterprises employing more than 100 people to undergo a complex approval process before retrenching employees.
Key industrial reforms implemented in China are:
Reforming SOEs: In 1979 the government allowed state-owned enterprises to retain profits. Gradually, the government is trying to build professional management within SOEs. It has also adopted SOE labor reforms, such as the contracting of labor, retrenchment and performance-linked pay. The reform process picked up in 1995 when the central government adopted the idea of ‘grasping the large and letting go the small’, wherein it intended to keep about 1,000 enterprises as state-owned and privatize the rest.
Deregulation of product prices: Initially, China adopted a dual-track approach to price liberalization wherein price determination was through both planned and market forces. By the mid-1990s, prices of most products in China were liberalized.
SME reforms: Since 1978, the importance of Township and Village Enterprises (TVEs) in China has increased manifold. The TVEs are hybrid institutions – alliances between TVE entrepreneurs and local government officials (acting in the capacity of ‘owners’). TVEs have emerged as one of the key growth drivers of industrial output in China.
Encouraging private and joint sectors: The government has allowed non-state-owned enterprises to operate in China and they have proven to be a primary driver of economic growth since the 1980s. Non-state-owned enterprises accounted for 61% of total value-added industrial output in 2005, up from 43% in 1998.
Privatization of SOEs: China has pursued a limited form of privatization by way of the sale of stakes in state-owned companies to public and foreign institutional shareholders. The government has used this as an opportunity to strengthen state-owned enterprises. The amount collected in China from the sale of stakes in SOEs is many times that in India.
Labor reforms: China has been successful in introducing a flexible labor system. China has over the years shifted to a more flexible policy on labor in terms of both hiring and firing. Geographical mobility of labor is still limited, nevertheless. Unfavorable conditions for migrant workers in urban areas have limited the pace of migration; hence, the apparent labor shortage in recent years in the coastal cities.
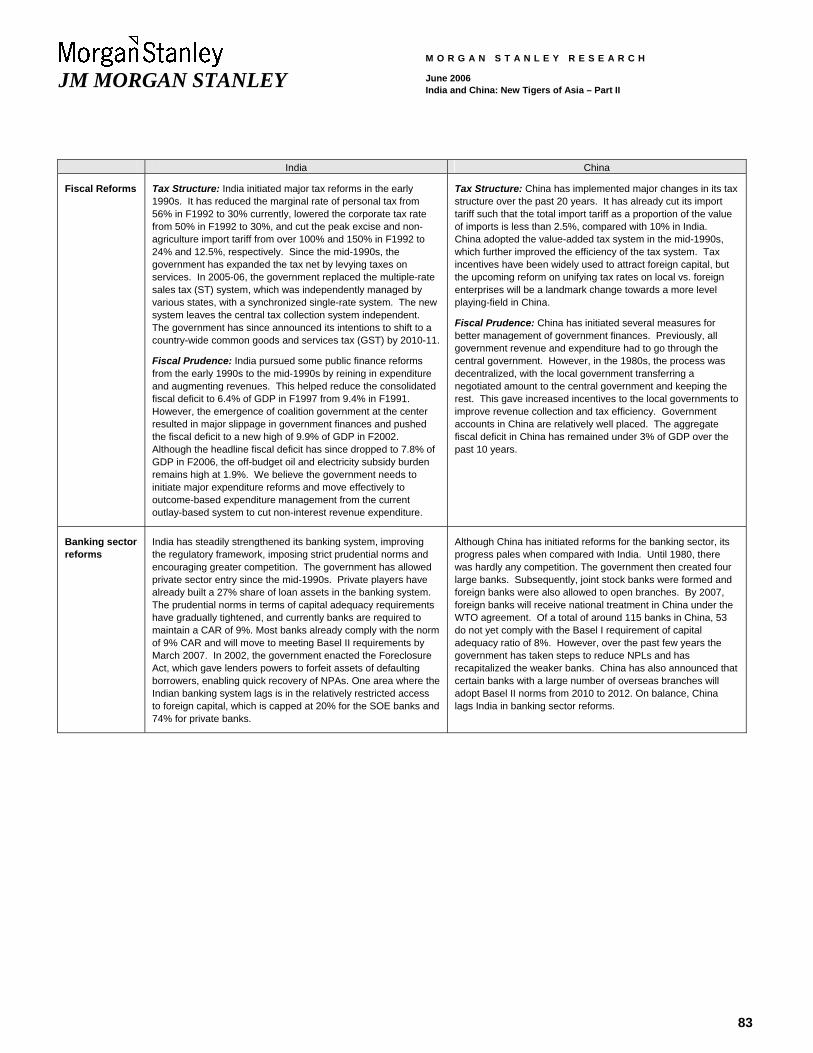
83
JM MORGAN STANLEY
M O R G A N S T A N L E Y R E S E A R C H
June 2006 India and China: New Tigers of Asia – Part II
India China
Fiscal Reforms Tax Structure: India initiated major tax reforms in the early 1990s. It has reduced the marginal rate of personal tax from 56% in F1992 to 30% currently, lowered the corporate tax rate from 50% in F1992 to 30%, and cut the peak excise and non-agriculture import tariff from over 100% and 150% in F1992 to 24% and 12.5%, respectively. Since the mid-1990s, the government has expanded the tax net by levying taxes on services. In 2005-06, the government replaced the multiple-rate sales tax (ST) system, which was independently managed by various states, with a synchronized single-rate system. The new system leaves the central tax collection system independent. The government has since announced its intentions to shift to a country-wide common goods and services tax (GST) by 2010-11.
Fiscal Prudence: India pursued some public finance reforms from the early 1990s to the mid-1990s by reining in expenditure and augmenting revenues. This helped reduce the consolidated fiscal deficit to 6.4% of GDP in F1997 from 9.4% in F1991. However, the emergence of coalition government at the center resulted in major slippage in government finances and pushed the fiscal deficit to a new high of 9.9% of GDP in F2002. Although the headline fiscal deficit has since dropped to 7.8% of GDP in F2006, the off-budget oil and electricity subsidy burden remains high at 1.9%. We believe the government needs to initiate major expenditure reforms and move effectively to outcome-based expenditure management from the current outlay-based system to cut non-interest revenue expenditure.
Tax Structure: China has implemented major changes in its tax structure over the past 20 years. It has already cut its import tariff such that the total import tariff as a proportion of the value of imports is less than 2.5%, compared with 10% in India. China adopted the value-added tax system in the mid-1990s, which further improved the efficiency of the tax system. Tax incentives have been widely used to attract foreign capital, but the upcoming reform on unifying tax rates on local vs. foreign enterprises will be a landmark change towards a more level playing-field in China.
Fiscal Prudence: China has initiated several measures for better management of government finances. Previously, all government revenue and expenditure had to go through the central government. However, in the 1980s, the process was decentralized, with the local government transferring a negotiated amount to the central government and keeping the rest. This gave increased incentives to the local governments to improve revenue collection and tax efficiency. Government accounts in China are relatively well placed. The aggregate fiscal deficit in China has remained under 3% of GDP over the past 10 years.
Banking sector reforms
India has steadily strengthened its banking system, improving the regulatory framework, imposing strict prudential norms and encouraging greater competition. The government has allowed private sector entry since the mid-1990s. Private players have already built a 27% share of loan assets in the banking system. The prudential norms in terms of capital adequacy requirements have gradually tightened, and currently banks are required to maintain a CAR of 9%. Most banks already comply with the norm of 9% CAR and will move to meeting Basel II requirements by March 2007. In 2002, the government enacted the Foreclosure Act, which gave lenders powers to forfeit assets of defaulting borrowers, enabling quick recovery of NPAs. One area where the Indian banking system lags is in the relatively restricted access to foreign capital, which is capped at 20% for the SOE banks and 74% for private banks.
Although China has initiated reforms for the banking sector, its progress pales when compared with India. Until 1980, there was hardly any competition. The government then created four large banks. Subsequently, joint stock banks were formed and foreign banks were also allowed to open branches. By 2007, foreign banks will receive national treatment in China under the WTO agreement. Of a total of around 115 banks in China, 53 do not yet comply with the Basel I requirement of capital adequacy ratio of 8%. However, over the past few years the government has taken steps to reduce NPLs and has recapitalized the weaker banks. China has also announced that certain banks with a large number of overseas branches will adopt Basel II norms from 2010 to 2012. On balance, China lags India in banking sector reforms.
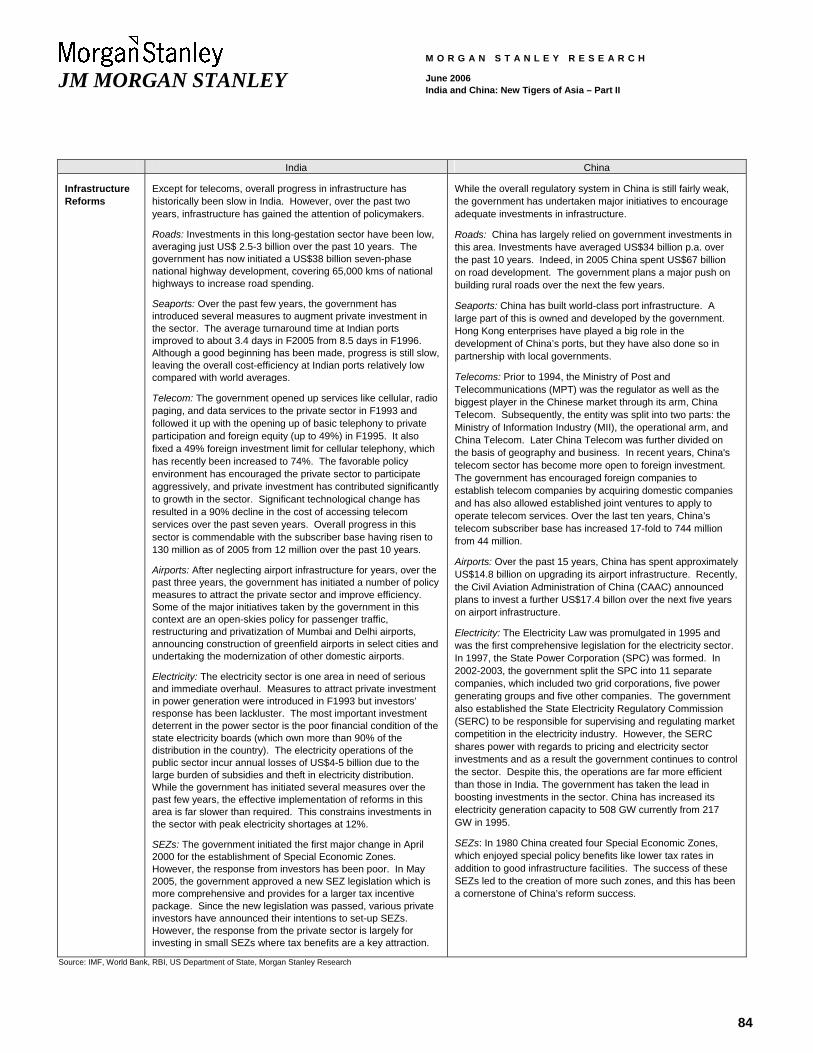
84
JM MORGAN STANLEY
M O R G A N S T A N L E Y R E S E A R C H
June 2006 India and China: New Tigers of Asia – Part II
India China
Infrastructure Reforms
Except for telecoms, overall progress in infrastructure has historically been slow in India. However, over the past two years, infrastructure has gained the attention of policymakers.
Roads: Investments in this long-gestation sector have been low, averaging just US$ 2.5-3 billion over the past 10 years. The government has now initiated a US$38 billion seven-phase national highway development, covering 65,000 kms of national highways to increase road spending.
Seaports: Over the past few years, the government has introduced several measures to augment private investment in the sector. The average turnaround time at Indian ports improved to about 3.4 days in F2005 from 8.5 days in F1996. Although a good beginning has been made, progress is still slow, leaving the overall cost-efficiency at Indian ports relatively low compared with world averages.
Telecom: The government opened up services like cellular, radio paging, and data services to the private sector in F1993 and followed it up with the opening up of basic telephony to private participation and foreign equity (up to 49%) in F1995. It also fixed a 49% foreign investment limit for cellular telephony, which has recently been increased to 74%. The favorable policy environment has encouraged the private sector to participate aggressively, and private investment has contributed significantly to growth in the sector. Significant technological change has resulted in a 90% decline in the cost of accessing telecom services over the past seven years. Overall progress in this sector is commendable with the subscriber base having risen to 130 million as of 2005 from 12 million over the past 10 years.
Airports: After neglecting airport infrastructure for years, over the past three years, the government has initiated a number of policy measures to attract the private sector and improve efficiency. Some of the major initiatives taken by the government in this context are an open-skies policy for passenger traffic, restructuring and privatization of Mumbai and Delhi airports, announcing construction of greenfield airports in select cities and undertaking the modernization of other domestic airports.
Electricity: The electricity sector is one area in need of serious and immediate overhaul. Measures to attract private investment in power generation were introduced in F1993 but investors’ response has been lackluster. The most important investment deterrent in the power sector is the poor financial condition of the state electricity boards (which own more than 90% of the distribution in the country). The electricity operations of the public sector incur annual losses of US$4-5 billion due to the large burden of subsidies and theft in electricity distribution. While the government has initiated several measures over the past few years, the effective implementation of reforms in this area is far slower than required. This constrains investments in the sector with peak electricity shortages at 12%.
SEZs: The government initiated the first major change in April 2000 for the establishment of Special Economic Zones. However, the response from investors has been poor. In May 2005, the government approved a new SEZ legislation which is more comprehensive and provides for a larger tax incentive package. Since the new legislation was passed, various private investors have announced their intentions to set-up SEZs. However, the response from the private sector is largely for investing in small SEZs where tax benefits are a key attraction.
While the overall regulatory system in China is still fairly weak, the government has undertaken major initiatives to encourage adequate investments in infrastructure.
Roads: China has largely relied on government investments in this area. Investments have averaged US$34 billion p.a. over the past 10 years. Indeed, in 2005 China spent US$67 billion on road development. The government plans a major push on building rural roads over the next the few years.
Seaports: China has built world-class port infrastructure. A large part of this is owned and developed by the government. Hong Kong enterprises have played a big role in the development of China’s ports, but they have also done so in partnership with local governments.
Telecoms: Prior to 1994, the Ministry of Post and Telecommunications (MPT) was the regulator as well as the biggest player in the Chinese market through its arm, China Telecom. Subsequently, the entity was split into two parts: the Ministry of Information Industry (MII), the operational arm, and China Telecom. Later China Telecom was further divided on the basis of geography and business. In recent years, China's telecom sector has become more open to foreign investment. The government has encouraged foreign companies to establish telecom companies by acquiring domestic companies and has also allowed established joint ventures to apply to operate telecom services. Over the last ten years, China’s telecom subscriber base has increased 17-fold to 744 million from 44 million.
Airports: Over the past 15 years, China has spent approximately US$14.8 billion on upgrading its airport infrastructure. Recently, the Civil Aviation Administration of China (CAAC) announced plans to invest a further US$17.4 billon over the next five years on airport infrastructure.
Electricity: The Electricity Law was promulgated in 1995 and was the first comprehensive legislation for the electricity sector. In 1997, the State Power Corporation (SPC) was formed. In 2002-2003, the government split the SPC into 11 separate companies, which included two grid corporations, five power generating groups and five other companies. The government also established the State Electricity Regulatory Commission (SERC) to be responsible for supervising and regulating market competition in the electricity industry. However, the SERC shares power with regards to pricing and electricity sector investments and as a result the government continues to control the sector. Despite this, the operations are far more efficient than those in India. The government has taken the lead in boosting investments in the sector. China has increased its electricity generation capacity to 508 GW currently from 217 GW in 1995.
SEZs: In 1980 China created four Special Economic Zones, which enjoyed special policy benefits like lower tax rates in addition to good infrastructure facilities. The success of these SEZs led to the creation of more such zones, and this has been a cornerstone of China’s reform success.
Source: IMF, World Bank, RBI, US Department of State, Morgan Stanley Research
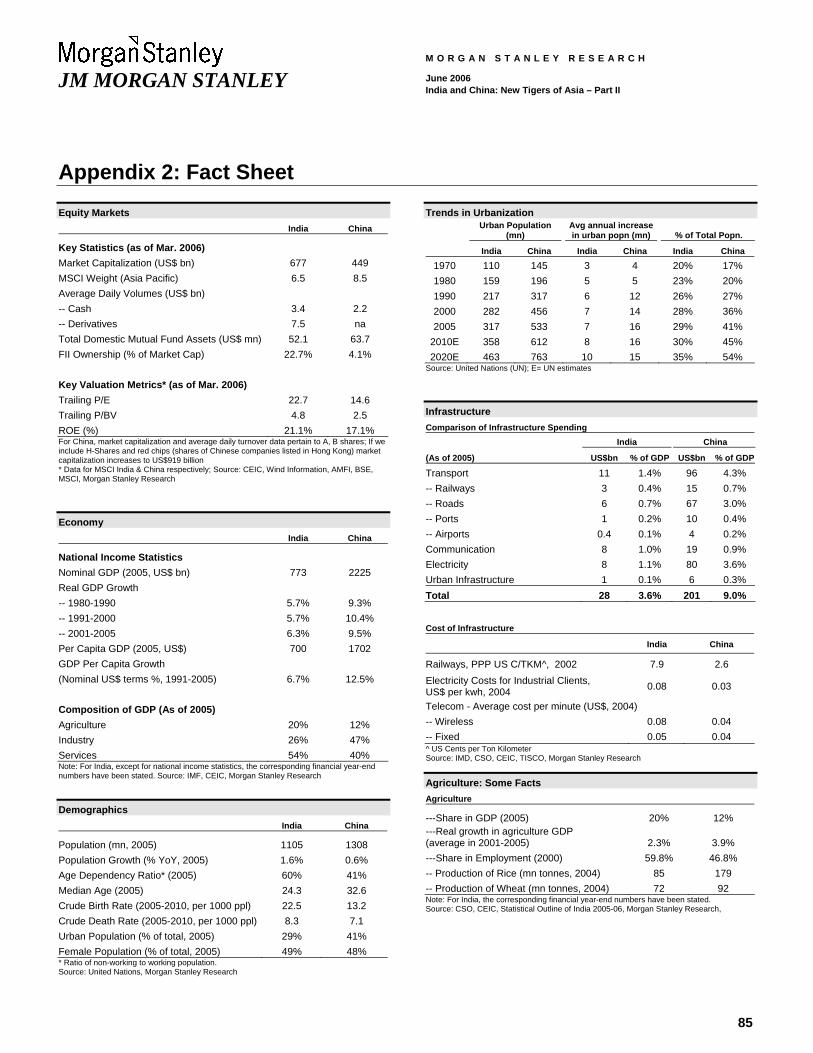
85
JM MORGAN STANLEY
M O R G A N S T A N L E Y R E S E A R C H
June 2006 India and China: New Tigers of Asia – Part II
Appendix 2: Fact Sheet Equity Markets India China
Key Statistics (as of Mar. 2006) Market Capitalization (US$ bn) 677 449 MSCI Weight (Asia Pacific) 6.5 8.5 Average Daily Volumes (US$ bn) -- Cash 3.4 2.2 -- Derivatives 7.5 na Total Domestic Mutual Fund Assets (US$ mn) 52.1 63.7 FII Ownership (% of Market Cap) 22.7% 4.1% Key Valuation Metrics* (as of Mar. 2006) Trailing P/E 22.7 14.6 Trailing P/BV 4.8 2.5 ROE (%) 21.1% 17.1% For China, market capitalization and average daily turnover data pertain to A, B shares; If we include H-Shares and red chips (shares of Chinese companies listed in Hong Kong) market capitalization increases to US$919 billion * Data for MSCI India & China respectively; Source: CEIC, Wind Information, AMFI, BSE, MSCI, Morgan Stanley Research
Economy India China
National Income Statistics Nominal GDP (2005, US$ bn) 773 2225 Real GDP Growth -- 1980-1990 5.7% 9.3% -- 1991-2000 5.7% 10.4% -- 2001-2005 6.3% 9.5% Per Capita GDP (2005, US$) 700 1702 GDP Per Capita Growth (Nominal US$ terms %, 1991-2005) 6.7% 12.5% Composition of GDP (As of 2005) Agriculture 20% 12% Industry 26% 47% Services 54% 40% Note: For India, except for national income statistics, the corresponding financial year-end numbers have been stated. Source: IMF, CEIC, Morgan Stanley Research
Demographics India China
Population (mn, 2005) 1105 1308 Population Growth (% YoY, 2005) 1.6% 0.6% Age Dependency Ratio* (2005) 60% 41% Median Age (2005) 24.3 32.6 Crude Birth Rate (2005-2010, per 1000 ppl) 22.5 13.2 Crude Death Rate (2005-2010, per 1000 ppl) 8.3 7.1 Urban Population (% of total, 2005) 29% 41% Female Population (% of total, 2005) 49% 48% * Ratio of non-working to working population. Source: United Nations, Morgan Stanley Research
Trends in Urbanization
Urban Population
(mn) Avg annual increase in urban popn (mn) % of Total Popn.
India China India China India China 1970 110 145 3 4 20% 17% 1980 159 196 5 5 23% 20% 1990 217 317 6 12 26% 27% 2000 282 456 7 14 28% 36% 2005 317 533 7 16 29% 41%
2010E 358 612 8 16 30% 45% 2020E 463 763 10 15 35% 54%
Source: United Nations (UN); E= UN estimates
Infrastructure Comparison of Infrastructure Spending
India China
(As of 2005) US$bn % of GDP US$bn % of GDP
Transport 11 1.4% 96 4.3% -- Railways 3 0.4% 15 0.7% -- Roads 6 0.7% 67 3.0% -- Ports 1 0.2% 10 0.4% -- Airports 0.4 0.1% 4 0.2% Communication 8 1.0% 19 0.9% Electricity 8 1.1% 80 3.6% Urban Infrastructure 1 0.1% 6 0.3% Total 28 3.6% 201 9.0% Cost of Infrastructure
India China
Railways, PPP US C/TKM^, 2002 7.9 2.6 Electricity Costs for Industrial Clients, US$ per kwh, 2004 0.08 0.03
Telecom - Average cost per minute (US$, 2004) -- Wireless 0.08 0.04 -- Fixed 0.05 0.04 ^ US Cents per Ton Kilometer Source: IMD, CSO, CEIC, TISCO, Morgan Stanley Research
Agriculture: Some Facts Agriculture
---Share in GDP (2005) 20% 12% ---Real growth in agriculture GDP (average in 2001-2005) 2.3% 3.9% ---Share in Employment (2000) 59.8% 46.8% -- Production of Rice (mn tonnes, 2004) 85 179 -- Production of Wheat (mn tonnes, 2004) 72 92 Note: For India, the corresponding financial year-end numbers have been stated. Source: CSO, CEIC, Statistical Outline of India 2005-06, Morgan Stanley Research,
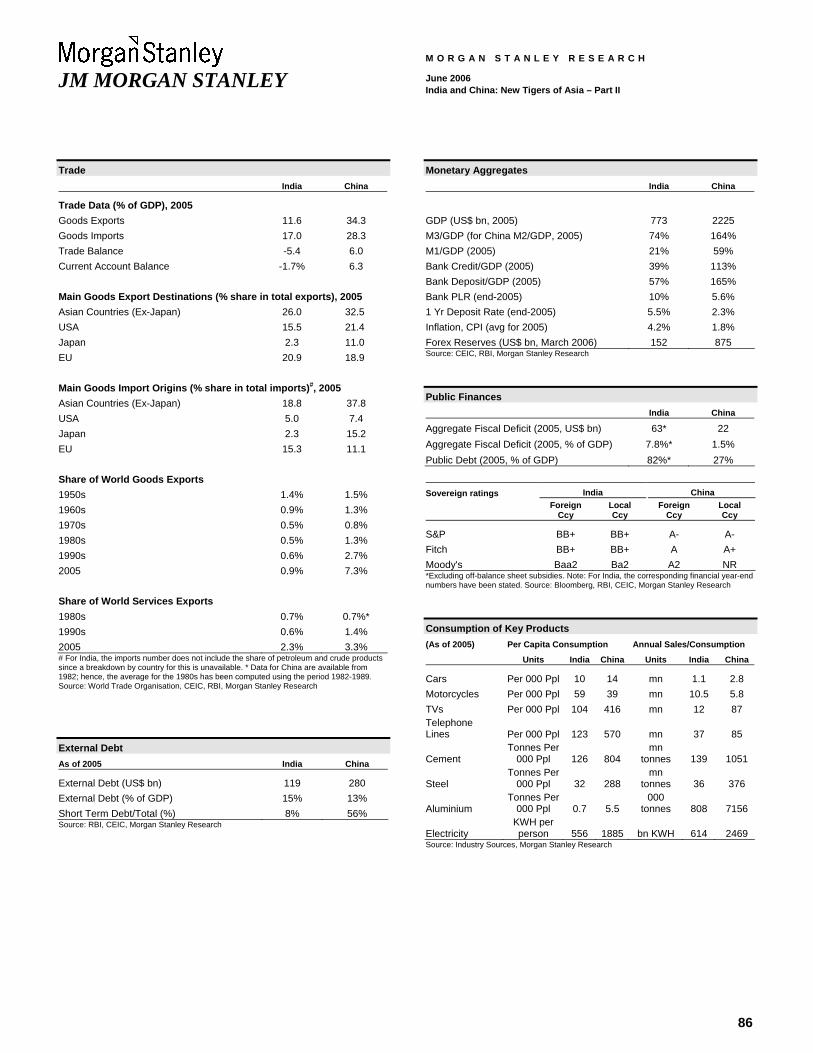
86
JM MORGAN STANLEY
M O R G A N S T A N L E Y R E S E A R C H
June 2006 India and China: New Tigers of Asia – Part II
Trade India China
Trade Data (% of GDP), 2005 Goods Exports 11.6 34.3 Goods Imports 17.0 28.3 Trade Balance -5.4 6.0 Current Account Balance -1.7% 6.3 Main Goods Export Destinations (% share in total exports), 2005 Asian Countries (Ex-Japan) 26.0 32.5 USA 15.5 21.4 Japan 2.3 11.0 EU 20.9 18.9 Main Goods Import Origins (% share in total imports)#, 2005 Asian Countries (Ex-Japan) 18.8 37.8 USA 5.0 7.4 Japan 2.3 15.2 EU 15.3 11.1 Share of World Goods Exports 1950s 1.4% 1.5% 1960s 0.9% 1.3% 1970s 0.5% 0.8% 1980s 0.5% 1.3% 1990s 0.6% 2.7% 2005 0.9% 7.3% Share of World Services Exports 1980s 0.7% 0.7%* 1990s 0.6% 1.4% 2005 2.3% 3.3% # For India, the imports number does not include the share of petroleum and crude products since a breakdown by country for this is unavailable. * Data for China are available from 1982; hence, the average for the 1980s has been computed using the period 1982-1989. Source: World Trade Organisation, CEIC, RBI, Morgan Stanley Research
External Debt As of 2005 India China
External Debt (US$ bn) 119 280 External Debt (% of GDP) 15% 13% Short Term Debt/Total (%) 8% 56% Source: RBI, CEIC, Morgan Stanley Research
Monetary Aggregates India China
GDP (US$ bn, 2005) 773 2225 M3/GDP (for China M2/GDP, 2005) 74% 164% M1/GDP (2005) 21% 59% Bank Credit/GDP (2005) 39% 113% Bank Deposit/GDP (2005) 57% 165% Bank PLR (end-2005) 10% 5.6% 1 Yr Deposit Rate (end-2005) 5.5% 2.3% Inflation, CPI (avg for 2005) 4.2% 1.8% Forex Reserves (US$ bn, March 2006) 152 875 Source: CEIC, RBI, Morgan Stanley Research
Public Finances India China
Aggregate Fiscal Deficit (2005, US$ bn) 63* 22 Aggregate Fiscal Deficit (2005, % of GDP) 7.8%* 1.5% Public Debt (2005, % of GDP) 82%* 27% Sovereign ratings India China
Foreign
Ccy Local Ccy
Foreign Ccy
Local Ccy
S&P BB+ BB+ A- A- Fitch BB+ BB+ A A+ Moody's Baa2 Ba2 A2 NR *Excluding off-balance sheet subsidies. Note: For India, the corresponding financial year-end numbers have been stated. Source: Bloomberg, RBI, CEIC, Morgan Stanley Research
Consumption of Key Products (As of 2005) Per Capita Consumption Annual Sales/Consumption
Units India China Units India China
Cars Per 000 Ppl 10 14 mn 1.1 2.8 Motorcycles Per 000 Ppl 59 39 mn 10.5 5.8 TVs Per 000 Ppl 104 416 mn 12 87 Telephone Lines Per 000 Ppl 123 570 mn 37 85
Cement Tonnes Per
000 Ppl 126 804 mn
tonnes 139 1051
Steel Tonnes Per
000 Ppl 32 288 mn
tonnes 36 376
Aluminium Tonnes Per
000 Ppl 0.7 5.5 000
tonnes 808 7156
Electricity KWH per person 556 1885 bn KWH 614 2469
Source: Industry Sources, Morgan Stanley Research
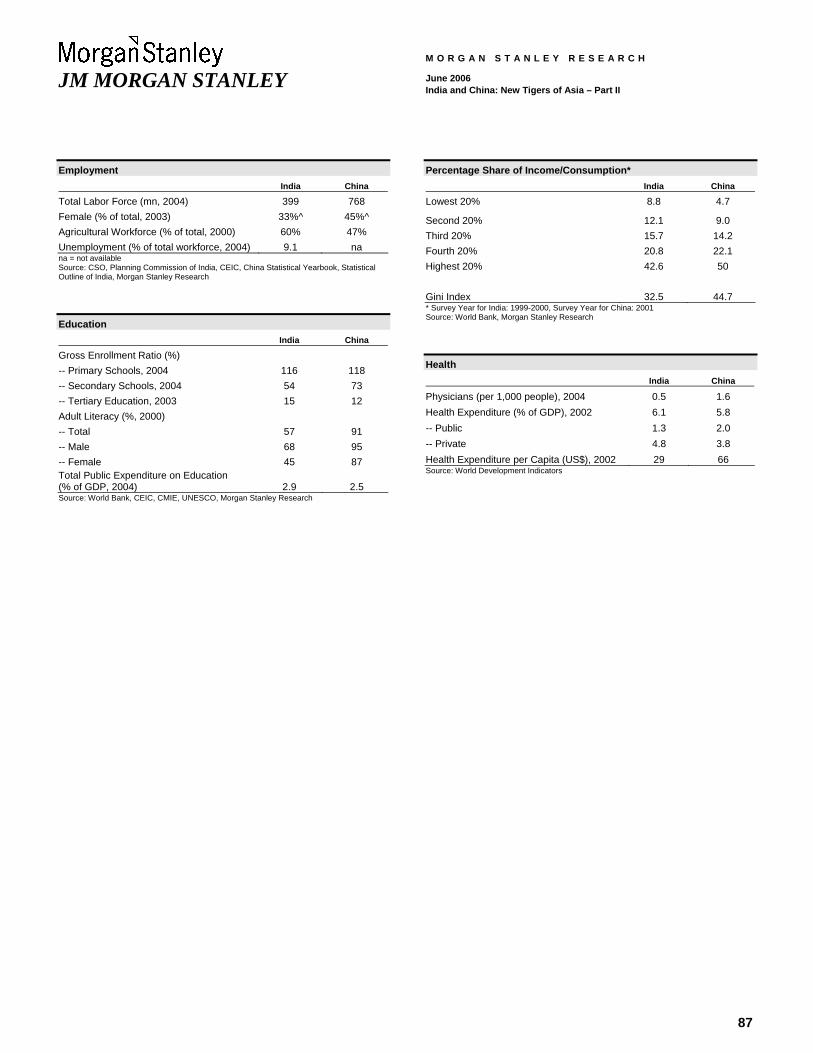
87
JM MORGAN STANLEY
M O R G A N S T A N L E Y R E S E A R C H
June 2006 India and China: New Tigers of Asia – Part II
Employment India China
Total Labor Force (mn, 2004) 399 768 Female (% of total, 2003) 33%^ 45%^ Agricultural Workforce (% of total, 2000) 60% 47% Unemployment (% of total workforce, 2004) 9.1 na na = not available Source: CSO, Planning Commission of India, CEIC, China Statistical Yearbook, Statistical Outline of India, Morgan Stanley Research
Education India China
Gross Enrollment Ratio (%) -- Primary Schools, 2004 116 118 -- Secondary Schools, 2004 54 73 -- Tertiary Education, 2003 15 12 Adult Literacy (%, 2000) -- Total 57 91 -- Male 68 95 -- Female 45 87 Total Public Expenditure on Education (% of GDP, 2004) 2.9 2.5 Source: World Bank, CEIC, CMIE, UNESCO, Morgan Stanley Research
Percentage Share of Income/Consumption* India China
Lowest 20% 8.8 4.7
Second 20% 12.1 9.0 Third 20% 15.7 14.2 Fourth 20% 20.8 22.1 Highest 20% 42.6 50 Gini Index 32.5 44.7 * Survey Year for India: 1999-2000, Survey Year for China: 2001 Source: World Bank, Morgan Stanley Research
Health India China
Physicians (per 1,000 people), 2004 0.5 1.6 Health Expenditure (% of GDP), 2002 6.1 5.8 -- Public 1.3 2.0 -- Private 4.8 3.8 Health Expenditure per Capita (US$), 2002 29 66 Source: World Development Indicators
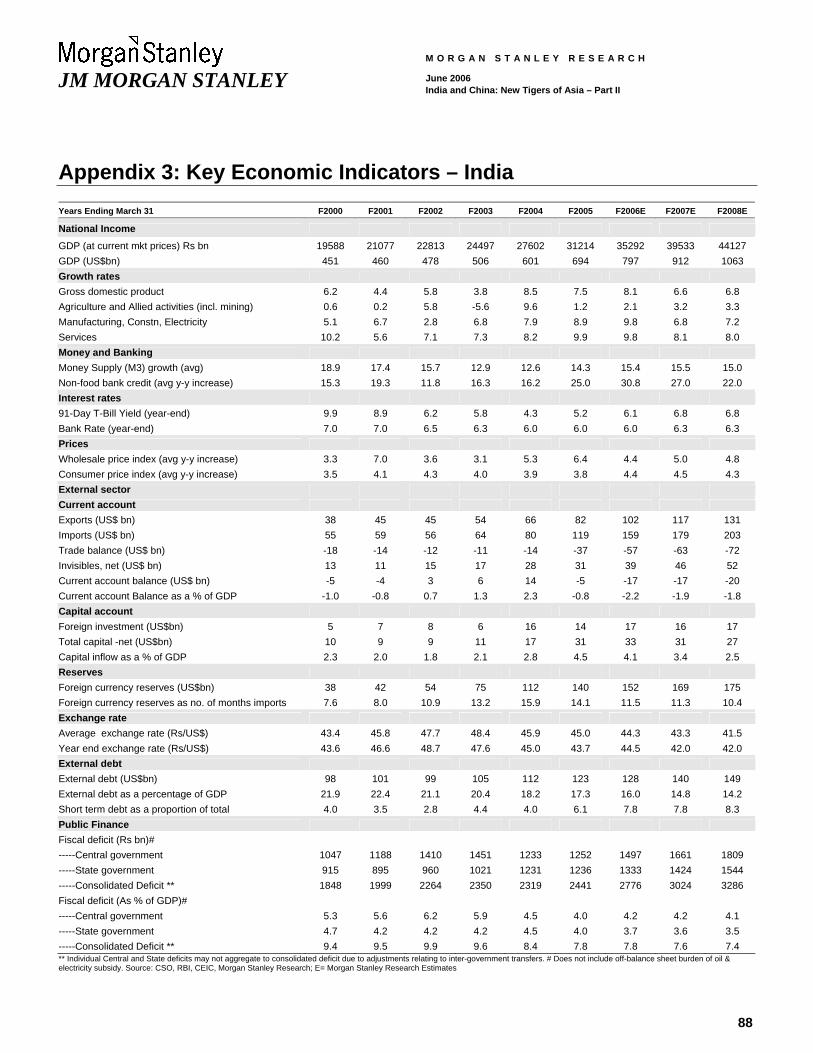
88
JM MORGAN STANLEY
M O R G A N S T A N L E Y R E S E A R C H
June 2006 India and China: New Tigers of Asia – Part II
Appendix 3: Key Economic Indicators – India Years Ending March 31 F2000 F2001 F2002 F2003 F2004 F2005 F2006E F2007E F2008E
National Income GDP (at current mkt prices) Rs bn 19588 21077 22813 24497 27602 31214 35292 39533 44127 GDP (US$bn) 451 460 478 506 601 694 797 912 1063 Growth rates Gross domestic product 6.2 4.4 5.8 3.8 8.5 7.5 8.1 6.6 6.8 Agriculture and Allied activities (incl. mining) 0.6 0.2 5.8 -5.6 9.6 1.2 2.1 3.2 3.3 Manufacturing, Constn, Electricity 5.1 6.7 2.8 6.8 7.9 8.9 9.8 6.8 7.2 Services 10.2 5.6 7.1 7.3 8.2 9.9 9.8 8.1 8.0 Money and Banking Money Supply (M3) growth (avg) 18.9 17.4 15.7 12.9 12.6 14.3 15.4 15.5 15.0 Non-food bank credit (avg y-y increase) 15.3 19.3 11.8 16.3 16.2 25.0 30.8 27.0 22.0 Interest rates 91-Day T-Bill Yield (year-end) 9.9 8.9 6.2 5.8 4.3 5.2 6.1 6.8 6.8 Bank Rate (year-end) 7.0 7.0 6.5 6.3 6.0 6.0 6.0 6.3 6.3 Prices Wholesale price index (avg y-y increase) 3.3 7.0 3.6 3.1 5.3 6.4 4.4 5.0 4.8 Consumer price index (avg y-y increase) 3.5 4.1 4.3 4.0 3.9 3.8 4.4 4.5 4.3 External sector Current account Exports (US$ bn) 38 45 45 54 66 82 102 117 131 Imports (US$ bn) 55 59 56 64 80 119 159 179 203 Trade balance (US$ bn) -18 -14 -12 -11 -14 -37 -57 -63 -72 Invisibles, net (US$ bn) 13 11 15 17 28 31 39 46 52 Current account balance (US$ bn) -5 -4 3 6 14 -5 -17 -17 -20 Current account Balance as a % of GDP -1.0 -0.8 0.7 1.3 2.3 -0.8 -2.2 -1.9 -1.8 Capital account Foreign investment (US$bn) 5 7 8 6 16 14 17 16 17 Total capital -net (US$bn) 10 9 9 11 17 31 33 31 27 Capital inflow as a % of GDP 2.3 2.0 1.8 2.1 2.8 4.5 4.1 3.4 2.5 Reserves Foreign currency reserves (US$bn) 38 42 54 75 112 140 152 169 175 Foreign currency reserves as no. of months imports 7.6 8.0 10.9 13.2 15.9 14.1 11.5 11.3 10.4 Exchange rate Average exchange rate (Rs/US$) 43.4 45.8 47.7 48.4 45.9 45.0 44.3 43.3 41.5 Year end exchange rate (Rs/US$) 43.6 46.6 48.7 47.6 45.0 43.7 44.5 42.0 42.0 External debt External debt (US$bn) 98 101 99 105 112 123 128 140 149 External debt as a percentage of GDP 21.9 22.4 21.1 20.4 18.2 17.3 16.0 14.8 14.2 Short term debt as a proportion of total 4.0 3.5 2.8 4.4 4.0 6.1 7.8 7.8 8.3 Public Finance Fiscal deficit (Rs bn)# -----Central government 1047 1188 1410 1451 1233 1252 1497 1661 1809 -----State government 915 895 960 1021 1231 1236 1333 1424 1544 -----Consolidated Deficit ** 1848 1999 2264 2350 2319 2441 2776 3024 3286 Fiscal deficit (As % of GDP)# -----Central government 5.3 5.6 6.2 5.9 4.5 4.0 4.2 4.2 4.1 -----State government 4.7 4.2 4.2 4.2 4.5 4.0 3.7 3.6 3.5 -----Consolidated Deficit ** 9.4 9.5 9.9 9.6 8.4 7.8 7.8 7.6 7.4 ** Individual Central and State deficits may not aggregate to consolidated deficit due to adjustments relating to inter-government transfers. # Does not include off-balance sheet burden of oil & electricity subsidy. Source: CSO, RBI, CEIC, Morgan Stanley Research; E= Morgan Stanley Research Estimates
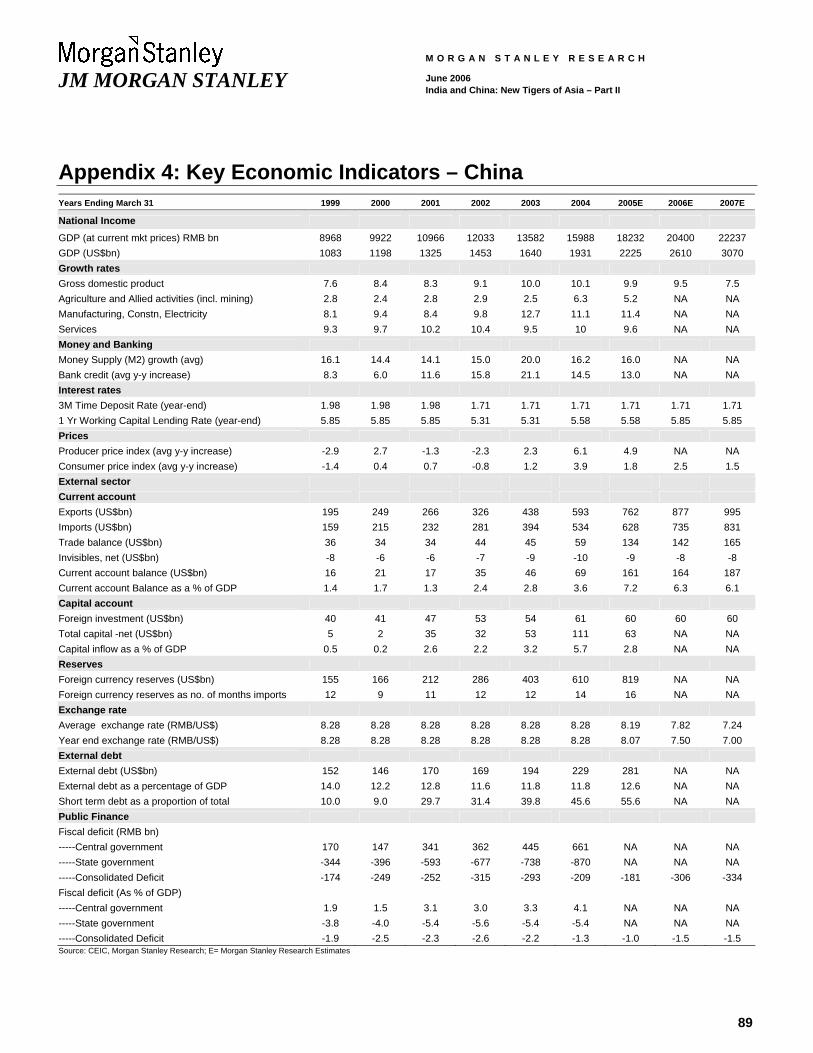
89
JM MORGAN STANLEY
M O R G A N S T A N L E Y R E S E A R C H
June 2006 India and China: New Tigers of Asia – Part II
Appendix 4: Key Economic Indicators – China Years Ending March 31 1999 2000 2001 2002 2003 2004 2005E 2006E 2007E
National Income GDP (at current mkt prices) RMB bn 8968 9922 10966 12033 13582 15988 18232 20400 22237 GDP (US$bn) 1083 1198 1325 1453 1640 1931 2225 2610 3070 Growth rates Gross domestic product 7.6 8.4 8.3 9.1 10.0 10.1 9.9 9.5 7.5 Agriculture and Allied activities (incl. mining) 2.8 2.4 2.8 2.9 2.5 6.3 5.2 NA NA Manufacturing, Constn, Electricity 8.1 9.4 8.4 9.8 12.7 11.1 11.4 NA NA Services 9.3 9.7 10.2 10.4 9.5 10 9.6 NA NA Money and Banking Money Supply (M2) growth (avg) 16.1 14.4 14.1 15.0 20.0 16.2 16.0 NA NA Bank credit (avg y-y increase) 8.3 6.0 11.6 15.8 21.1 14.5 13.0 NA NA Interest rates 3M Time Deposit Rate (year-end) 1.98 1.98 1.98 1.71 1.71 1.71 1.71 1.71 1.71 1 Yr Working Capital Lending Rate (year-end) 5.85 5.85 5.85 5.31 5.31 5.58 5.58 5.85 5.85 Prices Producer price index (avg y-y increase) -2.9 2.7 -1.3 -2.3 2.3 6.1 4.9 NA NA Consumer price index (avg y-y increase) -1.4 0.4 0.7 -0.8 1.2 3.9 1.8 2.5 1.5 External sector Current account Exports (US$bn) 195 249 266 326 438 593 762 877 995 Imports (US$bn) 159 215 232 281 394 534 628 735 831 Trade balance (US$bn) 36 34 34 44 45 59 134 142 165 Invisibles, net (US$bn) -8 -6 -6 -7 -9 -10 -9 -8 -8 Current account balance (US$bn) 16 21 17 35 46 69 161 164 187 Current account Balance as a % of GDP 1.4 1.7 1.3 2.4 2.8 3.6 7.2 6.3 6.1 Capital account Foreign investment (US$bn) 40 41 47 53 54 61 60 60 60 Total capital -net (US$bn) 5 2 35 32 53 111 63 NA NA Capital inflow as a % of GDP 0.5 0.2 2.6 2.2 3.2 5.7 2.8 NA NA Reserves Foreign currency reserves (US$bn) 155 166 212 286 403 610 819 NA NA Foreign currency reserves as no. of months imports 12 9 11 12 12 14 16 NA NA Exchange rate Average exchange rate (RMB/US$) 8.28 8.28 8.28 8.28 8.28 8.28 8.19 7.82 7.24 Year end exchange rate (RMB/US$) 8.28 8.28 8.28 8.28 8.28 8.28 8.07 7.50 7.00 External debt External debt (US$bn) 152 146 170 169 194 229 281 NA NA External debt as a percentage of GDP 14.0 12.2 12.8 11.6 11.8 11.8 12.6 NA NA Short term debt as a proportion of total 10.0 9.0 29.7 31.4 39.8 45.6 55.6 NA NA Public Finance Fiscal deficit (RMB bn) -----Central government 170 147 341 362 445 661 NA NA NA -----State government -344 -396 -593 -677 -738 -870 NA NA NA -----Consolidated Deficit -174 -249 -252 -315 -293 -209 -181 -306 -334 Fiscal deficit (As % of GDP) -----Central government 1.9 1.5 3.1 3.0 3.3 4.1 NA NA NA -----State government -3.8 -4.0 -5.4 -5.6 -5.4 -5.4 NA NA NA -----Consolidated Deficit -1.9 -2.5 -2.3 -2.6 -2.2 -1.3 -1.0 -1.5 -1.5 Source: CEIC, Morgan Stanley Research; E= Morgan Stanley Research Estimates
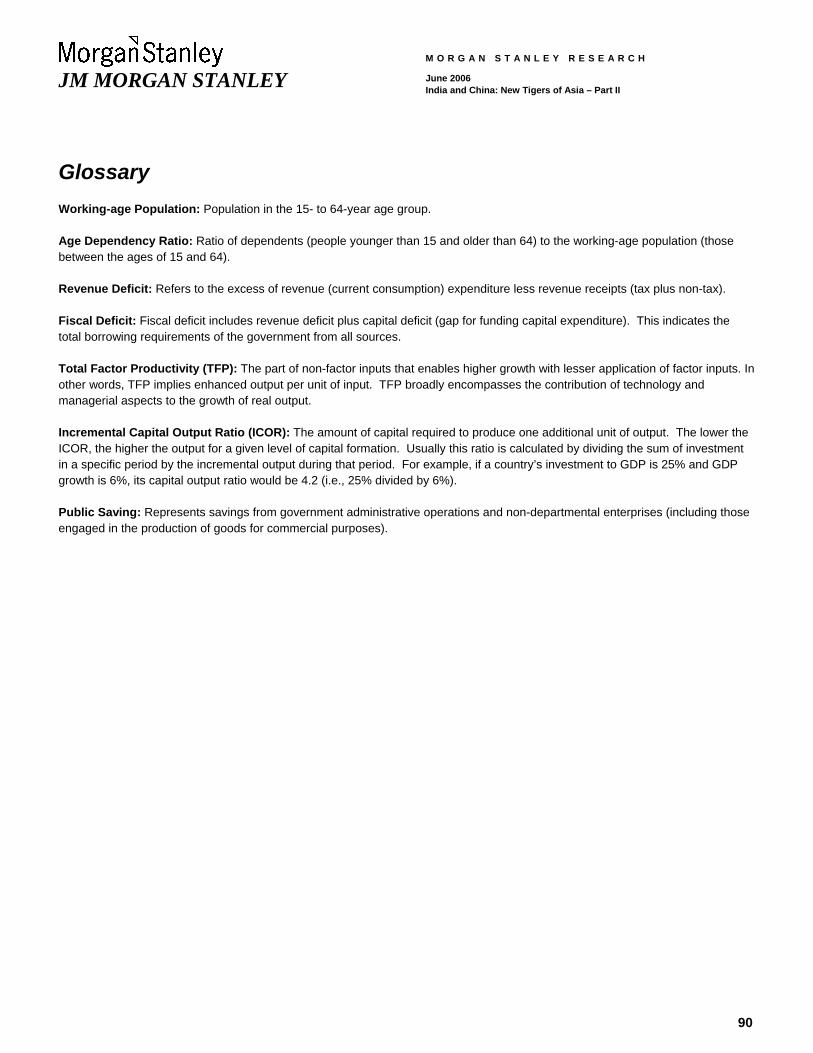
90
JM MORGAN STANLEY
M O R G A N S T A N L E Y R E S E A R C H
June 2006 India and China: New Tigers of Asia – Part II
Glossary Working-age Population: Population in the 15- to 64-year age group.
Age Dependency Ratio: Ratio of dependents (people younger than 15 and older than 64) to the working-age population (those between the ages of 15 and 64).
Revenue Deficit: Refers to the excess of revenue (current consumption) expenditure less revenue receipts (tax plus non-tax).
Fiscal Deficit: Fiscal deficit includes revenue deficit plus capital deficit (gap for funding capital expenditure). This indicates the total borrowing requirements of the government from all sources.
Total Factor Productivity (TFP): The part of non-factor inputs that enables higher growth with lesser application of factor inputs. In other words, TFP implies enhanced output per unit of input. TFP broadly encompasses the contribution of technology and managerial aspects to the growth of real output.
Incremental Capital Output Ratio (ICOR): The amount of capital required to produce one additional unit of output. The lower the ICOR, the higher the output for a given level of capital formation. Usually this ratio is calculated by dividing the sum of investment in a specific period by the incremental output during that period. For example, if a country’s investment to GDP is 25% and GDP growth is 6%, its capital output ratio would be 4.2 (i.e., 25% divided by 6%).
Public Saving: Represents savings from government administrative operations and non-departmental enterprises (including those engaged in the production of goods for commercial purposes).
91
JM MORGAN STANLEY
M O R G A N S T A N L E Y R E S E A R C H
June 2006 India and China: New Tigers of Asia – Part II
Disclosure Section
Information and opinions in this report were prepared or are disseminated by one or more of the following, which accept responsibility for its contents: Morgan Stanley Dean Witter Asia Limited, and/or Morgan Stanley Dean Witter Asia (Singapore) Pte. (Registration number 199206298Z, regulated by the Monetary Authority of Singapore, and/or Morgan Stanley Asia (Singapore) Securities Pte Ltd (Registration number 200008434H, regulated by the Monetary Authority of Singapore), and/or Morgan Stanley & Co. International Limited, Taipei Branch and/or Morgan Stanley & Co International Limited, Seoul Branch, and/or Morgan Stanley Dean Witter Australia Limited (A.B.N. 67 003 734 576, holder of Australian financial services license No. 233742), and/or JM Morgan Stanley Securities Private Limited and their affiliates (collectively, "Morgan Stanley").
Global Research Conflict Management Policy This research observes our conflict management policy, available at www.morganstanley.com/institutional/research/conflictpolicies.
Important Disclosures This report does not provide individually tailored investment advice. It has been prepared without regard to the circumstances and objectives of those who receive it. Morgan Stanley recommends that investors independently evaluate particular investments and strategies, and encourages them to seek a financial adviser's advice. The appropriateness of an investment or strategy will depend on an investor's circumstances and objectives. This report is not an offer to buy or sell any security or to participate in any trading strategy. The value of and income from your investments may vary because of changes in interest rates or foreign exchange rates, securities prices or market indexes, operational or financial conditions of companies or other factors. Past performance is not necessarily a guide to future performance. Estimates of future performance are based on assumptions that may not be realized. With the exception of information regarding Morgan Stanley, reports prepared by Morgan Stanley research personnel are based on public information. Morgan Stanley makes every effort to use reliable, comprehensive information, but we do not represent that it is accurate or complete. We have no obligation to tell you when opinions or information in this report change apart from when we intend to discontinue research coverage of a company. Facts and views in this report have not been reviewed by, and may not reflect information known to, professionals in other Morgan Stanley business areas, including investment banking personnel. To our readers in Taiwan: This publication is distributed by Morgan Stanley & Co. International Limited, Taipei Branch; it may not be distributed to or quoted or used by the public media without the express written consent of Morgan Stanley. To our readers in Hong Kong: Information is distributed in Hong Kong by and on behalf of, and is attributable to, Morgan Stanley Dean Witter Asia Limited as part of its regulated activities in Hong Kong; if you have any queries concerning it, contact our Hong Kong sales representatives. This publication is disseminated in Japan by Morgan Stanley Japan Securities Co., Ltd.; in Canada by Morgan Stanley Canada Limited, which has approved of and takes responsibility for its contents in Canada; in Germany by Morgan Stanley Bank AG, Frankfurt am Main, regulated by Bundesanstalt fuer Finanzdienstleistungsaufsicht (BaFin);in Spain by Morgan Stanley, S.V., S.A., a Morgan Stanley group company, supervised by the Spanish Securities Markets Commission(CNMV), which states that it is written and distributed in accordance with rules of conduct for financial research under Spanish regulations; in the US by Morgan Stanley & Co. Incorporated and Morgan Stanley DW Inc., which accept responsibility for its contents. Morgan Stanley & Co. International Limited, authorized and regulated by Financial Services Authority, disseminates in the UK research it has prepared, and approves solely for purposes of section 21 of the Financial Services and Markets Act 2000, research prepared by any affiliates. Private UK investors should obtain the advice of their Morgan Stanley & Co. International Limited representative about the investments concerned. In Australia, this report and any access to it is intended only for "wholesale clients" within the meaning of the Australian Corporations Act. Trademarks and service marks herein are their owners' property. Third-party data providers make no warranties or representations of the accuracy, completeness, or timeliness of their data and shall not have liability for any damages relating to such data. The Global Industry Classification Standard (GICS) was developed by and is the exclusive property of MSCI and S&P. Morgan Stanley bases projections, opinions, forecasts and trading strategies regarding the MSCI Country Index Series solely on public information. MSCI has not reviewed, approved or endorsed these projections, opinions, forecasts and trading strategies. Morgan Stanley has no influence on or control over MSCI's index compilation decisions. This report or portions of it may not be reprinted, sold or redistributed without the written consent of Morgan Stanley. Morgan Stanley research is disseminated and available primarily electronically, and, in some cases, in printed form. Additional information on recommended securities is available on request. INDIACHINA_TIGERS_PART_II

June 2006