Monitoring Air Toxic Particulate from Heavily Trafficked ... · PDF filePollutants from...
35
1 Monitoring Air Toxic Particulate Pollutants from Heavily Trafficked New Jersey Turnpike (EPA Grant XA 97268501) Francisco Artigas 1 , Ph.D Jin Y. Shin 1 , Ph.D Yuan Gao 2 , Ph.D 1 Meadowlands Environmental Research Institute (MERI), Lyndhurst, NJ 2 Rutgers University, Newark, NJ
Transcript of Monitoring Air Toxic Particulate from Heavily Trafficked ... · PDF filePollutants from...
1
Monitoring Air Toxic Particulate Pollutants from Heavily Trafficked New
Jersey Turnpike (EPA Grant XA 97268501)
Francisco Artigas1, Ph.DJin Y. Shin1, Ph.DYuan Gao2, Ph.D
1Meadowlands Environmental Research Institute (MERI), Lyndhurst, NJ2Rutgers University, Newark, NJ
2
Funding Support
USEPA Agreement # XA 97268501
• Mike Jones, Air Toxics Monitoring Program, Triangle Park, NC,
• Marion Hoyer, Office of Transportation and Air Quality, Ann Arbor, MI Raymond Werner, Reema Loutan, Roch Baamonde and Maria Flores‐Collazo EPA Region II New York Office
3
Introduction
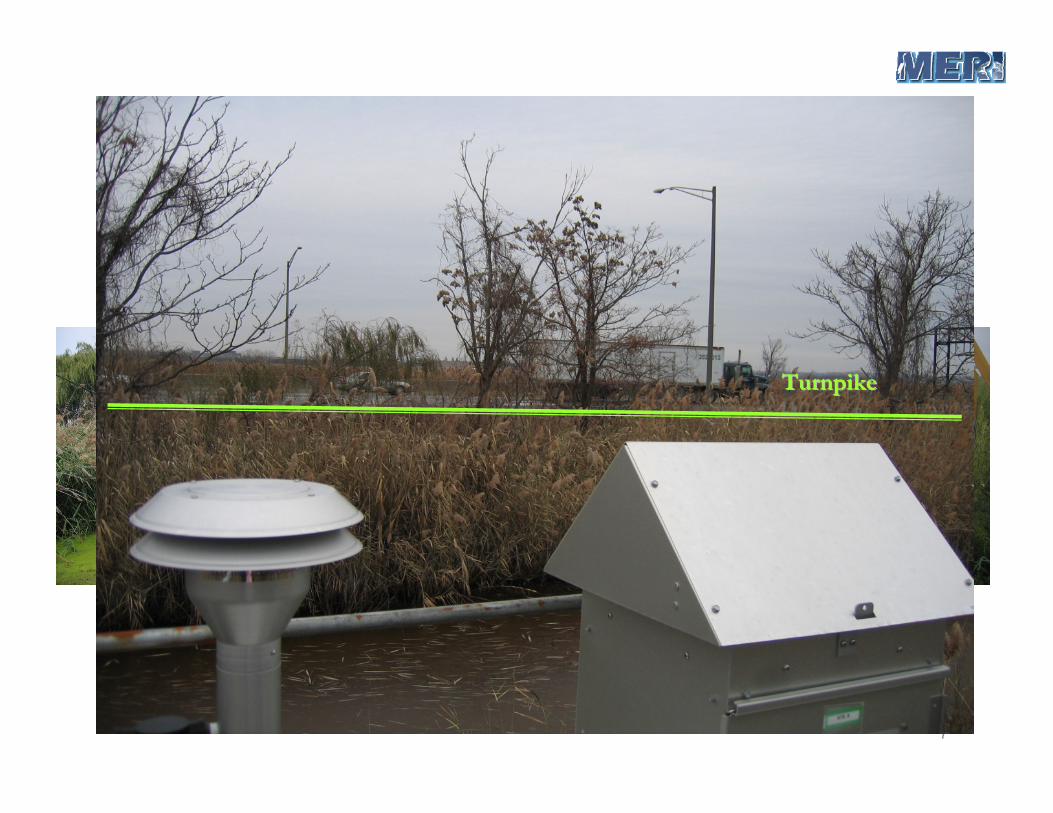
NJ turnpike connects New York and Philadelphia with more than 1/2 million cars per day.
Traffic emissions have lead to elevated concentration of HAPs near highways compared to the average urban background
This study measured pollutant levels at different distances from the NJ turnpike, seasonal effects and traffic and weather effects on PAH’s, TSP and PM2.5 and associated metals
4
Objective
• Measure ambient concentration gradients of PM2.5 ,TSP,
PAHs and their associated Trace Metals at different distances
from the NJ Turnpike.
• Determine how particulate concentration from vehicle
emission is affected by seasons, day/night, traffic flow
variations and meteorological conditions.
• Design and test a visualization tool for interactively displaying
spatial‐temporal patterns of highway Air quality.
5
Experimental Design
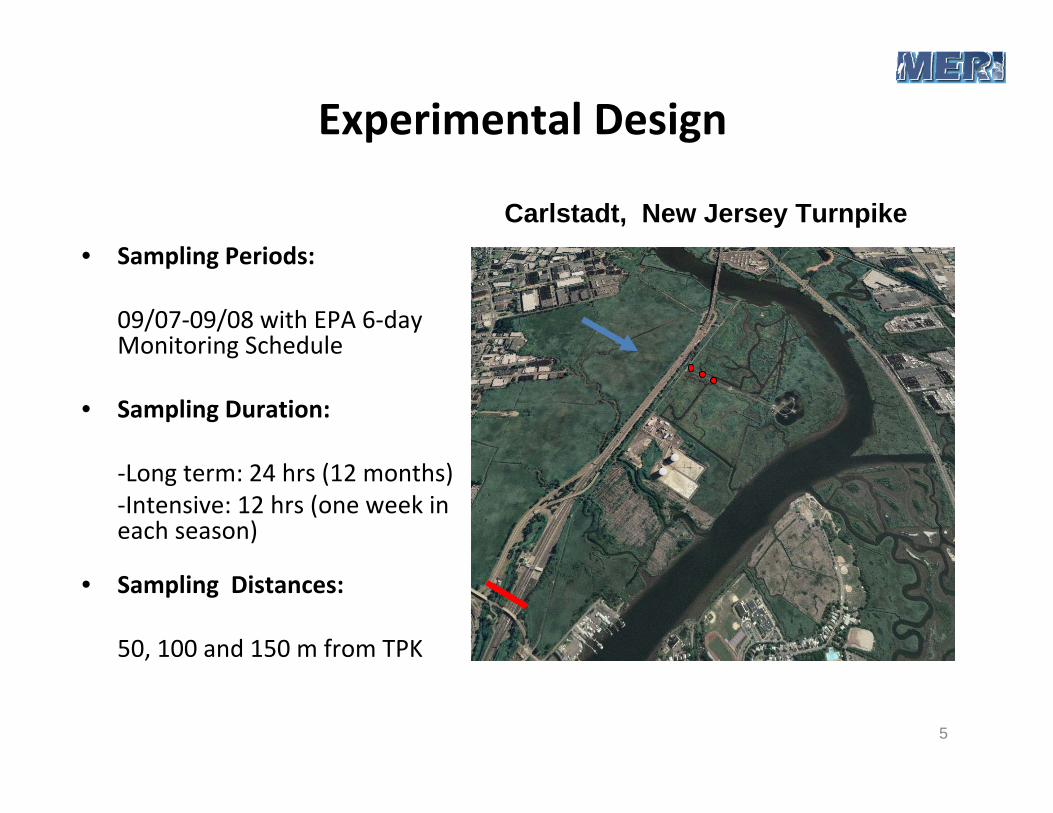
• Sampling Periods:
09/07‐09/08 with EPA 6‐day Monitoring Schedule
• Sampling Duration:
‐Long term: 24 hrs (12 months)‐Intensive: 12 hrs (one week in each season)
• Sampling Distances:
50, 100 and 150 m from TPK
Carlstadt, New Jersey Turnpike
6
Measured Variables
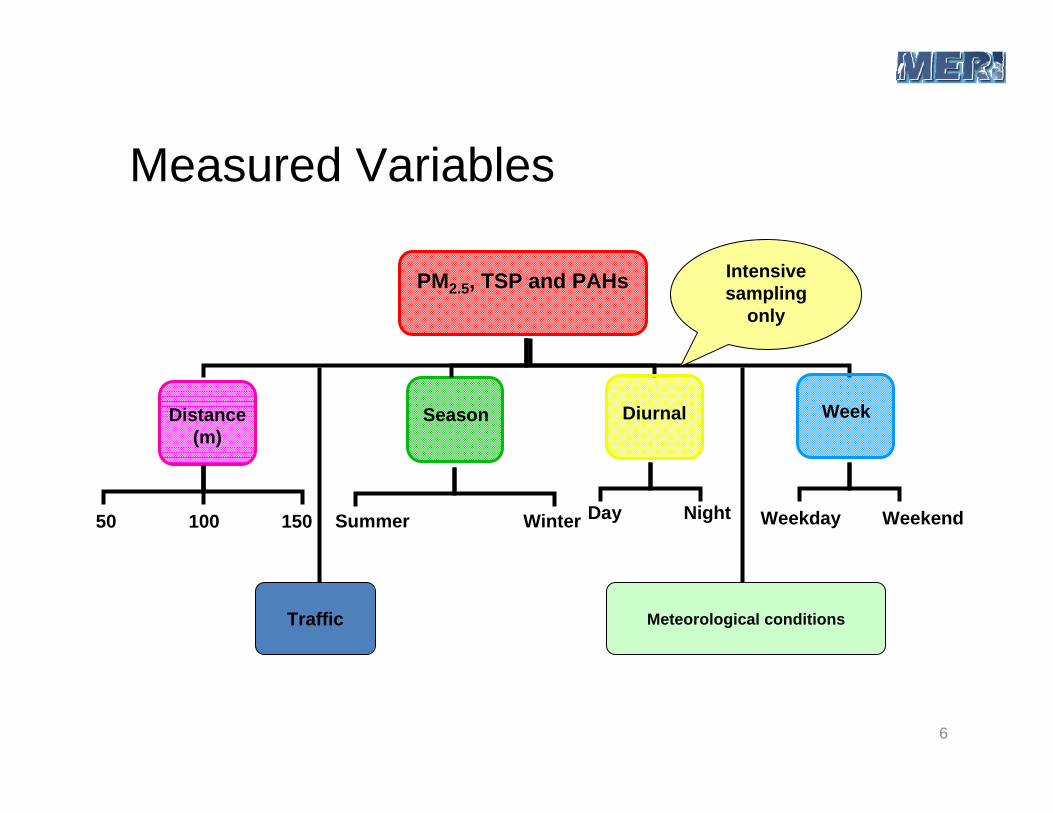
PM2.5, TSP and PAHs
Distance (m)
Season
50 100 150 Summer Winter Day Night Weekday Weekend
Intensive sampling
only
Diurnal Week
Traffic Meteorological conditions
7
Sampling Sites: A, B, and C
A: 50 mA: 50 m B: 100 mB: 100 m C: 150 mC: 150 m
TurnpikeTurnpike
8
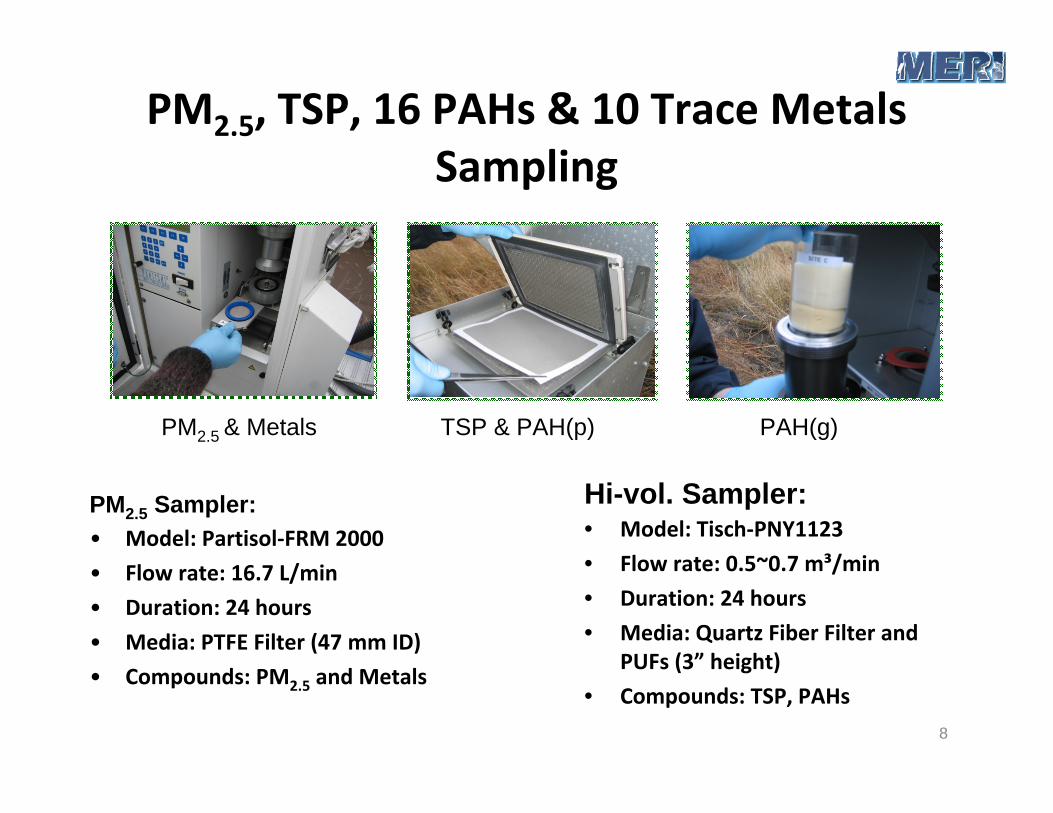
PM2.5, TSP, 16 PAHs & 10 Trace Metals Sampling
Hi-vol. Sampler:• Model: Tisch‐PNY1123
• Flow rate: 0.5~0.7 m³/min
• Duration: 24 hours
• Media: Quartz Fiber Filter and PUFs (3” height)
• Compounds: TSP, PAHs
PM2.5 Sampler:• Model: Partisol‐FRM 2000
• Flow rate: 16.7 L/min
• Duration: 24 hours
• Media: PTFE Filter (47 mm ID)
• Compounds: PM2.5 and Metals
TSP & PAH(p)PM2.5 & Metals PAH(g)
9
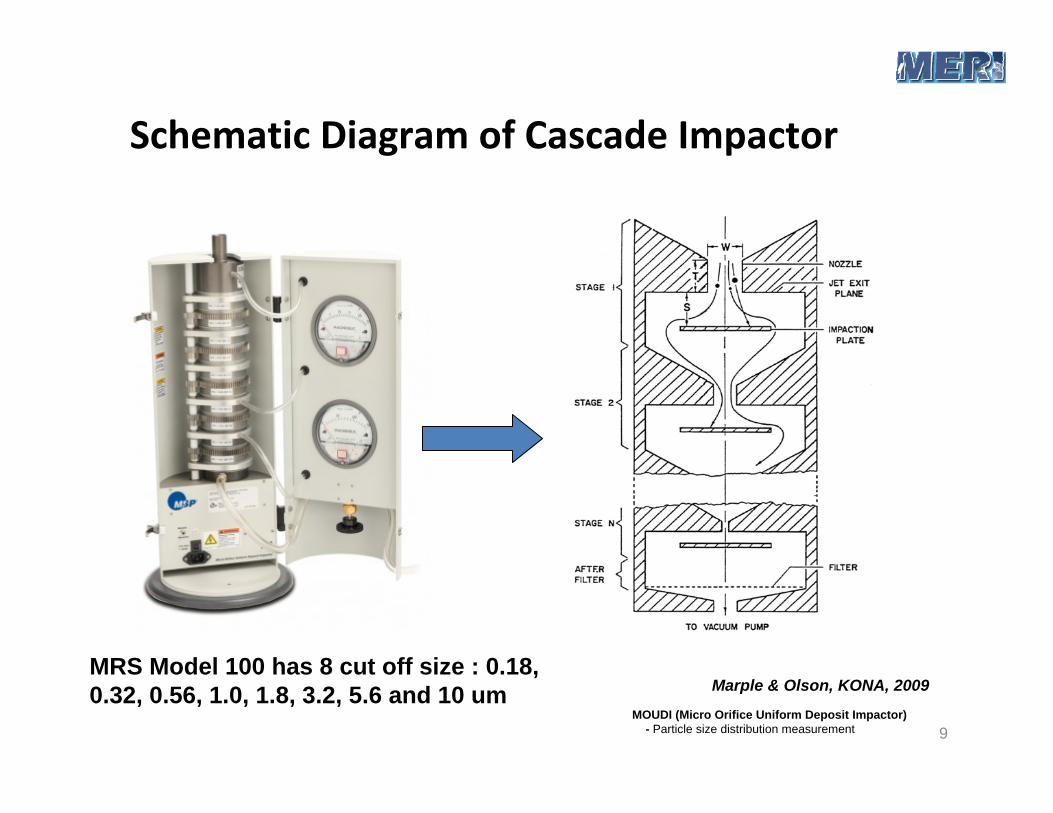
Schematic Diagram of Cascade Impactor
MRS Model 100 has 8 cut off size : 0.18, 0.32, 0.56, 1.0, 1.8, 3.2, 5.6 and 10 um Marple & Olson, KONA, 2009
MOUDI (Micro Orifice Uniform Deposit Impactor) - Particle size distribution measurement
10
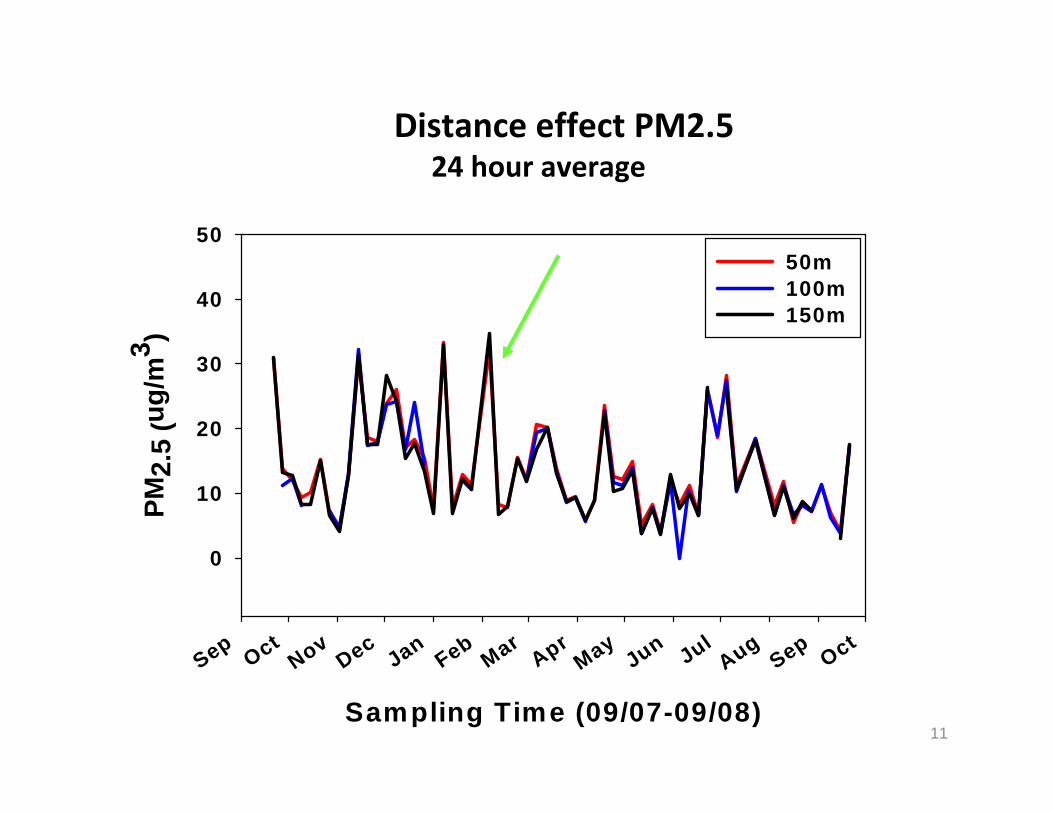
Distance effects
PM2.5, TSP and PAH
11Sampling Time (09/07-09/08)
Sep Oct
Nov Dec
Jan Feb
Mar Apr
May Jun
Jul Aug
Sep Oct
PM2.
5 (u
g/m
3 )
0
10
20
30
40
5050m100m150m
Distance effect PM2.524 hour average
12
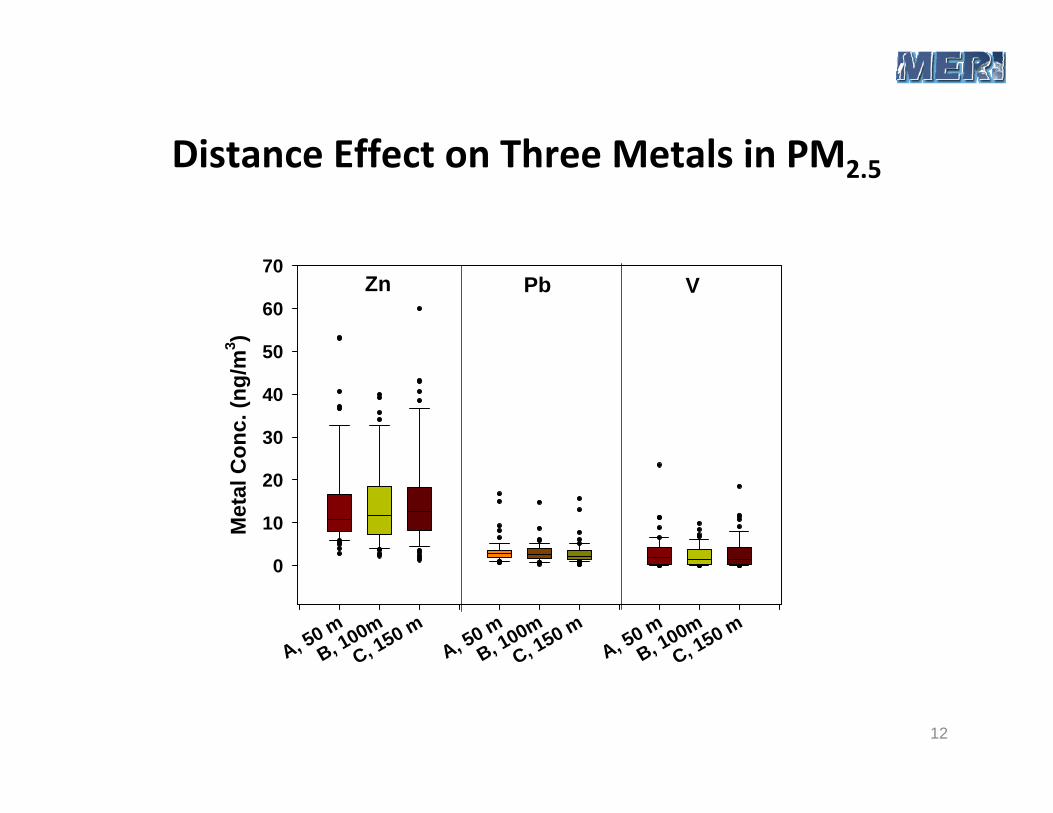
Distance Effect on Three Metals in PM2.5
A, 50 mB, 100m
C, 150 mA, 50 m
B, 100mC, 150 m
A, 50 mB, 100m
C, 150 m
Met
al C
onc.
(ng/
m3 )
0
10
20
30
40
50
60
70Zn Pb V
13
P 2.5
TSP
Sampling Date (09/07-09/08)
Sep Oct
Nov Dec
Jan Feb
Mar Apr
May Jun
Jul Aug
Sep Oct
TSP
(ug/
m3 )
0
20
40
60
80
100
120
140
160
18050 m100 m150 m
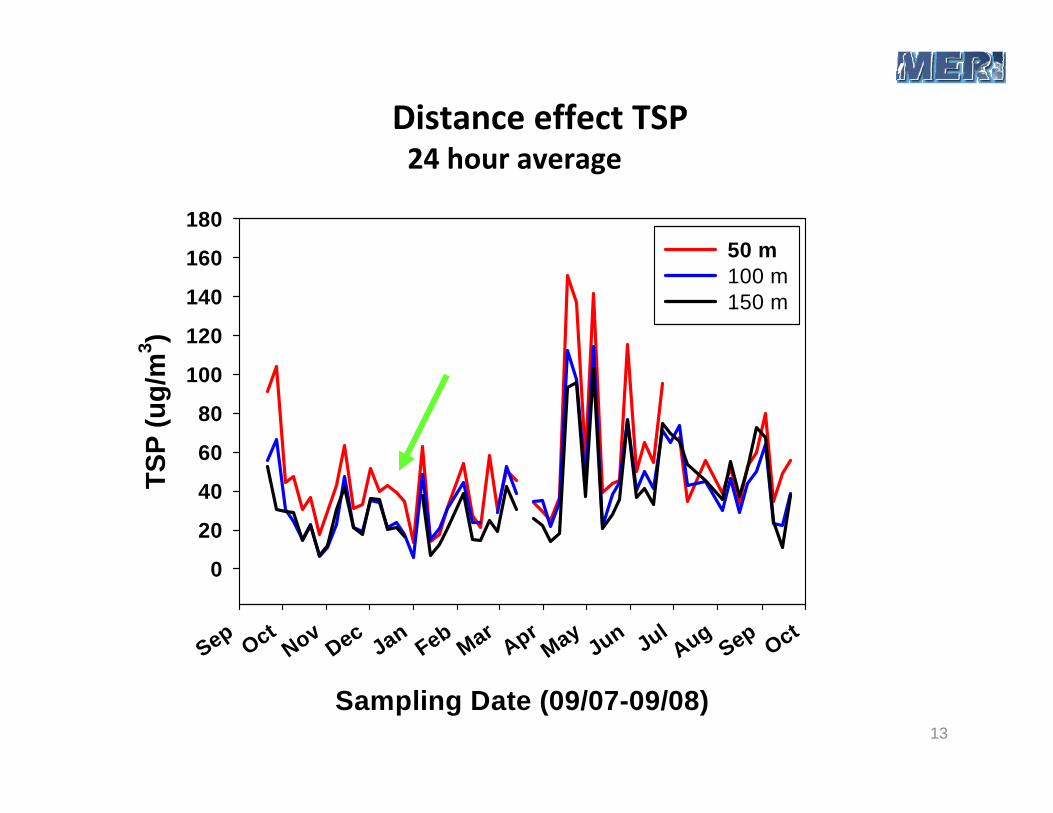
Distance effect TSP24 hour average
14
Sampling Time (09/07-09/08)
Sep Oct
Nov Dec
Jan Feb
Mar Apr
May Jun
Jul Aug
Sep Oct
PAH
(ng/
m3 )
0
20
40
60
80
10050 m100 m150 m
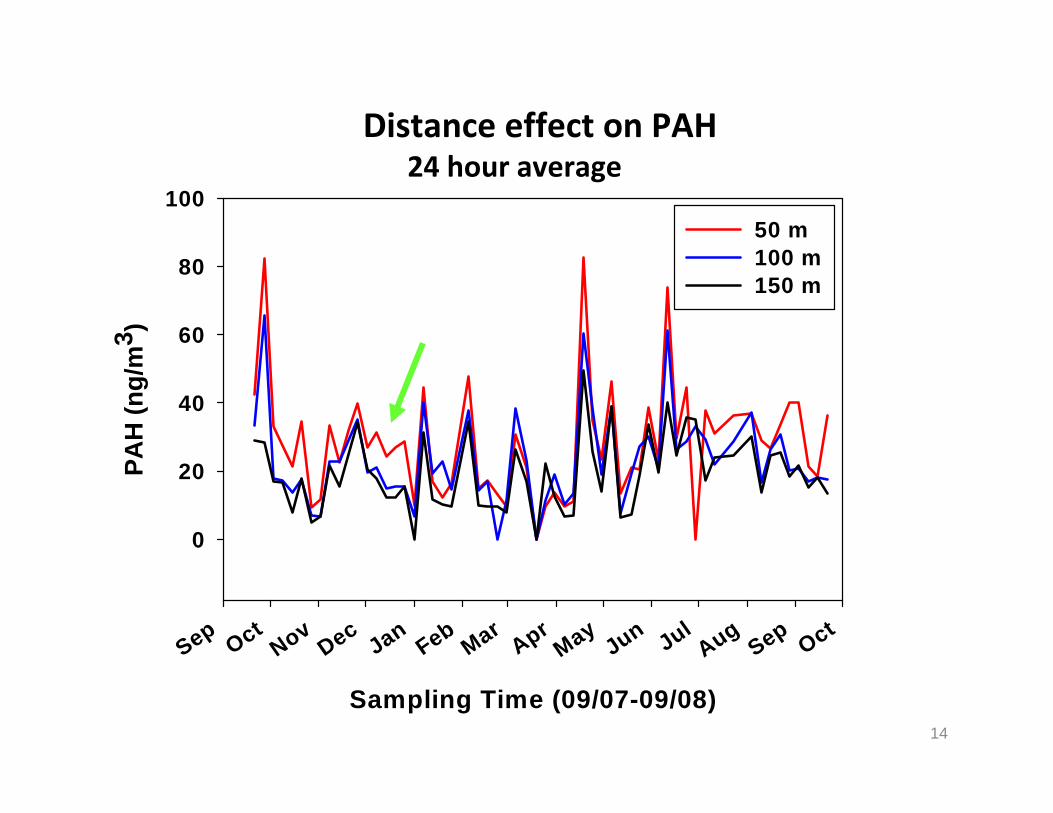
Distance effect on PAH24 hour average
15
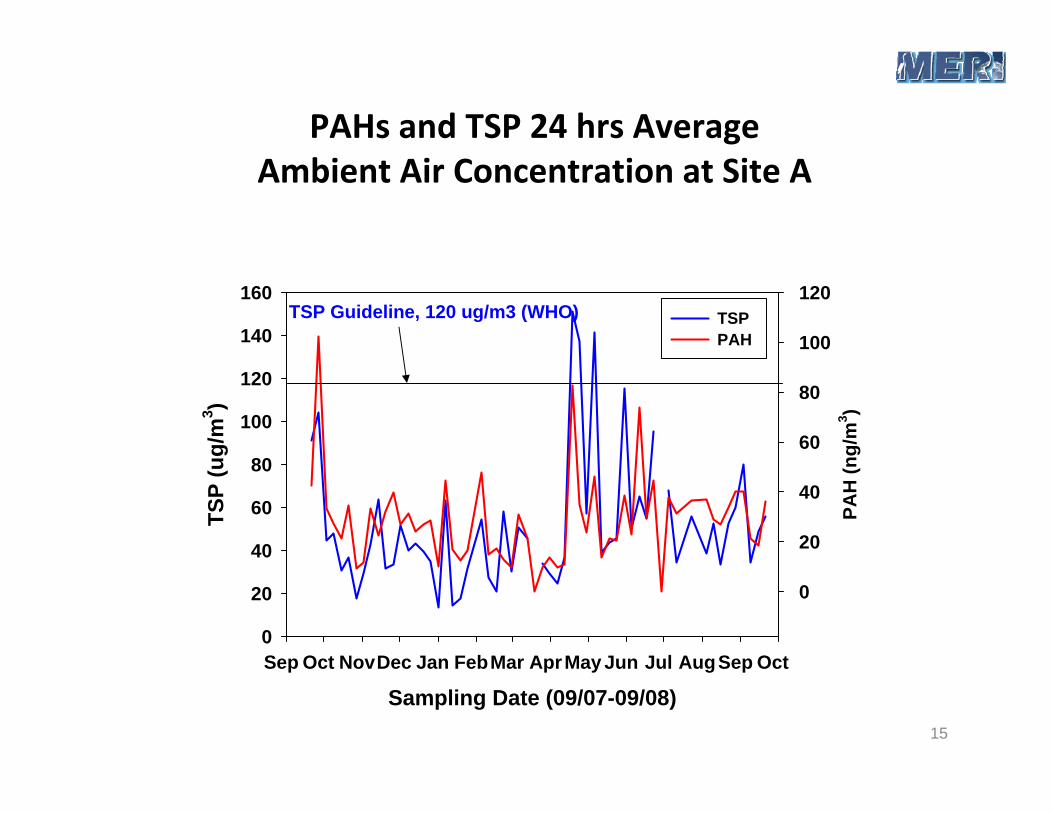
PAHs and TSP 24 hrs Average Ambient Air Concentration at Site A
Sampling Date (09/07-09/08)Sep Oct Nov Dec Jan Feb Mar Apr May Jun Jul Aug Sep Oct
TSP
(ug/
m3 )
0
20
40
60
80
100
120
140
160
PAH
(ng/
m3 )
0
20
40
60
80
100
120TSP PAH
TSP Guideline, 120 ug/m3 (WHO)
16
Sampling Time (09/07-09/08)Sep Oct Nov Dec Jan Feb Mar Apr May Jun Jul Aug Sep Oct
PM2.
5 (u
g/m
3 )
0
5
10
15
20
25
30
35
40
45
50
PAH
s (n
g/m
3 )
0
20
40
60
80
100
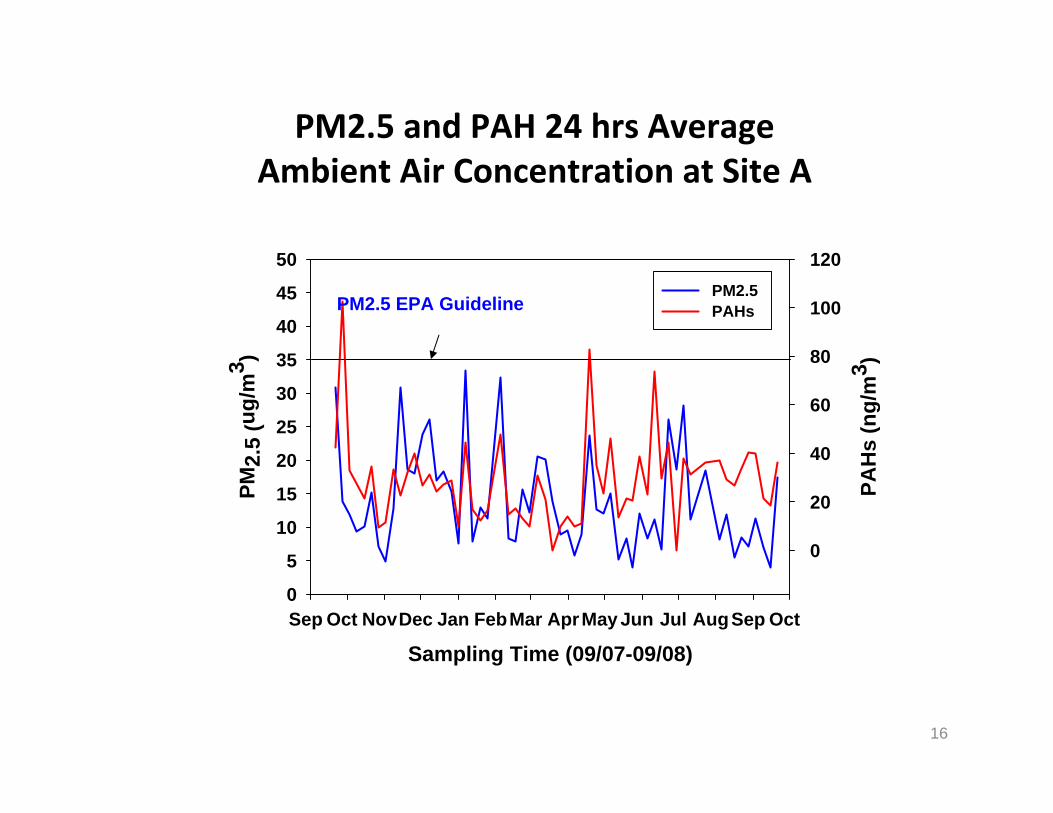
120 PM2.5 PAHs PM2.5 EPA Guideline
PM2.5 and PAH 24 hrs Average Ambient Air Concentration at Site A
17
Traffic effects
18
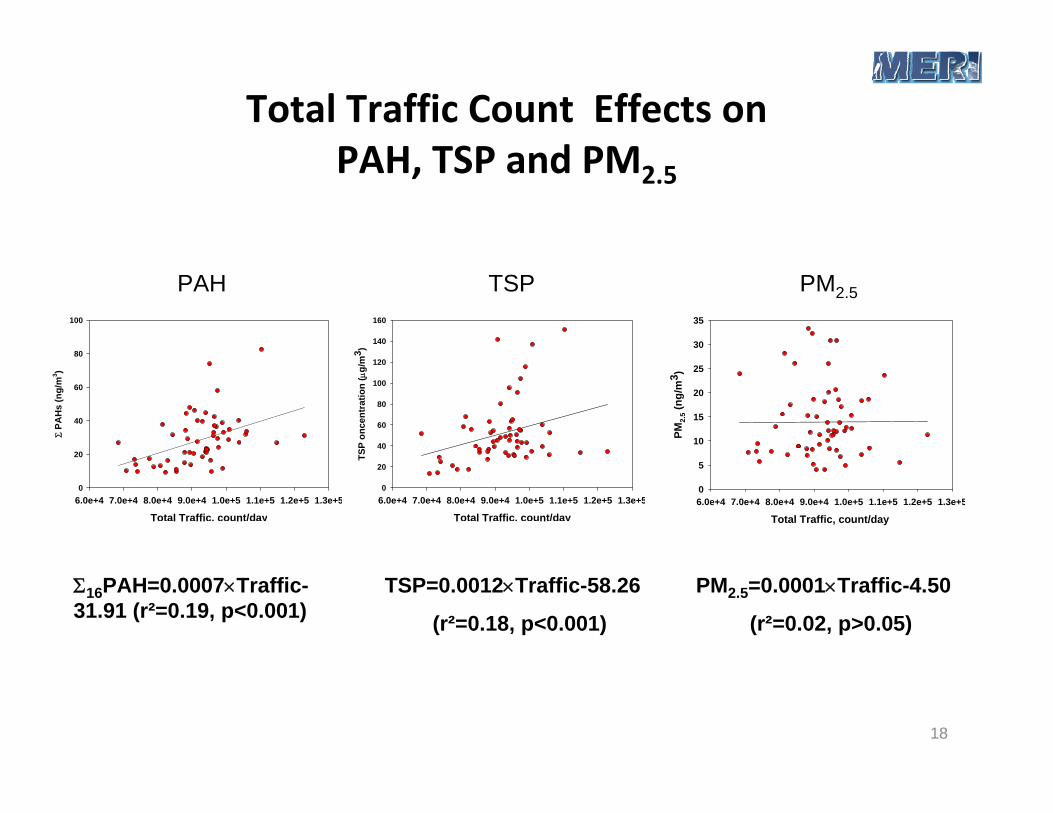
Total Traffic Count Effects on PAH, TSP and PM2.5
16PAH=0.0007Traffic-31.91 (r²=0.19, p<0.001)
Total Traffic, count/day6.0e+4 7.0e+4 8.0e+4 9.0e+4 1.0e+5 1.1e+5 1.2e+5 1.3e+5
PA
Hs
(ng/
m3 )
0
20
40
60
80
100
Total Traffic, count/day 6.0e+4 7.0e+4 8.0e+4 9.0e+4 1.0e+5 1.1e+5 1.2e+5 1.3e+5
PM2.
5 (ng
/m3 )
0
5
10
15
20
25
30
35
TSP=0.0012Traffic-58.26
(r²=0.18, p<0.001)
PM2.5=0.0001Traffic-4.50
(r²=0.02, p>0.05)
PAH TSP PM2.5
Total Traffic, count/day6.0e+4 7.0e+4 8.0e+4 9.0e+4 1.0e+5 1.1e+5 1.2e+5 1.3e+5
TSP
once
ntra
tion
( g/
m3 )
0
20
40
60
80
100
120
140
160
19
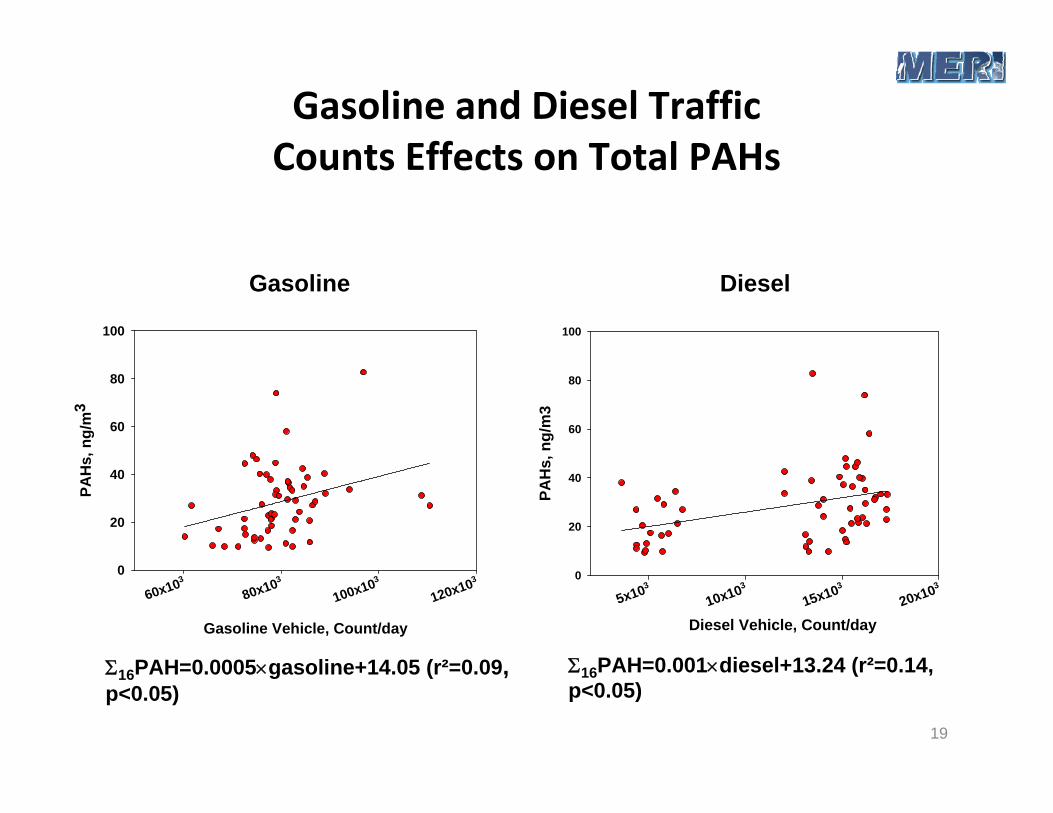
Gasoline and Diesel TrafficCounts Effects on Total PAHs
16PAH=0.0005gasoline+14.05 (r²=0.09, p<0.05)
16PAH=0.001diesel+13.24 (r²=0.14, p<0.05)
Gasoline Diesel
Gasoline Vehicle, Count/day
60x103
80x103
100x103
120x103
PAH
s, n
g/m
3
0
20
40
60
80
100
5x10³
10x103
15x103
20x103
PAH
s, n
g/m
3
0
20
40
60
80
100
Diesel Vehicle, Count/day
20
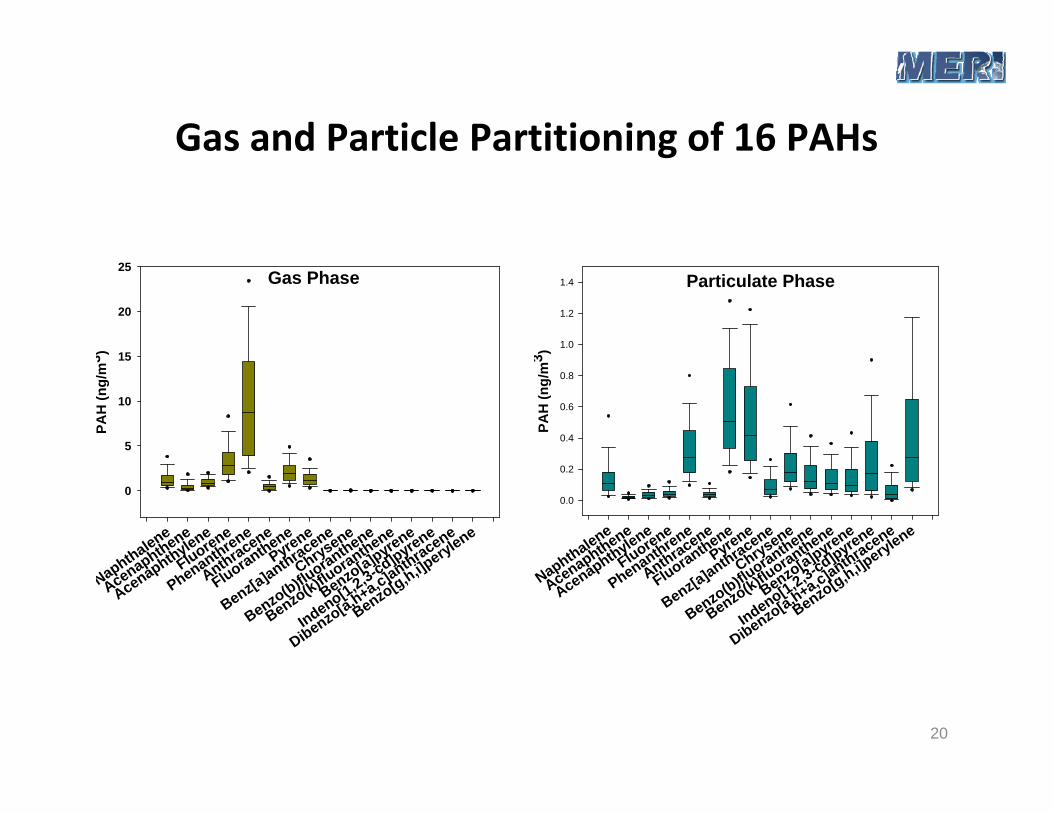
Gas and Particle Partitioning of 16 PAHs
Gas Phase
Naphthalene
Acenaphthene
Acenaphthylene
Fluorene
Phenanthrene
Anthracene
FluoranthenePyrene
Benz[a]anthracene
Chrysene
Benzo(b)fluoranthene
Benzo(k)fluoranthene
Benzo[a]pyrene
Indeno[1,2,3-cd]pyrene
Dibenzo[a,h+a,c]anthracene
Benzo[g,h,i]perylene
PAH
(ng/
m3 )
0
5
10
15
20
25Particulate Phase
Naphthalene
Acenaphthene
Acenaphthylene
Fluorene
Phenanthrene
Anthracene
FluoranthenePyrene
Benz[a]anthracene
Chrysene
Benzo(b)fluoranthene
Benzo(k)fluoranthene
Benzo[a]pyrene
Indeno[1,2,3-cd]pyrene
Dibenzo[a,h+a,c]anthracene
Benzo[g,h,i]perylene
PAH
(ng/
m3 )
0.0
0.2
0.4
0.6
0.8
1.0
1.2
1.4
21
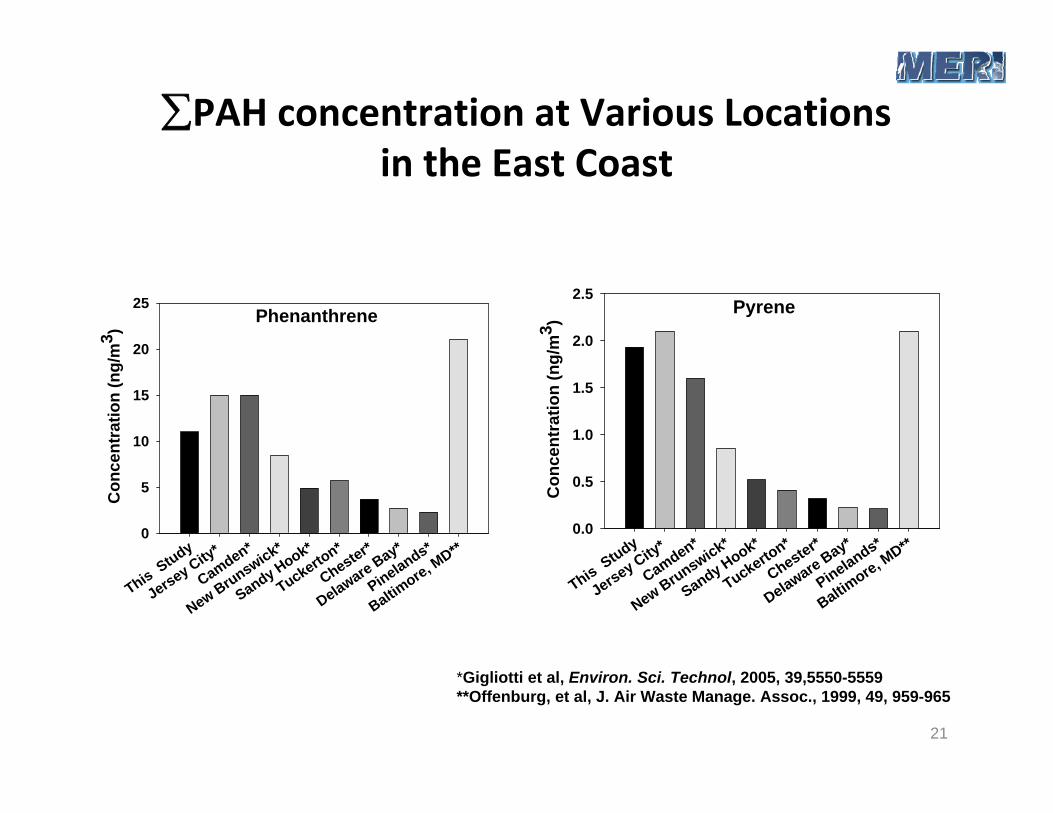
PAH concentration at Various Locations in the East Coast
Phenanthrene
This Study
Jersey City*
Camden*
New Brunswick*
Sandy Hook*
Tuckerton*
Chester*
Delaware Bay*
Pinelands*
Baltimore, M
D**
Con
cent
ratio
n (n
g/m
3 )
0
5
10
15
20
25 Pyrene
This Study
Jersey City*
Camden*
New Brunswick*
Sandy Hook*
Tuckerton*
Chester*
Delaware Bay*
Pinelands*
Baltimore, M
D**C
once
ntra
tion
(ng/
m3 )
0.0
0.5
1.0
1.5
2.0
2.5
*Gigliotti et al, Environ. Sci. Technol, 2005, 39,5550-5559**Offenburg, et al, J. Air Waste Manage. Assoc., 1999, 49, 959-965
22
Meteorological effects
23
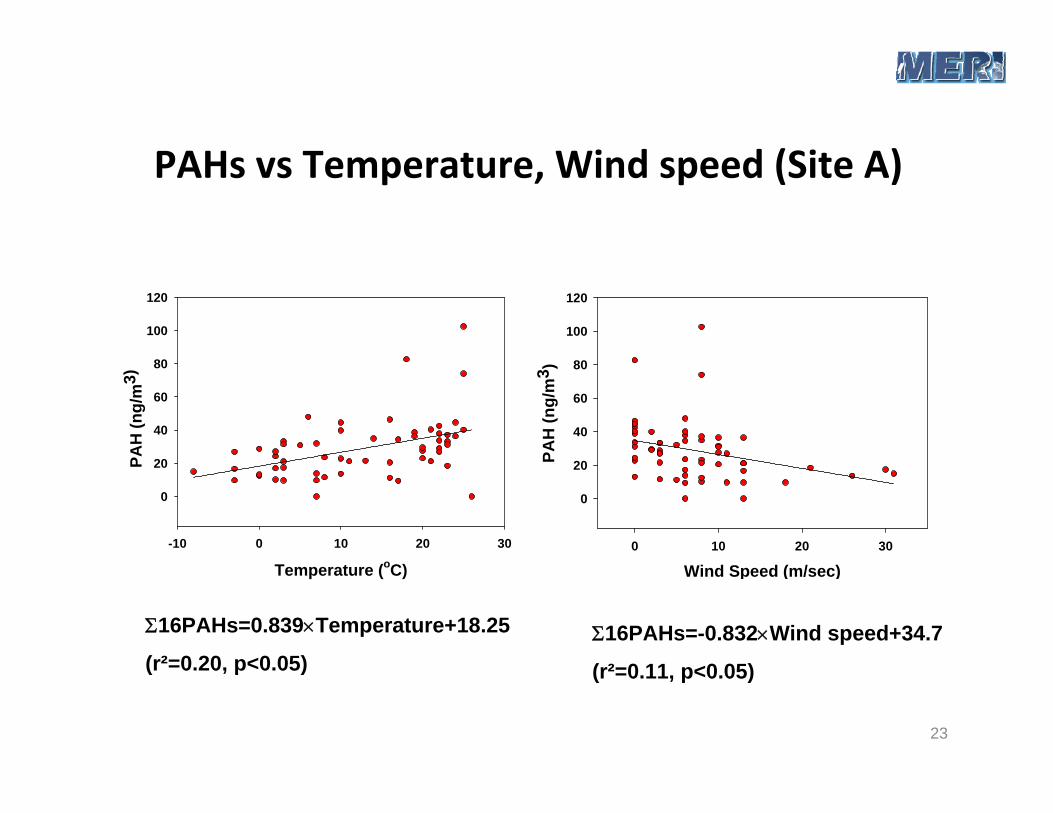
PAHs vs Temperature, Wind speed (Site A)
Temperature (oC)-10 0 10 20 30
PAH
(ng/
m3)
0
20
40
60
80
100
120
16PAHs=0.839Temperature+18.25
(r²=0.20, p<0.05)16PAHs=-0.832Wind speed+34.7
(r²=0.11, p<0.05)
Wind Speed (m/sec)0 10 20 30
PAH
(ng/
m3 )
0
20
40
60
80
100
120
24
Seasonal effects
25
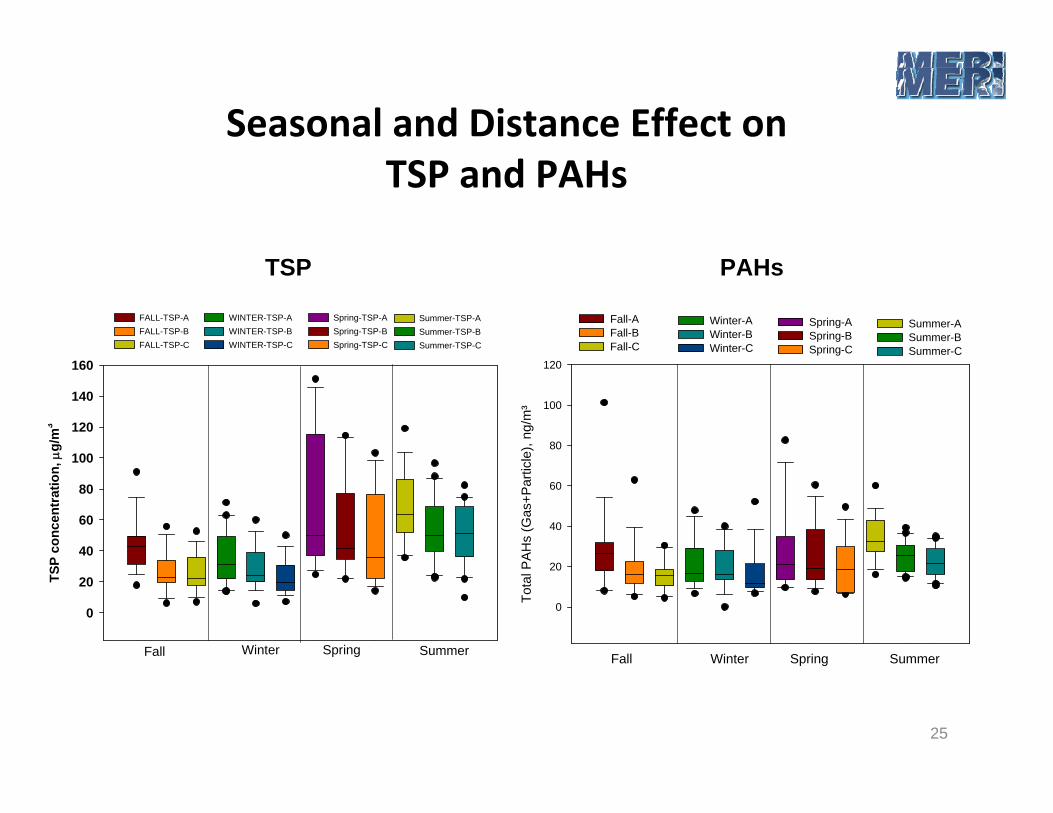
Seasonal and Distance Effect on TSP and PAHs
TSP
conc
entr
atio
n,
g/m
3
0
20
40
60
80
100
120
140
160
Fall Winter Spring
FALL-TSP-A FALL-TSP-B FALL-TSP-C
WINTER-TSP-A WINTER-TSP-B WINTER-TSP-C
Spring-TSP-A Spring-TSP-B Spring-TSP-C
Summer
Summer-TSP-A Summer-TSP-B Summer-TSP-C
Tota
l PA
Hs
(Gas
+Par
ticle
), ng
/m³
0
20
40
60
80
100
120
Fall-A Fall-B Fall-C
Winter-A Winter-B Winter-C
Spring-A Spring-B Spring-C
Summer-A Summer-B Summer-C
Fall Winter Spring Summer
TSP PAHs
26
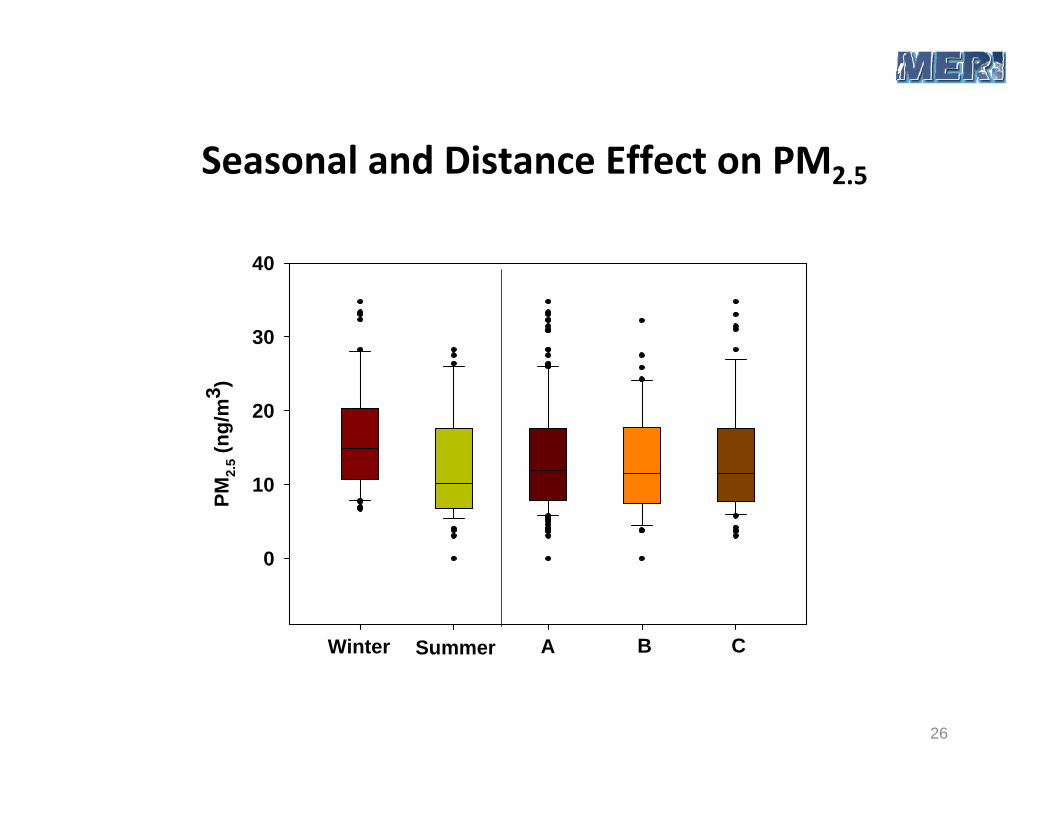
Seasonal and Distance Effect on PM2.5
PM2.
5 (ng
/m3 )
0
10
20
30
40
Winter Summer A B C
27
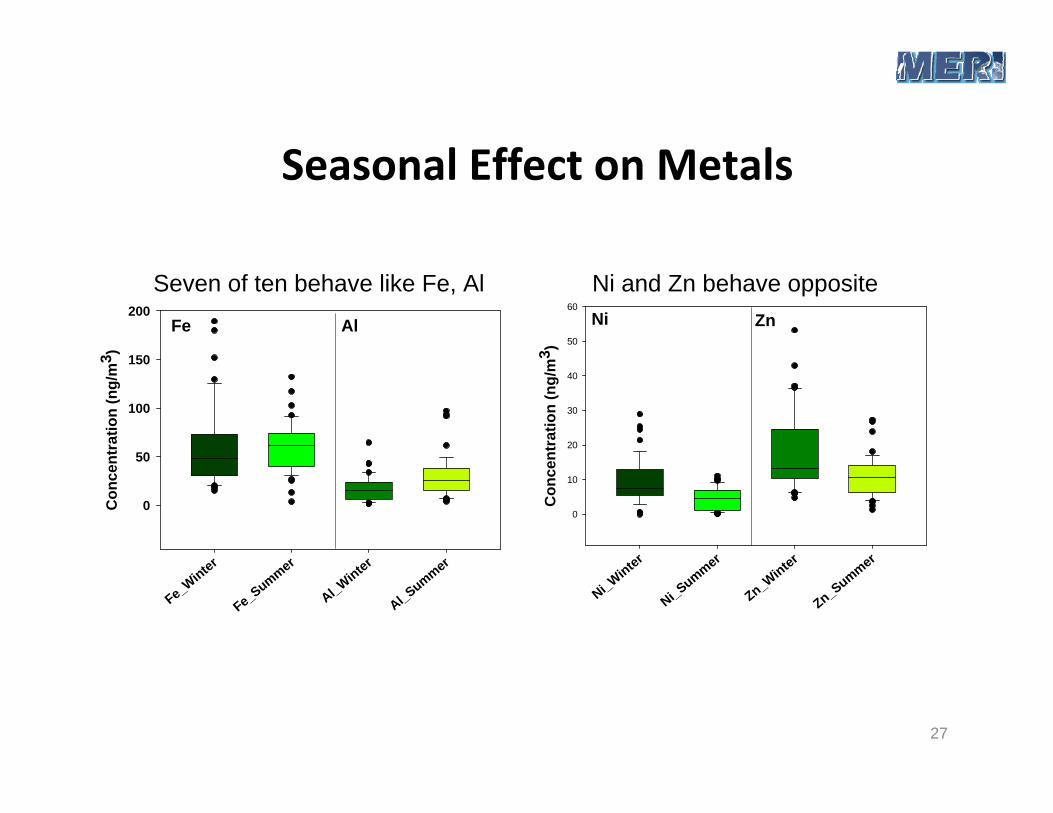
Seasonal Effect on Metals
Fe_Winter
Fe_Summer
Al_Winter
Al_Summer
Con
cent
ratio
n (n
g/m
3 )
0
50
100
150
200Fe Al
Ni_Winter
Ni_Summer
Zn_Winter
Zn_SummerC
once
ntra
tion
(ng/
m3 )
0
10
20
30
40
50
60Ni Zn
Seven of ten behave like Fe, Al Ni and Zn behave opposite

28
Day of the week
29
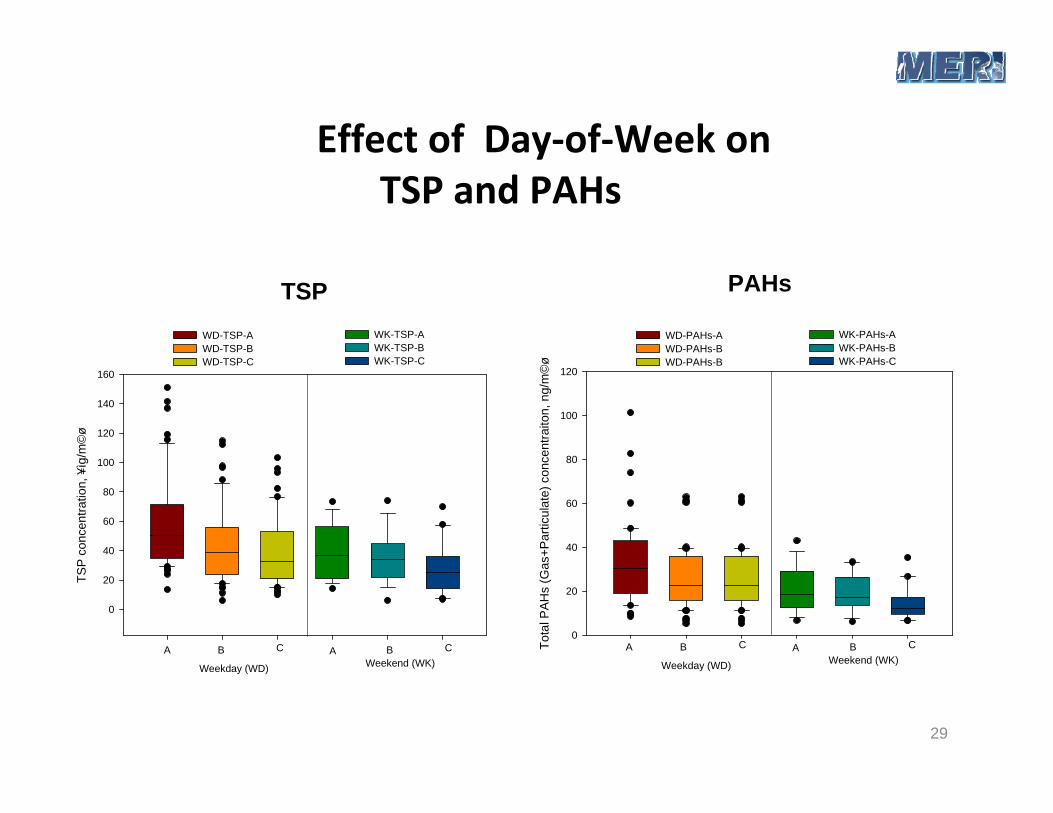
Effect of Day‐of‐Week on TSP and PAHs
TSP PAHs
Tota
l PAH
s (G
as+P
artic
ulat
e) c
once
ntra
iton,
ng/
m©
ø
0
20
40
60
80
100
120
A B C A B C
Weekday (WD) Weekend (WK)
WD-PAHs-A WD-PAHs-B WD-PAHs-B
WK-PAHs-A WK-PAHs-B WK-PAHs-C
TSP
con
cent
ratio
n, ¥
ìg/m
©ø
0
20
40
60
80
100
120
140
160
A B C A B C
Weekday (WD) Weekend (WK)
WD-TSP-A WD-TSP-B WD-TSP-C
WK-TSP-A WK-TSP-B WK-TSP-C
30
Metal concentrations associated with particle size
31
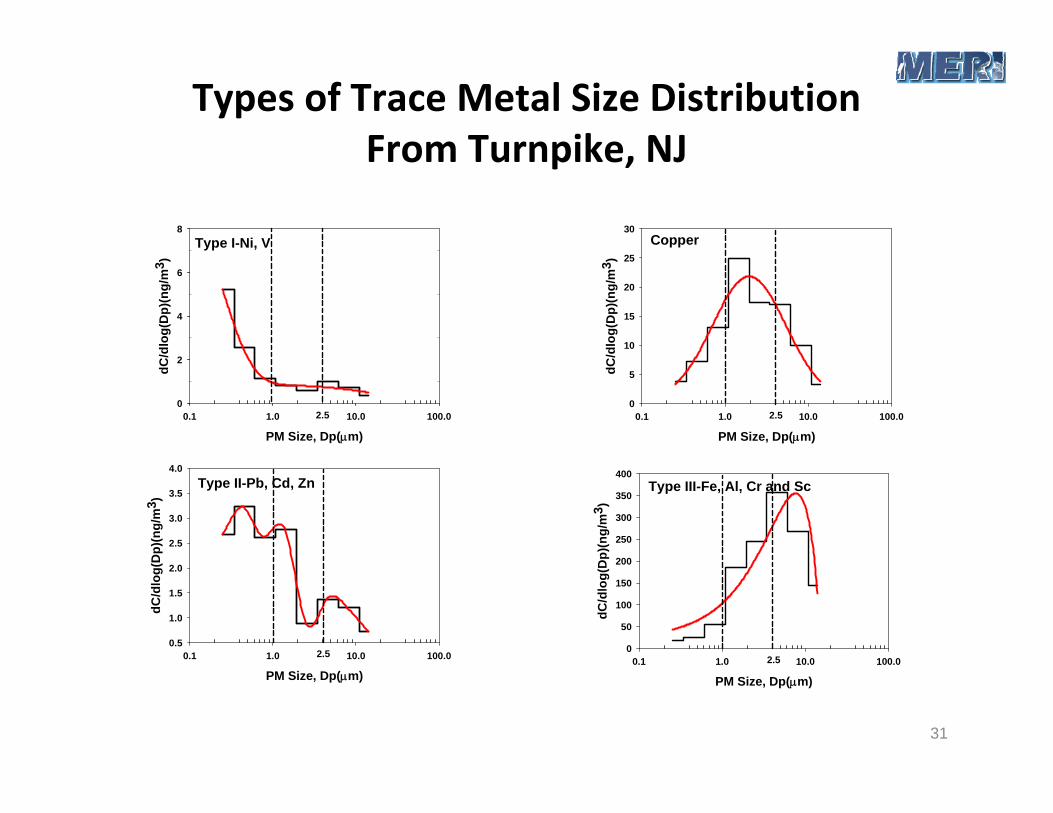
Types of Trace Metal Size Distribution From Turnpike, NJ
Type I-Ni, V
PM Size, Dp(m)0.1 1.0 10.0 100.0
dC/d
log(
Dp)
(ng/
m3 )
0
2
4
6
8
2.5
Copper
PM Size, Dp(m)0.1 1.0 10.0 100.0
dC/d
log(
Dp)
(ng/
m3 )
0
5
10
15
20
25
30
2.5
Type III-Fe, Al, Cr and Sc
PM Size, Dp(m)0.1 1.0 10.0 100.0
dC/d
log(
Dp)
(ng/
m3 )
0
50
100
150
200
250
300
350
400
2.5
Type II-Pb, Cd, Zn
PM Size, Dp(m)0.1 1.0 10.0 100.0
dC/d
log(
Dp)
(ng/
m3 )
0.5
1.0
1.5
2.0
2.5
3.0
3.5
4.0
2.5
32
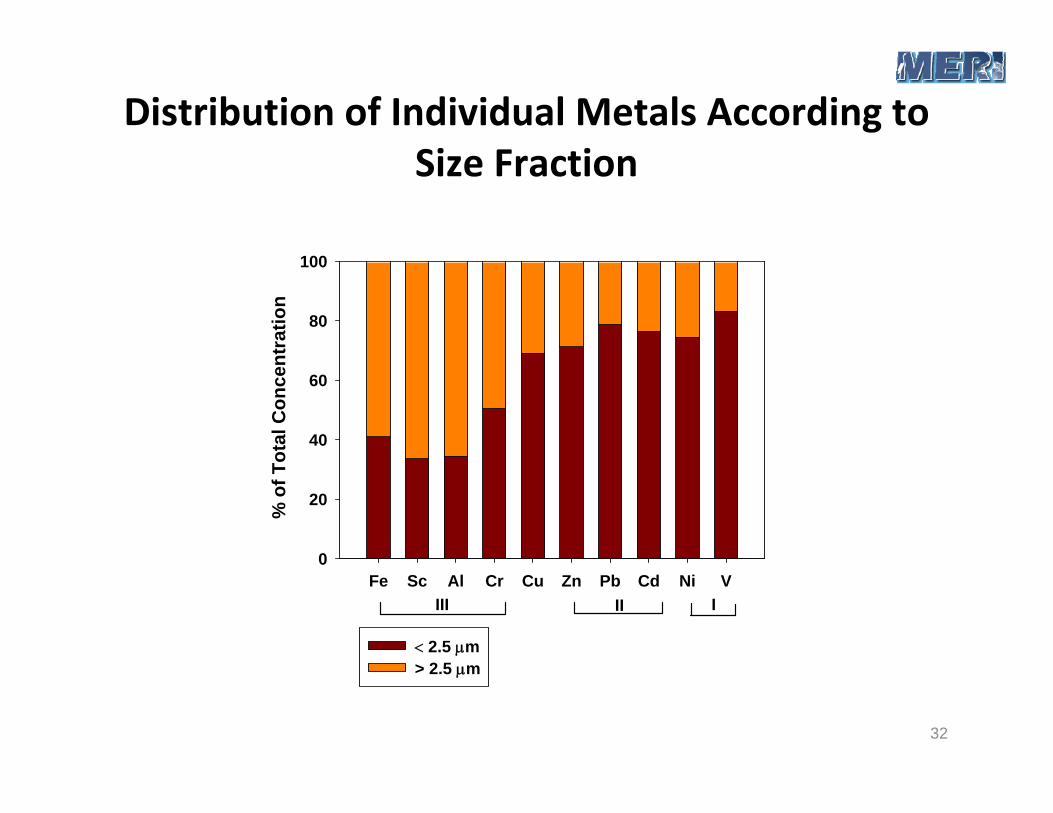
Distribution of Individual Metals According to Size Fraction
Fe Sc Al Cr Cu Zn Pb Cd Ni V
% o
f Tot
al C
once
ntra
tion
0
20
40
60
80
100
2.5 m> 2.5 m
IIIII I
33
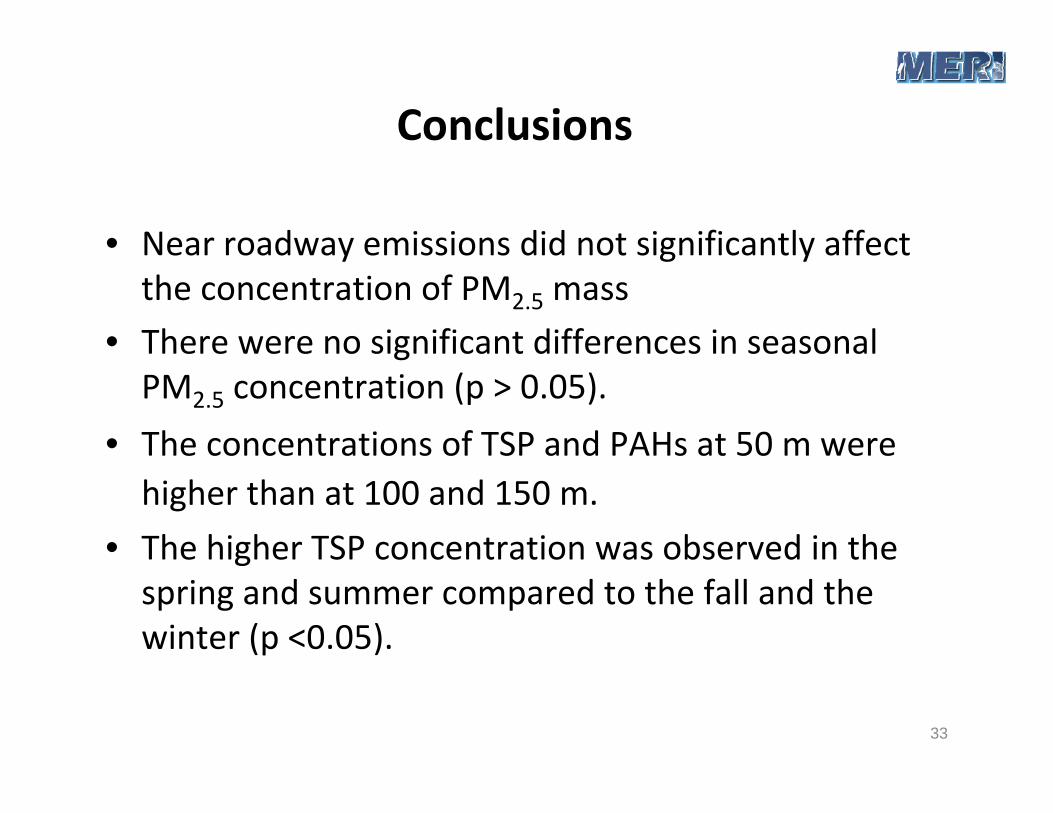
Conclusions
• Near roadway emissions did not significantly affect the concentration of PM2.5 mass
• There were no significant differences in seasonal PM2.5 concentration (p > 0.05).
• The concentrations of TSP and PAHs at 50 m were higher than at 100 and 150 m.
• The higher TSP concentration was observed in the spring and summer compared to the fall and the winter (p <0.05).
34
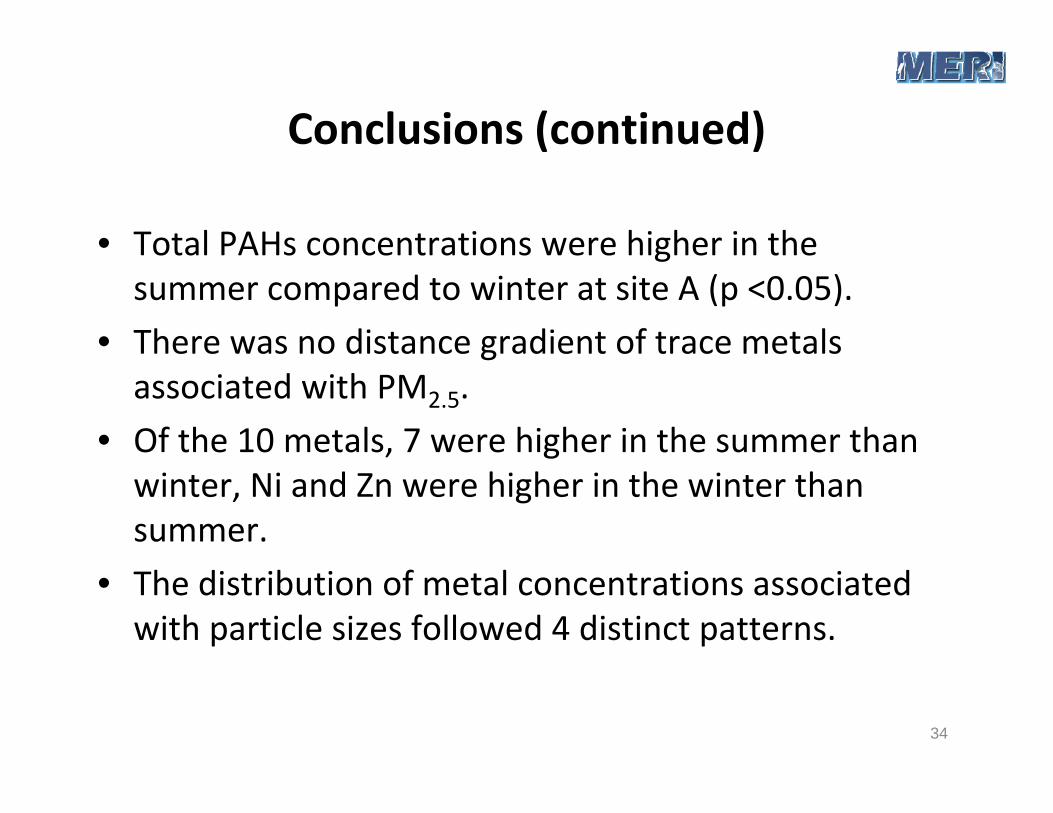
Conclusions (continued)
• Total PAHs concentrations were higher in the summer compared to winter at site A (p <0.05).
• There was no distance gradient of trace metals associated with PM2.5.
• Of the 10 metals, 7 were higher in the summer than winter, Ni and Zn were higher in the winter than summer.
• The distribution of metal concentrations associated with particle sizes followed 4 distinct patterns.

35
MERI Webpage
http://meri.njmeadowlands.gov/
Current_Projects/