Models for the elastic deformation of honeycombs for the elastic deformation of honeycombs 407 where...
20
ELSEVIER Composirr Structures 35 (1996) 403-422 0 1997 Elsevier Science Ltd Printed in Great Britain. All rights reserved 0263~8223/96/$15.00 Pll:SO263-8223(96)00054-2 Models for the elastic deformation of honeycombs I. G. Masters & K. E. Evans School of Engineeting, University of Exeter; North Park Road, Exeter EX4 4QE UK A theoretical model has been developed for predicting the elastic constants of honeycombs based on the deformation of the honeycomb cells by hexme, stretching and hinging. This is an extension of earlier work based on flexure alone. The model has been used to derive expressions for the tensile moduli, shear moduli and Poisson’s ratios. Examples are given of structures with a negative Poisson’s ratio. It is shown how the properties can be tailored by varying the relative magnitudes of the force constants for the different deformation mechanisms. Off-axis elastic constants are also calculated and it is shown how the moduli and Poisson’s ratios vary with applied loading direction. Depending on the geometry of the honeycomb the properties may be isotropic (for regular hexagons) or extremely anisotropic. Again, the degree of anisotropy is also affected by the relative magnitude of the force constants for the three deformation mechanisms. 0 1997 Elsevier Science Ltd. All rights reserved. INTRODUCTION Honeycomb core materials are widely used in the manufacture of stiff, lightweight sandwich panels mainly for use in aircraft. Commercial honeycombs are most commonly based on a hexagonal cell shape which is simple to produce and ideal for the manufacture of flat sandwich panels. A disadvantage of the hexagonal cell honeycomb is that if it is bent out-of-plane it produces an anticlastic or saddle-shaped curva- ture due to the effective in-plane Poisson’s ratio being positive. With such a honeycomb doubly curved structures, e.g. radomes can only be pro- duced by forcing a sheet of honeycomb into the desired shape, causing local crushing of the cells, or by machining a block to the required profile which is expensive. However, if the effective Poisson’s ratio is made negative by altering the cell shape the domed or synclastic curvatures can be achieved naturally.’ The value of the in-plane Poisson’s ratio is determined by the cell geometry alone whereas the stiffness in bending of the sheet of honey- comb is related to the mechanism by which the individual cells deform, which in turn, is deter- mined by the material properties of the cell wall material.*“’ Honeycombs can be envisaged to deform when loaded in the plane by flexing and stretch- ing of the cell walls and by hinging at the cell wall junctions. Several workers have formulated mathematical models based on one or two of these mechanisms for specific geometries. The in-plane moduli of the hexagonal cell honey- comb has been successfully modelled by assuming that the cell walls flex like beams.2%4 Using simple mechanics to calculate the deflec- tions in each beam the strains induced in an individual cell, and hence the whole network can be determined; enabling expressions for the moduli and Poisson’s ratios to be written for the condition of uniaxial loading. This simple model has been shown to give good agreement with experimental results for both metal and silicon rubber honeycombs.2*4 The flexure model was extended4 to include stretching and shear deflections but these refinements were found to provide negligible improvement to the model. Only in the particular case of a hexagonal cell honeycomb subjected to biaxial loading was the contribution of stretching considered significant. 403
Transcript of Models for the elastic deformation of honeycombs for the elastic deformation of honeycombs 407 where...
ELSEVIER
Composirr Structures 35 (1996) 403-422 0 1997 Elsevier Science Ltd
Printed in Great Britain. All rights reserved 0263~8223/96/$15.00
Pll:SO263-8223(96)00054-2
Models for the elastic deformation of honeycombs
I. G. Masters & K. E. Evans School of Engineeting, University of Exeter; North Park Road, Exeter EX4 4QE UK
A theoretical model has been developed for predicting the elastic constants of honeycombs based on the deformation of the honeycomb cells by hexme, stretching and hinging. This is an extension of earlier work based on flexure alone. The model has been used to derive expressions for the tensile moduli, shear moduli and Poisson’s ratios. Examples are given of structures with a negative Poisson’s ratio. It is shown how the properties can be tailored by varying the relative magnitudes of the force constants for the different deformation mechanisms. Off-axis elastic constants are also calculated and it is shown how the moduli and Poisson’s ratios vary with applied loading direction. Depending on the geometry of the honeycomb the properties may be isotropic (for regular hexagons) or extremely anisotropic. Again, the degree of anisotropy is also affected by the relative magnitude of the force constants for the three deformation mechanisms. 0 1997 Elsevier Science Ltd. All rights reserved.
INTRODUCTION
Honeycomb core materials are widely used in the manufacture of stiff, lightweight sandwich panels mainly for use in aircraft. Commercial honeycombs are most commonly based on a hexagonal cell shape which is simple to produce and ideal for the manufacture of flat sandwich panels. A disadvantage of the hexagonal cell honeycomb is that if it is bent out-of-plane it produces an anticlastic or saddle-shaped curva- ture due to the effective in-plane Poisson’s ratio being positive. With such a honeycomb doubly curved structures, e.g. radomes can only be pro- duced by forcing a sheet of honeycomb into the desired shape, causing local crushing of the cells, or by machining a block to the required profile which is expensive. However, if the effective Poisson’s ratio is made negative by altering the cell shape the domed or synclastic curvatures can be achieved naturally.’
The value of the in-plane Poisson’s ratio is determined by the cell geometry alone whereas the stiffness in bending of the sheet of honey- comb is related to the mechanism by which the individual cells deform, which in turn, is deter-
mined by the material properties of the cell wall material.*“’
Honeycombs can be envisaged to deform when loaded in the plane by flexing and stretch- ing of the cell walls and by hinging at the cell wall junctions. Several workers have formulated mathematical models based on one or two of these mechanisms for specific geometries. The in-plane moduli of the hexagonal cell honey- comb has been successfully modelled by assuming that the cell walls flex like beams.2%4 Using simple mechanics to calculate the deflec- tions in each beam the strains induced in an individual cell, and hence the whole network can be determined; enabling expressions for the moduli and Poisson’s ratios to be written for the condition of uniaxial loading. This simple model has been shown to give good agreement with experimental results for both metal and silicon rubber honeycombs.2*4 The flexure model was extended4 to include stretching and shear deflections but these refinements were found to provide negligible improvement to the model. Only in the particular case of a hexagonal cell honeycomb subjected to biaxial loading was the contribution of stretching considered significant.
403
404 I. G. Masters, K. E. Evans
A related approach has been proposed” for predicting the in-plane properties of graphite by assuming that deformation of the cellular net- work occurred by stretching of the atomic bonds and changes in bond angle, i.e. hinging. Other workers” have used the flexure model to determine the Young’s moduli and Poisson’s ratio of theoretical molecular structures, and compared the results with those obtained by molecular modelling and finite element analysis. The simple flexure model was found to consist- ently overestimate the values of E and 1’ predicted by molecular modelling. This implies that although flexure might be the dominant mechanism there must be contributions from stretching, and or hinging. In molecular net- works the stretching of molecular chains tends to increase the longitudinal deformation at the expense of transverse thus reducing the Pois- son’s ratio. In cardboard honeycombs hinging has been shown to be the dominant mechan- ism,77x the low forces required to operate the hinges in these materials giving rise to extremely flexible honeycombs.
Stretching and hinging mechanisms have been combined to develop a model for predict- ing the Poisson’s ratio of both hexagonal and re-entrant cell three-dimensional (3D) struc- tures”.“’ which in a generalized form” can describe the Poisson’s ratio of polymer mole- cules. For the latter types of structure the cell orientations are random unlike periodic honey- combs and hence produce very different results. Flexing and stretching have also been com- bined’* to describe the elasticity of rigid, disordered 3D networks.
These mathematical models show that for regular hexagonal-celled honeycomb structures Poisson’s ratios in excess of +1 can easily be achieved as a result of the open structure. The re-entrant cell shape identified by various work- ers 4,‘0,‘3.‘4 however, is shown to have a negative Poisson’s ratio, which may also be much less than -1.
In this paper all three mechanisms of flexing, hinging and stretching are combined. New expressions for shear moduli as well as Young’s moduli and Poisson’s ratio are derived to explore the off-axis properties of the honey- combs using the axis transformation equations. ” Polar plots of properties are obtained that enable us to determine the com- bination of material properties that lead to an auxetic honeycomb which is nearly isotropic, as
opposed to the highly anisotropic behaviour seen in honeycombs deforming by one mechan- ism alone.
MODELS
To aid comparison of the models each can be written in terms of a force constant Kj which also facilitates combining the three mechanisms to generate a general model.
Force constants
The elastic constants of a two-dimensional (2D) honeycomb can be described by considering the displacement of the single cell, from which the honeycomb is produced by translational repeti- tion, under appropriate loading conditions.
The force constants relate the displacement of the cell walls of a honeycomb to the applied force which causes it. For all three mechanisms the force constant is defined by the general relationship
F = K;6 (‘1
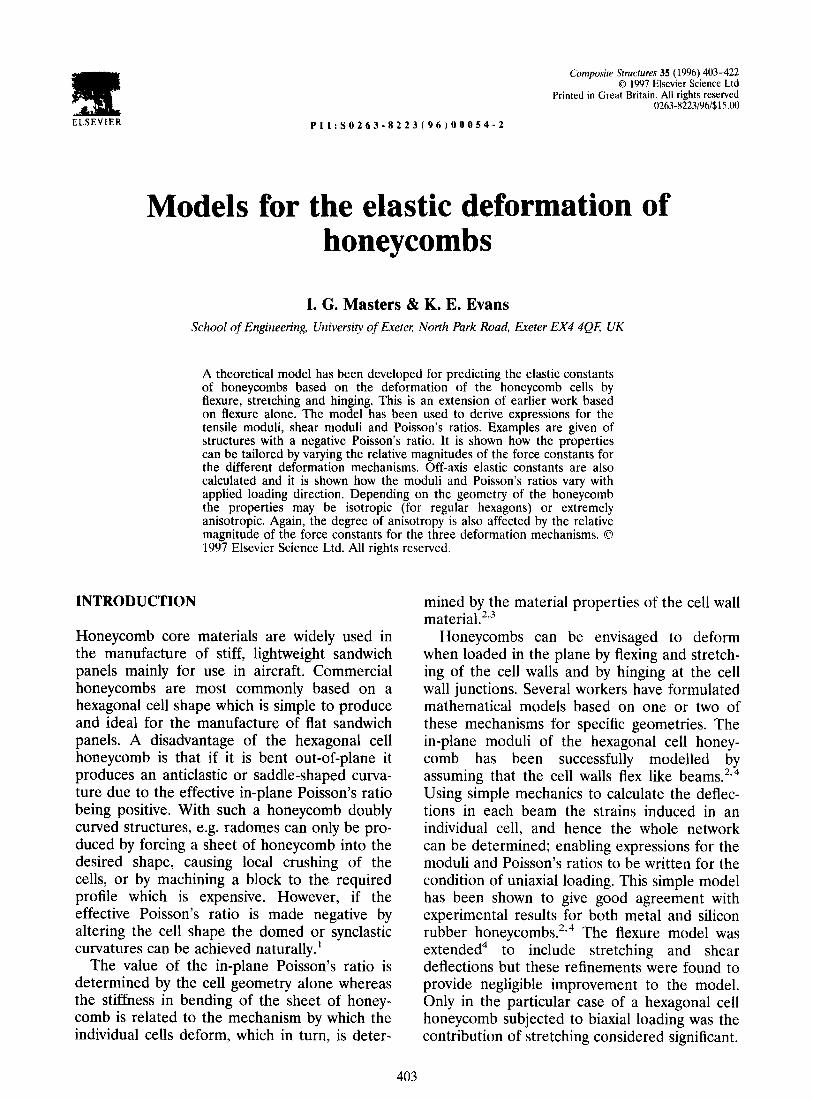
where F is the applied force, K, is the force constant and 6 is the displacement. The force constant contains details of the mechanical properties of the cell wall material and the net- work structure itself. For example, in a molecular network Kj can be related directly to the atomic force constants. The conventional case of macroscopic honeycombs of cell wall lengths I and h, thickness t and depth b (see Fig. 1) is considered here and it is assumed that the elastic constants of the material forming the cell walls are known; E,s being the Young’s modulus and G, being the shear modulus. Explicit rela- tionships between Kj and the properties of the cell wall can therefore be derived for each of the deformation mechanisms of flexure, stretch- ing and hinging.
Flexure force constant Kf
A cell wall of length 1 deforming by flexing can be likened to a cantilever beam loaded and guided at one end and fixed at the other.’ The deflection of the guided end due to flexingI is given by
Models for the elastic deformation of honeycombs 405
(a) 2 t h + 1 sin0
0)) 2 t
/t + 1 sin(-8) * w
I’ Fig. 1. Cell geometry and coordinate system used for (a)
hexagonal and (b) re-entrant cells.
Ml2 a= -
12E.J (2)
where M is the applied moment=t;l, I is the second moment of area of the cell wall=bt”/12. Therefore
b=z_ E,Tbt”
Comparing this with eqn (1) gives
K = E.&t’ .f
1’
(3)
(4)
Stretching force constant KS
The extension of a cell wall, length I, due to the axial force F acting along it, is
Fl 6= -
bt Es
Comparing this with eqn (1) gives
btE, &= -
1
(5)
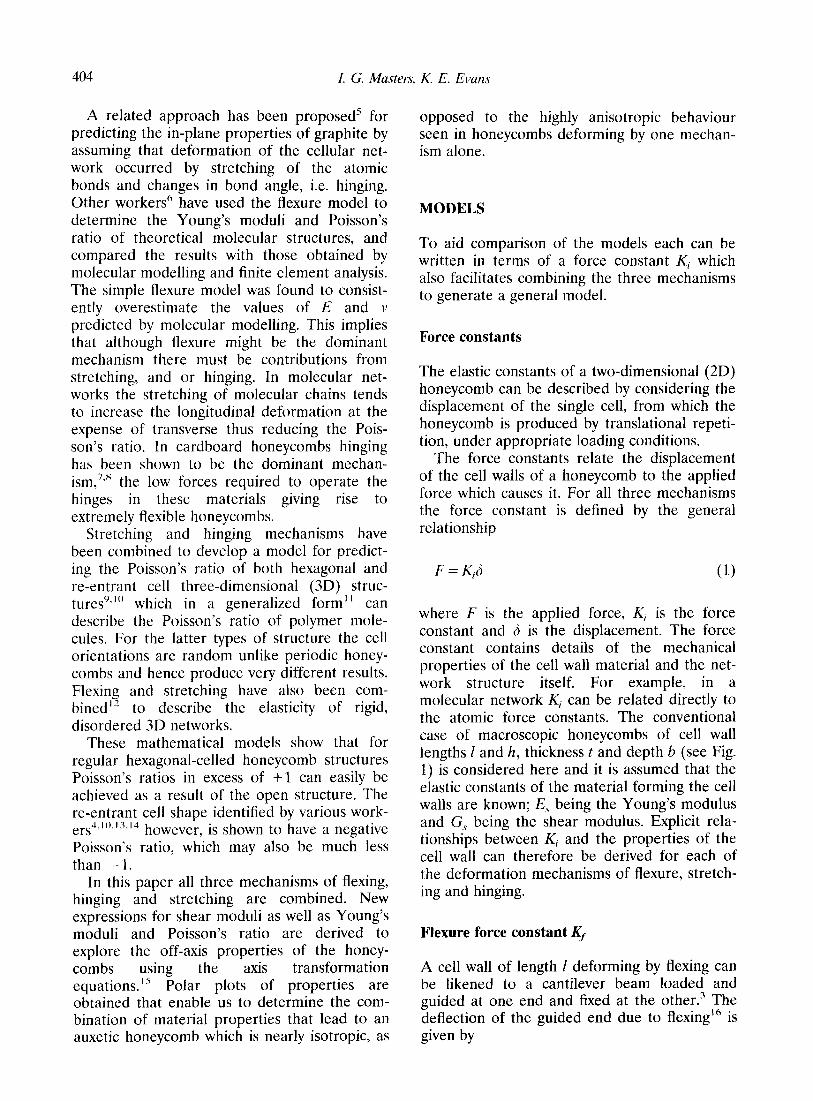
Hinging force constant Kh
Finally, for a cell deforming by hinging, we assume that the cell wall is rigid along its length and deflection occurs at the junction with other cell walls by a change of angle AO. Hence for a wall of length 1
(5=lsinAOzlA(I (7)
if A0 is small. Substituting into the general for- mula (eqn (1)) gives
F = KJAO (8)
The actual mechanism by which hinging occurs can be envisaged as one of two processes; global shear or local bending.
In global shear the relationship of Kh to material parameters is obtained by assuming that hinging occurs by shearing of the material at the cell wall junction (Fig. 2). Using the standard definition of shear modulus we can say
F Gs= -
btAO
where Gs is the shear modulus of the cell wall
(9)
material and F is the force applied perpendicu- lar to the beam. Comparing with eqn (8) gives
G,bt K,, = -
1 (10)
The shear mechanism is important when con- sidering small-celled foams and molecular networks but is unrealistic for the macro-net- works, like honeycombs, where hinging is
Fig. 2. Schematic diagram of hinging due to shearing of the cell wall material.
I. G. Masters, K. E. Evans 406
/
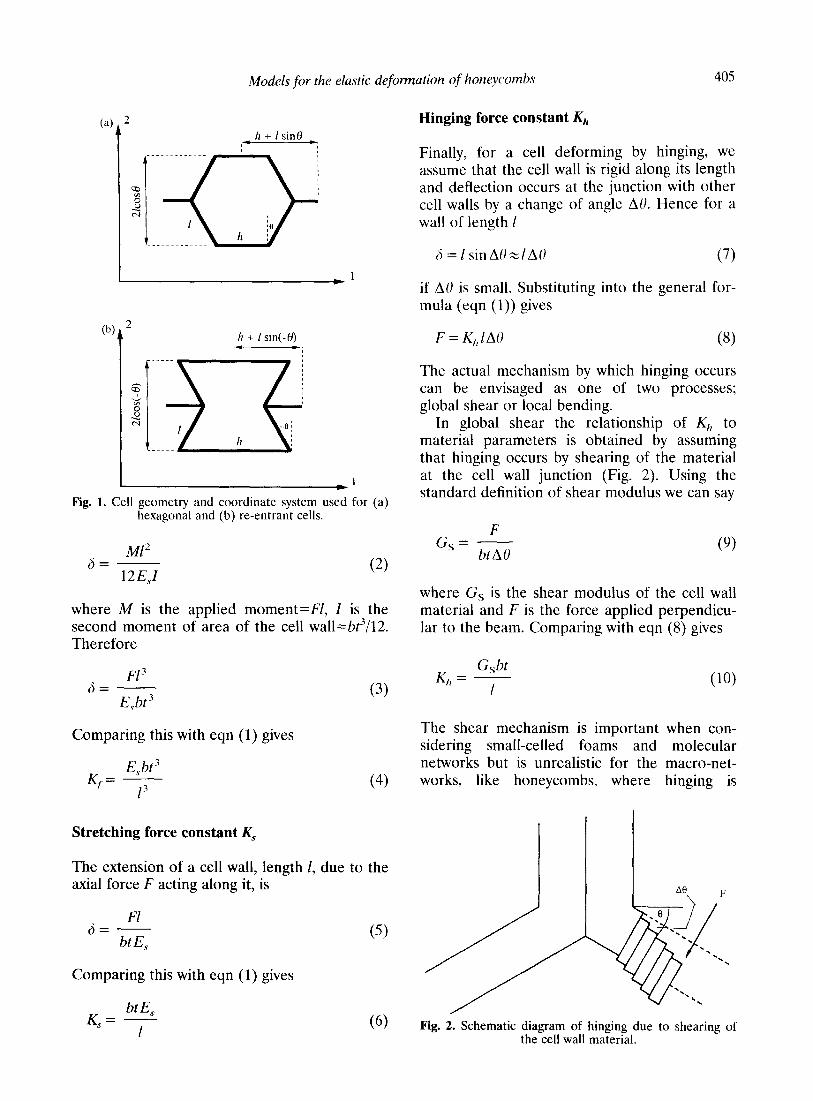
Fig. 3. Schematic diagram of hinging due to local bending of the cell wall.
obviously a local effect. To model the latter type of behaviour we can imagine the hinge to be a short, curved beam, of axial length q, in the vicinity of the cell node (Fig. 3).
Assuming that a curved beam behaves in accordance with simple bending theory16 then the change in angle II/ to I+V due to an applied moment M is given by
i.e.
(11)
(12)
But as can be seen from Fig. 3, II/ = 90 - 0 and rl/’ = 90-O--A(!). Hence we can say
m Aij=Ao= -
E.J (13)
where 19 is the cell angle. If q <1 then the moment (M) acting on the hinge can be assumed to be approximately equal to the length of the cell wall multiplied by the applied force
Hence
A()= ?i!- 2EJ
(15)
Comparing this with eqn (8) and substituting for I we obtain
E,ybt” Kh= -
612q (16)
Note that when q tends to I we do not achieve the flexure expression (eqn (4)) due to the dif- ferent boundary conditions; simply supported beam as opposed to the beam end being guided.
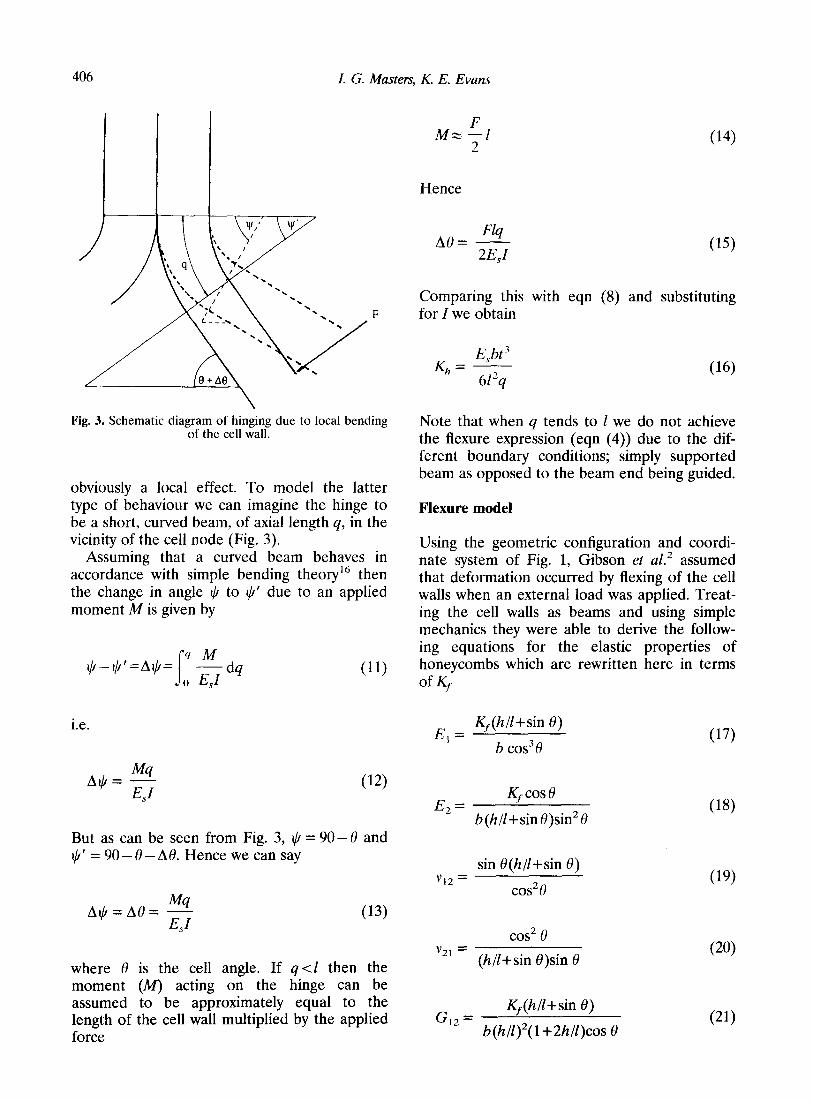
Flexure model
Using the geometric configuration and coordi- nate system of Fig. 1, Gibson et aL2 assumed that deformation occurred by flexing of the cell walls when an external load was applied. Treat- ing the cell walls as beams and using simple mechanics they were able to derive the follow- ing equations for the elastic properties of honeycombs which are rewritten here in terms of Kf
E, = Kf(h/l+sin 6)
b cos30 (17)
E,= Kf cos 0
b(h/l+sinQ)sin2Q
sin @(h/l+sin 0) VI2 =
cos2tl
cos2 8 v2’ = (h/Z+sin 0)sin 8
(312 =
K,(h/l+sin 0)
b(h/l)2(1+2h/f)cos 6’
(18)
(1%
(20)
(21)
Models for the elastic deformation of honeycombs 407
where El, E,, v12, v21 and G,, are the elastic constants for the honeycomb. This model has been shown to be very successful for modelling a great variety of conventional honeycombs and reticulated foams.4 If 8 is made negative (Fig. 1) then the Poisson’s ratio of the cell becomes negative in value; a condition known as aux- etic.” The Young’s moduli and Poisson’s ratio expressions for the flexure model comply with the reciprocal relation E,v,, = E2~,2 as required for a symmetric stiffness matrix.’
Stretching
This model assumes that the cell walls are only able to deform by stretching along their axes with no change in angle. This is akin to a set of connected shock absorbers.”
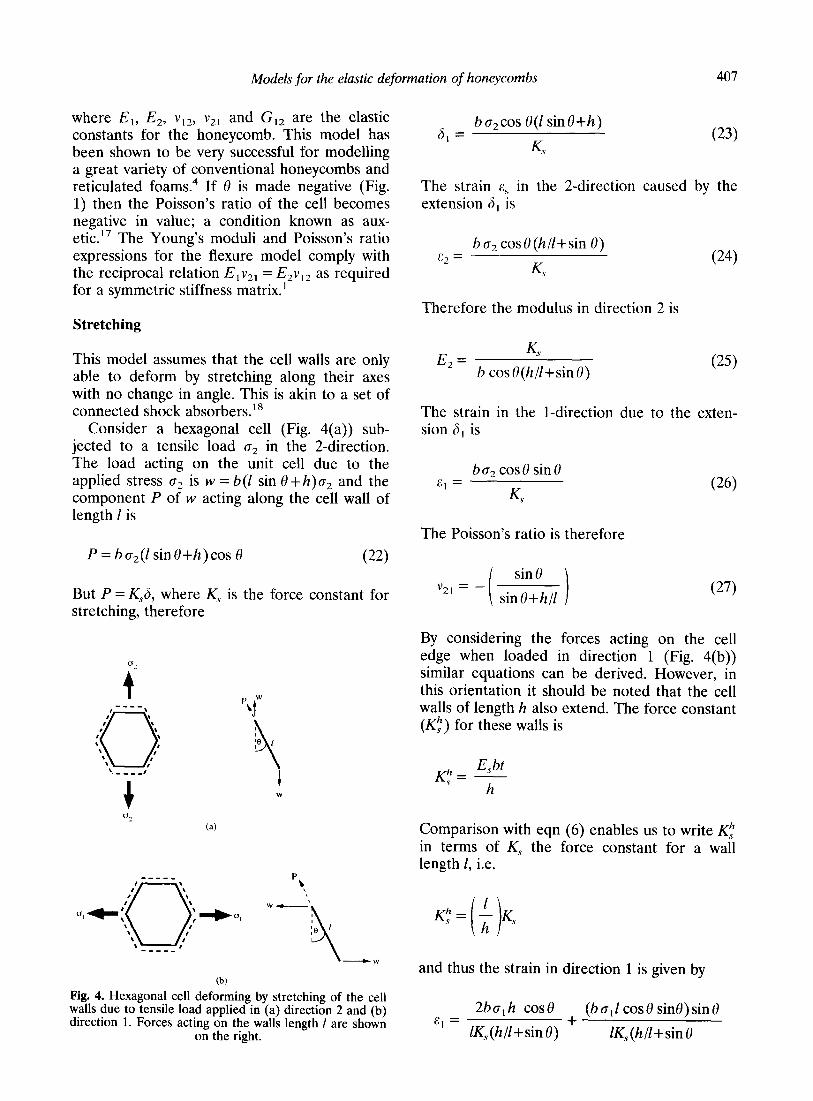
Consider a hexagonal cell (Fig. 4(a)) sub- jected to a tensile load g2 in the 2-direction. The load acting on the unit cell due to the applied stress c2 is w = b(Z sin 8 +h)o, and the component P of w acting along the cell wall of length 1 is
P = bcr,(Z sinO+h)cos 8 (22)
But P = K.,S, where K.:, is the force constant for stretching, therefore
-mm__
4’ \ \ ,I \ \
On+: 0 \ , \ \ I’ \ \ 8’ -____
(b)
Fig. 4. Hexagonal cell deforming by stretching of the cell walls due to tensile load applied in (a) direction 2 and (b) direction 1. Forces acting on the walls length 1 are shown
on the right.
6 I
= b rr2cos O(I sinO+h)
KS (23)
The strain 6, in the 2-direction caused by the extension 6, is
b c2 cos 0 (h/l+sin 0) c2 =
K, (24)
Therefore the modulus in direction 2 is
E, = KS
b cos O(h/l+sin 0) (25)
The strain in the l-direction due to the exten- sion 6, is
bo, cos0 sin0 c, =
K
The Poisson’s ratio is therefore
v2,= -( siz+;,l j
(26)
(27)
By considering the forces acting on the cell edge when loaded in direction 1 (Fig. 4(b)) similar equations can be derived. However, in this orientation it should be noted that the cell walls of length h also extend. The force constant (Kf) for these walls is
E,bt K$ -
h
Comparison with eqn (6) enables us to write Kt in terms of K, the force constant for a wall length 1, i.e.
and thus the strain in direction 1 is given by
2ba,h cos0
” = IK,(h/l+sinO) +
(bo,f cos0 sinO)sinO
lKJhll+sin0
408 I. G. Masters, K. E. Evans
bo, cosU(2h/l+sin*U) I:, =
&(h/f+sin 0) (28)
and the strain in the 2-direction is
bo,cosO sin0 c2 =
KS (29)
The modulus in the l-direction is therefore
E, = K,(h/l+sin 0)
b cos 0(2h/l+sin*U) (30)
and the Poisson’s ratio is
-sin O(h/l+sin 0) v,* =
2h/1+sin20 (31)
Note that when 0 is positive, i.e. the cell is hexagonal in shape, both v,* and v2, are nega- tive in value. Substituting (-0) into these equations produces the equivalent expressions for the re-entrant cell. It should also be noted that in the re-entrant case the direction of the forces in the walls of length 1 is reversed whilst the forces in the other walls remain unchanged.
Young’s moduli and Poisson’s ratio expres- sions have been derived4 for a hexagonal cell honeycomb subjected to a biaxial stress deform- ing by both flexure and stretching of the cell walls. It can be shown that for the conditions of a uniaxial applied stress and deformation only occurring by stretching that these equations reduce to eqns (25) (30) (27) and (31) respec- tively.
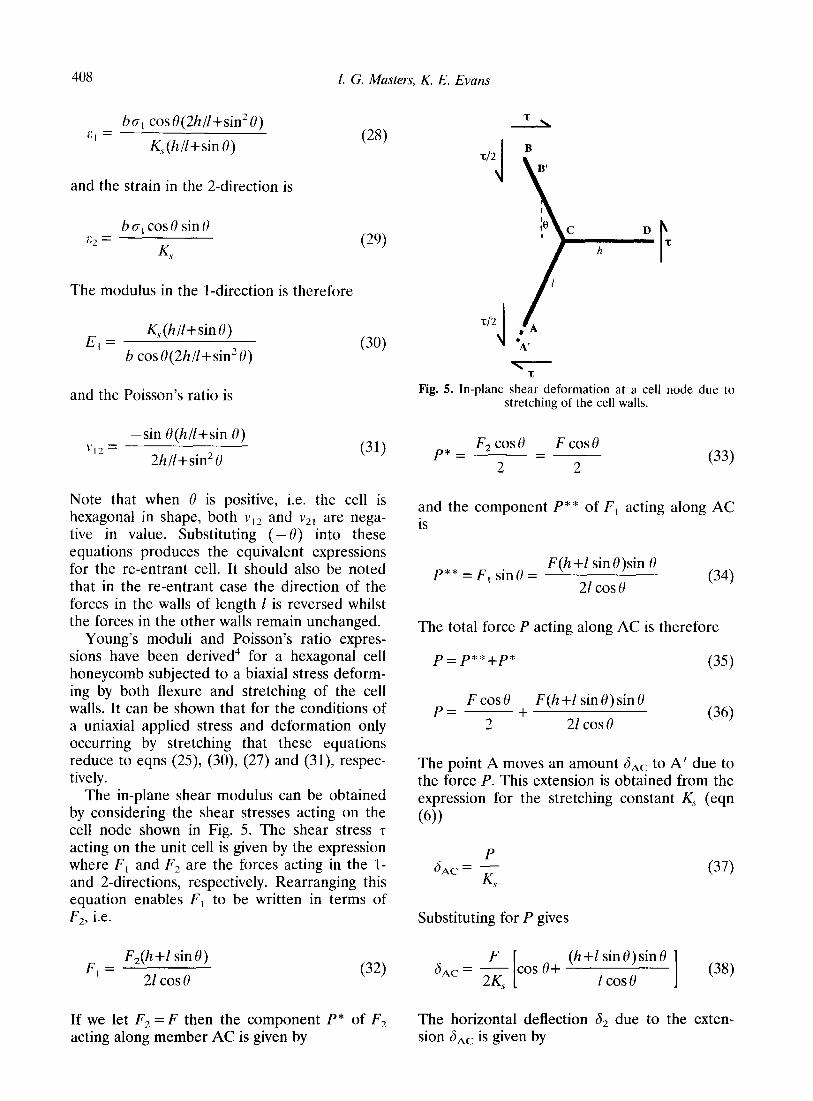
The in-plane shear modulus can be obtained by considering the shear stresses acting on the cell node shown in Fig. 5. The shear stress ‘5 acting on the unit cell is given by the expression where F, and F, are the forces acting in the l- and 2-directions, respectively. Rearranging this equation enables F, to be written in terms of F2, i.e.
F, = F,(h +Z sin 0)
21 cos 0 (32)
If we let F2 = F then the component P* of F, acting along member AC is given by
t/2
\i
t/2 1 \t-
Fig. 5. In-plane shear deformation at a cell node due to stretching of the cell walls.
F, cos 6, F cos0 p* = =
2 2 (33)
and the component P* * of F, acting along AC is
P** = F, sin6’ = F(h +I sin B)sin 0
21 cos 0 (34)
The total force P acting along AC is therefore
P=P**+P* (35)
F cos6’ P= +
F(h +I sin 0) sin 0
2 21 cos 0 (36)
The point A moves an amount 6,c to A’ due to the force P. This extension is obtained from the expression for the stretching constant K, (eqn
(6))
P 6 --
AC - K,y (37)
Substituting for P gives
F 6 - -
AC - 26, cos o+
(h+l sinO)sin0
1 case 1 (38) The horizontal deflection L& due to the exten- sion 6A, is given by
Models for the elastic deformation of honeycombs 409
6, = GA&OS 0
F 6,= - 2Ks I
cos2 0 + (h +I sin 0) sin 0 1 1 (39)
The vertical deflection 6, across the unit cell is
6, = 2bAV sin 0 (40)
The factor of two arises because the member CB shortens as much as AC extends. Therefore
F sinU ti, = ___ cosU+
K i
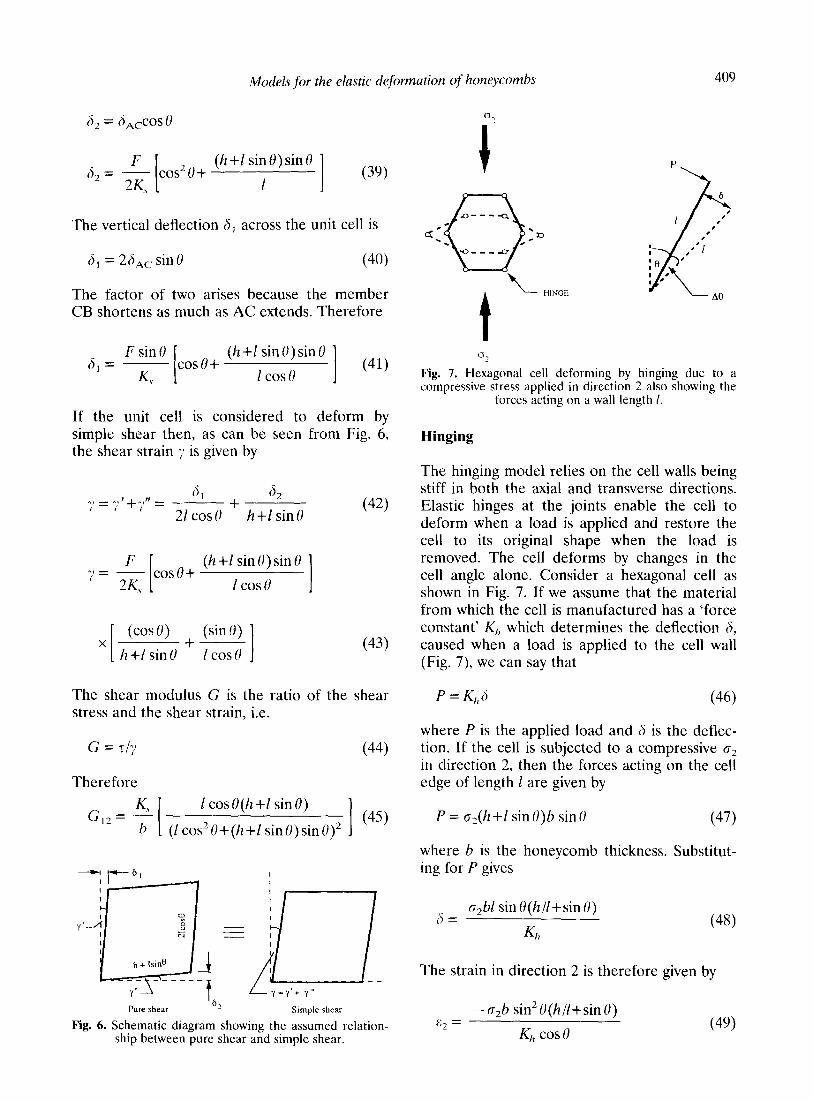
fh+l sinU)sinU 1 cos 0 1 (41) If the unit cell is considered to deform by simple shear then, as can be seen from Fig. 6, the shear strain 7 is given by
A, = ;,‘+f’ = 4 62
i + 21 cos 0 h+l sinU
F (h+l sinU)sinU “’ = - i cosU+
KS LCOSU I
x (cosU) + (sin 0)
h+l sinU 1 cos U 1
(42)
(43)
The shear modulus G is the ratio of the shear stress and the shear strain, i.e.
G = z/l (44)
Therefore
G,*= K, 1 cosU(h+l sinU)
h (1 cos*U+(h+l sinU)sinU)* 1 (45)
Pure shear Simple shear
Fig. 6. Schematic diagram showing the assumed relation- ship between pure shear and simple shear.
0,
t
HINGE
P
s
1 4t
?
8’ ,’
: ,“I ;I3 ’ I
I 0’ \ A6
Fig. 7. Hexagonal cell deforming by hinging due to a compressive stress applied in direction 2 also showing the
forces acting on a wall length 1.
Hinging
The hinging model relies on the cell walls being stiff in both the axial and transverse directions. Elastic hinges at the joints enable the cell to deform when a load is applied and restore the cell to its original shape when the load is removed. The cell deforms by changes in the cell angle alone. Consider a hexagonal cell as shown in Fig. 7. If we assume that the material from which the cell is manufactured has a ‘force constant’ K,, which determines the deflection 8, caused when a load is applied to the cell wall (Fig. 7) we can say that
P=K,J (46)
where P is the applied load and 6 is the deflec- tion. If the cell is subjected to a compressive o2 in direction 2, then the forces acting on the cell edge of length 1 are given by
P = cr2(h +I sin U)b sin U (47)
where h is the honeycomb thickness. Substitut- ing for P gives
n = o&l sin U(h/l+sin U)
K,, (48)
The strain in direction 2 is therefore given by
-o,b sin2U(h/l+sinU) + =
K,, cos U (4%
410 I. G. Masters. K. E. Evans
and the modulus in direction 2 by
E, = K,z cos 0
b sin*O(h/l+sin 0) (50)
The strain in direction 1 is
g2b sin 0 cos 0 c, =
K/1 (51)
and hence the Poisson’s ratio in the 2-direction is
--El 1’2, = -
62
cos* 0
= (h/l+sinO)sin 0 (52)
If the honeycomb is compressed in direction 1 then by a similar method we can determine that
c,b cos0 sin0 c2 =
Kh (53)
-o,b cos”0 Cl =
Kh (h/l+sin 0) (54)
E _ K,(h/l+sin 0) I-
b cos” 0 (55)
sin O(h/l+sin 0) “12 =
cos2 0 (56)
Comparing this result with the expression for v2, we can see that
1 “I2 =
“21
Again by substituting (- 0) into these equations we obtain expressions to describe the behaviour of a re-entrant cell.
As in the stretching model the in-plane shear modulus is obtained by considering the effects of the shear stresses z acting aIong the sides of
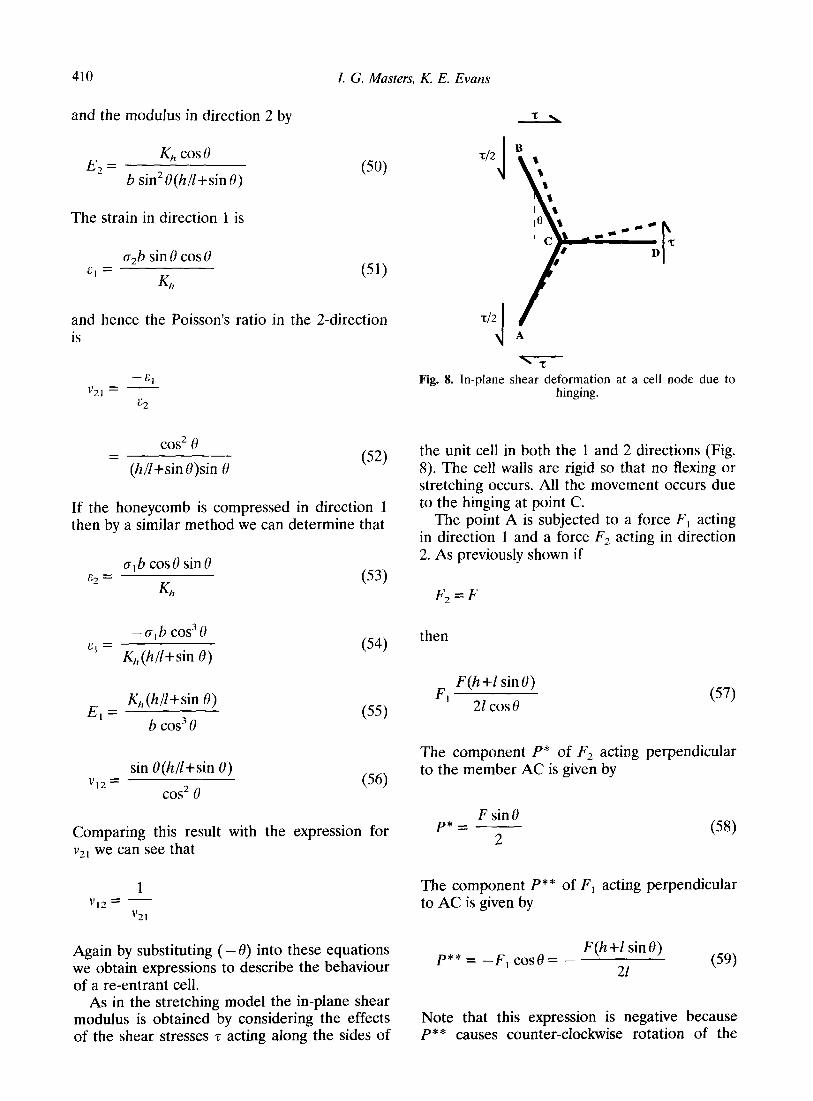
Fig. 8. In-plane shear deformation at a cell node due to hinging.
the unit cell in both the 1 and 2 directions (Fig. 8). The cell walls are rigid so that no flexing or stretching occurs. All the movement occurs due to the hinging at point C.
The point A is subjected to a force F, acting in direction 1 and a force F2 acting in direction 2. As previously shown if
F,=F
then
F1 F(h+l sin0)
21 cos 0 (57)
The component P* of F2 acting perpendicular to the member AC is given by
F sin0 p*= -
2 (58)
The component P** of F, acting perpendicular to AC is given by
P+* = -F, cos8 = - F(h +I sin 0)
21 (59)
Note that this expression is negative because P ** causes counter-clockwise rotation of the
Models for the elastic deformation of honeycombs 411
member AC. The total force P acting perpen- dicular to the member AC is therefore
P = P”+P”*
P= -$ [ sin&
(h+l sin0)
t 1
P-5 (60)
The force P rotates AC through an angle A8 such that the point A is deflected an amount 6 AC* From eqn (1) we know that
P 6 --
AC- &I
(61)
The displacement in direction 2 due to 6,, is
Psin8 6*,=6,,sinQ= -
& (62)
and the horizontal displacement of point D due to the force F, is
F F ((j**=_=_
2 K; K/,C (63)
where C is a constant, enabling Ki, the force constant for a cell wall of length h, to be written in terms of Kh, the force constant for a wall length 1. For the shear model (eqn (10)) C=l/h and for bending model (eqn (16)) C=(l/h)2. The total deflection in direction 2 is therefore
PsinO F F 6,=-
-Ch sirit)+ +-=-
K/Z K4 &I 2Cl 1 and the total displacement in direction 1 is
A general model
By summing the deflections in directions
(64)
2P cos 0 Fh cos 0 6, =
K, =- K,,l (65)
If we assume that the unit cell shown in Fig. 8 deforms by simple shear then the shear strain y is given by
1’= * I 62
21cosU’h+lsinO
F 21-Ch sin0 h
” 21K, C(h +I sin0) -7 1 (66) The negative sign in eqn (65) can be ignored since we are only interested in the length 6,. The remote shear stress z is given by
F z=
21b cos 0
Hence the shear modulus is
F G*=
21K, X-
21b COSU F
X Cl(h +1 sin8)
Ch(h+lsin8)+1(21-Ch sin0) 1
(67)
(68)
K/l G,2=-
b cosU
X Cl(h +f sin0)
Ch(h+Isin0)+1(21-Ch sin0) 1 (69)
1 and 2, we can combine the three models to obtain a . _
general expression. For example, if we consider a honeycomb loaded in direction 1 then the strains in direction 1 arising from deformation by stretching and hinging are given by eqns (28) and (54). The strain in direction 1 caused by flexure of the cell walls has been shown”34 to be
412 I. G. Masters, K. E. Evans
o,h14 cos’u
I”= 12E,,I(h+f sin(I)
where I is the second moment of area of the cell wall. Rewriting this in terms of the force constant for flexure F$ (eqn (4)) gives
I _ o,hcos3u > - ” K,(h/f + sin 0)
The total strain in direction 1, obtained by summing eqns (28) (56) and (72) is thus
(70)
(71)
The modulus in direction 1 is then given by
hence
1
cos2U + (2h/I+sin*h) (72)
-+- K,, KY 1
The strain in direction 2, due to flexing, arising from the applied stress o-, is given by the expression
6, bl-3 cos 0 sin 0 Cz =
12E,,I (73)
Writing in terms of the force constant this becomes
o,bcosOsinU C2 =
K,
Summing this expression with (29) and (53) g ives the total strain in direction 2
I;pta’=o,b cos(,I sin0 1 1 1
------+y Kf K,, s 1
(74)
(75)
Dividing this expression by (71) gives the Poisson’s ratio
Models for the elastic deformation of honeycombs
Using a similar method the following general expressions can be obtained for E2 and r2,
1 E,=
sin2 0 sin’ 0 cos 0 b (h /I + sin 0)
Kfcos 0 + K,, cos 0 +-
IY, 1 1 1 1
-sinO.cosO K~F-K L
.f I1 s 1 v 21=
sin* 0 sin’ 0 cos 0 (h/Z+sinO)
Kr cos 0 + K/, cos 0 +-
K,s 1 Gibson’s expression for the shear strain written in terms of the flexure force constant is
Fh2(f +2h) ‘r’=
2K,Z”(h +I sin0)
Summing this with expressions (45) and (69) the general shear modulus expression is obtained
1 G,2=
bh’(l+2h)cosO 1
Ch2+212 h cos 0
Kb2(h +I sin0 1 L +-
K,, Cl(h +I sin 0) 1 1 b(f cosZO+(h+ZsinO)sinO cos 0 sin 0
+ KS (h +fsinO) ’ cos0
413
(76)
(77)
(78)
(79)
(80)
If, for example, we put K,=K,y= rx, the above equations reduce to those for the flexure model.
DISCUSSION
The force constants
The properties of the force constants Kf KS and Kh are compared in Fig. 9 having evaluated the eqns (4) (6) (10) and (16) for the conditions
E,s=l=b=l, G,YzE,J3=1/3, q=Z/lO
The shear modulus of the bulk cell wall material G, z EJ3 is a general assumption for an elastic material and using this value we can evaluate the global shear model for K/* (eqn
(10)). In reality to evaluate this shear model for K,, we need to know G/,, the shear modulus of the material in the ‘hinge’, which is not neces- sarily the same as G, and is likely to be considerably lower due to the material being damaged. Using the local shear model, Kh (eqn (16)) is obtained directly from E,s. 1/10 may at first appear to be rather large as an estimate for the effective length (q) of the hinge, but for the 0*21-mm thick card honeycombs used in the experiment8 the folds were typically 1 mm in width and 1 was a constant length of 10 mm. It is apparent from the three models discussed here that if the force constant K, is high in value
I. G. Masters, K. E. Evans
I . , 1 , . , I , ,
0 0.2 0.4 0.6 0.8 I
t/1
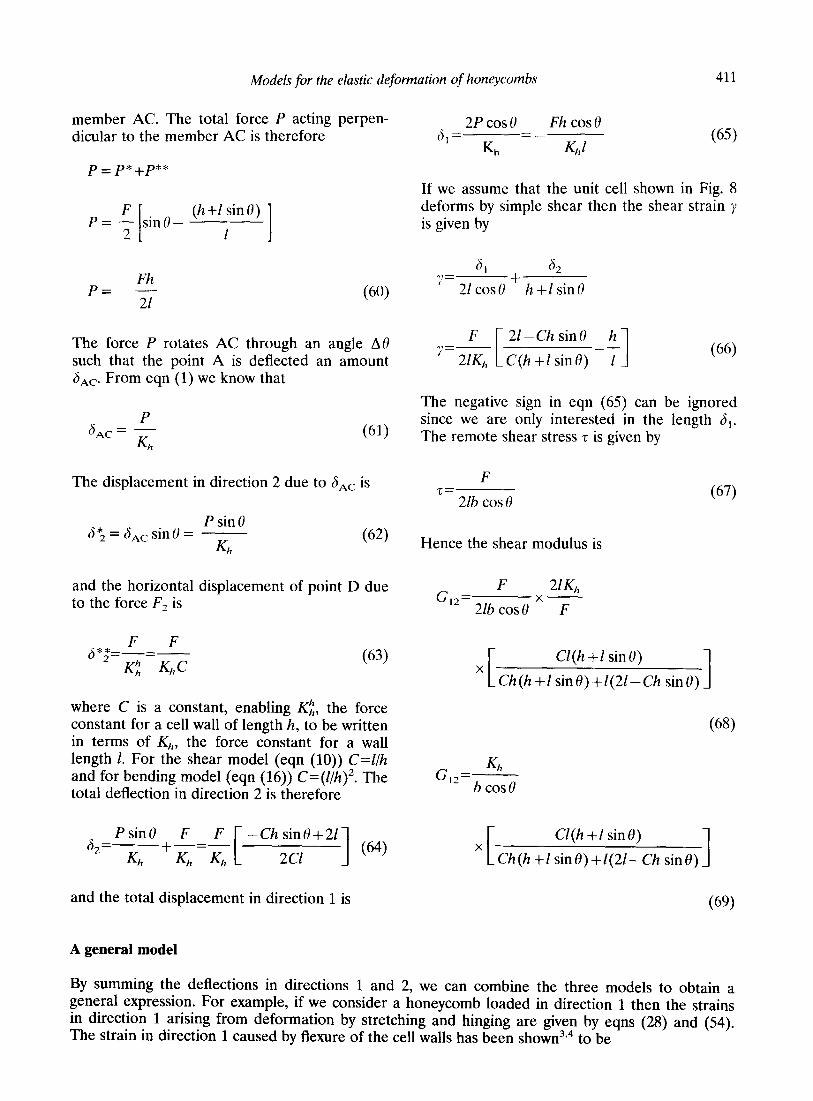
Fig. 9. Plot of K, versus t/l showing the relative behaviour of the flexing, stretching and hinging force constants. The constant with the lowest value determines the dominant
mechanism.
then the contribution of that particular mechan- ism to the overall deformation will be small. For the honeycombs used in these tests the value of t/l is in the range 0.01 to 0.02 so that K, (eqn (6)) is large compared to Kf (eqn (4)) and Kh (eqns (10) and (16)) and stretching can be ignored (Fig. 9). Stretching only becomes a sig- nificant mechanism when t/l > 1 which is obviously unrealistic for an open honeycomb structure, or unless KS is decoupled from Kh and Z$ as in molecular structures. Kf (eqn (4)) has the lowest value and thus explains why the flex- ure model has been so successful. However, as already stated the properties of the material operating as the hinge can be significantly dif- ferent from those of the bulk cell wall material. If they are lower, as might be expected, due to local damage from the folding of the card then Kh <Kf and hinging, for example, will dominate as shown with the card honeycombs. Of the two proposed hinging mechanisms local hinging (eqn (16)) predominates over global shear deformation (eqn (10)) when t/l < 0.2.
Effect of geometry on properties
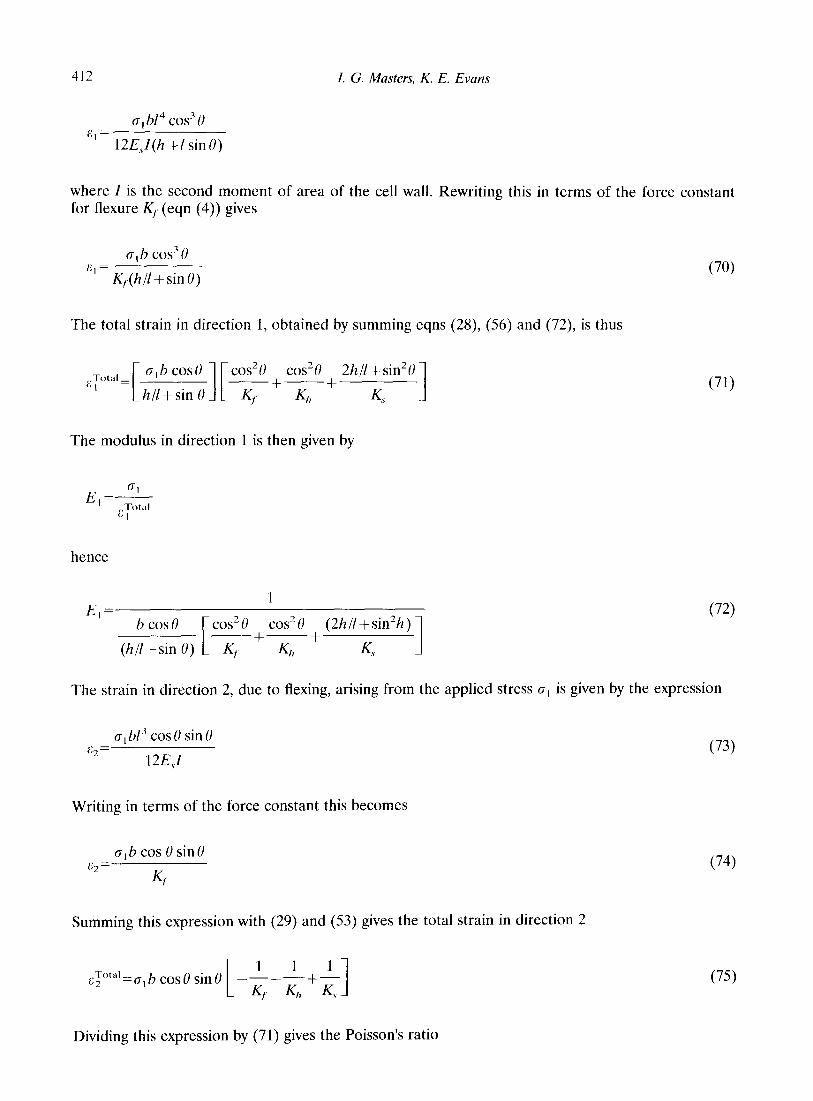
Two cell geometries are considered here h = 1, 8 > 0” and h = 21, 0 < 0” enabling a conventional hexagonal cell honeycomb to be compared, on the same plot, with an auxetic honeycomb con- taining cells of approximately the same area. The density of the auxetic honeycomb is higher than the conventional structure. Figures lo-12 show the elastic properties E, v and G vary with the cell angle 0 for each model. In each case E,Y = I = b = 1, t = 0.1. The respective force con- stants are & = O-001, Kh = 0.03 (shear) and
KS = 0.1. The discontinuities at 0 = 0” occur because of the change in the value of h.
The E versus 0 plots (Figs 10 and 11) for the flexure and hinging models are of identical shape as expected from comparing eqns (17) and (55) for E,, and (18) and (50) for E2. The difference in numerical values is determined by
0.06
E
0.04
0.02
0.00 -90 -60 -30 0 30 60 90
0 (Deg)
8.0
6.0
4.0
2.0
v
-90 -60 -30 0 30 60
0 (Deg)
0.010 - ---~._--..~ __._ , _I_
0.008
0.006
G 12
o.ooo2
0.004
0.002
-90 -60 -30 0 30 60
0 (De13
Fig. 10. Plot of E, v and G versus 0 for the flexure model (E=l=b=l, t=O+l, K.=O.OOl, h=2 for 0<0” and
h = {for e>O”).
Models for the elastic deformation of honeycombs 415
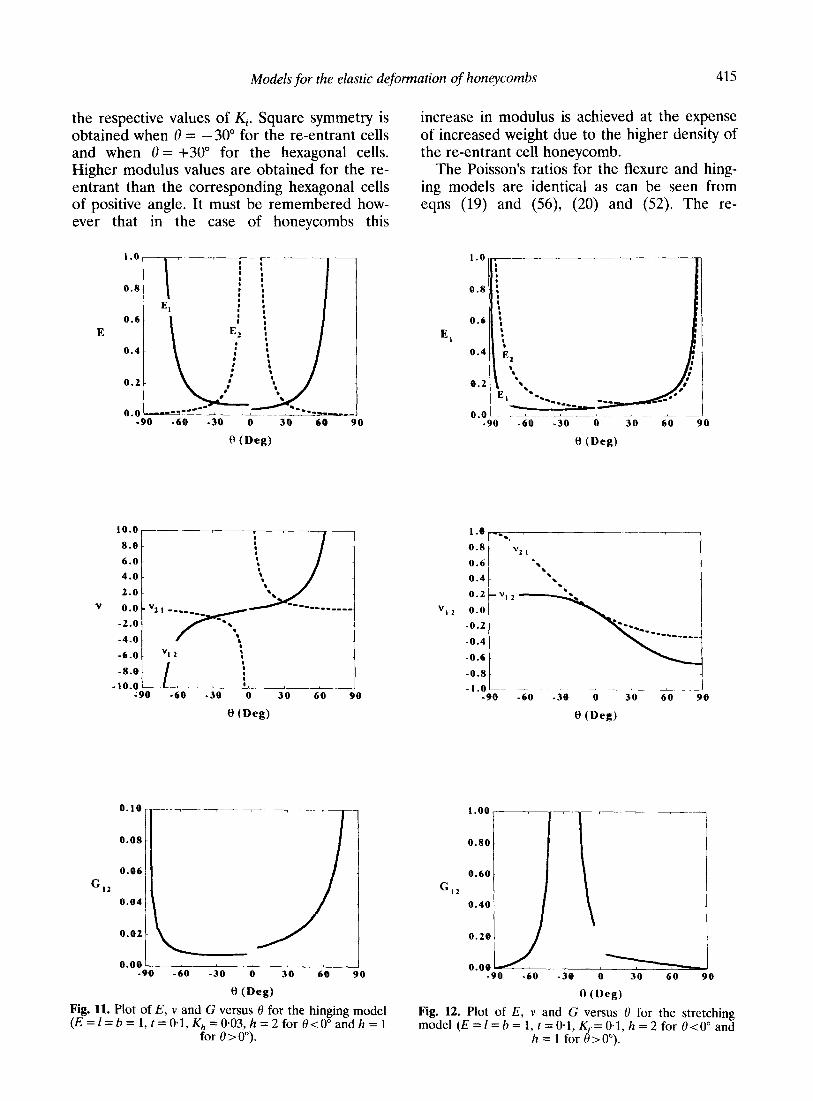
the respective values of Kj. Square symmetry is obtained when 0 = -30” for the re-entrant cells and when 8 = +30” for the hexagonal cells. Higher modulus values are obtained for the re- entrant than the corresponding hexagonal cells of positive angle. It must be remembered how- ever that in the case of honeycombs this
0.8
0.6
E
0.4
n.n -._ _. __i__I~
-90 -60 -30 0 30 r--90
8.0
6.0
4.0
V
-6.0. “12 1
-60 -30 0 30 60 90
0 (Deg)
0.00 1 -90 -60 -30 0 30 60 90
0 (Deg)
increase in modulus is achieved at the expense of increased weight due to the higher density of the re-entrant cell honeycomb.
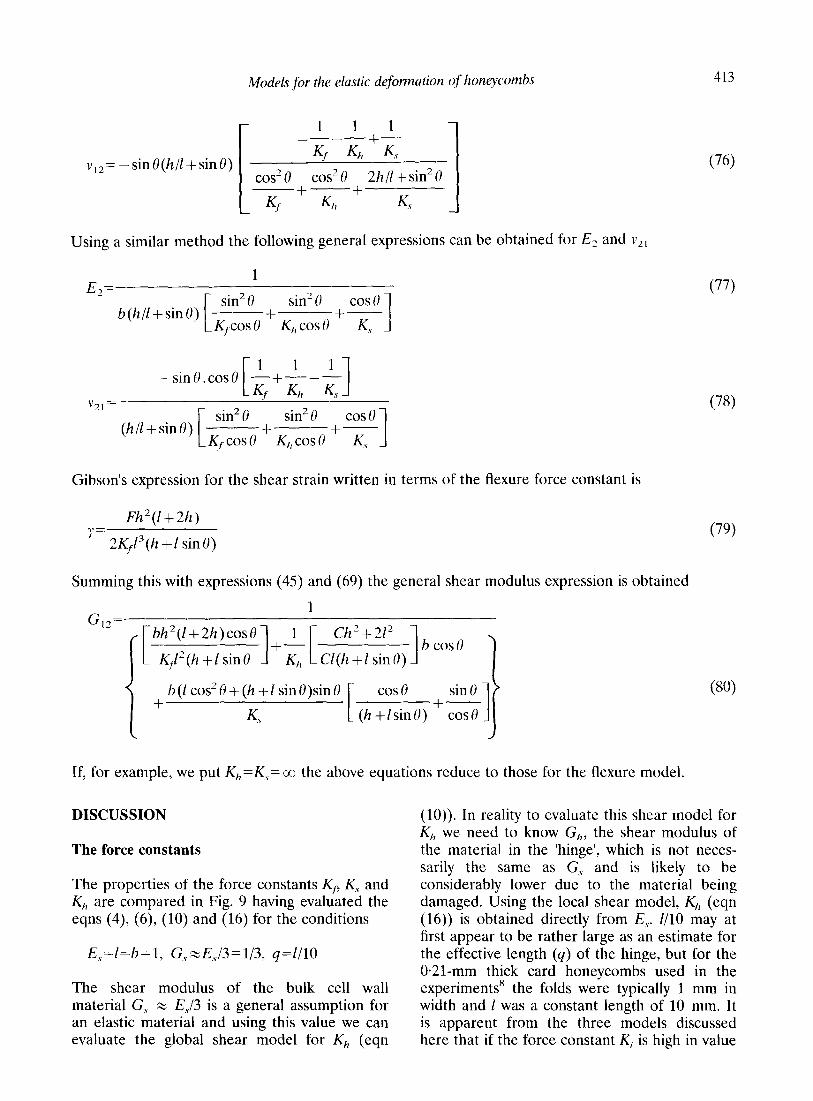
The Poisson’s ratios for the flexure and hing- ing models are identical as can be seen from eqns (19) and (56) (20) and (52). The re-
E,
0.8
0.6
0.4
0.2
0.a
l-O--._ .~
0.8 ‘v2, 0.6 . \ . 0.4 . . 0.2 -v,*
l .
V 12 0.0
-0.2
-0.4
-0.6
-0.8
_,.o_-b ~l.m-..i-___i mmml__ - -90 -60 -30 0 30 60 90
8 (De&
0.40
o.ot
1.00
0.80
0.60
0 -60 -30 0 30 60 90
fl (Deg) Fig. 11. Plot of E, v and G versus 6 for the hinging model (E=l=b=1,t=~1,K,,=0-03,h=2forO<0”andh=1
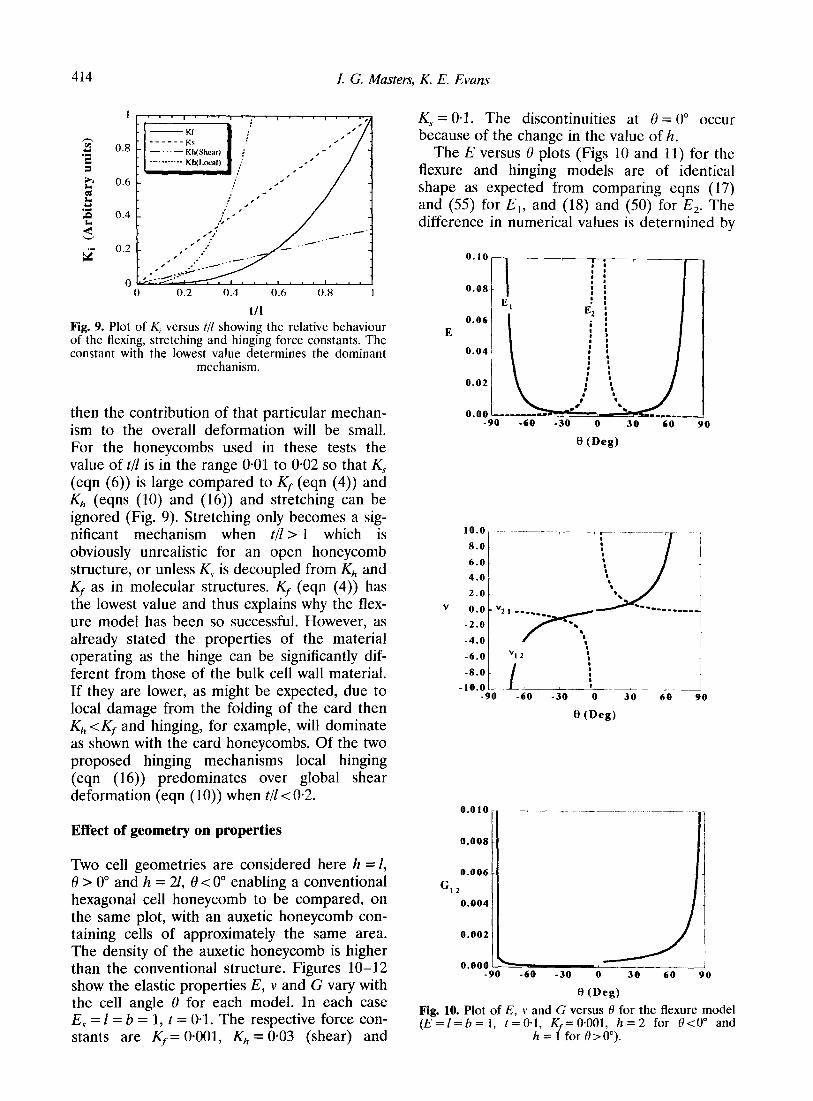
Fig. 12. Plot of E, v and G versus 0 for the stretching
for O>O”). model (E = 1= b = 1, t = O-1, K-= 0.1, h = 2 for O-CO” and
h = 1 for $>O’).
416 1. G. Masters, K. E. Evans
entrant cells have a negative Poisson’s ratio and square symmetry is again apparent at +30”.
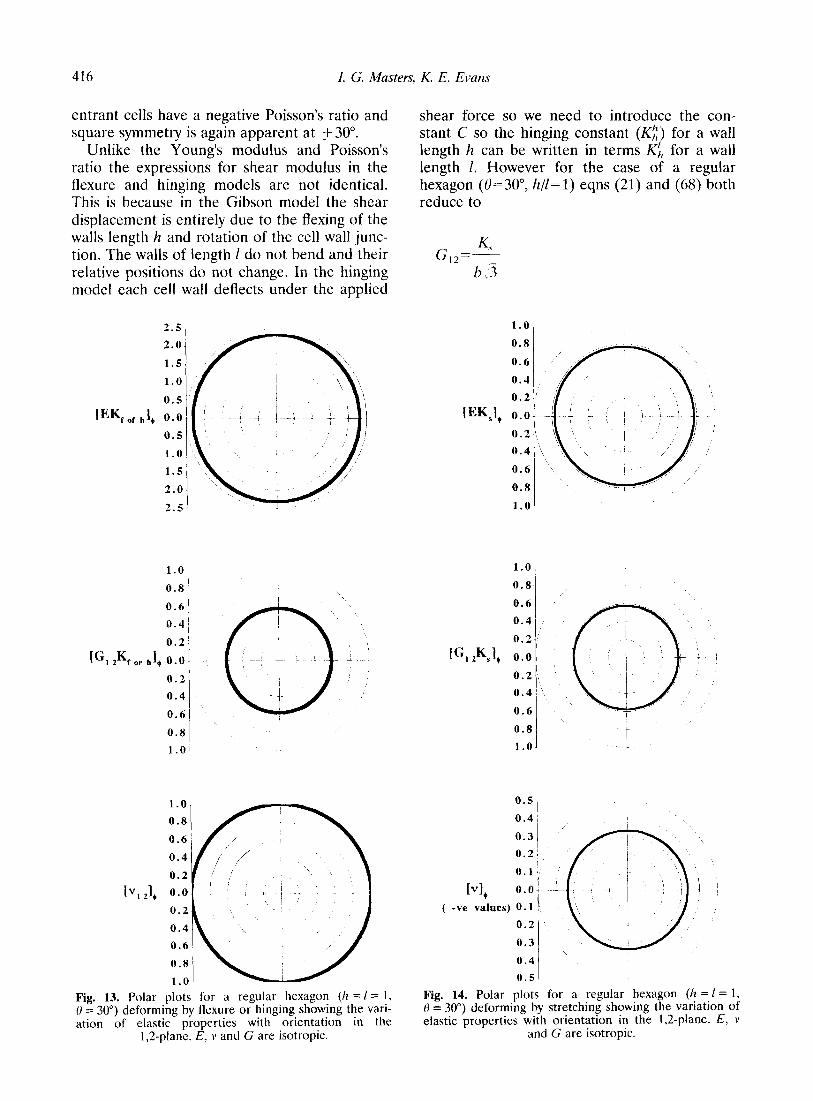
Unlike the Young’s modulus and Poisson’s ratio the expressions for shear modulus in the flexure and hinging models are not identical. This is because in the Gibson model the shear displacement is entirely due to the flexing of the walls length h and rotation of the cell wall junc- tion. The walls of length 1 do not bend and their relative positions do not change. In the hinging model each cell wall deflects under the applied
1.0
0.8
0.6
0.4
0.2
0.2
0.4
0.6
0.8
1.0
Fig. 13. Polar plots for a regular hexagon (h = I= 1, Fig. 14. Polar plots for a regular hexagon (A = I= 1, 0 = 30”) deforming by flexure or hinging showing the vari- f1 = 30”) deforming by stretching showing the variation of ation of elastic properties with orientation in the elastic properties with orientation in the I,Zplane. E, v
1,2-plane. E, 1’ and G are isotropic. and G are isotropic.
shear force so we need to introduce the con- stant C so the hinging constant (Ki
I) for a wall
length h can be written in terms K,, for a wall length 1. However for the case of a regular hexagon (0=30”, h/1=1) eqns (21) and (68) both reduce to
1.0
0.8
0.6
0.4
0.2 ,’
WKJ, 0.0 0 . 2 ,!
0 . 4 / “.
0.6
0.8
1.0
1.0
0.8
0.6
0.4
0.2
0.2
0.4
0.6
0.8
1.0
( -ve values) 0.1 I , 0.2
Models for the elastic deformation of hontycomhs 417
This incidently is the same result as that obtained from the Gillis graphite model” when only hinging occurs, i.e. K, = 30. In both the flexure and hinging models the shear modulus is lowered by adopting the re-entrant cell shape. The value of G is particularly low and insensi- tive to cell angle in the range 0” > 0 > - 60”.
For the stretching model (Fig. 12) the mod- ulus E, is reduced for the re-entrant cell but E, remains higher than that obtained from the
/
1.0’ 1 I
0.5
[EKJ, 0.0 a ; i,(AiL : !+-;j$
0.5 .,i,:
* :
1.0 \ ..I., ;
1.5
2.0. L id 1~ ’
2.5
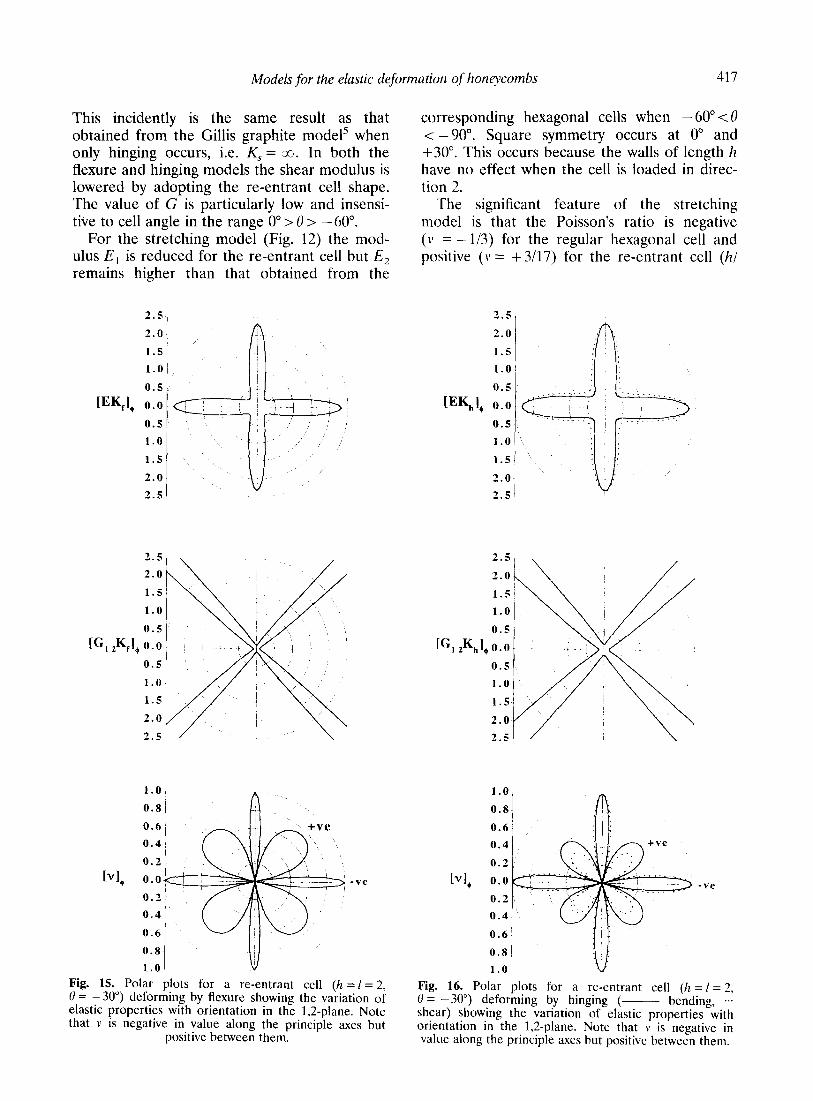
Fig. 15. Polar plots for a re-entrant cell (h = I= 2, U = -30”) deforming by flexure showing the variation of elastic properties with orientation in the 1,2-plane. Note that v is negative in value along the principle axes but
positive between them.
corresponding hexagonal cells when - 60” < 0 < -90”. Square symmetry occurs at 0” and +30”. This occurs because the walls of length h have no effect when the cell is loaded in direc- tion 2.
The significant feature of the stretching model is that the Poisson’s ratio is negative (11 = -l/3) for th e regular hexagonal cell and positive (V = +3/17) for the re-entrant cell (h/
2.0
1.5
1.0
WK,l+ i::
0.5
1.0
1.5
2.0
2.5
2.5
2.0
1.5
1.0
N;, ,K,I+ 1::
0.5
1.0
1.5
2.0
2.5
-ve
1.01 u
Fig. 16. Polar plots for a re-entrant cell (/I =l= 2, 0 = -30”) deforming by hinging (- bending, ... shear) showing the variation of elastic properties with orientation in the 1,Zplane. Note that 11 is negative in value along the principle axes but positive between them.
418 I. G. Masters, K. E. Evans
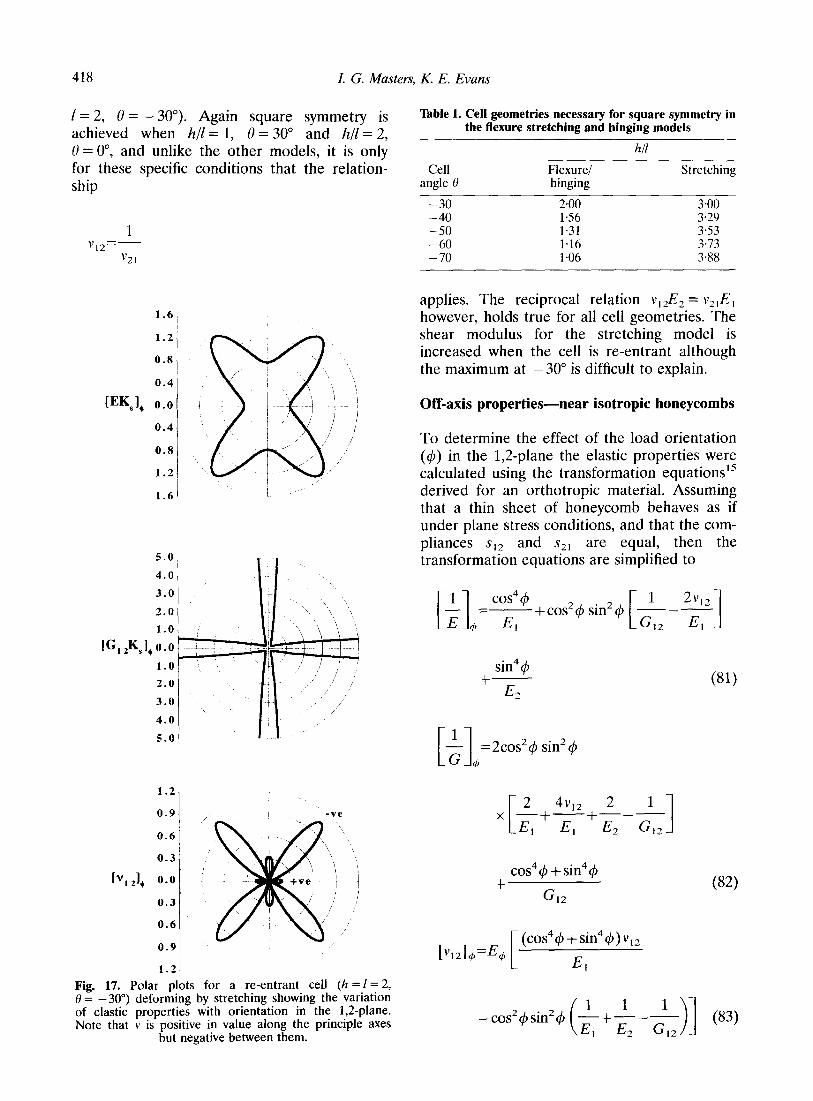
I= 2, 0 = -30”). Again square symmetry is achieved when h/l = 1, 0 = 30” and hll = 2, 0 = o”, and unlike the other models, it is only for these specific conditions that the relation- ship
1 v 12=-
V2I
1.6,
1.2
0.8
0.4
[EKJ, 0.0
0.4
0.8
1.2
1.6(
5.0
4.0
3.0
2.0
1.0
W, *KS], 0.0 t
1.0
2.0
3.0
4.0
5.0
1.2
0.9 ,
0.6
0.6
0.9
1.2
Fig. 17. Polar plots for a re-entrant cell (h = I= 2, 0 = -30”) deforming by stretching showing the variation of elastic properties with orientation in the 1,2-plane. Note that v is positive in value along the principle axes .
but negative between them.
Table 1. Cell geometries necessary for square symmetry in the flexure stretching and hinging models
hi1
Cell Flexure/ angle 0 hinging
Stretching
-30 2.00 3.00 -40 1.56 3.29 -50 1.31 353 -60 1.16 3.73 -70 1.06 3.88
applies. The reciprocal relation v,& = v,,E, however, holds true for all cell geometries. The shear modulus for the stretching model is increased when the cell is re-entrant although the maximum at -30” is difficult to explain.
Off-axis properties-near isotropic honeycombs
To determine the effect of the load orientation (4) in the 1,2-plane the elastic properties were calculated using the transformation equations15 derived for an orthotropic material. Assuming that a thin sheet of honeycomb behaves as if under plane stress conditions, and that the com- pliances s12 and s2, are equal, then the transformation equations are simplified to
[
1
z
[
1
=z
cos4 4 =-+cos2~ sin24
4 E, [&-?I
sin4 4
+ ~52
=2cos2~ sin24 @
1 cos44 +sin44
+ ‘712
(81)
(84
b121+=Kp [
(cos4~+sin4$)v,,
E,
-cos24sin24 1 1
++_-- 1 E2 (312 )I (83)
Models for the elastic deformation of honeycombs 419
As can be seen from Figs 13 and 14, for the flexure, hinging and stretching models, the regular hexagon (h = I, 0 = 30”) generates a material which is truly isotropic in the plane.
For the re-entrant cases (h = 21, 0 = -30”) deforming by flexing and hinging (Figs 15 and 16) the honeycomb is clearly square symmetric, not isotropic. For the stretching case (Fig. 17)
WKJ,
0.41
0.6
0.8
1.0
0.8,
0.6
0.4
0.2
lG,$J,o.ol
0.2
0.4
0.6
0.8
0.8
0.6
0.4
0.2
Iyl, 0.0
0.2
0.4
0.6
0.8
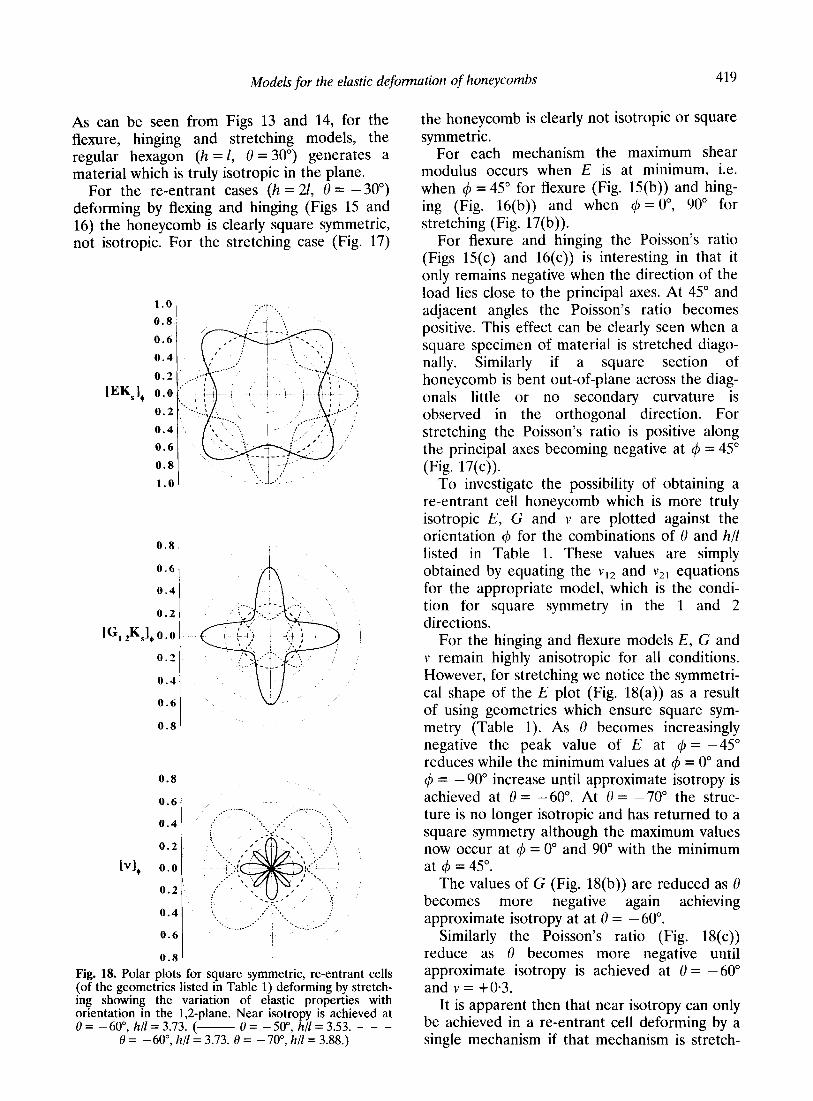
Fig. 18. Polar plots for square symmetric, re-entrant cells (of the geometries listed in Table 1) deforming by stretch- ing showing the variation of elastic properties with orientation in the 1,Zplane. Near isotropy is achieved at 8 = -6O”, h/l = 3.73. (- e = -5O”, h/l = 3.53. - - -
0 = -6O”, h/l = 3.73. 0 = -7O”, h/l = 3.88.)
the honeycomb is clearly not isotropic or square symmetric.
For each mechanism the maximum shear modulus occurs when E is at minimum, i.e. when 4 = 45” for flexure (Fig. 15(b)) and hing- ing (Fig. 16(b)) and when 4 = O”, 90” for stretching (Fig. 17(b)).
For flexure and hinging the Poisson’s ratio (Figs 15(c) and 16(c)) is interesting in that it only remains negative when the direction of the load lies close to the principal axes. At 45” and adjacent angles the Poisson’s ratio becomes positive. This effect can be clearly seen when a square specimen of material is stretched diago- nally. Similarly if a square section of honeycomb is bent out-of-plane across the diag- onals little or no secondary curvature is observed in the orthogonal direction. For stretching the Poisson’s ratio is positive along the principal axes becoming negative at 4 = 45” (Fig. 17(c)).
To investigate the possibility of obtaining a re-entrant cell honeycomb which is more truly isotropic E, G and v are plotted against the orientation $ for the combinations of 0 and h/f listed in Table 1. These values are simply obtained by equating the v12 and v2, equations for the appropriate model, which is the condi- tion for square symmetry in the 1 and 2 directions.
For the hinging and flexure models E, G and v remain highly anisotropic for all conditions. However, for stretching we notice the symmetri- cal shape of the E plot (Fig. 18(a)) as a result of using geometries which ensure square sym- metry (Table 1). As 0 becomes increasingly negative the peak value of E at 4 = -45” reduces while the minimum values at 4 = 0” and 4 = -90” increase until approximate isotropy is achieved at 0 = - 60”. At 0 = -70” the struc- ture is no longer isotropic and has returned to a square symmetry although the maximum values now occur at 4 = 0” and 90” with the minimum at 4 = 45”.
The values of G (Fig. 18(b)) are reduced as 0 becomes more negative again achieving approximate isotropy at at 0 = -60”.
Similarly the Poisson’s ratio (Fig. 18(c)) reduce as 0 becomes more negative until approximate isotropy is achieved at 0 = - 60” and v = +0*3.
It is apparent then that near isotropy can only be achieved in a re-entrant cell deforming by a single mechanism if that mechanism is stretch-
420 I. G. Masters, K. E. Evans
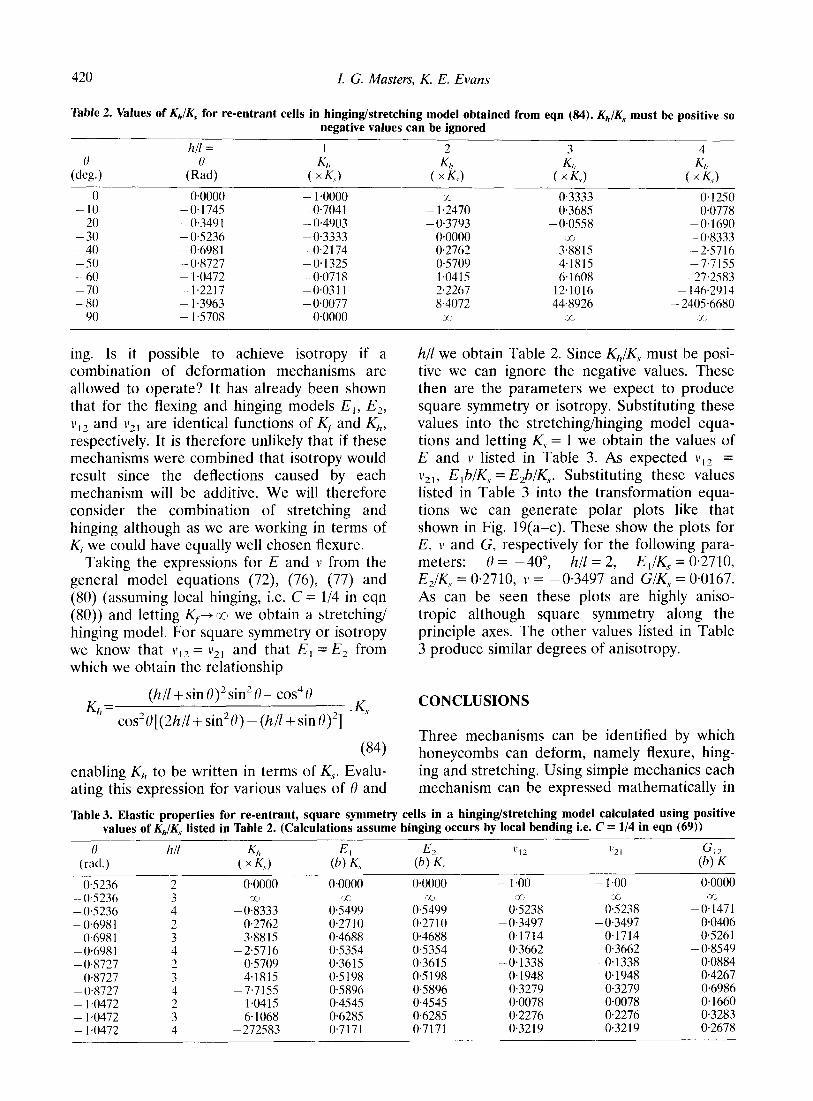
Table 2. Values of K,,IIC, for re-entrant cells in hinging/stretching model obtained from eqn (84). K,,/& must be positive so negative values can be ignored
rzir = 1 2 3 4
&.) (R(L) ( 2,) ( fk,) (& ( &,
0 0~0000 ~ 1 .oooo 0.3333 0.1250 - 10 - 0.1745 -0.7041 - I$470 0.3685 0.0778 ~ 20 -0.3491 - 0.4903 - 0.3793 - 0.0558 - 0.1690 - 30 - 0.5236 - 0.3333 0~0000 3&15 - 0.8333 -40 ~ 0.6981 -0.2174 0.2762 -2.5716 -50 - 0.8727 -0.1325 05709 4.1815 -7.7155 - 60 - 1.0472 -0.0718 I.0415 6.1608 - 27.2583 - 70 ~- 1.2217 ~ 0.03 1 1 2.2267 12.1016 - 1462914 -80 - 1.3963 - 0.0077 8.4072 44.8926 - 2405.6680 - 90 - I.5708 0~0000 73 x %
ing. Is it possible to achieve isotropy if a combination of deformation mechanisms are allowed to operate ? It has already been shown that for the flexing and hinging models E,, E,, I’,~ and vzI are identical functions of & and &, respectively. It is therefore unlikely that if these mechanisms were combined that isotropy would result since the deflections caused by each mechanism will be additive. We will therefore consider the combination of stretching and hinging although as we are working in terms of Kj we could have equally well chosen flexure.
Taking the expressions for E and v from the general model equations (72) (76) (77) and (80) (assuming local hinging, i.e. C = l/4 in eqn (SO)) and letting K~-+x we obtain a stretching/ hinging model. For square symmetry or isotropy we know that 1~~ = r2, and that E, =E, from which we obtain the relationship
&= (h/Z+sin0)2sin20-cos40 .K
cos20[(2h/l + sin’()) -(h/l + sin O)2] ’
(84) enabling K,, to be written in terms of K,. Evalu- ating this expression for various values of 0 and
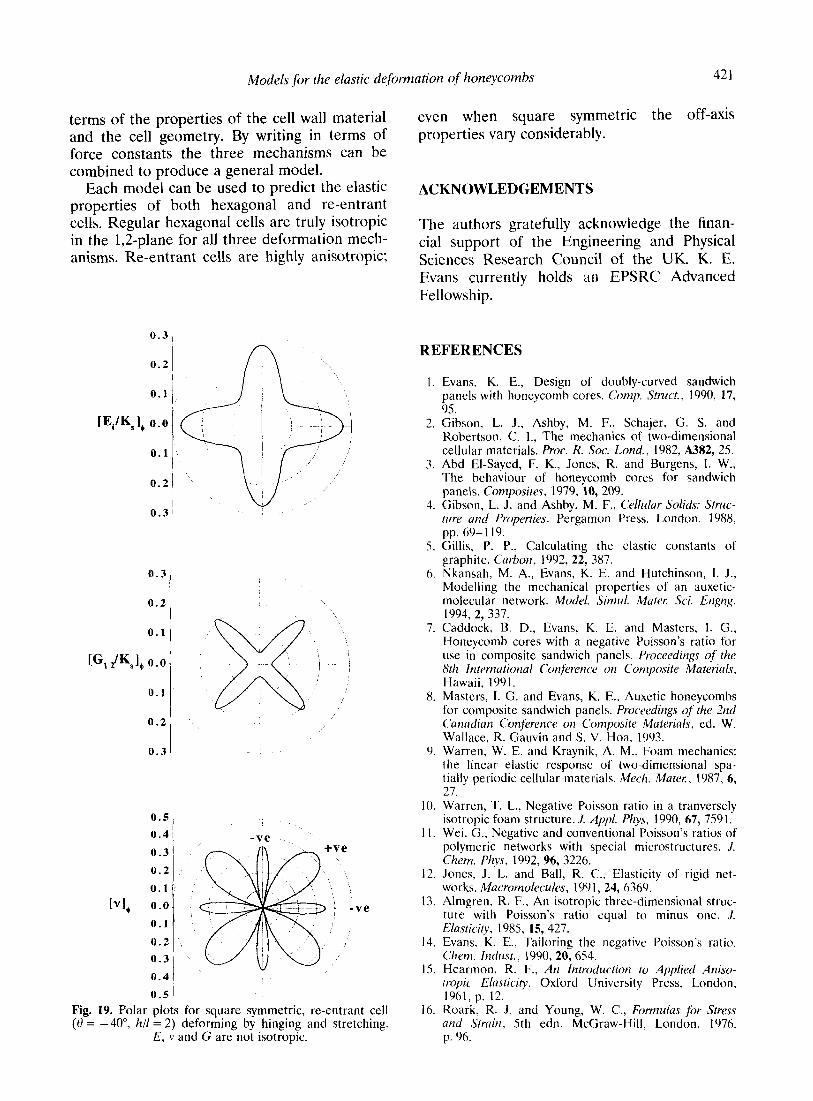
h/f we obtain Table 2. Since K,/K, must be posi- tive we can ignore the negative values. These then are the parameters we expect to produce square symmetry or isotropy. Substituting these values into the stretching/hinging model equa- tions and letting KS = 1 we obtain the values of E and I? listed in Table 3. As expected v,? = v2,, E,b/K, = E,b/K,. Substituting these values listed in Table 3 into the transformation equa- tions we can generate polar plots like that shown in Fig. 19(a-c). These show the plots for E, 11 and G, respectively for the following para- meters: 0 = - 40”, h/l = 2, E ,/K, = O-2710, E,/K, = 0.2710, 1’ = -0.3497 and G/K,, = 0.0167. As can be seen these plots are highly aniso- tropic although square symmetry along the principle axes. The other values listed in Table 3 produce similar degrees of anisotropy.
CONCLUSIONS
Three mechanisms can be identified by which honeycombs can deform, namely flexure, hing- ing and stretching. Using simple mechanics each mechanism can be expressed mathematically in
Table 3. Elastic properties for re-entrant, square symmetry cells in a hinging/stretching model calculated using positive values of K,& listed in Table 2. (Calculations assume hinging occurs by local bending i.e. C = l/4 in eqn (69))
0 (rad.)
~ 0.5236
-0.5236 - 0.5236 - 0.698 I -0.6981 - 0.698 1 - 0.8727 ~ 0.8727 - 0.8727 - I.0472 - I.0472 - I.0472
hi1
2
3 4 2 3 4 2 3 4 2 3 4
c x”;;,, cR k (&
I’ 11 “2 I (X%
0~0000 0~0000 0~0000 - 1 .oo ~ 140 0~0000
- oG333 0.5799 OG99 0:238 02238 - (I:;47 1 0.2762 0.2710 0.2710 - 0.3497 - 0.3497 0.0406 3.8815 0.4688 0.4688 0.1714 0.1714 0526 1
-2.5716 0.5354 0.5354 0.3662 0.3662 - 0.8549 0.5709 0.3615 0.3615 -0.1338 -0.1338 0.0884 4.1815 05198 0.5198 0.1948 0.1948 0.4267
-7.7155 0.5896 0.5896 0.3279 0.3279 0.6986 1.0415 0.4545 0.4545 0.0078 0.0078 0.1660 6.1068 0.6285 0.6285 0.2276 0.2276 0.3283
- 272583 0.7171 0.7171 0.3219 0.3219 0.2678
Models for the elastic deformation of honeycombs 421
terms of the properties of the cell wall material and the cell geometry. By writing in terms of force constants the three mechanisms can be combined to produce a general model.
Each model can be used to predict the elastic properties of both hexagonal and re-entrant cells. Regular hexagonal cells are truly isotropic in the 1,2-plane for all three deformation mech- anisms. Re-entrant cells are highly anisotropic;
0.3
0.2
0.1
W,/KJ, 0.0
0.1
0.2
0.3
0.3
0.2
0.1
[G, ,/q, 0.0
0.1
0.2
0.3
0.5
0.4
0.3
0.2
0.1 ’
Id, 0.0
0.1
0.2
0.3
0.4
0.5
Fig. 19. Polar plots for square symmetric, r-e-entrant cell (0 = -4o”, h/l = 2) deforming by hinging and stretching.
E, v and G are not isotropic.
even when square symmetric the off-axis properties vary considerably.
ACKNOWLEDGEMENTS
The authors gratefully acknowledge the finan- cial support of the Engineering and Physical Sciences Research Council of the UK. K. E. Evans currently holds an EPSRC Advanced Fellowship.
REFERENCES
I.
2.
3.
4.
5.
6.
7.
8.
‘).
10.
11.
12.
13.
14.
1.5.
16.
Evans, K. E., Design of doubly-curved sandwich panels with honeycomb cores. Camp. Stmct., 1990, 17, 95. Gibson, L. J., Ashby, M. F., Schajer, G. S. and Robertson, C. I., The mechanics of two-dimensional cellular materials. Proc. R. Sot. Land., 1982, A382, 25. Abd El-Sayed, F. K., Jones, R. and Burgens, 1. W., The behaviour of honeycomb cores for sandwich panels. Composites, 1979, 10, 209. Gibson, L. J. and Ashby, M. F., Cellular Solids: Struc- ture and Propetiies. Pergamon Press, London, 1988, pp. 69-I 19. Gillis, P. P., Calculating the elastic constants of graphite. Carbon, 1992, 22, 387. Nkansah, M. A., Evans, K. E. and Hutchinson, I. J., Modelling the mechanical properties of an auxetic- molecular network. Model. Simrd. Mater Sci. Engtzg. 1994, 2, 337. Caddock, B. D., Evans, K. E. and Masters, 1. G.. Honeycomb cores with a negative Poisson’s ratio for use in composite sandwich panels. Proceedings of the 8th International Corzference on Composite Materials, Hawaii, 199 I. Masters, I. G. and Evans, K. E.. Auxetic honeycombs for composite sandwich panels. Proceedings qf’the 2nd Canudian Conference on Composite Materials, cd. W. Wallace, R. Gauvin and S. V. Hoa, 1993. Warren, W. E. and Kraynik, A. M., Foam mechanics: the linear elastic response of two-dimensional spa- tially periodic cellular materials. Me& Mater., lY87, 6, 27. Warren, T. L., Negative Poisson ratio in a tranversely isotropic foam structure. J. Appl. Phys, 1990, 67, 759 1. Wci, G., Negative and conventional Poisson’s ratios of polymeric networks with special microstructures. 1. Chem. Phys, 1992, 96, 3226. Jones, J. L. and Ball, R. C., Elasticity of rigid net- works. Macromolecules, 199 1, 24, 6369. Almgren, R. F., An isotropic three-dimensional struc- ture with Poisson’s ratio equal to minus one. J. Elasticity, 198.5, 15, 427. Evans, K. E., Tailoring the negative Poisson’s ratio. Gem. Indust., 1990, 20, 654. Hearmon, R. F., An Introduction to Applied Aniso- tropic Elasticity. Oxford University Press, London, 1961, p. 12. Roark, R. J. and Young, W. C., Formulas ji,r Stress and Strain, 5th edn. McGraw-Hill. London, 1976, p. 96.
422 I. G. Masters, K d. Evans
17. Evans, K. E., Nkansah, M. A., Hutchinson, I. J. and Rogers, S. C., Molecular network design. Nature, 1991,353, 124.
18. Rothenberg, L., Berlin, A. A. and Bathurst, R. J., Microstructure of isotropic materials with negative Poisson’s ratio. Nature, 1991,354, 470.