Modelling Interactions in Complex Systems – An Air Navigation ...
8
Fourth SESAR Innovation Days, 25 th – 27 th November 2014 Modelling Interactions in Complex Systems – An Air Navigation Service Provider Focussed Approach Michael Kreuz DLR German Aerospace Center Institute of Flight Guidance Lilienthalplatz 7, Braunschweig, Germany [email protected] Michael Schultz DLR German Aerospace Center Institute of Flight Guidance Lilienthalplatz 7, Braunschweig, Germany [email protected] Abstract - Recent Single European Sky activities initiated by the European Commission striving for higher performance in the European air traffic management shape the background of this paper. From the viewpoint of an air navigation service provider this paper describes first the challenges ahead due to the setup of a performance regulation with binding targets on national air navigation service provider. Second, it motivates a reflection on inner-organizational processes and offers a statistical approach with focus on interdependencies and the impact of these in terms of changes in the system´s behavior. Keywords - modelling; air navigation service provider, complex systems I. INTRODUCTION AND BACKGROUND Requirements on air navigation service provider (ANSP) steadily increase with respect to the four key performance areas (KPA) capacity, cost efficiency, safety and environment. The performance scheme is one of the main pillars of the Single European Sky (SES) initiative and strives to achieve the SES objectives as detailed in [1] and amended by [2]. The scheme sets binding targets on member states to improve the performance in terms of delivering air navigation services, leading to cheaper flights, less delays, and the saving of unnecessary costs for airlines and passengers. In addition, European Commission aims to reduce the environment impact of air traffic due to more efficient and shorter flight paths. Presenting the main content of the performance scheme briefly, two reference periods (RP) with different EU-wide performance targets are defined. The outcomes measured by various performance indicators (PI) are expected to cover four KPAs. Reference period 1 (RP1) runs from 2012 to 2014 and tackles the following thresholds [3]: The EU-wide environment target is a reduction of 0,75% of the route extension in 2014 compared with 2009, the EU-wide Capacity target is set at maximum of 0,5 minute en-route ATFM delay per flight for the whole year 2014 and the EU-wide Cost-Efficiency target is a set of three en-route determined unit rates expressed in €2009 per service unit: €57,88 in 2012, €55,87 in 2013 and €53,92 in 2014. Regarding the KPA safety, RP1 does not set specific thresholds but goes along with rules and regulations defined by the European aviation safety agency (EASA) in order to keep safety at least at recent level. Expanding the focus of RP1 which mainly addresses the en-route part, following RP2 aims to achieve full coverage of ANS provisions. Running from 2015 to 2019, RP2 emphasizes the needs for improvements in performance scheme and the intentions towards to gate-to-gate scope including target-setting in all four KPAs. Beyond the thresholds in RP1, dedicated safety performance indicators are being developed for implementation in RP2. An overview of proposed Key Performance Indicator (KPI) and PI of the revised performance regulation to the Commission can be found in [4]. Summarizing, the presented targets are legally binding for EU Member States and encourage national ANSP to be more efficient with keeping up adequate safety levels [5]. From the perspective of users the expected outcome of the performance scheme can be summarized as savings of billions of Euros in terms of e.g. delays costs and user charges [6]. From the perspective of an ANSP, these targets frame the challenge the different ANSP in Europe have to face [7]. Based on the short description of the regulatory background of recent ANSP related activities on European level, this paper focusses on the analysis and the evaluation of interdependencies of crucial ANSP´s related parameters. Understanding their interactions as well as their impact is of key relevance in terms of performance assessment. This paper is organized as follows: First we will offer a general introduction in the aspects of system´s modelling, complexity and non-linearity (see section II). Focus is laid on the interaction of systems (system of systems) within the global aviation industry.
Transcript of Modelling Interactions in Complex Systems – An Air Navigation ...

Fourth SESAR Innovation Days, 25th – 27th November 2014
Modelling Interactions in Complex Systems – An Air Navigation Service Provider Focussed Approach
Michael Kreuz DLR German Aerospace Center
Institute of Flight Guidance Lilienthalplatz 7, Braunschweig, Germany
Michael Schultz DLR German Aerospace Center
Institute of Flight Guidance Lilienthalplatz 7, Braunschweig, Germany
Abstract - Recent Single European Sky activities initiated by the European Commission striving for higher performance in the European air traffic management shape the background of this paper. From the viewpoint of an air navigation service provider this paper describes first the challenges ahead due to the setup of a performance regulation with binding targets on national air navigation service provider. Second, it motivates a reflection on inner-organizational processes and offers a statistical approach with focus on interdependencies and the impact of these in terms of changes in the system´s behavior.
Keywords - modelling; air navigation service provider, complex systems
I. INTRODUCTION AND BACKGROUND
Requirements on air navigation service provider (ANSP) steadily increase with respect to the four key performance areas (KPA) capacity, cost efficiency, safety and environment. The performance scheme is one of the main pillars of the Single European Sky (SES) initiative and strives to achieve the SES objectives as detailed in [1] and amended by [2].
The scheme sets binding targets on member states to improve the performance in terms of delivering air navigation services, leading to cheaper flights, less delays, and the saving of unnecessary costs for airlines and passengers. In addition, European Commission aims to reduce the environment impact of air traffic due to more efficient and shorter flight paths.
Presenting the main content of the performance scheme briefly, two reference periods (RP) with different EU-wide performance targets are defined. The outcomes measured by various performance indicators (PI) are expected to cover four KPAs.
Reference period 1 (RP1) runs from 2012 to 2014 and tackles the following thresholds [3]:
The EU-wide environment target is a reduction of 0,75% of the route extension in 2014 compared with 2009,
the EU-wide Capacity target is set at maximum of 0,5 minute en-route ATFM delay per flight for the whole year 2014 and
the EU-wide Cost-Efficiency target is a set of three en-route determined unit rates expressed in €2009 per service unit: €57,88 in 2012, €55,87 in 2013 and €53,92 in 2014.
Regarding the KPA safety, RP1 does not set specific thresholds but goes along with rules and regulations defined by the European aviation safety agency (EASA) in order to keep safety at least at recent level.
Expanding the focus of RP1 which mainly addresses the en-route part, following RP2 aims to achieve full coverage of ANS provisions. Running from 2015 to 2019, RP2 emphasizes the needs for improvements in performance scheme and the intentions towards to gate-to-gate scope including target-setting in all four KPAs.
Beyond the thresholds in RP1, dedicated safety performance indicators are being developed for implementation in RP2. An overview of proposed Key Performance Indicator (KPI) and PI of the revised performance regulation to the Commission can be found in [4].
Summarizing, the presented targets are legally binding
for EU Member States and encourage national ANSP to be more efficient with keeping up adequate safety levels [5]. From the perspective of users the expected outcome of the performance scheme can be summarized as savings of billions of Euros in terms of e.g. delays costs and user charges [6]. From the perspective of an ANSP, these targets frame the challenge the different ANSP in Europe have to face [7].
Based on the short description of the regulatory background of recent ANSP related activities on European level, this paper focusses on the analysis and the evaluation of interdependencies of crucial ANSP´s related parameters. Understanding their interactions as well as their impact is of key relevance in terms of performance assessment.
This paper is organized as follows: First we will offer a general introduction in the aspects of system´s modelling, complexity and non-linearity (see section II). Focus is laid on the interaction of systems (system of systems) within the global aviation industry.

Fourth SESAR Innovation Days, 25th – 27th November 2014
Section III presents the statistical background as well as the basic idea that is behind our approach. Section IV presents the results that are subject of comparison with real-world data (see section V). We conclude this paper with ideas for future work in this field.
II. SYSTEMS MODELLING AND COMPLEXITY
The air traffic is international, geographically distributed and characterized by different organizational structures as well as national interests and comes along with a high variety of autonomously acting, complex (socio-) technical systems own by several stakeholders like airports, airlines, air traffic control, or ground handlers [8]. To ensure efficient and safe flights a close cooperation between all of these stakeholders is essential. Over the past decades the optimization of single air traffic components was focused, but today a holistic view of the involved organizations and systems is inevitable to identify and utilize the innovational potential. This becomes a challenging task for both the fundamental research and operational implementation.
The forthcoming introduction of automated processes and systems demands for an improved decision support and integration of different kind of information (quantity, quality, frequency, integrity) from several sources at the air traffic system (e.g. weather forecast, passenger landside, see also Airport Collaborative Decision Making [A-CDM]). The combination of information results in mutual dependencies and emphasizes the need for a detailed scientific examination of the requirements, potentials and implications to optimize the air traffic system [9], [10]. Not only the increasing correlation of air traffic systems but also the heterogeneous system requirements, taking into account organizational, regulatory, social, technical, and operational conditions indicate the imperative necessity of mathematical models and computational support. For a continuous improvement in terms of punctuality, robust planning, or resilient system design a comprehensive understanding of relevant stakeholders must be achieved. From a scientific point of view appropriate modeling methods have to be identified or transferred from other domains taking the specific problems in aviation into account [11].
Besides the fundamental demand for a holistic approach to cope with current/future challenges, the investigation of the accompanied dynamics of the air traffic system is an additional value. Each stakeholder has to make own decisions triggered by internal/external events (key performance indicators). These decisions are considering customized operational, tactical and strategic reactions aiming at individually optimized solutions which are linked to direct and indirect effects on downstream or parallel systems. Due the increasing mutual system dependencies leads to a complex, dynamic system behavior even if stochastic/predictable deviations or disturbances occur. The resulting complex-coupled situation must often be resolved
under a restrictive time budget using a (limited) set of information.
To systematically understand the capabilities of a complex system a hierarchical approach can be used. The requirements are decomposed into several systems to achieve the demanded system capability [12]. The hierarchical representation of requirements and the capability of an entire system are shown in the following Figure 1.
Figure 1 Hierarchical representation of a system [12]
In contrast to the re-engineering of current processes the hierarchical approach, the demand performance of the system and the accompanied requirements are used to define a valid model1. Beside the deduction of common system parameter from operational conditions (data-based approach) the development of a model is always a problem focused approximation of the reality. The model allows analyzing the variety of system behavior and states regarding to the quantity and quality of the available input factors (e.g. sensitivity analysis). By nature, a model contains systematically errors and deviations, which have to be clear stated and analyzed in detail before the results are used for recommendations.
The model developed in this paper does not equal a data-based (deriving the status quo from data) but represent the fundamental interactions offering a valid basis for the analysis of future system states.
III. MODELLING INTERACTIONS IN COMPLEX SYSTEMS
As pointed out in section II, the understanding of relevant interacting parameters is of crucial importance. In order to describe the system of an ANSP (and to assess its performance in a second step), we develop a generic model that is focused on in the following.
1 A discussion about the term „validity” of models, its purpose and the validation result are given in section V.
2

Fourth SESAR Innovation Days, 25th – 27th November 2014
A. Deduction of requirements
Based on the descriptions in section II some first requirements of the model can be deducted. These are as follows:
Interactions between the relevant parts of an ANSP in terms of capacity and overall (economic) performance have to be represented and evaluated with regard to their impact on the system´s behavior.
Clarification of interactions and evaluation of system´s behavior.
A dynamic approach is required in order to describe tight couplings among parameters and actions leading to effects that are rarely proportional.
B. Method choice
Based on the requirements, the model will be developed based on System Dynamics approach. This approach is represented by formal models dealing with the interaction of objects in time-dependent and complex dynamic systems [13], [14]. Having previously been used in fields such as industrial dynamics the span of applications grew to include social sciences as well as economics [15], [16]. System Dynamics models are defined by independent stocks (levels), inflows/outflows (rates) as well as variables and constants affecting the flows. Mathematically, System Dynamics provides a method to solve coupled, nonlinear differential or integral equations with the stocks being the integrals of the flows by what change is constituted.
C. Literature overview
In the field of aviation the number of empirical analyses of an ANSP based on System Dynamics is limited compared to those dealing with other air traffic management (ATM) stakeholder such as airlines and airports. Concerning the latest ones, most studies deal with the interaction of the air traffic demand and the availability of air- and landside capacity [17], [18]. Parameters such as the number of movements per day at selected airports, price elasticity of demand (customers/air traffic users), forecasted volumes of air traffic, fuel consumptions as well as the analyses of emissions on ground and en-route are focused [19], [20].
Concerning the analysis of an ANSP based on System Dynamics publications e.g. focus on workload assessments in combination with the implementation of new systems or macroscopic analyses concerning the delay development caused by air traffic flow management procedures [21], [22].
Summarizing, studies on the interdependencies of the ANSP inherent sub-systems (according to the idea of Figure 1) as well as their potentials and implications on the total system´s behavior (named performance in Figure 1) are limited.
D. Analysing interactions
As a consequence of the findings in the literature review, this paper aims to overcome this gap by offering a
conceptual approach on how to combine capacity related as well as economic related aspects including their interactions. Relating to the aspects of an ANSP, we aim to assess the interactions of crucial performance indicators by using an analysis of variance in multiple linear regressions. The indicators (variables) focused on are
movements,
air traffic controller hours (ATCOh)2 and
delay.
In order to assess their interactions real data of the mentioned variables are analyzed over a period of five years on a monthly basis. In total we gained a number of (five years multiplied by 12 months) 60 values for regression analysis. Real data are provided by a European ANSP and support our approach to minimize deviations between the model and the real system of an ANSP from the data point of view. Data describe the development of the defined indicators covering three phases. These phases follow the implementation of an automated air traffic management system and can be subdivided in before, during and after implementation. The first phase covers a period of 24 months, phase two of 12 and phase three of 24 months. In a first step, data are used to determine a correlation between the indicators over time. In a second step, we analyze possibilities to approximate one of the three variables by the two others.
From a mathematical point of view, an approximation of one parameter based on one or several predictors describes the explanation of variance (see Figure 2 and Figure 3).
Figure 2 Explaining variance with one predictor
2 Determination of the required ATCOh takes into account capacity related issues such as sector capacity values (entries per hour), definition of configurations (number of sectors, number of ATCO) as well as the configuration capacity (capacity per number of ATCO). Further input needed is given by guidelines for staff planning which define e.g. working times for ATCO (on-board times) as well as times for regeneration or management related tasks. This analysis focusses on the air traffic controller and does not consider further technical staff that is involved with the maintenance of hardware and software systems.
3
Fourth SESAR Innovation Days, 25th – 27th November 2014
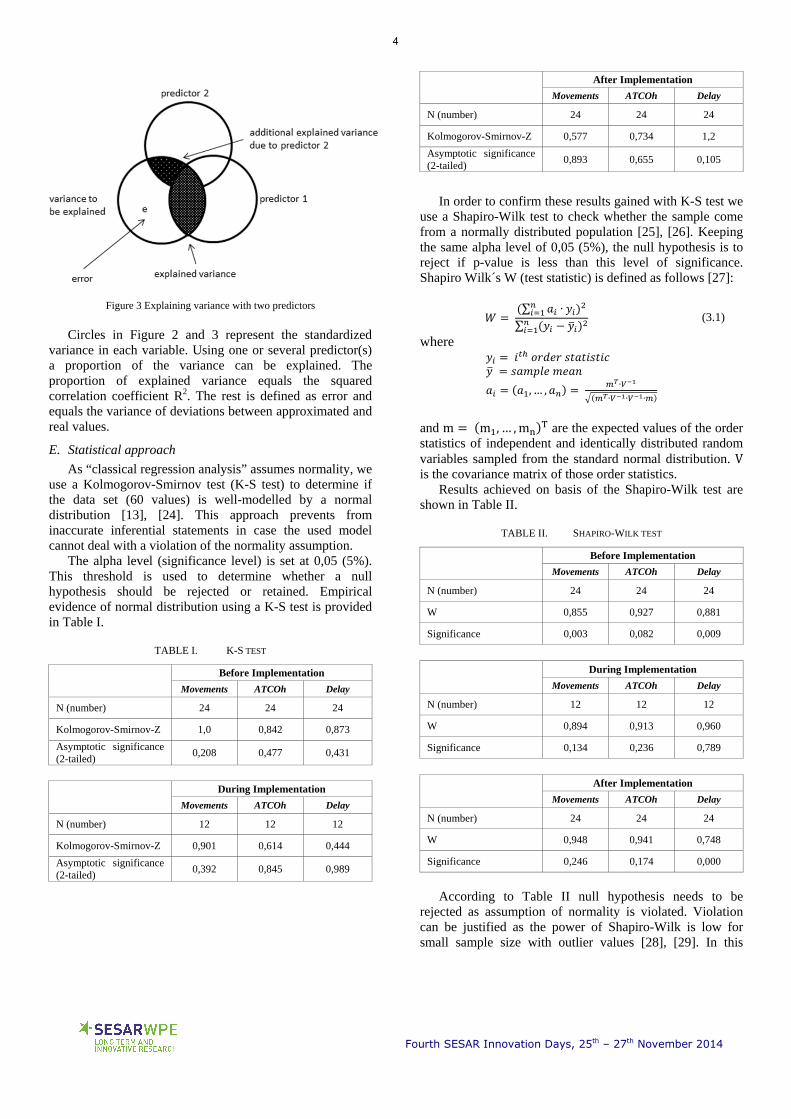
Figure 3 Explaining variance with two predictors
Circles in Figure 2 and 3 represent the standardized
variance in each variable. Using one or several predictor(s) a proportion of the variance can be explained. The proportion of explained variance equals the squared correlation coefficient R2. The rest is defined as error and equals the variance of deviations between approximated and real values.
E. Statistical approach
As “classical regression analysis” assumes normality, we use a Kolmogorov-Smirnov test (K-S test) to determine if the data set (60 values) is well-modelled by a normal distribution [13], [24]. This approach prevents from inaccurate inferential statements in case the used model cannot deal with a violation of the normality assumption.
The alpha level (significance level) is set at 0,05 (5%). This threshold is used to determine whether a null hypothesis should be rejected or retained. Empirical evidence of normal distribution using a K-S test is provided in Table I.
TABLE I. K-S TEST
Before Implementation
Movements ATCOh Delay
N (number) 24 24 24
Kolmogorov-Smirnov-Z 1,0 0,842 0,873
Asymptotic significance (2-tailed)
0,208 0,477 0,431
During Implementation
Movements ATCOh Delay
N (number) 12 12 12
Kolmogorov-Smirnov-Z 0,901 0,614 0,444
Asymptotic significance (2-tailed)
0,392 0,845 0,989
After Implementation
Movements ATCOh Delay
N (number) 24 24 24
Kolmogorov-Smirnov-Z 0,577 0,734 1,2
Asymptotic significance (2-tailed)
0,893 0,655 0,105
In order to confirm these results gained with K-S test we
use a Shapiro-Wilk test to check whether the sample come from a normally distributed population [25], [26]. Keeping the same alpha level of 0,05 (5%), the null hypothesis is to reject if p-value is less than this level of significance. Shapiro Wilk´s W (test statistic) is defined as follows [27]:
∑ ∙∑
(3.1)
where
, … , ∙
∙ ∙ ∙
and m m ,… ,m are the expected values of the order statistics of independent and identically distributed random variables sampled from the standard normal distribution. V is the covariance matrix of those order statistics.
Results achieved on basis of the Shapiro-Wilk test are shown in Table II.
TABLE II. SHAPIRO-WILK TEST
Before Implementation
Movements ATCOh Delay
N (number) 24 24 24
W 0,855 0,927 0,881
Significance 0,003 0,082 0,009
During Implementation
Movements ATCOh Delay
N (number) 12 12 12
W 0,894 0,913 0,960
Significance 0,134 0,236 0,789
After Implementation
Movements ATCOh Delay
N (number) 24 24 24
W 0,948 0,941 0,748
Significance 0,246 0,174 0,000
According to Table II null hypothesis needs to be
rejected as assumption of normality is violated. Violation can be justified as the power of Shapiro-Wilk is low for small sample size with outlier values [28], [29]. In this
4

Fourth SESAR Innovation Days, 25th – 27th November 2014
paper we define outliers as any value that lies more than 1,5 ∙ (interquartile range) from each end of the box.
Due to this heterogeneous result we use an ANOVA for multiple regressions that is considered a robust test against the normality assumption. This means that it tolerates violations to its normality assumption rather well [30].
Statistical measures used are discussed briefly in the following:
Multiple Correlation Coefficient, (see equation 3.2), is a measure of the strength of the association between the independent variables and the dependent (prediction) variable. The closer R is to one, the stronger the association is.
∙ (3.2)
where
Coefficient of determination, R (see equation 3.3), provides a measure of how well observed outcomes are replicated by the model. In other words, R offers a proportion of the total variance that can be explained by the model.
∙ (3.3)
where
The adjusted , (see equation 3.4), takes into
account the number of variables that are added to the model. Thus, is adjusted for the number of predictors in the model and increases only if a new explanatory variable improves more than expected by chance.
1 ∑ 1⁄∑ 1⁄
(3.4)
The standard error (see equation 3.5) of the estimate is a
measure of the accuracy of predictions. It offers the standard deviation of the error in the sample mean with respect to the true mean.
∙ 1 (3.5)
Using these equations 3.2 to 3.5 the approximated variable can be expressed by the predictors as follows:
∙ ∙ (3.6) (unstandardized form)
∙ ∙ (3.7)
(standardized form)
As the unstandardized form (see equation 3.6) uses means and standard deviations, it is prone for statistical bias. In case this form is used for the assessment of one variable´s future development, constant values of both means and standard deviations need to be postulated.
In opposite, z-scores are applied for the assessment of a variable´s future development based on the standardized form. The interpretation of the z-scores is as follows: The absolute value of z represents the distance between the raw score and the population mean in units of the standard deviation. Positive values of z represent a raw score above the mean and vice versa.
IV. RESULTS
Based on the explanations in section III the presented results focus on the approximation of delay based on the predictors movements and ATCOh in the phase after the implementation (duration of 24 months). This approach goes along with Figure 3 and the approximation of one parameter based on two predictors. According to the values in Table III a significant variance explanation (delay) with 2,21 11,5, 0,000 can be achieved by the model
(predictors movements and ATCOh).
TABLE III. MULTIPLE REGRESSION RESULTS (EXPLANATION OF VARIABLE DELAY)
standard error
0,725 0,526 0,480 15067
The influence of each of the two predictors on the
explanation of the variable (delay) is shown in Tables IV and V.
TABLE IV. INFLUENCE OF THE PREDICTOR MOVEMENTS
Beta t significance
(Constant) 0,000 -3,8 0,000
movements 0,719 4,8 0,000
TABLE V. INFLUENCE OF THE PREDICTOR ATCOH
Beta t significance
(Constant) 0,000 -3,8 0,000
ATCOh 0,716 4,8 0,000
According to the Tables IV and V both predictors are
significant. However, by adding predictor 2 there is only an infinitesimal additional increase in the ability of explaining the criterion (delay) (see Figure 4 in comparison to Figure
5

Fourth SESAR Innovation Days, 25th – 27th November 2014
5). This is caused due to a correlation of 0,958 between the two predictors. In consequence, the semi partial correlation between these variables is decreased and the increase of the values of and is limited due to this correlation of 0,958.
Figure 4 One predictor offers significant variance explanation
Figure 5 Two predictors offer significant variance explanation
Summarizing, the variable delay can be described by the
predictors as follows:
73612 0,334 ∙ 2,4 ∙ (3.8) (unstandardized form)
0,331 ∙ 0,401 ∙ (3.9)
(standardized form)
Reviewing these results critically no account is taken up to now of the nature of the relationship between the variables. As statistical correlation does not necessarily denote causality focus should be expanded on the causal process underlying the observed data [31]. This is due to the fact that statistical correlation as indicated in this section not only confounds associations but also provides no information about cause and effect [32]. Applying the question of cause-effect relationship to our model parameters (movements, ATCOh and delay) we use a directed acyclic graph (DAG) to order these parameters into a sequence. This sequence represents the process in which
the parameters are used in a consistent direction in the underlying model. According to the traffic-oriented modelling approach movements are subject to constraints in such a way that no other parameters must be performed earlier. Based on the traffic data (movements) the next modeling step deals with the capacity personal balancing. At the end of this planning process the required ATCOh are determined. Delay values are the resulting factor in this sequence. This topological order is developed according to the modelling approach and allows the deduction of the causal relationship between the parameters.
V. VALIDATION
The purpose of validation is to ensure the usefulness of a model with respect to its dedicated purpose [31]. Validation is the process of ensuring that the model is sufficiently accurate for the indicated purpose [34]. A validation, however, cannot be assumed to result in a perfect model as models are necessarily selective and approximate [35]. As a consequence, the purpose of a model has to be clarified at the start of a study. The model developed in this paper aims for the analysis of the interactions and the possibility of approximating one variable on the basis of two other predictors. In this paper we perform validation by comparing the system´s output with real-world data obtained. In accordance to section IV results of this comparison are given for duration of 24 months (January_01 to December_02, phase after implementation) in Figure 6 and Figure 7. First mentioned Figure 6 represents the model output based on the unstandardized regression and last mentioned one (Figure 7) the output based on the standardized regression.
Figure 6 Comparison with a reference - unstandardized form
0
0.1
0.2
0.3
0.4
0.5
0.6
0.7
0.8
0.9
1
approximated
delay ‐norm
alized
reference period
reference model
6

Fourth SESAR Innovation Days, 25th – 27th November 2014
Figure 7 Comparison with a reference - standardized form
Both Figures 5 and 6 show strong correlation
( 0,74 0,75 with the obtained real-world data. Higher values are prevented by the peak values in the summer months (July_01 as well as July_02, August_02 and September_02).
Summarizing, our results underline the model´s capability to represent the interactions between the focused variables. This capability offers the possibility to indicate potential changes in the delay variable due to changes in the variable movements or ATCOh by simulations. This approach saves both time and (human or financial) resources. Especially in a dynamic market such as the aviation industry (see section I) the use of this model can increase the understanding and finally the ability to assess the economic performance.
VI. CONCLUSION
This paper offers a conceptual generic approach on how to combine capacity related as well as economic related aspects including their interdependencies. The overall goal of the approach is to increase understanding in the system´s behavior and the nonlinear interdependencies of relevant parameters (movements, ATCOh, delay). Doing so, the paper overcomes the drafted scientific gap in the literature review. The importance of performance measurement is expressed by drawing a picture of recent SES activities with the main objective of coping with a sustained air traffic growth and air traffic operations under the safe, cost- and environmentally friendly conditions.
The significance of the findings can be achieved by comparing the model´s output with real-world data. The exemplary analysis of the key parameters such as movements and the resulting air traffic controller hours underline the added value towards a strategic decision support.
Summarizing, the developed modelling approach as well as the application-oriented implementation of the model
offer a scientific basis for future ANSP related performance assessment in order to meet the challenges ahead. Furthermore, the necessity of understanding the dynamics in system´s interactions over time is emphasized with the system of systems approach. This approach picks up the modelling idea of this paper and describes the way forward in terms of understanding and assessing performance in complex systems.
REFERENCES [1] European Union. REGULATION (EC) No 549/2004 OF THE
EUROPEAN PARLIAMENT AND OF THE COUNCIL of 10 March 2004 laying down the framework for the creation of the single European sky. March 2004.
[2] European Union. REGULATION (EC) No 1070/2009 OF THE EUROPEAN PARLIAMENT AND OF THE COUNCIL of 21 October 2009 amending Regulations (EC) No 549/2004, (EC) No 550/2004, (EC) No 551/2004 and (EC) No 552/2004 in order to improve the performance and sustainability of the European aviation system. September 2009.
[3] EUROCONTROL. SES II Performance Scheme – Proposed EU-wide performance targets for the reference period 2012-2014. Prepared by the Performance Review Commission (PRC) of EUROCONTROL as the designated Performance Review Body (PRB) of the Single European Sky. September 2010.
[4] EUROCONTROL. Report on the preparation of the revision of the SES Performance Scheme addressing RP2 and beyond. Prepared by the Performance Review Body (PRB) of the Single European Sky. July 2012.
[5] European Union. European ATM Masterplan – The roadmap for sustainable air traffic management. Edition 2. October 2012.
[6] EUROCONTROL. PRB advice to the Commission in the setting of Union-wide performance targets for RP2. September 2013.
[7] EUROCONTROL/FAA. Comparison of air traffic management-related operational performances: U.S./Europe 2013.Produced by EUROCONTROL on behalf of the European Union and FAA Air Traffic Organization System Operations Services. June 2014.
[8] Harris, D. and Stanton, N. A., "Aviation as a system of systems: Preface to the special issue of human factors in aviation", Ergonomics, 53:2, 145-148, 2010.
[9] DeLaurentis, D. A., "Understanding Transportation as System-of-Systems Design Problem", at 43rd AIAA Aerospace Sciences Meeting and Exhibit, Reno, Nevada, 10 - 13 January 2005.
[10] Shetty, S., "System of Systems Design for Worldwide Commercial Aircraft Networks", at 26th International Congress of the Aeronautical Sciences, 2008.
[11] Dahmann, J. and Baldwin, K. J. and Rebovich Jr, G., "Systems of Systems and Net-Centric Enterprise Systems", at 7th Annual Conference on Systems Engineering Research 2009 (CSER 2009), Loughborough University.
[12] Han, S.Y. and DeLaurentis, D.A., "Development Interdependency Modeling for System-of-Systems (SoS) using Bayesian Networks: SoS Management Strategy Planning”, Procedia Computer Science, Vol. 16, pp. 698-707, 2013.
[13] Forrester, J.W., “Industrial Dynamics”, MIT Press, Cambridge, MA., 1962.
[14] Booth-Sweeny, L. and Stermann, J.D., “Bathtub Dynamics – Initial Results of System Thinking Inventory”, System Dynamics Review, Vol. 16, pp. 249-286, 2000.
[15] Weil, H.B., “Application of system dynamics to corportate strategy: an evolution of issues and frameworks”, System Dynamics Review, Vol. 23, pp. 137-156, 2007.
[16] Forrester, J.W., “Dynamic models of economic systems and industrial organizations”, System Dynamics Review, Vol. 19, pp. 331-345, 2003.
0
0.1
0.2
0.3
0.4
0.5
0.6
0.7
0.8
0.9
1
approximated
delay ‐norm
alized
reference period
reference model
7

Fourth SESAR Innovation Days, 25th – 27th November 2014
[17] Inzerelli, F. and Sergioc, R., “Uncertain demand, model competition and optimal price-capacity adjustments in air transportation”, Transportation, Vol. 21, pp. 91-101, 1994.
[18] Suryani, E. and Chou, S.-Y. and Chen, C.-H., “Air passenger demand forecasting and passenger terminal capacity expansion: A system dynamics framework”, Expert System with applications, Vol. 37, pp. 2324-2339, 2010.
[19] Hsu, C. and Chao, C., “Space allocation for commercial activities at international passenger terminals”, Transportation Research Part E, Vol. 41, pp. 29-51, 2005.
[20] Armah, F. and Yawson, D and Pappoe, A., “A system dynamics approach to explore traffic congestion and air pollution link in the city of Accra, Ghana”, Sustainability, Vol. 2, pp. 252-265, 2010.
[21] Hustache, J.C. and Gibellini, M. and De Matos, P.L., “A System Dynamics tool for economic performance assessment in air traffic management”, Proceedings of the 4th USA/Europe ATM R/D Seminar, Sante Fe, New Mexico, 2001.
[22] Galvin, Jr., J., “Traffic control resource management strategies and the small aircraft transportation system: A system dynamics perspective”, Dissertation, Faculty of the Virginia Polytech Institute and the State University, 2002.
[23] Jarque, M. Carlos and Bera, K. Anil, “Efficient Tests for Normality, Homoscedasticity and Serial Independence of Regression Residuals,” Economics Letters 6, pp. 255-259, 1980.
[24] Darling, D. “The kolmogorov-smirnov, cramer von mises tests”, Annals Mathematical Statistics, 28, pp. 823-838, 1957.
[25] D´agostino, R., and Belanger, A., and D´agostino, Jr., R., “A suggestion for using powerful and informative tests of normality”. The American Statistician, 44, pp. 316-321, 1990.
[26] Shapiro, S. and Wilk, M., “An analysis of variance tests for normality (complete samples)”, Biometrica, 52, pp. 591-611, 1965.
[27] Royston, P., “Approximating the Shapiro-Wilk W-test for non-normality”, Statistics and Computing, 2, pp. 117-119, 1992.
[28] Razali, N.M., “Power comparisons of Shapiro-Wilk, Kolmogorov-Smirnov, Lilliefors and Anderson-Darling tests“, Journal of Statistical Modeling and Analytics, Vol. 2, No. 1, pp. 21-33, 2011.
[29] Prescott, P., “On a test for normality based on sample entropy”, Journal of Royal Statistical Society, 38, pp. 254-256.
[30] Hopkins, D. Kenneth and Weeks, L. Douglas, “Tests for normality and measures of skeweness and kurtosis: Their place in research reporting”, Educational and Psychological Messurement, Vol. 50, pp. 717-729, 1990.
[31] Wright, B.R.E. et al., “Reconsidering the relationship between SES and delinquency: Causation but not correlation”, Criminology, Volume 37, pp. 175-194, 2006.
[32] Opgen-Rhein, R. and Strimmer, K.,“From correlation to causation networks: A simple approximate learning algorithm and its application to high-dimensional plant gene expression data“, BMC Systems Biology, 1:37, 2007.
[33] Barlas, Y., “Formal aspects of model validity and validation in system dynamics”, System Dynamics Review, Vol. 12, pp. 183-210, 1996.
[34] Carson, J.S., “Convincing Users of Model´s Validity is Challenging Aspect of Modeler´s Job”, Industrial Engineering, Vol. 18, pp. 74-85, 1986.
[35] Kleijnen, J.P.C., “Verification and validation of simulation models”, European Journal of Operational Research, Vol. 85, pp. 145-162, 1995.
8