Modeling and Simulation of 0.5 HP Rotating Machine for the...
10
Australian Journal of Basic and Applied Sciences, 5(12): 179-188, 2011 ISSN 1991-8178 Corresponding Author: I. Daut, Power Electronics and Electrical Machine Design Research Cluster School of Electrical Systems Engineering Universiti Malaysia Perlis (UniMAP). E-mail: [email protected], [email protected], 179 Modeling and Simulation of 0.5 HP Rotating Machine for the Investigation of Losses by Using Copper as Rotor Bar Material I. Daut, N. Gomesh, Y. Yanawati, M. Irwanto, S. Nor Shafiqin, Y.M. Irwan, Power Electronics and Electrical Machine Design Research Cluster School of Electrical Systems Engineering Universiti Malaysia Perlis (UniMAP). Abstract: In this paper, the 0.5HP three phase AC induction motor have been investigated and analyzed.Through out this project, an induction motor is design by AutoCAD software and then simulated by using the FEM software.It is then compared with another conventionally used rotor bar. The first part of comparison is done with FEM Simulation by modeling the induction motor of aluminium rotor bar and copper rotor bar for the same 0.5HP configuration of stator slot design and winding configuration. The simulation is compared in terms of power loss, magnetic flux density, magnetic field intensity, eddy current density, torque vs. speed, torque vs. slip, power loss vs. speed and power loss vs. slip. From the overall experiment of software simulation, results shows that in the magnetic flux density (B) between the aluminium and copper rotor bars analysis, the high electrical conductivity can provide lower resistivity of the material, this means the copper rotor bars has lower impedance thus lower losses. The entire analysis shows some good benefits towards the usage of copper material rotor bars. Key words: Induction Motor, Simulation, Losses, Efficiency, Copper, Aluminium. INTRODUCTION Based on the analysis of industrial energy use in Malaysian companies, it has been found that electrical motors used the highest amount of energy (47%) followed by pumps (14%), air compressors (9%), air- conditioning systems (7%), workshop machines (6%,), lighting (6%), overhead cranes (3%), ventilation (2%), furnace (1%), conveyor system (1%), boiler (1%), refrigeration system (1%) and other equipments (4%) (Saidur, R., 2009). Majority of motors in the industry are induction motors. There may be various reasons for the desire of testing an existing induction motor in the field, such as consideration of exchanging out of date or worn motors with new, or checking the efficiency after rewinding. Particularly the output power of motor is hard to detect. One of established procedures is therefore to calculate the efficiency by measuring the losses and subtract them from the input to find the output (Chapman, S.J., 2005). The induction motor machine is an important class of electric machines which finds wide applications. More than 85% of industrial motors in use today are in fact induction motors. Induction motors are complex electromechanical devices utilized in most industrial applications for the conversion of power from electrical to mechanical form. Three phase induction motor are used because it is simple, rugged, low price, and easy to maintain. They run at essentially constant speed from zero to full-load (Theodore, W., 2006). In general, the losses of a machine can be estimated either by calculation or determined by measurement, but the nature of electrical machines is such that it is almost impossible to predict the losses with high precision. The losses of the AC induction motor can be divided into five categories. The first five loss components are stator copper loss, rotor copper loss, core loss, stray load loss and friction and windage losses are obtain from no-load test and block rotor test. The copper loss is determined based on stator resistance, slip and input power measurements. The fifth loss component is known as stray loss. Indeed the term ‘stray losses’ came about because of the discrepancies between predicted and measured losses. The accurate measurement of loss, which itself presents many difficulties, can be approached in a number of ways first by the difference between the measured input and output powers, second by the segregation and separate measurement of the loss components, and finally by the measurement by the effects of the losses (Turner, D.R., 1991). Stator and rotor copper loss l 2 R make up the largest share. Both are influenced by the presence of harmonics. Whereas what occurs within the stator winding is directly measurable, what occurs in the rotor is not. Iron or core loss is frequency-dependent. It's determined in standard test procedures (refer to IEEE Standard 112 B) from measurements made during a no-load running test. These losses can affect the efficiency and can be reduced by using quality materials, as well as by optimizing the design. The aim of this research is to investigate the losses in AC induction motor using different rotor bar material which is copper and aluminium and to obtain the efficiency and performance of the induction motor in both rotor materials. The objective of this research can be summarized as follows:
Transcript of Modeling and Simulation of 0.5 HP Rotating Machine for the...

Australian Journal of Basic and Applied Sciences, 5(12): 179-188, 2011 ISSN 1991-8178
Corresponding Author: I. Daut, Power Electronics and Electrical Machine Design Research Cluster School of Electrical Systems Engineering Universiti Malaysia Perlis (UniMAP).
E-mail: [email protected], [email protected], 179
Modeling and Simulation of 0.5 HP Rotating Machine for the Investigation of Losses by Using Copper as Rotor Bar Material
I. Daut, N. Gomesh, Y. Yanawati, M. Irwanto, S. Nor Shafiqin, Y.M. Irwan,
Power Electronics and Electrical Machine Design Research Cluster School of Electrical Systems
Engineering Universiti Malaysia Perlis (UniMAP). Abstract: In this paper, the 0.5HP three phase AC induction motor have been investigated and analyzed.Through out this project, an induction motor is design by AutoCAD software and then simulated by using the FEM software.It is then compared with another conventionally used rotor bar. The first part of comparison is done with FEM Simulation by modeling the induction motor of aluminium rotor bar and copper rotor bar for the same 0.5HP configuration of stator slot design and winding configuration. The simulation is compared in terms of power loss, magnetic flux density, magnetic field intensity, eddy current density, torque vs. speed, torque vs. slip, power loss vs. speed and power loss vs. slip. From the overall experiment of software simulation, results shows that in the magnetic flux density (B) between the aluminium and copper rotor bars analysis, the high electrical conductivity can provide lower resistivity of the material, this means the copper rotor bars has lower impedance thus lower losses. The entire analysis shows some good benefits towards the usage of copper material rotor bars. Key words: Induction Motor, Simulation, Losses, Efficiency, Copper, Aluminium.
INTRODUCTION Based on the analysis of industrial energy use in Malaysian companies, it has been found that electrical
motors used the highest amount of energy (47%) followed by pumps (14%), air compressors (9%), air-conditioning systems (7%), workshop machines (6%,), lighting (6%), overhead cranes (3%), ventilation (2%), furnace (1%), conveyor system (1%), boiler (1%), refrigeration system (1%) and other equipments (4%) (Saidur, R., 2009). Majority of motors in the industry are induction motors. There may be various reasons for the desire of testing an existing induction motor in the field, such as consideration of exchanging out of date or worn motors with new, or checking the efficiency after rewinding. Particularly the output power of motor is hard to detect. One of established procedures is therefore to calculate the efficiency by measuring the losses and subtract them from the input to find the output (Chapman, S.J., 2005).
The induction motor machine is an important class of electric machines which finds wide applications. More than 85% of industrial motors in use today are in fact induction motors. Induction motors are complex electromechanical devices utilized in most industrial applications for the conversion of power from electrical to mechanical form. Three phase induction motor are used because it is simple, rugged, low price, and easy to maintain. They run at essentially constant speed from zero to full-load (Theodore, W., 2006).
In general, the losses of a machine can be estimated either by calculation or determined by measurement, but the nature of electrical machines is such that it is almost impossible to predict the losses with high precision. The losses of the AC induction motor can be divided into five categories. The first five loss components are stator copper loss, rotor copper loss, core loss, stray load loss and friction and windage losses are obtain from no-load test and block rotor test. The copper loss is determined based on stator resistance, slip and input power measurements. The fifth loss component is known as stray loss. Indeed the term ‘stray losses’ came about because of the discrepancies between predicted and measured losses. The accurate measurement of loss, which itself presents many difficulties, can be approached in a number of ways first by the difference between the measured input and output powers, second by the segregation and separate measurement of the loss components, and finally by the measurement by the effects of the losses (Turner, D.R., 1991). Stator and rotor copper loss l2R make up the largest share. Both are influenced by the presence of harmonics. Whereas what occurs within the stator winding is directly measurable, what occurs in the rotor is not. Iron or core loss is frequency-dependent. It's determined in standard test procedures (refer to IEEE Standard 112 B) from measurements made during a no-load running test. These losses can affect the efficiency and can be reduced by using quality materials, as well as by optimizing the design.
The aim of this research is to investigate the losses in AC induction motor using different rotor bar material which is copper and aluminium and to obtain the efficiency and performance of the induction motor in both rotor materials. The objective of this research can be summarized as follows:
Aust. J. Basic & Appl. Sci., 5(12): 179-188, 2011
180
1. Design and simulation of three phase AC induction motor using Opera 2D software version 12.0 for aluminium and copper rotor bars.
2. To construct a rotor with copper rotor bar and compare it with the existing aluminium rotor bars of the 0.5HP induction motor.
3. To investigate the performance of the copper rotor bar in terms of efficiency, power factor, losses reduction potential and economical aspect analysis in terms of money and energy saving.
4. To investigate the efficiency of the 0.5HP AC induction motor based on loss parameters such as stator copper loss, rotor loss, core loss, friction & windage losses and stray load loss in both rotors.
Problem Statement: The efficiency of induction motor depends on percentage of losses. In electrical machines, core losses
amount to 20-25 % and copper loss amount to 15-30 % of the total losses. A substantial portion of the losses in electrical machines is loss in the iron core. Calculations of iron losses in the electrical machines are normally based on experimental characteristics of core material used in the machines. Efficiency of induction motor is very much debated these days. Different standards are used in the world making actual manufacturer numbers hard to compare. Energy efficient electric motors generally represent one of the biggest opportunities for cost effective electricity saving around the world, Induction motor efficiency is dependent on the amount of motor losses such as stator copper loss, rotor loss, core loss, friction and windage loss and stray load loss. If these losses can be decreased, the motor efficiency can be increased and energy consumption can be reduced. The increase in the efficiency of electric machines is the main problem in the production of induction motors, especially in the range of small motors. F.E.M Design Modeling of Induction Motor:
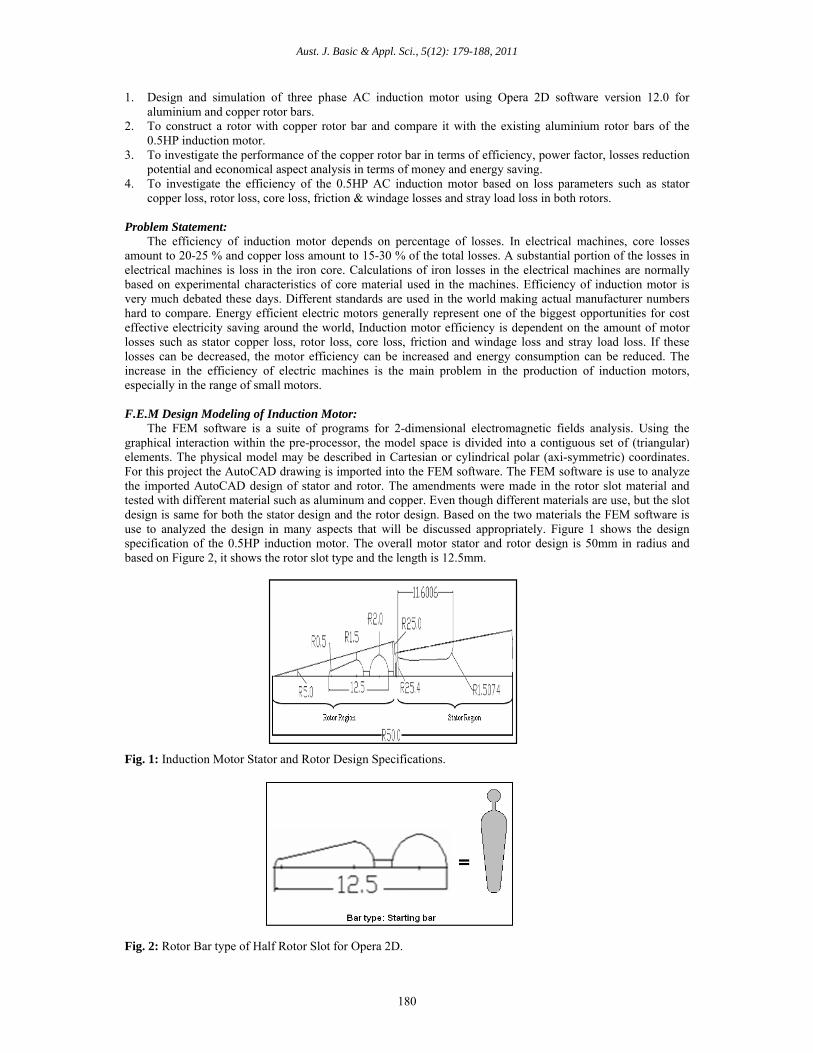
The FEM software is a suite of programs for 2-dimensional electromagnetic fields analysis. Using the graphical interaction within the pre-processor, the model space is divided into a contiguous set of (triangular) elements. The physical model may be described in Cartesian or cylindrical polar (axi-symmetric) coordinates. For this project the AutoCAD drawing is imported into the FEM software. The FEM software is use to analyze the imported AutoCAD design of stator and rotor. The amendments were made in the rotor slot material and tested with different material such as aluminum and copper. Even though different materials are use, but the slot design is same for both the stator design and the rotor design. Based on the two materials the FEM software is use to analyzed the design in many aspects that will be discussed appropriately. Figure 1 shows the design specification of the 0.5HP induction motor. The overall motor stator and rotor design is 50mm in radius and based on Figure 2, it shows the rotor slot type and the length is 12.5mm.
Fig. 1: Induction Motor Stator and Rotor Design Specifications.
Fig. 2: Rotor Bar type of Half Rotor Slot for Opera 2D.

Table done and u Table 1: 0.5H
0.5 Hp Indu
stator resist
rotor resista
slip
roter freque
shaft load t
Figurebars and acopper rotoand coppedifferences
Fig. 3: 2D
The BFigure 4. T
Fig. 4: B-H
1 shows the paused as the inpu
HP Induction Moto
uction Motor Para
tance (R1)
ance (R2)
ency(fy)
torque(T)
e 3 shows the 2air gap from thor and aluminier rotor. Baseds are stated.
view of Stator
BH curve used The BH curve h
H Curve of the
Aust.
arameter of theut for the F.E.M
or Parameters for t
ameters
2 dimensional he FEM softwaium rotor desigd on the simu
r & Stator Bars
for the Aluminhas been taken
Copper and A
J. Basic & Appl
e 0.5HP inductMsoftware.
the Opera 2D inpu
(2D) view of are. Two motogn; the FEM soulation, results
s, Rotor & Rot
nium and Coppfrom the FEM
Aluminium Mat
l. Sci., 5(12): 179
tion motor bas
ut.
Value
25.6Ω
18.58Ω
0.05
2.60Hz
2.5N-m
the induction or is designed oftware uses st from the two
or Bars and Ai
per rotor bar slM software whi
terials.
9-188, 2011
ed on the math
motor with itsto have 36 sta
teady-state ACo materials ar
ir Gap.
lot of the 0.5Hch shows 1.8 T
hematical mode
stator, stator bator and 24 rot analysis solve
re analyzed an
HP induction mTesla and given
eling procedur
bars, rotor, rottor slots each er for aluminiund its properti
motor is shown n below.
res
tor of
um ies
as
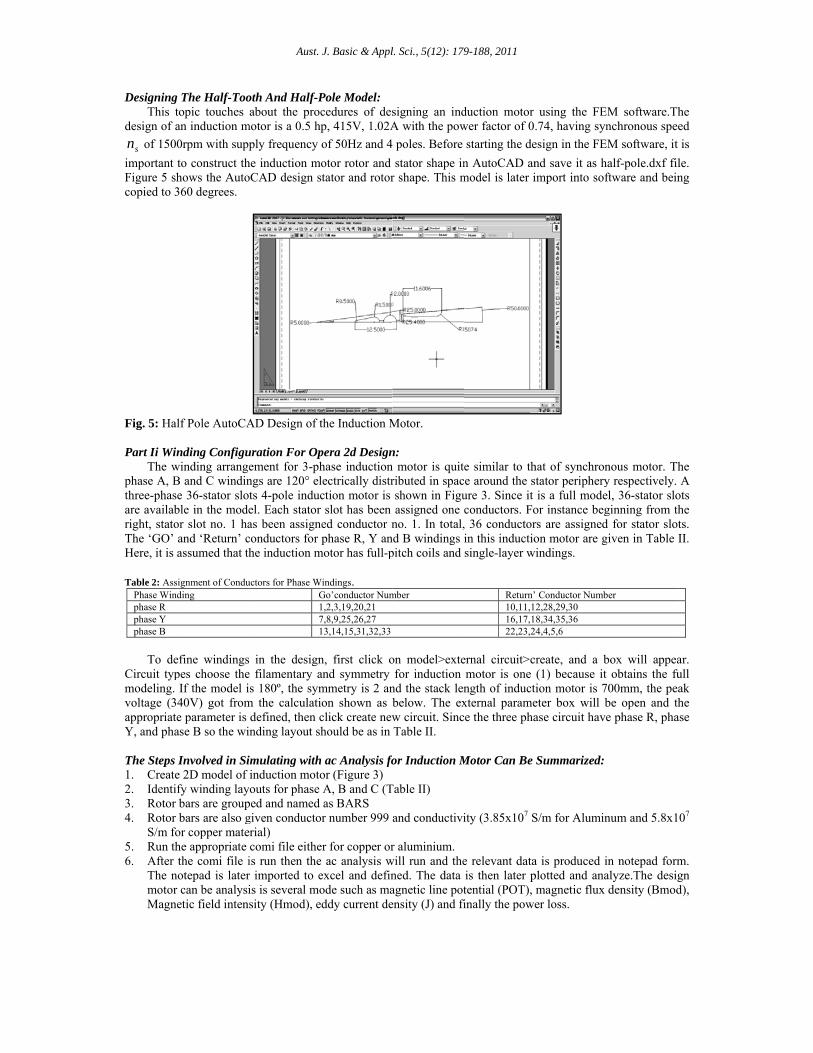
Designing This t
design of a
sn of 1500
important tFigure 5 shcopied to 3
Fig. 5: Hal Part Ii Win
The wphase A, Bthree-phaseare availabright, statoThe ‘GO’ Here, it is a Table 2: Ass
Phase Windphase R phase Y phase B
To de
Circuit typmodeling. voltage (34appropriateY, and pha The Steps 1. Create2. Identif3. Rotor 4. Rotor
S/m fo5. Run th6. After
The nmotor Magne
g The Half-Tootopic touches an induction m
0rpm with supp
to construct thhows the Auto360 degrees.
lf Pole AutoCA
nding Configuwinding arrangeB and C windine 36-stator sloble in the modeor slot no. 1 haand ‘Return’ cassumed that th
ignment of Conduding
efine windingspes choose theIf the model i40V) got frome parameter is ase B so the wi
Involved in Sie 2D model of fy winding laybars are groupbars are also g
or copper matehe appropriate the comi file iotepad is latercan be analysi
etic field inten
Aust.
oth And Half-Pabout the proc
motor is a 0.5 hp
ply frequency
he induction moCAD design s
AD Design of t
uration For Opement for 3-phngs are 120° elts 4-pole inducel. Each statoras been assignconductors for he induction m
uctors for Phase WG171
in the designe filamentary as 180º, the sym
m the calculatidefined, then cnding layout sh
imulating withinduction moto
youts for phase ped and named given conductoerial) comi file eitheis run then ther imported to eis is several mosity (Hmod), e
J. Basic & Appl
Pole Model: cedures of desp, 415V, 1.02A
of 50Hz and 4
otor rotor and stator and rotor
the Induction M
pera 2d Designhase inductionlectrically distrction motor is r slot has been ned conductor n
phase R, Y anmotor has full-p
Windings. Go’conductor Num1,2,3,19,20,21 7,8,9,25,26,27 13,14,15,31,32,33
n, first click oand symmetry mmetry is 2 anion shown as bclick create newhould be as in
h ac Analysis foor (Figure 3) A, B and C (Tas BARS
or number 999
er for copper ore ac analysis wexcel and definode such as ma
eddy current de
l. Sci., 5(12): 179
signing an indA with the pow
4 poles. Before
stator shape inr shape. This m
Motor.
n: n motor is quitributed in spacshown in Figuassigned one
no. 1. In total,nd B windings pitch coils and
mber
on model>extefor induction
nd the stack lenbelow. The exw circuit. SincTable II.
for Induction M
Table II)
and conductivi
r aluminium. will run and thened. The data agnetic line potensity (J) and fi
9-188, 2011
duction motor wer factor of 0.
starting the de
n AutoCAD anmodel is later i
e similar to thce around the sure 3. Since it conductors. Fo, 36 conductorin this inductiosingle-layer w
Return’10,11,116,17,122,23,2
ernal circuit>cmotor is one ngth of inductxternal paramece the three pha
Motor Can Be
ity (3.85x10⁷ S
e relevant datais then later ptential (POT),
finally the powe
using the FE.74, having syn
esign in the FE
nd save it as himport into sof
hat of synchrontator peripheryis a full mode
or instance begrs are assignedon motor are gindings.
Conductor Numb2,28,29,30 8,34,35,36 4,4,5,6
reate, and a b(1) because it ion motor is 7eter box will base circuit have
Summarized:
S/m for Alumin
a is produced iplotted and anamagnetic flux er loss.
M software.Thnchronous spee
M software, it
alf-pole.dxf filftware and bein
nous motor. Thy respectively. el, 36-stator sloginning from thd for stator slotgiven in Table I
ber
box will appeaobtains the fu
700mm, the peabe open and the phase R, pha
num and 5.8x1
in notepad formalyze.The desigdensity (Bmod
he ed
is
le. ng
he A
ots he ts. II.
ar. ull ak he
ase
07
m. gn d),

Aust. J. Basic & Appl. Sci., 5(12): 179-188, 2011
183
Simulation Result From Fem: This topic discusses the results obtained from the Opera 2D software simulation and the result is described
as plot magnetic potential lines (POT), eddy current density (J2), magnetic flux density (Bmod), and magnetic field strength ((Hmod).
Plot Magnetic Potential Lines (POT):
Figure 6 shows difference of magnetic pole distribution base on two material used in the induction motor. Based on Figure (b), the magnetic pole of copper rotor bars is more uniform than aluminum rotor bars (a). This shows that copper rotor bar is more likely to lessen the hysteresis losses because the line potential of magnetic from copper material is more uniform than aluminum line potential and flux leakage at copper rotor bars is less than aluminum rotor bars.
(a) (b) Fig. 6: Magnetic Line Potential based at 50 Hz. Plot Magnetic Potential Lines (Pot):-Colored Zone Analysis:
Based on Figure 7, notice that the density of magnetic potential in the rotor area for aluminum and copper bars is different. Aluminum shows denser magnetic potential concentration at the rotor area than copper, the aluminum rotor shows that the effect from the stator plays an important role in rotating the rotor. The magnetic pole at the stator area is spreading to the rotor and needs higher torque to turn the rotor because the magnetic flux density in the aluminium rotor bar area is stronger than the copper rotor bar. As in copper rotor bar, the area of rotor shows much lighter flux density affecting the rotor and the magnetic flux pull from the stator doesn’t affect much and this makes the copper rotor needs smaller torque to rotate the rotor.
(a) (b)
Fig. 7: Magnetic Line Potential based on Colored Zone at 50 Hz. Eddy Current Density Across Motor Area for Aluminium and Copper:
Based on Figure 8 it shows the difference of eddy current density between the aluminum and copper rotor motor at 50Hz. Both the figure shows a 4 pole pattern in which copper has less eddy current density than aluminum based on the density meter. When using copper as material, the losses decrease. When the rotor

Aust. J. Basic & Appl. Sci., 5(12): 179-188, 2011
184
moves at 50 Hz there is a change in the magnetic field and eddy current produced. Figure 8 shows the faster the field that the conductor is exposed to changes, then the greater the currents that are developed and the greater the opposing field. Eddy currents transform useful forms of energy, such as kinetic energy, into heat, which is generally much less useful. In many devices, this Joule heating reduces efficiency of electric motors and other devices that use changing magnetic fields.
(a) (b)
Fig. 8: Eddy Current Density of Rotor Bar at 50 Hz. Magnetic Flux Density of Aluminium and Copper at 50 Hz:
Figure 9 shows the magnetic flux density base on aluminum and copper rotor bars. The maximum magnetic flux density assigned to both materials is less than 1.8 Tesla based on Figure 4. For the copper rotor bars, the magnetic flux density is 1.34 Tesla and for aluminum rotor bars magnetic flux density is 1.36 Tesla. So, the copper rotor bars produced less flux magnet than aluminum rotor bars by 1.47%. This is because both of the materials have different electrical conductivity. For aluminum, the electrical conductivity is 3.77 × 10⁷ S·m-1 and for copper, electrical conductivity is 5.8× 10⁷ S·m-1. High electrical conductivity can provide lower resistivity of the material; this means the copper rotor bars has lower impedance thus lower losses. It means the magnetic flux density for copper rotor bars is better than aluminum rotor bars and this can reduce the core loss of an induction motor because core loss is the energy required to overcome opposition to changing magnetic fields in the core material and this can be reduce by using better quality steel or by lengthening the core to reduce magnetic flux density.
(a) (b) Fig. 9: Magnetic Flux Density of Rotor Bar at 50 Hz. Magnetic Field Strength of Aluminium and Copper at 50 Hz:
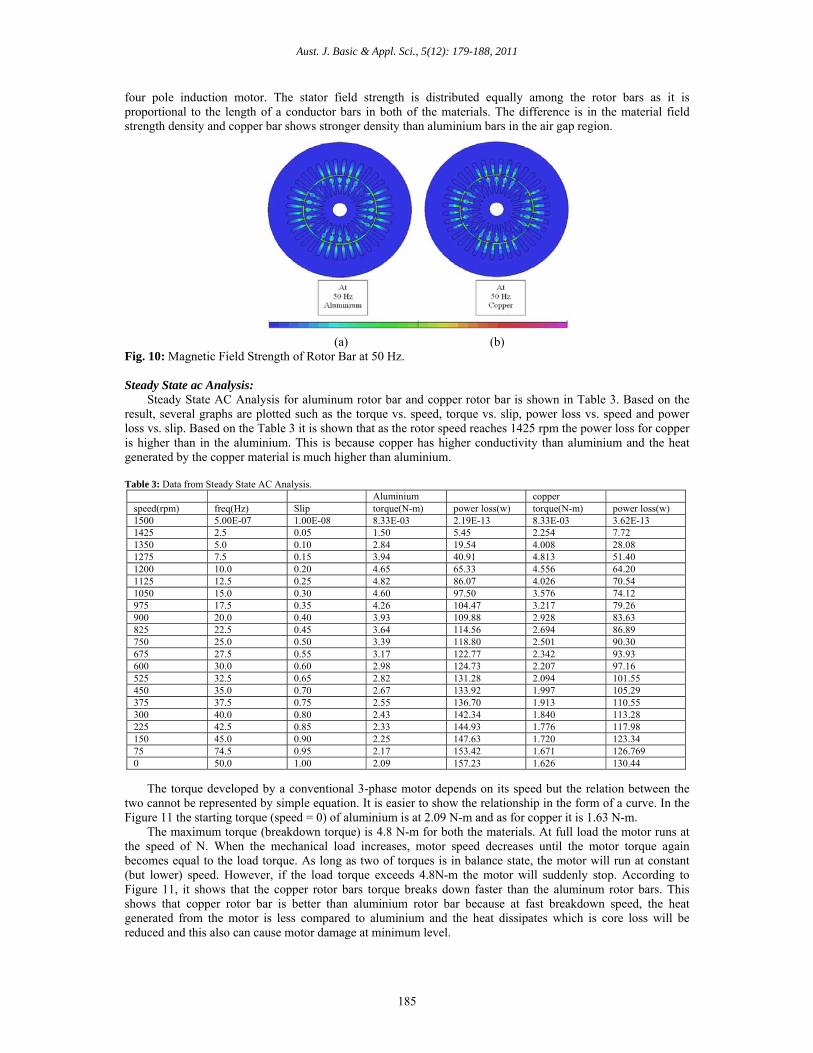
Figure 10, it shows the magnetic field strength (H) of the design Opera 2D motor for aluminium and copper material. Notice that at 50 Hz, the strength of the magnetic field is equally distributed to the stator developing a
Aust. J. Basic & Appl. Sci., 5(12): 179-188, 2011
185
four pole induction motor. The stator field strength is distributed equally among the rotor bars as it is proportional to the length of a conductor bars in both of the materials. The difference is in the material field strength density and copper bar shows stronger density than aluminium bars in the air gap region.
(a) (b) Fig. 10: Magnetic Field Strength of Rotor Bar at 50 Hz. Steady State ac Analysis:
Steady State AC Analysis for aluminum rotor bar and copper rotor bar is shown in Table 3. Based on the result, several graphs are plotted such as the torque vs. speed, torque vs. slip, power loss vs. speed and power loss vs. slip. Based on the Table 3 it is shown that as the rotor speed reaches 1425 rpm the power loss for copper is higher than in the aluminium. This is because copper has higher conductivity than aluminium and the heat generated by the copper material is much higher than aluminium. Table 3: Data from Steady State AC Analysis.
Aluminium copper speed(rpm) freq(Hz) Slip torque(N-m) power loss(w) torque(N-m) power loss(w) 1500 5.00E-07 1.00E-08 8.33E-03 2.19E-13 8.33E-03 3.62E-13 1425 2.5 0.05 1.50 5.45 2.254 7.72 1350 5.0 0.10 2.84 19.54 4.008 28.08 1275 7.5 0.15 3.94 40.91 4.813 51.40 1200 10.0 0.20 4.65 65.33 4.556 64.20 1125 12.5 0.25 4.82 86.07 4.026 70.54 1050 15.0 0.30 4.60 97.50 3.576 74.12 975 17.5 0.35 4.26 104.47 3.217 79.26 900 20.0 0.40 3.93 109.88 2.928 83.63 825 22.5 0.45 3.64 114.56 2.694 86.89 750 25.0 0.50 3.39 118.80 2.501 90.30 675 27.5 0.55 3.17 122.77 2.342 93.93 600 30.0 0.60 2.98 124.73 2.207 97.16 525 32.5 0.65 2.82 131.28 2.094 101.55 450 35.0 0.70 2.67 133.92 1.997 105.29 375 37.5 0.75 2.55 136.70 1.913 110.55 300 40.0 0.80 2.43 142.34 1.840 113.28 225 42.5 0.85 2.33 144.93 1.776 117.98 150 45.0 0.90 2.25 147.63 1.720 123.34 75 74.5 0.95 2.17 153.42 1.671 126.769 0 50.0 1.00 2.09 157.23 1.626 130.44
The torque developed by a conventional 3-phase motor depends on its speed but the relation between the two cannot be represented by simple equation. It is easier to show the relationship in the form of a curve. In the Figure 11 the starting torque (speed = 0) of aluminium is at 2.09 N-m and as for copper it is 1.63 N-m.
The maximum torque (breakdown torque) is 4.8 N-m for both the materials. At full load the motor runs at the speed of N. When the mechanical load increases, motor speed decreases until the motor torque again becomes equal to the load torque. As long as two of torques is in balance state, the motor will run at constant (but lower) speed. However, if the load torque exceeds 4.8N-m the motor will suddenly stop. According to Figure 11, it shows that the copper rotor bars torque breaks down faster than the aluminum rotor bars. This shows that copper rotor bar is better than aluminium rotor bar because at fast breakdown speed, the heat generated from the motor is less compared to aluminium and the heat dissipates which is core loss will be reduced and this also can cause motor damage at minimum level.
Aust. J. Basic & Appl. Sci., 5(12): 179-188, 2011
186
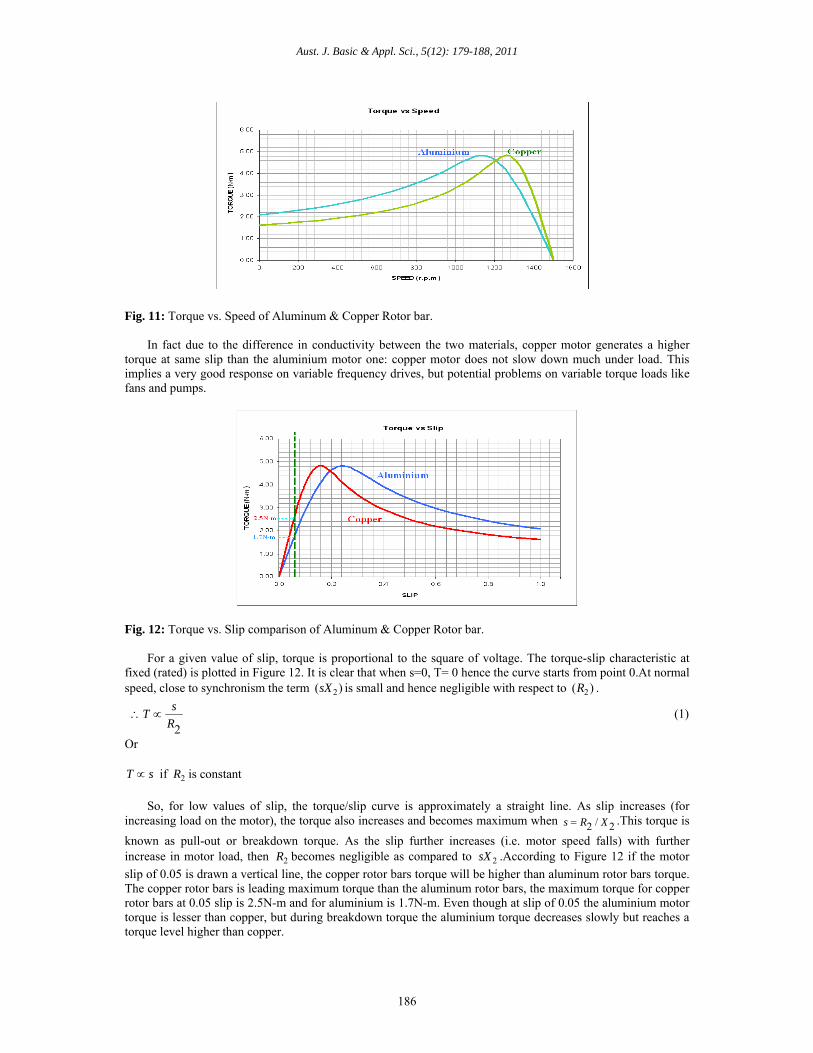
Fig. 11: Torque vs. Speed of Aluminum & Copper Rotor bar. In fact due to the difference in conductivity between the two materials, copper motor generates a higher
torque at same slip than the aluminium motor one: copper motor does not slow down much under load. This implies a very good response on variable frequency drives, but potential problems on variable torque loads like fans and pumps.
Fig. 12: Torque vs. Slip comparison of Aluminum & Copper Rotor bar.
For a given value of slip, torque is proportional to the square of voltage. The torque-slip characteristic at fixed (rated) is plotted in Figure 12. It is clear that when s=0, T= 0 hence the curve starts from point 0.At normal speed, close to synchronism the term )( 2sX is small and hence negligible with respect to )( 2R .
2R
sT (1)
Or
sT if 2R is constant
So, for low values of slip, the torque/slip curve is approximately a straight line. As slip increases (for
increasing load on the motor), the torque also increases and becomes maximum when 2/2 XRs .This torque is
known as pull-out or breakdown torque. As the slip further increases (i.e. motor speed falls) with further increase in motor load, then 2R becomes negligible as compared to 2sX .According to Figure 12 if the motor
slip of 0.05 is drawn a vertical line, the copper rotor bars torque will be higher than aluminum rotor bars torque. The copper rotor bars is leading maximum torque than the aluminum rotor bars, the maximum torque for copper rotor bars at 0.05 slip is 2.5N-m and for aluminium is 1.7N-m. Even though at slip of 0.05 the aluminium motor torque is lesser than copper, but during breakdown torque the aluminium torque decreases slowly but reaches a torque level higher than copper.
Aust. J. Basic & Appl. Sci., 5(12): 179-188, 2011
187
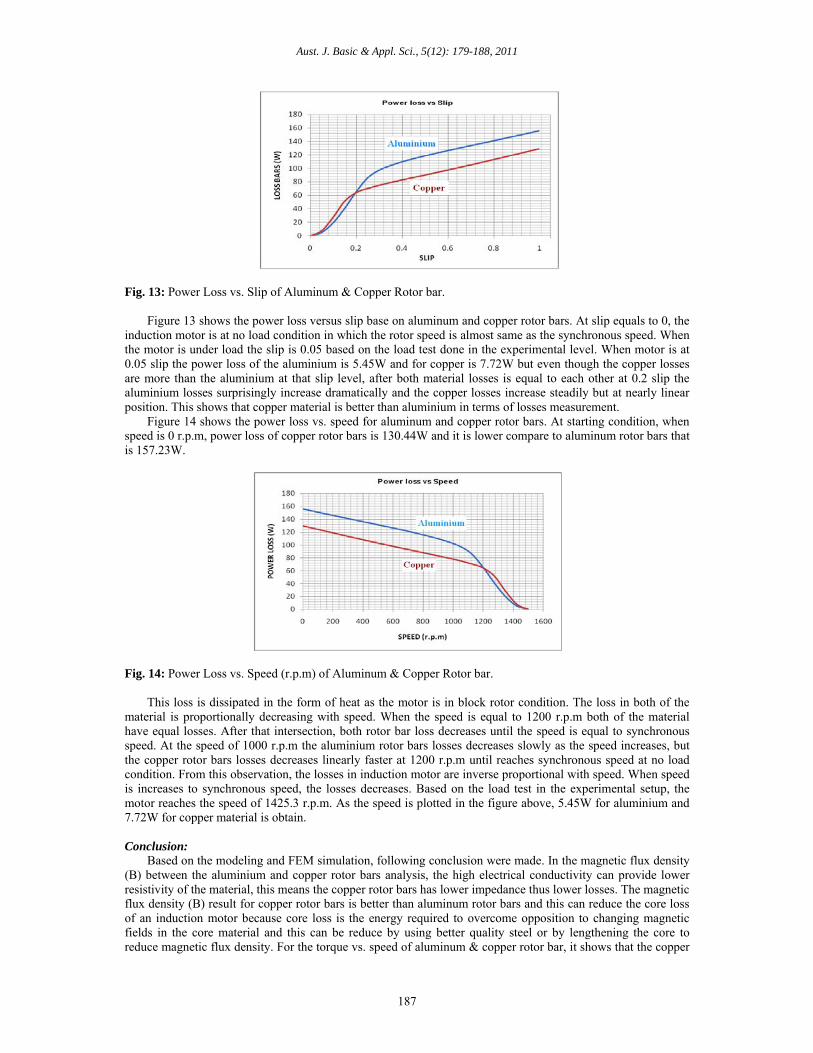
Fig. 13: Power Loss vs. Slip of Aluminum & Copper Rotor bar.
Figure 13 shows the power loss versus slip base on aluminum and copper rotor bars. At slip equals to 0, the induction motor is at no load condition in which the rotor speed is almost same as the synchronous speed. When the motor is under load the slip is 0.05 based on the load test done in the experimental level. When motor is at 0.05 slip the power loss of the aluminium is 5.45W and for copper is 7.72W but even though the copper losses are more than the aluminium at that slip level, after both material losses is equal to each other at 0.2 slip the aluminium losses surprisingly increase dramatically and the copper losses increase steadily but at nearly linear position. This shows that copper material is better than aluminium in terms of losses measurement.
Figure 14 shows the power loss vs. speed for aluminum and copper rotor bars. At starting condition, when speed is 0 r.p.m, power loss of copper rotor bars is 130.44W and it is lower compare to aluminum rotor bars that is 157.23W.
Fig. 14: Power Loss vs. Speed (r.p.m) of Aluminum & Copper Rotor bar.
This loss is dissipated in the form of heat as the motor is in block rotor condition. The loss in both of the material is proportionally decreasing with speed. When the speed is equal to 1200 r.p.m both of the material have equal losses. After that intersection, both rotor bar loss decreases until the speed is equal to synchronous speed. At the speed of 1000 r.p.m the aluminium rotor bars losses decreases slowly as the speed increases, but the copper rotor bars losses decreases linearly faster at 1200 r.p.m until reaches synchronous speed at no load condition. From this observation, the losses in induction motor are inverse proportional with speed. When speed is increases to synchronous speed, the losses decreases. Based on the load test in the experimental setup, the motor reaches the speed of 1425.3 r.p.m. As the speed is plotted in the figure above, 5.45W for aluminium and 7.72W for copper material is obtain.
Conclusion:
Based on the modeling and FEM simulation, following conclusion were made. In the magnetic flux density (B) between the aluminium and copper rotor bars analysis, the high electrical conductivity can provide lower resistivity of the material, this means the copper rotor bars has lower impedance thus lower losses. The magnetic flux density (B) result for copper rotor bars is better than aluminum rotor bars and this can reduce the core loss of an induction motor because core loss is the energy required to overcome opposition to changing magnetic fields in the core material and this can be reduce by using better quality steel or by lengthening the core to reduce magnetic flux density. For the torque vs. speed of aluminum & copper rotor bar, it shows that the copper
Aust. J. Basic & Appl. Sci., 5(12): 179-188, 2011
188
rotor bars torque breaks down faster than the aluminum rotor bars. It shows that copper rotor bar is better than aluminium rotor bar. This is because at fast breakdown speed, the heat generated from the motor is less compared to aluminium and core loss will be reduced and this also can cause motor damage at minimum level. Because of the difference in conductivity between the two materials, copper motor generates a higher torque at same slip than the aluminium motor one: copper motor does not slow down much under load. This implies a very good response on variable frequency drives, but potential problems on variable torque loads like fans and pumps.
ACKNOWLEDGEMENTS
The authors wish to thank School of Electrical Systems Engineering, Universiti Malaysia Perlis (UniMAP) for the technical and financial support in terms of Short term Grant.
REFERENCES
Chapman, S.J., 2005. Electric machinery fundamentals (4th ed). New York: McGraw-Hill. Saidur, R., N.A. Rahim, H.H. Masjuki, S. Mekhilef, H.W. Ping and M.F. Jamaluddin, 2009. “End-use
energy analysis in the Malaysian industrial sector”. Energy, 34(2): 153-158. Theodore, W., 2006. Electrical machines, drives and power systems (6th ed). New Jersey: Pearson Prentice
Hall. Turner, D.R., K.J. Binns, B.N. Shamsadeen and D.F. Warne, 1991. “Accurate measurement of induction
motor losses using balance calorimeter”. Electric Power Applications, IEE Proceedings, 138(5): 233-242.