The Influencing Factors of Managerial Competencies among ...ajbasweb.com/old/ajbas/2012/December...
12
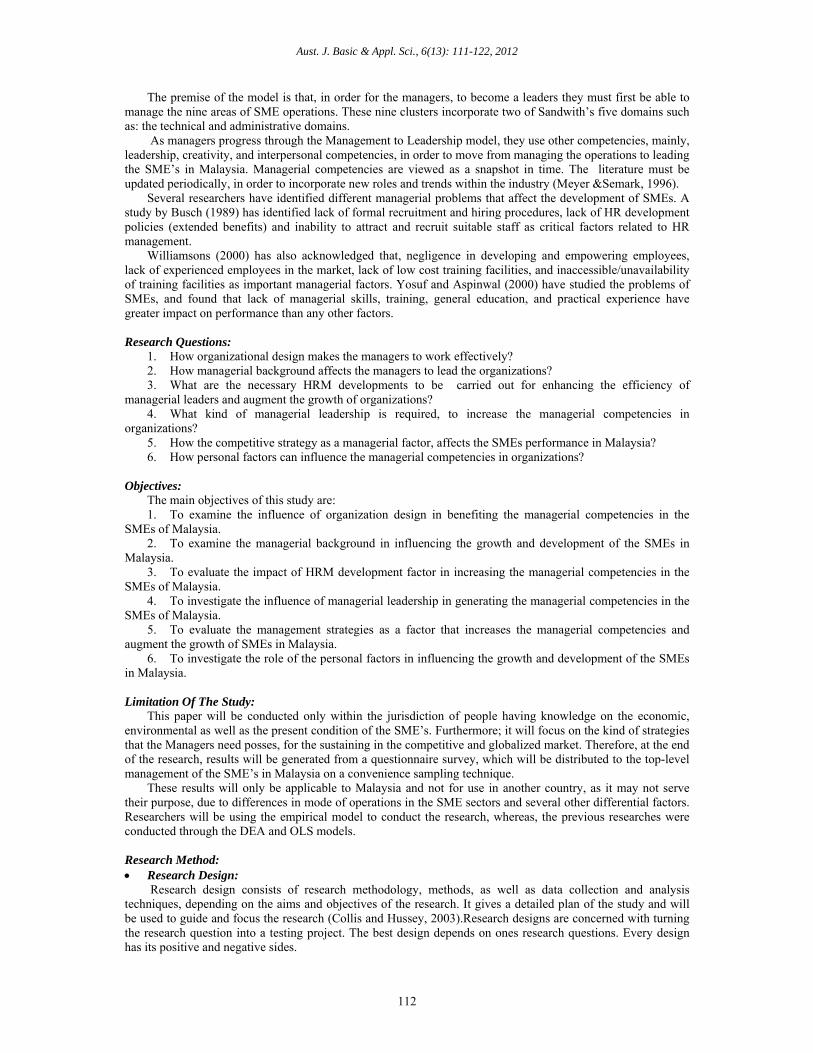
Australian Journal of Basic and Applied Sciences, 6(13): 111-122, 2012 ISSN 1991-8178 Corresponding Author: Hani AbdulhafedhThabitYahya, Master of Business Administration -Human Resource Management- Limkokwing University of Creative Technology 111 The Influencing Factors of Managerial Competencies among SMEs in Selangor, Malaysia: the Results of Quantitative Study 1 Hani AbdulhafedhThabitYahya, 2 KhaledAbdelhayElsayed 1 Master of Business Administration -Human Resource Management- Limkokwing University of Creative Technology 2 PhD Candidate of Peace and Conflict Studies-IKRAB Institute-UKM-Malaysia Abstract: Global economy depends not only on large or multinational companies, instead SMEs are very crucial for the developing the economy of any country. Therefore it is essential to have healthy competency among the managers of SMEs, to sustain their positions, growth of the enterprisers, especially in achieving their business objectives. Malaysia is one of the countries, which depends on SMEs for its economical growth. Hence it is essential to investigate the managerial competencies in the SMEs. Failure to do so, will eventually affect the financial stability of countries. In this context, this paper has reviewed the quantitative studies related to the factors that influence managerial competencies among SMEs in Selangor, Malaysia. This study has examined the following six factors towards influencing the managing competencies, such as: organization design, managerial background, HRM development factor, the managerial leadership, management strategies and personal factors. The researchers have established the relationship of these factors in influencing the managerial competencies among SMEs in Malaysia. This study is aimed at identifying the most influential factor among the above six factors. Furthermore they have made extensive efforts to identify the most influential factor form the above. The researchers have employed quantitative research design as the research methodology, in addition to using the questionnaire to quantify the results of the research. This paper has concluded that, the HRM development and managerial background are the most influential factors of increasing managerial competencies in the SMEs in Selangor Malaysia. Key words: Influence, Factor, Managerial Competencies, SMEs in Selangor, Malaysia, Quantitative Study INTRODUCTION Identifying the competencies requisites for achievement in an occupational field is a critical process in human resource management. The task of identifying specific qualities is considered as the exclusive feature of effective managers. The general definition for management competency used in this paper is, a cluster of related knowledge, skills, and attitudes that affects a major part of one’s job (a role or responsibility), that correlates with performance on the job, that can be measured against well-accepted standards, and can be improved via training and development. This paper recognizes the relationship between the dependent variable of managerial competencies in SMEs in Selangor Malaysia with the independent variables. It was quite difficult to find the appropriate respondents, due to lack of knowledge, related to managerial competency among the respondents. Therefore, the researchers had explained them about the objectives of the research and defined the terms managerial competency. The researchers have also discussed about the advantages of knowledge management in the organization. The data were collected from the selected 110 respondents and hypotheses were derived after the analysis of the data. So the research is partially primary and partially secondary. The data analysis was conducted with SPSS software by computing the required output. Problem Statement: The whole Malaysian economy depends on the SME’s, however, the rate of development of this sector is very low and their contribution towards economic diversification, employment creation, income distribution and poverty alleviation is minimal. This could be attributed to several factors. The business environment in which, the SMEs are operating today is different. Considerable changes have taken place in the global economy during the past two decades. The growing intensity of international competition and globalization are affecting the growth of SMEs in developing economies. The ability of firms to survive and grow in today’s turbulent markets, depends to a large extent on their managerial capabilities and strategic awareness. Managerial competencies are very well developed in various organizations including, small medium enterprises. However, most of the managerial competencies are focused on the education and business sectors.
Transcript of The Influencing Factors of Managerial Competencies among ...ajbasweb.com/old/ajbas/2012/December...
Australian Journal of Basic and Applied Sciences, 6(13): 111-122, 2012 ISSN 1991-8178
Corresponding Author: Hani AbdulhafedhThabitYahya, Master of Business Administration -Human Resource Management- Limkokwing University of Creative Technology
111
The Influencing Factors of Managerial Competencies among SMEs in Selangor, Malaysia: the Results of Quantitative Study
1Hani AbdulhafedhThabitYahya, 2KhaledAbdelhayElsayed
1Master of Business Administration -Human Resource Management- Limkokwing University of
Creative Technology 2PhD Candidate of Peace and Conflict Studies-IKRAB Institute-UKM-Malaysia
Abstract: Global economy depends not only on large or multinational companies, instead SMEs are very crucial for the developing the economy of any country. Therefore it is essential to have healthy competency among the managers of SMEs, to sustain their positions, growth of the enterprisers, especially in achieving their business objectives. Malaysia is one of the countries, which depends on SMEs for its economical growth. Hence it is essential to investigate the managerial competencies in the SMEs. Failure to do so, will eventually affect the financial stability of countries. In this context, this paper has reviewed the quantitative studies related to the factors that influence managerial competencies among SMEs in Selangor, Malaysia. This study has examined the following six factors towards influencing the managing competencies, such as: organization design, managerial background, HRM development factor, the managerial leadership, management strategies and personal factors. The researchers have established the relationship of these factors in influencing the managerial competencies among SMEs in Malaysia. This study is aimed at identifying the most influential factor among the above six factors. Furthermore they have made extensive efforts to identify the most influential factor form the above. The researchers have employed quantitative research design as the research methodology, in addition to using the questionnaire to quantify the results of the research. This paper has concluded that, the HRM development and managerial background are the most influential factors of increasing managerial competencies in the SMEs in Selangor Malaysia. Key words: Influence, Factor, Managerial Competencies, SMEs in Selangor, Malaysia, Quantitative
Study
INTRODUCTION
Identifying the competencies requisites for achievement in an occupational field is a critical process in human resource management. The task of identifying specific qualities is considered as the exclusive feature of effective managers. The general definition for management competency used in this paper is, a cluster of related knowledge, skills, and attitudes that affects a major part of one’s job (a role or responsibility), that correlates with performance on the job, that can be measured against well-accepted standards, and can be improved via training and development.
This paper recognizes the relationship between the dependent variable of managerial competencies in SMEs in Selangor Malaysia with the independent variables. It was quite difficult to find the appropriate respondents, due to lack of knowledge, related to managerial competency among the respondents. Therefore, the researchers had explained them about the objectives of the research and defined the terms managerial competency. The researchers have also discussed about the advantages of knowledge management in the organization. The data were collected from the selected 110 respondents and hypotheses were derived after the analysis of the data. So the research is partially primary and partially secondary. The data analysis was conducted with SPSS software by computing the required output. Problem Statement:
The whole Malaysian economy depends on the SME’s, however, the rate of development of this sector is very low and their contribution towards economic diversification, employment creation, income distribution and poverty alleviation is minimal. This could be attributed to several factors. The business environment in which, the SMEs are operating today is different. Considerable changes have taken place in the global economy during the past two decades. The growing intensity of international competition and globalization are affecting the growth of SMEs in developing economies.
The ability of firms to survive and grow in today’s turbulent markets, depends to a large extent on their managerial capabilities and strategic awareness. Managerial competencies are very well developed in various organizations including, small medium enterprises. However, most of the managerial competencies are focused on the education and business sectors.
Aust. J. Basic & Appl. Sci., 6(13): 111-122, 2012
112
The premise of the model is that, in order for the managers, to become a leaders they must first be able to manage the nine areas of SME operations. These nine clusters incorporate two of Sandwith’s five domains such as: the technical and administrative domains.
As managers progress through the Management to Leadership model, they use other competencies, mainly, leadership, creativity, and interpersonal competencies, in order to move from managing the operations to leading the SME’s in Malaysia. Managerial competencies are viewed as a snapshot in time. The literature must be updated periodically, in order to incorporate new roles and trends within the industry (Meyer &Semark, 1996).
Several researchers have identified different managerial problems that affect the development of SMEs. A study by Busch (1989) has identified lack of formal recruitment and hiring procedures, lack of HR development policies (extended benefits) and inability to attract and recruit suitable staff as critical factors related to HR management.
Williamsons (2000) has also acknowledged that, negligence in developing and empowering employees, lack of experienced employees in the market, lack of low cost training facilities, and inaccessible/unavailability of training facilities as important managerial factors. Yosuf and Aspinwal (2000) have studied the problems of SMEs, and found that lack of managerial skills, training, general education, and practical experience have greater impact on performance than any other factors.
Research Questions:
1. How organizational design makes the managers to work effectively? 2. How managerial background affects the managers to lead the organizations? 3. What are the necessary HRM developments to be carried out for enhancing the efficiency of
managerial leaders and augment the growth of organizations? 4. What kind of managerial leadership is required, to increase the managerial competencies in
organizations? 5. How the competitive strategy as a managerial factor, affects the SMEs performance in Malaysia? 6. How personal factors can influence the managerial competencies in organizations?
Objectives: The main objectives of this study are: 1. To examine the influence of organization design in benefiting the managerial competencies in the
SMEs of Malaysia. 2. To examine the managerial background in influencing the growth and development of the SMEs in
Malaysia. 3. To evaluate the impact of HRM development factor in increasing the managerial competencies in the
SMEs of Malaysia. 4. To investigate the influence of managerial leadership in generating the managerial competencies in the
SMEs of Malaysia. 5. To evaluate the management strategies as a factor that increases the managerial competencies and
augment the growth of SMEs in Malaysia. 6. To investigate the role of the personal factors in influencing the growth and development of the SMEs
in Malaysia.
Limitation Of The Study: This paper will be conducted only within the jurisdiction of people having knowledge on the economic,
environmental as well as the present condition of the SME’s. Furthermore; it will focus on the kind of strategies that the Managers need posses, for the sustaining in the competitive and globalized market. Therefore, at the end of the research, results will be generated from a questionnaire survey, which will be distributed to the top-level management of the SME’s in Malaysia on a convenience sampling technique.
These results will only be applicable to Malaysia and not for use in another country, as it may not serve their purpose, due to differences in mode of operations in the SME sectors and several other differential factors. Researchers will be using the empirical model to conduct the research, whereas, the previous researches were conducted through the DEA and OLS models.
Research Method: Research Design:
Research design consists of research methodology, methods, as well as data collection and analysis techniques, depending on the aims and objectives of the research. It gives a detailed plan of the study and will be used to guide and focus the research (Collis and Hussey, 2003).Research designs are concerned with turning the research question into a testing project. The best design depends on ones research questions. Every design has its positive and negative sides.
Howevqualitative study usingup statisticdefinitely kof quantitaequipmentthe results
A reseanalyzed acompetencfeatures. Inchosen the
Resea
After hypothesis
HypotH1: T
SMEs of MHypotH1: T
the SMEs oHypotH1: T
SMEs of MHypotH1: Th
SMEs of MHypotH1: T
SMEs of MHypotH1: Th
of Malaysi
Resea
Sourc (Lee T
ver, there are research and
g quantitative cal models toknow what theative research s (Miles, and can support te
earch philosopand used. The mcies in Malaysn addition, the quantitative re
rch Hypothesianalyzing the
s or not? This isthesis 1:
There is a posiMalaysia. thesis 2: here is a positof Malaysia. thesis 3:
There is a posiMalaysia. thesis 4: here is a positi
Malaysia. thesis 5:
There is a posiMalaysia. thesis 6: here is a positiia.
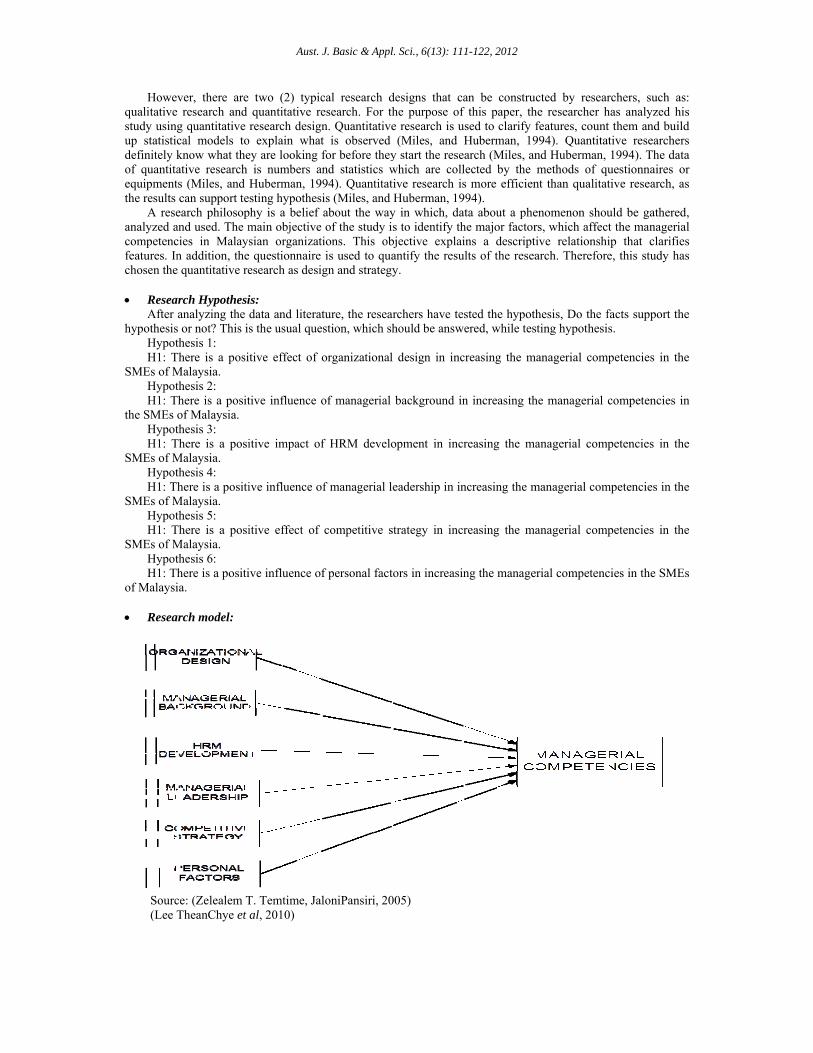
rch model:
ce: (Zelealem TTheanChye et
Aust.
two (2) typicquantitative reresearch desig
o explain whatey are looking
is numbers aHuberman, 19sting hypothes
phy is a belief main objectivesian organizat questionnaireesearch as desi
is: data and literas the usual que
tive effect of
tive influence
itive impact o
ive influence o
itive effect of
ive influence o
T. Temtime, Jaal, 2010)
J. Basic & Appl
cal research desearch. For th
gn. Quantitativet is observed for before they
and statistics w994). Quantitatsis (Miles, and about the way
e of the study itions. This ob is used to quaign and strategy
ature, the reseaestion, which sh
organizational
of managerial
f HRM develo
of managerial l
competitive s
f personal fact
aloniPansiri, 20
l. Sci., 6(13): 11
designs that cahe purpose of e research is u(Miles, and
y start the resewhich are colltive research isHuberman, 19
y in which, das to identify th
bjective explaiantify the resuy.
archers have tehould be answ
l design in inc
background in
opment in incr
eadership in in
strategy in incr
tors in increasin
005)
1-122, 2012
an be construf this paper, thused to clarify fHuberman, 19arch (Miles, anlected by the s more efficien994). ata about a phehe major factorins a descript
ults of the resea
sted the hypothered, while tes
creasing the m
n increasing th
reasing the ma
ncreasing the m
reasing the ma
ng the manage
cted by researhe researcher hfeatures, count994). Quantitand Huberman, methods of q
nt than qualitat
enomenon shours, which affecive relationsharch. Therefor
hesis, Do the fsting hypothesi
managerial com
he managerial
anagerial com
managerial com
anagerial com
erial competenc
rchers, such ahas analyzed ht them and buiative researche
1994). The daquestionnaires tive research,
uld be gatherect the manageriip that clarifie, this study h
facts support this.
mpetencies in th
competencies
mpetencies in th
mpetencies in th
mpetencies in th
cies in the SME
as: his ild ers ata or as
ed, ial ies has
he
he
in
he
he
he
Es
Aust. J. Basic & Appl. Sci., 6(13): 111-122, 2012
114
Type of Research: This paper can be classified based on purpose (basic research or applied research) or by method (deductive
research or inductive research). This is a descriptive research, as it profiles, defines, segments, estimates, predicts and examines associative relationship (Du, 2006). Research methodology is an approach to the entire process of the research study (Collis and Hussey, 2003). Quantitative research is a process of disproving the null hypothesis. Such a study tries to prove that, there will be no difference in response between the experimental and control groups.
Empirical research is appropriate, when proof is obtained and sought that certain variables affect other variables in some way. Evidence gathered through experiments or empirical studies, is today considered to be the most powerful support, for a given hypothesis. A research strategy contains objectives, which are derived from the research questions. Furthermore, it specifies the sources from which the data collection is intended and considers the constraints that will be faced.
There are several research strategies available, such as surveys, case studies, experiments or grounded theory (Saunders, et al., 2003). The data for this paper will be analysed using a questionnaire survey and the research design will be quantitative.
Research Questionnaire:
This method consists in preparing a questionnaire related to the field of enquiry and providing space for the
answers to be filled by the respondents, which is mailed to the respondents, with a request for quick response, within the specified time.
The questionnaire is the only media of communication between the investigator and the respondents, and as such the questionnaire should be meticulously designed or drafted, so that all the relevant and essential information for the enquiry may be collected without any difficulty, ambiguity and vagueness.
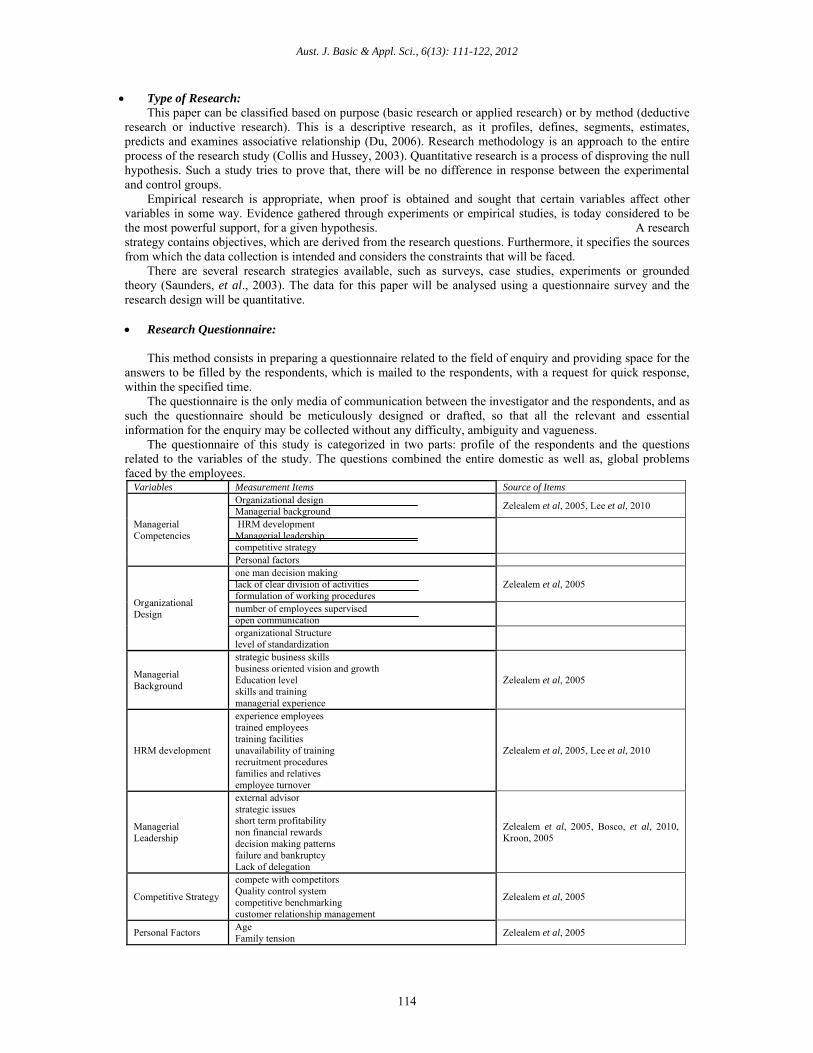
The questionnaire of this study is categorized in two parts: profile of the respondents and the questions related to the variables of the study. The questions combined the entire domestic as well as, global problems faced by the employees.
Variables Measurement Items Source of Items
Managerial Competencies
Organizational design Managerial background
Zelealem et al, 2005, Lee et al, 2010
HRM development Managerial leadership competitive strategy
Personal factors
Organizational Design
one man decision making lack of clear division of activities formulation of working procedures
Zelealem et al, 2005
number of employees supervised open communication
organizational Structure level of standardization
Managerial Background
strategic business skills business oriented vision and growth Education level skills and training managerial experience
Zelealem et al, 2005
HRM development
experience employees trained employees training facilities unavailability of training recruitment procedures families and relatives employee turnover
Zelealem et al, 2005, Lee et al, 2010
Managerial Leadership
external advisor strategic issues short term profitability non financial rewards decision making patterns failure and bankruptcy Lack of delegation
Zelealem et al, 2005, Bosco, et al, 2010, Kroon, 2005
Competitive Strategy
compete with competitors Quality control system competitive benchmarking customer relationship management
Zelealem et al, 2005
Personal Factors Age Family tension
Zelealem et al, 2005
Aust. J. Basic & Appl. Sci., 6(13): 111-122, 2012
115
Respondents were required to answer questions by using a five-point scale from 1 (Strongly disagree) to 5 (Strongly agree). The perceptions of respondents were measured without the use of any financial figures. These questions were developed based on the literature review (Ahmed P. K., Lim K. K., and Zairi M., 1999).
All the questions have been tested with a pilot study and therefore, face validity has been achieved. In addition, this study has also found a high degree of construct validity among all the variables under survey.
As such, the attributes and scales are deemed fit, to be included in the current study. Statistical analyses were conducted using Statistical Package for Social Science (SPSS) software. Parametric statistical tests such as, linear regression and multiple regression analyses were used to analyze the data. Also descriptive statistics of the respondents were obtained from this software.
RESULTS AND DISCUSSION
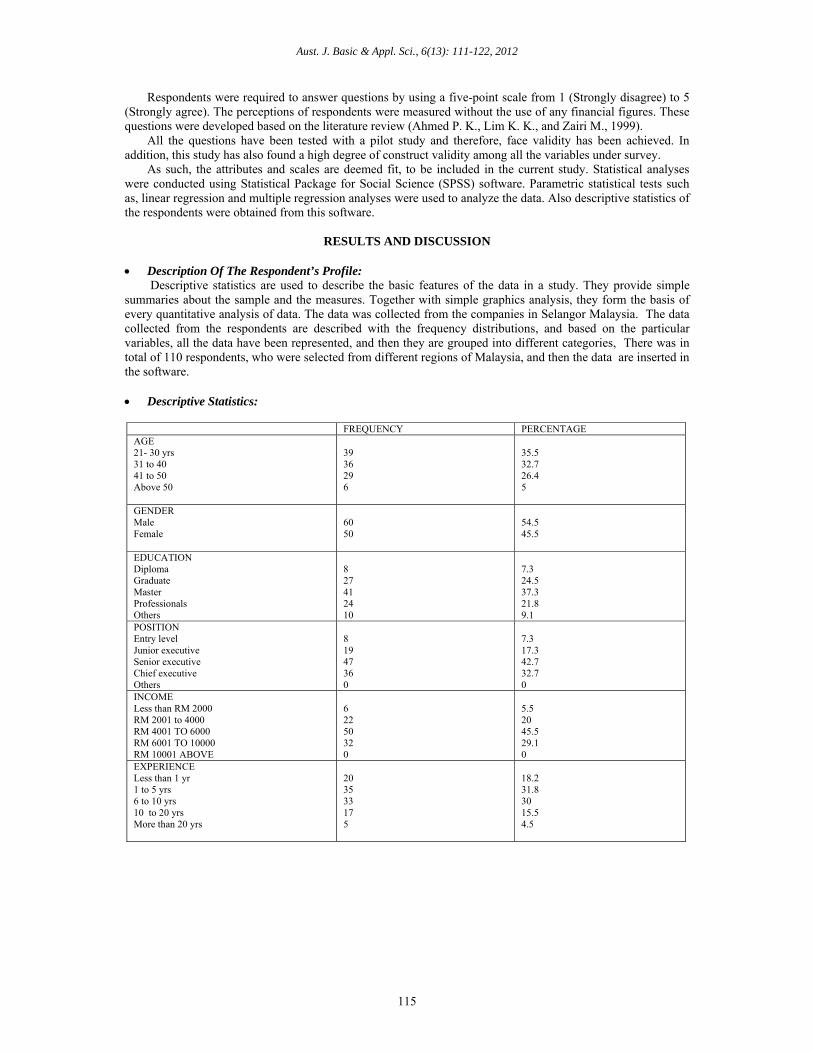
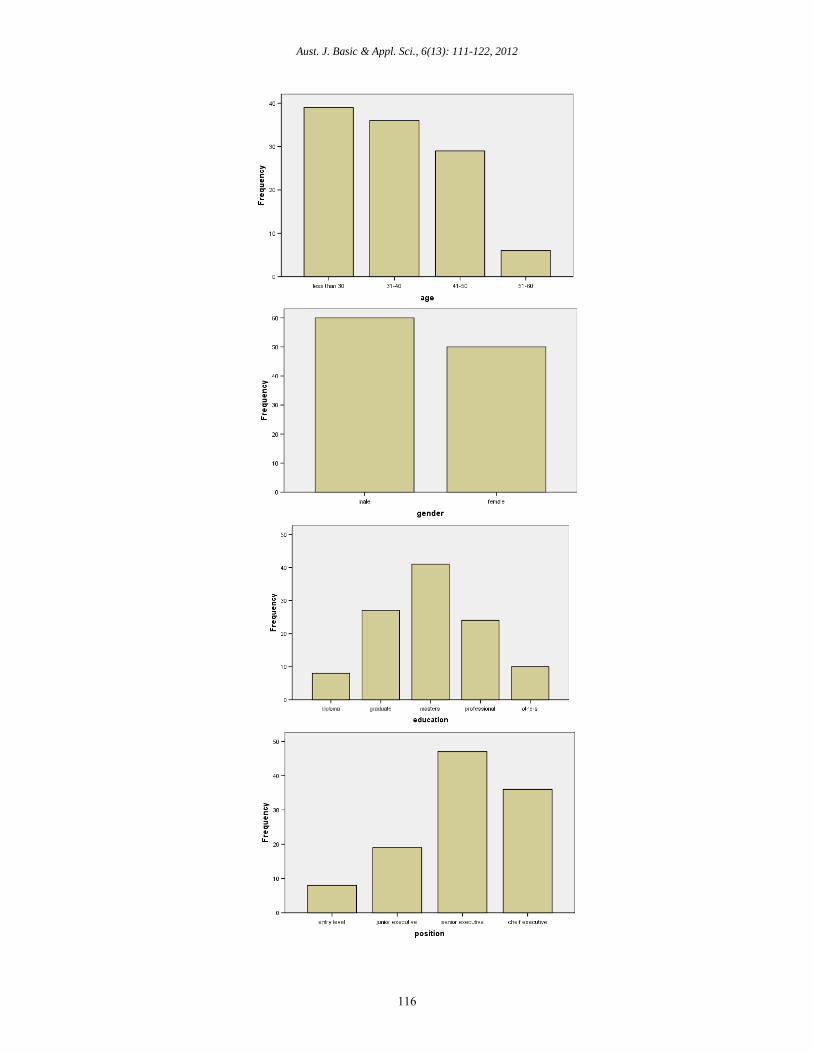
Description Of The Respondent’s Profile:
Descriptive statistics are used to describe the basic features of the data in a study. They provide simple summaries about the sample and the measures. Together with simple graphics analysis, they form the basis of every quantitative analysis of data. The data was collected from the companies in Selangor Malaysia. The data collected from the respondents are described with the frequency distributions, and based on the particular variables, all the data have been represented, and then they are grouped into different categories, There was in total of 110 respondents, who were selected from different regions of Malaysia, and then the data are inserted in the software.
Descriptive Statistics:
FREQUENCY PERCENTAGE AGE 21- 30 yrs 31 to 40 41 to 50 Above 50
39 36 29 6
35.5 32.7 26.4 5
GENDER Male Female
60 50
54.5 45.5
EDUCATION Diploma Graduate Master Professionals Others
8 27 41 24 10
7.3 24.5 37.3 21.8 9.1
POSITION Entry level Junior executive Senior executive Chief executive Others
8 19 47 36 0
7.3 17.3 42.7 32.7 0
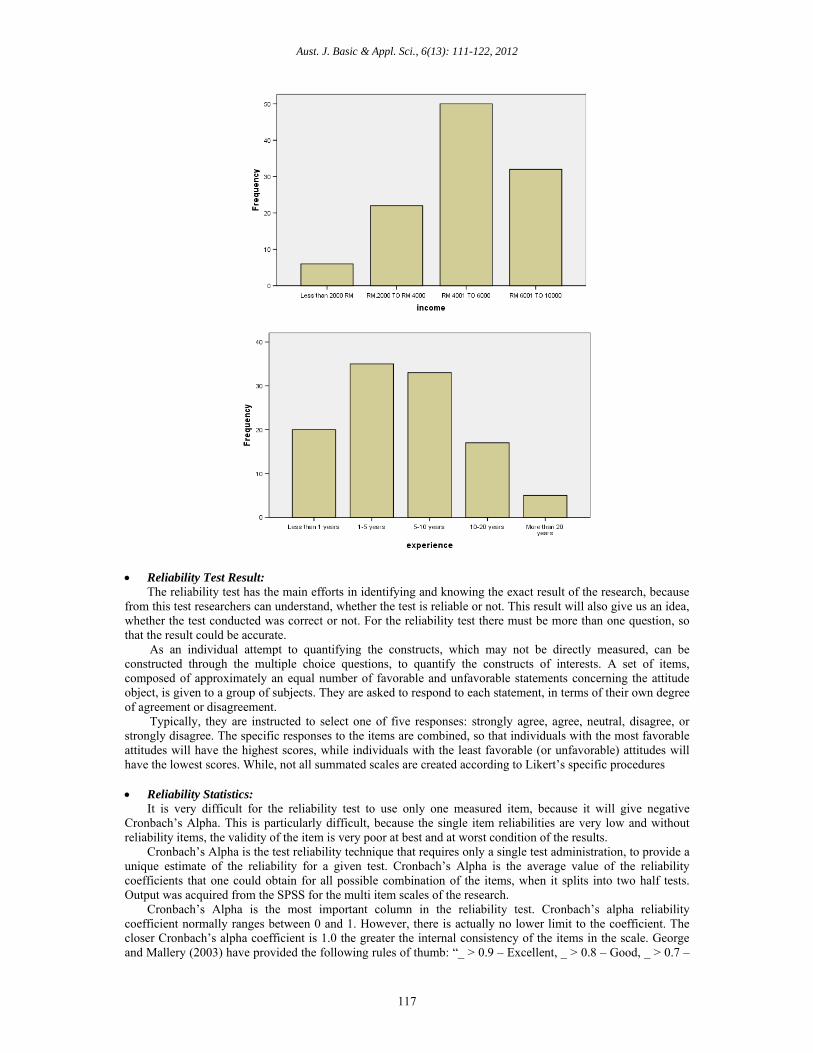
INCOME Less than RM 2000 RM 2001 to 4000 RM 4001 TO 6000 RM 6001 TO 10000 RM 10001 ABOVE
6 22 50 32 0
5.5 20 45.5 29.1 0
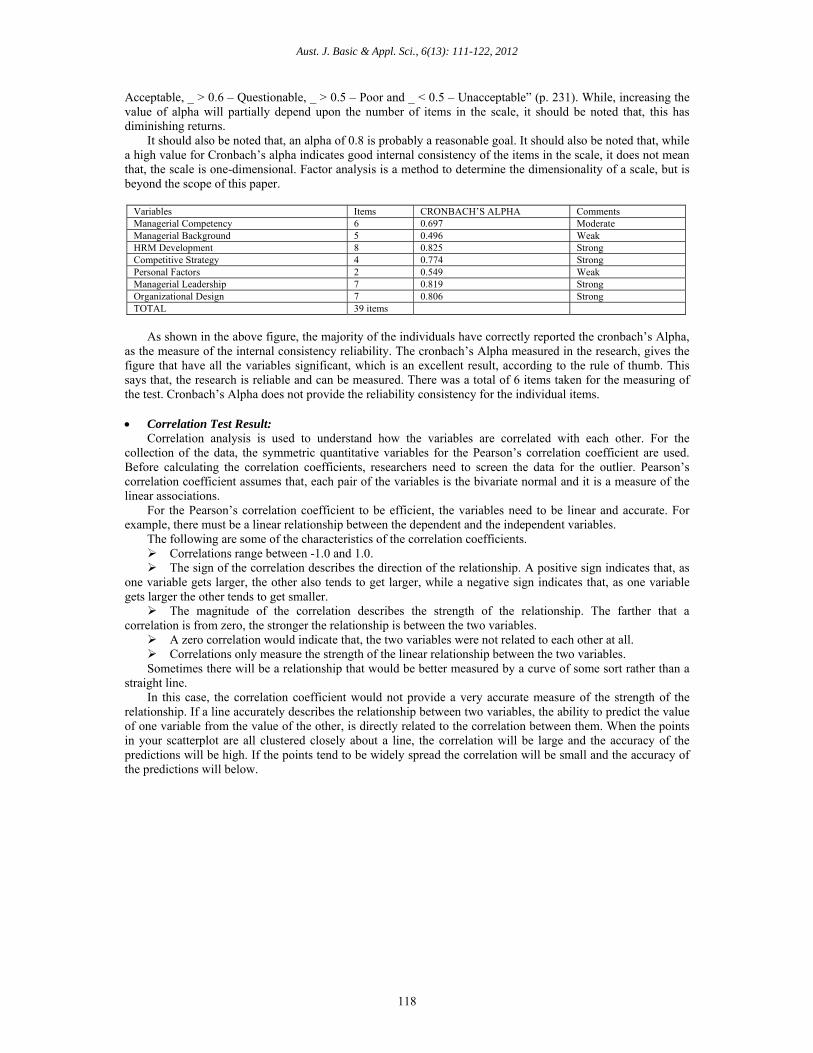
EXPERIENCE Less than 1 yr 1 to 5 yrs 6 to 10 yrs 10 to 20 yrs More than 20 yrs
20 35 33 17 5
18.2 31.8 30 15.5 4.5
Aust. J. Basic & Appl. Sci., 6(13): 111-122, 2012
116
Aust. J. Basic & Appl. Sci., 6(13): 111-122, 2012
117
Reliability Test Result: The reliability test has the main efforts in identifying and knowing the exact result of the research, because from this test researchers can understand, whether the test is reliable or not. This result will also give us an idea, whether the test conducted was correct or not. For the reliability test there must be more than one question, so that the result could be accurate. As an individual attempt to quantifying the constructs, which may not be directly measured, can be constructed through the multiple choice questions, to quantify the constructs of interests. A set of items, composed of approximately an equal number of favorable and unfavorable statements concerning the attitude object, is given to a group of subjects. They are asked to respond to each statement, in terms of their own degree of agreement or disagreement. Typically, they are instructed to select one of five responses: strongly agree, agree, neutral, disagree, or strongly disagree. The specific responses to the items are combined, so that individuals with the most favorable attitudes will have the highest scores, while individuals with the least favorable (or unfavorable) attitudes will have the lowest scores. While, not all summated scales are created according to Likert’s specific procedures Reliability Statistics: It is very difficult for the reliability test to use only one measured item, because it will give negative Cronbach’s Alpha. This is particularly difficult, because the single item reliabilities are very low and without reliability items, the validity of the item is very poor at best and at worst condition of the results.
Cronbach’s Alpha is the test reliability technique that requires only a single test administration, to provide a unique estimate of the reliability for a given test. Cronbach’s Alpha is the average value of the reliability coefficients that one could obtain for all possible combination of the items, when it splits into two half tests. Output was acquired from the SPSS for the multi item scales of the research.
Cronbach’s Alpha is the most important column in the reliability test. Cronbach’s alpha reliability coefficient normally ranges between 0 and 1. However, there is actually no lower limit to the coefficient. The closer Cronbach’s alpha coefficient is 1.0 the greater the internal consistency of the items in the scale. George and Mallery (2003) have provided the following rules of thumb: “_ > 0.9 – Excellent, _ > 0.8 – Good, _ > 0.7 –
Aust. J. Basic & Appl. Sci., 6(13): 111-122, 2012
118
Acceptable, _ > 0.6 – Questionable, _ > 0.5 – Poor and _ < 0.5 – Unacceptable” (p. 231). While, increasing the value of alpha will partially depend upon the number of items in the scale, it should be noted that, this has diminishing returns.
It should also be noted that, an alpha of 0.8 is probably a reasonable goal. It should also be noted that, while a high value for Cronbach’s alpha indicates good internal consistency of the items in the scale, it does not mean that, the scale is one-dimensional. Factor analysis is a method to determine the dimensionality of a scale, but is beyond the scope of this paper.
Variables Items CRONBACH’S ALPHA Comments Managerial Competency 6 0.697 Moderate Managerial Background 5 0.496 Weak HRM Development 8 0.825 Strong Competitive Strategy 4 0.774 Strong Personal Factors 2 0.549 Weak Managerial Leadership 7 0.819 Strong Organizational Design 7 0.806 Strong TOTAL 39 items
As shown in the above figure, the majority of the individuals have correctly reported the cronbach’s Alpha,
as the measure of the internal consistency reliability. The cronbach’s Alpha measured in the research, gives the figure that have all the variables significant, which is an excellent result, according to the rule of thumb. This says that, the research is reliable and can be measured. There was a total of 6 items taken for the measuring of the test. Cronbach’s Alpha does not provide the reliability consistency for the individual items.
Correlation Test Result:
Correlation analysis is used to understand how the variables are correlated with each other. For the collection of the data, the symmetric quantitative variables for the Pearson’s correlation coefficient are used. Before calculating the correlation coefficients, researchers need to screen the data for the outlier. Pearson’s correlation coefficient assumes that, each pair of the variables is the bivariate normal and it is a measure of the linear associations.
For the Pearson’s correlation coefficient to be efficient, the variables need to be linear and accurate. For example, there must be a linear relationship between the dependent and the independent variables.
The following are some of the characteristics of the correlation coefficients. Correlations range between -1.0 and 1.0. The sign of the correlation describes the direction of the relationship. A positive sign indicates that, as
one variable gets larger, the other also tends to get larger, while a negative sign indicates that, as one variable gets larger the other tends to get smaller.
The magnitude of the correlation describes the strength of the relationship. The farther that a correlation is from zero, the stronger the relationship is between the two variables.
A zero correlation would indicate that, the two variables were not related to each other at all. Correlations only measure the strength of the linear relationship between the two variables. Sometimes there will be a relationship that would be better measured by a curve of some sort rather than a
straight line. In this case, the correlation coefficient would not provide a very accurate measure of the strength of the
relationship. If a line accurately describes the relationship between two variables, the ability to predict the value of one variable from the value of the other, is directly related to the correlation between them. When the points in your scatterplot are all clustered closely about a line, the correlation will be large and the accuracy of the predictions will be high. If the points tend to be widely spread the correlation will be small and the accuracy of the predictions will below.
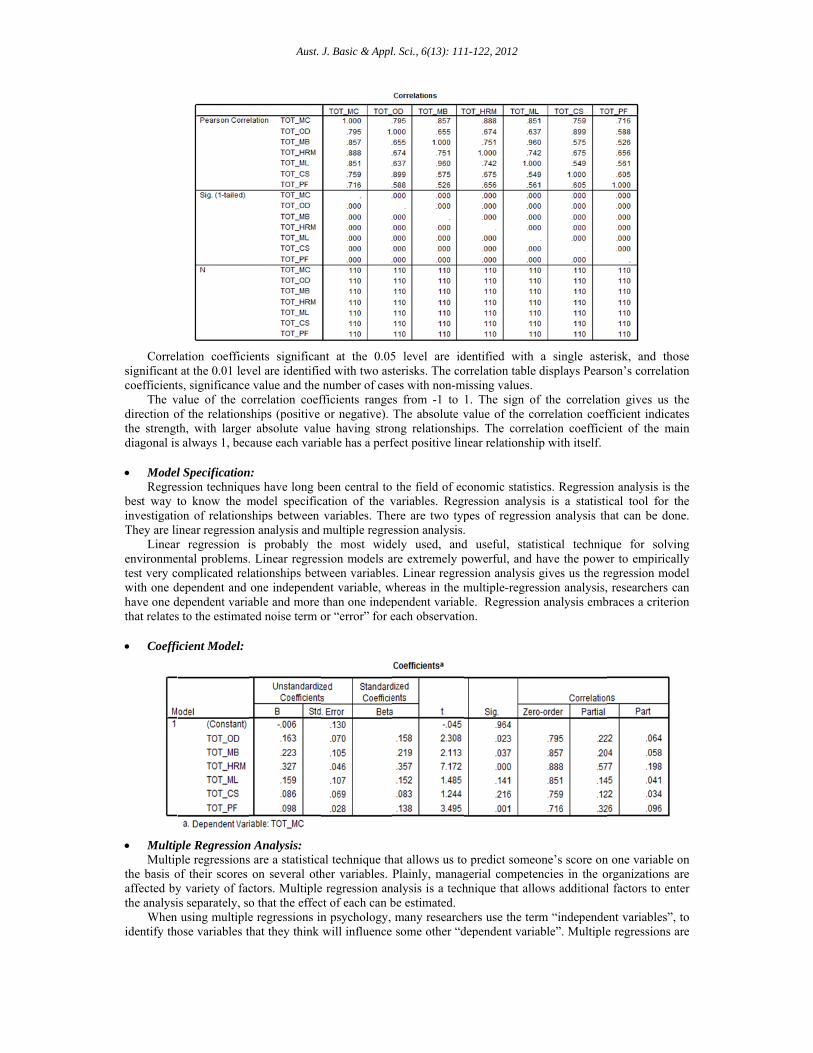
Correlsignificant coefficient
The vdirection othe strengtdiagonal is
Model
Regresbest way tinvestigatioThey are li
Linearenvironmetest very cwith one dhave one dthat relates
Coeffi
MultipMultip
the basis oaffected bythe analysi
When identify tho
lation coefficiat the 0.01 lev
ts, significancevalue of the coof the relationsth, with largers always 1, bec
l Specificationssion techniquto know the mon of relationsinear regressionr regression iental problems.omplicated rel
dependent and dependent varias to the estimat
ficient Model:
ple Regressionple regressionsof their scores y variety of facis separately, sousing multiple
ose variables t
Aust.
ents significanvel are identifiee value and the orrelation coefships (positive r absolute valucause each vari
n: ues have long bmodel specificships between n analysis and is probably th. Linear regreslationships betwone independeable and more ted noise term o
n Analysis: s are a statistica
on several othctors. Multipleo that the effece regressions inhat they think
J. Basic & Appl
nt at the 0.05ed with two astnumber of cas
fficients rangeor negative).
ue having stroable has a perf
been central tocation of the v
variables. Themultiple regrehe most widession models aween variablesent variable, wthan one indepor “error” for e
al technique thher variables. e regression anct of each can bn psychology, will influence
l. Sci., 6(13): 11
5 level are idterisks. The co
ses with non-ms from -1 to The absolute v
ong relationshifect positive lin
the field of ecvariables. Regere are two typession analysis.ely used, and
are extremely ps. Linear regre
whereas in the mpendent variabeach observatio
hat allows us toPlainly, manag
nalysis is a techbe estimated. many researchsome other “d
1-122, 2012
dentified with orrelation table
missing values. 1. The sign ovalue of the coips. The correlnear relationshi
conomic statistression analyspes of regressi. d useful, statipowerful, and ession analysis multiple-regres
ble. Regressionon.
o predict somegerial competehnique that allo
hers use the terdependent varia
a single astee displays Pears f the correlatiorrelation coeflation coefficiip with itself.
tics. Regressiosis is a statistiion analysis th
istical techniqhave the powegives us the r
ssion analysis,n analysis emb
one’s score onencies in the oows additional
rm “independeable”. Multiple
erisk, and thoson’s correlatio
ion gives us thfficient indicatient of the ma
on analysis is thical tool for thhat can be don
que for solviner to empiricalregression mod, researchers cabraces a criterio
n one variable oorganizations al factors to ent
ent variables”, e regressions a
se on
he tes ain
he he ne.
ng lly del an on
on are ter
to are
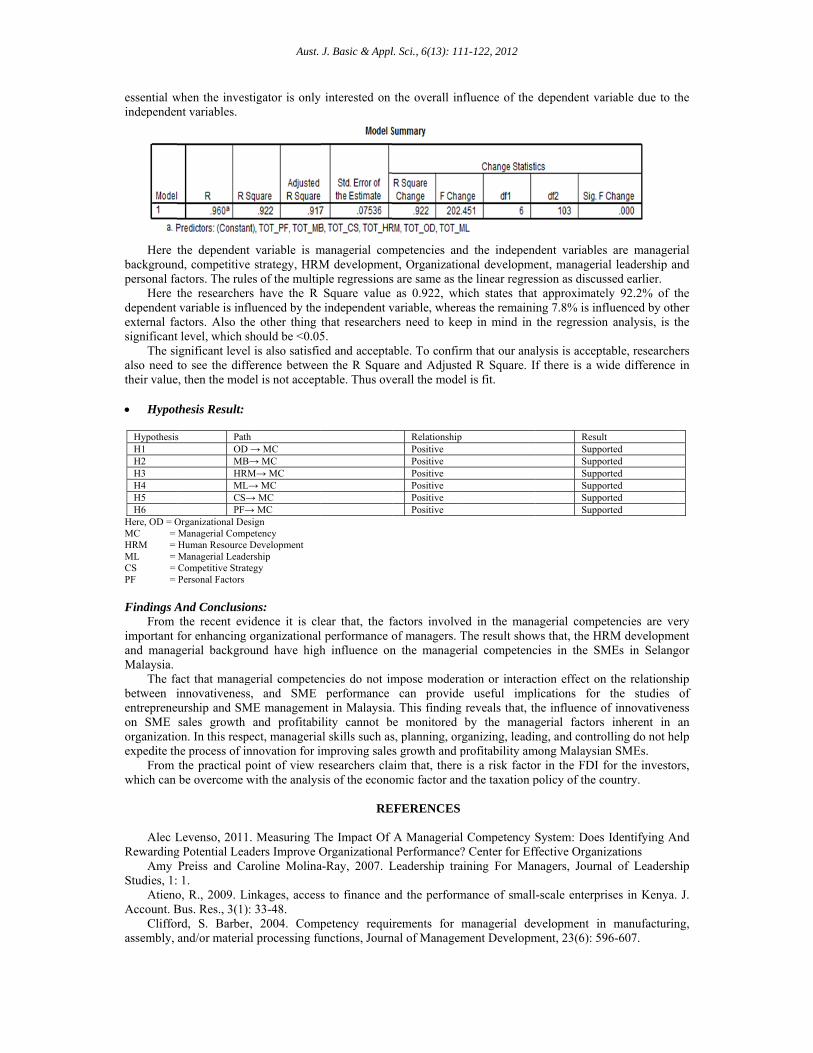
essential windependen
Here tbackgrounpersonal fa
Here tdependent external fasignificant
The sialso need ttheir value
Hypot
HypothesisH1 H2 H3 H4 H5 H6
Here, OD = OMC = HRM = ML = CS = PF =
Findings A
From important fand managMalaysia.
The fabetween ientrepreneuon SME organizatioexpedite th
From which can
Alec L
RewardingAmy
Studies, 1: Atieno
Account. BCliffor
assembly,
when the invesnt variables.
the dependentd, competitiveactors. The rulethe researchervariable is infl
actors. Also thlevel, which s
ignificant levelto see the diff, then the mod
thesis Result:
s PathOD MBHRMML→CS→PF→
Organizational DesManagerial CompHuman Resource Managerial LeadeCompetitive StratePersonal Factors
And Conclusiothe recent evifor enhancing gerial backgro
act that managinnovativenessurship and SMsales growth
on. In this resphe process of inthe practical pbe overcome w
Levenso, 2011g Potential LeaPreiss and Ca1.
o, R., 2009. LiBus. Res., 3(1):rd, S. Barberand/or materia
Aust.
tigator is only
t variable is me strategy, HRMes of the multiprs have the R fluenced by thehe other thing should be <0.05l is also satisfieference betweedel is not accept
h → MC → MC M→ MC → MC → MC → MC sign petency Development
ership egy
ons: idence it is clorganizational
ound have high
gerial competens, and SME
ME managemenand profitabi
ect, manageriannovation for ipoint of view rwith the analys
. Measuring Tders Improve O
aroline Molina
inkages, acces: 33-48. r, 2004. Compal processing fu
J. Basic & Appl
interested on
managerial comM developmenple regressionsSquare value independent vthat researcher5. ed and acceptaen the R Squartable. Thus ove
ear that, the fl performance oh influence on
ncies do not imperformance
nt in Malaysiaility cannot bal skills such asmproving saleresearchers clasis of the econo
RE
The Impact Of Organizationala-Ray, 2007. L
s to finance an
petency requirunctions, Journ
l. Sci., 6(13): 11
the overall inf
mpetencies andnt, Organizatios are same as th
as 0.922, whvariable, wherers need to kee
able. To confirmre and Adjusteerall the model
RelationshipPositive Positive Positive Positive Positive Positive
factors involveof managers. Tn the manager
mpose moderacan provide
. This finding e monitored s, planning, orgs growth and p
aim that, there omic factor and
EFERENCES
A Managerial l Performance?Leadership trai
nd the perform
rements for mnal of Managem
1-122, 2012
fluence of the
d the independonal developmehe linear regreshich states thateas the remainiep in mind in
m that our anaed R Square. Il is fit.
ed in the manaThe result showrial competenc
ation or interace useful impl
reveals that, thby the managganizing, leadinprofitability am
is a risk factod the taxation p
Competency S? Center for Effining For Man
mance of small
managerial dement Developm
dependent var
dent variablesent, manageriassion as discust approximateling 7.8% is inflthe regression
alysis is acceptaf there is a wi
ResultSuppoSuppoSuppoSuppoSuppoSuppo
agerial competws that, the HRcies in the SM
ction effect on lications for he influence ogerial factors ng, and contro
mong Malaysianor in the FDI fpolicy of the co
System: Does ffective Organiznagers, Journa
-scale enterpri
evelopment in ment, 23(6): 59
riable due to th
are manageri
al leadership ansed earlier. ly 92.2% of th
fluenced by othn analysis, is th
able, researcheide difference
rted rted rted rted rted rted
tencies are veRM developmeMEs in Selang
the relationshthe studies f innovativeneinherent in a
lling do not hen SMEs. for the investorountry.
Identifying Anzations
al of Leadersh
ises in Kenya.
manufacturin96-607.
he
ial nd
he her he
ers in
ery ent gor
hip of
ess an
elp
rs,
nd
hip
J.
ng,
Aust. J. Basic & Appl. Sci., 6(13): 111-122, 2012
121
Cochran, Graham, R., 2009. Ohio State University Extension Competency Study: Developing a Competency Model for a 21st Century Extension Organization, Permalink: http://rave.ohiolink.edu/etdc/view?acc_num=osu1243620503
Coetzee, M, (ed), 2007.Practicing, education, training and development in South African organizations. Cape Town: Juta: 1-2
Du, X.K., 2006. Business Research Methods (7th Ed), Beijing: Engineer Manufacturing Publishing. Elliott, D., & D. Smith, 2006. Cultural readjustment after crisis: Regulation and learning from crisis within
the UK soccer industry. Journal of Management Studies, 43(2): 289-317. EF Steyn, 2006. Managerial competencies among first-line news managers in South Africa's mainstream
media: A newsroom management framework http://dspace.nwu.ac.za/handle/10394/7 Ge, W., D. Matsumoto, and J. Zhang, 2010. Do CFOs have styles of their own? An empirical investigation
of the effect of individual CFOs on financial reporting practices.Working paper, University of Washington. Goldsmith, 2004. Nice guys can finish first. Fast Company, 88: 123. Hsieh, C.W. and Mary E. Guy, 2009. “Performance Outcomes: The Relationship between Managing the
„Heart� and Managing Client Satisfaction. Review of Public Personnel Administration., 29: 41-57. Huam Hon Tat, 2010. Are Managerial Competencies a Blessing to the Performance of Innovative SMEs in
Malaysia? Int. Journal of Economics and Management., 4(1): 120-136. http://etd.auburn.edu/etd/bitstream/handle/10415/114/Koenigsfeld_Jason_42.pdf?sequence=1 Jurée Capers, K., 2011. how good is Your Network? The Effect of Network Quality on Organizational
Outcomes, Prepared for the Public Management Research Association Conference ( 2011), Syracuse, NY KinuthiaWamwangi, 2003. Organizational Development as a Framework for Creating Anti-Poverty
Strategies and Action Including Gender Mainstreaming, Municipal Development Partnership, Global Distance Learning Centre, Tanzania
Lawler, III, E.E., & M. McDermott, 2003. Current performance management practices: Examining the varying impacts. World at Work Journal, 12(2): 49-60.
Martin, G. and H. Staines, 1994. Managerial Competences in Small Firms, Journal of Management Development, 13(7): 23-34.
Meier, K.J. and J.O. Laurence � Jr., Toole and Holly T. Goerdel, 2006. “Management Activity and Program Performance: Gender as Management Capital.” Public Administration Review 1(Jan-Feb): 24-36.
Michelle, R. Ennis, 2008. The Role of the Employment and Training Administration, http://www.careeronestop.org/competencymodel/info_documents/OPDRLiteratureRevie w.pdf
Miles, M.B. and A.M. Huberman, 1994. Qualitative data analysis: an expanded sourcebook, Beverly Hills: Sage Publications.
Monk, Richard, 2000. “Why Small Businesses Fail?” CMA Management, 74(6): 12-14. Noe, R.A., 2008. Employee training and development. New York: McGrawHill: 2. Normah MohdAris, 2007. SMEs: Building Blocks for Economic Growth. Paper presented in National
Statistics Conference 4-5 September 2006. Department of Statistics. NSDC. 2007. SME Annual Report 2006, Putrajaya, Malaysia: National SME, Development Council
Malaysia OlawaleOlufunsoFatoki, 2011. Constraints to credit access by new SMEs in South Africa: A supply-side
analysis, African Journal of Business Management., 5(4): 1413-1425. Peterson, R.A., G. Kozmetsky and N.M. Ridgway, 1983. “Perceived Causes of Small Business Failures: A
Research Note”, American Journal of Small Business, 8: 15-19. Raju, R., Kamble, 2011. Managerial Skills for Organizational Performance: An Analytical Study, Indian
streams research journal, l (1): 23-27. Robert, J., Grossman, 2007. New Competencies for HR, Society for Human Resource Management, 52: 6. Roe, R.A., 2002.Competenties – eensleuteltotintegratie in theorie en praktijk van de A&O psychologie.
Gedrag en Organisatie, 15(4): 203-221. Schaper, M. and T. Volery, 2004. Entrepreneurship and Small Business: A Pacific Rim Perspective. John
Wiley, Queensland Schlogl, H., 2004. Small and medium enterprises: Seizing the potential. Organizational for Economic
Cooperation and Development, 243: 46-48. Smallbone, D., 1990. “Success and Failure in New Business Start-ups”, International Small Business
Journal, 8(2): 34-47. SME., 2006., SME Annual Report 2005: Optimizing Strategic Values, Bank Negara Malaysia, Kuala
Lumpur, Malaysia Trochim, W.M.K., 2006. ‘Research Methods Knowledge Base’.Online accessed 29th November, (2010)
Available from URL: http://www.socialresearchmethods.net/kb/scallik.php
Aust. J. Basic & Appl. Sci., 6(13): 111-122, 2012
122
Ulrich, D., W. Brockbank, D. Hohnson, K. Sandholtz, & J. Younger, 2008. HR competencies: mastery at the intersection of people and business. Michigan: Society for Human Resource Management: 1.
Van der Klink, M. & J. Boon, 2002. The investigation of competencies within professional domains.Human resource development international, 5(4): 411-424.
Liu, X., 2009. Is it simply a matter of managerial competence? Interpreting Chinese executives’ perceptions of crisis management, Public Relations Review, 35: 232-239.
Zelealem, T., Temtime and Jaloni Pansiri, 2007. Perceived managerial problems in SMEs: evidence from Botswana, Development And Learning In Organizations, 20(5): 15-17
Zikmund, W.G., 2000. Business Research Methods (6th Ed), Orlando: Harcourt College Publishers.