Modelagem Estatística Aplicada à Genética Quantitativa e ... I Introduction... · Modelagem...
15
Guilherme J. M. Rosa Department of Animal Sciences Department of Biostatistics & Medical Informatics 57a Reunião da RBRAS 5-9 de maio de 2012 - Piracicaba/SP Modelagem Estatística Aplicada à Genética Quantitativa e Genômica
Transcript of Modelagem Estatística Aplicada à Genética Quantitativa e ... I Introduction... · Modelagem...

Guilherme J. M. Rosa Department of Animal Sciences
Department of Biostatistics & Medical Informatics
57a Reunião da RBRAS 5-9 de maio de 2012 - Piracicaba/SP
Modelagem Estatística Aplicada à Genética Quantitativa e Genômica
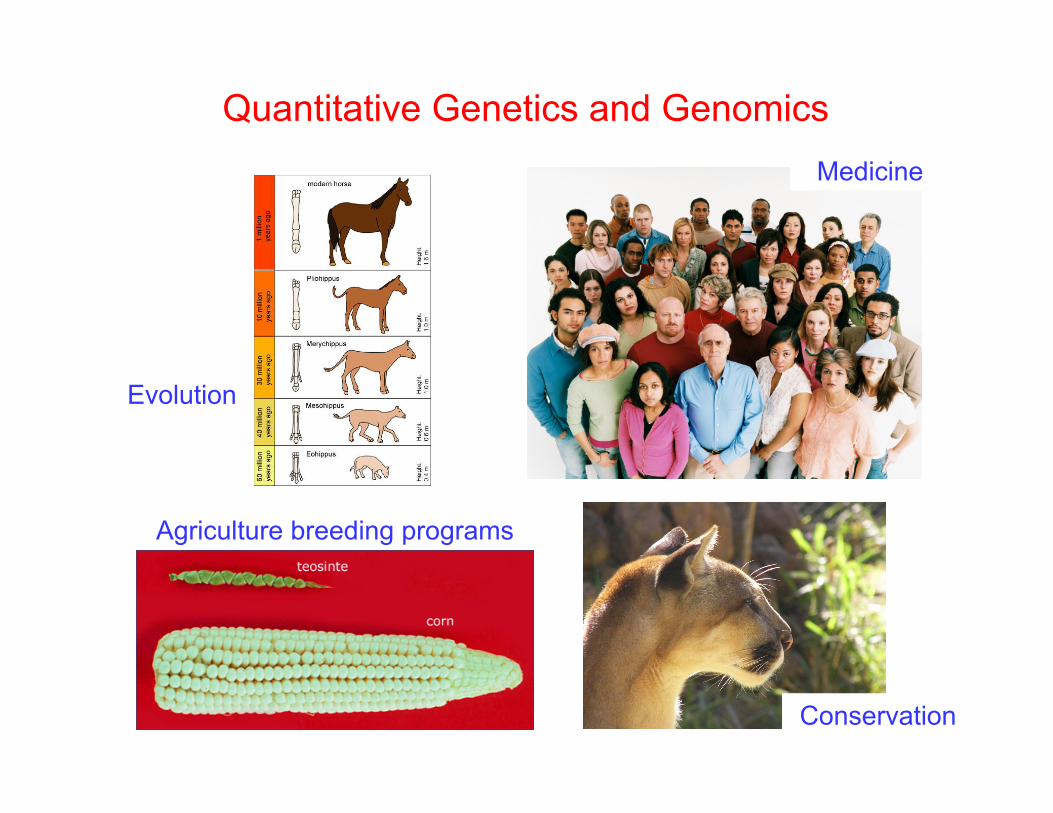
Quantitative Genetics and Genomics
Evolution
Medicine
Conservation
Agriculture breeding programs

Statistics in Genetics and Genomics
• Genomic resources: genome assembling (sequencing errors), alignment algorithms
• Gene expression: microarray analysis, NGS, proteomics
• Genomic variation between populations/species: phylogenetic analysis
• Genetic and genomic variation within populations: mixed models (genetic relationship matrix), molecular marker analysis
• Gene (marker) – phenotype association: QTL analysis, GWAS, prediction of phenotype

Phenotypic Variation

Nature vs. Nurture
Simply-Inherited Traits
Complex traits
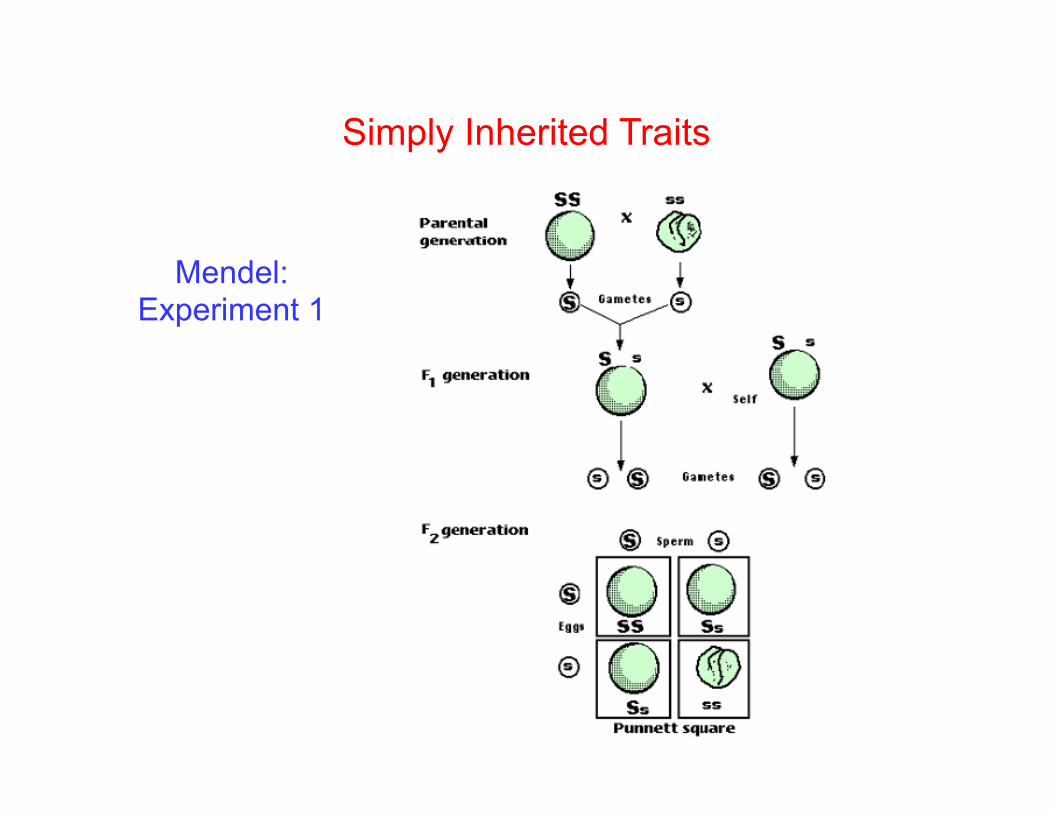
Mendel: Experiment 1
Simply Inherited Traits

A1A2 A1A2
25% A1A1 + 50% A1A2 + 25% A2A2
Genotypes A1A1 A1A2 A2A2
Observed O11 O12 O22
Expected E11 E12 E22
E11 = 0.25 × N E12 = 0.50 × N E22 = 0.25 × N
N = O11 + O12 + O22
2)1k(
k
1i i
2ii2 ~
E)EO(X −
=
χ−
=∑k: # of classes
Testing for Segregation Distortion
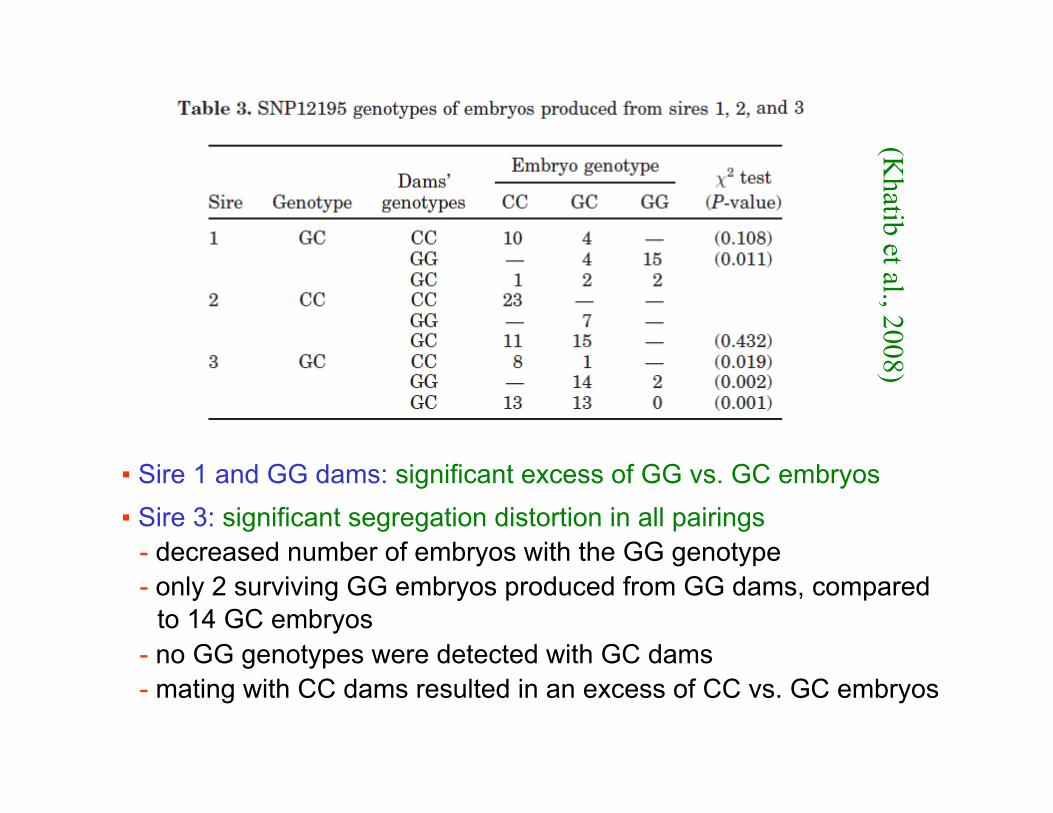
▪ Sire 1 and GG dams: significant excess of GG vs. GC embryos ▪ Sire 3: significant segregation distortion in all pairings - decreased number of embryos with the GG genotype - only 2 surviving GG embryos produced from GG dams, compared
to 14 GC embryos - no GG genotypes were detected with GC dams - mating with CC dams resulted in an excess of CC vs. GC embryos
(Khatib et al., 2008)

Phenotype = Genetics + Environment
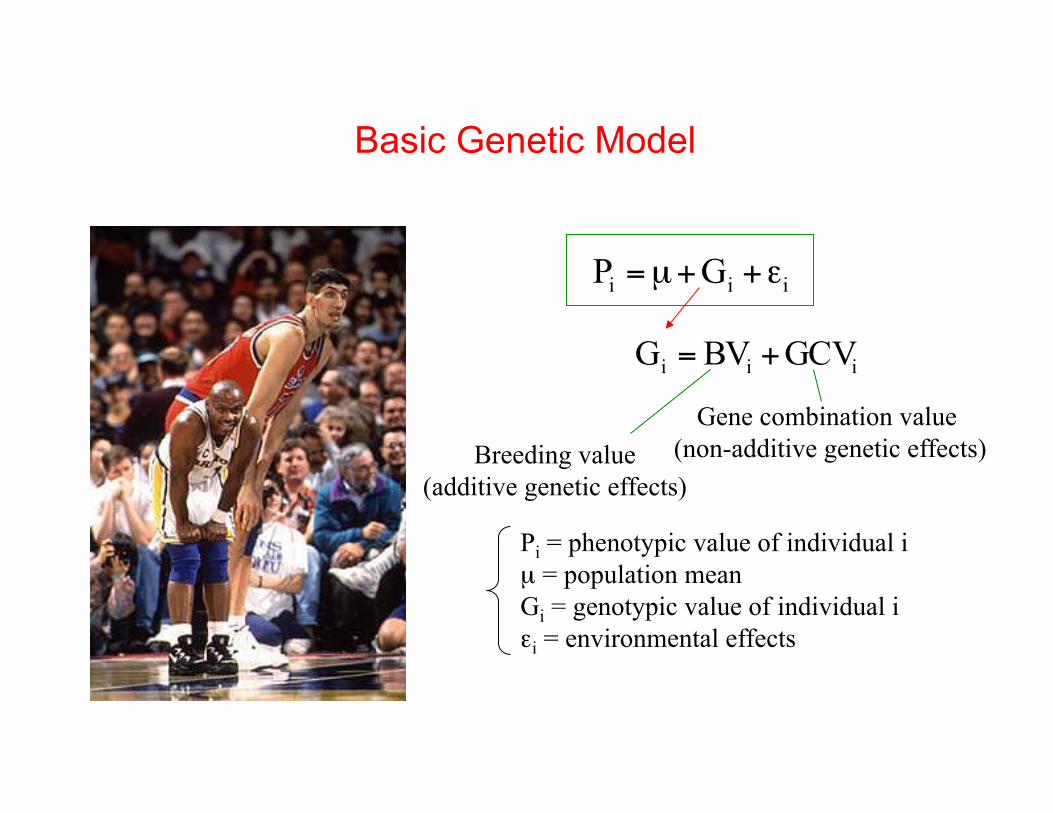
iii GP ε++µ=
Basic Genetic Model
Pi = phenotypic value of individual i µ = population mean Gi = genotypic value of individual i εi = environmental effects
Gene combination value (non-additive genetic effects) Breeding value
(additive genetic effects)
iii GCVBVG +=

Heritability
)(V)GCV(V)BV(V)P(V ε++=→ε+++µ= GCVBVP
ð Heritability, narrow sense (h2): )P(V)BV(Vh2 =
)P(V)GCV(V)BV(VH2 +
=ð Heritability, broad sense (H2):


OUTLINE
Ø DNA Sequence; genomic variation
Ø Phenotypic and genetic variation
Ø Gene expression; transcriptome
Ø Genotype-phenotype association; QTL mapping
• Basic background
• Statistical issues - Dimensionality - n << p - Multiple testing


Illustrative examples using SAS Software
Alternatively
http://www.bioconductor.org/
http://www.r-project.org/