Model for Estimating Methane Production from MSW … - Model for Estimating Methane...to the...
19
Columbia International Publishing American Journal of Bioengineering and Biotechnology (2013) Vo. 1 No. 1 pp. 11-29 doi:10.7726/ajbebt.2013.1002 Research Article ____________________________________________________________________________________________________________ *Corresponding e-mail: [email protected] Politecnico di Torino, Department of Engineering for Environmental, Land and Infrastructures, Italy 11 Model for Estimating Methane Production from MSW Organic Fraction after Reactivation Deborah Panepinto * , Giuseppe Genon, and Andrea Borsarelli Received 9 April 2013; Published online 3 August 2013 © The author(s) 2013. Published with open access at www.uscip.org Abstract The final destination of Municipal Solid Wastes (MSW) is at least partly dependent on utilisation of landfills, with a consequent condition of potential emissions. In these anaerobic bioreactors the biodegradable part of the waste can be converted into biogas, with the simultaneous advantage of waste stabilization and the production of an important energy source. In order to forecast the actual operating performances of these types of anaerobic reactors, it is necessary to evaluate their kinetic aspects, in connection with operating parameters and the quality of the waste that is introduced in the landfill. We studied the strategy of obtaining a rapid reactivation of the organic waste by increasing its water content, and the consequence of this procedure on the rate and quantity of biogas production. To this aim, we utilized two established theoretical predictive models found in the existing literature, and evaluated the modifications required to the structure and parameters of these models to fit experimental data that were obtained in simulation tests, where real samples of waste were subjected to several different reactivation strategies. Keyword: Methane production; Model; MSW organic fraction; Pre-treatment; Reactivation. 1. Introduction The environmental impact caused by the undifferentiated portion of Municipal Solid Waste (MSW) can be substantially mitigated by correct management of the various components. Specifically, the non- combustible fraction deriving from preliminary waste mechanical treatment processes cannot currently be directly introduced into landfills; it must receive an appropriate treatment in order to limit the production of leachate and biogas. Biogas in particular has a double environmental aspect: on the one hand it can be a valid and acceptable source of energy because of its high concentration of methane; on the other hand it can produce significant environmental impact when it is released into the atmosphere, since methane is the second most important greenhouse gas (after carbon dioxide), with a GWP 20 times higher than CO 2 (El-Fadel M. et al., 1997; Valentini A., 1998; Ubbiali C. et al., 2003; Valencia R. et al., 2009). Considering these two counteracting aspects, it is important to determine the potential volume of biogas that can be emitted from various materials after various types of treatments, and critical to this task is the adoption and validation of suitable models (Chang N.B. et al., 1997; Goi D. et al., 2000). In the literature are many examples of predictive models for biogas production from landfills: these models can be usefully adopted for predictive evaluations, but they must be validated in order to assess the productivity and profitability of energy systems that use waste from traditional landfills, in the presence of undifferentiated MSW (Meima J.A. et al., 2008). For different original MSW materials and
-
Upload
truongtuyen -
Category
Documents
-
view
216 -
download
3
Transcript of Model for Estimating Methane Production from MSW … - Model for Estimating Methane...to the...

Columbia International Publishing American Journal of Bioengineering and Biotechnology (2013) Vo. 1 No. 1 pp. 11-29 doi:10.7726/ajbebt.2013.1002
Research Article
____________________________________________________________________________________________________________ *Corresponding e-mail: [email protected] Politecnico di Torino, Department of Engineering for Environmental, Land and Infrastructures, Italy
11
Model for Estimating Methane Production from MSW Organic Fraction after Reactivation
Deborah Panepinto*, Giuseppe Genon, and Andrea Borsarelli
Received 9 April 2013; Published online 3 August 2013 © The author(s) 2013. Published with open access at www.uscip.org
Abstract The final destination of Municipal Solid Wastes (MSW) is at least partly dependent on utilisation of landfills, with a consequent condition of potential emissions. In these anaerobic bioreactors the biodegradable part of the waste can be converted into biogas, with the simultaneous advantage of waste stabilization and the production of an important energy source. In order to forecast the actual operating performances of these types of anaerobic reactors, it is necessary to evaluate their kinetic aspects, in connection with operating parameters and the quality of the waste that is introduced in the landfill. We studied the strategy of obtaining a rapid reactivation of the organic waste by increasing its water content, and the consequence of this procedure on the rate and quantity of biogas production. To this aim, we utilized two established theoretical predictive models found in the existing literature, and evaluated the modifications required to the structure and parameters of these models to fit experimental data that were obtained in simulation tests, where real samples of waste were subjected to several different reactivation strategies. Keyword: Methane production; Model; MSW organic fraction; Pre-treatment; Reactivation.
1. Introduction
The environmental impact caused by the undifferentiated portion of Municipal Solid Waste (MSW) can be substantially mitigated by correct management of the various components. Specifically, the non-combustible fraction deriving from preliminary waste mechanical treatment processes cannot currently be directly introduced into landfills; it must receive an appropriate treatment in order to limit the production of leachate and biogas. Biogas in particular has a double environmental aspect: on the one hand it can be a valid and acceptable source of energy because of its high concentration of methane; on the other hand it can produce significant environmental impact when it is released into the atmosphere, since methane is the second most important greenhouse gas (after carbon dioxide), with a GWP 20 times higher than CO2 (El-Fadel M. et al., 1997; Valentini A., 1998; Ubbiali C. et al., 2003; Valencia R. et al., 2009). Considering these two counteracting aspects, it is important to determine the potential volume of biogas that can be emitted from various materials after various types of treatments, and critical to this task is the adoption and validation of suitable models (Chang N.B. et al., 1997; Goi D. et al., 2000). In the literature are many examples of predictive models for biogas production from landfills: these models can be usefully adopted for predictive evaluations, but they must be validated in order to assess the productivity and profitability of energy systems that use waste from traditional landfills, in the presence of undifferentiated MSW (Meima J.A. et al., 2008). For different original MSW materials and

Deborah Panepinto, Giuseppe Genon and Andrea Borsarelli / American Journal of Bioengineering and Biotechnology (2013) Vo. 1 No. 1 pp. 11-29
12
different operational strategies in the landfill, it is necessary to assess and verify specific predictive models, depending on what is practicable for each specific case (Arena U. et al., 2003). With this aim, in the present work we evaluated the applicability and defined the required change in structure and parameters of two widely used mathematical models (known as Andreottola & Cossu and USEPA), for application to anaerobic digestion of bio-dried waste derived from a mechanical treatment plant located in Piedmont (Northern Italy). In particular, we applied the algorithms aimed at modeling potential methane production to experimental data derived from laboratory biogas production tests, where real waste samples were used as starting materials for digestion. These analyses were applied to a specific stabilized waste present in a landfill, after its reactivation by injection of water or leachate. This treatment scenario which can be considered as an innovative solution represents a possible application for the current configurations of preliminary treatment, in agreement with current environmental legislation.
2. State of the Art of the Models
2.1 An overview The most popular models used for estimating emissions of biogas from MSW landfills are simple models based on the assumption of first-order biodegradation kinetics; their easy application and capability of fitting the experimental results justify their success. Among them are the well-known models called Andreottola & Cossu (Andreottola and Cossu, 1988) and USEPA (USEPA, 2005), and in the following discussion we will concentrate on them. However, there are a great number of other models, briefly summarized in the following table; for each one of them the fundamental equation is given, and the physical basis and the main advantages and disadvantages are indicated.

Deborah Panepinto, Giuseppe Genon and Andrea Borsarelli / American Journal of Bioengineering and Biotechnology (2013) Vo. 1 No. 1 pp. 11-29
13
Table 1 Summary of existing models Model Equation for methane production calculation Advantages Disadvantages
El-Fadel M., A. Findikakis N. and Leckie J. O. (1996)
The temperature parameter is considered. The model provides space-time distribution of concentration and pressure of the biogas, both in the landfill and considering possible leakage through the roof. It is very useful for evaluating the impact of landfill emissions into the atmosphere. It can be used to design and control systems for the recovery of biogas, and to predict the effects of the location and management of the biogas generation system, including reference to the temperature distribution in the landfill.
Very complex model, as the functional relationships that describe a complex ecosystem of the landfill require a large number of parameters, often difficult to establish. These parameters must be known for each cell into which the landfill is divided.
Lay J.J., Li Y.Y. and Noike T. (1998)
The model introduces a delay (or lag time) in the initial phase of methane production.
It requires determining the modeling parameters through laboratory tests, without sampling, but with a reconstruction of the substrate components; hence deviations from the real case are possible.
Manna L., Zanetti M.C., Genon G. (1999)
The model takes into account parameters such as temperature, depth, and the phenomenon of settling of the landfill; it has been validated on a real case, by comparison with experimental data, and for this reason the estimates can be considered very accurate.
The need to consider the density variation with depth requires the collection of a large amount of experimental data. The final value obtained must be reduced by the portion of gas that is not taken up and is therefore lost to the atmosphere; this phenomenon is not always easy to determine.
Yedla Sudhakar, Jyoti K. Parikh (2002)
CH4
A simple model to apply, as it estimates the methane production only by the amount of waste that is introduced into the landfill, its organic fraction
An instantaneous release of methane in the same time period of the deposition does not consider the initial lag phase. Because the assumptions are all

Deborah Panepinto, Giuseppe Genon and Andrea Borsarelli / American Journal of Bioengineering and Biotechnology (2013) Vo. 1 No. 1 pp. 11-29
14
(total conversion to biogas) and the percentage of methane.. If favorable conditions are considered it is estimated that it is possible not only to recover the methane that would otherwise to be emitted into the atmosphere, but also to produce it in greater quantities.
positive, the methane production is overestimated.
Hashemi Mehrdad, Halil I. Kavak, Theodore T. Tsotsis, Muhammad Sahimi (2002)
The model takes into account the heterogeneity in the distribution of permeability and porosity in the landfill. It can predict the spatial and temporal distribution of gas and pressure in the landfill, and gas flow through the cover and the extraction wells.
In order to be full applied it requires a large volume of input data, and a sophisticated knowledge of the phenomena. It is very complex, and requires many simplifying assumptions to be applied to a simple hypothesis that must then be verified. For example, the effect of oxygen, which is known to be a potent inhibitor of methanogenic processes, has to be accurately quantified, as does the distribution of permeability and porosity.
Meraz Rosa-Laura, Ana-Maria Vidales, Armando Dominguez (2004)
QCH4 = L0
The model considers the fermentation process as irregular in the landfill, as the hydrolyzed substrate is spread in a heterogeneous solid space, with wet and dry areas. (The kinetics of methane production are controlled by the diffusion of the organic substrate through the solid phase of the solid-liquid interface). It poses more realistic assumptions about the conversion and the heterogeneous nature of the waste than most other models.
It is necessary to accurately determine the efficiency of uptake of methane extraction wells. The estimated methane production is considered for a landfill where the elapsed time for complete production is 90 years after the shutdown of the plant, which is an unrealistic hypothesis (the real value is about 30 years).
Biswas J., Chowdhury R., Bhattacharya P.
The model is useful for evaluating the changes in methane production from MSW based on the sludge concentrations (wet materials),
The kinetics are evaluated in a batch reactor with concentration, temperature and mixing as controlled conditions. Its application to a real case

Deborah Panepinto, Giuseppe Genon and Andrea Borsarelli / American Journal of Bioengineering and Biotechnology (2013) Vo. 1 No. 1 pp. 11-29
15
(2006) carbohydrate, protease and fat. is dubious and t requires extensive testing to be implemented. The kinetics of enzymatic reaction can be improved by including larger data sets.
Mor Suman, Khaiwal Ravindra, Alex De Visscher, R.P. Dahiya, A. Chandra (2006)
The parameter ζ considers the possible heterogeneity of the aerobic decomposition in the waste.
Physical and chemical laboratory analysis on samples taken on site are required, so that distortions are possible-. The model can not be applied in Northern Europe, because of the climate. The model assumes that the factor limiting the rate of methane production is the amount of carbon still present in landfills, and methane production is therefore overstated. To obtain a more realistic solution, instead of C0 (initial content) the carbon concentration variable for each year of operation of the landfill should be included.
Spokas M., Bogner J., Chanton J.P., Morcet M., Aran C., Graff C., Moreau-Le Y., Golvan, Hebe I. (2006)
Mass balance:
CH4 generated = CH4 emitted + CH4 oxidized + CH4 recovered (flame) + CH4 migrate + ΔCH4 stored
Methane generated:
As a model for the calculation of the methane generated it is widely validated and applied in case studies in association with a number of input data on the various fractions of the waste. Good agreement between the valuescalculated by the model and measurements in-situ with a flow chamber and the use of tracers.
The reliability of the results grows in direct proportion to the amount of available experimental data. Large discrepancies occur between measured and calculated values if the reference area is less than 1 hectare.

Deborah Panepinto, Giuseppe Genon and Andrea Borsarelli / American Journal of Bioengineering and Biotechnology (2013) Vo. 1 No. 1 pp. 11-29
16
De Gioannis G., Muntoni A., Cappai G.., Milia S. (2008)
The simulation of landfill conditions in a reactor, associated with the first-order degradation kinetics, describes the phenomenology well; hence the model can be widely applied and it is easy to implement.
The model recreates the real conditions in a reactor in a feasible operation, but it usually creates an optimum system, which can provide data overestimation. Methanotrophs bacteria are needed to provide the ideal environment for biodegradation, with respect to temperature, moisture and nutrients.
Berge Nicole D., Debra R. Reinhart, Eyad S. Batarseh (2009)
The model assumes that the most substantial methane production occurs after the installation of the covering cap and the recirculation of leachate. The rate of generation and the efficiency of uptake are therefore higher, compared to reality.
The model is almost identical to the USEPA. The main inaccuracies that may be encountered in applying it are two: -assumption of 100% conversion; -use of a single kinetic constant, without considering more or less biodegradable components.
Sinan Bilgili M., Ahmet Demir, Gamze Varank, Bestamin Ozkaya (2009)
The principal aspect is an experimental test useful for understanding the importance of leachate recirculation. In the reactor, with recirculation, there is an increase in methane production of more than 10% (or, in other words, the waste has reached its maximum before the stabilization). Good correspondence of the first-order kinetics with the experimental data (> 95%).
Potential methane production measured per unit of weight, with laboratory tests on only on the dried organic fraction.

Deborah Panepinto, Giuseppe Genon and Andrea Borsarelli / American Journal of Bioengineering and Biotechnology (2013) Vo. 1 No. 1 pp. 11-29
17
Without entering in other details for the description of the above models, in the following a brief summary of the two most popular (Cossu & Andreottola and USEPA) is introduced, in order to establish the basis for the subsequent development of the calculations concerning the treatment in question. 2.2 Andreottola & Cossu Model Andreottola and Cossu proposed a model for the representation of biogas production by supposing a fluid dynamic consisting of a batch reactor where the input flows are represented by the waste, the meteoric water contribution and eventually the recycled leachate. In this model the biodegradable organic carbon content in the waste is considered the fundamental input parameter, as it is the substrate for microorganisms. The biodegradable organic carbon (solid phase) for each product fraction of the waste is given by the following expression:
ibiib pfCCO )( (1)
where: (COb)i = amount of biodegradable organic carbon contained in the waste in the landfill, with reference to the waste fraction under consideration; Ci = percentage of organic carbon contained in the fraction of dry waste that is fed to the landfill fb = percentage of biodegradation of the total organic C content of the fraction contained in the waste; pi = quantity of the dry component fraction of total waste in the landfill. In addition to the evaluation of the biodegradable organic carbon content (solid phase), the Andreottola & Cossu model takes into account the influence of humidity, density and size on the gasification process. These factors are considered in the kinetic constant fixation for each waste product fraction. The model is based on first-order reaction kinetics, represented by the following relationship:
dtkCOCO
COdi
igie
ig
)()(
)(
(2) where: (COg)i = biodegradable organic carbon of the i-th component of the dry waste fraction conferred to the landfill, gasified at time t; (COe)i = amount of organic carbon effectively bio-gasified, of the i-th dry component at time t = 0; ki = kinetic constant relative to the i-th waste component (y)-1; t = time (y). On the basis of the actual carbon amount that is effectively gasified, it is possible to determine the production of biogas per kg of carbon, assuming, for simplicity, that biogas is exclusively composed of CH4 and CO2. With this assumption, the specific production of biogas can be calculated as 1,868 m3 biogas / kg organic carbon bio-gasified, according to stoichiometric considerations. By considering only these purely mathematical relationships, it is possible to derive an expression for the specific production of biogas, which is denoted as "g," corresponding to expression (3). This integrated expression is widely used in the literature, and it is known as the Andreottola & Cossu model for the prediction of the amount of biogas produced from landfills of undifferentiated MSW.
i
tk
iieiekCOg )(868,1
(3)
2.3 USEPA Model
Like the Andreottola and Cossu model, the USEPA model is also based on the assumption of first-order degradation kinetics.

Deborah Panepinto, Giuseppe Genon and Andrea Borsarelli / American Journal of Bioengineering and Biotechnology (2013) Vo. 1 No. 1 pp. 11-29
18
The expression for the annual production of biogas is: g = k*L0*Rx*e-k(t-x) (4) where: g = annual production of biogas per kg of waste sent to the landfill [m3 biogas/kg waste * y]; L0 = potential of biogas generation per kg of biodegradable waste [m3 biogas/kg waste biodegradable]; Rx = amount of biodegradable waste, from total waste disposed of in the landfill [kg waste biodegradable/kg waste landfilled]; k = constant of methane generation [y-1]; x = year in which the waste has been deposited in the landfill [y]; t = current year [y]. With a different approach from that of the Andreottola and Cossu model, the USEPA model does not consider the individual product fractions, and it assigns a unique value for the kinetic constant, for the total waste to be degraded. It also assumes that all the organic carbon present in the waste is biodegradable. However, in order to have a more representative value for the theoretical maximum production of biogas from waste (L0), it was considered convenient to divide the biodegradable components of municipal waste into two fractions: slowly biodegradable (wood, textile, leather and hides) and quickly biodegradable (organic materials, paper, cardboard and cellulose). The parameter Rx, therefore, represents, for each fraction, its percentage of the total incoming landfill waste.
3. Elaboration and Results
3.1 Pre-treatment plant
For the specific application of this study devoted to waste materials coming from an initial mechanical separation and then subjected to reactivation processes, a plant in the North of Italy, working on a process technology based on biodrying and mechanical separation, was utilized as the origin for the wastes (Ecodeco; Regione Piemonte).
In that plant, Municipal Solid Waste coming from an area of 50.000 inhabitants is processed as follows: the pretreatment process is used to treat unsorted waste to produce RDF. The scrap from that process is pressed to create an organic fraction, which is transported for use in landscaping. The study focused on the potential biogas production from this fraction.
3.2 Input data
Data from specialized literature were used for characterization of the waste, because of the lack of specific data for the specific waste. This simplification is valid, by first approximation, in order to arrive at biogas production diagrams; in fact the aim of this study was to obtain first indications for a mathematic model. As for the quality of the waste and its classification, reference data were obtained from a plant operating in the Trento Province (Ragazzi M. et al., 2004); the data are reported in Table 2, where the differences in comparison with medium literature data are also considered.
Deborah Panepinto, Giuseppe Genon and Andrea Borsarelli / American Journal of Bioengineering and Biotechnology (2013) Vo. 1 No. 1 pp. 11-29
19
Table 2 Waste quality used as a reference
% w/w - unsorted waste – rif. (Ragazzi M. et al.,
2004) – Low season
Range
unsorted waste - classifica-tion related in literature in
2000 and 2004
Organic matter 33% 22% 42% 35%
Paper 36% 10% 36% 32%
Wood 2% 2% 13% 2%
Material 3% 2% 13% 4%
Plastics 17% 9% 24% 16%
Not degradable matter 9% 2% 12% 11%
On the basis of the material characteristics displayed in Table 2, the actual process can be evaluated by using process material balance. Hence it has been possible to arrive at a numerical indication in order to describe the landfill material and the product that was used for the laboratory test. During the pre-treatment process, the unsorted waste was ground, bio–dried, and filtered through a screen, and the metals removed. Theoretical yields for the different waste fractions were used in order to obtain material characteristics, as can be seen from the data listed in Table 3.
Table 3 Material characteristics according to process material balance
[kg/kg
MSWinput] Paper 0,101 Material 0,010 Wood 0,005 Organic matter 0,078 Glass + Metal + Inert 0,055 Plastics 0,066 TOT 0,315
3.3 Input data: experimental biogas production data description Experimental biogas production data have been obtained in laboratory tests, utilized to calibrate biogas production theoretical models. The experimental results are based on laboratory tests where the pre-treated organic fraction was the starting material: with the aim of re-activation, the selected waste was moistened with landscape leachate in various percentages. Fig 1 represents the integral value of methane production during a one-year of test for four different samples. Specifically, 0%, 20%, 40% and 150% of leachate was added to the samples used.

Deborah Panepinto, Giuseppe Genon and Andrea Borsarelli / American Journal of Bioengineering and Biotechnology (2013) Vo. 1 No. 1 pp. 11-29
20
Fig 1. Evaluation of methane production during one-year test for different moisture levels
During laboratory tests, waste material was kept in four bioreactors at a constant temperature of 40°C; the test was also conducted on a leachate sample, and it was observed that no biogas was produced. It is clear from the data reported in Fig. 1 that added moisture exerts a strong influence on methane production, on both its starting point and its maximum. It is also important to consider the influence of the heterogeneity of the original material and its influence on performance; this fact could have some effect on the test results also, particularly because of the small quantity of solid material that was used for the tests. The experimental results could change with a different initial material quality (Brockreis A. et al., 2005; Hettiarachchi H. et al., 2009).
4. Results of Model Simulation
In the development of our work, the original Andreottola & Cossu and USEPA models were tested and in some part modified, with the aim of creating a model able to fit the experimental data. The real scale bioreactor used in this experience for the material coming from separation and re-activation could in fact perform differently in a traditional MSW landfill. In fact, biogas production is normally absent at the moment of landfill disposal, but it can start after moisture injection. In consideration of these influences, some changes were introduced into the models: a moisture parameter was added, with the capability of variation over time, and a lag phase was introduced in order to represent a delayed start of the biological kinetics. The moisture parameter does not take into consideration the initial moisture of the original material, but only the added water. To compensate for this lack, it must be taken into account that normally bio–dried waste has a residual moisture of 10%.
4.1 First simulation – Effect of added moisture on the constant parameters
The first simulation used two constants, C1 and C2, for adaptation of the theoretical model to the experimental results.
4.1.1 Test 1: Andreottola & Cossu model modification
Three hypotheses were considered to obtain a model more suitably fitted to the experimental data. the conversion factor 1,868 was changed to 0,934 m3 CH4/kg Corg, because the experimental data
considered only methane production. A 50% v/v rate of CH4 in biogas can be assumed; the time parameter and reference were changed from year to day;
Deborah Panepinto, Giuseppe Genon and Andrea Borsarelli / American Journal of Bioengineering and Biotechnology (2013) Vo. 1 No. 1 pp. 11-29
21
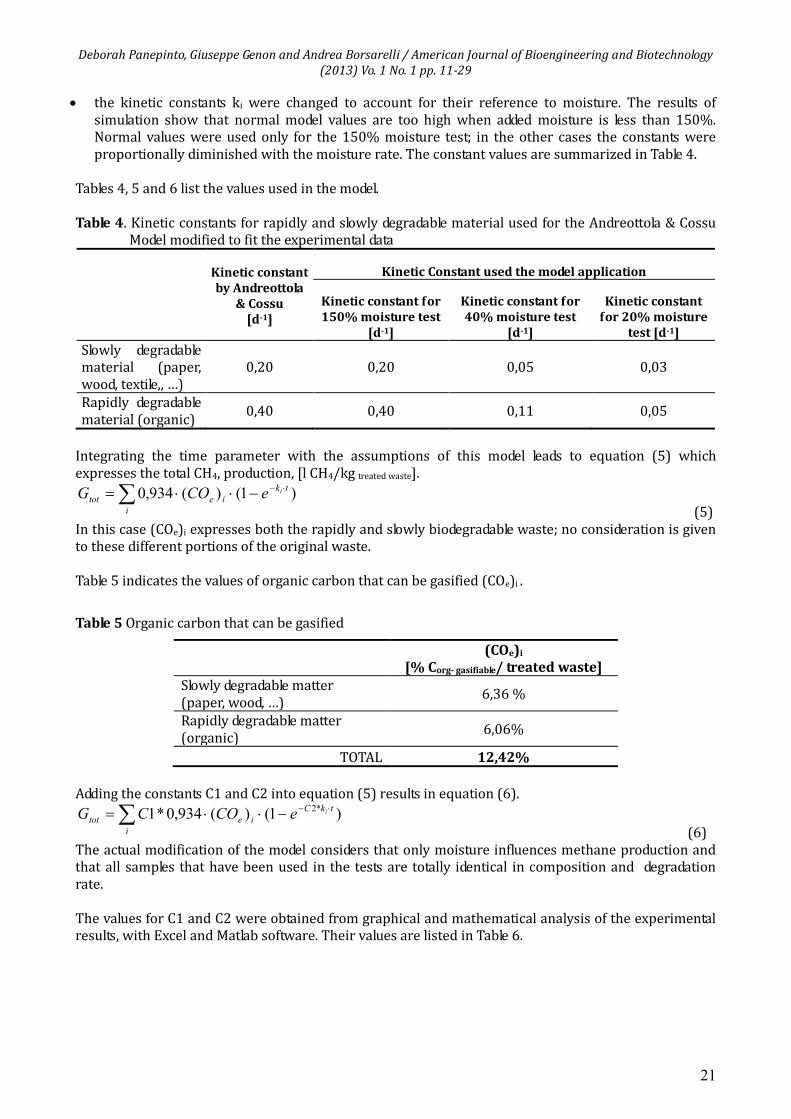
the kinetic constants ki were changed to account for their reference to moisture. The results of simulation show that normal model values are too high when added moisture is less than 150%. Normal values were used only for the 150% moisture test; in the other cases the constants were proportionally diminished with the moisture rate. The constant values are summarized in Table 4.
Tables 4, 5 and 6 list the values used in the model. Table 4. Kinetic constants for rapidly and slowly degradable material used for the Andreottola & Cossu
Model modified to fit the experimental data
Kinetic constant by Andreottola
& Cossu [d-1]
Kinetic Constant used the model application
Kinetic constant for 150% moisture test
[d-1]
Kinetic constant for 40% moisture test
[d-1]
Kinetic constant for 20% moisture
test [d-1]
Slowly degradable material (paper, wood, textile,, …)
0,20 0,20 0,05 0,03
Rapidly degradable material (organic)
0,40 0,40 0,11 0,05
Integrating the time parameter with the assumptions of this model leads to equation (5) which expresses the total CH4, production, [l CH4/kg treated waste].
i
tk
ietotieCOG )1()(934,0
(5) In this case (COe)i expresses both the rapidly and slowly biodegradable waste; no consideration is given to these different portions of the original waste. Table 5 indicates the values of organic carbon that can be gasified (COe)i .
Table 5 Organic carbon that can be gasified
(COe)i
[% Corg- gasifiable/ treated waste] Slowly degradable matter (paper, wood, …)
6,36 %
Rapidly degradable matter (organic)
6,06%
TOTAL 12,42%
Adding the constants C1 and C2 into equation (5) results in equation (6).
i
tkC
ietotieCOCG )1()(934,0*1
*2
(6) The actual modification of the model considers that only moisture influences methane production and that all samples that have been used in the tests are totally identical in composition and degradation rate. The values for C1 and C2 were obtained from graphical and mathematical analysis of the experimental results, with Excel and Matlab software. Their values are listed in Table 6.

Deborah Panepinto, Giuseppe Genon and Andrea Borsarelli / American Journal of Bioengineering and Biotechnology (2013) Vo. 1 No. 1 pp. 11-29
22
Table 6 C1 and C2 constant values
C1 C2 Added moisture 150% 0,60 0,25 Added moisture 40% 0,53 0,07 Added moisture 20% 0,51 0,03
C1 and C2 are dependent on the added moisture according to equations (7) and (8). C1 = 0,8*e[-1/(2+u)] (7) C2 = u/6 (8)
4.1.2 Test 1: USEPA model modification
The USEPA model was also modified in order to adapt it to the experimental data. time was expressed in days; the term x was considered to be 0, meaning that the bioreactor was activated when the landfill was
completed. The L0 parameter was evaluated separately for slowly biodegradable waste and rapidly biodegradable waste.
Table 7 L0*Rx parameter for each waste fraction rate
L0 [N l biogas/kg
RB] [N l biogas/kg SB]
Rx [% kg RB/kg treated
waste] [% kg RB/kg treated
waste]
L0*Rx [N l biogas/kg treated waste]
Rapidly degradable matter (organic)
847 50,2% 425
Slowly degradable matter (paper, wood, textile,, …)
1025 4,5% 46
According to the methane production experimental data, the kinetic constant was defined as 0,4 d-1, for all types of waste. Integrating the time parameter with the above-mentioned assumptions leads to equation (9), which represents the total CH4 production, [l CH4/kg treated waste].
)1(**0
kt
xtot eRLG (9)
where: Gtot= total methane production [l CH4/kg treated waste]; L0*Rx = specific methane production [l CH4/kg treated waste]. The total amount of production is 235,5 l CH4/kg treated waste, and is included in the Table 9 data; a ratio of 50% v/v of methane in biogas is assumed. k = kinetic constant [d-1] t = time [d]. Adding the constants C1 and C2 to equation (9) results in equation (10).
)1(***1 *2
0
ktC
xtot eRLCG (10)
The C1 and C2 values are listed in Table 8; they are dependent on the added moisture according to equations (11) and (12). C1 = 0,15 + 0,15* ln(1 + u) (11) C2 = u/5 (12)

Deborah Panepinto, Giuseppe Genon and Andrea Borsarelli / American Journal of Bioengineering and Biotechnology (2013) Vo. 1 No. 1 pp. 11-29
23
Table 8 C1 and C2 constant values
C1 C2 Added moisture 40% 0,29 0,30 Added moisture 20% 0,20 0,08 Added moisture 150% 0,18 0,04
4.1.3 Test 1: results
In Fig. 2 the results of the theoretical mathematical models obtained after modification are compared with the experimental data.
Fig. 2 Comparison between models and experimental data
4.2 Second simulation: introduction of variable coefficients as a function of re-humidification ratio and
time On the basis of the theoretical curves obtained from Test 1, it is possible to observe some important differences between them and the experimental results, chiefly for low moisture conditions. To improve the capacity to simulate the results, it was decided to introduce a new unique coefficient C1, connected with both the re-humidification ratio and the time. This coefficient was determined by interpolating in time the ratio between the experimental values and the theoretical ones obtained from the first simulation, for both the models.
The following paragraphs discuss the results.
4.2.1 Test 2: Andreottola & Cossu model
In order to perform this second simulation, the expression was modified into the following form (13):
i
tk
ietotieCOCG )1()(934,0*1
(13) This equation differs from the previous in the absence of the C2 parameter and the presence of a time variable parameter C1, with the expression
C1 = a / (b + e-ut) (14) It is possible to determine the three parameters of the previous expression as a function of the re-humidification ratio, by means of the following correlations (15) (16) and (17).
a = 0,8*ln(1 + u) (15) b = √u (16) µ = √u / 20 (17)

Deborah Panepinto, Giuseppe Genon and Andrea Borsarelli / American Journal of Bioengineering and Biotechnology (2013) Vo. 1 No. 1 pp. 11-29
24
The values of the constants a, b and µ are indicated in Table 9.
Table 9 Values of the parameters
a b µ Re-humidification ratio 150 % 0,73 1,22 0,06 Re-humidification ratio 40 % 0,27 0,63 0,03 Re-humidification ratio 20 % 0,15 0,45 0,02
4.2.2 Test 2: USEPA model
In a similar approach, for the second simulation the expression was modified into the form (18)
)1(***1 0
kt
xtot eRLCG (18)
Also in this case a unique time variable parameter C1 must be considered, and the parameter C2 is not present. The expression of the coefficient C1 is
C1 = a / (b + e-µt) (19) The three parameters must be evaluated as a function of the humidity by means of the following expressions
a = (0,15*eu^3) / 45 (20) b = eu^2,7/ 60 (21) µ = u / 10 (22) The values of the parameters are indicated in Table 10.
Table 10 Values of the parameters
a b µ Re-humidification ratio 150 % 0,097 0,33 0,15 Re-humidification ratio 40 % 0,004 0,02 0,04 Re-humidification ratio 20 % 0,003 0,02 0,02
4.2.3 Test 2: General results
In Fig. 3 the curves corresponding to the two models calculated with the previously indicated parameters are reported for the second simulation, in comparison with the experimental values.

Deborah Panepinto, Giuseppe Genon and Andrea Borsarelli / American Journal of Bioengineering and Biotechnology (2013) Vo. 1 No. 1 pp. 11-29
25
Fig 3. Comparison between models and experimental data. Test 2
4.4 Third simulation: introduction of coefficients related to lag time The last interpretation trial was performed on the basis of the observation of the experimental results and the evaluation of the previous interpretation; the objective was to establish whether the experimental results could be described by means of an exponential law, together with consideration of a possible lag effect. In fact in the case of experimental determinations with a re-humidification ratio corresponding to 150%, the exponential calculated curve followed with good approximation the experimental results; on the contrary for the cases of samples where the re-humidification ratios were 20% and 40%, a sufficient overlapping of the calculated and experimental results was observed only after a rather long initial period of low biodegradation activity. The objective of the third simulation was consequently the introduction of a correction factor, to take into account the very clear difference between the theoretical and experimental curves connected with the lag in the activation of degradation processes for the organic samples. We therefore used the hypothesis that up until a lag time T0 the biogas production can be very low, so that it can be considered negligible. In the case of the sample with a re-humidification ratio of 150%, however, this lag time was defined as equal to 0, in order to represent the very fast activation of the degradation processes. To establish an expression for the calculation of the lag time, it was assumed that this parameter was dependent only on the sample re-humidification ratio. Hence the expression T0 = f(u) was used to identify the time lag, by interpolating the values of the time lag individuated from the experimental curves. And, as stated, a further hypothesis was that for re-humidification ratios higher than 70% the start of the biological degradation was immediate. Given these considerations, the expression for the parameter T0 can be determined as
47ln*670 uT (23)
with the values that are indicated in Table 11. Table 11 Values for the lag time
T0 [d] Re-humidification ratio 150 % 0 Re-humidification ratio 40 % 108 Re-humidification ratio 20 % 155

Deborah Panepinto, Giuseppe Genon and Andrea Borsarelli / American Journal of Bioengineering and Biotechnology (2013) Vo. 1 No. 1 pp. 11-29
26
It is important to realize that the expression for T0 was determined by utilizing a limited amount of data. Moreover, as a partial confirmation, it is possible to observe from the analysis of the raw data that, for all the tested situations, biogas production started the moment the samples were subjected to re-humidification, and that low gas production was correlated with low ratios of re-humidification. Consequently, it was decided to disregard the biogas production during the time between 0 and T0. Another factor in this decision was the lack of consistency of the specific characteristics of the waste material used. When using samples from actual MSW, it is very difficult to obtain a consistent composition of the various materials in the waste. Applying these assumptions to both the models, expression (24) was used to determine the parameter C1. a * (1 – e-bt) t > T0 (24) C1(t) = 0 t < T0 4.4.1 Test 3: Andreottola and Cossu model For the third simulation, the expression was modified to:
Σ C1 * 0,934 * (COe)i * (1 – e-k*(t-T0)) t > T0 (25) Gtot(t) = 0 t < T0
The equations for calculating the value of the parameters a and b are:
a = 0,8*ln(1+u(1/2)) (26) b = u0,3
(27) Table 12 Values for the parameters a and b
a b Re-humidification ratio 150 % 0,64 1,13 Re-humidification ratio 40 % 0,39 0,76 Re-humidification ratio 20 % 0,30 0,62
4.4.2 Test 3: USEPA model For the second simulation, the expression was modified to: C1 * L0 *Rx * (1 – e-C2*k(t-T0)) t > T0 (28) Gtot(t) = 0 t < T0
The equations for calculating the value of the parameters a and b are: a =0,15*ln(1,3 + u) + 0,12 (29) b = (u + 0,4)/6,5 (30) For the situations considered, different kinetic parameters were utilized, depending on the re-humidification ratios for the different samples. Specifically, it was assumed that a “k” value of 0.4 d-1 could be conveniently utilized for the condition of 150% re-humidification, but that this value resulted in an overestimation when applied to the ratios 20% and 40%. Hence it was decided to correct the value of the kinetic constant by introducing a parameter, C2, that depends on the re-humidification ratio. That dependence can be written as
%1502
uC
(31) The values of the parameters a, b, and C2 are summarized in Table 13.

Deborah Panepinto, Giuseppe Genon and Andrea Borsarelli / American Journal of Bioengineering and Biotechnology (2013) Vo. 1 No. 1 pp. 11-29
27
Table 13 Values for the parameters a, b and C2
a b C2 Rehumidification ratio 150 % 0,27 0,29 1,00 Rehumidification ratio 40 % 0,20 0,12 0,27 Rehumidification ratio 20 % 0,18 0,09 0,13
4.4.3 Test 3: General results In Fig. 4 the curves corresponding to the two models are reported for the third simulation, for comparison with the experimental results.
Fig 4. Comparison between experimental results and calculation – Third simulation
5. Conclusions For evaluating the conditions of different types of landfills, information in the scientific literature appears to be rather limited, especially concerning the description and modelling of degradation processes in the interior of bioreactors. And studies on the influence of the operating conditions on the most meaningful parameters for the process is even more sparse, particularly for evaluating kinetics and biogas production from original municipal waste. What little information is available concerns stabilized organic fractions. In order to increase the knowledge of these phenomena, this paper proposes the identification of an operative procedure for evaluating the biological phenomena. Further research is clearly needed, considering that the data used for the present evaluations were limited, and that they were only on a laboratory scale. For a useful evaluation of actual results, we recommend utilizing identified theoretical models for an interpretation of experimental results, using in particular three approaches: the modification of existing theoretical models by using constant parameters; the modification of the same models by using parameters dependent on the time; the modification of the models by introducing parameters dependent on the time and also taking an
initial time lag into account . Using models that are able to represent the methane/biogas production from waste introduced in a landfill by means of an exponential equation (based on a first-order kinetic model), we evaluated a

Deborah Panepinto, Giuseppe Genon and Andrea Borsarelli / American Journal of Bioengineering and Biotechnology (2013) Vo. 1 No. 1 pp. 11-29
28
modification in order to explain the experimental results. The calculation yielded positive results, although with varying precision levels. Further experiments and verifications are clearly required. Specifically, the interpretations obtained using two constant values, C1 and C2 only, did not achieve correspondence to the experimental curves, and the differences increased as the re-humidification ratio of the original organic material decreased. In the second elaboration, using a parameter dependent on time, the calculated curves achieved a better correspondence to the experimental ones, chiefly in the case of USEPA model. The introduction of a parameter corresponding to a time lag appeared to achieve the best correspondence of the considered models. This introduction was able to produce a significant correspondence between calculated and experimental curves, for both the models. A physical explanation of this phenomenon is that the initial inactivity of the degradation reactions can be reduced as the quantity of water in the waste increases. The most obvious interpretation of this situation is that hydrolysis facilitates anaerobic degradation processes. The results obtained in this experiment could lead to meaningful improvements in the identification of an accurate model for predicting biogas production from MSW, and in the determination of optimum operating parameters (humidity of the material sent to the landfill) for the utilization of activated bioreactors. The future developments from this initial experimental study and interpretation should be directed to these aims: definition of parameters for input to the bioreactor; tests on homogeneous samples, and if possible on an operating scale; definition of parameters for optimal operations; definition of limiting parameters in different operating ranges; validation of predictive models on a large scale; clearer explanation of the influence of different materials in the interior of the waste, on the kinetic
parameters and on the maximum theoretical production; definition of predictive models, including with kinetic models not of the first order, and the ability to
interpret the exhausting phase in the biogas production.
References Andreottola G., Cossu R., 1988. Modello matematico di produzione del biogas in uno scarico controllato, RS - Rifiuti
solidi, 2(6), 473 - 483; Arena U., Mastellone M.L., Perugini F., 2003. The environmental performance of alternative solid waste
management options: a life cycle assessment study, Chemical Engineering Journal, 96, 207-222; http://dx.doi.org/10.1016/j.cej.2003.08.019 Baratieri M., Ragazzi M., Salvaterra M., 2004. Quantificazione e caratterizzazione merceologica della produzione di
rifiuti urbani indotta dalle presenze turistiche sul territorio: un caso di studio per la Provincia di Trento, RS - Rifiuti solidi, 6, 373 - 378;
Berge N.D., Reinhart D.R., Batarseh E.S., 2009. An assessment of bioreactor landfill costs and benefits, Waste Management, 29, 1558 – 1567;
http://dx.doi.org/10.1016/j.wasman.2008.12.010 PMid:19167875 Biswas J., Chowdhury R., Bhattacharya P., 2006. Kinetic studies of biogas generation using municipal waste as feed
stock, Enzyme and Microbial Technology, 38, 493 – 503; http://dx.doi.org/10.1016/j.enzmictec.2005.07.004 Brockreis B., Steinberg J., 2005. Influence of mechanical-biological waste pre-treatment methods on the gas
formation in landfill. Waste Management, 25, 337-343; http://dx.doi.org/10.1016/j.wasman.2005.02.004 PMid:15869975 Chang Ni-Bin, Chang Ying – His, Chen W.C., 1997. Evaluation of heat an its prediction for refuse-derived fuel – The
science of the Total Environment, 197, 139 - 148;

Deborah Panepinto, Giuseppe Genon and Andrea Borsarelli / American Journal of Bioengineering and Biotechnology (2013) Vo. 1 No. 1 pp. 11-29
29
http://dx.doi.org/10.1016/S0048-9697(97)05425-9 De Gioannis G., Muntoni A., Cappai G., Milia S., 2009. Landfill gas generation after mechanical biological treatment
of municipal solid waste. Estimation for generation rate constants, Waste Management, 29, 1026 – 1034; http://dx.doi.org/10.1016/j.wasman.2008.08.016 PMid:18954969 El-Fadel M., Findikakis A.N., Lechie J.O., 1996. Numerical modeling of generation and transport of gas and heat in
landfills. I: Model formulation, Waste Management and Research, 14, 483-504; El-Fadel M., Findikakis A.N., Lechie J.O., 1997. Environmental impacts of solid waste landfilling, Journal of
Environmental Management, 50, 1 – 25; http://dx.doi.org/10.1006/jema.1995.0131 Goi D., Cirino N., Pivato P., Lizzi G., Dolcetti G., 2000. Conversione del biogas di discarica in energia elettrica: aspetti
previsionali ed economici di un caso in Provincia di Udine , RS – Rifiuti solidi, 14(6), 367 - 371; Hashemi M., Kavate H.I., Tsotsis T.T., Sahimi M., 2002. Computer simulation of gas generation and transport in
landfills. I: quasi-steady-state condition, Chemical Engineering Science, 57, 2475 – 2501; http://dx.doi.org/10.1016/S0009-2509(02)00142-2 Hettiarachchi H., Meegoda J.N., Hettiaratchi J.P.A., 2009. Effects of gas and moisture on modeling of bioreactor
landfill settlement, Waste Management, 29, 1018 – 1025; http://dx.doi.org/10.1016/j.wasman.2008.08.018 PMid:18951007 Lay J.J., Li Y.Y., Noike T., 1998. Dynamics of methanogenic activities in a landfill bioreactor treating the organic
fraction of municipal solid waste, Water Science and Technology, 28, 177 – 184; http://dx.doi.org/10.1016/S0273-1223(98)00479-X Manna L., Zanetti M.C., Genon G., 1999. Modeling biogas production at landfill site, Resources, Conservation and
Recycling, 26, 1-14; http://dx.doi.org/10.1016/S0921-3449(98)00049-4 Meima J.A., Mora Naranjo N., Haarstrick A., 2008. Sensitivity analysis and literature review of parameters
controlling local biodegradation processes in municipal solid waste landfills, Waste Management, 28, 904 – 918;
http://dx.doi.org/10.1016/j.wasman.2007.02.032 PMid:17499984 Meraz R.L., Vidales A.M., Dominiguez A., 2004. A fractal-like kinetics equation to calculate landfill methane
production, Fuel, 83, 73 – 80; http://dx.doi.org/10.1016/S0016-2361(03)00212-6 Mor S., Ravindra K., De Visscher A., Dahiya R.P., Chandra A., 2006. Municipal solid waste characterization and its
assessment for potential methane generation: A case study, Science of Total Environmental, 371, 1 – 10; http://dx.doi.org/10.1016/j.scitotenv.2006.04.014 PMid:16822537 Regione Piemonte, Situazione della gestione dei rifiuti in Piemonte (2008). http://extranet.regione.piemonte.it/ambiente/rifiuti/archicio_doc.htm , last accessed on November 2011; Sinan Bilgili M., Demir A., Varank G., 2009. Evaluation and modeling of biochemical methane potential (BMP) of
landfilled solid waste: A pilot scale study, Bioresource Technology, 100, 4976 – 4980; http://dx.doi.org/10.1016/j.biortech.2009.05.012 PMid:19553105 Sistema Ecodeco®. Available at: <http://www.ecodeco.it>, last accessed on November 2011; Spokas K., Bogner J., Chanton J.P., Morcet M., Aran C., Graff C., Moreau – Le Galvan Y., Hebe J., 2006. Methane mass
balance at three landfill sites: What is the efficiency of capture by gas collection systems?, Waste Management, 26, 516 – 525;
http://dx.doi.org/10.1016/j.wasman.2005.07.021 PMid:16198554 Ubbiali C., Laraia R., Adani F., 2003. Stabilità biologica di rifiuti urbani residui da raccolta differenziata, RS – Rifiuti
solidi, 17, 162 - 166; USEPA, 2005. LandGEM: Landfill Gas Emissions Model (version 3.02), available at: <http://nepis.epa.gov, last
accessed on April 2013; Valencia R., Van der Zon W., Woelders H., Lubberding H.J., Gijzen H.J., 2009. The effect of hydraulic conditions on
waste stabilization in bioreactor landfill simulators, Bioresource Technology, 100, 1754 – 1761; http://dx.doi.org/10.1016/j.biortech.2008.09.055 PMid:19004629 Yedla S., Parich J.K., 2002. Development of a purpose built landfill system for the control of methane emissions
from municipal solid waste, Waste Management, 22, 501 – 506. http://dx.doi.org/10.1016/S0956-053X(02)00007-7


![A conduit dilation model of methane venting from lake ...web.mit.edu/hemond/www/docs/conduit_dilation_model.pdfcontrols ebullition from lake sediments. 2. Model Formulation [5] Methane](https://static.fdocuments.in/doc/165x107/5f7cf4de3b2572106a6ce8e3/a-conduit-dilation-model-of-methane-venting-from-lake-webmiteduhemondwwwdocsconduitdilationmodelpdf.jpg)