Hydrogen production from methane steam reforming over Mg ...

A universal equation to predict methane productionof forage-fed cattle in Australia
E. CharmleyA,G, S. R. O.WilliamsB, P. J. MoateB, R. S. HegartyC, R. M. HerdD, V. H. OddyD,P. Reyenga E, K. M. Staunton E, A. AndersonF and M. C. HannahB
ACSIRO Agriculture, Private Mail Bag PO Aitkenvale, Townsville, Qld 4814, Australia.BDepartment of Economic Development, Jobs, Transport and Resources, 1301 Hazeldean Road, Ellinbank,Vic. 3821, Australia.
CEnvironmental and Rural Sciences, University of New England, Armidale, NSW 2351, Australia.DNSWDepartment of Primary Industries, Beef Industry Centre, University of New England, Armidale, NSW 2351,Australia.
EDepartment of the Environment, GPO Box 787, Canberra City, ACT 2601, Australia.FQueensland Department of Agriculture and Fisheries, Spyglass Beef Research Facility, MS 99,Charters Towers, Qld 4820, Australia.
GCorresponding author. Email: [email protected]
Abstract. Themethods for estimatingmethane emissions fromcattle as used in theAustralian national inventory are basedon older data that have now been superseded by a large amount of more recent data. Recent data suggested that the currentinventory emissions estimates can be improved. To address this issue, a total of 1034 individual animal records of dailymethane production (MP) was used to reassess the relationship between MP and each of dry matter intake (DMI) and grossenergy intake (GEI).Datawere restricted to trials conducted in thepast 10years usingopen-circuit respiration chambers,withcattle fed forage-based diets (forage >70%). Results from diets considered to inhibit methanogenesis were omitted fromthe dataset. Records were obtained from dairy cattle fed temperate forages (220 records), beef cattle fed temperate forages(680 records) and beef cattle fed tropical forages (133 records). Relationships were very similar for all three productioncategories and single relationships for MP on a DMI or GEI basis were proposed for national inventory purposes. Theserelationships wereMP (g/day) = 20.7 (�0.28) ·DMI (kg/day) (R2 = 0.92, P < 0.001) andMP (MJ/day) = 0.063 (�0.008) ·GEI (MJ/day) (R2 = 0.93, P < 0.001). If the revisedMP (g/day) approach is used to calculate Australia’s national inventory,it will reduce estimates of emissions of forage-fed cattle by 24%. Assuming a global warming potential of 25 for methane,this represents a 12.6 Mt CO2-e reduction in calculated annual emissions from Australian cattle.
Additional keywords: beef, dairy, emissions intensity, tropical.
Received 10 July 2015, accepted 6 November 2015, published online 9 December 2015
Introduction
Australia reports its national greenhouse accounts using country-specific Tier 2 methods (Department of the Environment 2014),as recommended by the IPCC (2000). Enteric fermentationby cattle is responsible for ~52% of total agriculturalemissions of greenhouse gases (total was 87.4 million t CO2-ein 2012) and 8.4% of the total national emissions (AustralianGreenhouse Emissions Information System 2014). In theAustralian Inventory of Greenhouse Gases, methane emissionsfrom forage-fed cattle currently rely on twomethods. Themethodfor dairy cattle and temperate beef cattle is based on an equationreported by Blaxter and Clapperton (1965) and subsequentlycorrected by Wilkerson et al. (1995). The method for tropicalbeef cattle is based on an equation originally reported byKuriharaet al. (1999), but subsequently modified by Hunter (2007). Bothmethods rely on an estimation of feed intake. For dairy cattle,
feed intake is based on the equation of Minson and McDonald(1987) corrected for milk production (Standing Committee onAgriculture 1990). For beef cattle, dry matter intake (DMI) isderived from bodyweight (BW) and BW gain (Minson andMcDonald 1987). In the most comprehensive Australian studyof tropical diets, Kennedy and Charmley (2012) concludedthat the Kurihara et al. (1999) method for estimatingmethane emissions from tropical cattle overestimated methaneproduction by ~30%. Consequently, theAustralianDepartment ofEnvironment commissioned a re-analysis of all recent, availableAustralian data collected from open-circuit respiration chambersto determine whether it was appropriate to reconsider the Tier 2methodusedbyAustralia for estimating entericmethane emissionsfrom forage-fed cattle.
In the present study, data were collated with the objective ofderiving a relationship or relationships involving DMI or gross
CSIRO PUBLISHING
Animal Production Sciencehttp://dx.doi.org/10.1071/AN15365
Journal compilation � CSIRO 2015 www.publish.csiro.au/journals/an

energy intake (GEI) for estimating methane production (MP)fromall classesof cattle inAustralia fedorgrazingonawide rangeof diets and diet qualities.
Materials and methods
All experiments that contributed to the dataset were approvedunder the Australian code of practice for the care and use ofanimals for scientific purposes (NHMRC 2004), according to therespective State in which the experiments were conducted.Data for the analysis were primarily sourced from publisheddatasets involving only data collected using open-circuitrespiration chambers from individual cattle that were fed>70% forage in the ration, on diets which were not expectedto reduce methane emissions or yield. Data were sourced fromthe following four sites: Department of Economic Development,Jobs, Transport and Resources Victoria for the dairy data(DAIRY); New South Wales Department of Primary Industriesand the University of New England for the temperate (southern)beef data (S.BEEF); and CSIRO Rockhampton and Townsvillefor the tropical (northern) beef data (N.BEEF; Table 1). Tomaintain intellectual-property rights of contributing sources, thedata provided comprised only sex, liveweight, DMI, MP (g/day,MJ/day), treatment design and an experimental designation,which included some information on diet composition. For
tropical diets, gross energy (GE) concentration of the dietswas also provided. This was necessitated as the mean GEconcentration of tropical diets used by Kennedy and Charmley(2012) was lower than the standard value of 18.4 MJ/kg DMused for temperate forages in the present paper and in currentaccounting methods. For all data, a constant energy value formethane of 55.22 MJ/kg methane (Brouwer 1965) was adopted.There was a total of 1034 observations, including 220 dairyobservations, 680 temperate beef observations and 133 tropicalbeef observations (Table 1). The northern beef data comprised114 observations on Brahman steers at Rockhampton and 19observations on Brahman steers at Townsville.
Description of the feedsThe dairy data were taken from five published experiments usinglactating cows (Grainger et al. 2008, 2010; Moate et al. 2013;Williams et al. 2013; Deighton et al. 2014) and five unpublishedexperiments. The cows were at different stages of lactation andwere fed on a wide variety of diets containing in excess of 70%forage (pasture, pasture hay, pasture silage, or lucerne hay) andbetween 0 and 30%concentrate (barley, triticale, or wheat). Noneof these diets contained any known methane mitigants (Table 2).
The temperate beef data were taken from a project designedto evaluate the phenotypic and genetic variation in methaneproduction, described by Donoghue et al. (2013) and Herdet al. (2014). Growing Angus heifers, bulls and steers were feda commercial lucerne and oaten hay chaff ration at ~1.2 timesmaintenance (Table 2). A small number of observations (15)were also incorporated from two separate studies conducted atthe University of New England with Shorthorn and Angus cattle(J. Velazco, unpubl. data).
The tropical beef data collected on growing Bos indicussteers were previously published by Kennedy and Charmley(2012). In total, 23 diets were evaluated that included thetropical grasses black speargrass (Heteropogon contortus),buffel grass (Cenchrus ciliaris) bisset creeping bluegrass(Bothriochloa insculpta), mitchell grass (mixture of Astreblalappacea, Astrebla elymoides) and rhodes grass (Chlorisgayana). Speargrass, buffel grass and bluegrass were given atcontrasting levels of maturity and speargrass was also fed withor without urea. Grasses were fed alone or in combinationwith the legumes dolichos (Dolichos lablab), burgundy bean,(Macroptilium bracteatum), stylo cv. verano (Stylosantheshamata) and lucerne (Medicago sativa). All diets were fedad libitum as hays and no concentrate feeds were given. Datafor diets containing leucaena, presented in the original paper(Kennedy and Charmley 2012) were excluded becauseleucaena was shown to reduce methane emissions. Data froma further three grasses (mitchell grass hay, rhodes grass hay and
Table 1. Description of the data used in the analysis for dairy (DAIRY),southern beef (S.BEEF) and northern beef (N.BEEF) cattle
Parameter DAIRY S.BEEF N.BEEF
Number of observations 220 680 133Female 220 313 0Entire male 0 323 0Steer 0 39 133
Description of livestockSubspecies Bos taurus Bos taurus Bos indicusHolstein–Friesian 220 0 0Angus 0 675 0Brahman 0 0 133Shorthorn 0 5 0
Bodyweight (kg)Mean 575 365 309Range 458–706 156–640 214–425
Dry matter intake (kg/day)Mean 19.8 5.94 4.90Range 11.8–27.7 3.55–11.6 2.18–8.02
Methane production (g/day)Mean 421 133 94.7Range 237–623 78.9–241 32.2–184
Table 2. Description of the feeds given to dairy (DAIRY), southern beef (S.BEEF) and northern beef (N.BEEF) cattle used in the data analysis
Parameter DAIRY S.BEEF N.BEEF
Forage species Temperate pasture, pasture hay,grass silage, lucerne hay
Lucerne–oaten hay fedas a chaff
Tropical grass hays, tropical legume hays,lucerne hay
Concentrate type Barley, triticale, wheat n.a. n.a.Crude protein (% DM) 15–30 6–14 3–22Gross energy (MJ/kg DM) 18.4 18.4 17.7
B Animal Production Science E. Charmley et al.

a mixed Urochloa, rhodes, buffel pasture) from trials conductedin Townsville were included to expand the dataset (N. W.Tomkins, unpubl. data).
Methane measurementAll measurements were made in open-circuit respirationchambers from which methane concentration was measured.However, the procedures at the four sites differed to somedegree and the methods are summarised below.
Dairy data: Ellinbank, VictoriaThe physical dimensions and major characteristics of the two
open-circuit respiration chambers and emission calculationshave been described previously (Grainger et al. 2007).Operation of the chambers was as described by Williams et al.(2013). Briefly, cows were fed and milked twice a day andmethane measurements were made for 22 h per day on twoconsecutive days. During the two 1 h periods when thedoors were open for milking, it was assumed that the rate ofmethane production was the same as during the hour beforedoor opening. Methane was detected using an infrared sensor(GFx 0–500 mg/kg, Servomex Group, Crowborough, UK).Temperature and humidity were controlled and intake andexhaust air were sequenced to the analyser in a 12-min cycle(4 min outside air, 4 min exhaust air Chamber 1, 4 min exhaustair Chamber 2). Methane measurements taken in the last 2 minof each 4min sampling period were used to determine emissions.The methane concentrations, exhaust air flow rates, relativehumidity, temperature and gas pressure at the inlet and exhaustwere recorded at 10 s intervals. Each chamber was calibratedat the beginning and end of the experiments, with additionalcalibrations between experiment cycles as scheduling permitted.Calibration consisted of injecting individual gases at controlledrates while running the regular data-collection process.
Temperate (southern) beef data: Armidale, New SouthWales (NSW)A full description of the methane testing facility located
on the University of New England campus in Armidale, NSW,Australia, was given by Hegarty et al. (2014) and Herd et al.(2014). It comprises 10 open-circuit respiration chambers,each of 20 m3 internal volume and with an air flow rateof 1.6 m3/min. The respiration-chamber ambient air flowis reliant on negative pressure in the system, achieved by 2 ·Aerovent HPE400 3-phase fans (Aerovent Australia,Melbourne,Vic., Australia) placed in parallel at the exhaust of the system.Exhaust air from each chamber flows directly into a flowcontrol manifold composed of 10 mass-flow meters (ModelST75V, Fluid Components International, San Marcos, CA,USA). A continuous subsample of gas is drawn from each gasline immediately after each flow meter, dried through a customrefrigerated drier (AZCO Instruments, Auckland, NZ) andmethane concentrations are measured by a Servomex analyserModel 4100C1 (ServomexGroup)fittedwith an infrared detectorfor methane (GFx1210, 0–500 ppm) over 10 s after a 40 s purgetime. Gas production was determined every 9 min per chamberfor a period of 20 s. The Servomex was calibrated for methanewith two high-purity gas standards (low: 0 mg/kg, and high:
97.5 mg/kg methane). Methane recovery through the chamberswasmeasuredbetweenstudies byacontinuous releaseofmethanestandard. Methane production was measured over 2 · 24 hconsecutive periods, with animals fed once a day in the morning.
Tropical (northern) beef data: Rockhampton, QueenslandFull details were provided by Kennedy and Charmley (2012)
and Tomkins et al. (2011). Briefly, in each of two chambers,animalswere fed once daily in themorning at a level equivalent tothe feeding level established in the previous 5 days during penfeeding.Methane emissions weremeasured over one 24 h period.Air was sampled from alternate chambers every 3 min andmethane output was calculated from air sampled over the last2 min of each 3 min sampling cycle. Calibrations of the methaneanalyser were checked every 2 h and system recoveries wereassessed after each experimental period. If feed intake on the dayof measurement was less than 90% that of the previous day, themeasurement was repeated several days later.
Tropical (northern) beef data: Townsville, QueenslandFour open-circuit chambers were used with methane
emissions collected over two consecutive days. Each chamberwas 4.0 · 2.4 · 2.4m andwas constructed of a tubular galvanisedsteel frame over which 4.5 mm clear polycarbonate was attachedproviding full visibility for each animal. A modified squeezecrush within each chamber defined a confinement area thataccommodated cattle of different sizes. Each chamber wasfitted with a door (1050 · 2100 mm) at either end for entryand exit of the animal. Animals were fed at ad libitum levelsestablished in the days before animals entered chambers.Measurements were taken over 23 h and extrapolated to a 24 hmethane production. Intake airwas sourced external to the animalbuilding, with chamber air vented through the roof line. Inlinefans (TD800/200N, Fantech, Melbourne, Vic., Australia) fittedwith variable speed controllers maintained flow rates of 100 L/sand a slight negative pressure within each chamber. Relativehumidity and temperature (HMT 330, Vaisala, Melbourne, Vic.,Australia) and pressure (QBM75-1U/C, Siemens, Zurich,Switzerland) sensors installed in each chamber permitted airflow to be corrected to standard temperature and pressure. Airflow was measured on the exhaust with thermal flow sensors(SS20.500 SCHMIDT® Flow sensor, St Georgen, Germany).Air for gas analysis was drawn from a point in the exhaustduct through polyurethane tubing at 4.5 L/min, using a microdiaphragm pump located between a multiport gas-switching unit(SW & WS Burrage, Ashford, Kent, UK) and membrane drier(Perma Pure LLC, Toms River, NJ, USA). Following particulatefiltering and dehumidifying using a four pot refrigerateddrier (AF30-02, SMC Pneumatics Australia, Sydney, NSW,Australia), air samples entered the multiport gas-switching unitthat sampled each chamber and two outside air ports for 180 s.Air samples then passed through the membrane drier andwere metered through independent rotameters before analysisfor methane (GFx Infrared, 0–500 mg/kg, Servomex 4100,Servomex Group). Sampling events, internal monitoring ofchamber conditions and data management were handledby Innotech® processors (Genesis II, Innotech®, Brisbane,Australia) using digital I/O at 4–20 mA. All data werecompiled in a dedicated computer by using a structured query
Methane production and intake in cattle Animal Production Science C

language database. Daily (24 h) methane emissions werecalculated by averaging the last 90 s of each sampling period.System recoveries were assessed by releasing methane (99.9%purity) at known rates (g/min) and regressed against chamberreadings between each experimental period.
Data analysesThe relationships between MP (g/day or MJ/day) and DMI(kg/day) or GEI (MJ/day) were analysed for the combined datain a meta-analysis using linear mixed-effect models (Galwey2006) by REML in GENSTAT (17th edn, 2014, VSN International,Hemel Hempstead, UK). The mixed-effect models consisted offixed effects to characterise the relationships between MP andintake, and random effects to characterise the variance structureof the data.
The fixed effects included a linear term in DMI (or GEI) byfactorial effects of cattle class (DAIRY, S.BEEF or N.BEEF),cattle breed (Shorthorn versus Angus) within S.BEEF, and sex(female, male or steer). Also included were quadratic terms inDMI by cattle class.
The random effects comprised variance componentsfor experiment, period within experiment, treatment withinexperiment, and residuals. The variance component forexperiment accounted for variance among experiments withineach class. The period-within-experiment variance componentwas relevant only to two short-term, dairy crossover trials. Theperiods in some longer-term dairy experiments related tomeasurements taken in autumn and spring, over 2 years. Theselong-term periods were considered as separate experiments inthe present analysis. The treatment-within-experiment variancecomponent accounted for feed-type effects. In addition to these,separate residual variances for the four locations from whichthe data were sourced, were included in the model. Finally, anadditional variance for dairy experiment was included, allowingfor larger variance among dairy experiments than among beefexperiments. This random-effect structure was employed in allanalyses.
Theoverall aimof thepresent paperwas topresent the simplestsatisfactory relationship between MP and intake. Accordingly,thefixed-effectsmodelwas progressively simplified by removingterms that were not statistically significant or that were physicallyimplausible. The initial full model was as follows:
MPli ¼ mþ b0xli þ d0x2li þ ck þ bkxli þ dkx2li þ sj þ fjxliþ bq þ gqxli þ Ee þ Dke þ Pkp þ Tet þ eli;
where x is either DMI or GEI, m is a constant (intercept). OtherGreek letters indicate coefficients for linear and quadratic effectsin DMI. Lower-case Latin letters are factorial fixed effects.Upper-case Latin letters are random effects, assumed to benormally distributed, and e is a normally distributed residualerror. Subscript l = 1. . .4 indicates the location of experiment,e denotes the experiment from which the data were derived,t indexes the treatment within experiment, p denotes the period(within dairy crossover experiments), and i identifies theobservation within levels of location, experiment, treatmentand period. Subscript k = 1. . .3, indicates the class of cattle(DAIRY, S.BEEF, N.BEEF), j = 1. . .3, the cattle sex (female,male, steer), and q = 1. . .3, the cattle breed (Shorthorn, Angus,
other). The variances of the random effects are variance amongexperiments,
VarðEeÞ ¼ s2E;
extra variance among dairy experiments,
VarðDkeÞ ¼ s2D; if k ¼ dairy
0; otherwise
�;
variance among periods,
VarðPkpÞ ¼ s2P; if k ¼ dairy
0; otherwise
�;
variance among fodder treatments,
VarðTetÞ ¼ s2T ;
and residual error variances for the four locations,
VarðeletpiÞ ¼ s2l ; l ¼ 1 . . . 4:
Models were tested with and without intercepts. The minimalmodel, that included just a linear term in DMI through the origin,and random (noise) effects, was as follows:
MPli ¼ b0xli þ Ee þ Dke þ Pkp þ Tet þ eli:
A generalised R2 statistic (Nakagawa and Schieizeth 2013),suitable for use in mixed-effect models, was calculated for eachmodel. Fixed effects were tested using F-tests from accumulatedanalysis of deviance, and contrast Student’s t-tests derived fromcoefficient estimates and their variance–covariance matrix.Distributional assumptions of normality and constant variancewere checkedgraphically usinghistograms, normal quantile plotsand plots of residuals versus fitted values.
The predictive capability of the final model was assessed bycross validation in which each of the 29 experiments wassuccessively excluded from the calibration data, to which themodel was refitted, with the excluded data being used as test data.The root mean square of percentage discrepancies between thecross-validation predicted and observed test data MP for all29 experiments was used to summarise precision of prediction.Percentage, rather than absolute, discrepancywasusedbecauseofits stability for thesedata, consistentwithvariance increasingwithmean, but coefficient of variation remaining constant.
Results
Methane production and DM intake
A graph of MP versus DMI data indicated a linear relationship,possibly through the origin, with the spread of data observed toincrease with increasing DMI (Fig. 1).
In the initial meta-analysis model, Shorthorn did not differsignificantly (breed effects P > 0.05) from Angus in interceptor slope of DMI. Accordingly, breed was excluded from allsubsequent models. However, there were significant effects ofcattle class (P=0.03) and sex (P<0.001) that remained significantin the model with breed effects excluded. Slope and interceptestimates for these are shown in Table 3. Some of the interceptswere significantly different from zero (S.BEEF (male),P= 0.032,and S.BEEF (steer), P < 0.001). The estimated slopes were not
D Animal Production Science E. Charmley et al.

significantly different by class (P = 0.74), but were different bysex (P < 0.001).
When the lines were constrained to pass through the origin,slope estimates were significantly different among classes(P = 0.042) and sexes (P < 0.001; Table 4, Fig. 2). Pairwisetests of slope estimates between class by sex groups are given inTable 5. These showed significant differences between N.BEEFand each other class by sex group, except for S.BEEF (female).Within S.BEEF, there were significant differences betweenfemales and each of males and steers.
Further simplification of the fixed effects, to a single line-through-the-origin, gave the combined estimate of slope as
MP ¼ 20:7 ð�0:28Þ · DMI; ð1Þwhere MP is in g/day and DMI in kg/day (Table 4, Figs 1, 2).Despite appearances, results of Tables 4 and 5 are not
inconsistent. Unlike the confidence intervals for the individualslopes given in Table 4 and Fig. 2, the pairwise tests in Table 5 aredesigned for testing differences and, therefore, take into accountthe shared structure in the experimental and sampling design. Forexample, for S.BEEF, female and male, or female and steer,sometimes occurred together within the same experiment. Thisresulted in a more precise comparison of their slopes that is notreflected in their individual confidence intervals.
Estimates of the variance components for MP, expressedin Table 6 as standard deviations for ease of interpretation,were calculated under the mixed model having minimal fixed-effects consisting of a common single straight line throughthe origin. The largest components of variance all pertainedexclusively to dairy data. These were, in a decreasing order,the dairy residual variance, dairy experiment variance and dairyperiod variance. The residual standard deviation for dairy wasapproximately four-fold the residual standard deviations for thebeef classes. The variance component for beef experiment wasof an order of magnitude similar to the residual variances. Thevariance component for treatment was the smallest component,consistent with anti-methanogenic treatments having beenexcluded from the data. While components have been tabulatedin Table 6 only for the simplest fixed-effect model, the estimatesderived from other models were very similar and have not beenpresented here.
Methane production and GE intake
For N.BEEF data, individual GE concentrations were measuredand used for each feed. The mean GE concentration for theN.BEEF diets was 17.7 MJ/kg DM. As a consequence of therelativity between mass and energy, results expressed on anenergy basis were essentially the same as those expressed on aDM basis. The one exception was for N.BEEF data, where therewas a 5% increase in methane yield (MY) on an energy basisversus a DM basis. This is most apparent in Fig. 2 where themean MP values are given for the five class by sex groups.
00 5 10 15 20 25 30
100
200
300
400
500
600
Met
hane
pro
duct
ion
(g/d
ay)
Dry matter intake (kg/day)
Fig. 1. The combined relationship between methane (CH4) production anddry matter intake for dairy (DAIRY, open triangles), southern beef (S.BEEF,open circles) and northern beef (N.BEEF, open squares). The solid linerepresents the relationship MY = 20.7 (�0.28) g CH4/kg DMI.
Table 3. Meta-analysis slope and intercept estimates for methaneproduction versus dry matter intake (DMI) and gross energy intake
(GEI) by animal classFixed-effect models wereMP = ai + bi ·DMI, R2 = 91.5, andMP = ai + bi ·
GEI, R2 = 91.5, for class and sex combination i
Class Slope s.e. Intercept s.e.
DMIDAIRY (female) 19.22 1.404 38.0 29.03S.BEEF (female) 19.35 0.668 12.82 6.79S.BEEF (male) 24.74 0.733 –15.29 7.12S.BEEF (steer) 13.5 1.421 68.51 12.38N.BEEF (steer) 20.64 1.185 –6.1 6.46
GEIDAIRY (female) 0.058 0.004 2.140 1.614S.BEEF (female) 0.059 0.002 0.714 0.382S.BEEF (male) 0.075 0.002 –0.853 0.400S.BEEF (steer) 0.041 0.004 3.824 0.691N.BEEF (steer) 0.066 0.004 –0.380 0.363
Table 4. Estimates of fixed-effect slopes for methane production (MP)versus dry matter intake (DMI) and gross energy intake (GEI) straight
line through the originData shownare by cattle class and sex (DMI,R2=0.924;GEI,R2=0.925), andcombined, single line through the origin (DMI, R2 = 0.922; GEI R2 = 0.927)
Cattle class Slope s.e. 95% confidence limitLower Upper
MP vs DMI (g/kg)DAIRY (female) 20.99 0.45 20.09 21.88S.BEEF (female) 20.48 0.43 19.62 21.33S.BEEF (male) 20.99 0.42 20.15 21.82S.BEEF (steer) 21.53 0.45 20.64 22.43N.BEEF (steer) 19.60 0.49 18.61 20.58Combined 20.74 0.28 20.18 21.30
MP vs GEI (KJ/MJ)DAIRY (female) 0.0635 0.0013 0.0608 0.0662S.BEEF (female) 0.0619 0.0013 0.0592 0.0645S.BEEF (male) 0.0634 0.0013 0.0609 0.0660S.BEEF (steer) 0.0651 0.0014 0.0623 0.0678N.BEEF (steer) 0.0619 0.0017 0.0587 0.0652Combined 0.0634 0.0008 0.0618 0.0650
Methane production and intake in cattle Animal Production Science E

As withMP on a DM basis, a single line-through-the-origin gavethe combined estimate of slope as
MP ¼ 0:0634 ð�0:0008Þ · GEI; ð2Þwhere MP and GEI are in MJ/day (Table 4, Fig. 2). Slope did notdiffer significantlybetweenN.BEEFsteers andother class-by-sexgroups, as it did on the basis of DM intake (Table 5).
Discussion
Methane and DMI
There is a single, strong, linear relationship between MP andDMI across all classes of forage-fed cattle in Australia (Eqn 1).
This is despite the data being collated from experimentsconducted at four different research sites, using a wide rangeof diets typical of those fed to cattle on Australian farms, andinvolving 220 lactating Holstein dairy cows, 680 Angus beefcattle, including yearling heifers, 2-year-old bulls and steersand 134 Brahman steers. Equation 1 was developed from themost comprehensive dataset relevant to the Australian cattleindustries and is strong (P < 0.001, R2 = 0.92). In addition, themethane-emission measurements in this dataset were all madeusing respiration chambers, a method generally accepted asthe most accurate of those currently available (Storm et al.2012). For these reasons, we propose Eqn 1 as a universalequation to describe methane emissions from all forage-fedcattle in Australia.
A linear relationship between MP and DMI has also beenshown by other researchers. Ricci et al. (2013) reported that DMIfor beef cattle accounted for 70%of the variation inMP in ameta-analysis of 38 published international studies on dairy and beef
22.5
22.0
21.5
20.5
Met
hane
per
DM
I (g/
kg)
Met
hane
per
GE
I (M
J/M
J)
21.0
20.0
19.5
19.0
18.5
0.068
0.066
0.064
0.062
0.060
DA
IRY
(fe
mal
e)
S.B
EE
F (
fem
ale)
S.B
EE
F (
mal
e)
S.B
EE
F (
stee
r)
N.B
EE
F (
stee
r)
Com
bine
d
Fig. 2. Estimates ofmethane yields (drymatter (DM) and gross energy (GE)basis) with 95% confidence intervals by cattle class and sex, and combined.Methane yields (g/kg DM orMJ/MJ GE intake (GEI)) were derived as slopesformethane production (MP) versusDM intake (DMI) orGEI as straight linesthrough the origin, in a meta-analysis using a linear mixed-effect model.
Table 5. P-values for pairwise Student’s t-test contrasts between slopecoefficients of methane production (MP) versus drymatter intake (DMI)and gross energy intake (GEI) straight line through the origin, by cattle
class and sexNote that some pairwise tests were more sensitive than might be expectedgiven their 95% confidence intervals. This is because these combinations of
class and sex sometimes occurred together in the same experiments
DAIRY(female)
S.BEEF(female)
S.BEEF(male)
S.BEEF(steer)
DMIS.BEEF (female) 0.41S.BEEF (male) 0.99 0.001S.BEEF (steer) 0.39 0.001 0.11N.BEEF (steer) 0.04 0.18 0.04 0.005
GEIS.BEEF (female) 0.404S.BEEF (male) 0.979 0.001S.BEEF (steer) 0.408 0.001 0.109N.BEEF (steer) 0.469 0.98 0.472 0.144
Table 6. Variance components, expressed as standard deviations(square root of variance component) corresponding to the meta-analysis mixed-model random effects for methane (CH4) productionunder the simplest fixed-effect (line through the origin) model:
MP = b � DMI
Source Standard deviation(g CH4/day)
DMI GEI
Beef experiment 10.3 0.49Dairy experiment 24.8 1.21Treatments 4.8 0.26Period, dairy 17.0 1.01Residual, dairy 44.7 2.49Residual, beef Rockhampton 10.4 0.58Residual, beef Townsville 13.5 0.74Residual, beef southern 9.5 0.54
F Animal Production Science E. Charmley et al.
cattle. Their data included methane measurements made by bothrespiration chambers and by the SF6 technique of Johnson et al.(1994), and this may account for some of the variance in theirdataset. Hristov et al. (2013a, 2013b) also demonstrated a simplerelationship between MP and DMI in a meta-analysis of dairydata that included DMI over a range similar to that in the currentanalysis (MP (g/day) = 19.14 · DMI + 2.54). Similarly, Dijkstraet al. (2011) reported that methane yield (MY, g CH4/kg DMI)for dairy cows in The Netherlands was 23.1, suggesting a linearrelationship between MP and DMI, with an intercept of zero.
In contrast, a curvilinear relationship between MP andDMI was developed by Blaxter and Clapperton (1965), andsubsequently corrected by Wilkerson et al. (1995). Recently,Moate et al. (2014) listed six reasons why the equation of Blaxterand Clapperton (1965) should not be used for Australian cattle,including that the work was undertaken predominantly usingsheep and feeds that are qualitatively different from the forage-based diets typically used in Australia. A curvilinear relationshipbased on the chemical composition of the diet is used to estimateemissions from dairy cattle in the United States (Rotz et al.2011). Reported curvilinearity between MP and DMI is mostlikely due to an increasing proportion of concentrate in the diet(Rotz et al. 2011). The purpose of our analysis was to developa universal equation for forage-fed cattle in Australia, whichrepresents a substantial proportion of the Australian beef anddairy industries that are pasture or forage-based. The equationneither uses data from cattle fed over 30% concentrate in the diet,nor is it intended to be used for estimating emissions from suchcattle. Constraining our dataset to low concentrate-inclusionlevels may explain the lack of curvilinearity at higher intakesobserved in our analysis.
Methane yield
The slope of the proposed universal relationship betweenmethane and DMI was similar to previously published values.For dairy cattle alone, the MYwas 21.0� 0.45 g/kg DMI, whichcompares well with values reported in the scientific literaturethat range from ~17 g methane per kg DMI to a maximum of~25 g/kg DMI. Grainger et al. (2007) summarised data fromAustralian dairy cows and found a low yield of methaneof 17.1 g/kg DMI. While some of the Grainger data wereincluded in the present analysis, the current dairy datasetexcludes all data where the concentrate proportion of the dietwas over 30% and also includes data obtained since 2007 (Moateet al. 2014). The dairy MY is a little below that of 23.1 g CH4/kgDMI reported by Dijkstra et al. (2011) for dairy cows in TheNetherlands and slightly higher than the 19.1 g CH4/kg DMIreported byHristov et al. (2013a, 2013b). The analysis byHristovet al. (2013a, 2013b) included high-concentrate diets andthis probably contributed to the slightly lower MY than in ouranalysis.
For the classes of beef cattle used,MYranged from19.6� 0.49to 21.5 � 0.45 g/kg DMI, which is within previously publishedvalues. Irish beef data suggested a higher MY of ~25 g/kg DMI(Yan et al. 2009), with a reasonable relationship between MP andDMI (R2 = 0.68). Their analysis included trials with growing beefcattle-fed diets containing 0–70% concentrate. This discrepancybetween Irish and Australian data may be attributed to the
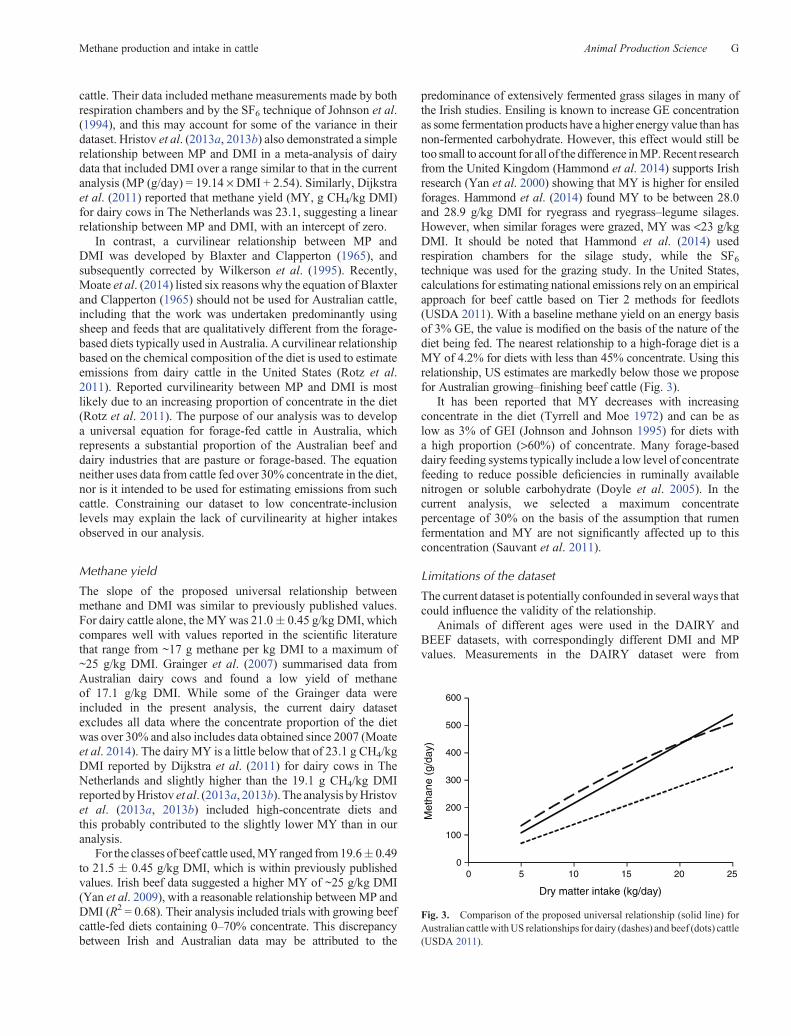
predominance of extensively fermented grass silages in many ofthe Irish studies. Ensiling is known to increase GE concentrationas some fermentation products have a higher energy value than hasnon-fermented carbohydrate. However, this effect would still betoo small to account for all of the difference inMP.Recent researchfrom the United Kingdom (Hammond et al. 2014) supports Irishresearch (Yan et al. 2000) showing that MY is higher for ensiledforages. Hammond et al. (2014) found MY to be between 28.0and 28.9 g/kg DMI for ryegrass and ryegrass–legume silages.However, when similar forages were grazed, MY was <23 g/kgDMI. It should be noted that Hammond et al. (2014) usedrespiration chambers for the silage study, while the SF6technique was used for the grazing study. In the United States,calculations for estimating national emissions rely on an empiricalapproach for beef cattle based on Tier 2 methods for feedlots(USDA 2011). With a baseline methane yield on an energy basisof 3% GE, the value is modified on the basis of the nature of thediet being fed. The nearest relationship to a high-forage diet is aMY of 4.2% for diets with less than 45% concentrate. Using thisrelationship, US estimates are markedly below those we proposefor Australian growing–finishing beef cattle (Fig. 3).
It has been reported that MY decreases with increasingconcentrate in the diet (Tyrrell and Moe 1972) and can be aslow as 3% of GEI (Johnson and Johnson 1995) for diets witha high proportion (>60%) of concentrate. Many forage-baseddairy feeding systems typically include a low level of concentratefeeding to reduce possible deficiencies in ruminally availablenitrogen or soluble carbohydrate (Doyle et al. 2005). In thecurrent analysis, we selected a maximum concentratepercentage of 30% on the basis of the assumption that rumenfermentation and MY are not significantly affected up to thisconcentration (Sauvant et al. 2011).
Limitations of the dataset
The current dataset is potentially confounded in several ways thatcould influence the validity of the relationship.
Animals of different ages were used in the DAIRY andBEEF datasets, with correspondingly different DMI and MPvalues. Measurements in the DAIRY dataset were from
0
100
200
300
400
500
600
0 5 10 15 20 25
Met
hane
(g/
day)
Dry matter intake (kg/day)
Fig. 3. Comparison of the proposed universal relationship (solid line) forAustralian cattlewithUS relationships for dairy (dashes) and beef (dots) cattle(USDA 2011).
Methane production and intake in cattle Animal Production Science G

lactating Holstein–Friesian dairy cows with a high DMI and highMP,whilemeasurements in the BEEFdataset were fromgrowingyoung stock with a low DMI and low MP. The analysis did notinclude any data for young growing dairy heifers or mature beefbreeder cattle.
A sex effect was detected for the S.BEEF dataset, wheremales, heifers and steers were evaluated. All measurementsin the N.BEEF dataset were taken on steers and those in theDAIRY dataset were from lactating cows, so a possible sex effectin Bos indicus and dairy was not able to be tested.
Different diets were used at different experimental sitesand diet is well known to affect methane production (e.g.Hristov et al. 2013a). The DAIRY and N.BEEF data are basedon a wide variety of diets, with generally few observations perdiet,while theS.BEEFdataweremainly derived fromavery largedataset where the diet quality was deliberately standardised.Site of digestion can be influenced by the form in which theforage is fed. Fresh and grazed forages are more extensivelydegraded in the rumen than are hays and dried forages (Holdenet al. 1994). This could have influenced MP in the DAIRY dataversus S.BEEFandN.BEEFdata, since theDAIRYdata includedfresh forages, whereas the majority of BEEF data were collectedfrom cattle fed dried forages. Furthermore, within the beefbreeds, all data for tropical forages were generated from Bosindicus cattle, while temperate forage data were generated fromBos taurus cattle. It cannot be discounted that the 5% lower MYon an energy basis in N.BEEF data may have been due to geneticdifferences. Bos indicus · Bos taurus steers have been shown toproduce ~10% lessmethane thanBos taurus steers of comparableweight and age (Vercoe 1970). Generally, it is considered thattropical grasses are associated with higher methane emissionsper unit of DMI than are temperate grasses (Kurihara et al. 1999;Ulyatt et al. 2002) due to higher lignification and subsequentlower rate of passage of feed. However, direct comparisonsbetween tropical and temperate grasses are scarce (e.g. Marganet al. 1988; Archimède et al. 2013). Archimède et al. (2011)conducted a meta-analysis of 22 studies and concluded thatmethane emissions were 12% higher for ruminants fed C4(tropical) grasses than for those fed C3 (temperate) grasses.Their analysis employed a range of techniques, including theSF6 technique, and a range of livestock species, includingsheep and goats. Our data, which are restricted to cattle andmeasurements made in respiration chambers, clearly showed thatMYwas no higher forBos indicus cattle fedC4 (tropical) grasses,than from Bos taurus cattle fed C3 (temperate) grasses.
In an analysis of this type, it is impossible to eliminate allfactors thatmayhave contributed to someof the statistical ‘noise’.The apparent positive relationship of residual variance withMP may have been an artefact of experimental conditions atdifferent sites and the observation of a sex effect in the S.BEEFdata may have been an artefact of data measurement or selection.Nevertheless, we believe that the effects of these factors, ifpresent, were too small to markedly influence the results, andthis is borne out by the strong regression statistic (R2 = 0.92) ofthe universal relationship. In addition, the current dataset, withover a thousand individual measurements of MP from cattle inopen-circuit respiration chambers, is very much larger that thedatasets used to establish the current Tier 2 estimates of methaneemissions used in the Australian inventory.
Choice of statistical approach
The discussion around the statistical approach is confined to MPon a DM basis, because the same arguments and conclusionswould also apply to MP expressed on an energy basis.
The data for the current meta-analysis were derivedfrom experiments that were not planned as a whole series.Consequently, the data were both experimental andobservational, involving a certain amount of imbalance andconfounding due to differences between sites and the choices ofexperimental protocols, animal type and sex. The challengefor the present meta-analysis was to detect and represent thestructure in the data in an efficient and realistic manner, so as toreliably select and estimate models descriptive of MP. A mixed-model framework was well suited to this end (St-Pierre 2001;Sauvant et al. 2008).
The purpose of the random effects was, first, to account forlack of independence arising by virtue of the data being groupedaccording to their site, experiment, time and experimentalstructure. Second, additional random effects were included toaccount for variance heterogeneity apparent in the data. This wasachieved by the inclusion of multiple residual variances, one foreach location from which the data were sourced. These fourlocations utiliseddifferent respiration chambers andexperimentalprotocols that could have contributed to differing variances.Furthermore, these locations each measured just one class ofanimal, for which there were different ranges of DMI and thusalso of MP. In particular, it was found that dairy, with its greaterDMI and MP had greater variance, not only within, but alsobetween experiments. Random effects were included specificallyto account for this heterogeneity.
Variations of this approach to the meta-analysis wereinvestigated. For example, log-transformation of MP beforeanalysis was effective in removing much of varianceheterogeneity, but it did not completely remove it. It didobviate the need for a special variance component for dairyexperiments. Log-transformation, while maintaining theconvenience of a linear model, implied a change in the formof the MP versus DMI relationship to that of a power curve.With this, a straight line through the origin occurs as a specialcase, when slope coefficient for log-DMI equals unity.
A third approach, noting that variance increases with bothMPand DMI, was to analyse MY (i.e. the data formed by the ratioMP :DMI) directly. This too reduced variance heterogeneity, butnot completely. It also simplified the fixed-effects model to onewithout DMI, or raised a perceived difficulty of dealing withDMI on both sides of the model equation.
All approaches tested produced similar estimates of slopesof the straight line between MP and DMI, through the origin.As all approaches require a reasonably complex random-effectsstructure, dictated by the grouped sampling structure, thereappears to be no compelling reason to choose one above theother. We adopted the first approach, of analysing MP in termsof DMI by classifying factors, which is analogous to groupedregression, as being conceptually the simplest for the readership.
The case for adopting a single relationship
There was some evidence of non-zero intercepts in relationshipsbetween MP and DMI for males and steers within the
H Animal Production Science E. Charmley et al.

S.BEEFclass. Formales, the interceptwas less than zero,whereasfor steers, the intercept was greater than zero. The reasons forthis remain obscure. It is possible that these were in fact Type Ierrors. Biologically, it makes sense thatMP should be zero at zeroDMI, so the relationship must eventually go through the origin.This implies that either the straight-line relationship does gothrough the origin andweweremistaken in allowing for non-zerointercept, or that the true relationship actually involved some
curvature.Whilewe cannot exclude the possibility of curvature, itis unlikely that suchcurvaturewouldmanifest at the relatively lowlevels of DMI observed for these beef data, particularly whenit was not apparent at the higher DMI observed for DAIRY. It isalso apparent that the S.BEEF (male) and S.BEEF (steer) data doin fact not stray far from a straight line through the origin sharedby all of the data (Fig. 4). We also note that a small change inslope can produce a large change in intercept, especially when
5 10 15 20 25
5 10 15 20 25 5
DMI (kg/day)
GEI (MJ/day)
10 15 20 25
600
500
400
300
200
100
600
DAIRY (female) N.BEEF RH (steer) N.BEEF TV (steer)
S.BEEF (female) S.BEEF (male) S.BEEF (steer)
DAIRY (female) N.BEEF RH (steer) N.BEEF TV (steer)
S.BEEF (female) S.BEEF (male) S.BEEF (steer)
500
400
300
200
100
30
20
10
30
20
10
100 200 300 400 500
100 200 300 400 500 100 200 300 400 500
Met
hane
pro
duct
ion
(MJ/
day)
Met
hane
pro
duct
ion
(g/d
ay)
Fig. 4. Methane production plotted against dry matter intake (DMI) or gross energy intake (GEI),separately for each data source by sex combination that was present in the experimental data sourcedfromeasternAustralia.Thedashed line is the line through theorigin (slope20.7),fitted to the combineddata using a mixed-effects meta-analysis.
Methane production and intake in cattle Animal Production Science I

DMI data are clumped well away from zero. For these reasons,we proceeded to include in our analysis straight-line modelsconstrained to pass through the origin. When this was done,the generalised R2-value actually increased slightly (from 0.915to 0.924; Tables 3, 4). Apart from its simplicity, the adoption ofthe straight line through the origin has the added advantage thatthe slope can be interpreted as the average MY.
The model suggested in the present paper can be used topredict the methane emissions from individual animals, froma herd of animals or emissions with respect to the nationalinventory. If the model is used to predict methane emissionsfroman individual animal, then, at a givenDMI, the spread of dataas shown in Fig. 1 provides an indication of the possible error ofprediction. At any given DMI, the observed variation in methaneemissions is due to several factors, including differences in dietcomposition (Johnson and Johnson 1995), variation in the day-to-day feed intake (Moate et al. 2012), genetic differencesamong animals (Hegarty et al. 2006) and measurement error(Gardiner et al. 2015). Our model indicates that all of thesefactorsmaycollectively introduce anerror of~13.4%(root-mean-square percentage discrepancy between points and the fittedline) into the prediction of the methane emissions from anindividual animal. The ‘leave one experiment out at a time’cross-validation gave comparable root-mean-square percentageerror of prediction of 14.4%. The variance component estatespresented in the paper can be used to estimate absolute predictionerror for an animal, or for a herd, of a particular class. However,if the model is used to estimate the methane emissions for thenational inventory, then, on the basis of Eqn 1, the error ofprediction is likely to be ~1.4%.
Current inventory methods versus the universal equation
The current Australian national accounting system (Departmentof the Environment 2014) uses two distinct methods forestimating methane emissions. For dairy cattle and beef cattlein temperate regions, feed intake is based on the equation ofMinson and McDonald (1987) corrected for milk production(Standing Committee on Agriculture 1990); then, the equationof Blaxter and Clapperton (1965) as corrected by Wilkersonet al. (1995) is used to predict the MY. For beef cattle intropical regions, intake is calculated according to Minson andMcDonald (1987), whereas MY is based on the equation ofKurihara et al. (1999) as modified by Hunter (2007). Thefollowing relationships between MP and DMI were derivedusing the methods of Australian Inventory of GreenhouseGases (Department of the Environment 2014):
MPDAIRY ¼ �0:64 · DMI2 þ 39:2 · DMI� 66:0; ð3ÞMPS:BEEF ¼ 26:4 · DMIþ 0:213; and ð4Þ
MPN:BEEF ¼ 34:9 · DMI� 30:8; ð5ÞwhereMP is methane production (g/day) for dairy cattle and beefcattle in southern or northern Australia.
These relationships generally estimate a higher MP than doesthe new universal equation (Fig. 5). Estimates of MP for dairycattle were reduced by ~10% at DMI up to 15 kg/day. Above thisDMI, the curvilinearity of the currentmethod used for accountingdiminished thedifferencebetween the two relationships, such that
at DMI above 23 kg/day, the proposed linear equation predictedmarginally higher emissions. For beef cattle in temperate regions,estimates ofMPwere between5%and20% lower than the currentinventory estimate across the likely intake range of growingbeef cattle. For beef cattle in tropical regions, the reduction inestimated MP ranged from 25% to 30%.
Using the proposed linear equation dramatically reducesemission estimates from enteric fermentation of Australia’sbeef and dairy cattle (Table 7). By applying the universalequation to the 2012 inventory data (Department of theEnvironment 2014) and applying a global warming potential(GWP) of 21 from the 2012 inventory, emissions from cattle arereducedby10.6Mt (CO2-e) or 24.1%.Thiswould reduce the totalcontribution of agriculture from16.1% to 14.1%of nationalGHGemissions. Under the proposed inventory methodology forthe next accounting period, a GWP for methane of 25 will beused to recalculate the inventory back to 1990 (Department ofthe Environment 2015). If the current equations were used, theestimated total emissions from the cattle industries would be52.1 Mt (CO2-e), whereas by applying the new relationship, theemissions are calculated as 39.5 Mt (CO2-e). Thus, the newuniversal equation predicts 12.6 Mt (CO2-e) less emissions.
Compared with the 2102 inventory with a GWP of 21, thecombined effect of the new universal equation and a GWP of25 would result in estimates of 0.2 Mt CO2-e more emission forDAIRY, no change for S.BEEF, 4.5 Mt CO2-e less emissions forN.BEEF, and a net reduction in the total estimated inventoryfor cattle of 4.3 Mt CO2-e annually.
Summary and conclusions
On the basis of the most comprehensive dataset for methaneemissions measured in open-circuit respiration chambers inAustralia, the case is made to revise the methods used forcalculating the national inventory for forage-fed cattle. Theresults showed that a single relationship for dairy and all beefcattle is justified, considering the inconsequential differencesfound between the dairy and beef cattle in the tropical northernand temperate southern regions of Australia. It is proposed that
00 5 10 15 20 25
100
200
300
400
500
600
Dry matter intake (kg/day)
Met
hane
(g/
day)
Fig. 5. Comparison of the relationships used in the Australian inventory fornational greenhouse gas accounting for dairy (DAIRY, long dashes and dots),southern beef (S.BEEF, short dashes) and northern beef (N.BEEF, dots) withthe proposed universal relationship (solid line).
J Animal Production Science E. Charmley et al.

for the national inventory, a single relationship for forage-based diets (forage content of >70%) between MP and DMI of20.7 g/kg DM should be adopted when GE content of the dietis unknown and assumed to be similar to the default value of18.4 MJ/kg DM. If the GE concentration of the diet is known,then an energy loss as methane of 6.3% of GE is recommended.We do not support a more complex relationship that takesinto account diet quality, rate of passage, class of cattle andphysiological state on the presumption that the animal integratesthese andother variables into the total feed eatenwhenconsumingforage-based diets. Voluntary DMI is a product of both plant andanimal characteristics affecting digestion and, as such, representsa suitable basis for estimating methane emissions.
Acknowledgements
This reviewwas fundedby theAustralianDepartment of theEnvironment andis based on research largely funded through the Reducing Emissions fromLivestockResearchProgram, andNational LivestockMethaneProgram, bothcoordinated by Meat and Livestock Australia (MLA) and co-funded bythe Australian Government and MLA. The assistance provided by NigelTomkins and Lindsey Perry in the provision of additional data is gratefullyacknowledged. Additional advice on statistical analysis was also provided byDr Julian Hill.
References
ArchimèdeH, EugèneM,Marie-Magdeleine C, BovalM,Martin C,MorgaviDP, LeComte P, Doreau M (2011) Comparison of methane productionbetween C3 and C4 grasses and legumes. Animal Feed Science andTechnology 166–167, 59–64. doi:10.1016/j.anifeedsci.2011.04.003
Archimède H, RiraM, EugeneM,Morgavi DP, Anais C, Periacarpin F, CalifB, Martin C, Marie-Magdeleine C, Doreau M (2013) Intake, total-tractdigestibility and methane emission of Texel and Blackbelly sheep fed C4and C3 grasses tested simultaneously in a temperate and a tropical area.Advances in Animal Biosciences 4, 285.
Australian Greenhouse Emissions Information System (2014) ‘Nationalgreenhouse gas inventory: Kyoto protocol accounting framework.’Available at http://ageis.climatechange.gov.au/# [Verified 29 July 2014]
Blaxter KL, Clapperton JL (1965) Prediction of the amount of methaneproduced by ruminants. British Journal of Nutrition 19, 511–522.doi:10.1079/BJN19650046
Brouwer E (1965) Report of subcommittee on constants and factors. In‘Proceedings of the 3rd EAAP symposium on energy metabolism’.Publ. 11. (Ed. KL Blaxter) pp. 441–443. (Academic Press: London, UK)
Deighton MH, Williams SRO, Hannah MC, Eckard RJ, Boland TM,Wales WJ, Moate PJ (2014) A modified sulphur hexafluoride tracertechnique enables accurate determination of enteric methane emissionsfrom ruminants. Animal Feed Science and Technology 197, 47–63.doi:10.1016/j.anifeedsci.2014.08.003
Department of the Environment (2014) National inventory report 2012,vol. 1. Commonwealth of Australia, Canberra. Available at http://www.environment.gov.au/climate-change/greenhouse-gas-measurement/pub-lications#national [Verified 25 August 2014]
Department of the Environment (2015) ‘National greenhouse and energyreporting (measurement) amendment determination 2015 (No. 1).’Departmental Commentary. http://www.environment.gov.au/consulta-tion-draft-nger-amendmant-determination-2015-no1-departmental-com-mentry.doc [Verified 30 June 2015]
Dijkstra J, Van Zijderveld SM, Apajalahti JA, Bannink A, Gerrits WJJ,Newbold JR, Perdok HB, Berends H (2011) Relationships betweenmethane production and milk fatty acid profiles in dairy cattle. AnimalFeed Science and Technology 166–167, 590–595. doi:10.1016/j.anifeedsci.2011.04.042
Donoghue KA, Herd RM, Bird SH, Arthur PF, Hegarty RS (2013)Preliminary genetic parameters for methane yield in Australian beefcattle. In ‘Proceedings of the Association for the Advancement ofAnimal Breeding and Genetics. Vol. 20’. (Ed. NL Villalobos)pp. 290–293. (Association for the Advancement of Animal Breedingand Genetics: Napier, NZ)
Doyle PT, Francis SA, Stockdale CR (2005) Associative effects betweenfeeds when concentrate supplements are fed to grazing dairy cows: areview of likely impacts on metabolizable energy supply. AustralianJournal of Agricultural Research 56, 1315–1329. doi:10.1071/AR05087
Galwey NW (2006) ‘Introduction to mixed modelling, beyond regressionand analysis of variance.’ (John Wiley & Sons: Chichester, UK)
Gardiner TD, Coleman MD, Innocenti F, Tompkins J, Connor A,Garnsworthy PC, Moorby JM, Reynolds CK, Waterhouse A, Wills D(2015) Determination of the absolute accuracy of UK chamber facilitiesused in measuring methane emissions from livestock. Measurement:Journal of the International Measurement Confederation 66, 272–279.doi:10.1016/j.measurement.2015.02.029
Grainger C, Clarke T, McGinn SM, Auldist MJ, Beauchemin KA, HannahMC, Waghorn GC, Clark H, Eckhard RJ (2007) Methane emissionsfrom dairy cows measured using sulphur hexafluoride (SF6) tracerand chamber techniques. Journal of Dairy Science 90, 2755–2766.doi:10.3168/jds.2006-697
Grainger C, Auldist MJ, Clarke T, Beauchemin KA, McGinn SM, HannahMC, Eckard RJ, Lowe LB (2008) Use of monensin controlled-releasecapsules to reduce methane emissions and improve milk production ofdairy cows offered pasture supplemented with grain. Journal of DairyScience 91, 1159–1165. doi:10.3168/jds.2007-0319
Grainger C, Williams SRO, Eckard RJ, Hannah MC (2010) A high doseof monensin does not reduce methane emissions of dairy cows offeredpasture supplemented with grain. Journal of Dairy Science 93,5300–5308. doi:10.3168/jds.2010-3154
Hammond KJ, Humphries DJ, Westbury DB, Thompson A, Crompton LA,Kirton P, Green C, Reynolds CK (2014) The inclusion of foragemixtures in the diet of growing dairy heifers: impacts on digestion,energy utilization, and methane emissions. Agriculture, Ecosystems &Environment 197, 88–95. doi:10.1016/j.agee.2014.07.016
Hegarty RS, Goopy JP, Herd RM, McCorkell B (2006) Cattle selected forlower residual feed intake have reduced daily methane production.Journal of Animal Science 85, 1479–1486. doi:10.2527/jas.2006-236
Hegarty R, Bird S, Woodgate R (2014) Chapter 2: cattle respiration facility,Armidale, New South Wales, Australia. In ‘Technical manual on
Table 7. Impact on Australia’s calculated 2012 enteric-methaneemissions (CO2-e Mt/year) from cattle of applying the proposedrelationship between methane production and dry matter intake fordairy (DAIRY), southern beef (S.BEEF) and northern beef (N.BEEF)
cattle using a global warming potential (GWP) of either 21 or 25Dataand theoldmethodusedare fromDepartmentof theEnvironment (2014),
the new method uses the relationship proposed in the current paper
Cattle class Old method New method Change Difference (%)
GWP = 21DAIRY 6.6 5.7 –0.9 –14S.BEEF 14.0 11.8 –2.2 –16N.BEEF 23.2 15.7 –7.5 –32Total 43.8 33.2 –10.6 –24
GWP = 25DAIRY 7.9 6.8 –1.1 –14S.BEEF 16.7 14.0 –2.7 –16N.BEEF 27.6 18.7 –8.9 –32Total 52.1 39.5 –12.6 –24
Methane production and intake in cattle Animal Production Science K

respiration chamber designs’. (Eds C Pinares, G Waghorn) pp. 31–44.(Ministry of Agriculture and Forestry: Wellington, NZ) Available athttp://www.globalresearchalliance.org/app/uploads/2012/03/GRA-MAN-Facility-BestPract-2012-FINAL.pdf [Verified 31 July 2014]
Herd RM, Donoghue KA, Arthur PF, Bird SH, Bird-Gardiner T, HegartyRS (2014) Measures of methane production and their phenotypicrelationships with growth and body composition traits in beef cattle.Journal of Animal Science 92, 5267–5274. doi:10.2527/jas.2014-8273
Holden LA, Miller LD, Varga GA, Hillard PJ (1994) Ruminal digestion andduodenal nutrient flows in dairy cows consuming grass as pasture, hay, orsilage. Journal of Dairy Science 77, 3034–3042. doi:10.3168/jds.S0022-0302(94)77245-3
Hristov AN, Oh J, Firkins JL, Dijkstra J, Kebreab E, Waghorn GC, MakkarHPS, Adesogan AT, YangW, Lee C, Gerber PJ, Henderson B, TricaricoJM (2013a) Mitigation of methane and nitrous oxide emissions fromanimal operations: I. A review of enteric methane mitigation options.Journal of Animal Science 91, 5045–5069. doi:10.2527/jas.2013-6583
HristovAN,Oh J, LeeC,MeinenR,MontesF,Ott T,Firkins J,RotzA,DellC,Adesogan A, Ang WZ, Tricarico J, Kebreab E, Waghorn GC, Dijkstra J,Oosting S (2013b) ‘Mitigation of greenhouse gas emissions in livestockproduction: a review of technical options for non-CO2 emissions.FAO animal production and health. Paper no. 177.’ (Eds P Gerber,B Henderson, H Makkar) (FAO: Rome, Italy)
HunterRA (2007)Methane production by cattle in the tropics.British Journalof Nutrition 98, 657. doi:10.1017/S0007114507727460
IPCC (2000) ‘Good practice guidance and uncertainty management inNational Greenhouse Gas Inventories.’ (Intergovernmental Panel onClimate Change: Kanagawa, Japan)
Johnson KA, Johnson DE (1995) Methane emissions from cattle. Journalof Animal Science 73, 2483–2492.
Johnson K, Huyler M, Westberg H, Lamb B, Zimmerman P (1994)Measurement of methane emissions from ruminant livestock using aSF6 tracer technique. Environmental Science & Technology 28,359–362. doi:10.1021/es00051a025
Kennedy PM, Charmley E (2012) Methane yields from Brahman cattlefed tropical grasses and legumes. Animal Production Science 52,225–239. doi:10.1071/AN11103
KuriharaM,Magner T, Hunter RA,McCrabbGJ (1999)Methane productionand energy partition of cattle in the tropics. British Journal of Nutrition81, 227–234. doi:doi:10.1017/S0007114599000422
Margan DE, Graham NMcC, Minson DJ, Searle TW (1988) Energy andprotein values of four forages, including a comparison between tropicaland temperate species. Australian Journal of Experimental Agriculture28, 729–736. doi:10.1071/EA9880729
Minson DJ, McDonald CK (1987) Estimating forage intake from the growthof beef cattle. Tropical Grasslands 21, 116–122.
Moate PJ, Deighton MH, Hannah MC, Williams SRO (2012) Intake effectson methane emissions from dairy cows. In ‘The CCRSPI conference,Melbourne, 27–29 November 2012’. pp. 60–61. (Climate ChangeResearch Strategy for Primary Industries: Melbourne)
Moate PJ, Williams SRO, Torok VA, Hannah MC, Eckard RJ, Auldist MJ,Ribaux BE, Jacobs JL, Wales WJ (2013) Effects of feeding algal mealhigh in docosahexanoic acid on feed intake milk production and methaneemissions in dairy cows. Journal of Dairy Science 96, 3177–3188.doi:10.3168/jds.2012-6168
Moate PJ, Williams SRO, Deighton MH, Pryce JE, Hayes BJ, Jacobs JL,Eckard RJ, HannahMC, WalesWJ (2014) Mitigation of enteric methaneemissions from the Australian dairy industry. In ‘Proceedings of the 6thAustralasian dairy science symposium’. (Ed. J Roche) pp. 121–136.(Australasian Dairy Science Symposium: Hamilton, NZ)
Nakagawa S, Schieizeth S (2013) A general and simple method for obtainingR2 from general linear mixed effects models. Methods in Ecology andEvolution 4, 133–142. doi:10.1111/j.2041-210x.2012.00261.x
NHMRC (2004) ‘Australian code of practice for the care and use of animalsfor scientific purposes.’ 7th edn. (Commonwealth of Australia: Canberra)
Ricci P, Rooke JA, Nevison I,WaterhouseA (2013)Methane emissions frombeef and dairy cattle: quantifying the effect of physiological stage and dietcharacteristics. Journal of Animal Science 91, 5379–5389. doi:10.2527/jas.2013-6544
Rotz CA,CorsonMS, ChianeseDS,Montes F, Hafner SD, Coiner CU (2011)‘Integrated farm system model: reference manual.’ (US Departmentof Agriculture, Agricultural Research Service: University Park, PA)Available at http://ars.usda.gov/SP2UserFiles/Place/19020000/ifsmreference.pdf [Verified 29 August 2014]
Sauvant D, Schmidely P, Daudin JJ, St-Pierre NR (2008) Meta-analyses ofexperimental data in animal nutrition.Animal2, 1203–1214. doi:10.1017/S1751731108002280
Sauvant D, Giger-Reverdin S, Serment A, Broudiscou L (2011) Influencesdes régimes et de leur fermentation dans le rumen sur la production deméthane par les ruminants. INRA Production Animaux 24, 433–446.
St-Pierre NR (2001) Invited review: integrating quantitative findings frommultiple studies using mixed model methodology. Journal of DairyScience 84, 741–755. doi:10.3168/jds.S0022-0302(01)74530-4
StandingCommittee onAgriculture (1990) ‘Feeding standards for Australianlivestock ruminants.’ (CSIRO Publishing: Melbourne)
Storm IM, Hellwing ALF, Nielsen NI, Madsen J (2012) Methods formeasuring and estimating methane emission from ruminants. Animals(Basel) 2, 160–183. doi:10.3390/ani2020160
Tomkins NW, McGinn SM, Turner DA, Charmley E (2011) Comparison oftwo methods for measuring methane emissions from beef cattle grazingRhodes grass dominated pastures. Animal Feed Science and Technology166–167, 240–247. doi:10.1016/j.anifeedsci.2011.04.014
Tyrrell HF, Moe PW (1972) Net energy value for lactation of a high and lowconcentrate ration containing corn silage. Journal of Dairy Science 55,1106–1112. doi:10.3168/jds.S0022-0302(72)85632-7
UlyattMJ, LasseyKR, Shelton ID,WalkerCF (2002)Methane emission fromdairy cows and wether sheep fed subtropical grass-dominant pasturesin midsummer in New Zealand. New Zealand Journal of AgriculturalResearch 45, 227–234. doi:10.1080/00288233.2002.9513513
United States Department of Agriculture (2011) Quantifying greenhousegas sources and sinks in animal production systems. In ‘Greenhousegas estimation. Quantifying greenhouse gas fluxes in agriculture andforestry: methods for entity-scale inventory’. pp. 5–159. (Office of theChief Economist, USDA:Washington, DC) Available at www.usda.gov/oce/climate_change/estimation.htm [Verified 10 July 2015]
Vercoe JE (1970) Fasting metabolism and heat increment of feeding inBrahman · British and British cross cattle. In ‘Energy metabolism offarm animals’. EAAP Publication No. 13. (Eds A Schurch, C Wenk)pp. 85–88. (Juris Druck and Verlag Zurich: Zurich, Switzerland)
Wilkerson VA, Casper DP, Mertens DR (1995) The prediction of methaneproduction of Holstein cows by several equations. Journal of DairyScience 78, 2402–2414. doi:10.3168/jds.S0022-0302(95)76869-2
Williams SRO, Clark T, Hannah MC, Marett LC, Moate PJ, Auldist MJ,Wales WJ (2013) Energy partitioning in herbage-fed dairy cows offeredsupplementary grain during an extended lactation. Journal of DairyScience 96, 484–494. doi:10.3168/jds.2012-5787
Yan T, Agnew RE, Gordon FJ, Porter MG (2000) Prediction of methaneenergy output in dairy and beef cattle offered grass silage-based diets.LivestockProductionScience64, 253–263. doi:10.1016/S0301-6226(99)00145-1
Yan T, Porter MG, Mayne CS (2009) Prediction of methane emission frombeef cattle using data measured in indirect open-circuit respirationchambers. Animal 3, 1455–1462. doi:10.1017/S175173110900473X
L Animal Production Science E. Charmley et al.
www.publish.csiro.au/journals/an