Minutes - SSA Shagunssashagun.nic.in/docs/minutes1718/Kerala/Kerala.pdf1 Results Framework for...
31
Transcript of Minutes - SSA Shagunssashagun.nic.in/docs/minutes1718/Kerala/Kerala.pdf1 Results Framework for...


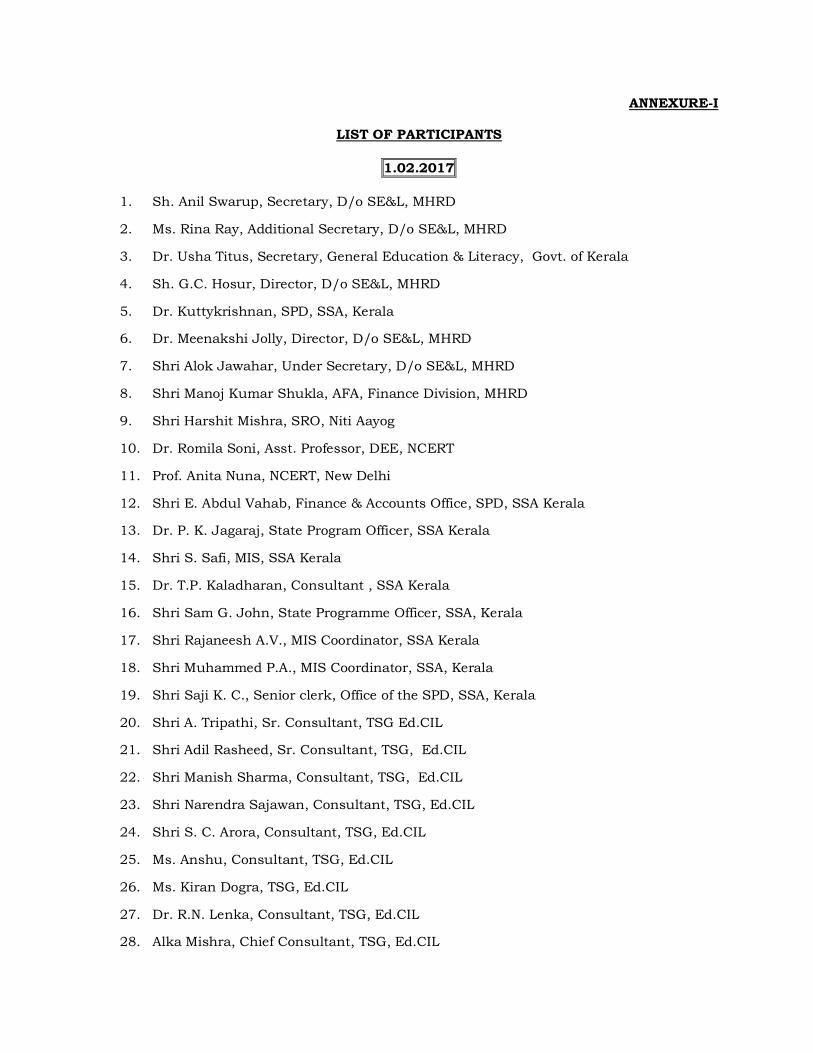
ANNEXURE-I
LIST OF PARTICIPANTS
1.02.2017
1. Sh. Anil Swarup, Secretary, D/o SE&L, MHRD
2. Ms. Rina Ray, Additional Secretary, D/o SE&L, MHRD
3. Dr. Usha Titus, Secretary, General Education & Literacy, Govt. of Kerala
4. Sh. G.C. Hosur, Director, D/o SE&L, MHRD
5. Dr. Kuttykrishnan, SPD, SSA, Kerala
6. Dr. Meenakshi Jolly, Director, D/o SE&L, MHRD
7. Shri Alok Jawahar, Under Secretary, D/o SE&L, MHRD
8. Shri Manoj Kumar Shukla, AFA, Finance Division, MHRD
9. Shri Harshit Mishra, SRO, Niti Aayog
10. Dr. Romila Soni, Asst. Professor, DEE, NCERT
11. Prof. Anita Nuna, NCERT, New Delhi
12. Shri E. Abdul Vahab, Finance & Accounts Office, SPD, SSA Kerala
13. Dr. P. K. Jagaraj, State Program Officer, SSA Kerala
14. Shri S. Safi, MIS, SSA Kerala
15. Dr. T.P. Kaladharan, Consultant , SSA Kerala
16. Shri Sam G. John, State Programme Officer, SSA, Kerala
17. Shri Rajaneesh A.V., MIS Coordinator, SSA Kerala
18. Shri Muhammed P.A., MIS Coordinator, SSA, Kerala
19. Shri Saji K. C., Senior clerk, Office of the SPD, SSA, Kerala
20. Shri A. Tripathi, Sr. Consultant, TSG Ed.CIL
21. Shri Adil Rasheed, Sr. Consultant, TSG, Ed.CIL
22. Shri Manish Sharma, Consultant, TSG, Ed.CIL
23. Shri Narendra Sajawan, Consultant, TSG, Ed.CIL
24. Shri S. C. Arora, Consultant, TSG, Ed.CIL
25. Ms. Anshu, Consultant, TSG, Ed.CIL
26. Ms. Kiran Dogra, TSG, Ed.CIL
27. Dr. R.N. Lenka, Consultant, TSG, Ed.CIL
28. Alka Mishra, Chief Consultant, TSG, Ed.CIL
1
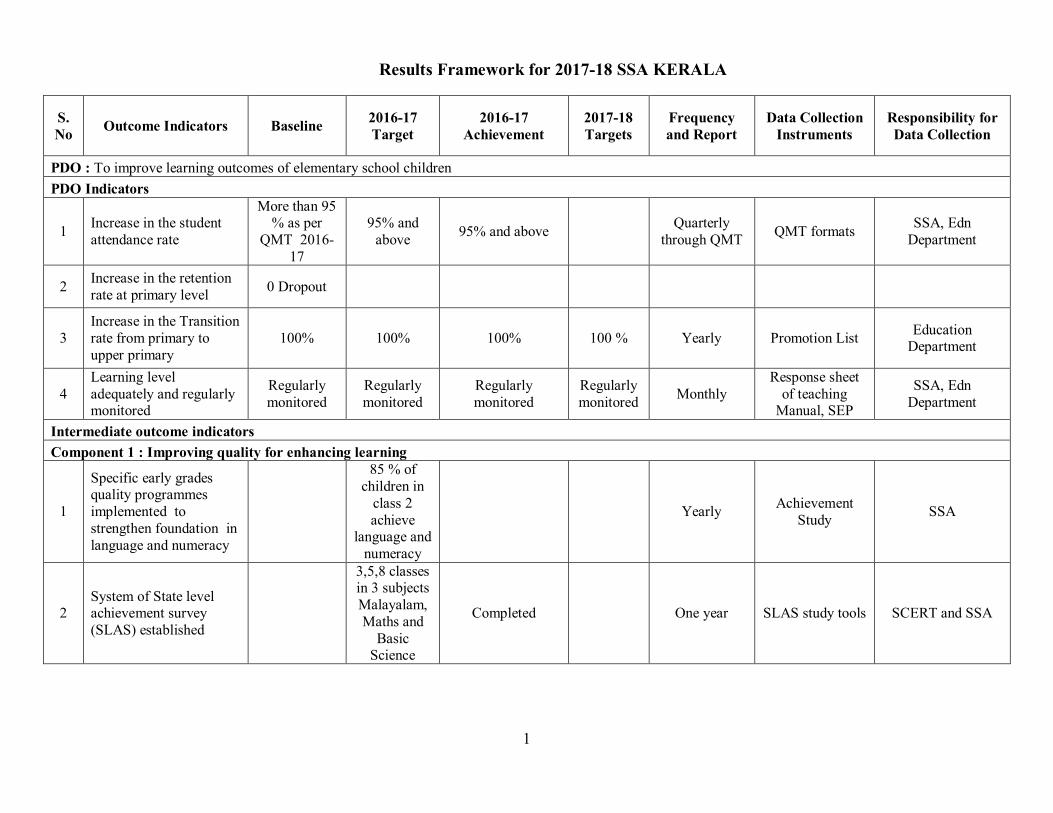
Results Framework for 2017-18 SSA KERALA
S. No Outcome Indicators Baseline 2016-17
Target 2016-17
Achievement 2017-18 Targets
Frequency and Report
Data Collection Instruments
Responsibility for Data Collection
PDO : To improve learning outcomes of elementary school children PDO Indicators
1 Increase in the student attendance rate
More than 95 % as per
QMT 2016-17
95% and above 95% and above
Quarterly through QMT QMT formats SSA, Edn
Department
2 Increase in the retention rate at primary level 0 Dropout
3 Increase in the Transition rate from primary to upper primary
100% 100% 100% 100 % Yearly Promotion List Education Department
4 Learning level adequately and regularly monitored
Regularly monitored
Regularly monitored
Regularly monitored
Regularly monitored Monthly
Response sheet of teaching
Manual, SEP
SSA, Edn Department
Intermediate outcome indicators Component 1 : Improving quality for enhancing learning
1
Specific early grades quality programmes implemented to strengthen foundation in language and numeracy
85 % of children in
class 2 achieve
language and numeracy
Yearly Achievement Study SSA
2 System of State level achievement survey (SLAS) established
3,5,8 classes in 3 subjects Malayalam, Maths and
Basic Science
Completed One year SLAS study tools SCERT and SSA
2
S. No Outcome Indicators Baseline 2016-17
Target 2016-17
Achievement 2017-18 Targets
Frequency and Report
Data Collection Instruments
Responsibility for Data Collection
3
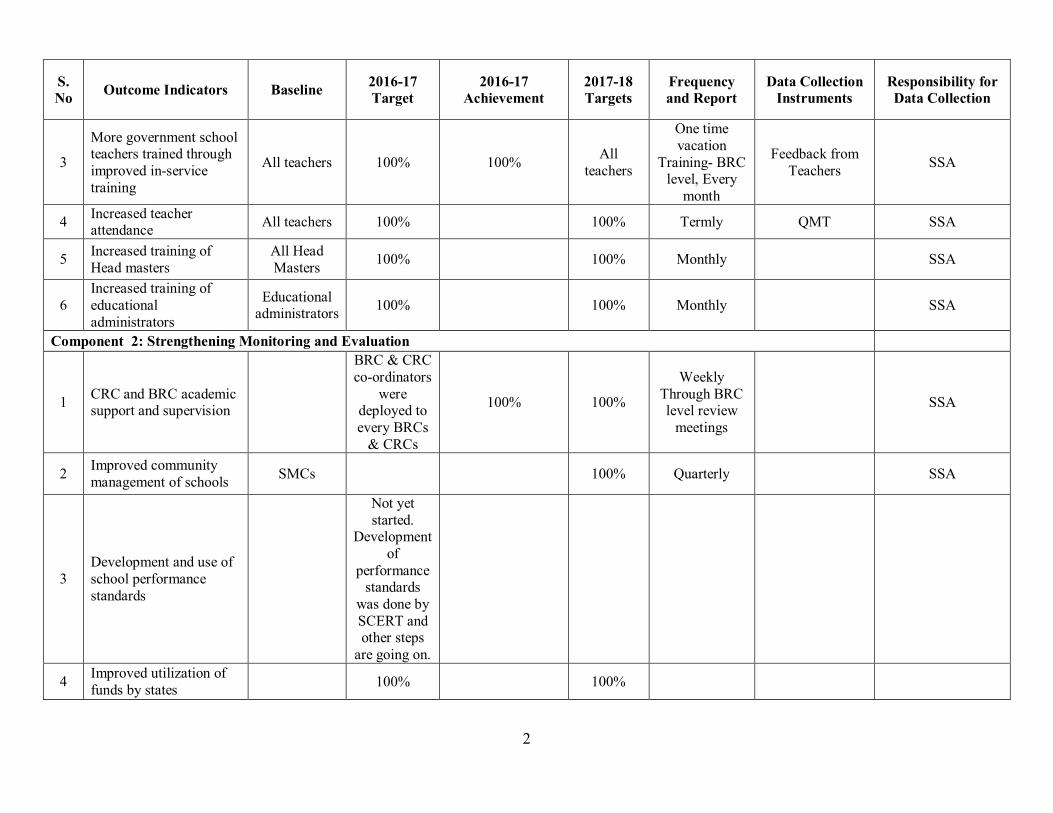
More government school teachers trained through improved in-service training
All teachers 100% 100% All teachers
One time vacation
Training- BRC level, Every
month
Feedback from Teachers SSA
4 Increased teacher attendance All teachers 100% 100% Termly QMT SSA
5 Increased training of Head masters
All Head Masters 100% 100% Monthly SSA
6 Increased training of educational administrators
Educational administrators 100% 100% Monthly SSA
Component 2: Strengthening Monitoring and Evaluation
1 CRC and BRC academic support and supervision
BRC & CRC co-ordinators
were deployed to every BRCs
& CRCs
100% 100%
Weekly Through BRC level review
meetings SSA
2 Improved community management of schools SMCs 100% Quarterly SSA
3 Development and use of school performance standards
Not yet started.
Development of
performance standards
was done by SCERT and other steps
are going on.
4 Improved utilization of funds by states 100% 100%
3
S. No Outcome Indicators Baseline 2016-17
Target 2016-17
Achievement 2017-18 Targets
Frequency and Report
Data Collection Instruments
Responsibility for Data Collection
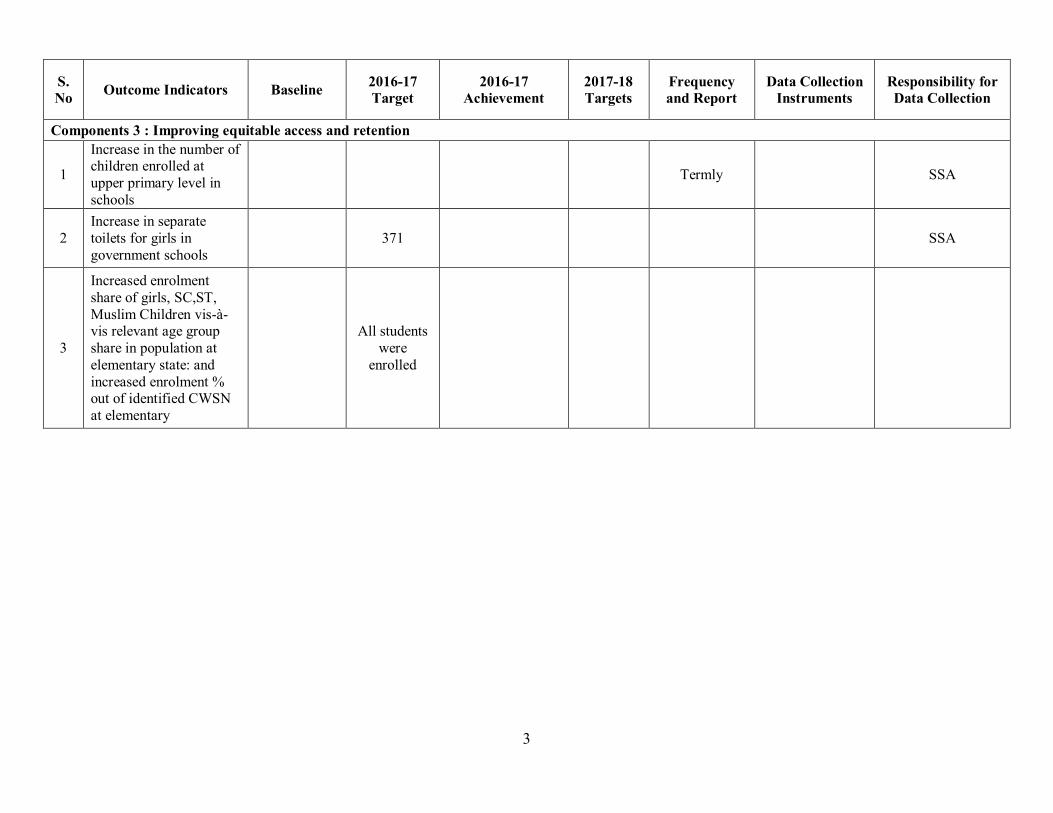
Components 3 : Improving equitable access and retention
1
Increase in the number of children enrolled at upper primary level in schools
Termly SSA
2 Increase in separate toilets for girls in government schools 371 SSA
3
Increased enrolment share of girls, SC,ST, Muslim Children vis-à-vis relevant age group share in population at elementary state: and increased enrolment % out of identified CWSN at elementary
All students were
enrolled
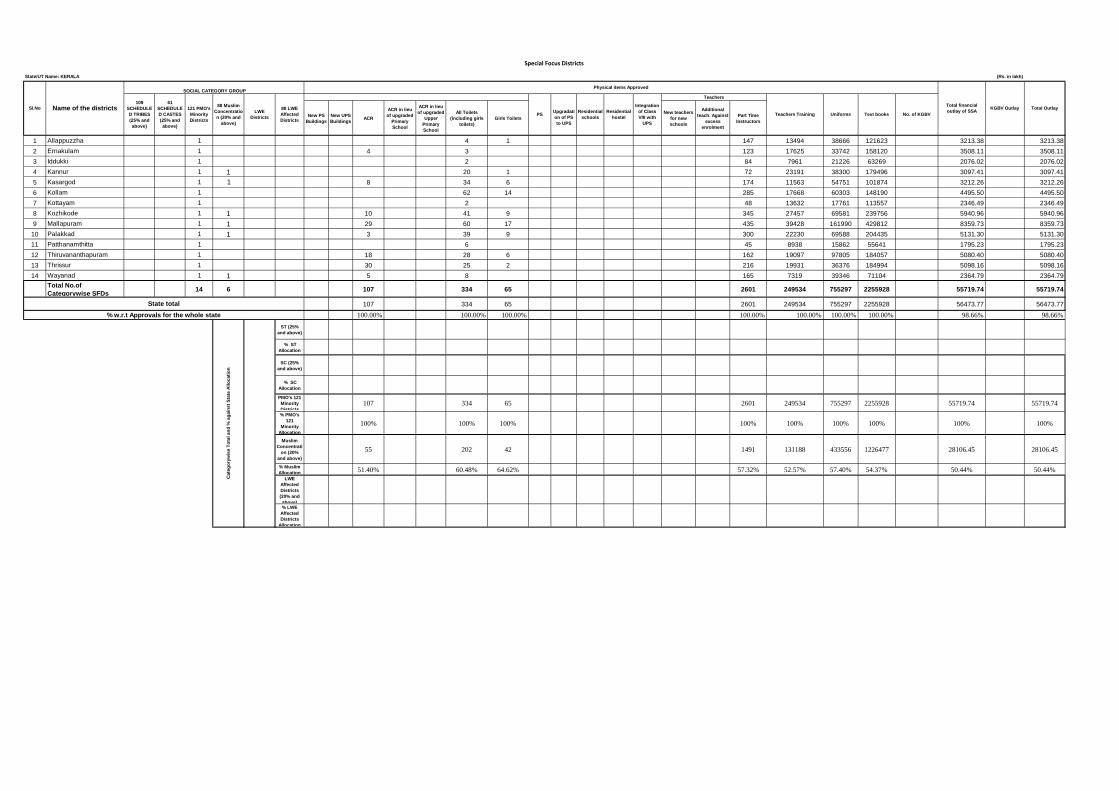
Special Focus Districts
New PS
Buildings
New UPS
BuildingsACR
ACR in lieu
of upgraded
Primary
School
ACR in lieu
of upgraded
Upper
Primary
School
All Toilets
(including girls
toilets)
Girls Toilets
New teachers
for new
schools
Additional
teach. Against
excess
enrolment
Part Time
Instructors
1 Allappuzzha 1 4 1 147 13494 38666 121623 3213.38 3213.38
2 Ernakulam 1 4 3 123 17625 33742 158120 3508.11 3508.11
3 Iddukki 1 2 84 7961 21226 63269 2076.02 2076.02
4 Kannur 1 1 20 1 72 23191 38300 179496 3097.41 3097.41
5 Kasargod 1 1 8 34 6 174 11563 54751 101874 3212.26 3212.26
6 Kollam 1 62 14 285 17668 60303 148190 4495.50 4495.50
7 Kottayam 1 2 48 13632 17761 113557 2346.49 2346.49
8 Kozhikode 1 1 10 41 9 345 27457 69581 239756 5940.96 5940.96
9 Mallapuram 1 1 29 60 17 435 39428 161990 429812 8359.73 8359.73
10 Palakkad 1 1 3 39 9 300 22230 69588 204435 5131.30 5131.30
11 Patthanamthitta 1 6 45 8938 15862 55641 1795.23 1795.23
12 Thiruvananthapuram 1 18 28 6 162 19097 97805 184057 5080.40 5080.40
13 Thrissur 1 30 25 2 216 19931 36376 184994 5098.16 5098.16
14 Wayanad 1 1 5 8 165 7319 39346 71104 2364.79 2364.79
Total No.of
Categorywise SFDs 14 6 107 334 65 2601 249534 755297 2255928 55719.74 55719.74
107 334 65 2601 249534 755297 2255928 56473.77 56473.77
100.00% 100.00% 100.00% 100.00% 100.00% 100.00% 100.00% 98.66% 98.66%
ST (25%
and above)
% ST
Allocation
SC (25%
and above)
% SC
Allocation
PMO's 121
Minority
Districts107 334 65 2601 249534 755297 2255928 55719.74 55719.74
% PMO's
121
Minority
Allocation
100% 100% 100% 100% 100% 100% 100% 100% 100%
Muslim
Concentrati
on (20%
and above)
55 202 42 1491 131188 433556 1226477 28106.45 28106.45
% Muslim
Allocation 51.40% 60.48% 64.62% 57.32% 52.57% 57.40% 54.37% 50.44% 50.44%
LWE
Affected
Districts
(20% and
above)% LWE
Affected
Districts
Allocation
Total Outlay
State total
% w.r.t Approvals for the whole state
Cate
go
ryw
ise T
ota
l an
d %
ag
ain
st
Sta
te A
llo
cati
on
Integration
of Class
VIII with
UPS
Teachers109
SCHEDULE
D TRIBES
(25% and
above)
61
SCHEDULE
D CASTES
(25% and
above)
121 PMO's
Minority
Districts
88 Muslim
Concentratio
n (20% and
above)
LWE
Districts
88 LWE
Affected
Districts
PS
Upgradati
on of PS
to UPS
State/UT Name: KERALA (Rs. in lakh)
Sl.No Name of the districts
SOCIAL CATEGORY GROUPPhysical items Approved
Total financial
outlay of SSA KGBV Outlay
Residential
schools
Residential
hostelTeachers Training Uniforms Text books No. of KGBV