Minnesota Part C Federal Fiscal Year 2016 State ...
45
Minnesota Part C Federal Fiscal Year 2016 State Performance Plan/Annual Performance Report Fiscal year 2018 Report to the Legislature As required by Minnesota Statutes, section 125A.28 This document is made available electronically by the Minnesota Legislative Reference Library as part of an ongoing digital archiving project. http://www.leg.state.mn.us/lrl/lrl.asp
Transcript of Minnesota Part C Federal Fiscal Year 2016 State ...

Minnesota Part C Federal Fiscal Year 2016 State Performance Plan/Annual Performance Report
Fiscal year 2018 Report to the Legislature
As required by Minnesota Statutes, section 125A.28
This document is made available electronically by the Minnesota Legislative Reference Library as part of an ongoing digital archiving project. http://www.leg.state.mn.us/lrl/lrl.asp

For more information:
Lisa Backer Early Learning Services Minnesota Department of Education 1500 Highway 36 West Roseville, MN 55113 (651) 582-8473 [email protected] education.mn.gov
As requested by Minnesota Statutes, section 3.197: This report cost approximately $1646.00 to prepare, including staff time, printing and mailing expenses.
Upon request, this material will be made available in an alternative format such as large print, braille or audio
recording. Printed on recycled paper.
Legislative Charge
Minnesota Statutes, section 125A.28:
Annually, the council must prepare and submit a report to the governor and the secretary of the federal Department of Education on the status of early intervention services and programs for infants and toddlers with disabilities and their families under the Individuals with Disabilities Education Act, United States Code, title 20, sections 1471 to 1485 (Part C, Public Law 102-119), as operated in Minnesota. The Minnesota Part C annual performance report may serve as the report.
Executive Summary
Overall, the FFY 2016 Annual Performance Report documents the ongoing strength of Minnesota's system of early intervention provided under Part C of the Individuals with Disabilities Education Act (IDEA). The state's performance on four of five compliance measures was 100 percent with the remaining indicator being above 95 percent. Progress was made on four of six child outcome measures although no targets were met. Year to year progress was measured on three of three family outcomes. Child find continues to be an area of strength. Minnesota made progress on both child find measures and met the established target for the identification of infants and toddlers birth through age 2. Serving children in the natural environments is also a strength of the system as the state consistently services more than 95 percent in these setting.
General Supervision System
(The systems that are in place to ensure that IDEA Part C requirements are met, e.g., monitoring systems, dispute resolution systems.)

FFY 2016 State Performance Plan/Annual Performance Report 3
The Minnesota Department of Education (MDE) administers a comprehensive system of general supervision including special education program and fiscal compliance monitoring, special education complaints, due process hearings and alternative dispute resolution options for parents, districts and other stakeholders in the special education and early intervention systems.
Program monitoring provides general supervision and oversight of special education and early intervention programs using the Minnesota Continuous Improvement Monitoring Process (MNCIMP). MNCIMP is the vehicle for MDE’s Division of Compliance and Assistance program monitoring unit to ensure a free appropriate public education (FAPE) is available for children with disabilities beginning at birth.
Each special education administrative unit (SEAU) is monitored for compliance through MDE’s MNCIMP web-based data system, which gathers data from early intervention records reviewed. Compliance monitoring takes place on a six-year cycle. In year one of the cycle, the SEAU conducts a self-review of records. A computer-generated sample is used to select the records to be reviewed from the most recent SEAU enrollment data chosen to accurately represent the SEAU as a whole. Selection is based on a stratified random sampling with consideration given to race/ethnicity, age, gender, and primary disability. During the record review process, the most current Individual Family Service Plan (IFSP) and corresponding due process documentation are reviewed for compliance with legal standards. In year two, the SEAU must demonstrate correction of any noncompliance identified in the self-review consistent with the requirements of Office of Special Education Program (OSEP) Memo 09-02.
In year three of the cycle, MDE conducts an on-site review of the SEAU including a review of early intervention records (following the same process for record selection as used in year one). Stakeholder input is gathered from early intervention service providers, parents and administrators. Data gathered from the various stakeholders helps to determine compliance within the district as well as identify areas of needed technical assistance.
In year four of the cycle, the SEAU must demonstrate correction of noncompliance identified during the MDE review and implement any corrective action, again consistent with the requirements of OSEP Memo 09-02. The fifth year of the cycle is used to verify results of the implemented corrective action plan. In any given year, data is collected through the self-review of records for 20 percent of the local programs in Minnesota. In the sixth year, an SEAU that has met all requirements has no formal monitoring obligations.
Fiscal monitors from MDE’s Fiscal Monitoring Team work to ensure that Part C funds are used only to serve eligible children and are administered under appropriate internal controls in the SEAU. Fiscal monitoring and program monitoring teams follow the same five-year schedule with the exception that there is no self-review process in fiscal monitoring. Annually, a risk assessment is completed in order to determine if an SEAU will receive an onsite review or one of two types of desk reviews. Once the SEAUs have been striated into their appropriate risk category, the fiscal monitors utilize the Electronic Data Reporting System (EDRS) and the Minnesota Automated Reporting Student System (MARSS) to pick samples related to time and effort, procurement, and transportation. Additionally, information is requested from the SEAUs for inventory management. Each of the three levels of review request additional samples, more documentation, and monitor additional details of the data as the SEAU progresses higher in risk.

FFY 2016 State Performance Plan/Annual Performance Report 4
Corrective action by the local program, as needed, takes place in the year following a fiscal monitoring. Corrective action may include documenting processes, changing documents so they contain appropriate data, or making corrections within the EDRS or MARSS systems so data entered is accurate. MDE also reserves the right to reclaim funds should it be deemed funds were used for ineligible purposes.
Finally, the fiscal monitoring team receives fiscally based complaints and conducts investigations as necessary. When complaints come in to the agency, the investigation is led by the supervisor of this group but is also assigned to a monitor to assist. A complaint can be filed about any entity that provides publicly funded intervention services directly to families and children with disabilities that has violated a state or federal special education law or rule. Before filing a complaint, MDE encourages parents or other persons to first contact the school district’s special education director, who may be able to help resolve the issue.
Once a fiscal investigation is opened, the entity is notified and provided a short timeline to provide requested documentation based on the nature of the complaint. Interviews with staff may be conducted, if necessary, and an on-site visit may occur. If the LEA is found to be in violation and a corrective action is deemed necessary, a corrective action plan is developed and the responsible education agencies must complete the corrective action within the specified timeframe. Through active follow-up, MDE ensures that July 2, 2018, corrective action plans are appropriately implemented and individual correction occurs within one year.
As noted, MDE administers a comprehensive dispute resolution system for the state. Minnesota Special Education Mediation Service (MNSEMS) provides conflict resolution assistance for students, schools, parents and agencies. Parents and program staff can use mediation or facilitated IFSP meeting(s) to address issues of conflict. During the summer of 2014, MDE’s Special Education Alternative Dispute Resolutions (ADR) Services conducted a continuous improvement process involving internal and external stakeholders, examined its procedures, and made changes to improve ADR’s efficiency and effectiveness. Some changes included submission of requests online, faster online scheduling, automated emails, and the development of a vision of success for parents, older students, and educators.
Parents and districts are entitled to an impartial due process hearing to resolve disputes over identification, evaluation, education placement, or provision of a free appropriate public education to an infant, toddler or student with a disability. Parents and districts are encouraged to use mediation, conciliation or some other mutually agreed upon alternative before proceeding to a hearing.
Information about the hearing system is available on the MDE website including a Hearing Request form, information on free or low-cost legal resources and Minnesota’s procedural safeguards notice. While the majority of due process hearing requests are settled or resolved without a hearing, MDE continues to work with the Office of Administrative Hearings, who conducts the hearings, districts, and parent advocates to educate parents and districts on their rights and responsibilities regarding due process hearing resolution sessions. Through these efforts, district participation in documenting the occurrence of the resolution sessions has increased by 100 percent. In addition, MDE is obtaining more accurate data regarding when the sessions are held and the results of the resolution session.

FFY 2016 State Performance Plan/Annual Performance Report 5
The special education complaint system is designed to ensure that all children with disabilities, including infants and toddlers, are provided a free appropriate public education. A complaint can be filed about any entity that provides publicly funded intervention services directly to families and children with disabilities that has violated a state or federal special education law or rule. Before filing a complaint, MDE encourages parents or other persons to first contact the school district’s special education director, who may be able to help resolve the issue. Sample complaint forms for use by parents, other entities or private school stakeholders are available on the MDE website.
When MDE receives a complaint, an investigator is assigned who reviews the written complaint to determine the issues to be investigated. The individual or entity that filed the complaint is contacted and the issues, claims and facts are discussed. MDE has 60 calendar days to fully investigate and resolve the complaint from the date the complaint is received in writing. If the LEA is found to be in violation and a corrective action is deemed necessary, a corrective action plan is developed and the responsible education agencies must complete the corrective action within the specified timeframe. Through active follow-up, MDE ensures that corrective action plans are appropriately implemented and individual correction occurs within one year.
Compliance and Assistance staff collaborates with other departmental divisions regarding the provision of early intervention and special education services.
Technical Assistance System
(The mechanisms that the State has in place to ensure the timely delivery of high-quality, evidenced-based technical assistance and support to early intervention service (EIS) programs.)
The Early Childhood Special Education (ECSE) Team at the Minnesota Department of Education believes their role is to support local programs to "do it right and do it well" so that infants, toddlers and young children with disabilities and their families experience positive outcomes. "Doing it right" refers to those aspects of the work where there is a generally agreed-upon right way and wrong way. "Doing it well" refers to efforts to achieve high levels of quality including the use of evidence-based practices. Our technical assistance (TA) efforts are our efforts to help programs do it right.
MDE uses a variety of mechanisms to provide technical assistance to leaders and providers within early childhood special education programs, which are responsible to deliver early intervention services. Our website is a constant source of information for families, administrators and direct service providers. MDE hosts two face-to-face opportunities annually to provide TA to local program leaders. Each fall, a three-day leadership conference is held in partnership with the Minnesota Division for Early Childhood within the Council for Exceptional Children. A one-day leadership forum is held each spring. Leaders from greater Minnesota have the option to participate in the forum virtually. A monthly call is held for program leaders focused almost exclusively on TA. The call takes place the first Wednesday of each month at 1 p.m., which coincides with our state's civil defense drills. Our local leaders know "if the siren is blowing" they should be on the call. Members of the ECSE team provide individualized TA over the phone or on-site as needed or requested by a local program. MDE has established a team email box, [email protected], to make it easier for local programs to consistently

FFY 2016 State Performance Plan/Annual Performance Report 6
receive a timely, high quality answer to their technical questions. Kara Tempel, our Part C coordinator, triages all messages to this mailbox, forwarding each message to the team member with the deepest knowledge in the needed subject.
Strengthening our professional development system has been a team priority for the past seven years. During that time, we have benefited considerably from participation in several important federal initiatives.
1. National Professional Development Center on Inclusion (NPDCI): Minnesota was one of four states selected to work with experts from the University of North Carolina at Chapel Hill. This opportunity helped us establish a cross-sector state leadership team, create regional cross-sector professional development councils and launch regionalized professional development focused on selected evidence-based practices.
2. Technical Assistance Center on Social Emotional Intervention (TACSEI): Minnesota was one of four states selected to be supported to implement the practices of the pyramid model. We started with three demonstration sites and are now implementing in 53 local programs.
3. State Implementation and Scaling-up of Evidence-based Practices (SISEP): Minnesota was one of six states selected to participate in the initial cohort. Karen Blase has provided the ECSE team with considerable guidance and support in refining and refocusing our professional development system. The frameworks of active implementation are foundational to our enhanced professional development system.
4. Early Childhood Technical Assistance Center: Minnesota was the first state selected to receive targeted technical assistance to implement the revised Recommended Practices developed by the Division of Early Childhood of the Council for Exceptional Children. Commonly referred to as DEC's Recommended Practices, this work is focused on those practices that support child and family engagement in intervention.
5. Early Childhood Personnel Center (ECPC): Minnesota's Part C and 619 Coordinators have been supported by ECPC related to their personal professional development. Minnesota is now receiving intensive technical support from ECPC to engage stakeholders in the development of our Comprehensive System of Personnel Development.
6. DaSY: Minnesota's ECSE team has participated in two cohorts sponsored by DaSY. The first is the Powerful 619 Data cohort, which because of our state's 0-5 system, has equally benefitted Part C. We have also participated in TA to better support local programs to use data.
Our professional development system is referred to as the Centers of Excellence for Young Children with Disabilities (CoE). The stated vision of the CoE is that early childhood professionals will have the knowledge, skills and supports necessary to be effective in their respective roles in order to increase the probability that young children with disabilities and their families achieve positive outcomes. The CoE includes these structural components:
Professional Development Facilitators located within each region of the state. The 10.0 FTE of individuals in this role actively partner with local program leaders to identify opportunities to improve quality and serve as the external coach to those programs implementing one of the three evidence-based usable interventions formally promoted through the CoE.

FFY 2016 State Performance Plan/Annual Performance Report 7
State Leadership Team of cross-sector state agency personnel, higher education faculty, parents, and other stakeholders in the system.
Consistent use of the frameworks of active implementation. Three usable interventions that are evidence-informed. These include the Pyramid Model (TACSEI),
Family-guided Routines-based Intervention (FGRBI), and the Classroom Engagement Model.
During FFY16 we continued to target discretionary federal funds to support local programs committing to the implementation of one of three usable interventions. The funds are available to selected programs over a five-year period to eliminate identified barriers to scaling and sustaining use of these practices. We also focused, as described in our Phase III SSIP, on developing a more integrated data system that incorporates coaching and fidelity data from the CoE with child outcome data.
Stakeholder Involvement
A workgroup was convened to review data and develop preliminary targets prior to our FFY 13 APR submission. That workgroup was comprised of volunteer members of Minnesota’s Interagency Coordinating Council (ICC) and state agency staff from the Minnesota Departments of Health and Education. That group reviewed historical performance and target data for each indicator and discussed past contextual factors that helped or hindered the state’s effort to meet or exceed each target. The group also identified factors that might similarly help or hinder the state’s efforts to make progress from baseline for each indicator. From those discussions, preliminary targets were set for each indicator for each year included within the State Performance Plan (SPP). MDE shared preliminary targets with local program leaders during a monthly leadership call and with the ICC during a quarterly meeting. The ICC finalized each target through a vote during its quarterly meeting on January 8, 2015.
The ICC has similarly reviewed performance and targets for each of the three subsequent APR submissions; most recently on January 12, 2018. No revisions to targets were considered. Instead, we are focusing at the state and local program levels on year-to-year improved performance.
Reporting to the Public
(How and where the state reported to the public on the FFY 2015 performance of each EIS program or provider located in the state on the targets in the SPP/APR as soon as practicable, but no later than 120 days following the state’s submission of its FFY 2015 APR, as required by 34 CFR § 303.702(b)(1)(i)(A); and a description of where, on its website, a complete copy of the state’s SPP, including any revision if the state has revised the SPP that it submitted with its FFY 2015 APR in 2017, is available.)
MDE makes an annual determination on the performance of each Special Education Administrative Unit (SEAU) against specific criteria. The department reviews all SEAU performance against selected targets in the Annual Performance Report (APR) and determines whether each SEAU meets the requirements of Part C of the Individuals with Disabilities Education Act (IDEA).
MDE publicly reports the performance of each SEAU by member district in its Data Center website under the Special Education District Profiles section. Performance on Part C indicators 1-8 is displayed on a data sheet that

FFY 2016 State Performance Plan/Annual Performance Report 8
includes the program performance, the state rate and the state target. These district data profiles can be found on the MDE website. (http://w20.education.state.mn.us/MDEAnalytics/Data.jsp)
A complete copy of Minnesota's SPP and current APR are located on MDE’s website on the landing page for the Governor's Interagency Coordinating Council. (https://education.mn.gov )
OSEP Response
States were instructed to submit Phase III Year Two of the State Systemic Improvement Plan (SSIP) by April 2, 2018. The state provided the required information.
In the FFY 2017 APR, the State must report FFY data for the State-identified Measurable Result (SiMR). Additionally, the State must, consistent with its evaluation plan described in Phase II, assess and report on its progress implementing the SSIP. Specifically, the state must provide:
1. a narrative or graphic representation of the principal activities; 2. measures and outcomes that were implemented since the state's last SSIP submission (i.e., April 2,
2018); and, 3. a summary of the infrastructure improvement strategies and evidence-based practices that were
implemented and progress toward short- and long-term outcomes that are intended to impact the State-identified Measurable Result (SiMR).
Indicator 1: Timely provision of services
Monitoring priority: Early Intervention Services in Natural Environments
Compliance Indicator: Percent of infants and toddlers with Individualized Family Service Plans (IFSPs) who receive services on their IFSPs in a timely manner.
(20 U.S.C. 1416(a)(3)(A) and 1442)
Historical Data
Baseline Data: 2005
FFY 2004 2005 2006 2007 2008 2009 2010 2011 2012 2013 2014 2015
Target No data No data
100% 100% 100% 100% 100% 100% 100% 100% 100% 100%
Data Prior to baseline
91% 98.8% 98% 99.4% 98.8% 98% 99.75% 100% 100% 100% 100%

FFY 2016 State Performance Plan/Annual Performance Report 9
FFY 2016-FFY 2018 Targets
FFY 2016 2017 2018
Target 100% 100% 100%
FFY 2016 SPP/APR Data
Number of infants and toddlers with IFSPs Total number of FFY 2015 FFY 2016 FFY 2016 who receive the early intervention infants and Data Target Data
services on their IFSPs in a timely manner toddlers with IFSPs
206 206 100% 100% 100%
Number of documented delays attributable to exceptional family circumstances: 0
At the September 2005 meeting of the State Interagency Coordinating Council, the council defined “timely” for the purpose of this State Performance Plan to mean that IFSP services begin not more than 30 calendar days following the initial IFSP team meeting.
What is the source of this data provided for this indicator? State Monitoring
Describe the method used to select EIS programs for monitoring:
Data for this indicator has been collected through MDE’s Minnesota Continuous Improvement Monitoring Process (MNCIMP) web-based data system. The MNCIMP web-based data system is used in part for gathering data from record reviews completed as part of compliance monitoring. Compliance monitoring of Early Intervention (EI) programs occurs through the monitoring of the local education agencies (LEAs) through special education administrative units (SEAUs) which has been scheduled on a five-year cycle, but in FFY 2015 MDE moved to a six year monitoring cycle. In year one of the cycle, the SEAU conducts a self-review of records. In year two, the SEAU must demonstrate correction of any noncompliance identified in the self-review consistent with the requirements of OSEP Memo 09-02. In year three, MDE conducts an on-site review of the SEAU including a review of student records, facilities, and the SEAU’s Total Special Education System (TSES). In year four of the cycle, the SEAU must demonstrate correction of noncompliance identified during the MDE review and implement any corrective action, again consistent with the requirements of OSEP Memo 09-02. The fifth year of the cycle is used to verify results of the implemented corrective action plan. The sixth year of the cycle provides an additional year for SEAUs to implement corrective action and changes to their systems prior to the start of the new monitoring cycle and self-review of records.
FFY 2016 State Performance Plan/Annual Performance Report 10
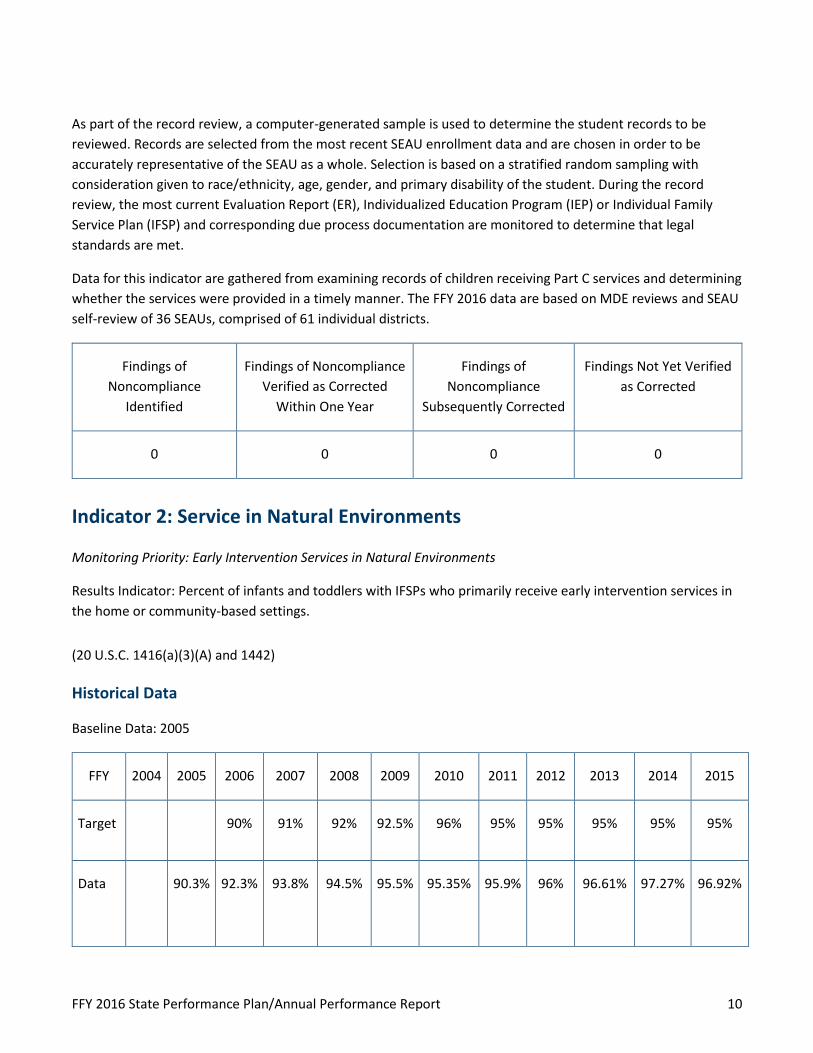
As part of the record review, a computer-generated sample is used to determine the student records to be reviewed. Records are selected from the most recent SEAU enrollment data and are chosen in order to be accurately representative of the SEAU as a whole. Selection is based on a stratified random sampling with consideration given to race/ethnicity, age, gender, and primary disability of the student. During the record review, the most current Evaluation Report (ER), Individualized Education Program (IEP) or Individual Family Service Plan (IFSP) and corresponding due process documentation are monitored to determine that legal standards are met.
Data for this indicator are gathered from examining records of children receiving Part C services and determining whether the services were provided in a timely manner. The FFY 2016 data are based on MDE reviews and SEAU self-review of 36 SEAUs, comprised of 61 individual districts.
Findings of Noncompliance
Identified
Findings of Noncompliance Verified as Corrected
Within One Year
Findings of Noncompliance
Subsequently Corrected
Findings Not Yet Verified as Corrected
0 0 0 0
Indicator 2: Service in Natural Environments
Monitoring Priority: Early Intervention Services in Natural Environments
Results Indicator: Percent of infants and toddlers with IFSPs who primarily receive early intervention services in the home or community-based settings.
(20 U.S.C. 1416(a)(3)(A) and 1442)
Historical Data
Baseline Data: 2005
FFY 2004 2005 2006 2007 2008 2009 2010 2011 2012 2013 2014 2015
Target No data
No data
90% 91% 92% 92.5% 96% 95% 95% 95% 95% 95%
Data Prior to
baseline
90.3% 92.3% 93.8% 94.5% 95.5% 95.35% 95.9% 96% 96.61% 97.27% 96.92%

FFY 2016 State Performance Plan/Annual Performance Report 11
FFY 2016-FFY 2018 Targets
FFY 2016 2017 2018
Target 95% 95% 95%
Prepopulated Data
Source Date Description Data Overwrite Data
SY 2016-17 Child Count/Educational Environment
Data Groups
7/12/2017 Number of infants and toddlers with IFSPs who primarily receive early
intervention services in the home or community-based settings
5,604 No data
SY 2016-17 Child Count/Educational Environment
Data Groups
7/12/2017 Total number of infants and toddlers with IFSPs
5,736 No data
FFY 2016 SPP/APR Data
Number of infants and toddlers with IFSPs who primarily receive early
intervention services in the home or community-based settings
Total number of infants and
toddlers with IFSPs
FFY 2015 Data*
FFY 2016 Target*
FFY 2016 Data
5,604 5,736 96.92% 95% 97.7%
No actions were required in the FFY 2015 response.

FFY 2016 State Performance Plan/Annual Performance Report 12
Indicator 3: Early Childhood Outcomes
Monitoring Priority: Early Intervention Services in Natural Environments
Results Indicator: Percent of infants and toddlers with IFSPs who demonstrate improved:
A. Positive social-emotional skills (including social relationships); B. Acquisition and use of knowledge and skills (including early language/communication); and C. Use of appropriate behaviors to meet their needs.
(20 U.S.C. 1416(a)(3)(A) and 1442)
Does your State’s Part C eligibility criteria include infants and toddlers who are at risk of having substantial developmental delays (or “at risk infants and toddlers”) under IDEA section 632(5)(B)(i)? No.
Historical Data
Baseline Data: 2013

FFY 2016 State Performance Plan/Annual Performance Report 13
Indicator FFY 2008 2009 2010 2011 2012 2013 2014 2015
A1 Target ≥ No data 66% 64% 65% 66% 54.13% 54.20% 54.30%
A1 Data 64.10% 63.80% 63% 58.8% 57.7% 54.13% 51.17% 50.87%
A2 Target ≥ No data 41% 42% 42.5% 43% 49.82% 47.51% 51%
A2 Data 40.40% 42.20% 44% 48.3% 49.5% 49.82% 47.51% 50.87%
B1 Target ≥ No data 70% 66% 67% 68% 60.20% 60.30% 60.40%
B1 Data 68.20% 65.1% 65% 62.5% 61.2% 60.2% 57.16% 57.32%
B2 Target ≥ No data 42% 43% 43.5% 44% 44.11% 44.5% 45%
B2 Data 40.70% 42.2% 41% 43.4% 45.1% 44.11% 41.67% 43.28%
C1 Target ≥ No data 70% 68% 69% 70% 61.91% 59.60% 62.10%
C1 Data 68% 67.3% 66% 64% 62.7% 61.91% 59.60% 58.28%
C2 Target ≥ No data 44% 45% 45.5% 46% 51.26% 51.50% 52%
C2 Data 42.70% 44.2% 46% 49.2% 49.7% 51.26% 49.83% 50.14%
FFY 2016 – FFY 2018 Targets
FFY 2016 2017 2018
Target A1 ≥ 54.4% 54.5% 54.6%
Target A2 ≥ 52% 53% 54%

FFY 2016 State Performance Plan/Annual Performance Report 14
FFY 2016 2017 2018
Target B1 ≥ 60.5% 60.6% 60.7%
Target B2 ≥ 45.5% 46.5% 47.5%
Target C1 ≥ 62.2% 62.3% 62.4%
Target C2 ≥ 53% 54% 55%
FFY 2016 SPP/APR Data
Number of infants and toddlers with IFSPs assessed: 3069
Outcome A: Positive social-emotional skills (including social relationships)
Progress Category Number of Children
Percentage of Children
a. Infants and toddlers who did not improve functioning 54 1.76%
b. Infants and toddlers who improved functioning but not sufficient to move nearer to functioning comparable to same-aged peers
1053 34.31%
c. Infants and toddlers who improved functioning to a level nearer to same-aged peers but did not reach it
422 13.75%
d. Infants and toddlers who improved functioning to reach a level comparable to same-aged peers
648 21.11%
e. Infants and toddlers who maintained functioning at a level comparable to same-aged peers
892 29.06%

FFY 2016 State Performance Plan/Annual Performance Report 15
No data
Numerator Denominator FFY 2015 Data*
FFY 2016
Target*
FFY 2016 Data
A1. Of those children who entered or exited the program below age expectations in Outcome A, the percent who substantially increased their rate of growth by the time they turned 3 years of age or exited the program (c+d)/(a+b+c+d+e)
1070 2177 50.87% 54.40% 49.15%
A2. The percent of infants and toddlers who were functioning within age expectations in Outcome A by the time they turned 3 years of age or exited the program (d+e)/(a+b+c+d+e)
1540 3069 48.84% 52% 50.18%
Reasons for A1 Slippage
Comprehensive analysis of the FFY 16 data was made and compared with similar analysis conducted using FFY 15 data. Analysis compared groups of children by rate of poverty, primary disability category, race/ethnicity and home language. No significant differences in performance was identified.
One notable difference is the slight increase in the proportion of children rated as demonstrating some age-expected skills at the time of entry (COS ratings of 4 and 5) in FFY 16 compared to prior years. Children rated as a 5 at entry are less likely than children rated as 1-4 or 6 to show an increase in their child outcome summary rating at exit.
Minnesota also used the Meaningful Differences calculator developed by the Early Childhood Technical Assistance (ECTA) Center for comparing a state's year-to-year performance. This calculator showed that Minnesota's performance in FFY16 is not meaningfully lower than that in FFY 15.
Outcome B. Acquisition and use of knowledge and skills (including early language/communication)
Progress Category Number of Children
Percentage of Children
a. Infants and toddlers who did not improve functioning 43 1.40%

FFY 2016 State Performance Plan/Annual Performance Report 16
Progress Category Number of Children
Percentage of Children
b. Infants and toddlers who improved functioning but notsufficient to move nearer to functioning comparable to same-aged peers
1014 33.04%
c. Infants and toddlers who improved functioning to a level nearerto same-aged peers but did not reach it
649 21.15%
d. Infants and toddlers who improved functioning to reach a levelcomparable to same-aged peers but did not reach it
858 27.96%
e. Infants and toddlers who maintained functioning at a levelcomparable to same-aged peers
505 16.45%
No data Numerator Denominator FFY 2015 Data*
FFY 2016 Target*
FFY 2016 Data
B1. Of those children who entered or exited the program below age expectations in Outcome A, the percent who substantially increased their rate of growth by the time they turned 3 years of age or exited the program (c+d)/(a+b+c+d+e)
1507 2564 57.32% 60.50% 58.78%
B2. The percent of infants and toddlers who were functioning within age expectations in Outcome A by the time they turned 3 years of age or exited the program (d+e)/(a+b+c+d+e)
1363 3069 43.28% 45.50% 44.41%

FFY 2016 State Performance Plan/Annual Performance Report 17
Outcome C. Use of appropriate behaviors to meet their needs
Progress Category Number of Children
Percentage of Children
a. Infants and toddlers who did not improve functioning 45 1.47%
b. Infants and toddlers who improved functioning but not sufficient to move nearer to functioning comparable to same-aged peers
962 31.35%
c. Infants and toddlers who improved functioning to a level nearer to same-aged peers but did not reach it
502 16.36%
d. Infants and toddlers who improved functioning to reach a level comparable to same-aged peers but did not reach it
890 29%
e. Infants and toddlers who maintained functioning at a level comparable to same-aged peers
670 21.83%
No data Numerator Denominator FFY 2015 Data*
FFY 2016 Target*
FFY 2016 Data
C1. Of those children who entered or exited the program below age expectations in Outcome A, the percent who substantially increased their rate of growth by the time they turned 3 years of age or exited the program (c+d)/(a+b+c+d+e)
1392 2399 58.28% 62.20% 58.02%
C2. The percent of infants and toddlers who were functioning within age expectations in Outcome A by the time they turned 3 years of age or exited the program (d+e)/(a+b+c+d+e)
1560 3069 50.14% 53% 50.83%
Did you use the Early Childhood Outcomes (ECO) Center Child Outcomes Summary (COS) process? Yes.

FFY 2016 State Performance Plan/Annual Performance Report 18
List the instruments used to gather data for this indicator.
Minnesota's process allows local programs to use a variety of sources to inform the ratings on each Child Outcome Summary form. Teams may use information from norm-referenced tools administered as part of a child's initial evaluation. They may also use parent report and professional observation to complete an age-anchored criterion-referenced assessment tool. Minnesota's process requires careful use of the crosswalk documents developed by the ECO Center. Minnesota requires ratings be made within a month of the actual date of entry or exit. For children exiting Part C and transitioning into early childhood special education services under Part B, the Part C exit rating automatically becomes the Part B entrance rating. In the event that two different local teams serve the child under each part, the teams must reach consensus on an accurate C exit/B entrance rating.
Actions required in FFY 2015 response: None
OSEP Response
States must report the following data starting with the FFY 2017 SPP/APR submission, due February 2019: (1) the number of infants and toddlers who exited the Part C program during the reporting period, as reported in the State’s Part C exiting data under Section 618 of the IDEA; and (2) the number of those infants and toddlers who did not receive early intervention services for at least six months before exiting the Part C program.

FFY 2016 State Performance Plan/Annual Performance Report 19
Indicator 4: Family Involvement
Monitoring Priority: Early Intervention Services in Natural Environments
Results Indicator: Percent of families participating in part C who report that early intervention services have helped the family:
A. Know their rights; B. Effectively communicate their children’s needs; and C. Help their children develop and learn.
(20 U.S.C. 1416(a)(3)(A) and 1442)
Historical Data
Baseline Data: 2013
Family Out-come
FFY 2006 2007 2008 2009 2010 2011 2012 2013 2014 2015
A Target≥ No data
No data
85% 90% 95% 95% 95% 89% 90% 90.3%
A Data 75% 76.6% 81% 82% 84% 82.7% 86.1% 89.22%
87.4% 88.98%
B Target≥ No data
No data
86% 88% 90% 90% 90% 93% 93.2% 93.4%
B Data 87% 83.1% 87% 89% 90% 88.2% 89.7% 92.58%
90.96%
91.31%
C Target≥ No data
No data
93% 96% 100% 92% 92% 90% 90.3% 90.6%
C Data 90% 86.7% 90% 92% 87% 86.4% 86.6% 89.8% 87.88%
89.56%

FFY 2016 State Performance Plan/Annual Performance Report 20
FFY 2016 – 2018 Targets
FFY 2016 2017 2018
Target A≥ 90.60% 91.00% 91.50%
Target B≥ 93.60% 93.80% 94.00%
Target C≥ 90.90% 91.20% 91.50%
FFY 2016 SPP/APR Data
Number of families to whom surveys were distributed: 3069
Number of respondent families participating in Part C: 852 (27.76 percent)
A1. Number of respondent families participating in Part C who report that early intervention services have helped the family know their rights: 766
A2. Number of responses to the question of whether early intervention services have helped the family know their rights: 852
B1. Number of respondent families participating in Part C who report that early intervention services have helped the family effectively communicate their children's needs: 790
B2. Number of responses to the question of whether early intervention services have helped the family effectively communicate their children's needs: 852
C1. Number of respondent families participating in Part C who report that early intervention services have helped the family help their children develop and learn: 766
C2. Number of responses to the question of whether early intervention services have helped the family help their children develop and learn: 852
Family Outcome FFY 2015 Data*
FFY 2016 Target*
FFY 2016 Data
A. Percent of families participating in Part C who report that early intervention services have helped the family know their rights
88.98% 90.60% 89.91%

FFY 2016 State Performance Plan/Annual Performance Report 21
Family Outcome FFY 2015 Data*
FFY 2016 Target*
FFY 2016 Data
B. Percent of families participating in Part C who report that early intervention services have helped the family effectively communicate their children's needs
91.31% 93.60% 92.72%
C. Percent of families participating in Part C who report that early intervention services have helped the family help their children develop and learn
89.56% 90.90% 89.91%
Was sampling used? No.
Was a collection tool used? Yes.
Is it a new or revised collection tool? No.
Are the demographics of the families responding representative of the demographics of infants, toddler and families enrolled in the Part C program? No.
Describe the strategies that the state will use to ensure that in the future the response data are representative of those demographics.
As mentioned, the state has already translated the Family Outcome Survey into 13 languages to promote participation from families who are linguistically diverse. Because Minnesota does not utilize sampling, there is no way to over-sample from under-represented groups to increase the extent to which respondent families are demographically similar to all families enrolled in early intervention.
The Minnesota Department of Education (MDE) will continue to support local programs to implement strategies to improve our overall response rate with special emphasis on families who are culturally or linguistically diverse, or who are experiencing poverty. The early childhood special education team from MDE meets face to face with local program leaders twice each year and holds a monthly leaders' telephone call. MDE will use these opportunities to address this issue.
Include the State’s analysis of the extent to which the demographics of the families responding are representative of the demographics of infants, toddlers, and families enrolled in the Part C program.
Minnesota does not use sampling in collecting data or reporting this indicator. The pool of potential respondents exactly matches the demographics of families served by and exiting Part C. All families who have participated in early intervention services for six months or more are provided the Family Outcome Survey at the time of transition to Part B or to other community supports and services. The Family Outcome Survey has been

FFY 2016 State Performance Plan/Annual Performance Report 22
translated into 13 languages to limit barriers attributable to a family's home primary language being a language other than English. The Minnesota Department of Education has provided local programs with procedures to use to obtain survey data from families who do not read or whose primary language is not a written language.
Minnesota's received responses were analyzed using multiple demographic variables and by employing the Representedness calculator provided by the Early Childhood Technical Assistance Center (ECTA) and DaSY. Minnesota acknowledges that families who are black, Asian, multi-racial or American Indian are under-represented among the returned surveys. Families who speak a language other than English or who were experiencing poverty were also under-represented. Ironically, across all three family outcomes, families who were culturally or linguistically diverse were slightly more likely to report benefit from early intervention than were families who were white or were English speakers.
When the responses of all groups were analyzed using ECTA's Meaningful Differences calculator there were no meaningful differences in the benefit attributed to early intervention across groups when compared to the overall state rate of performance.

FFY 2016 State Performance Plan/Annual Performance Report 23
Indicator 5: Child Find (Birth to 1)
Monitoring Priority: Effective General Supervision Part C/Child Find
Results indicator: percent of infants and toddlers birth to 1 with IFSPs compared to national data.
(20 U.S.C. 1416(a)(3)(B) and 1442)
Historical Data
Baseline Data: 2005
FFY 2004 2005 2006 2007 2008 2009 2010 2011 2012 2013 2014 2015
Target ≥ No data No Data
0.55%
0.60%
0.80%
0.85%
0.85%
0.88%
0.90%
0.98%
1.00%
1.05%
Data Data prior to baselin
e
0.46%
0.63%
0.62%
0.79%
0.74%
0.91%
0.87%
0.98%
0.97%
1.06%
0.95%
FFY 2016 – FFY 2018 Targets
FFY 2016 2017 2018
Target ≥ 1.10% 1.15% 1.20%
Prepopulated Data
Source Date Description Data Overwrite Data
SY 2016-17 Child Count/Educational
Environment Data Groups
7/12/2017 Number of infants and toddlers birth to 1 with IFSPs
722 null

FFY 2016 State Performance Plan/Annual Performance Report 24
Source Date Description Data Overwrite Data
U.S. Census Annual State Resident Population Estimates
April 1, 2010 to July 1, 2016
6/22/2017 Population of infants and toddlers birth to 1
69,937 null
To be determined No data No data Null No data
FFY 2016 SPP/APR Data
Number of infants and toddlers birth to 1 with IFSPs
Population of infants and toddlers birth to 1
FFY 2015* Data
FFY 2016 Target*
FFY 2016 Data
722 69,937 0.95% 1.10% 1.03%
Compare your results to the national data
The percentage of infants and toddlers birth to 1 served by Minnesota has historically been below the national average. Minnesota's performance for FFY 2016 continues this trend. While the state's rate has increased considerably over time, the state has never matched the rate of infants served by the country as a whole.
Actions required in FFY 2015 response: None

FFY 2016 State Performance Plan/Annual Performance Report 25
Indicator 6: Child Find (Birth to 3)
Monitoring Priority: Effective General Supervision Part C/Child Find
Results indicator: Percent of infants and toddlers birth to 3 with IFSPs compared to national data.
(20 U.S.C. 1416(a)(3)(B) and 1442)
Historical Data
Baseline Data: 2005
FFY 2004 2005 2006 2007 2008 2009 2010 2011 2012 2013 2014 2015
Target ≥
No data
No data
1.70% 1.90% 2.10% 2.25% 2.30% 2.35% 2.40% 2.50% 2.53% 2.60%
Data No data
1.56% 1.70% 1.83% 2.10% 2.15% 2.37% 2.45% 2.44% 2.49% 2.61% 2.62%
FFY 2016 – FFY 2018 Targets
FFY 2016 2017 2018
Target ≥ 2.68% 2.75% 2.82%
Prepopulated Data
Source Date Description Data Overwrite Data
SY 2016-17 Child Count/Educational
Environment Data Groups
7/12/2017 Number of infants and toddlers birth to 3 with IFSPs
5,736 No data
U.S. Census Annual State Resident Population Estimates
April 1, 2010 to July 1, 2016
6/22/2017 Population of infants and toddlers birth to 3
211,422 No data

FFY 2016 State Performance Plan/Annual Performance Report 26
Source Date Description Data Overwrite Data
TBD No data No data Null No data
FFY 2016 SPP/APR Data
Number of infants and toddlers birth to 3 with IFSPs
Population of infants and toddlers birth to 1
FFY 2015* Data
FFY 2016 Target*
FFY 2016 Data
5,736 211,442 2.62% 2.68% 2.71%
Compare your results to national data
The percentage of infants and toddlers birth to age 3 with IFSPs in Minnesota has historically been lower than the national percentage. Minnesota's performance in FFY 2016 continues this trend. The state is pleased that the state's year-to-year increase over FFY 2015 for the state nearly matches the federal increase.
Actions required in FFY 2015 response: none

FFY 2016 State Performance Plan/Annual Performance Report 27
Indicator 7: 45-day timeline
Monitoring Priority: Effective General Supervision Part C/Child Find
Compliance Indicator: Percent of eligible infants and toddlers with IFSPs for whom an initial evaluation and initial assessment and an initial IFSP meeting were conducted within Part C’s 45-day timeline.
(20 U.S.C. 1416(a)(3)(B) and 1442)
Historical Data
Baseline Data: 2005
FFY 2004 2005 2006 2007 2008 2009 2010 2011 2012 2013 2014 2015
Target No data
No data
100% 100% 100% 100% 100% 100% 100% 100% 100% 100%
Data No data
83.40%
86.30%
83.90%
83.40%
77.30%
90.70%
93.60%
91.10%
97.85%
98.64%
97.70%
FFY 2016 – FFY 2018 Targets
FFY 2016 2017 2018
Target 100% 100% 100%

FFY 2016 State Performance Plan/Annual Performance Report 28
FFY 2016 SPP/APR Data
Number of eligible infants and toddlers with IFSPs for whom an initial evaluation
and assessment and an initial IFSP meeting was conducted within Part C’s
45-day timeline
Number of eligible infants and toddlers evaluated and assessed for whom an initial IFSP meeting
was required to be conducted
FFY 2015 Data*
FFY 2016
Target*
FFY 2016 Data
167 192 97.70% 100% 95.83%
Number of documented delays attributable to exceptional family circumstances: 17 (This number will be added to the “Number of infants and toddlers with IFSPs for whom an initial evaluation and assessment and an initial IFSP meeting was conducted within Part C’s 45-day timeline” field above to calculate the numerator for this indicator.)
Reasons for Slippage
Minnesota reports slippage on Indicator 7 from the FFY 2015 rate of 97.70 percent to the FFY 2016 rate of 95.83 percent. This represents a decrease of 1.87 percent and does not meet the FFY 2016 target of 100 percent.
The data collection methods used in FFY 2016 are similar to those used in compilation of data from previous years and allow for a valid comparison of percentages between these years. The FFY 2016 data are based on MDE reviews and self-review of 36 SEAUs, a number comparable to FFY 2015.
In analyzing the identified noncompliance, 16.7 percent of the SEAUs reviewed were found to have noncompliance in this area. Of the six SEAUs with noncompliance, four were found to have only one occurrence of individual student noncompliance in this area. The other two SEAUs each had two occurrences of individual student noncompliance. One of these SEAUs is a large, urban LEA and the other is a cooperative of seven LEAs in greater Minnesota. Review of the documentation indicated delays were due primarily to scheduling issues. In many cooperatives, Part C staff cover large service areas. With small Part C populations in some rural communities, staff travel great distances to provide services to children across a vast area. In the metropolitan area, Part C staff often have high caseloads and provide services in an array of settings. In both situations it can be difficult for staff to schedule meetings at times convenient to all parties, particularly when interpreters might be needed to attend the meeting as well. MDE continues to train SEAUs on the requirements of 34 CFR § 303.310 as well as 34 CFR § 303.343(2) which allows for involvement in IFSP meetings through other means such as using a telephone conference, having an authorized representative attend, or by making pertinent records available.
Source of data provided for this indicator: State monitoring
Describe the method used to select EIS programs for monitoring:

FFY 2016 State Performance Plan/Annual Performance Report 29
Data for this indicator has been collected through MDE’s Minnesota Continuous Improvement Monitoring Process (MNCIMP) web-based data system. The MNCIMP web-based data system is used in part for gathering data from record reviews completed as part of compliance monitoring. Compliance monitoring of Early Intervention (EI) programs occurs through the monitoring of the local education agencies (LEAs) through special education administrative units (SEAUs) which has been scheduled on a five-year cycle, however in FFY 2015 MDE moved to a six-year monitoring cycle. In year one of the cycle, the SEAU conducts a self-review of records. In year two, the SEAU must demonstrate correction of any noncompliance identified in the self-review consistent with the requirements of OSEP Memo 09-02. In year three, MDE conducts an on-site review of the SEAU including a review of student records, facilities, and the SEAU’s Total Special Education System (TSES). In year four of the cycle, the SEAU must demonstrate correction of noncompliance identified during the MDE review and implement any corrective action, again consistent with the requirements of OSEP Memo 09-02. The fifth year of the cycle is used to verify results of the implemented corrective action plan. The sixth year of the cycle provides an additional year for SEAUs to implement corrective action and changes to their systems prior to the start of the new monitoring cycle and self-review of records.
As part of the record review, a computer-generated sample is used to determine the student records to be reviewed. Records are selected from the most recent SEAU enrollment data and are chosen in order to be accurately representative of the SEAU as a whole. Selection is based on a stratified random sampling with consideration given to race/ethnicity, age, gender, and primary disability of the student. During the record review, the most current Evaluation Report (ER), Individualized Education Program (IEP) or Individual Family Service Plan (IFSP) and corresponding due process documentation are monitored to determine that legal standards are met.
Data for this indicator are gathered from examining records of children receiving Part C services and determining whether the services were provided in a timely manner. The FFY 2016 data are based on MDE reviews and SEAU self-review of 36 SEAUs, comprised of 61 individual districts.
Correction of Findings of Noncompliance Identified in FFY 2015
Findings of Noncompliance Identified
Findings of Noncompliance Verified as Corrected Within One
Year
Findings of Noncompliance
Subsequently Corrected
Findings Not Yet Verified as Corrected
4 4 0 0
FFY 2015 Findings of Noncompliance Verified as Corrected
Describe how the State verified that the source of noncompliance is correctly implementing the regulatory requirements:

FFY 2016 State Performance Plan/Annual Performance Report 30
SEAUs with identified noncompliance are required to correct all individual student noncompliance, including possible Corrective Action Plans (CAPs) and a subsequent review of student records, in order to demonstrate the SEAU is now correctly implementing 34 CFR § 303.310. As part of the CAP, the SEAU must track timelines for a minimum of three months to verify the SEAU is in 100 compliance with the timeline. The SEAUs submit Letters of Assurance along with information on the student records that were reviewed, assuring that the SEAU is now in compliance. Each individual case of noncompliance was corrected, as described below. MDE believes that aside from isolated incidents of noncompliance, the SEAUs are correctly implementing 34 CFR § 303.310.
Describe how the State verified that each individual case of noncompliance was corrected:
All record review data from FFY 2015 was collected through MDE’s MNCIMP web-based data system. Once noncompliance is identified, it is tracked through the same web-based data system, which includes a compliance tracking system. For post-referral timelines, when record reviews are completed and data entered into the MNCIMP system, data is requested detailing the date of the referral, the date the evaluation and assessments were completed, and the date of the IFSP meeting. This allows MDE to verify that the evaluations, assessments, and IFSP meetings have been completed, although they may have been late. If the date the evaluations and assessments were completed or the date of the IFSP meeting is missing, MDE requires the SEAU to submit the completed IFSP to demonstrate the evaluation and assessments and IFSP meeting has been completed, although late. If the student is no longer within the jurisdiction of the SEAU, the SEAU must submit to MDE the reason (moved, for example) and the date of the occurrence to release the SEAU from further demonstration of correction for that specific student. Based on a review of the data, MDE verified all of the evaluations and assessments and IFSP meetings had been completed and that each SEAU with noncompliance reflected in the data the state reported for this indicator had completed the evaluations and assessments and IFSP meetings, although late, for any child whose initial evaluation and assessment and IFSP meeting was not timely unless the child is no longer within the jurisdiction of the SEAU, consistent with OSEP Memo 09-02. All correction of individual student record noncompliance was completed within the one-year timeframe.
OSEP Response
Because the state reported less than 100 percent compliance for FFY 2016, the state must report on the status of correction of noncompliance identified in FFY 2016 for this indicator. When reporting on the correction of noncompliance, the state must report in the FFY 2017 SPP/APR that it has verified that each Early Intervention Service (EIS) program or provider with noncompliance identified in FFY 2016 for this indicator:
1. Is correctly implementing the specific regulatory requirements (i.e., achieved 100 percent compliance)based on a review of updated data such as data subsequently collected through on-site monitoring or aState data system; and
2. Has corrected each individual case of noncompliance, unless the child is no longer within the jurisdictionof the EIS program or provider, consistent with OSEP Memo 09-02. In the FFY 2017 SPP/APR, the statemust describe the specific actions that were taken to verify the correction.

FFY 2016 State Performance Plan/Annual Performance Report 31
If the state did not identify any findings of noncompliance in FFY 2016, although its FFY 2016 data reflect less than 100 percent compliance, provide an explanation of why the state did not identify any findings of noncompliance in FFY 2016.

FFY 2016 State Performance Plan/Annual Performance Report 32
Indicator 8A: Early Childhood Transition
Monitoring Priority: Effective General Supervision Part C/Effective Transition
Compliance Indicator: The percentage of toddlers with disabilities exiting Part C with timely transition planning for whom the lead agency has:
A. Developed an IFSP with transition steps and services at least 90 days, and at the discretion of all parties,not more than nine months, prior to the toddler’s third birthday;
B. Notified (consistent with any opt-out policy adopted by the state) the state educational agency (SEA)and the local educational agency (LEA) where the toddler resides at least 90 days prior to the toddler’sthird birthday for toddlers potentially eligible for Part B preschool services; and
C. Conducted the transition conference held with the approval of the family at least 90 days, and at thediscretion of all parties, not more than nine months, prior to the toddler’s third birthday for toddlerspotentially eligible for Part B preschool services.
(20 U.S.C. 1416(a)(3)(B) and 1442)
Historical Data
Baseline Data: 2005
FFY 2004 2005 2006 2007 2008 2009 2010 2011 2012 2013 2014 2015
Target No data
No data
100% 100% 100% 100% 100% 100% 100% 100% 100% 100%
Data No data
80.40%
87.00%
91.00%
95.30%
99.00%
100%
93.00%
95.00%
99.19%
99.08%
100%
FFY 2016 – FFY 2018 Targets
FFY 2016 2017 2018
Target 100% 100% 100%

FFY 2016 State Performance Plan/Annual Performance Report 33
FFY 2016 SPP/APR Data
Data includes only those toddlers with disabilities exiting Part C with timely transition planning for whom the Lead Agency has developed an IFSP with transition steps and services at least 90 days, and at the discretion of all parties, not more than nine months, prior to the toddler’s third birthday.
Number of children exiting Part C who have an IFSP with transition steps and
services
Number of toddlers with disabilities exiting Part C
FFY 2015 Data*
FFY 2016 Target*
FFY 2016 Data
76 76 100% 100% 100%
Number of documented delays attributable to exceptional family circumstances: 0
Source of Data provided for this indicator: State monitoring
Describe the method used to select EIS programs for monitoring:
Data for this indicator has been collected through MDE’s Minnesota Continuous Improvement Monitoring Process (MNCIMP) web-based data system. The MNCIMP web-based data system is used in part for gathering data from record reviews completed as part of compliance monitoring. Compliance monitoring of Early Intervention (EI) programs occurs through the monitoring of the local education agencies (LEAs) through special education administrative units (SEAUs) which has been scheduled on a five-year cycle, but in FFY 2015 MDE moved to a six-year monitoring cycle. In year one of the cycle, the SEAU conducts a self-review of records. In year two, the SEAU must demonstrate correction of any noncompliance identified in the self-review consistent with the requirements of OSEP Memo 09-02. In year three, MDE conducts an on-site review of the SEAU including a review of student records, facilities, and the SEAU’s Total Special Education System (TSES). In year four of the cycle, the SEAU must demonstrate correction of noncompliance identified during the MDE review and implement any corrective action, again consistent with the requirements of OSEP Memo 09-02. The fifth year of the cycle is used to verify results of the implemented corrective action plan. The sixth year of the cycle provides an additional year for SEAUs to implement corrective action and changes to their systems prior to the start of the new monitoring cycle and self-review of records.
As part of the record review, a computer-generated sample is used to determine the student records to be reviewed. Records are selected from the most recent SEAU enrollment data and are chosen in order to be accurately representative of the SEAU as a whole. Selection is based on a stratified random sampling with consideration given to race/ethnicity, age, gender, and primary disability of the student. During the record review, the most current Evaluation Report (ER), Individualized Education Program (IEP) or Individual Family Service Plan (IFSP) and corresponding due process documentation are monitored to determine that legal standards are met.

FFY 2016 State Performance Plan/Annual Performance Report 34
Data for this indicator are gathered from examining records of children exiting Part C services and determining whether the IFSPs included transition steps and services. The FFY 2016 data are based on MDE reviews and SEAU self-review of 36 SEAUs, comprised of 61 individual districts.
Correction of Findings of Noncompliance Identified in FFY 2015
Findings of Noncompliance Identified
Findings of Noncompliance Verified as Corrected Within One
Year
Findings of Noncompliance
Subsequently Corrected
Findings Not Yet Verified as Corrected
0 0 0 0

FFY 2016 State Performance Plan/Annual Performance Report 35
Indicator 8B: Early Childhood Transition
Monitoring Priority: Effective General Supervision Part C/Effective Transition
Compliance indicator: The percentage of toddlers with disabilities exiting Part C with timely transition planning for whom the lead agency has:
A. Developed an IFSP with transition steps and services at least 90 days, and at the discretion of all parties, not more than nine months, prior to the toddler’s third birthday;
B. Notified (consistent with any opt-out policy adopted by the state) the state educational agency (SEA) and the local educational agency (LEA) where the toddler resides at least 90 days prior to the toddler’s third birthday for toddlers potentially eligible for Part B preschool services; and
C. Conducted the transition conference held with the approval of the family at least 90 days, and at the discretion of all parties, not more than nine months, prior to the toddler’s third birthday for toddlers potentially eligible for Part B preschool services.
(20 U.S.C. 1416(a)(3)(B) and 1442)
Historical Data
Baseline Data: 2005
FFY 2004 2005 2006 2007 2008 2009 2010 2011 2012 2013 2014 2015
Target No data
No data
100% 100% 100% 100% 100% 100% 100% 100% 100% 100%
Data No data
100% 100% 100% 100% 100% 100% 100% 100% 100% 100% 100%
FFY 2016 – FFY 2018 Targets
FFY 2016 2017 2018
Target 100% 100% 100%

FFY 2016 State Performance Plan/Annual Performance Report 36
FFY 2016 SPP/APR Data
Number of toddlers with disabilities exiting Part C where notification to the SEA and LEA occurred at least 90 days
prior to their third birthday for toddlers potentially eligible for Part B preschool
services
Number of toddlers with disabilities exiting Part C who
were potentially eligible for Part B
FFY 2015 Data*
FFY 2016 Target*
FFY 2016 Data
63 63 100% 100% 100%
Number of parents who opted out: 0
Describe the method used to collect these data
MDE includes the following among the "statement of assurances" required to be signed annually by local Early Intervention Program administrators prior to receipt of Part C funds. This has been accepted by OSEP as a component of Minnesota's Part C Application.
The state confirms notification of LEAs by local early intervention programs as required by the annual statement of assurances. The Part C program must provide notification to the state education agency (SEA) and the appropriate local education agency (LEA) no fewer than 90 days prior to the child’s third birthday, for those children who are potentially eligible for Part B services. 34 CFR § 303.209(b)(1)-(2). However, per MDE policy, this notification needs to be provided only to the LEA, who is acting as an agent of the SEA for this specific purpose, to satisfy the notification requirements.
Do you have a written opt out policy? No.
Source of the data provided for this indicator: State monitoring
Describe the method used to select EIS programs for monitoring:
Compliance monitoring of Early Intervention (EI) programs occurs by monitoring local education agencies (LEAs) through special education administrative units (SEAUs), which had been scheduled on a five-year cycle. In FFY 2015, MDE moved to a six-year monitoring cycle. In year one of the cycle, the SEAU conducts a self-review of records. In year two, the SEAU must demonstrate correction of any noncompliance identified in the self-review consistent with the requirements of OSEP memo 09-02. In year three, MDE conducts an on-site review of the SEAU including a review of student records, stakeholder interviews, facilities, and the SEAU’s Total Special Education System (TSES). In year four of the cycle, the SEAU must demonstrate correction of noncompliance identified during the MDE review and implement any corrective action, again consistent with the requirements of OSEP Memo 09-02. The fifth year of the cycle is used to verify results of the implemented corrective action

FFY 2016 State Performance Plan/Annual Performance Report 37
plan. The sixth year of the cycle provides an additional year for the SEAUs to implement corrective action and changes to their systems prior to the start of the new monitoring cycle and self-review of records.
Correction of Findings of Noncompliance Identified in FFY 2015
Findings of Noncompliance Identified
Findings of Noncompliance Verified as Corrected Within One
Year
Findings of Noncompliance
Subsequently Corrected
Findings Not Yet Verified as Corrected
0 0 0 0

FFY 2016 State Performance Plan/Annual Performance Report 38
Indicator 8C: Early Childhood Transition
Monitoring Priority: Effective General Supervision Part C/Effective Transition
Compliance indicator: The percentage of toddlers with disabilities exiting Part C with timely transition planning for whom the lead agency has:
A. Developed an IFSP with transition steps and services at least 90 days, and at the discretion of all parties, not more than nine months, prior to the toddler’s third birthday;
B. Notified (consistent with any opt-out policy adopted by the state) the state educational agency (SEA) and the local educational agency (LEA) where the toddler resides at least 90 days prior to the toddler’s third birthday for toddlers potentially eligible for Part B preschool services; and
C. Conducted the transition conference held with the approval of the family at least 90 days, and at the discretion of all parties, not more than nine months, prior to the toddler’s third birthday for toddlers potentially eligible for Part B preschool services.
(20 U.S.C. 1416(a)(3)(B) and 1442)
Historical Data
Baseline Data: 2005
FFY 2004 2005 2006 2007 2008 2009 2010 2011 2012 2013 2014 2015
Target No data
No data
100% 100% 100% 100% 100% 100% 100% 100% 100% 100%
Data No data
30.35% 50.00% 59.00% 95.60% 92% 91% 99% 99% 98% 100% 100%
FFY 2016 – FFY 2018 Targets
FFY 2016 2017 2018
Target 100% 100% 100%

FFY 2016 State Performance Plan/Annual Performance Report 39
FFY 2016 SPP/APR Data
Number of toddlers with disabilities exiting Part C where notification to the SEA and LEA occurred at least 90 days
prior to their third birthday for toddlers potentially eligible for Part B preschool
services
Number of toddlers with disabilities exiting Part C who
were potentially eligible for Part B
FFY 2015 Data*
FFY 2016 Target*
FFY 2016 Data
63 63 100% 100% 100%
Data reflects only those toddlers for whom the Lead Agency has conducted the transition conference held with the approval of the family at least 90 days, and at the discretion of all parties, not more than nine months, prior to the toddler’s third birthday for toddlers potentially eligible for Part B preschool services.
Number of toddlers with disabilities exiting Part C where the transition
conference occurred at least 90 days, and at the discretion of all parties at
least nine months prior to the toddler’s third birthday for toddlers potentially
eligible for Part B
Number of toddlers with disabilities exiting Part C who
were potentially eligible for Part B
FFY 2015 Data*
FFY 2016 Target*
FFY 2016 Data
63 63 100% 100% 100%
Number of toddlers for whom the parent did not provide approval for the transition conference: 0 (This number will be subtracted from the "Number of toddlers with disabilities exiting Part C who were potentially eligible for Part B" field to calculate the denominator for this indicator.)
Number of documented delays attributable to exceptional family circumstances: 0 (This number will be added to the "Number of toddlers with disabilities exiting Part C where the transition conference occurred at least 90 days, and at the discretion of all parties at least nine months prior to the toddler’s third birthday for toddlers potentially eligible for Part B" field to calculate the numerator for this indicator.)
Source of the data provided for this indicator: State monitoring
Describe the method used to select EIS programs for monitoring:
Data for this indicator has been collected through MDE’s Minnesota Continuous Improvement Monitoring Process (MNCIMP) web-based data system. The MNCIMP web-based data system is used in part for gathering data from record reviews completed as part of compliance monitoring. Compliance monitoring of Early

FFY 2016 State Performance Plan/Annual Performance Report 40
Intervention (EI) programs occurs by monitoring local education agencies (LEAs) through special education administrative units (SEAUs) which had been scheduled on a five-year cycle. In FFY 2015 MDE moved to a six-year monitoring cycle. In year one of the cycle, the SEAU conducts a self-review of records. In year two, the SEAU must demonstrate correction of any noncompliance identified in the self-review consistent with the requirements of OSEP Memo 09-02. In year three, MDE conducts an on-site review of the SEAU including a review of student records, stakeholder interviews, facilities, and the SEAU’s Total Special Education System (TSES). In year four of the cycle, the SEAU must demonstrate correction of noncompliance identified during the MDE review and implement any corrective action, again consistent with the requirements of OSEP Memo 09-02. The fifth year of the cycle is used to verify results of the implemented corrective action plan. The sixth year of the cycle provides an additional year for SEAUs to implement corrective action and changes to their systems prior to the start of the new monitoring cycle and self-review of records.
As part of the record review, a computer-generated sample is used to determine the student records to be reviewed. Records are selected from the most recent SEAU enrollment data and are chosen in order to be accurately representative of the SEAU as a whole. Selection is based on a stratified random sampling with consideration given to race/ethnicity, age, gender, and primary disability of the student. During the record review, the most current Evaluation Report (ER), Individualized Education Program (IEP) or Individual Family Service Plan (IFSP) and corresponding due process documentation are monitored to determine that legal standards are met.
Data for this indicator are gathered from examining records of children exiting Part C services and determining whether a transition conference was held during the required timeframe for toddlers potentially eligible for Part B. The FFY 2016 data are based on MDE reviews and SEAU self-review of 36 SEAUs, comprised of 61 individual districts.
Correction of Findings of Noncompliance Identified in FFY 2015
Findings of Noncompliance Identified
Findings of Noncompliance Verified as Corrected Within One
Year
Findings of Noncompliance
Subsequently Corrected
Findings Not Yet Verified as Corrected
0 0 0 0
FFY 2016 State Performance Plan/Annual Performance Report 41
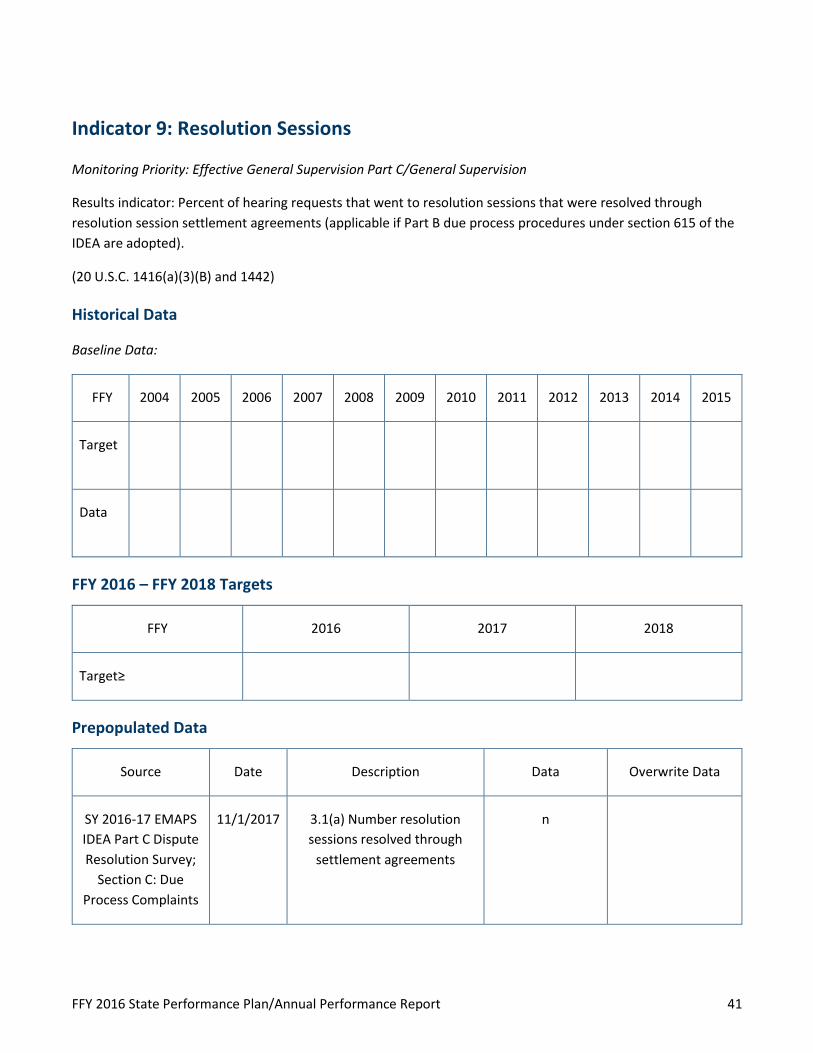
Indicator 9: Resolution Sessions
Monitoring Priority: Effective General Supervision Part C/General Supervision
Results indicator: Percent of hearing requests that went to resolution sessions that were resolved through resolution session settlement agreements (applicable if Part B due process procedures under section 615 of the IDEA are adopted).
(20 U.S.C. 1416(a)(3)(B) and 1442)
Historical Data
Baseline Data:
FFY 2004 2005 2006 2007 2008 2009 2010 2011 2012 2013 2014 2015
Target No data
No data
No data
No data
No data
No data
No data
No data
No data
No data
No data
No data
Data No data
No data
No data
No data
No data
No data
No data
No data
No data
No data
No data
No data
FFY 2016 – FFY 2018 Targets
FFY 2016 2017 2018
Target≥ No data No data No data
Prepopulated Data
Source Date Description Data Overwrite Data
SY 2016-17 EMAPS IDEA Part C Dispute Resolution Survey;
Section C: Due Process Complaints
11/1/2017 3.1(a) Number resolution sessions resolved through
settlement agreements
n null

FFY 2016 State Performance Plan/Annual Performance Report 42
Source Date Description Data Overwrite Data
SY 2016-17 EMAPS IDEA Part C Dispute Resolution Survey;
Section C: Due Process Complaints
11/1/2017 3.1 Number of resolution sessions
n null
FFY 2016 SPP/APR Data
3.1(a) Number resolution sessions resolved through settlement
agreements
3.1(a) Number resolution sessions resolved through settlement
agreements
FFY 2015 Data*
FFY 2016 Target*
FFY 2016 Data
0 0 No data No data 0%
Actions required in FFY 2015 response: none
OSEP Response: The state reported fewer than 10 resolution sessions held in FFY 2016. The state is not required to provide targets until any fiscal year in which 10 or more resolution sessions were held.

FFY 2016 State Performance Plan/Annual Performance Report 43
Indicator 10: Mediation
Monitoring Priority: Effective General Supervision Part C/General Supervision
Results Indicator: Percent of mediations held that resulted in mediation agreements.
(20 U.S.C. 1416 (a)(3)(B) and 1442)
Historical Data
Baseline Data: 2005
FFY 2004 2005 2006 2007 2008 2009 2010 2011 2012 2013 2014 2015
Target No data
No data
No data
83.00% No data
No data
No data
No data
No data
No data
No data
No data
Data No data
No data
No data
No data
100% No data
No data
No data
100% No data
No data
No data
FFY 2016 – FFY 2018 Targets
FFY 2016 2017 2018
Target≥ No data No data No data
Prepopulated Data
Source Date Description Data Overwrite Data
SY 2016-17 EMAPS IDEA Part C Dispute Resolution Survey;
Section B: Mediation Requests
11/1/2017 2.1.a.i Mediations agreements related to due process
complaints
n null
SY 2016-17 EMAPS IDEA Part C Dispute Resolution Survey;
Section B: Mediation Requests
11/1/2017 2.1.b.i Mediations agreements not related to due process complaints
n Null

FFY 2016 State Performance Plan/Annual Performance Report 44
Source Date Description Data Overwrite Data
SY 2016-17 EMAPS IDEA Part C Dispute Resolution Survey;
Section B: Mediation Requests
11/1/2017 2.1 Mediations held
FFY 2016 SPP/APR Data
2.1.a.i Mediations agreements related
to due process complaints
2.1.a.i Mediations agreements related to
due process complaints
2.1.a.i Mediations agreements related to due
process complaints
FFY 2015 Data*
FFY 2016 Target*
FFY 2016 Data
0 0 0 No data
No data No data
Actions required in FFY 2015 response: None
OSEP Response: The state reported fewer than 10 mediations held in FFY 2016. The state is not required to provide targets until any fiscal year in which 10 or more mediations were held.

FFY 2016 State Performance Plan/Annual Performance Report 45
Certify and Submit your SPP/APR
I certify that I am the director of the state's lead agency under Part C of the IDEA, or his or her designee, and that the state's submission of its IDEA Part C State Performance Plan/Annual Performance Report is accurate.
Selected: Designated by the lead agency director to certify
Name and title of the individual certifying the accuracy of the state's submission of its IDEA Part C State Performance Plan/Annual Performance Report.
Name: Lisa Backer
Title: Early Childhood Special Education Supervisor
Email: [email protected]
Phone: 651-582-8473