
State Fiscal Outlook: Minnesota and the Nation
35
State Fiscal Outlook: Minnesota and the Nation One Minnesota January 9, 2013 Scott Pattison Executive Director National Association of State Budget Officers 444 North Capitol Street, NW, Suite 642 • Washington, DC 20001 • (202) 624-5382 • www.nasbo.org
-
Upload
rigel-crane -
Category
Documents
-
view
20 -
download
3
description
State Fiscal Outlook: Minnesota and the Nation. One Minnesota January 9, 2013 Scott Pattison Executive Director National Association of State Budget Officers. 444 North Capitol Street, NW, Suite 642 • Washington, DC 20001 • (202) 624-5382 • www.nasbo.org. Current Fiscal Situation: - PowerPoint PPT Presentation
Transcript of State Fiscal Outlook: Minnesota and the Nation

State Fiscal Outlook: Minnesota and the Nation
One MinnesotaJanuary 9, 2013
Scott PattisonExecutive Director
National Association of State Budget Officers
444 North Capitol Street, NW, Suite 642 • Washington, DC 20001 • (202) 624-5382 • www.nasbo.org

NASBO 2
Current Fiscal Situation:
Overview

NASBO
State Fiscal Overview
The “Great Recession” was an extremely difficult fiscal period for states in all regions
Fiscal 2013 projections show aggregate expenditures and revenues continue to improve For many states, general fund revenues and expenditures still
below fiscal 2008
States recovering, but not recovered; resources remain tight
Federal uncertainty in a number of areas Federal spending expected to decline
3

NASBO 4
Federal Overhang…
Sequestration Cuts now scheduled for March 1, 2013
Debt Ceiling will need to be raised in February or March
Many program authorizations set to expire
“Grand bargain” Tax Reform?
NASBO 5
Current Fiscal Situation:
Indicators

NASBO
3 Years of Slow GF Growth Following 2 Years of Declines
-8
-6
-4
-2
0
2
4
6
8
10
12
%
General Fund Expenditure Growth (%)
*35-year historical average rate of growth is 5.6 percent *Fiscal ‘13 numbers are appropriated Source: NASBO Fall 2012 Fiscal Survey of States
* Average

NASBO
FY 2013 Appropriated Spending Still $5.9 Billion Below FY 2008
7
Source: NASBO Fall 2012 Fiscal Survey of States

NASBO
State Revenue Continues to Grow in 3rd Quarter, but at Slower Rate
-20
-15
-10
-5
0
5
10
15
1999 2000 2001 2002 2003 2004 2005 2006 2007 2008 2009 2010 2011 2012%
Year-Over-Year Real Change inQuarterly State Tax Revenue
Total
Source: Fiscal Studies Program, Rockefeller Institute of Government; U.S. Census Bureau

NASBO
FY 2013 General Fund Revenue is Expected to Surpass FY 2008 by $13B
9
Source: NASBO Fall 2012 Fiscal Survey of States

NASBO 10
Minnesota GF Revenue:1997-2012
Source: NASBO State Expenditure Report
(estimated)
NASBO
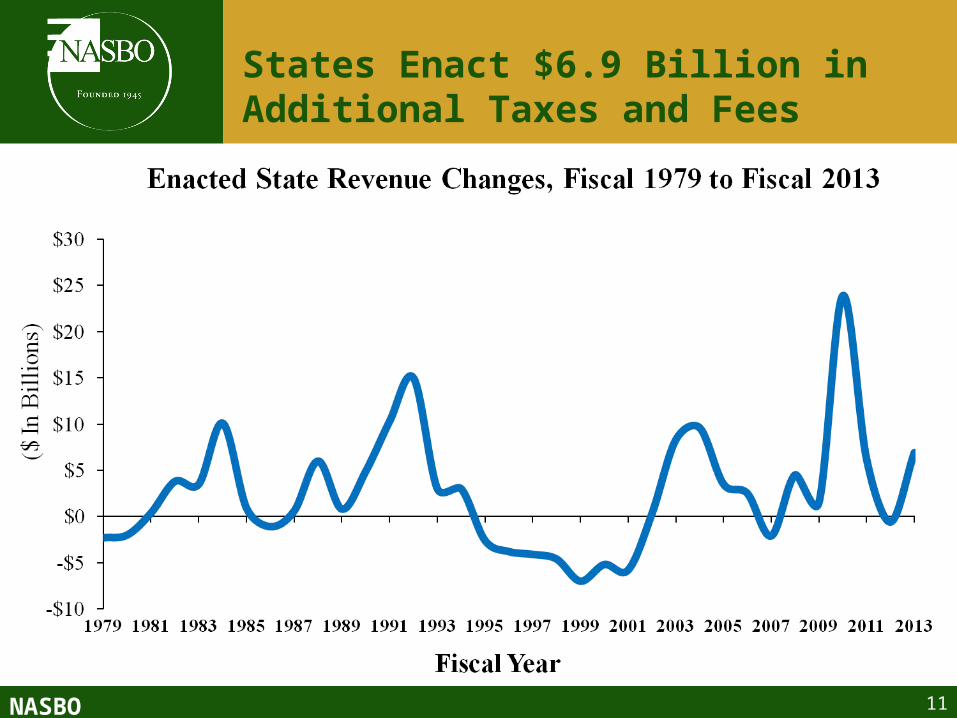
States Enact $6.9 Billion in Additional Taxes and Fees
11

NASBO
States Continue To Rebuild Budgetary Reserves After Recession
12

NASBO 13
Balances inMN and Selected States
Source: NASBO Dec. 2011 Fiscal Survey of States

NASBO
Budget Cuts Made After the Budget Passed
($ millions)
Source: NASBO Fall 2012 Fiscal Survey
Minimal Midyear Budget Cuts in FY 2012, 8 States Cut $1.7 Billion

NASBO
Strategies Used to Reduce or Eliminate Budget Gaps, FY 2013
Reduce Local Aid: 8 states
Layoffs: 9 states
Furloughs: 3 states
Cuts to Employee Benefits: 9 states
Across-the-Board Cuts: 13 states
Targeted Cuts: 21 states
Rainy Day Fund: 4 states
Reorganize Agencies: 10 statesSource: NASBO Fall 2012 Fiscal Survey of States

NASBO 16
Current Fiscal Situation:
Economic Overview

NASBO 17
Unemployment Ratein MN and Selected States
Source: U. S. Department of Labor, Bureau of Labor Statistics

NASBO
National Unemployment Rate Compared to MN
18
%
Source: U.S. Department of Labor, Bureau of Labor Statistics

NASBO 19
Background on State Spending Trends

NASBO 20
Spending by Funding Source(Percentage)
General Funds39.8%
Federal Funds31.2%
Other State Funds26.5% Bonds
2.5%
Total State Expenditures By Funding Source, Estimated Fiscal 2012
Source: NASBO State Expenditure Report

NASBO 21
MN Spending by Funding Source (Percentage)
Source: NASBO State Expenditure Report
NASBO 22
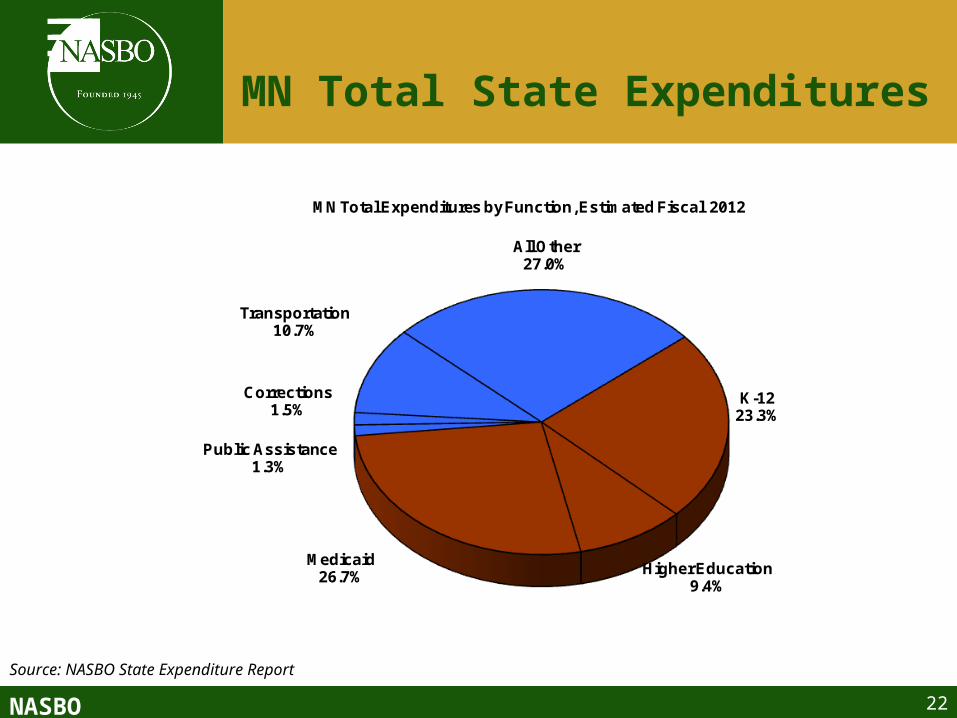
MN Total State Expenditures
K-1223.3%
Higher Education9.4%
Medicaid26.7%
Public Assistance1.3%
Corrections1.5%
Transportation10.7%
All Other27.0%
MN Total Expenditures by Function, Estimated Fiscal 2012
Source: NASBO State Expenditure Report

NASBO 23
Total Expenditures Percentage Growth in Spending Categories Over 10 Years
-5
31.8 33.9 34.5
44.8 47.7
59.7 60.9
-10
0
10
20
30
40
50
60
70
%
Percentage Growth in Spending CategoriesBetween Fiscal 2003 and Fiscal 2012 (Total Funds)
Public Assist. Higher Ed K-12 Corrections Transport. Total All Other Medicaid
Sources: NASBO State Expenditure Reports

NASBO 24
General Fund: Medicaid & Education 64.3%
Elementary & Secondary Education
34.7%
Higher Education10.0%
Medicaid19.6%
Public Assistance1.5%
Corrections7.0%
Transportation0.5%
All Other26.6%
General Fund Expenditures by Function, Estimated Fiscal 2012
Source: NASBO State Expenditure Report
NASBO 25
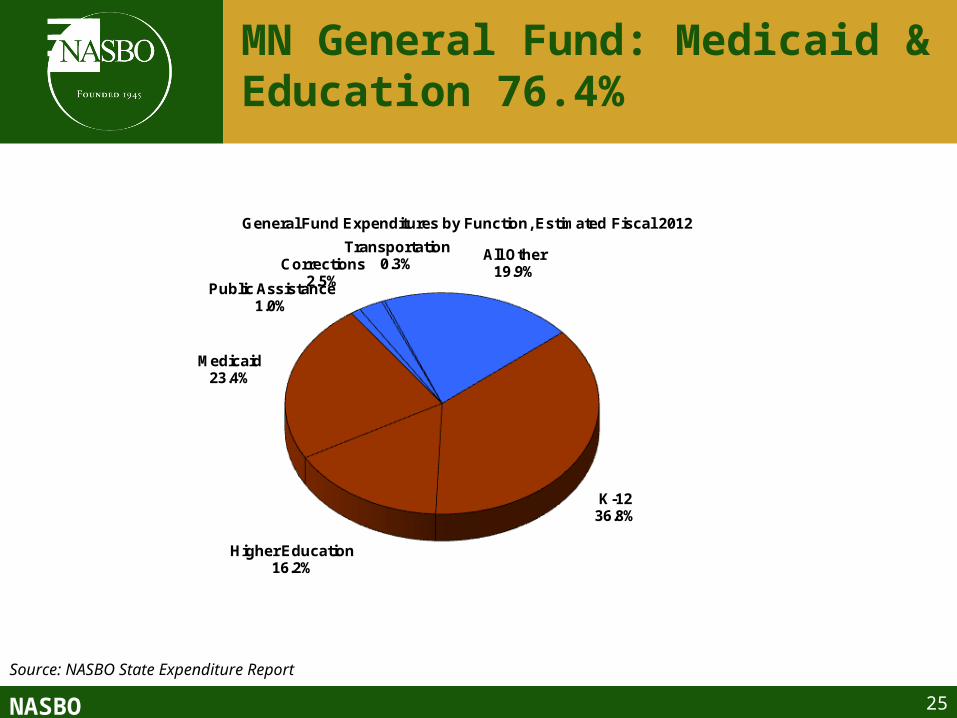
MN General Fund: Medicaid & Education 76.4%
K-1236.8%
Higher Education16.2%
Medicaid23.4%
Public Assistance1.0%
Corrections2.5%
Transportation0.3%
All Other19.9%
General Fund Expenditures by Function, Estimated Fiscal 2012
Source: NASBO State Expenditure Report

NASBO 26
General Fund Percentage Growth in Spending Categories Over 10 Years
-10.1
8 11.7
30.6 31.5 34.4
45.853.2
-20
-10
0
10
20
30
40
50
60
%
Percentage Growth in Spending CategoriesBetween Fiscal 2003 and Fiscal 2012 (General Funds)
Public Assist. Higher Ed Transport. K-12 Corrections Total All Other Medicaid
Sources: NASBO State Expenditure Reports

NASBO 27
State Spending from Federal Funds
Elementary & Secondary Education
10.9%
Higher Education3.5%
Medicaid43.9%
Public Assistance2.6%
Corrections0.2%
Transportation8.0%
All Other30.9%
Federal Funds Spending, Estimated Fiscal 2012
Source: NASBO State Expenditure Report
NASBO 28
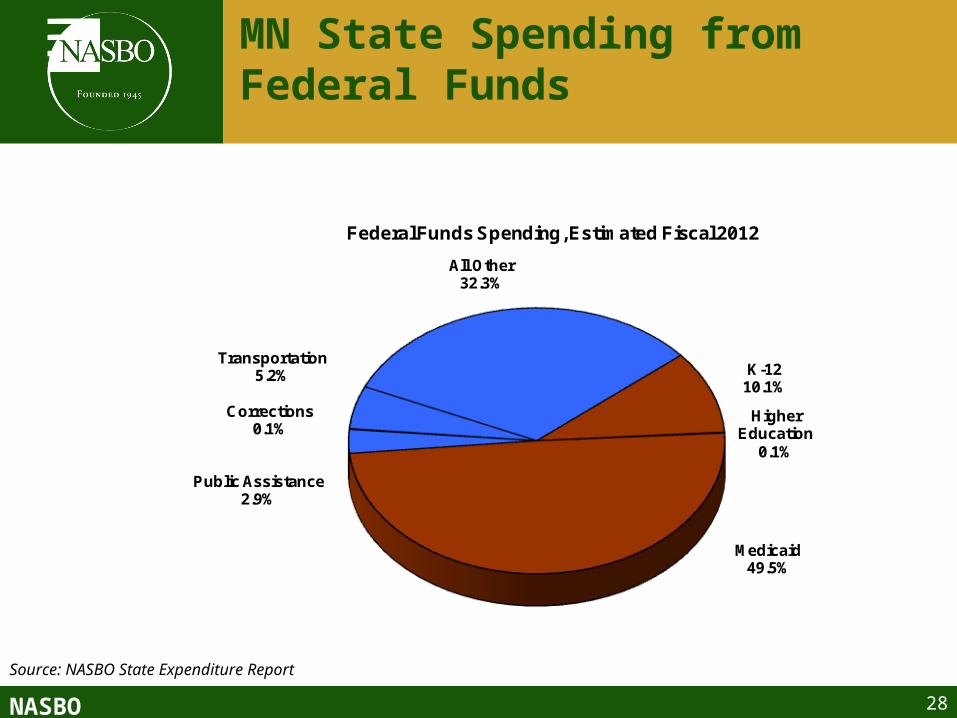
MN State Spending from Federal Funds
K-1210.1%
Higher Education
0.1%
Medicaid49.5%
Public Assistance2.9%
Corrections0.1%
Transportation5.2%
All Other32.3%
Federal Funds Spending, Estimated Fiscal 2012
Source: NASBO State Expenditure Report

NASBO 29
Promising Practices

NASBO 30
Promising Financial Management Practices
Use contingencies Prudent use of debt Rainy day funds and reserves One time only revenue for one time only! Use of performance information Avoiding bad practices in good times

NASBO 31
Focus on Outcomes
Focus on results and outcomes
Spend funds for effective programs
Improve management
NASBO 32
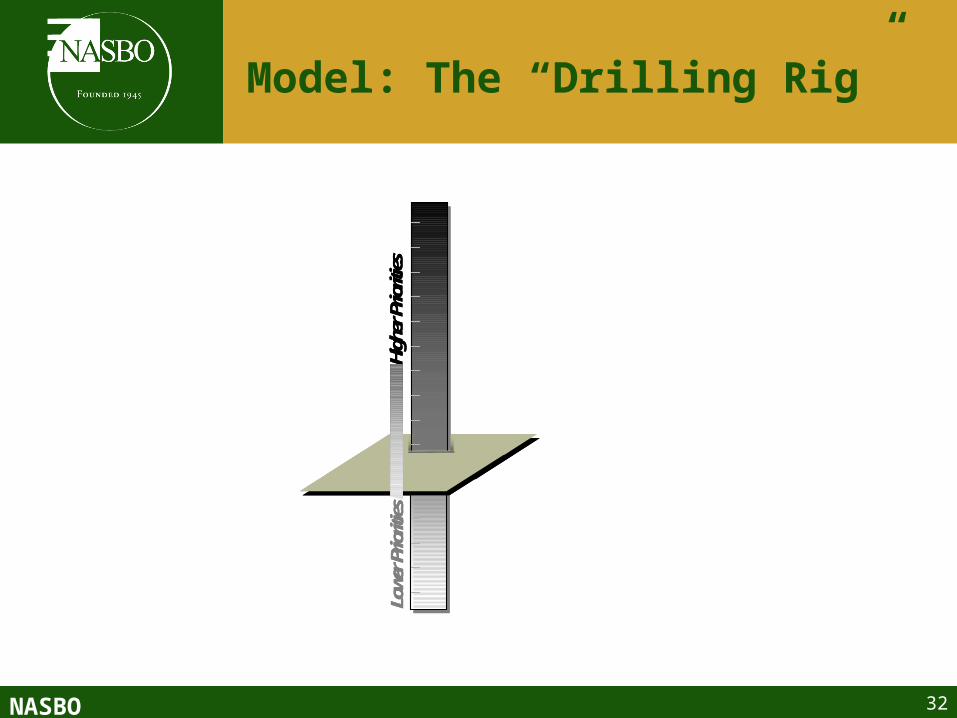
Model: The “Drilling Rig”
High
er Pr
ioritie
sLo
wer P
riorit
iesHi
gher
Prior
ities
Lowe
r Prio
rities

NASBO 33
Outlook
NASBO 34
State Fiscal Outlook
Austere state budgets for at least the next several years (Slow revenue growth, ARRA declines, economic uncertainty)
Health care reform, federal government will have an impact
Tough competition for general funds and limited federal funds
Dealing with long-term liabilities
States will continue to make painful choices