Minimum Sound Requirements for Hybrid and Electric ... · Minimum Sound Requirements for Hybrid and...
97
Preliminary Regulatory Impact Analysis Minimum Sound Requirements for Hybrid and Electric Vehicles FMVSS 141 Office of Regulatory Analysis and Evaluation National Center for Statistics and Analysis January 2013
Transcript of Minimum Sound Requirements for Hybrid and Electric ... · Minimum Sound Requirements for Hybrid and...

Preliminary Regulatory Impact Analysis
Minimum Sound Requirements for Hybrid and Electric Vehicles
FMVSS 141
Office of Regulatory Analysis and Evaluation National Center for Statistics and Analysis January 2013

Table of Contents Executive Summary ......................................................................................................................... i
System Effectiveness ...................................................................................................... ii Costs ............................................................................................................................... ii Benefits .......................................................................................................................... iii Net Impact [Pedestrians and Pedalcyclists Combined] ................................................. iv
Cost Effectiveness ......................................................................................................... iv
I. Introduction ............................................................................................................................. 1
II. Research and Proposal ............................................................................................................. 4
NHTSA’s Proposal ....................................................................................................... 17
III. Alternatives ........................................................................................................................... 24
Requiring Vehicle Sound to be Playback of an ICE Recording ................................... 24
Requiring that the Alert Sound Adapt to the Ambient ................................................. 24
Acoustic Profile Designed Around Sounds Produced by ICE Vehicles ...................... 24
Acoustic Profiles Suggested by Manufacturers ............................................................ 26
International Guidelines for Vehicle Alert Sounds ...................................................... 27
Possible Jury Testing for Recognizability of a Synthetic Sound ................................. 28
IV. COSTS ................................................................................................................................... 30
A. Number of vehicles affected ............................................................................................... 30
Low speed vehicles ...................................................................................................... 30
Light vehicles ............................................................................................................... 31
Medium and Heavy Trucks .......................................................................................... 34
Buses ............................................................................................................................ 34
Motorcycles and Motor-driven Cycles ......................................................................... 34
B. Technology Costs ($2010 economics) ............................................................................... 36
Low-Speed and Light Vehicles .................................................................................... 36
Medium and Heavy Trucks and Buses ......................................................................... 36
Motorcycles and Motor-Driven Cycles ........................................................................ 37
Cost Summary by Vehicle Types ................................................................................. 37
C. Weight and Fuel Economy Impacts ................................................................................... 38
D. Testing Costs ...................................................................................................................... 38
E. Total Costs .......................................................................................................................... 39
F. Non-quantified Costs .......................................................................................................... 40
V. BENEFITS ............................................................................................................................ 42

A. Benefits Methodology ........................................................................................................ 42
Injuries .......................................................................................................................... 42
Fatalities ....................................................................................................................... 65
Unquantifiable Benefits ................................................................................................ 66
VI. COST/BENEFIT ANALYSIS .............................................................................................. 67
A. Methodology ...................................................................................................................... 67
B. Other Vehicle Types ........................................................................................................... 72
C. Sensitivity Analysis ............................................................................................................ 73
Breakeven Point ........................................................................................................... 73
Hybrid and Electric Sales Rates ................................................................................... 74
Value of a Statistical Life (VSL) .................................................................................. 76
VII. Regulatory Flexibility Act and Unfunded Mandates Reform Act Analysis ......................... 77
A. Regulatory Flexibility Act .................................................................................................. 77
B. Unfunded Mandates Reform Act ....................................................................................... 80
Appendix A ................................................................................................................................... 82

Executive Summary NHTSA analyses have found that hybrid vehicles strike pedestrians and bicyclists more often at low speed than vehicles with internal combustion engines (ICEs). Testing has shown that electric and hybrid electric vehicles emit less sound and are quieter at low speeds than vehicles with internal combustion engines. The Pedestrian Safety Enhancement Act (PSEA) requires NHTSA to conduct a rulemaking to require an alert sound for pedestrians to be emitted by all types of motor vehicles that are electric vehicles (EVs) or hybrid vehicles (HVs). The covered types of vehicles include light vehicles (passenger cars, vans, sport utility vehicles and pickup trucks), and also low-speed vehicles, motorcycles, medium and heavy trucks and buses. While all these vehicle types are discussed, the analysis focuses on light vehicles, where the most data resides, and the cost effectiveness section only analyzes low-speed and light vehicles. The baseline for this analysis is a projected fleet of electric and hybrid electric vehicles in 2016, the projected first year of the phase-in effective date, assuming that all applicable MY 2016 vehicles had to meet the proposal1. The agency predicts that there will be an increasing percentage of electric and hybrid electric vehicles sold over time and that both the costs and benefits will increase proportionally to the increasing percentage of applicable vehicles. However, as explained below, we assume that even without the legislation, all EV manufacturers would have put sound in their vehicles. Therefore, there will be little cost or benefit for EVs. 2016 Target Population (Applicable vehicles2 and injuries) 671,270 hybrid and electric vehicles annually will be subject to the proposal (low-speed and light vehicles) 4 percent of MY2016 sales. 31,500 hybrid and electric medium and heavy trucks, buses and motorcycles annually will be subject to the proposal. This is 2 percent of MY2016 sales. Pedestrians+Pedalcyclists and Low Speed and Light Vehicles 2790 additional pedestrian and pedalcyclist injuries are expected over the lifetime of the MY 2016 low-speed and light vehicle fleets if 4% of the light vehicle fleet is hybrid/electric vehicles instead of ICEs (due to differences in sound). An additional 10 pedestrian and pedalcyclist injuries are expected over the lifetime of the MY 2016 fleet of electric low speed vehicles. Pedestrians+Pedalcyclists and Other Vehicles 7,294 total pedestrian and pedalcyclist injuries are expected over the lifetime of all MY 2016 medium and heavy trucks, buses, and motorcycles.
1 We selected MY 2016 as the baseline, but the analysis does not consider the phase-in in its calculations. It estimates the costs and benefits assuming all applicable vehicles in the MY 2016 fleet would meet the proposal. 2 Those vehicles that must provide an alert sound, which by our definition includes hybrids that can run exclusively on electric power, and excluding fully electric light vehicles that we assume would have voluntarily provided an alert sound.

ii
The number of additional pedestrian and pedalcyclist injuries caused by quietness of hybrid/electric medium trucks, heavy trucks, buses, and motorcycles in the MY 2016 fleet is unknown. However, for context, an estimated 16 percent of medium trucks, 1 percent of heavy trucks, 8 percent of buses, and 0.4 percent of motorcycles will be subject to the proposal.
System Effectiveness The agency assumes that the minimum sound requirement will make the pedestrian and bicyclist crash rate for EVs and HVs equal to the pedestrian and bicyclist crash rate of ICEs for light vehicles and low speed vehicles. This assumption results in an estimate that for light vehicles pedestrian crashes would be reduced by about 1 percent and pedalcyclist crashes would be reduced by less than 2 percent. Some auto manufacturers and safety and acoustics experts have come to the conclusion that the increased rate of crashes between hybrid and electric vehicles operating at low speeds and pedestrians/pedalcyclists is caused by the fact that these vehicles produce less sound than vehicles equipped with an ICE. The agency believes that requiring EVs and HVs to produce sounds meeting the acoustic requirements contained in the proposal will reduce risk of crashes between EVs and HVs and pedestrians to same risk level of a crash between ICE vehicles and pedestrians. Numerous studies by motor vehicle manufacturers and academics have found that sound, or lack thereof, influences pedestrians’ decisions about when to cross a street. The agency’s Phase 2 research showed that sounds with certain acoustic characteristics were at least as detectable to the study participants as the sound produced by ICE vehicles. Some studies have shown that sounds designed using psychoacoustic principals are more detectable than the sounds produced by ICE vehicles.3 To date no studies have linked the increase in the detectability of a sound to a reduction in the risk of crashes between EVs and HVs and pedestrians. The agency believes that sounds meeting the requirements contained in the proposal will be as detectable as an ICE vehicle. If the sound produced by EVs and HVs is detectable to pedestrians, they will be able to response to the presence of a vehicle thereby avoiding a collision. The agency plans to conduct additional research before issuing a final rule to confirm that sounds meeting the requirements contained in the proposal will be detectable at the distances predicted in the detection model. We have not attempted to estimate the effectiveness for medium and heavy trucks, buses, and motorcycles because of the lack of data.
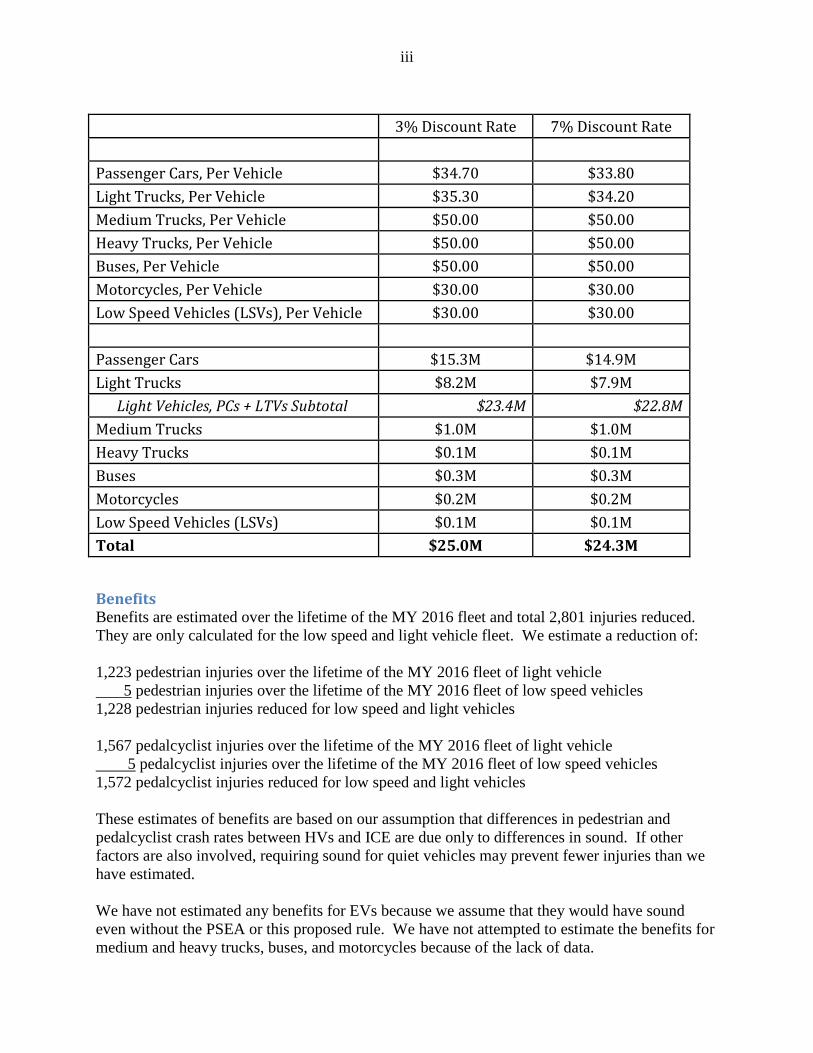
Costs An alert sound system is estimated to cost $30 per vehicle. In addition, there are fuel costs which add $4 to $5 per vehicle for the MY 2016 light vehicle fleet (present discounted value over the lifetime of the vehicle). We haven’t tested electric or hybrid medium/heavy trucks or motorcycles, so a partial estimate of cost is presented assuming their technology cost is also $30 -$50 per vehicle depending on size. We did not estimate fuel costs for these other types of vehicles.
Those vehicles that must provide an alert sound, which by our definition includes hybrids that can
iii
3% Discount Rate 7% Discount Rate Passenger Cars, Per Vehicle $34.70 $33.80 Light Trucks, Per Vehicle $35.30 $34.20 Medium Trucks, Per Vehicle $50.00 $50.00 Heavy Trucks, Per Vehicle $50.00 $50.00 Buses, Per Vehicle $50.00 $50.00 Motorcycles, Per Vehicle $30.00 $30.00 Low Speed Vehicles (LSVs), Per Vehicle $30.00 $30.00 Passenger Cars $15.3M $14.9M Light Trucks $8.2M $7.9M Light Vehicles, PCs + LTVs Subtotal $23.4M $22.8M Medium Trucks $1.0M $1.0M Heavy Trucks $0.1M $0.1M Buses $0.3M $0.3M Motorcycles $0.2M $0.2M Low Speed Vehicles (LSVs) $0.1M $0.1M Total $25.0M $24.3M
Benefits Benefits are estimated over the lifetime of the MY 2016 fleet and total 2,801 injuries reduced. They are only calculated for the low speed and light vehicle fleet. We estimate a reduction of: 1,223 pedestrian injuries over the lifetime of the MY 2016 fleet of light vehicle 5 pedestrian injuries over the lifetime of the MY 2016 fleet of low speed vehicles 1,228 pedestrian injuries reduced for low speed and light vehicles 1,567 pedalcyclist injuries over the lifetime of the MY 2016 fleet of light vehicle 5 pedalcyclist injuries over the lifetime of the MY 2016 fleet of low speed vehicles 1,572 pedalcyclist injuries reduced for low speed and light vehicles These estimates of benefits are based on our assumption that differences in pedestrian and pedalcyclist crash rates between HVs and ICE are due only to differences in sound. If other factors are also involved, requiring sound for quiet vehicles may prevent fewer injuries than we have estimated. We have not estimated any benefits for EVs because we assume that they would have sound even without the PSEA or this proposed rule. We have not attempted to estimate the benefits for medium and heavy trucks, buses, and motorcycles because of the lack of data.

iv
Net Impact [Pedestrians and Pedalcyclists Combined]
Total Benefits and Costs Summary for Light Vehicles and Low Speed Vehicles, MY2016, 2010$
3% Discount Rate 7% Discount Rate Total Monetized Benefits $178.7M $146.3M
Total Costs (Install+Fuel) $23.5M $22.9M Total Net Impact (Benefit – Costs) $155.2M $123.4M
Benefits and Costs Summary for Light Vehicles and Low Speed Vehicles By Vehicle Type, MY2016, 2010$
3% Discount Rate 7% Discount Rate Passenger Cars Monetized Benefits $122.7M $102.4M Light Trucks Monetized Benefits $55.3M $43.4M Low Speed Monetized Benefits $663,000 $543,000
Passenger Cars Total Cost (Install+Fuel) $15.3M $14.9M LTV Total Cost (Install+Fuel) $8.2M $7.9M Low Speed Total Cost (Install) $87,000 $85,000 Passenger Cars Net Impact
$107.5M $87.5M (Benefits – Costs) Light Trucks Net Impact
$47.1M $35.5M (Benefits – Costs) Low Speed Vehicles Net Impact
$576,000 $458,000 (Benefits – Costs) Total Net Impact
$155.2M $123.5M (Benefit – Costs)
Cost Effectiveness After applying the proposal’s requirement that all applicable vehicles make a sound meeting the proposed detection and recognition requirements and applying discount rates of three and seven percent to benefits, the cost per equivalent life saved ranged from $0.83 to $0.99 million. According to our present model, a countermeasure that allows a vehicle to meet the proposed

v
minimum sound requirements would be cost effective compared to our comprehensive cost estimate of the value of a statistical life of $6.3 million.
Cost per Equivalent Life Saved Passenger Cars Light Trucks Light Vehicles 3% Discount Rate $0.79 million $0.94 million $0.83 million 7% Discount Rate $0.92 million $1.15 million $0.99 million

1
I. Introduction On January 4, 2011, the Pedestrian Safety Enhancement Act of 2010 (Public Law 111-373) was signed into law. The Pedestrian Safety Enhancement Act (PSEA) requires NHTSA to conduct a rulemaking to establish a Federal Motor Vehicle Safety Standard (FMVSS)4 requiring an alert sound for pedestrians to be emitted by all types of motor vehicles that are electric vehicles5 (EVs) or hybrid vehicles6 (HVs). The covered types of vehicles include, not only light vehicles (passenger cars, vans, sport utility vehicles and pickup trucks), but also low speed vehicles, motorcycles, medium and heavy trucks and buses. Trailers are specifically excluded from the requirement for sound by the PSEA. The goal is to establish performance requirements for the minimum sound necessary for a vehicle that allows blind and other pedestrians to reasonably detect a nearby EV or HV. The alert sound must not require activation by the driver or the pedestrian, and must allow pedestrians to reasonably detect an EV or HV in critical operating scenarios such as, but not limited to, constant speed, accelerating, or decelerating. The standard must specify performance requirements for an alert sound that enables blind and other pedestrians to reasonably detect EVs and HVs operating below their cross-over speed.7 The PSEA defines “alert sound” as a “vehicle-emitted sound that enables pedestrians to discern the presence, direction, location, and operation of the vehicle.” The PSEA specifies several requirements regarding the performance of the vehicle sound to enable pedestrians to discern the operation of vehicles subject to the Act. First, the sound must be sufficient to allow a pedestrian to reasonably detect a nearby EV or HV operating at constant speed, accelerating, decelerating and operating in any other scenarios that NHTSA deems appropriate. Second, it must reflect the agency’s determination of the minimum sound level emitted by a motor vehicle that is necessary to allow blind and other pedestrians to reasonably detect a nearby EV or HV operating below the cross-over speed. Nothing in the Act specifically requires that the sound be electrically generated. Therefore, if manufacturers wish to meet the minimum sound level requirements specified by the agency through the use of sound generated by the vehicle’s power train or any other vehicle component, there is nothing in the PSEA to limit their flexibility to do so. The vehicle’s sound must also reflect the agency’s determination of the performance requirements necessary to ensure that each vehicle’s sound is recognizable to pedestrians as that of a motor vehicle in operation. We note that the requirement that the sound be recognizable as a run exclusively on electric power, and excluding fully electric light vehicles that we assume would have voluntarily provided an alert sound. Safety Act. 5 Section 2(10) of the PSEA defines “electric vehicle” as a motor vehicle with an electric motor as its sole means of propulsion. 6 Section 2(9) of the PSEA defines “hybrid vehicle” as a motor vehicle which has more than one means of propulsion. As a practical matter, this term is currently essentially synonymous with “hybrid electric vehicle.” 7 Section 2(3) of the PSEA defines “cross-over speed” as the speed at which tire noise, wind resistance, or other factors make an EV or HV detectable by pedestrians without the aid of an alert sound. The definition requires NHTSA to determine the speed at which an alert sound is no longer necessary.

2
motor vehicle in operation does not mean that the sound be recognizable as a vehicle with an internal combustion engine (ICE). The PSEA mandates that the FMVSS shall not require the alert sound to be dependent on either driver or pedestrian activation. It also requires that the safety standard allow manufacturers to provide each vehicle with one or more alert sounds that comply, at the time of manufacture, with the safety standard. Thus, a manufacturer may, at its option, equip a vehicle with different sounds to denote different operating scenarios, such as reverse or start up. Each vehicle of the same make, model, and model year must emit the same alert sound or set of sounds. The standard is required to prohibit manufacturers from providing anyone, other than the manufacturer or dealers, with a device designed to disable, alter, replace or modify the sound or set of sounds emitted from the vehicle to meet the FMVSS. A manufacturer or a dealer, however, is allowed to alter, replace, or modify the alert sound or set of sounds in order to remedy a defect or non-compliance with the safety standard. Additionally, vehicle manufacturers, distributors, dealers, and motor vehicle repair businesses would be prohibited from rendering the sound system inoperative under Section 30122 of the Vehicle Safety Act. The PSEA requires NHTSA to consider the cumulative community noise impact of any vehicle sound required by the new safety standard. In addition, NHTSA will consider the environmental analysis required by the National Environmental Policy Act (NEPA) when setting the standard. Finally, the PSEA requires NHTSA to conduct a study and report to Congress whether the agency believes that there is a safety need to require a minimum sound for some motor vehicles with internal combustion engines. The report must be submitted to Congress by January 4, 2015. If NHTSA determines that there is a safety need to require alert sounds for those motor vehicles the agency must initiate a rulemaking to require alert sounds for them. The agency has established three dockets to enhance and facilitate cooperation with outside entities including international organizations. The first docket (No. NHTSA-2008-0108)8 was created after the 2008 public meeting was held; it contains a copy of the notice of public meeting in the Federal Register, a transcript of the meeting, presentations prepared for the meeting and comment submissions. It also includes NHTSA’s research plan, our “Notice of Intent to Prepare an Environmental Assessment for the Pedestrian Safety Enhancement Act of 2010” (NOI) published on July 12th 2011 in the Federal Register, and the agency’s Phase 1 and 2 research reports. The second docket (No. NHTSA-2011-0100)9 was created to collect comments on the NOI; it also includes a copy of that notice. The third docket (No. NHTSA-2011-0148)10 was created in September 2011 to include all the material the agency has gathered “The Pedestrian Safety Enhancement Act of 2010”, research reports, statistical reports, meeting presentations,
8 http://www.regulations.gov/#!searchResults;rpp=10;po=0;s=NHTSA-2008-0108 9 http://www.regulations.gov/#!searchResults;rpp=10;po=0;s=%252BNHTSA-2011-0100 10 http://www.regulations.gov/#!searchResults;rpp=10;po=0;s=NHTSA-2011-0148

3
resubmissions from outside parties, etc.), outside up to and including the Notice of Proposed Rulemaking. This Preliminary Regulatory Impact Analysis discusses the testing the agency has performed to examine the issue, and the costs and benefits of requiring a minimum sound on electric and hybrid electric vehicles.

4
II. Research and Proposal NHTSA analysis of crash data (to be discussed further in the benefits section) found that hybrid electric vehicles were striking pedestrians at a statistically significant higher rate, particularly in low speed maneuvers11. That analysis led the agency to examine the sound levels emitted from hybrid electric vehicles in a variety of low speed maneuvers. All of the research done to date has been on light vehicles. The agency wants to understand the issues with light vehicles before considering what additional issues may be posed with electric motorcycles and electric or hybrid medium and heavy duty trucks because the great majority of hybrid and electric vehicles available today are light vehicles. Sound is a new research frontier for NHTSA. Research has taken place in several phases as the agency learned more and more about the issues. In April 2010, NHTSA issued a report presenting results of Phase 1 of the agency’s research.12 This report documents the cumulative sound levels and general spectral content for a selection of ICE vehicles and HVs in different operating conditions, evaluates pedestrian ability to detect vehicles in two ambient background noise levels, and considers countermeasure concepts that are categorized as vehicle-based, infrastructure-based, and systems requiring vehicle-pedestrian communications. Those results showed that the cumulative sound levels for the HVs tested are noticeably lower at low speeds than for the ICE vehicles tested. ICE vehicles tested were detected sooner than their HV twins. Pedestrian response time to detect a target vehicle varies by vehicle operating condition, ambient sound level, and vehicle type (i.e., ICE vehicle versus HV in EV mode).
In October 2011 NHTSA released a second report examining issues involving hybrid and electric vehicles and blind pedestrian safety titled “Quieter Cars and the Safety of Blind Pedestrians, Phase 2: Development of Potential Specifications for Vehicle Countermeasure Sounds.” The research conducted by Volpe first sought to define acoustic specifications to be used as alert sounds for quiet vehicles based on the sounds produced by ICE vehicles. Volpe then analyzed the loudness of the ICE sounds in a suburban ambient using psychoacoustic modeling. Volpe used human subject testing to evaluate the performance of several different varieties of countermeasure sounds including ICE sounds. Based on the results from the Phase I research, the psychoacoustic modeling and the human subjects testing Volpe developed potential specifications for vehicle countermeasure sounds.
The third phase of NHTSA’s research involving quiet vehicles consisted of developing an objective, repeatable test procedure and objective specifications for minimum sound 11 Maneuvers such as pulling out of a driveway, slowing for a turn, or backing out of a parking space. 12 Garay-Vega, Lisandra; Hastings, Aaron; Pollard, John K.; Zuschlag, Michael; and Stearns, Mary D., Quieter Cars and the Safety of Blind Pedestrians: Phase I, John A. Volpe National Transportation Systems Center, DOT HS 811 304 April 2010, available at http://www.nhtsa.gov/DOT/NHTSA/NVS/Crash%20Avoidance/Technical%20Publications/2010/811304rev.pdf.

5
requirements for hybrid and electric vehicles. NHTSA’s Vehicle Research and Test Center (VRTC) conducted acoustic measurements and recordings of several HVs and EVs and those vehicle’s ICE pair vehicles. Volpe used these recordings as well as data from the Phase 1 and Phase 2 research to identify parameters and criteria for sounds to be detectable and recognizable as a motor vehicle.
Phase 1 As part of Phase 1 research NHTSA sought to identify critical operating scenarios necessary for the safety of visually-impaired and other pedestrians. The researchers identified these scenarios based on crash data, literature reviews, and unstructured conversations with blind pedestrians and orientation and mobility specialists. Scenarios were defined by combining pedestrian vehicle environments, vehicle type, vehicle maneuver/speed/operation, and considerations for ambient sound level. The critical operating scenarios identified in Phase 1 were:
• Vehicle approaching at low speed (6 mph and 10 mph): One of the strategies used by pedestrians who are blind is to cross when the road is quiet. This technique assumes that it is safe to proceed when a vehicle is loud enough to be heard far enough away, there are no other masking sounds present, and no other vehicles are detected.
• Vehicle backing out, as if coming out of a driveway (5 mph): There is a concern that quieter vehicles may not be detectable when backing out. This scenario is complex for pedestrians since it is difficult to anticipate where there may be a driveway and the driver’s visibility may be limited. The pedestrian may have limited time to react and respond to avoid a conflict.
• Vehicle travelling in parallel and slowing (from 20 mph to 10 mph): Pedestrians who are blind often need to distinguish between a vehicle moving through an intersection and a vehicle turning into their path. The pedestrian needs to perceive this information when the vehicle is in the parallel street, before it turns into his or her path. The sound of slowing vehicles in the parallel street helps pedestrians identify turning vehicles.
• Vehicle accelerating from stop: Pedestrians who are blind use the sound of traffic in the parallel street to establish alignment and to identify a time to cross. The sound of accelerating vehicles in the parallel street indicates, for example, that the perpendicular traffic does not have the right of way and thus a crossing opportunity is available. Pedestrians may initiate their crossing as soon as they detect the surge of parallel traffic or may delay the decision to make sure traffic is moving straight through the intersection and not turning into their path. A delay in detecting the surge of parallel traffic may impact the opportunity to complete a crossing within the designated walking interval.
• Vehicle stationary: The sound of vehicles idling provides important cues. For example, the sound of a vehicle in the far lane gives cues about the width of the road (number of lanes), and conveys information about the distance to walk and the time needed to navigate across the street. A quieter vehicle may not be detected when it is stationary at intersections or parking lots and it may start moving suddenly at the same time a pedestrian enters the conflicting path.
The agency compared the sound of matched pairs of vehicles – one with an ICE and the other a hybrid. Since there is no ICE Prius, a similar vehicle (the Toyota Matrix) served as its ICE

6
counterpart.13 Average A-weighted sound levels for each of the six vehicles tested are reported in Table II-1. Typically the difference in sound levels detectable by humans is 3dBA.
Table II-1
Cumulative A-Weighted Sound Level at the Microphone Location (12 ft)
Average A-weighted dB level, LAeq0.5s
Scenario / Vehicle
Operation
2010 Toyota Prius
2009 Toyota Matrix
Honda Civic
Hybrid
Honda Civic ICE
2009 Toyota Highlander
Hybrid
2008 Toyota Highlander
Approaching at 6 mph
44.7 53.5 49.3 52.0 53.2 55.5
Backing out (5 mph)
44.2 51.3 48.5 58.2 45.9 52.7
Slowing from 20 to 10 mph
53.0 54.2 56.6 55.0 53.0 55.4
Acceleration 62.9 63.1 65.4 63.5 64.8 64.9
Idle background 47.8 44.8 46.0 background 48.1
Crossover speed Measurements were collected for vehicles approaching at constant speeds (6 mph. 10 mph, 20 mph, 30 mph, and 40 mph) in order to document the convergence, if any, of HVs and ICEs at higher speeds. The sound level of all the HVs converged with their ICE peers by 20 mph, above which either the ICE in the HV engaged, the tire and wind noise became dominant, or both. The sound emitted by HVs also tended to have less high frequency content than ICEs at low speeds. Further details and results from this study can be found in NHTSA’s final report DOT HS 811 304.14 The sound level of three of the HVs tested during the agency’s Phase 1 research were within 3 A-weighted dB of their ICE peer vehicles at 16 km/hr (10 mph) with the sound levels for all HVs meeting those of their peer ICE vehicles at 32 km/hr (20 mph). During the agency’s Phase 3 research, an EV (Nissan Leaf) and three HVs with prototype sound systems and their ICE peer vehicles were tested to compare the sound levels of HVs and EVs and their ICE peers when stationary but activated, 10 km/hr (6 mph), 20 km/hr (12 mph), and 30 km/hr (18 mph). Only one of the HVs tested during the Phase 3 research was within 3 A-weighted dB of its ICE peer at 20 km/hr (12 mph), the same hybrid produced a sound level 3.5
13 The Matrix was used as a best-fit peer for the Phase 1 sound level testing, but the Corolla was used as a best-fit peer for later statistical analysis, due to its higher sales. 14 See Docket for this notice, Item # NHTSA-2011-0148-0004.

7
A-weighted dB above its ICE peer at 30 km/hr (18 mph). The sound level produced by the Nissan Leaf was 5 A-weighted dB lower than its ICE peer, the Nissan Versa, at 20 km/hr (12 mph) and 4 A-weighted dB lower than the Versa at 30 km/hr (18 mph) with its sound generation system turned off. The other HV tested was 5 A-weighted dB lower than its ICE peer at 20 km/hr (12 mph) and 4 A-weighted dB lower than its ICE peer vehicle at 30 km/hr (18 mph). Our research data from Phase 1 and Phase 3 shows that the sound level gap between HVs or EVs and their ICE peer vehicles still exists at 20 km/hr (12 mph) and becomes much smaller or negligible in some tests at 30 km/hr (18 mph). Also, the EVs and HVs tested in Phase 3 research did not meet our minimum sound pressure level detectability requirements at 20 km/hr (12 mph). For these reasons, NHTSA tentatively concludes that ensuring EVs and HVs produce a minimum sound level until they reach a speed of 30 km/hr (18 mph) will ensure that these vehicles produce sufficient sound to allow pedestrians to detect them. The agency solicits comments on whether 20 km/hr (12 mph) should be considered the crossover speed, as an alternative to the 30 km/h (18 mph) crossover speed as well as additional research data that support this speed. Auditory Detectability of Vehicles in Critical Safety Scenarios15 16 In Phase 1, NHTSA compared the auditory detectability of HVs and ICE vehicles among pedestrians who are legally blind. Forty-eight independent travelers, with self-reported normal hearing, listened to binaural17 audio recordings of two HVs and two ICE vehicles in three operating conditions, and two different ambient sound levels. The operating conditions included: approaching at a constant speed (6 mph); backing out at 5 mph; and slowing from 20 to 10 mph (as if to turn right). The ambient sound levels were a quiet rural (31.2 dB (A)) and a moderately noisy suburban ambient (49.8 dB (A)). Overall, participants took longer to detect the two HVs tested (operated in electric mode) in all critical operating scenarios, except for the slowing maneuver. Vehicle type, ambient level, and operating condition had a significant effect on response time. Data collection included missed detection frequency and response time (and corresponding time-to-vehicle arrival and detection distance). Missed detection frequency is defined as instances when the target vehicle is present and the participant fails to respond. Response time is computed as the time from the start of a trial to the instant the participant presses a space bar as an indication he/she detects the target vehicle. The time-to-vehicle-arrival is the difference between
15 Garay-Vega, L; Hastings, A.; Pollard, J.K.; Zuschlag, M. & Stearns, M. (2010). Quieter Cars and the Safety of Bind. Pedestrians: Phase 1. DOT HS 811 304 Washington, DC: National Highway Traffic Safety Administration. http://www.nhtsa.gov/staticfiles/DOT/NHTSA/NRD/Multimedia/PDFs/Crash%20Avoidance/2010/811304.pdf; 16 Garay-Vega, L., Hasting A., Pollard, J.K., and Guthy, G. (2011) Auditory Detectability of Hybrid Electric Vehicles by Pedestrians Who Are Blind. 90th Annual Meeting Transportation Research Board January 23-27, Washington, D.C. http://amonline.trb.org/12ktc8/1 17 Binaural recordings reproduce the acoustic characteristics of the sound similar to how a human perceives it.

8
the duration of a trial and the response time. Detection distance is the longitudinal space between the vehicle and the pedestrian (microphone) location at the instant the participant indicated detection of a target vehicle. Time-to-vehicle-arrival is the time from first detection of a target vehicle to the instant the vehicle passes the microphone line/pedestrian location. A repeated measure of analysis of variance (ANOVA) was used to analyze the main and interaction effects of the independent variables; vehicle type, vehicle maneuver and ambient sound level. A separate analysis was completed for each scenario; a pair-wise t-test compared each vehicle with the other (ICE vehicle and HV twins) for each ambient sound level. Time-to-vehicle arrival for each vehicle-ambient condition is shown in Table II-2, Table II-3 and Table II-4 for each of three scenarios. Vehicle Approaching at Low Speed (6 mph (9.6 km/h) Pass by): The first traveling situation examined was a pedestrian standing on the curb waiting to cross a one-way street where there may be vehicles approaching from the left. Some trials included a target vehicle and some trials only background noise. The target vehicle in this scenario was traveling from the left at a constant speed of 6 mph. There were vehicles in the background in all trials. The pedestrian had to be able to detect a vehicle that would affect the decision about when to start to cross the street. This scenario tested the distance and time at which a pedestrian can detect a vehicle approaching at low speed. On average, participants took 1.1 seconds longer to detect vehicles in the high ambient sound condition than in the low ambient sound condition. The main effect of ambient was statistically significant [F (1, 47) = 35.0; p< 0.05]. The mean time-to-vehicle-arrival was 5.5 and 4.3 seconds for the low and high ambient condition respectively. Participants detected both ICE vehicles sooner than the HV twins. The main effect of vehicle was statistically significant (F (2.13, 99.9) = 106.1; p< 0.05). The interaction effect of vehicle and ambient was statistically significant (F (2.80, 131.36) = 11.93; p< 0.05). Table 2 presents the individual differences between ICE vehicles and their HV peers (i.e., Prius vs., Matrix and Highlander hybrid vs. Highlander ICE); pair-wise comparisons are statistically significant within a given ambient condition. Participants were more likely to miss the Toyota HVs than the Toyota ICE vehicles approaching at a constant low speed. The missed detection rates in the low ambient condition were: 0.02 for the Prius; 0.01 for the Matrix; 0.03 for the Highlander Hybrid; and 0.0 for the Highlander ICE vehicle. The corresponding values in the high ambient condition were: 0.21 for the Prius; 0.02 for the Matrix; 0.04 for the Highlander; and 0.01 for the Highlander ICE vehicle.

9
Table II-2 Time-to-Vehicle Arrival and Detection Distance for 6 mph Vehicle Pass-by
by Vehicle Type and Ambient Condition
Vehicle Ambient Sound Level
Time-to-Vehicle Arrival (s)
Detection Distance (ft)
2010 Toyota Prius Low 4.3 37.9
High 2.4 20.9
2009 Toyota Matrix Low 5.5 48.4
High 4.6 40.5
2009 Highlander Hybrid Low 5.3 46.6
High 4.1 36.6
2008 Highlander ICE Low 6.8 59.4
High 6.3 55.1
Vehicle Backing Out (5 mph (8 km/h) Reverse): The second traveling situation was a pedestrian walking along a sidewalk with driveways on the left side; the pedestrian heard distant vehicles in the background in all trials. This is similar to walking in an area that is a few blocks away from a main road. The target vehicle was a nearby vehicle backing towards the pedestrian at a constant speed of 5 mph. This task is complex for pedestrians since it is difficult to anticipate where there may be a driveway and when a vehicle will move out of a driveway. In addition, a driver’s visibility may be limited and the pedestrian may have very limited time to respond to avoid a conflict. The main effect of ambient was statistically significant (F (1, 47) = 96.64; p< 0.05). The average time-to-vehicle-arrival was 4.4 and 2.7 seconds for the low and high ambient condition, respectively. Participants took longer to detect both HVs than their ICE twins. The main effect of vehicle type was statistically significant (F (2.72, 128.0) = 115.0; p< 0.05). Table II-3 shows the individual differences between ICE vehicles and their HV twins; pair-wise comparisons were statistically significant within a given ambient condition. Participants were more likely to miss the Toyota HVs than the Toyota ICE vehicles in the backing out session. The missed detection rates in the low ambient condition were: 0.05 for the Prius; 0.02 for the Matrix; 0.10 for the Highlander Hybrid; and 0.02 for the Highlander ICE. The corresponding values in the high ambient condition were: 0.11 for the Prius; 0.0 for the Matrix; 0.26 for the Highlander; and 0.02 for the Highlander ICE. On average, participants took longer to detect vehicles in the high ambient sound condition than in the low ambient sound condition.

10
Table II-3 Time-to-Vehicle Arrival and Detection Distance for Vehicle Backing out by Vehicle and
Ambient Condition
Vehicle Ambient Sound Level Time-to-Vehicle Arrival (s)
2010 Toyota Prius Low 4.0
High 2.5
2009 Toyota Matrix Low 5.2
High 3.6
2009 Highlander Hybrid Low 3.3
High 1.4
2008 Highlander ICE Low 5.2
High 3.3
Vehicle Traveling in Parallel Lane and Slowing (Slowing from 20 to 10 mph (32 to 16 km/h): The third and last traveling situation examined in the study was a pedestrian trying to decide when to start crossing a street with the signal in his/her favor and a surge of parallel traffic on the immediate left. The sound of slowing vehicles in the parallel street helps blind pedestrians identify turning vehicles. In some trials (no-signal condition), a vehicle continued straight through the intersection at 20 mph, so pedestrians can cross whenever they choose. However, in other trials there was a vehicle slowing from 20 mph to 10 mph as if to turn right into the pedestrian path (target vehicle). The pedestrian had to be able to detect when the vehicle was slowing. This scenario tests whether the pedestrian perceived this information when the vehicle was in the parallel street. Table II-4 shows the time-to-vehicle arrival and detection distance for the ‘vehicle slowing’ scenario. Pair-wise comparisons (HV vs. ICE twin) were statistically significant within a given ambient condition. On average, participants detected HVs sooner than their ICE vehicle twins. The main effect of vehicle was statistically significant [F (2.04, 96) = 163.85; p< 0.05]. The trend observed in the vehicle-slowing scenario (i.e., HVs are detected sooner than their ICE vehicle twins) may be explained by a noticeable peak in the 5000 Hz one-third octave band for the HVs tested during this operation. The tone emitted was associated with the electronic components of the vehicles when braking (e.g., regenerative braking). The missed detection rates in the low ambient condition were: 0.05 for the Prius; 0.31 for the Matrix; 0.03 for the Highlander Hybrid; and 0.17 for the Highlander ICE vehicle. The missed detection rates in the high ambient condition were: 0.05 for the Prius; 0.35 for the Matrix; 0.03 for the Highlander Hybrid; and 0.17 for the Highlander ICE vehicle.

11
Table II-3 Time-to-Vehicle Arrival and Detection Distance for Vehicle Decelerating from 20 to 10
mph by Vehicle Type and Ambient Condition
Vehicle Ambient Sound Level
Time-to-Vehicle Arrival (s)
Detection Distance (ft)
2010 Toyota Prius Low 2.0 35.9
High 1.9 33.8
2009 Toyota Matrix Low 1.1 18.0
High 0.8 12.8
2009 Highlander Hybrid Low 3.0 58.8
High 2.7 51.6
2008 Highlander ICE Low 1.5 25.7
High 1.3 21.8
Table II-5 shows the time-to-vehicle arrival by vehicle type, and ambient condition. Considering all three independent variables, there was a main effect of vehicle type [F (2.5, 119.4) = 78.13; p < 0.05], vehicle maneuver [F (1.69, 79.59) = 146.49; p < 0.05], and ambient sound level [F (1, 47) = 94.21; p < 0.05]. Similarly, there were interaction effects between vehicle type and ambient [F (2.68, 125.89) = 4.54; p < 0.05]; vehicle type and maneuver [F (3.818, 179.43) = 137.37; p < 0.05], ambient and vehicle maneuver [F (1.99, 93.31) = 31.71; p < 0.05], and a three way interaction between ambient, vehicle type and vehicle maneuver [F (4.6, 216.50) = 9.673; p < 0.05].
Table II-4 Average Time-to-Vehicle Arrival by Scenario, Vehicle Type and Ambient Sound (in seconds)
Low Ambient High Ambient Scenario HVs ICE Vehicles HVs ICE Vehicles Approaching at 6 mph 4.8 6.2 3.3 5.5
Backing out (5 mph) 3.7 5.2 2.0 3.5
Slowing from 20 to 10 mph 2.5 1.3 2.3 1.1
In conclusion, the Phase 1 research showed that ICE vehicles were louder and were more detectable, and could be detected earlier, than HV vehicles in all of the low speed conditions examined, except when slowing down. Phase 2

12
NHTSA initiated additional research (Phase 2) in March 2010 to explore potential audible countermeasures to be used in vehicles while operating in electric mode in specific low speed conditions.18 The potential countermeasures explored included quantitative specifications for sound levels and spectral profiles for detectability. The feasibility of objectively specifying other aspects of sound quality for the purpose of predicting recognizability was also explored. In Phase 2 researchers assumed that acoustic countermeasures should provide alerting information at least equivalent to the cues provided by ICE vehicles. Groups representing people who are blind have expressed a preference for sound(s) that will be recognized as that of an approaching vehicle so that it will be intuitive for all pedestrians.19 20 In the Phase 2 research, acoustic data acquired from a sample of 10 ICE vehicles was used to determine the sound levels at which synthetic vehicle sounds, developed as countermeasures, could be set. ICE equivalent sounds were specified using cumulative A-weighted21 sound levels and, one-third octave band22 spectral content. Psychoacoustic models and human subject testing were used to explore issues of detectability, masking, and recognition of ICE-like and alternative sound countermeasures. Psychoacoustic models showed that frequency components between 1600 and 5000 Hz were more detectable due to strong signal strength and relatively low ambient levels in this range. Also, frequency components below 315 Hz were often masked by urban ambient noise. Human subject studies were conducted to evaluate countermeasure sounds in an outdoor, but controlled, environment for 6 mph forward pass-by at two sound pressure levels within the range of typical ICE vehicles. The sounds included ICE-like sounds, alternative (non-ICE-like) sounds designed according to psychoacoustic principles to improve detectability, and sounds that combine alternative sounds with some ICE-like components. In addition to the countermeasure sounds, an ICE vehicle sound was included in the study as a baseline for comparison purposes.
18 Hastings, A., Pollard, J. K., Garay-Vega, L., Stearns, M. D., & Guthy, C. (2011, October). Quieter Cars and the Safety of Blind Pedestrians, Phase 2: Development of Potential Specifications for Vehicle Countermeasure Sounds. (Report No. DOT HS 811 496). Washington, DC: National Highway Traffic Safety Administration. 19 Goodes, P.; Bai, Y.B. and Meyer, E. (2009). Investigation into the Detection of a Quiet Vehicle by the Blind Community and the Application of an External Noise Emitting System. SAE 2009-01-2189. 20 Maurer, M. (2008). The Danger Posed by Silent Vehicles. National Federation of the Blind. Remarks
made for the United Nations Economic Commission for Europe, Working Party on Noise. 47th GRB session February 19, 2008 Geneva. Informal Document No. GRB-47-10. http://www.unece.org/trans/doc/2008/wp29grb/ECE-TRANS-WP29-GRB-47-inf10e.pdf
21 A-weighting: A filter that attenuates low and high frequencies and amplifies some mid-range frequencies. The A-weighting curve approximates the equal loudness contour at 40 dB. 22 One-third Octave Band: Frequency band that is one-third of an octave band or whose lower and upper limits are 2 1/3 times the center frequency apart, as defined by their half-power points. For example a one-third octave band centered at 1000 Hz has upper and lower cutoff frequencies at about 890 and 1120 Hz and a bandwidth of 230 Hz. A one-third octave band centered at 4000 Hz has upper and lower cutoff frequencies at about 3560 and 4490 Hz and a bandwidth of 930 Hz.
13
Synthetic sounds that resemble those of an ICE produce similar detection distances as actual ICE vehicles. Some of the synthetic sounds examined in the study that were designed according to psychoacoustic principles produced detection distances twice as long as those of ICE sounds. A human subject study was conducted to compare the auditory detectability of potential sounds for hybrid and electric vehicles operating at a low speed. The sounds evaluated included: (1) sounds produced by vehicles with integrated sound systems rented from manufacturers, and (2) sounds produced by prototype systems rented from manufacturers, and played back by loudspeakers temporarily mounted on HVs rented separately. Phase 2 suggest that synthetic sounds that resemble those of an ICE produce similar detection distances as actual ICE vehicles. In some instances, synthetic sounds designed according to psychoacoustic principles can produce double the detection distances relative to the reference vehicle. The results also suggest that synthetic sounds that contain only the fundamental combustion noise are relatively ineffective. None of the analyses found a significant effect of vision ability.23 Participants who are legally blind, on average, were no better or worse than sighted participants in detecting the approach sounds. This research examined four potential ways in which countermeasure sounds could be specified. The study examined countermeasure sounds based on recordings of ICE vehicles, synthetically generated countermeasure sounds that emulate the sounds of an ICE, non-ICE like countermeasure sounds designed for maximum detectability at a given sound-pressure level, and synthetically generated sounds that have special characteristics to enhance detection and characteristics that ensure that the sounds resemble ICE sounds. The report notes that an objective specification for non-ICE-like sounds is more difficult to develop than one for synthetic sound generators that emulate the sound of typical ICEs. The report noted that the former approach could result in a wider variety of sounds, some of which might be not recognized as a vehicle or might be perceived as annoying. Phase 3 In the early Spring of 2011, NHTSA initiated additional research and data collection activities to further support of this rulemaking (Phase 3)24. One goal of the Phase 3 research program was to identify parameters and criteria for sounds to be detectable and recognizable as a motor vehicle. The frequency range, minimum sound level for selected one-third octave bands, and requirements for broadband noise and tones were examined as possible criteria for vehicle sound. Also considered were the relative proportions of acoustical energy emitted from a vehicle as a function of direction (directivity) and ways to denote changes in vehicle speed. Acoustic measurements and analyses were completed to support the development of specifications for alerting sounds and test procedures for compliance with agency requirements. Acoustic data were gathered for eight vehicles; four ICE vehicles and four EVs/HVs with alerting sounds (one production and three prototype vehicles). The SAE J2889-1 test procedure was used to measure the sound levels for the stopped and pass-by conditions.25 Acoustic measurements were 23 All participants were required to wear a blindfold during the study. 24 Phase 3 research has been completed, but a final report of this research has not yet been published. 25 See NPRM for a complete discussion of NHTSA’s use of SAE J2889-1.
14
completed on an ISO 10844:1994 noise pad. All HVs and EVs were measured in electric propulsion mode. Variations of this procedure were implemented to explore other aspects such as directivity, sound level as a function of vehicle speed, and to capture binaural recordings. Directivity refers to the relative proportions of acoustical energy that are emitted from a source, in this case a vehicle, as a function of direction to the front, back, left, and right. Acoustic measurements, modeling, and sound simulation tools were used to identify sound attributes that aid in detection of alert sounds and recognition of these sounds as a motor vehicle. Two approaches were considered in the development of parameters for alert sounds. In one approach, sound levels for the alert sound were developed using loudness models and a calculation of safe detection distances. In the other approach, sound levels for alert sounds are based on the sound of current ICE vehicles. This research focused on developing specifications that can be applied to all sounds and that are objective and practical. We investigated and developed the following issues. Acoustic Analysis Performed by Volpe
As part of the Phase 3 research Volpe examined the frequency range, minimum sound level for selected one-third octave bands, and requirements for broadband noise and tones as possible criteria for vehicle sound using a loudness model to determine when the sounds might be detectable in a given ambient. Also considered were the relative proportions of acoustical energy emitted from a vehicle as a function of direction (directivity) and ways to denote changes in vehicle speed. Background Noise
When talking about the detectability of a sound it is important to understand the concepts of background noise (ambient noise) and masking. Masking occurs when the perception of one sound is affected by the presence of an unrelated sound. Background noise affects the extent to which masking occurs. Two characteristics of background sounds are of primary importance: cumulative sound pressure level and the frequency content, or shape, of the frequency spectrum. Critical Frequency Range Critical frequency regions, defined by a set of one-third octave bands, are determined by applying psychoacoustic principles for a given ambient condition. The purpose of identifying a critical frequency region(s) is to ensure that a sound pressure is emitted from the vehicle such that it would be expected to be detectable at a reasonable distance away from a pedestrian. Due to masking effects of the ambient and potential hearing loss of the pedestrian, opportunities for detection will be maximized if the alert signal contains detectable components over a wide frequency range; therefore a minimum level is given for a set of one-third octave bands (critical frequency region) that includes mid-frequency one-third octave bands (315, 400, and 500 Hz) as well as high frequency one-third octave bands (2000, 2500, 3150, 4000, and 5000 Hz). Low frequency bands (below 315 Hz) were not considered due to the expected strong masking effects of the ambient at low frequencies. Mid-frequency bands from 630 to 1600 Hz were also not considered because analysis indicates that, for the ambient considered, these bands contributed more to the overall level than other bands for the same increase in detectability.
15
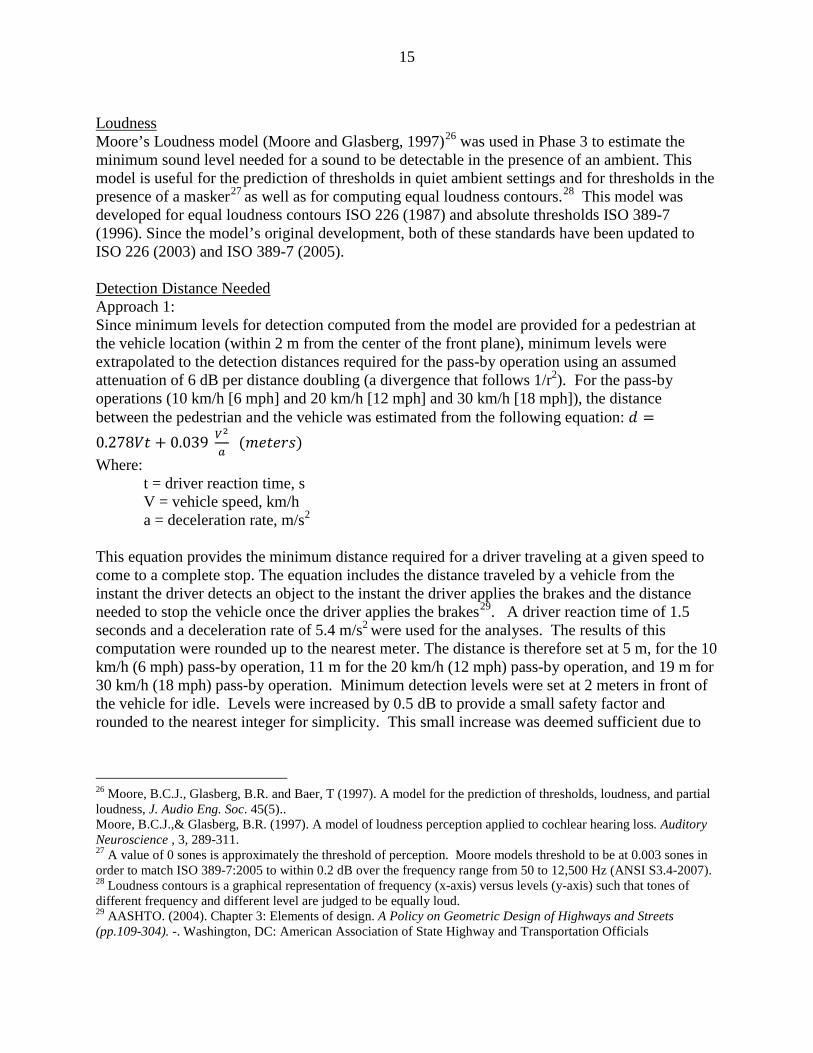
Loudness Moore’s Loudness model (Moore and Glasberg, 1997)26 was used in Phase 3 to estimate the minimum sound level needed for a sound to be detectable in the presence of an ambient. This model is useful for the prediction of thresholds in quiet ambient settings and for thresholds in the presence of a masker27 as well as for computing equal loudness contours.28 This model was developed for equal loudness contours ISO 226 (1987) and absolute thresholds ISO 389-7 (1996). Since the model’s original development, both of these standards have been updated to ISO 226 (2003) and ISO 389-7 (2005). Detection Distance Needed Approach 1: Since minimum levels for detection computed from the model are provided for a pedestrian at the vehicle location (within 2 m from the center of the front plane), minimum levels were extrapolated to the detection distances required for the pass-by operation using an assumed attenuation of 6 dB per distance doubling (a divergence that follows 1/r2). For the pass-by operations (10 km/h [6 mph] and 20 km/h [12 mph] and 30 km/h [18 mph]), the distance between the pedestrian and the vehicle was estimated from the following equation: 𝑑 =0.278𝑉𝑡 + 0.039 𝑉
2
𝑎 (𝑚𝑒𝑡𝑒𝑟𝑠)
Where: t = driver reaction time, s V = vehicle speed, km/h a = deceleration rate, m/s2
This equation provides the minimum distance required for a driver traveling at a given speed to come to a complete stop. The equation includes the distance traveled by a vehicle from the instant the driver detects an object to the instant the driver applies the brakes and the distance needed to stop the vehicle once the driver applies the brakes29. A driver reaction time of 1.5 seconds and a deceleration rate of 5.4 m/s2 were used for the analyses. The results of this computation were rounded up to the nearest meter. The distance is therefore set at 5 m, for the 10 km/h (6 mph) pass-by operation, 11 m for the 20 km/h (12 mph) pass-by operation, and 19 m for 30 km/h (18 mph) pass-by operation. Minimum detection levels were set at 2 meters in front of the vehicle for idle. Levels were increased by 0.5 dB to provide a small safety factor and rounded to the nearest integer for simplicity. This small increase was deemed sufficient due to
26 Moore, B.C.J., Glasberg, B.R. and Baer, T (1997). A model for the prediction of thresholds, loudness, and partial loudness, J. Audio Eng. Soc. 45(5).. Moore, B.C.J.,& Glasberg, B.R. (1997). A model of loudness perception applied to cochlear hearing loss. Auditory Neuroscience , 3, 289-311. 27 A value of 0 sones is approximately the threshold of perception. Moore models threshold to be at 0.003 sones in order to match ISO 389-7:2005 to within 0.2 dB over the frequency range from 50 to 12,500 Hz (ANSI S3.4-2007). 28 Loudness contours is a graphical representation of frequency (x-axis) versus levels (y-axis) such that tones of different frequency and different level are judged to be equally loud. 29 AASHTO. (2004). Chapter 3: Elements of design. A Policy on Geometric Design of Highways and Streets (pp.109-304). -. Washington, DC: American Association of State Highway and Transportation Officials
16
other conservative aspects of the estimation, e.g. multiple detection opportunities due to the multiple components. Approach 2: This approach is based on the idea that current ICE vehicles provide sufficient sound to be detectable. As discussed above, the following one-third octave bands were identified as the critical frequency region: 315, 400, 500, 2000, 2500, 3150, 4000, and 5000 Hz. A total of 152 measurements of idle and 10 km/hr (6 mph) forward pass-by events were analyzed to determine levels for these two operations. Data came from three different sources (the International Organization of Motor Vehicles Manufacturers (OICA) Phase 2 as described above, and Phase 3 research). Sound levels for backing were derived from the 10 km/hr (6 mph) forward levels but adjusted downward by 3 dB to account for directivity. In particular, the sound pressure level in the rear of an ICE vehicle is about 3 dB lower than what is measured at the SAE 2889-1 microphones. Recognition This element applies to both Approach 1 and Approach 2. Recognition includes two aspects: 1) recognition that the sound is emanating from a motor vehicle, 2) recognition of the type of operation that the vehicle is conducting so that the pedestrian can take appropriate measures. Sounds that contain both broadband components and tones can produce sounds that are recognized as vehicles. Sounds that contain only high frequencies have a synthetic (and unpleasant) character. Sounds with lower frequency tones and broadband components have a more conventional character. In Phase 3, parameters that were critical to recognition were determined by simulating sounds. Sound simulations were developed for the following conditions: stationary with the starting system activated30, constant speed pass-bys, and accelerating pass-bys. Pass-bys included Doppler shifts and accelerations also included a pitch shifting tied to vehicle speed. Levels changed as a function of speed and as a function of position relative to the receiver. Roughly two hundred sounds were generated and evaluated. Based on initial assessment and engineering judgment, at least one tone (and preferably more) should be included in the vehicle sound for the purpose of recognition. The lowest tone should have a frequency no greater than 400 Hz. A component is considered to be a tone if the Tone-to-Noise ratio according to ANSI S1.13-1995 31 is greater than 6 dB. Broadband components, which may be modulated, should be in each one-third octave band from 160 Hz to 5000 Hz. Tones at frequencies above 2000 Hz may be included for purposes of detection but would not contribute to recognition. To aid in recognition of vehicle acceleration and deceleration, the pitch (as measured by the fundamental frequency) should increase and decrease by at least one percent per km/hr of speed over the range from 0 km/h to 30 km/h.
30 This condition is commonly referred to as an “idling” vehicle for vehicles with internal combustion engines. However, the term “idle” technically refers to an engine state, not a vehicle state, and has no relevance to electric motors. The description used here of “stationary but activated” means the vehicle is not moving, but its starting system is activated. 31 American National Standard (1995). Procedure for the computation of loudness of steady sound (ANSI S1.13). New York, New York: Secretariat, Acoustical Society of America.

17
A pitch shifting requirement would keep out melodies or sounds that change over time. The low-frequency requirement would convey the sound of rotating machinery. Limiting amplitude modulation would reduce annoyance and help with recognition. Human subject experiments can be useful to refine the sound parameters needed for recognition of an alert sound as the sound of a motor vehicle and to identify sound parameters that could be considered unpleasant or annoying. Alert Sounds Currently Provided by Light Vehicle Manufacturers Automotive manufacturers that produce EVs for the U.S. market have developed various pedestrian alert sounds. As of the date of this writing, we have detailed knowledge of only one system – developed by Nissan – that is available to consumers, although we know that the 2012 Toyota Prius is equipped with an alert sound and that others are under development. Nissan has developed a system called Approaching Vehicle Sound for Pedestrians (VSP) for the 2011 Nissan Leaf.32 Based on what we know about the Leaf’s sound, it would not meet the requirements of this proposed rule. The system consists of a digital sound synthesizer connected to a speaker mounted under the hood of the vehicle and a sound control system. The sound controller gets three inputs: vehicle speed, gear position, and break signal. A forward sound activates at low speeds, fades off as the vehicle reaches 30 km/hr (18 mph) and fades back on as the vehicle speed reduces to 25 km/hr. The pitch increases proportionally with vehicle speed. A unique sound is activated when the gear is in ‘reverse’ and when the vehicle starts from a stopped position. No sound is emitted when the vehicle is operational but stationary. The sound is digitally generated as opposed to being a recording of an ICE vehicle and playing through speakers. Nissan indicates that the sound was designed to achieve the same detectability as ICE sound while maintaining a quiet cabin for the driver and without being intrusive to communities. The VSP was developed based on three design guidelines. First, increase peak frequency content between 600 and 800 Hz to improve detectability for aging pedestrians with high frequency hearing loss. Second, increase peak frequency content between 2000 and 5000 Hz to improve detectability of pedestrians with normal hearing. Lastly, reduce frequency content at around 1000 Hz to avoid noise intrusion. The VSP was set to have a similar sound pressure level as a Versa 1.8L at 10 km/hr (6 mph) while having two peaks at 630 Hz and 2500 Hz, and a valley at 1000 Hz.
NHTSA’s Proposal The NPRM proposes performance requirements for sounds produced by HVs and EVs so that pedestrians can detect, recognize, and locate these vehicles. While NHTSA acknowledges that many manufacturers will choose to install a speaker system to comply with the requirements of this proposal, this is a technology neutral proposal, so manufacturers would be able to choose 32 Konet, H.; Tabata, T.; and Kanuma, T. (2011) Development of Approaching Vehicle Sound for Pedestrians (VSP) for Quiet Electric Vehicles. SAE International. Paper No. 2011-01-0928. April, 12, 2011. Pp http://saeeng.saejournals.org/content/4/1/1217.abstract

18
any means of compliance they wish so long as the method produces a sound that compiles the acoustic specifications of this notice. Applicability of the Proposed Requirements NHTSA is proposing that the acoustic specifications in the NPRM apply to all hybrid and electric passenger cars, multipurpose vehicles, trucks, buses, low-speed vehicles and motorcycles.33 The agency’s proposal would apply only to those hybrid vehicles that are capable of propulsion solely by a source other than the vehicles’ ICE. The agency would also like to note that the definition of “hybrid vehicle” in the PSEA is not limited to hybrid-electric vehicles. Thus, the standard would apply to hybrid vehicles that operate using hydraulic propulsion independently of the vehicle’s ICE. We note that the PSEA did not exclude vehicles with a GVWR over 10,000 pounds from the scope of the required rulemaking. We believe Congress intended the agency to be proactive in addressing the safety problem posed by quiet hybrid and electric heavy vehicles before hybrid and electric heavy vehicle pedestrian crashes begin to show up in crash data bases in significant numbers. In other words, through the passage of the PSEA, Congress has determined that there is a safety need for HVs and EVs of various sizes to produce a minimum sound level. The agency recognizes that there are some challenges in including vehicles with GVWR over 10,000 lbs. in the current rulemaking. The agency has not determined the extent to which hybrid heavy vehicles produce less sound than their traditional ICE peer vehicles. The agency also is not aware of the extent to which hybrid electric vehicles with a GVWR of over 10,000 lbs. are capable of propulsion using only electric power without the ICE running.34 Heavy vehicle manufacturers, in their comments on our NOI, stated that to the extent that heavy vehicles are not capable of propulsion solely by some means other than the vehicle’s ICE, they should be exempt from the requirements of this proposal. While the agency is proposing to include heavy vehicles as part of this rulemaking, we note that the agency intends to conduct further research before issuing a final rule to determine the sound levels produced by heavy-duty hybrid and electric vehicles and to establish whether the sound requirements for light vehicles are also appropriate for heavy vehicles. Another regulatory option that the agency considered for heavy-duty HVs and EVs would require that these vehicles produce only a minimum sound pressure level rather than the full set of acoustic specifications in S5. Pending planned research on the sounds emitted by heavy vehicles, ICE, HV, and EV, the agency has tentatively concluded that applying the full acoustic
33 The PSEA specifically excludes trailers from the scope of the required rulemaking. 34 In its comments to the Notice of Intent to Prepare an Environmental Assessment (NOI) that the agency issued to solicit comments on the environmental consequence of this rulemaking, Hino Motors, Ltd. stated that it is planning on introducing a heavy-duty hybrid truck that is capable of propulsion using only the electric motor. Hino, however, stated that even when the truck is being propelled by the electric motor the ICE will remain on in order to power auxiliary systems. Comment of Hino Motors Ltd. available at www.regulations.gov Docket No. NHTSA-2011-0100-0015.

19
specifications that the agency intends to apply to light vehicles to heavy vehicles would better fulfill the requirements of the PSEA. The agency has tentatively concluded that low-speed vehicles (LSVs) would be required to meet the requirements proposed in the NPRM. While the agency expects that LSVs that run via an electric motor are extremely quiet, the agency has not conducted any acoustic measurements of these vehicles to determine the amount of sound they produce. The agency has not yet determined the extent to which minimum sound levels developed for light vehicles would be appropriate for LSVs. The agency seeks comment on whether the requirements in this proposal should apply to LSVs. The agency does not intend to require a minimum sound level for quiet ICE vehicles in this rulemaking. The agency is aware that, similar to HVs and EVs, some ICE vehicles may pose a risk to pedestrians because of the low level of sound that they produce when operating at low speeds. The PSEA requires the agency to study and report to Congress whether there is a need for a minimum sound level for ICE vehicles so that these vehicles can be readily detected by pedestrians. If, after the study, the agency determines that there is a safety need for minimum sound requirements for quiet ICE vehicles, NHTSA is required to initiate a rulemaking to establish minimum sound level requirements for ICE vehicles. Requirements Under our proposal EVs and HVs would be required to produce sounds that conform to the specifications listed in Table II-6 for detection, recognizability requirements and a pitch-shifting requirement. Through a compliance test, the agency would be able to easily measure the sound produced by an EV or HV and determine whether that sound conforms to the requirements in S5 of the proposed regulatory text. The agency developed the acoustic specifications for detectability contained in the proposal using a loudness model and a representative urban ambient sound level to ensure that sounds fitting the specifications would be detectable in a wide range of ambient noise conditions. Global Collaboration Efforts Considering the international interest and work in this new area of safety, the U.S. has proposed working on a new Global Technical Regulation (GTR), with Japan as co-sponsor, to develop harmonized pedestrian alert sound requirements for electric and hybrid-electric vehicles under the 1998 Global Agreement. WP.29 is now working to develop a GTR that will consider international safety concerns and leverage expertise and research from around the world. Meetings of the working group are planned to take place regularly with periodic reports to WP.29 until the expected establishment date for the new GTR in November 2014. NHTSA is currently leading the GTR development process. The US, along with Japan, is the co-chair of the informal working group assigned to develop the GTR and, therefore, will guide the informal working group’s development of the GTR. Other international organizations, such as the International Organization of Motor Vehicles Manufacturers (OICA) and Japan Automobile Manufacturers Association (JAMA) have been providing NHTSA with their own research findings and have also been attending our quiet vehicle meetings.

20
Table II-6 Minimum Sound Levels for Detection
One-Third Octave Band
Center Frequency,
Hz
Stationary but
activated Backing 10km/h 20 km/h
30 km/h
315 42 45 48 54 59 400 43 46 49 55 59 500 43 46 49 56 60
2000 42 45 48 54 58 2500 39 42 45 51 56 3150 37 40 43 49 53 4000 34 36 39 46 50 5000 31 34 37 43 48
The recognizability approach analyzes the sounds produced by ICE vehicles and sets the acoustic requirements for HVs and EVs so that they would contain acoustic characteristics similar to the sounds that pedestrians associate with current ICE vehicles. Recognition includes two aspects: 1) recognition that the sound is emanating from a motor vehicle that may pose a safety risk to the pedestrian, and 2) recognition of the vehicle’s operating mode (acceleration, deceleration, constant speed, reverse or stationary but activated) so that the pedestrian can take appropriate measures to avoid a collision with the vehicle. Sounds that contain both broadband noise and tones can produce sounds that are recognized as vehicles. Sounds that contain only high frequencies have a synthetic (and unpleasant) character. Sounds with lower frequency tones and noise sound more like the sounds typically associated with a conventional (ICE) motor vehicle. While the one-third octave band requirements listed in Table II-6 include some requirements for lower frequency signal content for vehicle emitted sounds, low frequency tones are necessary to provide additional cues to allow pedestrians to recognize these sounds. Tones are not necessary to achieve a certain sound pressure level in a one-third octave band. A vehicle-emitted sound would be able to meet a minimum sound pressure level requirement for a one-third octave band if it contained broadband noise at a high enough level. In addition to the detectability requirements in Table II-6, our proposal requires that the lowest tone of the vehicle emitted sound must have a frequency not greater than 400 Hz. Low-frequency tones are the tones that contribute the most to recognizablity so tones less than 2000 Hz contribute to recognition while tones above 2000 Hz contribute to detection. ICE vehicles produce low, mid, and high-frequency tones. The lowest frequencies are related to the combustion frequency of the engine. The low frequency components contribute to the perceived power of the vehicle. Low-frequency tones in simulated sounds will contribute the most to recognition because these are closer in frequency to the low order harmonics of the engine fundamental.

21
The agency is also proposing a general requirement for broadband noise in the requirements designed to ensure that EV and HV emitted sounds are recognizable. Sounds produced by current ICE vehicles are broadband in nature meaning that the sounds have some minimal signal content across a wide part of the frequency spectrum. Also, it is easier for a pedestrian to tell which direction a sound is coming from if the sound contains broadband characteristics. (Broadband sounds are also easier for pedestrians to localize than narrow band sounds.) In order for sounds emitted by EVs and HVs to provide sufficient broadband content to allow pedestrians to recognize these sounds as being produced by a motor vehicle, the agency is proposing to require these sounds to have some measurable content in each one-third octave band from 160 Hz to 5000 Hz. This means that sounds emitted by EVs and HVs are required to possess some acoustic signal content above 0 A-weighted dB at all frequencies in the one-third octave bands between 160 Hz to 5000 Hz. Critical Operating Scenarios: The PSEA identified acceleration, deceleration, and constant speed as critical operating scenarios for which sound cues are required in order for pedestrians to safely detect HVs and EVs. However, the PSEA did not limit NHTSA to these critical operating scenarios in our development of an FMVSS for vehicle sound. In addition to the three operating scenarios identified in the PSEA, the agency believes that HVs and EVs should also produce a minimum sound level while at a stationary but activated condition and while operating in reverse. It is NHTSA’s position that the scenario in which the vehicle is stationary, but its starting system is activated is a critical operating scenario because sound provided by idling ICE vehicles is essential to assisting visually-impaired pedestrians in making safe travel decisions. Sounds made by vehicles that are stationary but activated address collisions between pedestrians and HVs and EVs starting from a stopped position. The sound produced by vehicles idling while waiting to pass through an intersection provides a reference to visually-impaired pedestrians so they are able to cross a street in a straight line and arrive safely at the other side. The reference provided by idling vehicles is especially important to provide auditory cues for visually-impaired pedestrians crossing streets at complex intersections where the streets intersect at non-perpendicular angles. The sound of vehicles idling on the far side of the street while waiting to pass through an intersection also provides a visually-impaired pedestrian with a reference of how wide a street is so they can accurately gauge the amount of time needed to safely cross. A sound emitted by an HV or EV when stationary but activated is analogous to the ICE vehicle idling and ensures that the responsibility to avoid a crash between a vehicle and a pedestrian is shared between the driver of the vehicle and the pedestrian by providing pedestrians with an acoustic cue that a vehicle may begin moving at any moment.
The agency believes that reverse is a critical operating scenario for which the agency should issue minimum sound level requirements for HVs and EVs to provide acoustic cues to pedestrians to prevent pedestrian collisions and to satisfy the requirements of the PSEA. Requirements for the reverse operation of EVs and HVs will ensure that these vehicles provide sound cues to pedestrians so pedestrians will be able to avoid these vehicles when the vehicles are backing out of parking spaces or driveways.
22
NHTSA’s report on the incidence rates of crashes between HVs and pedestrians found 13 collisions with pedestrians when a HV is backing. The difference between the incidence rates of HVs involved in pedestrian crashes while backing and the incidence rate of ICE vehicles involved in pedestrian crashes while backing was not statistically significant. We do not believe that the lack of a statistically significant difference in incidence rates between ICE vehicles and HVs involved in pedestrian crashes while backing can be attributed to the absence of a safety problem related to a vehicle’s sound level during this operating condition. The absence of a difference in the incidence rates in backup pedestrian crashes between ICE vehicles and HVs is, the agency believes, due to the low penetration of these vehicles into the fleet and the sample size of HVs and EVs in the State Data System. Also, backing incidents with pedestrians may tend to be underreported because they occur in parking lots, garages, and drive ways, as well as other “off roadways” that traditionally have not been captured by existing data collection systems. The PSEA requires minimum sound level requirements promulgated by NHTSA to allow pedestrians to discern vehicle presence and operation. A vehicle moving in reverse is unquestionably operating, thus a minimum sound level is required for this condition. The pitch shifting requirement in our proposal would ensure that sounds produced by EVs and HVs that meet the requirements of this proposal will allow pedestrians to determine when a vehicle is accelerating or decelerating. Pitch shifting is the sound characteristic that pedestrians currently associate with an accelerating vehicle based on the sounds produced by an ICE vehicle. The agency included requirements for pitch shifting to ensure that components of the sounds produced by EVs and HVs moved along the frequency spectrum in a manner similar to those of ICE vehicles as vehicle speed increases. Pitch shifting will also denote that the vehicle is decelerating. The sound pressure level in each one-third octave band shown in Table II-6 changes as speed increases, leading to an increasing cumulative sound pressure level that corresponds to the behavior of an ICE vehicle. Thus, in addition to the acoustic cues provided by pitch shifting, pedestrians will be able to tell if an EV or HV is accelerating or decelerating based on the increase or decrease in sound emitted from the vehicle, just as they would be able to in the case of an ICE vehicle. The proposed requirement for pitch shifting is that the fundamental frequency of the sound emitted by the vehicle varies with vehicle speed by at least one percent per kilometer per hour between 0 and 30 km/h.
Same sound: The PSEA requires that each vehicle of the same make and model must emit the same alert sound or set of sounds. To fulfill this requirement NHTSA has decided to set the standard so that all vehicles of a particular make, model, and model year provide the same sound. NHTSA has decided to limit the requirement that each vehicle of the same make and model emit the same sound to vehicle vehicles of the same model year so that manufacturers have the flexibility to change the sound for different model years of the vehicle. We have also decided that we would test for the same sound in the stationary but activated condition. Testing in the stationary but activated condition reduces the need to test for every different type of tire or other add-on that could affect the sound of the vehicle during operation.

23
The standard is also required to prohibit manufacturers from providing anyone, other than the manufacturer or dealers, with a device designed to disable, alter, replace or modify the alert sound or set of sounds emitted from the vehicle. A manufacturer or a dealer, however, is allowed to alter, replace, or modify the alert sound or set of sounds in order to remedy a defect or non-compliance with the safety standard. Additionally, vehicle manufacturers, distributors, dealers, and motor vehicle repair businesses would be prohibited from rendering the sound system inoperative under Section 30122 of the Vehicle Safety Act.
24
III. Alternatives NHTSA has considered other alternatives for ensuring that HVs and EVs provide detectable, recognizable sound cues for pedestrians. These alternatives are outlined below.
Requiring Vehicle Sound to be Playback of an ICE Recording The agency considered specifying that the alert sound used on EVs and HVs be a recording of an ICE peer vehicle. After further consideration and based on comments on the NOI, the agency concludes that a recording based on an ICE vehicle is not a viable regulatory option for ensuring that EVs and HVs produce sound levels sufficient to allow pedestrians to safely detect them. The agency believes that it is not practical to require that the alert sound be a recording of an ICE vehicle because of concerns about enforcing such a standard, because the recording of an ICE engine might not be as detectable as the sounds that the agency is proposing, and because of the expense of creating and replaying the recording. In addition manufacturers have expressed a desire for flexibility in developing pedestrian alert sounds and this approach is unnecessarily limiting in that aspect.
Requiring that the Alert Sound Adapt to the Ambient The agency considered requiring that the sound level of the alert sound vary based on the ambient noise level in the environment surrounding the vehicle. The agency is aware that technology is available for back-up alarms for heavy vehicles and construction equipment that vary the sound pressure level of the alert sound based on the sound pressure level of the ambient. The agency decided not to pursue this approach because of concerns about the impact of environmental noise, and because of concerns about the sophistication of this technology. The agency believes that sounds meeting the specifications in our proposal will provide adequate detectability for pedestrians in ambient environments in which sound cues are used to assist pedestrians in avoiding collisions with vehicles.
Acoustic Profile Designed Around Sounds Produced by ICE Vehicles The agency is hesitant to set the minimum sound level requirements for quiet vehicles to mean levels produced by ICE vehicles. Setting the minimum sound requirements for HVs and EVs at the mean levels produced by ICE vehicles could have the effect of cutting off efforts by manufacturers to reduce vehicle noise emissions. This would also serve to increase the overall levels of vehicle noise emissions because vehicles that had been quieter would now be required to produce sound at the mean sound level of ICE vehicles The agency is also hesitant to set the minimum sound levels for HVs and EVs at 3 (or 2) standard deviations below the mean sound level produced by ICE vehicles because then sound levels may not be high enough to allow pedestrians to detect these vehicles. The agency has yet to determine whether all ICE vehicles produce sound levels that are sufficient enough to allow pedestrians to readily detect them. Because the PSEA requires the agency to study whether quiet ICE vehicles pose an increased risk of collisions with pedestrians, the agency does not believe that it is in a position to assume that very quiet ICE vehicles are easily detectable by pedestrians.

25
As discussed in the NPRM, the following one-third octave bands were identified as the critical for vehicle detectability: 315, 400, 500, 2000, 2500, 3150, 4000, and 5000 Hz. A total of 152 measurements of stationary but activated and 10 km/hr (6 mph) forward pass-by events were analyzed to determine levels for these two operations. Data came from three different sources (the International Organization of Motor Vehicles Manufacturers (OICA), Phase 2 as described above, and Phase 3 research). Sound levels for backing were derived from the 10 km/hr (6 mph) forward levels but adjusted downward by 3 dB to account for directivity. In particular, the sound pressure level in the rear of an ICE vehicle is about 3 dB lower than what is measured at the SAE 2889-1 microphones. Two versions of potential requirements based on measured ICE levels are provided below. Table III-1 shows minimum A-weighted sound levels based on the mean levels of ICE vehicles in the dataset. Table III-2 shows minimum A-weighted sound levels based on the mean levels minus one standard deviation. Mean levels minus two standard deviations were also considered, however, these levels are not expected to be sufficiently detectable in many cases.
Table III-1 Minimum A-weighted Sound Levels Based on ICE Mean Levels
One-Third Octave Band Center Frequency, Hz
Stationary but
activated
Backing 10 km/hr
20 km/hr
30 km/hr
315 40 42 45 52 55 400 41 44 47 53 57
500 43 45 48 54 59 2000 44 46 49 55 59 2500 44 46 49 53 56 3150 43 44 47 52 54 4000 41 42 45 49 51 5000 37 40 43 45 48

26
Table III-2
Minimum A-weighted Sound Levels Based on ICE Mean Levels Minus One Standard Deviation
One-Third Octave Band Center Frequency, Hz
Stationary but
activated
Backing 10 km/hr
20 km/hr
30 km/hr
315 34 37 40 48 52 400 35 40 43 49 53 500 37 42 45 51 56 2000 39 42 45 50 54 2500 39 41 44 49 51 3150 39 40 43 47 49 4000 36 37 40 42 44 5000 29 34 37 38 40
Table III-2 has levels that are as high as Table II-6 for stationary but activated only at 3150 and 4000 Hz. Again, this does not mean that vehicles with levels below the mean will never be detectable, but rather that they will not likely be detectable for the ambient that was used in the modeling.
Acoustic Profiles Suggested by Manufacturers The Alliance of Automotive Manufacturers (the “Alliance”) submitted acoustic specifications that could serve as minimum sound requirements for HVs and EVs.35 The Alliance proposed that the agency specify that HVs and EVs emit a sound with frequency content between 150 Hz and 3000 Hz. The Alliance proposal would require that sound emitted by HVs and EVs have at least two one-third octave bands with a sound pressure level of 44 A-weighted dB within this frequency range with one of the one-third octave bands being above 500 Hz.
The agency believes that specifications for sound levels in only two one-third octave bands would not guarantee that sounds produced by HVs and EVs would be detectable in the range of ambient conditions in which the agency believes that pedestrians would need to detect them. If a sound has a greater number of one-third octave bands, it is more likely to be detectable at a given ambient. Sounds containing only one or two one-third octave bands with elevated sound pressure levels would be masked by ambient sound with strong spectral content in the same one-third octave bands which would hinder the ability of pedestrians to detect the sound. If a sound has elevated sound pressure levels at a wide range of one-third octave bands, it is less likely that an ambient will mask all of the bands that would increase the likelihood that the sound would be detectable.
We do not believe that the suggestion submitted by the Alliance specifies the one-third octave bands for which a minimum sound level is required in enough detail. The placement of one-third
35A presentation given at a meeting with NHTSA staff with the details of the proposal is available in the rulemaking docket accessible through regulations.gov. NHTSA-2011-0148-0022.

27
octave bands in the frequency spectrum influences the detectability of a sound. While the Alliance’s suggestion would require one of the one-third octave bands to be at a frequency band above 500 Hz, the agency does not believe that this specification would ensure that the sounds would be loud enough for pedestrians to detect them at speeds above 0 km/hr. Based on the agency’s detection model, a one-third octave band with a sound pressure level of 44 A-weighted dB would not be detectable at 10 km/hr (6 mph) if the frequency of the one-third octave band was below 3150 Hz. A sound with two one-third octave bands with a sound pressure level of 44 A-weighted dB would be masked by the ambient if those one-third octave bands were both positioned in mid-range frequencies for which the ambient level is highest.
In its comments on the NOI, Nissan described the acoustic profile of the sound that is emitted by the Nissan Leaf. Nissan described the Leaf sound as having two peaks in sound pressure level with one peak near 2500 Hz and one peak near 600 Hz. Nissan stated that it included the 2500 Hz peak in sound pressure level to provide enhanced detection for pedestrians with the normal hearing and the 600 Hz in sound pressure level to provide detection for pedestrians with age related hearing loss. The Leaf sound does not include mid-range one-third octave bands so that sound does not contribute to cumulative increases in ambient noise.
As discussed above, the agency believes that sound should be present in multiple high frequency one-bands to increase the likelihood that a pedestrian will be able to detect the sound in multiple ambient settings with differing acoustic profiles. Like the Leaf sound, the acoustic specifications in this proposal do not contain requirements for the one-third octave bands that would contribute to the greatest increase in cumulative levels. They would have a significant amount of detectable content below 2000 Hz which, according to Nissan, is the threshold for age related hearing loss. The one-third octave band levels in Table 10 would ensure that pedestrians with age related hearing loss would be able to detect the sounds meeting these requirements, because they include content below 2000 Hz.
The agency believes that the acoustic specifications for minimum sound level requirements for HVs and EVs in the agency’s proposal will provide manufacturers flexibility to develop alerts that are detectable and recognizable to pedestrians and pleasing to drivers. While the specifications described in the agency’s proposal are more detailed than those contained in proposals that the agency received from manufacturers and their representatives, the agency believes that the specifications in its proposal place a greater emphasis on recognizability than specifications submitted by manufacturers. The agency’s specifications will also ensure that sounds produced by HVs and EVs will be detectable in a wider range of ambient sounds than would be the case in suggestions submitted by manufacturers because specifications for a wider range of one-third octave bands increases the likelihood that the sound pressure level in any one one-third octave band will exceed the ambient for that frequency.
International Guidelines for Vehicle Alert Sounds The Japanese government issued voluntary guidelines for manufacturers to use when installing alert sounds on HVs and EVs. The ECE has also adopted these guidelines for use on a voluntary basis. In their comments on the NOI, several manufacturers stated that the agency should use these guidelines as a basis for ensuring that HVs and EVs produce sound levels sufficient to allow pedestrians to detect these vehicles.

28
The agency does not believe that these guidelines have the level of detail necessary to serve as the basis for an FMVSS. The guidelines do not contain objective minimum requirements that manufacturers would be required to meet. The guidelines state that levels of sounds produced by HVs and EVs should not exceed the levels produced by ICE vehicles of the same class. The agency does not believe that this description of the sound levels would adequately ensure that these vehicles will be detectable by pedestrians or provide manufacturers with a set of requirements that they would be expected to meet.
The guidelines also do not contain an objective description of the acoustic characteristics that the sound should possess. Rather, the guidelines list what the sounds should not sound like. The guidelines state that vehicle emitted sounds should not sound like “siren[s], chime[s], bells, melody, horn[] sounds, animals, insects, [or] sound[s] of natural phenomenon such as wave[s], wind, [or] river current[s].” We do not believe that we would be able to tell whether a sound fell within one of the exclusions by means of an objective acoustic measurement because these descriptions do not contain any measurable values. We believe that sounds meeting the requirements of the agency’s proposal will harmonize well with current international vehicle alert sound guidelines, and in some cases vehicle manufacturers will still be able to alter the vehicle sound in other regions with a simple change in software, and no change in hardware.
Possible Jury Testing for Recognizability of a Synthetic Sound The PSEA requires the agency to develop performance requirements to determine whether pedestrian alert sounds required by the standard are recognizable as being emitted by a motor vehicle in operation. The agency has tentatively decided that a compliance test for recognizability based solely on acoustic measurements over spectral distribution detailed above is the best way to ensure recognizability while, at the same time, allowing manufacturers the flexibility to design sounds representative of each make/model of vehicle. While the agency believes that sounds that fall within the agency’s acoustic parameters will be recognizable to the public as a motor vehicle in operation, it is possible that manufacturers may wish to use sounds that would be equally as recognizable as those sounds meeting the agency’s proposed specifications but would fail to satisfy the requirements proposed. While the agency believes that human subject testing could provide an accurate evaluation of the recognizability of the pedestrian alert sound, the agency recognizes jury testing poses its own challenges. While the agency has tentatively concluded that jury testing is objective and repeatable as required by the Motor Vehicle Safety Act, manufacturers have expressed technical concerns about compliance testing by the agency using human subjects. Under the jury testing framework envisioned by the agency, manufacturers would be required to submit information to NHTSA demonstrating that the sounds emitted by their vehicles are recognizable as a motor vehicle in operation. Under this framework, manufacturers would conduct a jury test according to procedures established by NHTSA and then submit to NHTSA documentation of the results of the jury and a certification that the jury test was conducted according to the procedures established by the agency.

29
After NHTSA received documentation of the manufacturer’s jury test, the agency would examine the documents to ensure that the test was conducted properly. The agency would also include the same performance test for detectability in the standard as is proposed today. While the agency believes that a compliance test using jury testing is objective and repeatable, manufacturers have expressed concerns in discussions with the agency about being subjected to a jury based performance standard. We recognize that automobile manufacturers face significant penalties in the event that they are determined to be noncompliant with a FMVSS. In an effort to provide manufacturers with regulatory certainty and in acknowledging that the agency does not currently specify any jury-based compliance testing, we have concluded that the most feasible approach to jury testing at this time would be for the agency to require manufacturers to conduct the jury tests themselves and submit their results to NHTSA as part of their vehicle certification. Thus, the manufacturers’ records that the jury test was conducted properly with the jury determining that the sound was recognizable would constitute the manufacturers’ certification. Refer to the NPRM for a detailed discussion of how the agency believes jury testing could be used in the FMVSS certification environment.

30
IV. COSTS
A. Number of vehicles affected The agency’s proposal would apply to electric vehicles and to those hybrid vehicles that are capable of propulsion solely by a source other than the vehicles’ ICE. Thus, the coverage of this rule is broader than just electric and hybrid/electric vehicles, as it would cover fuel cell vehicles and hybrids with other types of propulsion that could propel the vehicle without the ICE running. We anticipate that there will be very few if any of the “other propulsion” vehicles by MY 2016 subject to the rule. There are several different estimates of the number of vehicles that will be produced in the future that meet these criteria and comments are requested on our estimates. The reason that estimating sales of these types of vehicles is so difficult is that the total number of sales depends not only upon the vehicles being offered for sale and their alternative, but also upon the general state of the economy and the price of gasoline or diesel fuel. For estimation purposes of this analysis we have decided to break up the vehicles into the following categories to analyze sales:
• Low-speed vehicles (those with top-speed of 20-25 mph) • Light vehicles (passenger cars, pickup trucks, multi-purpose passenger vehicles (vans and
sport-utility vehicles) under 10,000 pounds GVWR, excluding low-speed vehicles) • Medium and heavy trucks (vehicles above 10,000 pounds GVWR • Buses (transit, coaches, school buses) • Motorcycle and motor-driven cycles
We are also interested in projecting into the future what will be the estimated number of electric or hybrid vehicles that will be produced. So, we will estimate the number of vehicles in 2010 that might be affected by the proposal if it were in effect and the number of vehicles in 2016, which is projected to be the start of the phase-in period effective date of the proposal. It is important to realize that the proposed standard is for the vehicle to provide sounds during certain modes of operation. While NHTSA anticipates this to require the incremental installation of a speaker system, or the adoption of a new sound for an existing speaker system, any vehicle that meets the standard will be compliant. Thus, if a vehicle is compliant before the addition of a speaker, no change is needed to meet the proposed standard.
Low speed vehicles The agency has some data on the number of low speed vehicles currently in the fleet. We seek comment on the current number of low speed vehicle sales by means of propulsion. A report by the U.S. Department of Energy (DOE) released in April, 2010 estimated the total number of low speed electric vehicles in use in the United States at 44,842 as of 2008.

31
According to the DOE report, this represents 99.8 percent of the low speed vehicles currently in use.36 The DOE reports that the number of vehicles using electricity as their power source, which includes low speed vehicles, grew from 1,607 in l992 to 56,901 in 2008.37 Most of the 56,901 electric vehicles in 2008 were low speed vehicles (44,842). Updated DOE data shows 57,185 electric vehicles in 200938, indicating almost no growth in the number of electric vehicles in the fleet between 2008 and 2009. The number of electric vehicles in use was 49,536 (2004), 51,398 (2005), 53,526 (2006), 55,730 (2007), 56,901 (2008), and 57,185 (2009), which again reflects slow and steady growth until the economic downturn starting in 2008 of about 2,000 vehicles per year. Since low speed vehicles are a relatively new category of vehicles, we don’t expect scrappage of low speed vehicles to significantly affect the number on the road. Thus, we estimate sales for 2010 at about 1,500 vehicles and sales for 2016, when the economy recovers, at 2,500 vehicles registered for on-road use. .
Light vehicles Based on Ward’s Automotive Yearbook, in 2011 there were 306,882 hybrid engine installations in light vehicles (74% were in passenger cars and 26% were in light trucks) sold in MY 2010, which accounts for 2.8% of the total 10,796,533 light vehicles sold in MY 2010. There were a small number of electric vehicles (an estimated 852 from NHTSA’s data, not Ward’s) sold in MY 2010, since the larger sellers (GM Volt and Nissan Leaf) were introduced in MY 2011. NHTSA estimates that the great majorities of electric vehicles manufacturers provides a sound or are developing a sound. Those OEMs that have not added a sound most likely are waiting to see what NHTSA proposes before starting out, especially if they have very small production. Ford says that “only a limited number will be produced” with regard to their Ford Focus EV. It appears that Ford has plans to add sound to future EV models because the company solicited consumer input on sound via YouTube. There are many types of hybrid vehicles. We propose to require those hybrids which can run on their own electric power, without the combustion engine being on, to be required to have an alert sound. That means that hybrids which always have the combustion engine on when starting are not required to have an alert sound. For this analysis we are calling these hybrid systems that are not included in the affected vehicles “microhybrids”. As Figure IV-1 shows, there were very few microhybrids sold in 2010 (17,600), but we do expect that figure to rise by MY2016. According to our proposed definition, the microhybrids would not be required to provide an alert sound, but all of the electric vehicles on Figure IV-1 would be, including what we call the typical electric/gasoline hybrid car of today (as those vehicles do have the ability to run solely on electric power). 36 See “Alternatives to Traditional Transportation Fuels 2008,” April 2010, U.S. Energy Information Administration, Office of Coal, Nuclear, Electric and Alternate Fuels, U. S. Department of Energy, Table V5: Estimated Number of Alternative Fueled Vehicles in Use, by Weight Class, Vehicle Type and Fuel Type, 2008, at: http://www.eia.doe.gov/cneaf/alternate/page/atftables/attf_v5.pdf 37 See U.S. Department of Energy, Annual Energy Review 2009, Table 10.5 - Estimated Number of Alternative-Fueled Vehicles in Use and Fuel Consumption, 1992-2008, at http://www.eia.doe.gov/aer/pdf/aer.pdf, Page 295. 38 Annual Energy Review 2010, U.S. Energy Information Administration , Table 10-5, page 303.

32
In a separate analysis for the fuel economy rule, NHTSA has also made predictions of electric and hybrid vehicles sales. Of the predicted 16.2 million sales predicted for MY 2016, 796,000 (4.9%) would be hybrid or electric vehicles, of which 507,721 would be required to meet the alert sound proposal. Table IV-1 shows estimates from all the sources. For this analysis, the agency has decided to use the higher Annual Energy Outlook 2011 (AEO 2011) sales predictions in the main analysis of costs and benefits, and to provide a sensitivity analysis in the cost effectiveness section using the NHTSA CAFE sales predictions to compare forecasts. The prediction for MY 2016 for light vehicles in the AEO 2011 data base is 16,197,000 vehicles. That will be the basis for the MY 2016 sales estimates. Note that Table IV-2 shows estimates of the percent of new light vehicle sales that would be required to meet the minimum sound level, as well as the microhybrids that are not covered by this rule. AEO 2011 predicts varying sales of light vehicles each year. However, for an analysis to provide consistent costs per equivalent life saved, one must assume consistent vehicle sales. The AEO 2011 predicts sales levels of 16.2 million in 2016, 15.9 million in 2020, 17.2 million in 2025, and 18.5 million in 2030. So, Table IV-2 shows predictions of the percent of light vehicles that would need to meet the minimum sound level.
Table IV-1 Light Vehicle Electric and Hybrid Sales
Microhybrids (not required to meet standard)
Electric/or Plug-in Electric Hybrids
Electric Vehicles
Hydrogen Fuel Cell
Total Sales
Total Required to Meet Standard
2010 combined data
17,600 AEO data
289,282 Ward’s
852 NHTSA’s
0 307,734 290,134 If it were applicable
in 2010 2016 Projections
AEO 805,000 671,270 46,200 2,900 1,525,400 720,400 NHTSA CAFE 288,405 479,779 27,943 0 796,127 507,721 Used in the Main Analysis
671,270 46,200 2,900 720,400

33
Table IV-2 AEO 2011
Predictions of Percent of Light Vehicles that would have to meet the minimum sound requirements for 2016 costing purposes and over time
Year Total Required to Meet Standard
Total for Costing Purposes
2016 720,400 (4.45%) 671,270 (4.14%) 2020 5.59% 5.13% 2025 6.98% 6.30% 2030 8.01% 7.22%
Figure IV-1
The Nissan Leaf and other fully electric vehicles come equipped with an alert sound system. Based on what manufacturers have voluntarily provided in their fully electric vehicles, the agency assumes that fully electric vehicles and hydrogen fuel cell vehicles would have provided an alert sound on their own without the passage of the PSEA or this rule and for costing purposes this is not a cost of the proposal. However, those vehicles’ alert sounds may not meet the proposed standard, and, the rulemaking may force a change in manufacturers’ sound alerts. We assume that EV manufacturers would incur no incremental cost for that change, as it is anticipated to be a simple software modification. Furthermore, once a vehicle is equipped with a speaker system, there would be no incremental cost to produce sound during additional operating scenarios, such as decelerating or stationary but active because the vehicle could be reconfigured to play a sound during this scenario through a simple software modification, which would not require any additional equipment to be installed on the vehicle.

34
Those manufacturers that elected not to equip their vehicles with alert sound either produce limited numbers of EVs or began production after the PSEA was enacted and are waiting for the agency to issue its proposal before adding an alert sound. Thus, our estimate of the incremental number of light vehicles that have to add an alert sound system for MY 2016 is 720,400 – 46,200-2,900 = 671,270. This is the estimate used in the main analysis.
Medium and Heavy Trucks Electric and Hybrid medium trucks are very new to the market, being first introduced around 2007. Electric and Hybrid medium trucks now entering the market are primarily designed to carry high-volume low mass goods, like delivering potato chips in large cities. Other types of work for which electric and hybrid trucks are being considered are when the miles driven to a work site are low and the truck stays at the site for long periods of time. The Heavy Truck Users Forum brings together companies and estimates have been made of electric and hybrid sales and projections. For 2010, the estimates are that about 2,000 medium trucks and no heavy trucks are electric or hybrids. By 2016, the estimates are that about 20,000 medium trucks and 1,500 heavy trucks will be produced with electric or hybrid propulsion systems for a total of 21,500. The agency does not know how many of these vehicles would be subject to the requirements of the proposal because we do not have a good idea of how many are capable of running solely via their electric motor. Comments are requested. To be conservative, we will assume these vehicles will need to add sound and have added costs into Table IV-3.
Buses There are an estimated 60,800 buses and large buses greater than 10,000 pounds GVWR sold each year made up of approximately 2,200 large buses, 40,000 school buses, 4,000 urban transit buses and 14,600 other buses. The other bus category includes a variety of buses with different uses, such as shuttle buses, paratransit services, etc. sold in the 10,000 to 26,000 pounds GVWR range. There are many varieties of electric or hybrid buses being sold for inner-city transit companies, as well as to schools, churches and small cities. For purposes of this analysis, the agency estimates that about 3,000 electric or hybrid buses were sold in 2010 and that about 5,000 electric or hybrid buses will be sold in 2016. The agency believes most of these buses would be subject to the requirements of the proposal because we believe they are capable of running solely via their electric motor.
Motorcycles and Motor-driven Cycles NHTSA estimates that about 1,500 electric motorcycles, scooters, and motor-driven cycles were sold in the U.S. in 2010. The recession hurt motorcycle sales in general and particularly the recreational sales that electric motorcycles and scooters rely on. A large part of the current sales are often to police department fleets. It is anticipated that sales will pick up as the economy gets better to an estimated 5,000 sales in 2016. Summary Table IV-3a summarizes our predictions.

35
Table IV-3a Estimated/Predicted Hybrid and Electric Vehicle Sales
Proposed to be Required to Provide an alert sound * Estimated 2010 Sales Predicted 2016
Sales 2016 Sales for Costing
Purposes Low- Speed Vehicles 1,500 2,500 2,500
Light Vehicles Electric 852 46,200 Fuel Cells 0 2,900 Light Vehicles Hybrid 289,282 671,270 671,270 Light Vehicles Total 290,134 720,400
Medium Trucks 2,000 20,000 20,000 Heavy Trucks 1,500* 1500*
Buses 3,000 5,000 5,000 Motorcycles 1,500 5,000 5,000
Total Sales 298,134 747,900 698,800
*Microhybrids are excluded from this table because they are exempted from the proposed rule. Table IV-3b shows the projected total fleet sales by type of vehicle. These estimates are important because we compare the applicable vehicles to total sales to determine what percentage of the injury population applies to electric/hybrid vehicles. The light vehicle estimates come from the AEO 2011 estimates.
Table IV-3b Estimated Total Fleet Vehicle Sales
Predicted 2016 Sales
Low- Speed Vehicles 3,000
Light Vehicles Passenger Cars 9,032,000 Light Trucks 7,165,000
Light Vehicles Total 16,197,000
Medium Trucks 125,000 Heavy Trucks 150,000
Buses 61,000 Motorcycles 1,250,000
Total Sales 17,786,000

36
B. Technology Costs ($2010 economics)
Low-Speed and Light Vehicles The agency assumes that the technology to provide an alert39 sound that can meet the proposed criteria will consist of three main components. First, a sound generator by virtue of a computer sound chip. This sound generator would have to be indirectly connected to the speedometer, since louder sound levels are needed at higher speeds. Second, wiring from the sound generator to a speaker. Third, a dynamic range speaker that can generate sounds over a wide range of frequency and that can produce sound over several frequencies at once. The speaker would be mounted under the vehicle and have to be waterproof and weather proof to handle the elements. NHTSA does not anticipate that the mounting of the speaker would require any structural/design changes, let alone a significant change. The agency estimates that the total consumer cost for such a system (including the sound development), based on informal discussions with suppliers and industry experts, is around $30 per vehicle. This estimate includes the cost of a dynamic range speaker system that is protected from the elements and attached with mounting hardware and wiring to both power the speaker and receive signal inputs and a digital signal processor that receives information from the vehicle regarding vehicle operating status (to produce sounds dependent upon vehicle status). We assume that vehicles will not require any structural changes to accommodate the sound system. We seek comment on this estimate. We believe the same system can be used for both low-speed vehicles and light vehicles. For those electric vehicles that currently provide a sound, and have a speaker capable of producing a NHTSA-compliant sound, that might not fully meet the agency’s proposed sound requirements, we believe the additional cost of developing a sound that could meet the requirements will be fairly minimal on a per vehicle basis. There will be some development costs, but on a per vehicle basis these costs are relatively small compared to the $30 per vehicle costs for a speaker and the sound generator system. We assume that these costs, when distributed over the design lifetime of the vehicle, will be a few cents per vehicle. This is based on our understanding of the automobile industry. We seek comment on this assumption.
Medium and Heavy Trucks and Buses The agency has done no testing of the sounds emitted from electric or hybrid medium and heavy trucks or buses to date. Thus, we are not sure whether an alert sound is necessary for these vehicles to pass the test or whether they could pass based on the current sounds they make. At this time we are planning to test these vehicles to support the final rule. Because of the length of heavy and medium duty trucks and buses the agency believes these vehicles may require a second speaker in the rear to avoid undesirable increases in environmental noise from increases in sound pressure level from the front speaker in order to project sound to the rear. The act does say that trailers are not required to provide an alert sound. And we do not know whether a single speaker could cover the front and rear of a medium truck, like a garbage truck, cement mixer, or other medium size trucks. Thus, the cost for this wide arrangement of vehicles could range from $0 if they provide enough sound already, to $30 for one speaker to $50 for two speakers. If we assume that both medium and heavy trucks and buses would require two speakers at cost of $50
39 The agency is not requiring a specific system. For costing purposes of this analysis we assumed a specific system that manufacturers could use to meet the proposal, but the proposal has been written to be technology neutral.

37
per vehicle, the total cost for MY2016 vehicles would be $1,325,000, broken into $1,075,000 for medium to heavy trucks and $250,000 for buses. If we assumed $30 for medium trucks, and the maximum cost of $50 per heavy truck and bus, the total cost for MY2016 vehicles would be $925,000 , broken into $600,000 for medium trucks, $75,000 for heavy trucks, and $250,000 for buses. We have chosen to assume that all medium and heavy trucks and buses would require two speakers in calculating the costs of this proposal. We seek comment on this assumption.
Motorcycles and Motor-Driven Cycles The agency has done no testing of the sounds emitted from electric motorcycles or motor-driven cycles to date. Thus, we are not sure whether an alert sound is necessary for these vehicles to meet the proposed minimum sound requirement or whether they could comply based on the current sounds they make. At this time we are planning to test these vehicles to support the final rule. Assuming one speaker (at $30 per system) is necessary to pass the proposal, the total cost for electric motorcycles or motor-driven cycles would be $150,000 . In its comments to the NOI the Motorcycle Industry Council stated that there could be additional costs associated with installing speakers on motorcycles. Comments are requested for the cost of adding an alert sound system to motorcycles or motor-driven cycles.
Cost Summary by Vehicle Types Table IV-4 below combines the estimates made above for MY2016 vehicles. The low-speed and light vehicle estimates are more definitive, the other estimates are provided as a range from unknown to what we consider to be a potential estimate based on the assumptions discussed above. So, the total technology cost for the low-speed and light vehicles is $20.2 million and the potential technology cost for all vehicles is $21.7 million.
Table IV-4
Total Technology Cost Estimates Costs to cover lighter vehicles Costs to cover all vehicles Low-speed Vehicles $75,000 $75,000 Light Vehicles $20,138,107 $20,138,107 Medium Trucks Unknown to $1.00M Heavy Trucks Unknown to $0.08M Buses Unknown to $0.25M Motorcycles Unknown or $0.15M Total $20.21M $20.21M to $21.69 The total vehicle cost for MY 2016 of the proposal at $30+ per vehicle is estimated to be $21.69M. That is $75,000 for 2,500 low-speed vehicles and $20.14M for 671,270 light vehicles, and so on for the above costs for medium and heavy trucks, buses, and motorcycles. For the cost effectiveness chapter, only the costs for low-speed vehicles and light vehicles will be used, since we do not have reliable estimates of the target population for medium/heavy truck, buses, or motorcycles.

38
C. Weight and Fuel Economy Impacts The addition of wiring and a speaker will add weight to each of the vehicles, which would consequently increase their lifetime use of fuel. The average weight gain for a light vehicle is estimated to be 1.5 pounds (based upon a similar waterproof speaker used for marine purposes), resulting in 2.3 more gallons of fuel being used over the lifetime of a passenger car and 2.5 more gallons of fuel being used over the lifetime of a light truck. These estimates of increased fuel use and costs are derived in Appendix A. The present discounted value of the added fuel cost over the lifetime of the average passenger car and light truck is shown in Table IV-5. The total costs for MY 2016 assuming 439,586 passenger cars and 231,685 light trucks (as predicted in the AEO 2011 report) is shown in Table IV-5.
Table IV-5 Fuel Economy Costs of Weight Increase
Per Vehicle 3% Discount Rate 7% Discount Rate Passenger Cars $4.70 $3.80 Light Trucks $5.30 $4.20 All Applicable Vehicles Passenger Cars $2.07M $1.67M Light Trucks $1.23M $0.97M Total $3.29M $2.64M
D. Testing Costs The agency is proposing 5 tests for compliance with the proposal; 4 valid measurements are needed for each test. These include a test at stationary with the starting system activated, backing, and 3 pass-by tests: 10 km/h (6 mph), 20 km/h (12 mph), and 30 km/h (18 mph). There is a cost to set up the test area, with specific characteristics. The costs to run these tests are estimated to be approximately $2,000 per vehicle, once the test area has been set up. While there is no requirement to test, the manufacturers have to certify that they meet all safety standards. There are several ways in which a low-speed vehicle manufacturer and other manufacturers that sell a limited number of models, could potential certify compliance with the standard. We anticipate that manufacturers with limited models will not set up a test facility, but could rent the use of a test facility, arrange to have new models taken there and tested. We anticipate the cost to rent the facility and run the test will be $6,000. A second possibility is for a supplier to provide all the technology and test a few sample vehicles. It is possible that the undercarriage of low speed vehicles is fairly similar and that testing one vehicle with an alert sound system may well allow for certification to low speed vehicles with a similar undercarriage. Testing costs are not typically included in the cost of the rule because when the costs are spread over 16 million vehicles sold per year, the cost per vehicle usually comes out at less than one penny. In this case, with a very limited number of vehicles affected, the cost per vehicle for testing could result in a cost of several dollars per vehicle. For example, if we estimate that the testing cost is $10,000 per make/model, that there are 12 make/models to test, that 2,500 vehicles are produced per year and that the typical make/model last 10 years, then the total cost of $120,000 ($10,000*12) is spread over 25,000 vehicles ($2,500*10) for a cost of $4.80 per

39
vehicle to cover the testing cost. On the other hand, if you assume that one supplier tests one make/model and determines that it is sufficient for all low-speed vehicles, then the testing cost of $10,000 is spread over 25,000 vehicles for a cost of $0.40. The agency requests comments on testing costs and the ability for suppliers to test and provide information to low-speed vehicle manufacturers regarding possible compliance strategies. If we made similar calculations for light vehicles, assuming 20 make models with sales of 674,200 for a period of 10 years or 6,742,000 vehicles, with a test cost of $200,000, the cost for testing would be $0.03 per vehicle. One of the alternatives we considered included jury testing for recognizability. The number of people on the jury panel is a determining factor for the cost of the test. Assuming 50 jurors as a minimum, the agency believes it would cost about $20,000 to complete these tests. At this time the agency is not applying testing costs to the cost-effectiveness equation because that value is too sensitive to the number of makes and models rather than the number of vehicles sold. Each model and potentially some trim levels would require testing and retesting as the sound is designed and redesigned, and as any properties of the vehicle are changed that alter its complete acoustic profile. NHTSA is requesting more information to determine how best to address testing costs.
E. Total Costs Total costs for light vehicles, obtained by adding together the technology costs, fuel economy costs, and testing costs are shown in Table IV-6. Since we don’t know much yet about the other classes of vehicle, we will assume here that at least the technology costs would apply.
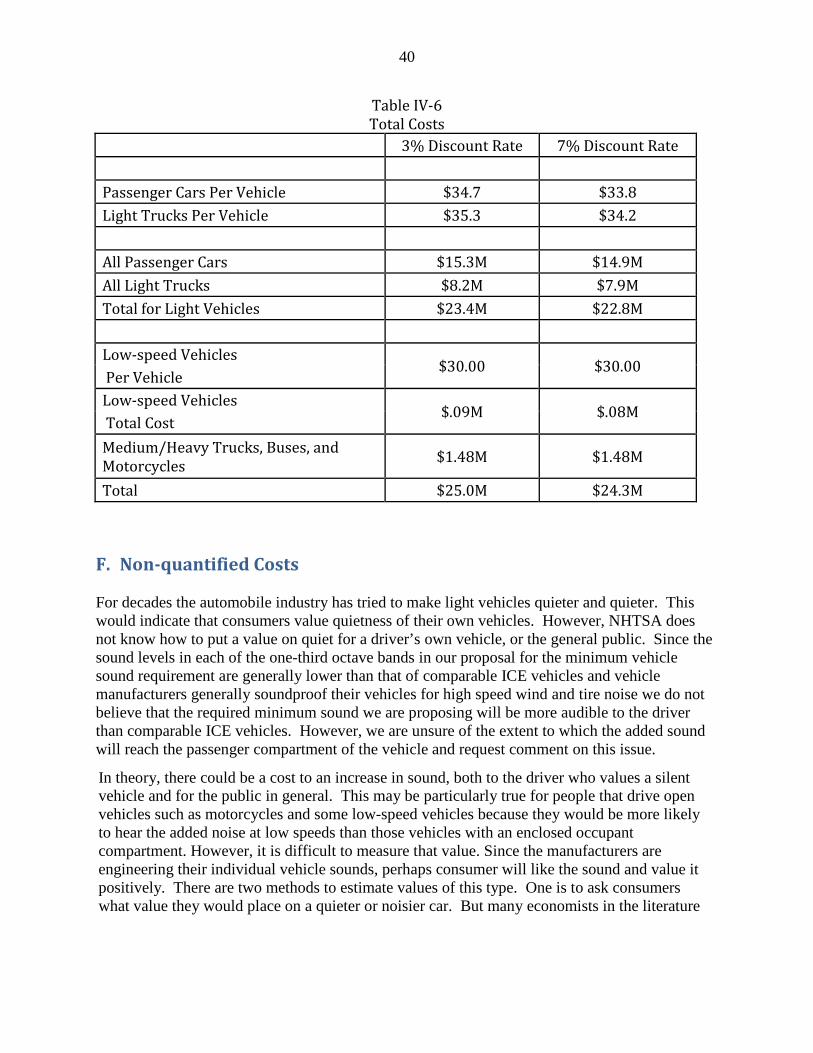
40
Table IV-6 Total Costs
3% Discount Rate 7% Discount Rate Passenger Cars Per Vehicle $34.7 $33.8 Light Trucks Per Vehicle $35.3 $34.2 All Passenger Cars $15.3M $14.9M All Light Trucks $8.2M $7.9M Total for Light Vehicles $23.4M $22.8M Low-speed Vehicles
$30.00 $30.00 Per Vehicle Low-speed Vehicles
$.09M $.08M Total Cost Medium/Heavy Trucks, Buses, and Motorcycles $1.48M $1.48M
Total $25.0M $24.3M
F. Non-quantified Costs For decades the automobile industry has tried to make light vehicles quieter and quieter. This would indicate that consumers value quietness of their own vehicles. However, NHTSA does not know how to put a value on quiet for a driver’s own vehicle, or the general public. Since the sound levels in each of the one-third octave bands in our proposal for the minimum vehicle sound requirement are generally lower than that of comparable ICE vehicles and vehicle manufacturers generally soundproof their vehicles for high speed wind and tire noise we do not believe that the required minimum sound we are proposing will be more audible to the driver than comparable ICE vehicles. However, we are unsure of the extent to which the added sound will reach the passenger compartment of the vehicle and request comment on this issue.
In theory, there could be a cost to an increase in sound, both to the driver who values a silent vehicle and for the public in general. This may be particularly true for people that drive open vehicles such as motorcycles and some low-speed vehicles because they would be more likely to hear the added noise at low speeds than those vehicles with an enclosed occupant compartment. However, it is difficult to measure that value. Since the manufacturers are engineering their individual vehicle sounds, perhaps consumer will like the sound and value it positively. There are two methods to estimate values of this type. One is to ask consumers what value they would place on a quieter or noisier car. But many economists in the literature

41
have no faith in these subjective values for a subject like this because people differ widely in their sensitivity and susceptibility to noise.40 Because responses on questions of annoyance can differ so widely it is difficult to develop objective criteria to measure annoyance that could be converted to a monetized valuation. The second way to measure the value of noise, hedonic pricing, has been attempted relating to roadway noise. Hedonic pricing is an economic technique that has been used to estimate the monetary value of noise based on the price that people pay when purchasing houses with different levels of road noise and the sampled road noise at the property location. Several studies have estimated the loss in home property values brought about by road noise. One such large study41 of 3,500 properties in Glasgow, Scotland found that the value of property declined by 0.2 percent for every decibel increase in road noise. This is a difficult analysis because one must value all aspects of the house and property so that everything is valued equally except for the noise. Thus, people value quiet as opposed to having a noisier environment. This study was presented to show the concept. We do not believe we could transfer the findings of a study like this on houses at relatively higher decibel levels to the quieter vehicle environment. That study examined the connection between extreme noises for roads near homes, whereas quiet vehicles are being raised from below the threshold of hearing to an audible level for pedestrians directly adjacent to the road. Also, the study itself admits that the values would need to be updated over time, and possibly for the locality in question. As explained more fully in our Environmental Assessment for this NPRM, we expect that the increase in noise from the alert sound will be no louder than that from an average ICE vehicle and that there will not be an appreciable aggregate sound from these vehicles. Thus, given the low increase in overall noise caused by this rule, we expect that this any costs that may exist here will be minimal for the general public. For drivers who value a silent car we believe that the cost of hearing a sound that meets the minimum sound emission requirements proposed in the NPRM will be minimal and will decline further once they understand the value to pedestrians, especially pedestrians with impaired vision, of hearing a nearby vehicle and the benefit to themselves, in the reduced likelihood of a crash, of ensuring that pedestrians can sense the approach of the vehicle. Nevertheless, we ask commenters how to value any increase in sound brought about by this proposal, both for the driver who values a silent car and the general public. NHTSA also seeks comment on whether manufacturers are taking any actions beyond adding speakers and typical noise reduction efforts in response to adding sound to quiet vehicles and the cost of such actions. NHTSA has not found any way to value the increase in noise, thus it is a non-quantified cost.
40 Noise & Health – Valuing the Human Health Impacts of Environmental Noise Exposure, A Response By the Interdepartmental Group on Costs and Benefits Noise Subject Group, July 2010, http://archive.defra.gov.uk/environment/quality/noise/igcb/documents/igcn-noise-health-response100707.pdf 41 Assigning a monetary value to noise reduction benefits; an example from the UK, Iain R. Lake, Ian J. Bateman, Brett H. Day and Andrew A. Lovett, 1Centre for Environmental Risk School of Environmental Sciences University of East Anglia Norwich NR4 7TJ 2 Centre http://www.iccr-international.org/trans-talk/docs/ws2-lake.pdf

42
V. BENEFITS
A. Benefits Methodology
Injuries Unlike a more traditional crashworthiness-based safety mechanism like airbags, the quieter vehicle issue falls under the umbrella of crash avoidance. This means that the safety mechanism at play is not as simple as an on/off switch. While an airbag either deploys during a crash or does not, the safety countermeasure of an alerting sound will be active during certain times during the vehicle’s operation in an attempt to provide warning to pedestrians of the vehicle’s presence and driver’s intention in an equivalent measure to the more common ICE vehicles. Thus, this rule seeks to eliminate the discrepancy between ICE vehicles and their quieter counterparts. NHTSA performed several analyses using state data volunteered from 16 states.42 We are unable to release this data to the public because of confidentiality agreements with the states. In some analyses we tried to match hybrids with comparable ICE make/models and in others we compared pedestrian injuries caused by ICE vehicles and HVs of all makes and models available. One result of that study is the ratio of the incidence rate of all HVs to the incidence rate of all ICE vehicles. It was found that HVs subject to the requirements of this proposal are 1.19 times as likely to produce pedestrian impacts and 1.44 times as likely to produce pedalcyclist impacts of the kind in question compared to ICE vehicles.43 There were not enough electric vehicles in the fleet to make similar comparisons as we did with hybrid vehicles. Given that electric vehicle produce similar sound levels to hybrids moving under electric power, we would assume the same incidence rates for electric vehicles as for hybrid vehicles. Despite the similarities in the overall sound level produced by the two vehicles (See Table II-1, above), the differential crash rate for the Civic HV and the ICE version of the Civic was even larger than for other pairs of HVs and ICEs. We note that the HV Civic is much different than the other hybrid vehicles in the analysis because when the agency tested this vehicle, we could not get the ICE engine to shutoff even at idle. Thus, unlike the other HVs tested, the ICE was always on in this vehicle, but we acknowledge that in the real-world, the ICE may shut-off at some point. We do know that, although sound levels are similar, there are differences between the frequency profile of the HV and ICE Civics, but we do not know how pedestrians would perceive this difference either in general or in the low-speed maneuvers used in our crash analysis. An attempt was made to compare urban vs. rural driving conditions, using variables regarding “big cities” (population over 600,000). We found that, while both hybrids and ICEs have higher crash rates in big cities than smaller areas, the data did not indicate that hybrids had a higher 42Wu et al. (2011) Incidence Rates of Pedestrian And Bicyclist Crashes by Hybrid Electric Passenger Vehicles: An Update, Report No. DOT HS 811 526. Dept. of Transportation, Washington, DC. Available at http://www-nrd.nhtsa.dot.gov/Pubs/811526.pdf 43 These results are from any roadway, with any speed limit. We applied the higher incidence rates on all roads for all pedestrian injuries. Higher odds ratios existed between HEVs and ICEs on those roadways with speed limits of 35 mph or less.

43
relative risk than ICEs in “big cities” because the hybrid sample size in big cities was not large enough, in parts caused by the few cities that qualify as “big cities” in the current variable definition. The agency seeks comments on whether the differences in pedestrian crash rates between HVs and ICEs are solely due to a pedestrians’ inability to detect the vehicle based on the vehicle’s sound while operating below the crossover speed or whether there may be other factors that we have not identified that affect the difference in crash rates between the two types of vehicles. The rule would only affect pedestrian and pedalcyclists at speeds around or below 18 mph that were caused by the reduced sound of HVs. To estimate the number of affected crashes, we examined the odds ratio between ICE vehicles and HVs for both crashes that occurred on streets with posted speed limits of 35 mph or less, as well as on all streets regardless of speed limit. These values in the dataset are “posted speed limits” and are not the actual speeds of the vehicles involved. State data on actual speeds does not exist for the crashes in NHTSA databases. Typically we found that the odds ratio was higher for streets with posted speed limits of 35 mph or less, than the odds ratio for all streets regardless of speed limit. This, as well as findings that HVs had higher incidence rates with pedestrians in low speed maneuvers and that the crossover speed was somewhere around 30 km/h, led us to believe that the difference in sound between the two vehicle types did not affect pedestrian collisions at higher speeds. We decided, however, to use the odds ratio for all speeds and apply it to all pedestrian and pedalcyclist crashes instead of limiting it to those with posted speed limit below 35 mph for several reasons:
• Using all speed was a more accurate analysis because we did not have to rely on police reporting of speed limits and the uncertainties associated with unknowns.
• Because the agency does not have data about the actual vehicle speeds during a pedestrian or pedalcyclist crash, using a posted speed of 35 mph (56 km/hr) for low speed crashes (when the crossover speed is 30 km/h (18 mph)) was not a perfect proxy measure. There would be many crashes at 18-35 mph speeds that would be in the data set.
• Even at a 40 mph (64 km/h) speed limit or higher there would be cases where the car slowed below 30 km/h (18 mph) to turn and could strike a pedestrian while turning at a lower speed, where the sound might be generated.
Based on everything we know, we would assume that at speeds above the crossover speed, ICEs and HVs would have the same crash rate and would not be affected by sound. This is due to the fact that pedestrian crash rates for HVs travelling at speeds greater than 35 mph are not greater than those of ICE vehicles. Therefore the results of the analysis would be the same using pedestrian crashes for either all speeds or for posted speed limit of 35 mph. The rate of crashes between HVs and pedalcyclists was different than the rate of crashes between HVs and pedestrians. While a larger percentage of pedalcyclist crashes for both HVs and ICE vehicles occurred at posted speed limits of 35 mph and below, the difference in rates of pedalcyclist crashes between HVs and ICE vehicles was higher at speed limits above 35 mph that at speed limits of 35 mph and below. For posted speed limits of 35 mph and below HVs showed an increased rate of pedalcyclist crashes when compared to ICE vehicles, however, the results were not statically significant. We seek comment on how this may affect the accuracy of

44
our measurement and whether there is some other cause for the differential pedalcylcist crash rates between HVs and ICEs. In order to construct a nationwide estimate of the number of pedestrian and pedalcyclist crashes caused by quiet HVs, the differential accident rates estimated from state data were applied to NASS-GES crash data. This is provided below in Table V-1a for pedestrians and Table V-1b for pedalcyclists. The legend to the table below is: O = No injury C = Possible injury B = Non-incapacitating injury A = Incapacitating injury ISU = Injured, severity unknown The analysis starts by estimating the number of pedestrian and pedalcyclists crashes for all vehicles and then estimates the number of crashes with applicable hybrid and electric vehicles.

45
Table V-1a Estimate of Pedestrians injured in motor vehicle traffic crashes where the first harmful event is a collision
with a non-fixed object (a pedestrian or a pedalcyclist) By Vehicle Type, Injury Severity, and Year General Estimates System (GES) 2006-2010
Pedestrians Injuries Year 2006 to 2010
2006 2007 2008 2009 2010 Number Percent Number Percent Number Percent Number Percent Number Percent Number Percent
Passenger Car (PC)
(O) 830 2.40% 789 1.80% 1,022 2.80% 29 0.10% 1,290 3.30% 3,961 2.10% (C) 11,244 31.90% 17,670 40.00% 14,334 38.80% 9,230 29.50% 16,426 41.50% 68,904 36.80% (B) 12,872 36.50% 14,203 32.20% 13,212 35.70% 13,363 42.70% 13,486 34.10% 67,137 35.80% (A) 8,554 24.20% 9,215 20.90% 7,495 20.30% 7,020 22.40% 6,507 16.40% 38,791 20.70%
(ISU) 1,784 5.10% 2,297 5.20% 908 2.50% 1,657 5.30% 1,871 4.70% 8,517 4.50% Total 35,285 100.00% 44,174 100.00% 36,971 100.00% 31,300 100.00% 39,580 100.00% 187,310 100.00%
Light Trucks &
Vans (LTV)
(O) 597 2.90% 1,824 8.30% 671 2.50% 641 2.80% 346 1.30% 4,079 3.40% (C) 5,789 28.00% 5,738 26.20% 11,368 41.60% 6,221 27.20% 10,220 38.90% 39,336 33.00% (B) 8,167 39.50% 9,062 41.30% 9,032 33.00% 9,672 42.20% 9,669 36.80% 45,602 38.30% (A) 5,013 24.20% 5,007 22.80% 4,522 16.50% 5,043 22.00% 4,506 17.10% 24,092 20.20%
(ISU) 1,135 5.50% 295 1.30% 1,759 6.40% 1,334 5.80% 1,537 5.80% 6,059 5.10% Total 20,701 100.00% 21,926 100.00% 27,352 100.00% 22,911 100.00% 26,278 100.00% 119,168 100.00%
*NOTE: The above numbers are not actual counts, but estimates of the actual counts. The estimates are calculated from data obtained from a nationally representative sample of crashes collected through NHTSA's General Estimates System (GES). Estimates should be rounded to the nearest 1,000. Estimates less than 500 indicate that the sample size was too small to produce a meaningful estimate and should be rounded to 0.

46
Table V-1a (continued) Estimate of Pedestrians injured in motor vehicle traffic crashes where the first harmful event is a collision
with a non-fixed object (a pedestrian or a pedalcyclist) By Vehicle Type, Injury Severity, and Year General Estimates System (GES) 2006-2010
Pedestrians Injuries Year 2006 to 2010
2006 2007 2008 2009 2010 Number Percent Number Percent Number Percent Number Percent Number Percent Number Percent
Motorcycle (O) . . . . . . . . . . . .
(C) . . 375 30.90% 15 4.50% 615 69.70% 295 37.60% 1,299 34.00%
(B) 416 67.20% 485 39.90% 155 47.70% 181 20.50% 158 20.10% 1,394 36.50%
(A) 203 32.80% 233 19.20% 155 47.80% 87 9.80% 33 4.20% 710 18.60%
(ISU) . . 121 10.00% . . . . 299 38.10% 421 11.00%
Total 618 100.00% 1,213 100.00% 324 100.00% 882 100.00% 785 100.00% 3,823 100.00%
Buses (O) . . . . . . . . . . . .
(C) 13 4.30% . . 284 43.70% 12 3.60% . . 309 12.40%
(B) 230 75.90% 381 49.20% 275 42.20% 241 72.60% 347 80.20% 1,474 59.10%
(A) 60 19.80% 393 50.80% 92 14.10% 79 23.80% 86 19.80% 710 28.50%
(ISU) . . . . . . . . . . . .
Total 303 100.00% 775 100.00% 651 100.00% 332 100.00% 432 100.00% 2,493 100.00%
Other/Unknown Vehicle
(O) . . 12 17.20% . . . . . . 12 3.70%
(C) . . . . . . . . . . . .
(B) 33 38.80% 27 39.00% 15 15.80% . . 20 46.80% 95 29.20%
(A) 51 61.20% 31 43.80% 80 84.20% 34 100.00% 23 53.20% 219 67.10%
(ISU) . . . . . . . . . . . .
Total 84 100.00% 70 100.00% 95 100.00% 34 100.00% 43 100.00% 326 100.00%
*NOTE: The above numbers are not actual counts, but estimates of the actual counts. The estimates are calculated from data obtained from a nationally representative sample of crashes collected through NHTSA's General Estimates System (GES). Estimates should be rounded to the nearest 1,000. Estimates less than 500 indicate that the sample size was too small to produce a meaningful estimate and should be rounded to 0.

47
Table V-1a (continued) Estimate of Pedestrians injured in motor vehicle traffic crashes where the first harmful event is a collision
with a non-fixed object (a pedestrian or a pedalcyclist) By Vehicle Type, Injury Severity, and Year General Estimates System (GES) 2006-2010
Pedestrians Injuries Year 2006 to 2010
2006 2007 2008 2009 2010 Number Percent Number Percent Number Percent Number Percent Number Percent Number Percent
LARGE TRUCKS
(Medium+Heavy Trucks)
(O) . . . . . . . . . . . .
(C) 382 34.40% 283 32.60% 327 34.30% 58 11.20% 412 45.10% 1,462 33.50%
(B) 253 22.80% 223 25.70% 298 31.20% 121 23.40% 382 41.90% 1,277 29.30%
(A) 462 41.70% 321 37.00% 330 34.50% 338 65.30% 113 12.40% 1,564 35.90%
(ISU) 12 1.00% 41 4.70% . . . . 6 0.60% 58 1.30%
Total 1,108 100.00% 868 100.00% 955 100.00% 518 100.00% 912 100.00% 4,361 100.00%
Total (O) 1,427 2.50% 2,625 3.80% 1,693 2.60% 669 1.20% 1,636 2.40% 8,052 2.50%
(C) 17,428 30.00% 24,065 34.90% 26,328 39.70% 16,137 28.80% 27,353 40.20% 111,311 35.10%
(B) 21,971 37.80% 24,381 35.30% 22,986 34.60% 23,578 42.10% 24,062 35.40% 116,978 36.80%
(A) 14,343 24.70% 15,200 22.00% 12,673 19.10% 12,602 22.50% 11,267 16.60% 66,085 20.80%
(ISU) 2,930 5.00% 2,754 4.00% 2,667 4.00% 2,991 5.30% 3,713 5.50% 15,055 4.70%
Total 58,100 100.00% 69,026 100.00% 66,347 100.00% 55,977 100.00% 68,031 100.00% 317,480 100.00%
*NOTE: The above numbers are not actual counts, but estimates of the actual counts. The estimates are calculated from data obtained from a nationally representative sample of crashes collected through NHTSA's General Estimates System (GES). Estimates should be rounded to the nearest 1,000. Estimates less than 500 indicate that the sample size was too small to produce a meaningful estimate and should be rounded to 0.

48
Table V-1b Estimate of Pedalcyclists injured in motor vehicle traffic crashes where the first harmful event is a collision
with a non-fixed object (a pedestrian or a pedalcyclist) By Vehicle Type, Injury Severity, and Year General Estimates System (GES) 2006-2010
Pedalcyclists Injuries Year 2006 to 2010
2006 2007 2008 2009 2010 Number Percent Number Percent Number Percent Number Percent Number Percent Number Percent
Passenger Car (PC)
(O) 2,654 9.20% 3,792 12.40% 2,703 8.20% 1,958 6.40% 2,428 7.30% 13,535 8.70% (C) 10,491 36.20% 9,740 32.00% 11,576 35.20% 12,463 40.70% 12,463 37.40% 56,732 36.30% (B) 11,142 38.40% 12,792 42.00% 14,315 43.50% 11,959 39.10% 14,422 43.30% 64,630 41.30% (A) 3,438 11.90% 3,921 12.90% 3,934 11.90% 3,545 11.60% 2,654 8.00% 17,493 11.20%
(ISU) 1,254 4.30% 227 0.70% 390 1.20% 689 2.30% 1,363 4.10% 3,922 2.50% Total 28,978 100.00% 30,473 100.00% 32,918 100.00% 30,613 100.00% 33,330 100.00% 156,312 100.00%
Light Trucks &
Vans (LTV)
(O) 1,150 6.40% 2,667 14.70% 1,315 6.00% 1,245 5.50% 980 4.80% 7,356 7.30% (C) 6,523 36.50% 4,839 26.60% 8,896 40.30% 8,820 39.00% 6,833 33.40% 35,912 35.50% (B) 7,025 39.40% 7,757 42.70% 9,050 41.00% 10,182 45.10% 9,583 46.90% 43,597 43.10% (A) 2,583 14.50% 2,132 11.70% 2,091 9.50% 2,324 10.30% 2,166 10.60% 11,295 11.20%
(ISU) 571 3.20% 780 4.30% 731 3.30% 19 0.10% 892 4.40% 2,994 3.00% Total 17,851 100.00% 18,175 100.00% 22,084 100.00% 22,590 100.00% 20,455 100.00% 101,155 100.00%
*NOTE: The above numbers are not actual counts, but estimates of the actual counts. The estimates are calculated from data obtained from a nationally representative sample of crashes collected through NHTSA's General Estimates System (GES). Estimates should be rounded to the nearest 1,000. Estimates less than 500 indicate that the sample size was too small to produce a meaningful estimate and should be rounded to 0.

49
Table V-1b (continued) Estimate of Pedalcyclists injured in motor vehicle traffic crashes where the first harmful event is a collision
with a non-fixed object (a pedestrian or a pedalcyclist) By Vehicle Type, Injury Severity, and Year General Estimates System (GES) 2006-2010
Pedalcyclists Injuries Year 2006 to 2010
2006 2007 2008 2009 2010 Number Percent Number Percent Number Percent Number Percent Number Percent Number Percent
Motorcycle (O) . . 263 52.00% 277 34.10% . . . . 539 25.80%
(C) . . 49 9.70% 271 33.30% 35 26.70% 293 59.00% 648 30.90%
(B) 85 57.10% 168 33.20% 171 21.10% 83 63.90% 151 30.50% 658 31.50%
(A) 64 42.90% 25 5.00% 93 11.50% 12 9.50% 52 10.50% 247 11.80%
(ISU) . . . . . . . . . . . .
Total 149 100.00% 505 100.00% 812 100.00% 130 100.00% 496 100.00% 2,093 100.00%
Buses (O) . . . . 260 48.70% 12 5.60% . . 272 14.50%
(C) . . 248 57.40% . . . . 299 61.80% 547 29.10%
(B) 161 75.20% 91 21.10% 220 41.30% 128 59.30% 132 27.30% 733 39.00%
(A) 53 24.80% 92 21.40% 53 10.00% 76 35.10% 53 10.90% 327 17.40%
(ISU) . . . . . . . . . . . .
Total 215 100.00% 431 100.00% 533 100.00% 215 100.00% 485 100.00% 1,879 100.00%
Other/Unknown Vehicle
(O) . . . . . . . . . . . .
(C) . . . . . . . . . . . .
(B) 11 100.00% 16 100.00% 55 50.50% 13 100.00% . . 96 64.00%
(A) . . . . 54 49.50% . . . . 54 36.00%
(ISU) . . . . . . . . . . . .
Total 11 100.00% 16 100.00% 109 100.00% 13 100.00% . . 150 100.00%
*NOTE: The above numbers are not actual counts, but estimates of the actual counts. The estimates are calculated from data obtained from a nationally representative sample of crashes collected through NHTSA's General Estimates System (GES). Estimates should be rounded to the nearest 1,000. Estimates less than 500 indicate that the sample size was too small to produce a meaningful estimate and should be rounded to 0.

50
Table V-1b (continued) Estimate of Pedalcyclists injured in motor vehicle traffic crashes where the first harmful event is a collision
with a non-fixed object (a pedestrian or a pedalcyclist) By Vehicle Type, Injury Severity, and Year General Estimates System (GES) 2006-2010
Pedalcyclists Injuries Year 2006 to 2010
2006 2007 2008 2009 2010 Number Percent Number Percent Number Percent Number Percent Number Percent Number Percent
LARGE TRUCKS
(Medium+Heavy Trucks)
(O) 15 3.70% . . 250 42.50% . . 40 10.30% 304 14.50%
(C) 9 2.30% 36 8.70% 10 1.70% 5 1.50% 23 5.90% 83 3.90%
(B) 320 82.10% 283 68.10% 226 38.50% 238 74.10% 182 46.80% 1,251 59.40%
(A) 31 8.00% 85 20.50% 102 17.40% 58 18.00% 124 31.80% 401 19.00%
(ISU) 15 3.80% 11 2.70% . . 20 6.30% 21 5.30% 67 3.20%
Total 390 100.00% 416 100.00% 588 100.00% 322 100.00% 390 100.00% 2,106 100.00%
Total (O) 3,818 8.00% 6,721 13.40% 4,804 8.40% 3,215 6.00% 3,448 6.30% 22,006 8.30%
(C) 17,022 35.80% 14,913 29.80% 20,753 36.40% 21,322 39.60% 19,912 36.10% 93,922 35.60%
(B) 18,744 39.40% 21,108 42.20% 24,038 42.10% 22,603 41.90% 24,471 44.40% 110,964 42.10%
(A) 6,169 13.00% 6,256 12.50% 6,327 11.10% 6,015 11.20% 5,050 9.20% 29,817 11.30%
(ISU) 1,840 3.90% 1,019 2.00% 1,121 2.00% 728 1.40% 2,275 4.10% 6,983 2.60%
Total 47,594 100.00% 50,016 100.00% 57,044 100.00% 53,884 100.00% 55,155 100.00% 263,694 100.00%
*NOTE: The above numbers are not actual counts, but estimates of the actual counts. The estimates are calculated from data obtained from a nationally representative sample of crashes collected through NHTSA's General Estimates System (GES). Estimates should be rounded to the nearest 1,000. Estimates less than 500 indicate that the sample size was too small to produce a meaningful estimate and should be rounded to 0.

51
Table V-1c Estimate of Pedestrians and Pedalcyclists injured in motor vehicle traffic crashes where the first harmful event is a collision with a
non-fixed object (a pedestrian or a pedalcyclist) By Vehicle Type General Estimate System (GES) 2006-2010
Pedestrians Pedalcyclists Count Average Percent Count Average Percent Passenger Car (PC) 187,310 37,462 59% 156,312 31,262 59% Light Trucks & Vans (LTV) 119,168 23,834 38% 101,155 20,231 38% Motorcycle 3,823 765 1% 2,093 419 1% Buses 2,493 499 1% 1,879 376 1% Other/Unknown Vehicle 326 65 0% 150 30 0% LARGE TRUCKS (Medium+Heavy Trucks) 4,361 872 1% 2,106 421 1% Total 317,480 63,496 100% 263,694 52,739 100%
*NOTE: The above numbers are the counts over the time span, and the average annual count. The estimates are calculated from data obtained from a nationally representative sample of crashes collected through NHTSA's General Estimates System (GES). Estimates should be rounded to the nearest 1,000. Estimates less than 500 indicate that the sample size was too small to produce a meaningful estimate and should be rounded to 0.

52
However, GES does not provide estimates for crashes that were not “in traffic.” For this, the 2007 one-time Not in Traffic Study (NiTS) was used to complement the table above. NiTS numbers are presented in Table V-2.
Table V-2 NiTS Estimated Nontraffic Pedestrian/Pedalcyclist Injuries
Pedestrian Pedalcyclist Total
Possible injury (C) 11,202 821 12,023
93% 7% 100% 35% 43% 36%
Non-incapacitating Injury (B) 12,229 834 13,063
94% 6% 100% 39% 44% 39%
Incapacitating Injury (A) 7,443 181 7,624
98% 2% 100% 24% 10% 23%
Injured, Severity Unknown (U) 777 53 830
94% 6% 100% 2% 3% 2%
Total 31,651 1,890 33,541 In order to combine the GES and NiTS data in a meaningful way, it was assumed that the ratio of GES-to-NiTS will be constant for all years 2006 to 2010. The NiTS data is not easily connected to vehicle types. Therefore, given the percentages in Table V-1c, NiTS data was distributed into the various vehicle types. Therefore, given the estimates below, NiTS data provides an additional 42% more pedestrian PC cases and 54% more pedestrian LTV cases than the GES estimate alone, and thus the average annual GES injury count of over 61,000 is supplemented by an additional 46% to provide a total of over 90,000 injuries. NiTS data provides an additional 4% more pedalcyclist PC cases and 4% more pedalcyclist LTV cases than the GES estimate alone, and thus the average annual GES injury count of 51,000 is supplemented by an additional 4% to provide a total of over 53,000 injuries. In total, then, the NiTS data provides an additional 33,541 injuries to pedestrians and pedalcyclists.
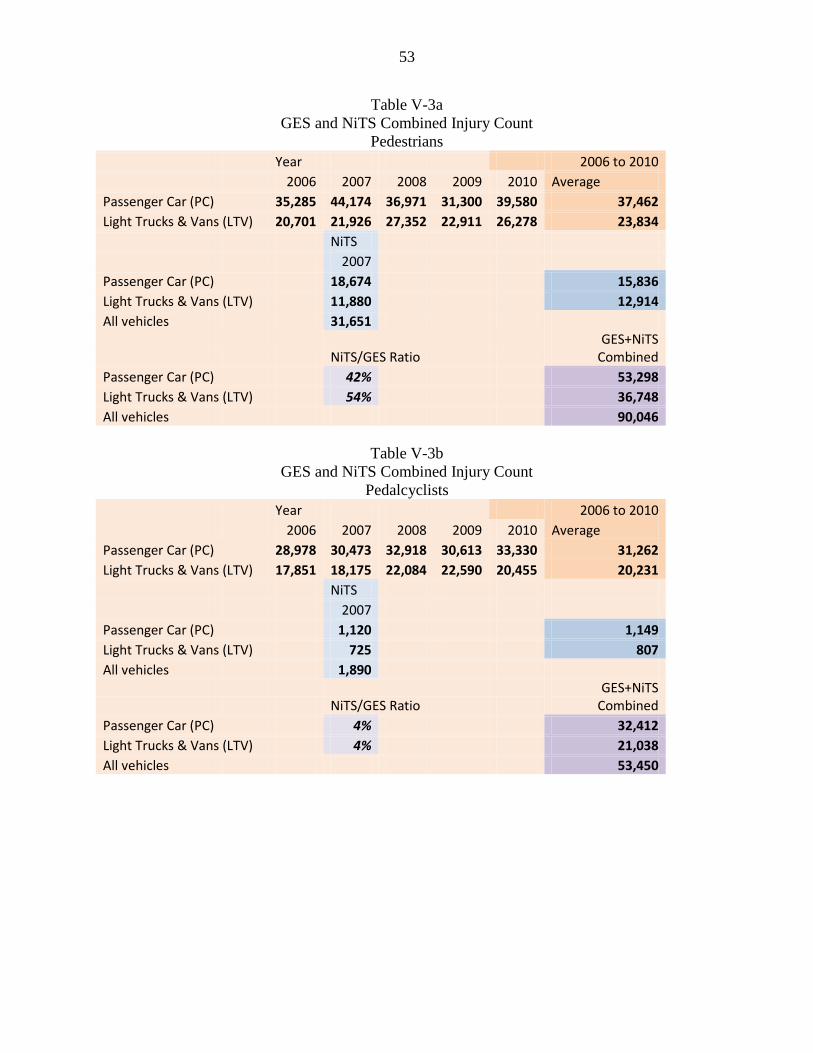
53
Table V-3a GES and NiTS Combined Injury Count
Pedestrians Year 2006 to 2010 2006 2007 2008 2009 2010 Average Passenger Car (PC) 35,285 44,174 36,971 31,300 39,580 37,462 Light Trucks & Vans (LTV) 20,701 21,926 27,352 22,911 26,278 23,834 NiTS 2007 Passenger Car (PC) 18,674 15,836 Light Trucks & Vans (LTV) 11,880 12,914 All vehicles 31,651
NiTS/GES Ratio GES+NiTS
Combined Passenger Car (PC) 42% 53,298 Light Trucks & Vans (LTV) 54% 36,748 All vehicles 90,046
Table V-3b
GES and NiTS Combined Injury Count Pedalcyclists
Year 2006 to 2010 2006 2007 2008 2009 2010 Average Passenger Car (PC) 28,978 30,473 32,918 30,613 33,330 31,262 Light Trucks & Vans (LTV) 17,851 18,175 22,084 22,590 20,455 20,231 NiTS 2007 Passenger Car (PC) 1,120 1,149 Light Trucks & Vans (LTV) 725 807 All vehicles 1,890
NiTS/GES Ratio GES+NiTS
Combined Passenger Car (PC) 4% 32,412 Light Trucks & Vans (LTV) 4% 21,038 All vehicles 53,450

54
Table V-3c GES and NiTS Combined Injury Counts
Pedestrians
Average GES
"Average" NiTS GES+NiTS
Passenger Car (PC) 37,462 15,836 53,298 Light Trucks & Vans (LTV) 23,834 12,914 36,748 Motorcycle 764 240 1,005 Buses 499 160 658 Other/Unknown Vehicle 65 30 95 LARGE TRUCKS (Medium+Heavy Trucks) 872 437 1,309 Total 63,496 29,618 93,114
Table V-3d GES and NiTS Combined Injury Counts
Pedalcyclists
Average GES
"Average" NiTS GES+NiTS
Passenger Car (PC) 31,262 1,149 32,412 Light Trucks & Vans (LTV) 20,231 807 21,038 Motorcycle 418 12 431 Buses 376 12 388 Other/Unknown Vehicle 30 2 32 LARGE TRUCKS (Medium+Heavy Trucks) 421 15 436 Total 52,739 1,998 54,736
All the above GES and NiTS data come from police-reported sources. Two missing components given police-reported data are injury severity provided in an easily monetizable format and a count of all unreported crashes. The first issue is addressed by a KABCO-MAIS translator tool used by NHTSA. The table is provided below, followed by the total police reported crashes (GES and NiTS combined) presented by MAIS injury level. Typically what happens when we use this translator from police reported injuries to AIS level injuries is that the total number of injuries decreases. Some people that were listed as “C” possible injuries by the police are later determined to be uninjured in the hospital. Thus, for example, you will note that the total number of injuries by AIS is 76,714 for pedestrians compared to 90,046 by police reported.

55
Table V-4 KABCO to MAIS Translator
MAIS A B C K NO ISU UNLK 0 0.03421 0.08336 0.23431 0 0.92535 0.21528 0.4293 1 0.55195 0.76745 0.68929 0 0.07257 0.62699 0.41027 2 0.20812 0.10884 0.06389 0 0.00198 0.10395 0.08721 3 0.14371 0.03187 0.01071 0 0.00008 0.03856 0.04735 4 0.03968 0.00619 0.00142 0 0 0.00442 0.00606 5 0.01775 0.00101 0.00013 0 0.00003 0.01034 0.00274
Fatal 0.00458 0.00128 0.00025 1 0 0.00046 0.01707 Total 1 1 1 1 1.00001 1 1
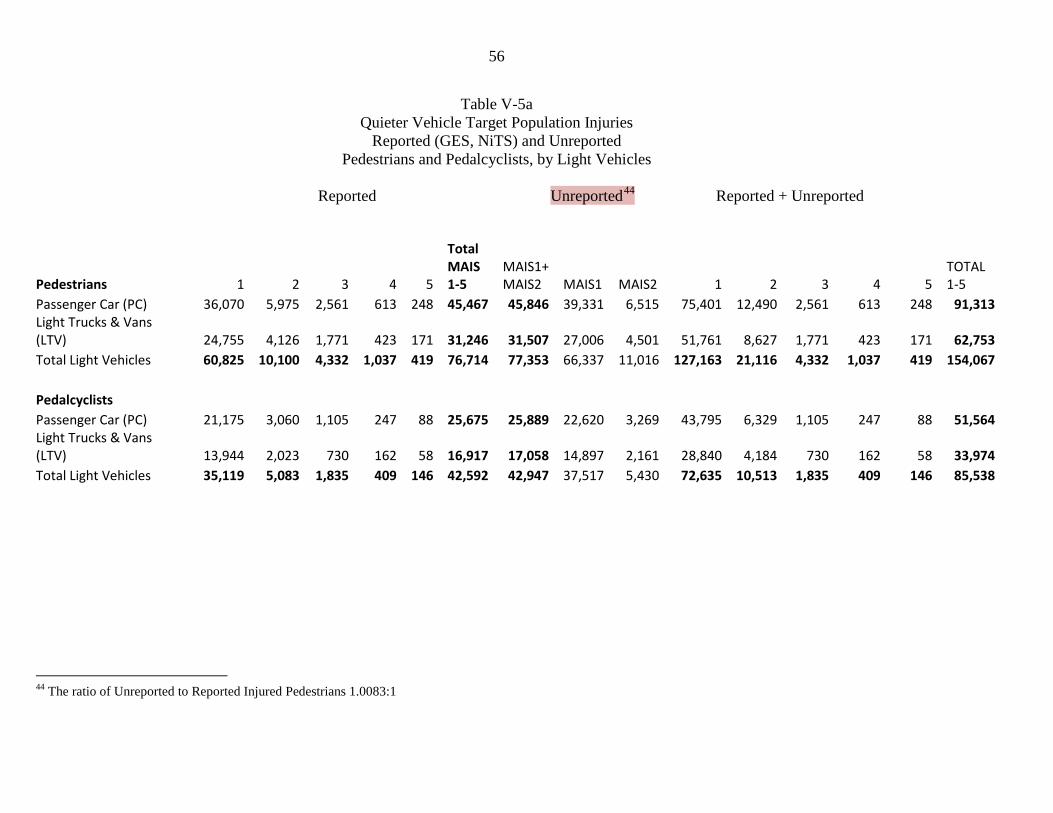
56
Table V-5a Quieter Vehicle Target Population Injuries
Reported (GES, NiTS) and Unreported Pedestrians and Pedalcyclists, by Light Vehicles
Reported Unreported44 Reported + Unreported
Pedestrians 1 2 3 4 5
Total MAIS 1-5
MAIS1+ MAIS2 MAIS1 MAIS2 1 2 3 4 5
TOTAL 1-5
Passenger Car (PC) 36,070 5,975 2,561 613 248 45,467 45,846 39,331 6,515 75,401 12,490 2,561 613 248 91,313 Light Trucks & Vans (LTV) 24,755 4,126 1,771 423 171 31,246 31,507 27,006 4,501 51,761 8,627 1,771 423 171 62,753 Total Light Vehicles 60,825 10,100 4,332 1,037 419 76,714 77,353 66,337 11,016 127,163 21,116 4,332 1,037 419 154,067
Pedalcyclists Passenger Car (PC) 21,175 3,060 1,105 247 88 25,675 25,889 22,620 3,269 43,795 6,329 1,105 247 88 51,564
Light Trucks & Vans (LTV) 13,944 2,023 730 162 58 16,917 17,058 14,897 2,161 28,840 4,184 730 162 58 33,974 Total Light Vehicles 35,119 5,083 1,835 409 146 42,592 42,947 37,517 5,430 72,635 10,513 1,835 409 146 85,538
44 The ratio of Unreported to Reported Injured Pedestrians 1.0083:1

57
Table V-5b
Quieter Vehicle Target Population Injuries Reported (GES, NiTS) and Unreported
Pedestrians and Pedalcyclists, by Vehicle Type Reported Unreported45 Reported + Unreported
1 2 3 4 5
Total MAIS 1-5
MAIS1+ MAIS2 MAIS1 MAIS2 1 2 3 4 5
TOTAL 1-5
Passenger Car (PC) 36,070 5,975 2,561 613 248 45,467 45,846 39,331 6,515 75,401 12,490 2,561 613 248 91,313 Light Trucks & Vans (LTV) 24,755 4,126 1,771 423 171 31,246 31,507 27,006 4,501 51,761 8,627 1,771 423 171 62,753 Motorcycle 689 113 48 11 5 865 873 749 123 1,438 236 48 11 5 1,738 Buses 457 84 39 10 4 593 598 505 93 962 177 39 10 4 1,190 Other/Unknown Vehicle 60 15 8 2 1 86 87 70 17 129 32 8 2 1 173 LARGE TRUCKS (Medium+Heavy Trucks) 877 164 79 20 8 1,147 1,157 975 182 1,852 345 79 20 8 2,304 Total 62,908 10,476 4,506 1,079 436 79,405 80,067 68,637 11,430 131,545 21,906 4,506 1,079 436 159,472
Passenger Car (PC) 21,175 3,060 1,105 247 88 25,675 25,889 22,620 3,269 43,795 6,329 1,105 247 88 51,564 Light Trucks & Vans (LTV) 13,944 2,023 730 162 58 16,917 17,058 14,897 2,161 28,840 4,184 730 162 58 33,974 Motorcycle 226 34 13 3 1 278 280 243 37 470 71 13 3 1 558 Buses 232 38 16 4 1 291 293 252 41 485 79 16 4 1 584 Other/Unknown Vehicle 22 5 2 1 0 29 30 25 5 47 10 2 1 0 59 LARGE TRUCKS (Medium+Heavy Trucks) 267 48 21 5 2 342 345 293 52 560 100 21 5 2 688 Total 35,882 5,208 1,887 421 150 43,549 43,912 38,346 5,565 74,228 10,773 1,887 421 150 87,460
45 The ratio of Unreported to Reported Injured Pedestrians is 1.0083:1

58
The injury count above is not injuries due to quieter vehicles, but rather injuries due to all light vehicles. In Table V-5 above, unreported crashes from GES and NiTS are presented in a format more conducive to cost and benefit analysis. Only injury counts will be examined for the purpose of benefits calculations, and as such fatalities and uninjured (MAIS 0) counts are not included. The lion’s share of injuries is clearly of severity MAIS 1 and 2. Much like the arithmetic used to combine in-traffic and not-in-traffic injuries, NHTSA has a similar metric for unreported crashes. The only published NHTSA source for unreported crashes46 states that the number of unreported non-occupants in crashes is equal to 100.8 percent of the reported crashes. That is to say, for every 100 police reported pedestrians injured in crashes, there exist 100.8 additional unreported injured pedestrians, for a total of 200.8 injured pedestrians. Thus, for the 79,405 injuries reported to the authorities, there are nearly 80,067 unreported injuries. Given the distribution of injury severity of not only these crashes, but of unreported crashes in general, it is assumed unreported injuries’ severity would be of MAIS 1 and 2. The combined total injuries, after counting GES police-reported in-traffic crashes, NiTS police-reported not-in-traffic-crashes, and unreported crashes comes to 159,472 injuries, distributed by injury severity as above. Likewise, the same calculations are applicable to pedalcyclists, and the combined total of reported and unreported injuries is 87,460 pedalcyclists. In order to assign injuries to the varied vehicle types in question, the sales data from AEO will be combined with the injury risk ratios of 1.19 and 1.44 derived from state data. The agency’s 2011 analysis of the difference in crash rates between HVs and ICE vehicles included the Honda Civic Hybrid and the Honda Accord Hybrid in the HV data set.47 . To derive the odds ratios used to estimate the benefits of this rulemaking action the agency re-categorized 6496 Civic Hybrid and 1060 Accord Hybrid crashes to the ICE vehicle data set. After re-categorization the new odds ratio (HE vs. ICE) for pedestrian crashes is 1.19 with all manufacturers included (1.22 before re-categorization); and the new odds ratio (HE vs. ICE) for pedalcyclist crashes is 1.44 with all manufacturers included (1.38 before re-categorization). The odds ratio is a quotient of crash rates, and these calculations are explained in detail in the report. The guiding assumption is that the difference in crash rates between hybrid vehicles and their peers is entirely based on the sound levels of the vehicle during the various modes of operation. As discussed above, an attempt was made to find a statistically significant connection between the location of the crash (urban vs. rural), but no such connection was found, and we are requesting comment on substantive methodology for adjusting our estimate of expected benefits for any proposed confounding factors. Thus, the odds ratios explored herein are assumed to be entirely the result of the sound levels provided by the vehicle. This work step includes several assumptions regarding the injuries caused by the various propulsion types. The four following groups will culminate in Table V-6.
46 Westat (1981) “National Accident Sampling System Nonreported Accident Survey” DOT-HS-806-198, pg. 4-16 47 Wu et al. (2011) Incidence Rates of Pedestrian And Bicyclist Crashes by Hybrid Electric Passenger Vehicles: An Update, Report No. DOT HS 811 526. Dept. of Transportation, Washington, DC. Available at http://www-nrd.nhtsa.dot.gov/Pubs/811526.pdf

59
First, excluded from the rulemaking are vehicles labeled as microhybrids below. These vehicles constantly operate an ICE engine while the vehicle is moving but use energy from regenerative braking, a solar panel, an external source, or other energy sources to provide additional propulsion. Because they do not fall under the proposed rulemaking, there are no costs and no benefits associated with these vehicles. Second, HVs subject to the proposal are those vehicles capable of operating completely under two distinct sources of propulsion. These vehicles are assumed to operate under a non-ICE-only mode and produce little to no sound from the alternate propulsion source. Because these vehicles would require a countermeasure to bring their pedestrian injury rate down to an ICE-equivalent rate, they would receive benefits and costs under the rulemaking as proposed. Third, EVs are those vehicles whose only source of propulsion is a battery-operated engine producing much less engine noise than traditional ICE vehicles. However, due to foresight on the part of the light vehicles manufacturers, paired with consumer expectations and style choices, these light vehicles are all assumed to already be equipped with speaker systems capable of meeting this rulemaking. We do not assume that electric low speed vehicles, electric medium trucks, heavy trucks or buses will be voluntarily equipped with speaker systems, since none of the electric low speed vehicles, medium trucks, buses, or motorcycles that we know of have sound systems today and even if some of them do have a sound system, this is a conservative assumption. Thus, electric light vehicles are assumed to have almost no increase in costs, but their benefits under the rule are more difficult to estimate. While NHTSA’s proposed rulemaking includes specific requirements on the type of sound generated by the vehicle, it is between difficult and impossible to compare the set of all possible sound profiles manufacturers could have used to the set of all possible sounds allowable under the rulemaking. Thus, it is assumed there are some unquantifiable benefits associated with providing a codified structure on EV sounds for detectability and recognizability, but with regard to the analysis of benefits and costs, zero benefits and zero costs will be assumed. Fourth, ICEs represent what could be seen as more “traditional” vehicles, but also include diesel, flex-fuel, and all other internal combustion engines. These will not receive any benefits or costs under the current rulemaking, but it should be noted that the PSEA requires that NHTSA investigate not only hybrid and electric vehicles, but also requires NHTSA to further investigate all vehicles, regardless of propulsion type for the potential benefits of regulating minimum vehicle alert sounds. As for the proposed rule and this analysis, ICEs are assumed to provide no benefits and no costs. Thus, after considering the impact of the rule upon the four groups of light vehicle propulsion above, only the HVs will produce benefits that we are currently able to quantify. Thus, we will only calculate the benefits of equipping HVs with an alert sound, even though we are estimating the costs to all vehicles covered by this rulemaking. In the table below, the percentage of annual sales is paired with another value, dubbed the Enhanced Injury Rate (EIR). The EIR is 1.19 times

60
greater than the corresponding sales for pedestrian injury rates, and 1.44 times greater for pedalcyclists. Additionally, it is worth noting that these increased injury rates are not available for vehicle types other than Passenger Cars or Light Trucks, so benefits for motorcycles, buses, and medium and heavy trucks have not been estimated. These vehicles are assumed to have a pedestrian impact problem equivalent to passenger vehicles, but we have no real data for comparison between Hybrid and ICE versions regarding their crash behavior. However, the PSEA establishes a need for these vehicles to meet a new safety standard. In addition, specifically with regard to Low Speed Vehicles, a lack of registrations compounds an already difficult data dilemma. We intend to continue seeking data regarding all vehicle types between now and the final rule. Table V-5b is the last word available on benefits for those classes in that it does not describe benefits, but rather the target population. Since hybrid and electric vehicles are a small proportion of these target populations, possible benefits are most likely also a small proportion.
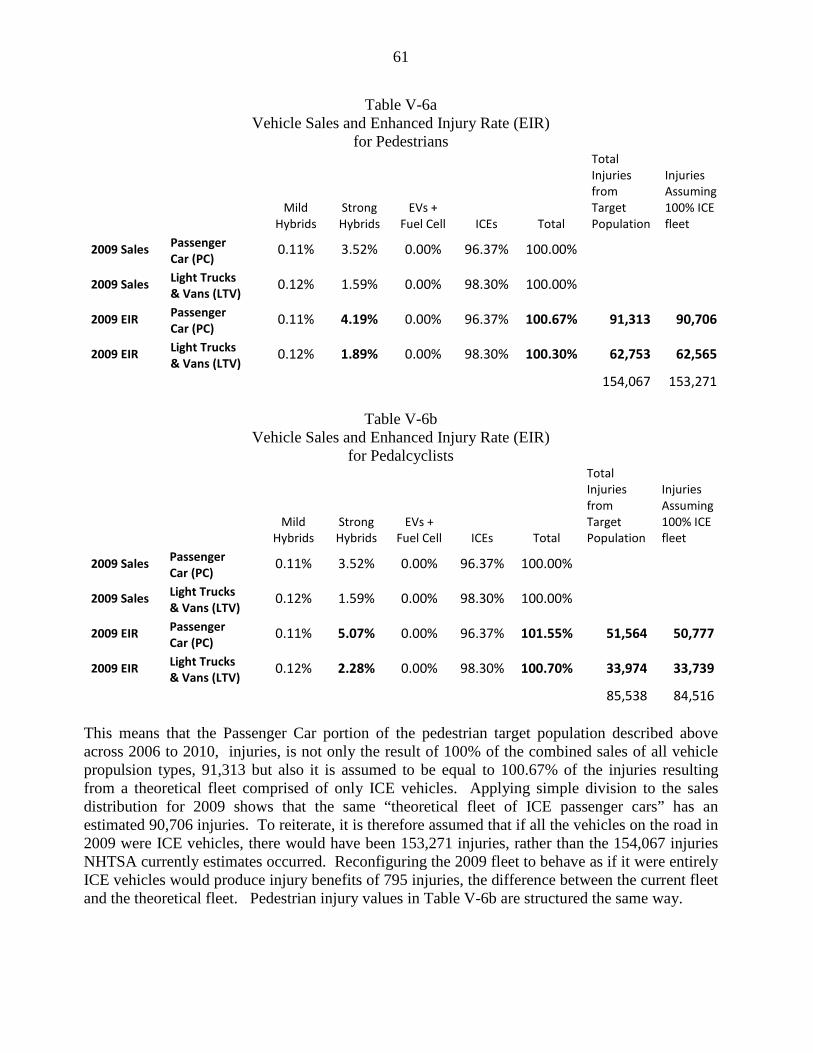
61
Table V-6a Vehicle Sales and Enhanced Injury Rate (EIR)
for Pedestrians
Mild Hybrids
Strong Hybrids
EVs + Fuel Cell ICEs Total
Total Injuries from Target Population
Injuries Assuming 100% ICE fleet
2009 Sales Passenger Car (PC)
0.11% 3.52% 0.00% 96.37% 100.00%
2009 Sales Light Trucks & Vans (LTV)
0.12% 1.59% 0.00% 98.30% 100.00%
2009 EIR Passenger Car (PC)
0.11% 4.19% 0.00% 96.37% 100.67% 91,313 90,706
2009 EIR Light Trucks & Vans (LTV)
0.12% 1.89% 0.00% 98.30% 100.30% 62,753 62,565
154,067 153,271
Table V-6b
Vehicle Sales and Enhanced Injury Rate (EIR) for Pedalcyclists
Mild Hybrids
Strong Hybrids
EVs + Fuel Cell ICEs Total
Total Injuries from Target Population
Injuries Assuming 100% ICE fleet
2009 Sales Passenger Car (PC)
0.11% 3.52% 0.00% 96.37% 100.00%
2009 Sales Light Trucks & Vans (LTV)
0.12% 1.59% 0.00% 98.30% 100.00%
2009 EIR Passenger Car (PC)
0.11% 5.07% 0.00% 96.37% 101.55% 51,564 50,777
2009 EIR Light Trucks & Vans (LTV)
0.12% 2.28% 0.00% 98.30% 100.70% 33,974 33,739
85,538 84,516
This means that the Passenger Car portion of the pedestrian target population described above across 2006 to 2010, injuries, is not only the result of 100% of the combined sales of all vehicle propulsion types, 91,313 but also it is assumed to be equal to 100.67% of the injuries resulting from a theoretical fleet comprised of only ICE vehicles. Applying simple division to the sales distribution for 2009 shows that the same “theoretical fleet of ICE passenger cars” has an estimated 90,706 injuries. To reiterate, it is therefore assumed that if all the vehicles on the road in 2009 were ICE vehicles, there would have been 153,271 injuries, rather than the 154,067 injuries NHTSA currently estimates occurred. Reconfiguring the 2009 fleet to behave as if it were entirely ICE vehicles would produce injury benefits of 795 injuries, the difference between the current fleet and the theoretical fleet. Pedestrian injury values in Table V-6b are structured the same way.

62
That is to say, assuming the pedestrian injury rate remains constant overall, the benefits produced by the rule is the difference between the injury estimate before the rulemaking (including the various higher risk vehicles) and the injury rate after the rulemaking, where the latter is the injury estimate assuming a theoretical fleet of only ICE vehicles.
Table V-7a Vehicle Sales and Enhanced Injury Rate (EIR)
for Pedestrians48
Mild Hybrids
Strong Hybrids
EVs + Fuel Cell ICEs Total
Injuries Assuming 100% ICE fleet
Injuries Assuming Predicted Fleet
Injury Difference
2016 Sales Passenger Car (PC) 4.46% 4.87% 0.50% 90.18% 100.00%
2016 Sales Light Trucks & Vans (LTV) 5.62% 3.23% 0.04% 91.11% 100.00%
2016 EIR Passenger Car (PC) 4.46% 5.79% 0.50% 90.18% 100.92% 90,706 91,545 839
2016 EIR Light Trucks & Vans (LTV) 5.62% 3.85% 0.04% 91.11% 100.61% 62,565 62,949 384
153,271 154,494 1,223
Table V-7b Vehicle Sales and Enhanced Injury Rate (EIR)
for Pedalcyclists49
Mild Hybrids
Strong Hybrids
EVs + Fuel Cell ICEs Total
Injuries Assuming 100% ICE fleet
Injuries Assuming Predicted Fleet
Injury Difference
2016 Sales Passenger Car (PC) 4.46% 4.87% 0.50% 90.18% 100.00%
2016 Sales Light Trucks & Vans (LTV) 5.62% 3.23% 0.04% 91.11% 100.00%
2016 EIR Passenger Car (PC) 4.46% 7.01% 0.50% 90.18% 102.14% 50,777 51,865 1,087
2016 EIR Light Trucks & Vans (LTV) 5.62% 4.66% 0.04% 91.11% 101.42% 33,739 34,219 480
84,516 86,084 1,567
The estimated injuries above are calculated by finding the percentage in excess of a theoretical ICE-only fleet estimate from 2009. Thus, when considering pedestrians injured by MY2016 vehicles, the rulemaking is responsible for the 1,223 injury difference between that theoretical
48 Table values may be off by one due to rounding. 49 Table values may be off by one due to rounding.

63
ICE-only fleet (153,271 injuries) and the estimated lifetime injuries from the MY2016 fleet (154,494). When considering pedalcyclists injured by MY2016 vehicles, the rulemaking is responsible for the 1,567 injury difference between that theoretical fleet (84,516 injuries) and the estimated lifetime injuries from the MY2016 fleet (86,084). The “injury differences” assume that the difference between crash rates for ICEs and non-ICEs is explained wholly by the difference in sounds produced by these two types of vehicles. It is possible that there are other factors that contribute to the difference in crash rates, which would mean that adding sound to hybrid and electric vehicles would not address 100 percent of the difference in pedestrian and pedalcyclist crashes between the two types of vehicles. NHTSA also assumes the sound added to hybrid and electric vehicles will be as effective in providing warning to pedestrians as the sound produced by a vehicle’s ICE. NHTSA invites comments regarding these assumptions, as they are the crux of the benefits methodology. This includes, but is not limited to, comments about the countermeasure alert sounds providing more or less safety benefits than their ICE counterparts and measurable and quantifiable factors influencing the crash rates of the different vehicle types. These benefits calculated above are assumed to have the same distribution as in the combined reported/unreported Table V-5 above. This calculation, combined with the NHTSA’s Comprehensive Costs using 2010$ found in the table below, will provide the monetization of benefits in Table V-8 below.
Table V-8 Value of a Statistical Life (VSL) in 2010$
Injury Severity
Monetized Comprehensive
Societal Cost Percentage of Equivalent
Life Saved (ELS)
AIS 0 $221 0.003%
AIS 1 $17,669 0.279%
AIS 2 $277,103 4.383%
AIS 3 $514,714 8.141%
AIS 4 $1,276,754 20.193%
AIS 5 $4,245,210 67.141%
Fatal $6,322,857 100.000%

64
Table V-9a Pedestrian Injury Benefits
MY2016 in 2010$
PC LTV PC + LTV Estimated
Injuries Avoided
Monetized Benefits
ELS Estimated Injuries Avoided
Monetized Benefits
ELS Estimated Injuries Avoided
Monetized Benefits
ELS
AIS0 0 $0 0 0 $0 0 0 $0 0 AIS1 693 $12,237,473 2 317 $5,602,265 1 1,010 $17,839,738 3 AIS2 115 $31,789,993 5 53 $14,642,826 2 168 $46,432,819 7 AIS3 24 $12,110,043 2 11 $5,583,102 1 34 $17,693,145 3 AIS4 6 $7,193,475 1 3 $3,311,756 1 8 $10,505,231 2 AIS5 2 $9,659,976 2 1 $4,450,111 1 3 $14,110,087 2 Fatal 0 $0 0 0 $0 0 0 $0 0 Total 839 $72,990,961 12 384 $33,590,060 5 1,223 $106,581,020 17
Table V-9b Pedalcyclists Injury Benefits
MY2016 in 2010$
PC LTV PC + LTV
Estimated Injuries Avoided
Monetized Benefits ELS
Estimated Injuries Avoided
Monetized Benefits ELS
Estimated Injuries Avoided
Monetized Benefits ELS
AIS0 0 $0 0 0 $0 0 0 $0 0 AIS1 924 $16,317,623 3 408 $7,200,121 1 1,331 $23,517,743 4 AIS2 133 $36,984,632 6 59 $16,381,817 3 193 $53,366,449 8 AIS3 23 $11,997,293 2 10 $5,307,491 1 34 $17,304,784 3 AIS4 5 $6,644,301 1 2 $2,928,520 0 7 $9,572,821 2 AIS5 2 $7,850,343 1 1 $3,484,406 1 3 $11,334,748 2 Fatal 0 $0 0 0 $0 0 0 $0 0 Total 1,087 $79,794,192 13 480 $35,302,355 6 1,567 $115,096,546 18
Thus, the quantifiable benefits for MY 2016 vehicles due to the rule are 1,223 pedestrian injuries and 1,567 pedalcyclist injuries, or in other words a total of $222M in monetized benefits or roughly 35 equivalent lives saved. Quantifiable benefits for medium and heavy trucks, buses, and motorcycles are unavailable due to a lack of an odds ratio from the state data. In their place are the complete injury target population attributed to those vehicles as a placeholder for the scale of potential benefits. No adjustment is made in these benefits to limit crashes to those below any given crossover speed. The ratios form the state data come from all posted speed limits and show the difference between HEV and ICE crash rates of all severities. Injuries of severities AIS 3, 4, and 5 are rare amongst the target population.

65
Fatalities The Fatality Analysis Reporting System (FARS) contains a census of all traffic fatalities. Hybrid and electric vehicles that struck and killed a pedestrian were identified using the Vehicle Identification Number (VIN) contained in the 2001 through 2009 FARS files. During this period there were 53 pedestrian fatalities related to 47 hybrid and three electric vehicles. Almost all (47 of the 50) of these vehicles were identified as passenger vehicles. In 2008 there were 10 hybrid or electric vehicles that struck and killed 10 pedestrians, and in 2009 there were 11 hybrid or electric vehicles that struck and killed 11 pedestrians. However, these fatalities were excluded from the target population for two reasons. The first reason is that the rate of pedestrian fatalities per registered vehicles was smaller for hybrid and electric vehicles. We don’t know why. Using 2008 numbers, the rate for hybrid and electric vehicles is 0.85 fatalities per 100,000 registered vehicles, and the corresponding rate for ICE vehicles is 1.57 per 100,000 vehicles. Thus, since this rate is already lower for EVs and HVs than for ICE vehicles, we cannot support the theory that adding sound will result in any fewer fatalities. The second reason is that the pedestrian fatalities do not follow the same pattern of being more likely to occur at lower speed limits than other vehicles as was found in the technical reports cited above. Overall 67 percent of the pedestrian fatalities involving hybrid or electric vehicles and with known speed limits occurred at a speed limit above 35 miles per hour (mph). For all pedestrian fatalities with known speed limits, 62 percent occurred at a speed limit above 35 mph and 61 percent of those involving passenger vehicles occurred at a speed limit above 35 mph. There also could be fatalities involving hybrid and electric vehicles that occur in non-traffic crashes in places such as driveways and parking lots. However, a comprehensive search for hybrid and electric vehicles involved in pedestrian fatalities could not be undertaken because the Not in Traffic Surveillance (NiTS) system does not provide VINs, and a search for model names that indicate hybrid or electric vehicles did not identify any related to pedestrian fatalities. In summary, the agency did not find a higher rate of pedestrian fatalities for hybrid and electric vehicles compared to ICE vehicles. Thus, we cannot claim any fatality benefits. The agency has another rulemaking in progress that involves rear visibility and backover fatalities. Backovers are a low speed event that has resulted in fatalities. Logically, one would believe that there would be more backing fatalities resulting from vehicles that were quieter because they provide less warning to pedestrians. A significant number of the pedestrian fatalities in the backover cases come from vulnerable populations. Of the 228 fatalities a year resulting from backovers and light vehicles, 100 (44%) are children under 5 years old and 74 (33%) are adults over 70 years of age. It is unclear how valuable the alert sound would be to children under 5 years old that don’t understand the danger involved. For these children it is unlikely that the pedestrian fatality rate would be any higher without the alert sound. For adults over 70 years old, there is the potential of hearing loss and less capability to move out of the way, which could play a part in how likely an alert sound would influence their involvement with light vehicles as pedestrians. Thus, there are a few potential theories why a higher pedestrian fatality rate of hybrid and electric vehicles has not shown up in the statistics.

66
Unquantifiable Benefits One unquantifiable benefit of the rulemaking is the incremental benefit for vehicles that carry a speaker but do not provide a compliant sound. At present, there is assumed no incremental cost for the manufacturer to switch to a compliant sound, but one could assume there is some benefit. However, with the vast number of possible sounds capable of being emitted from the sound alert system, it would be impractical to find the incremental benefits between a compliant sound and all possible sounds for vehicles not yet brought to market. For this reason, the benefits from such vehicles are not included in the analysis, but it is important to recognize the importance of codifying the safety standard for alert sounds even amongst vehicles that are already equipped with mechanisms or devices for producing sounds. In addition to the reduction in the annual number of injured pedestrians, there are other possible benefits from requiring certain vehicles to emit some minimum sound. There are benefits in navigation for the blind community. While the PSEA addresses an issue that has an impact on all pedestrians, it has a particular impact on pedestrians who are blind or visually impaired. While pedestrians regardless of sightedness are included in the above benefits calculation, there are other non-injury benefit components tied to vehicle alert sounds. According to the National Federation of the Blind (NFB), blind pedestrians use the sounds available to them in order to both perceive and navigate in their environment. There is no single established method of sightless navigation, so it is very difficult for NHTSA to address the disparate needs of every individual in the blind community. The decision to cross a road is tied to the pedestrian’s confidence that they will avoid vehicles crossing in front of them. However, the direction of traffic can be determined by observing the behavior of vehicles moving parallel to the pedestrian’s motion, and by increasing the sound levels of nearby vehicles, blind pedestrians are able to determine the motion of traffic more easily than if those vehicles were quieter. This increased navigational ability is hard to quantify and thus this benefit is mentioned but not assigned a specific productivity or quality of life monetization. Similar to navigation confidence/speed, blind pedestrians face an issue overlooked by their sighted counterparts. Without a fixed reference point, all human beings have a profound inability to walk in a straight line. Some blind pedestrians use walls, handrails, even curbs as a “shoreline” that provides a reference line parallel to their motion. Upon crossing a road with several vehicles stopped for a red traffic signal, the engine noises of idling vehicles presently provides a shoreline for blind pedestrians. If vehicles are effectively silent when waiting at a traffic signal, the blind pedestrian has no audible shoreline, which may lead them to the situation of bumping into or tripping onto stopped vehicles, or alternatively the injurious situation of wandering into the path of parallel traffic. By requiring vehicle alert sounds on vehicles, blind pedestrians will be able to navigate roads as safely and effectively as if the fleet were entirely ICE vehicles. The benefit of independent navigation leads to the ability to travel independently and therefore increased employment and the ability to live independently. Such benefits, while unquantifiable at this time, are profound.

67
VI. COST/BENEFIT ANALYSIS
A. Methodology The intent of the final rulemaking is to mitigate pedestrian crashes. This section estimates the dollars spent for every live to be saved through the reduction in injuries. It should be noted that the costs of the equipment needed to meet the requirements are incurred when the vehicles are purchased, but the injury benefits and fuel costs due to countermeasure weight will accrue over the lifetime of the fleet. Therefore, discount factors are applied to estimate the present value of injury benefits and fuel costs for a meaningful comparison to costs. All dollar values are in 2010$. With respect to reduction in the number of injuries, the agency estimates the number of “equivalent fatalities” that would be prevented, or “equivalent lives saved,” a concept that incorporates a reduction in both the number of fatalities (although there are no predicted fatality reductions in this analysis) and injuries. The estimated equivalent lives saved are discounted to account for the fact that crashes occur over the lifetime of the vehicle and not all in the same year in which the vehicle was purchased. There is general agreement within the economic community that the appropriate basis for determining discount rates is the marginal opportunity costs of lost or displaced funds. When these funds involve capital investment, the marginal, real rate of return on capital must be considered. However, when these funds represent lost consumption, the appropriate measure is the rate at which society is willing to trade-off future for current consumption. This is referred to as the "social rate of time preference," and it is generally assumed that the consumption rate of interest, i.e., the real, after-tax rate of return on widely available savings instruments or investment opportunities, is the appropriate measure of its value. Estimates of the social rate of time preference have been made by a number of authors. Robert Lind50 estimated that the social rate of time preference is between zero and six percent, reflecting the rates of return on Treasury bills and stock market portfolios. Kolb and Sheraga51 put the rate at between one and five percent, based on returns to stocks and three-month Treasury bills. Moore and Viscusi52 calculated a two percent real time rate of time preference for health, which they characterize as being consistent with financial market rates for the period covered by their study. Moore and Viscusi's estimate was derived by estimating the implicit discount rate for deferred health benefits exhibited by workers in their choice of job risk. OMB Circular A-4 recommends agencies use both three percent and seven percent as the “social rate of time preference”.
50Lind, R.C., "A Primer on the Major Issues Relating to the Discount Rate for Evaluating National Energy Options," in Discounting for Time and Risks in Energy Policy, 1982, (Washington, D.C., Resources for the Future, Inc.) 51J. Kolb and J.D. Sheraga, "A Suggested Approach for Discounting the Benefits and Costs of Environmental Regulations,: unpublished working papers. 52Moore, M.J. and Viscusi, W.K., "Discounting Environmental Health Risks: New Evidence and Policy Implications," Journal of Environmental Economics and Management, V. 18, No. 2, March 1990, part 2 of 2.

68
In the context of this particular regulatory evaluation to increase sound levels, safety benefits occur when there is a potential crash severe enough to result in a pedestrian or pedalcyclist injury that would predictably be prevented by the required technology. The benefits could occur at any time over the vehicle’s lifetime. This analysis assumes that crashes over the vehicle fleet’s lifetime will occur in proportion to the number of miles a given year’s new vehicle fleet will be driven from year to year as it ages. Tables VI-1a and VI-1b contain the vehicle miles of traveled (VMT) by vehicle age and the survival probability schedules used in calculating age and survival factors. The values in the column indicating the percentage of fleet travel that would occur each year, i.e., weighted yearly travel, are used to distribute savings by year of vehicle operation. The vehicle miles traveled (VMT) by vehicle age distribution is used to determine the percentage of lifetime mileage that occurs each year that in turn is used to calculate the discount factors by year for the three and seven percent discount rates. The two right-hand columns show the weighted values for these discount factors. These values are derived by multiplying the yearly discount factors by the share of lifetime travel that occurs in the respective years and summing these factors over the 25 or 36 years. The values in the two columns are then summed to produce the following multipliers for the respective discount rates:
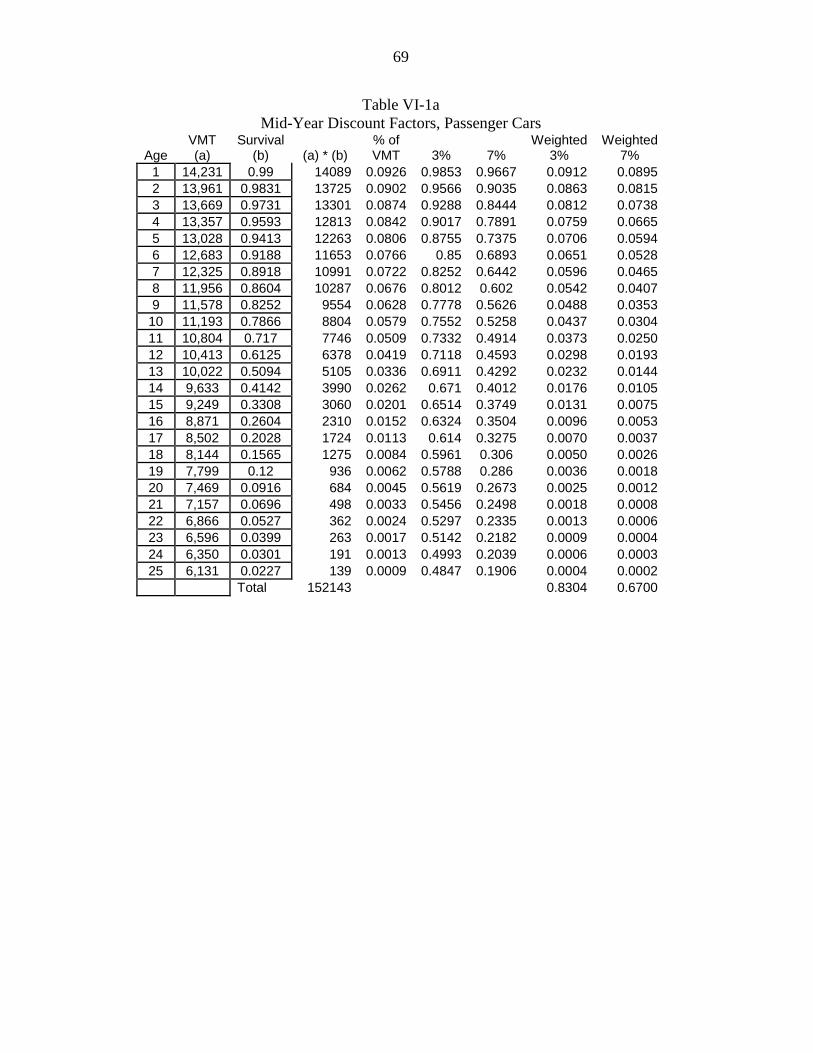
69
Table VI-1a Mid-Year Discount Factors, Passenger Cars
Age VMT (a)
Survival (b) (a) * (b)
% of VMT 3% 7%
Weighted 3%
Weighted 7%
1 14,231 0.99 14089 0.0926 0.9853 0.9667 0.0912 0.0895 2 13,961 0.9831 13725 0.0902 0.9566 0.9035 0.0863 0.0815 3 13,669 0.9731 13301 0.0874 0.9288 0.8444 0.0812 0.0738 4 13,357 0.9593 12813 0.0842 0.9017 0.7891 0.0759 0.0665 5 13,028 0.9413 12263 0.0806 0.8755 0.7375 0.0706 0.0594 6 12,683 0.9188 11653 0.0766 0.85 0.6893 0.0651 0.0528 7 12,325 0.8918 10991 0.0722 0.8252 0.6442 0.0596 0.0465 8 11,956 0.8604 10287 0.0676 0.8012 0.602 0.0542 0.0407 9 11,578 0.8252 9554 0.0628 0.7778 0.5626 0.0488 0.0353
10 11,193 0.7866 8804 0.0579 0.7552 0.5258 0.0437 0.0304 11 10,804 0.717 7746 0.0509 0.7332 0.4914 0.0373 0.0250 12 10,413 0.6125 6378 0.0419 0.7118 0.4593 0.0298 0.0193 13 10,022 0.5094 5105 0.0336 0.6911 0.4292 0.0232 0.0144 14 9,633 0.4142 3990 0.0262 0.671 0.4012 0.0176 0.0105 15 9,249 0.3308 3060 0.0201 0.6514 0.3749 0.0131 0.0075 16 8,871 0.2604 2310 0.0152 0.6324 0.3504 0.0096 0.0053 17 8,502 0.2028 1724 0.0113 0.614 0.3275 0.0070 0.0037 18 8,144 0.1565 1275 0.0084 0.5961 0.306 0.0050 0.0026 19 7,799 0.12 936 0.0062 0.5788 0.286 0.0036 0.0018 20 7,469 0.0916 684 0.0045 0.5619 0.2673 0.0025 0.0012 21 7,157 0.0696 498 0.0033 0.5456 0.2498 0.0018 0.0008 22 6,866 0.0527 362 0.0024 0.5297 0.2335 0.0013 0.0006 23 6,596 0.0399 263 0.0017 0.5142 0.2182 0.0009 0.0004 24 6,350 0.0301 191 0.0013 0.4993 0.2039 0.0006 0.0003 25 6,131 0.0227 139 0.0009 0.4847 0.1906 0.0004 0.0002 Total 152143 0.8304 0.6700

70
Table VI-1b Mid-Year Discount Factors, Light Trucks
Age
VMT (a)
Survival (b) (a) * (b)
% of VMT 3% 7%
Weighted 3%
Weighted 7%
1 16,085 0.9741 15668 0.0871 0.9853 0.9667 0.0858 0.0842 2 15,782 0.9603 15155 0.0842 0.9566 0.9035 0.0806 0.0761 3 15,442 0.942 14546 0.0808 0.9288 0.8444 0.0751 0.0683 4 15,069 0.919 13848 0.0770 0.9017 0.7891 0.0694 0.0607 5 14,667 0.8913 13073 0.0726 0.8755 0.7375 0.0636 0.0536 6 14,239 0.859 12231 0.0680 0.85 0.6893 0.0578 0.0468 7 13,790 0.8226 11344 0.0630 0.8252 0.6442 0.0520 0.0406 8 13,323 0.7827 10428 0.0579 0.8012 0.602 0.0464 0.0349 9 12,844 0.7401 9506 0.0528 0.7778 0.5626 0.0411 0.0297 10 12,356 0.6956 8595 0.0478 0.7552 0.5258 0.0361 0.0251 11 11,863 0.6501 7712 0.0429 0.7332 0.4914 0.0314 0.0211 12 11,369 0.6042 6869 0.0382 0.7118 0.4593 0.0272 0.0175 13 10,879 0.5517 6002 0.0334 0.6911 0.4292 0.0230 0.0143 14 10,396 0.5009 5207 0.0289 0.671 0.4012 0.0194 0.0116 15 9,924 0.4522 4488 0.0249 0.6514 0.3749 0.0162 0.0093 16 9,468 0.4062 3846 0.0214 0.6324 0.3504 0.0135 0.0075 17 9,032 0.3633 3281 0.0182 0.614 0.3275 0.0112 0.0060 18 8,619 0.3236 2789 0.0155 0.5961 0.306 0.0092 0.0047 19 8,234 0.2873 2366 0.0131 0.5788 0.286 0.0076 0.0038 20 7,881 0.2542 2003 0.0111 0.5619 0.2673 0.0063 0.0030 21 7,565 0.2244 1698 0.0094 0.5456 0.2498 0.0051 0.0024 22 7,288 0.1975 1439 0.0080 0.5297 0.2335 0.0042 0.0019 23 7,055 0.1735 1224 0.0068 0.5142 0.2182 0.0035 0.0015 24 6,871 0.1522 1046 0.0058 0.4993 0.2039 0.0029 0.0012 25 6,739 0.1332 898 0.0050 0.4847 0.1906 0.0024 0.0010 26 6,663 0.1165 776 0.0043 0.4706 0.1781 0.0020 0.0008 27 6,648 0.1017 676 0.0038 0.4569 0.1665 0.0017 0.0006 28 6,648 0.0887 590 0.0033 0.4436 0.1556 0.0015 0.0005 29 6,648 0.0773 514 0.0029 0.4307 0.1454 0.0012 0.0004 30 6,648 0.0673 447 0.0025 0.4181 0.1359 0.0010 0.0003 31 6,648 0.0586 390 0.0022 0.4059 0.127 0.0009 0.0003 32 6,648 0.0509 338 0.0019 0.3941 0.1187 0.0007 0.0002 33 6,648 0.0443 295 0.0016 0.3826 0.1109 0.0006 0.0002 34 6,648 0.0385 256 0.0014 0.3715 0.1037 0.0005 0.0001 35 6,648 0.0334 222 0.0012 0.3607 0.0969 0.0004 0.0001 36 6,648 0.029 193 0.0011 0.3502 0.0905 0.0004 0.0001 Total 179959 0.8022 0.6303
For passenger cars, 0.8304 for a three percent discount rate and 0.6700 for a seven percent discount rate, as shown in Table VI-1a. For light trucks, 0.8022 for a three percent discount rate and 0.6303 for a seven percent discount rate, as shown in Table VI-1b. These multipliers are applied to the estimated number of equivalent fatalities prevented to give the present values of estimated safety benefits for the respective discount rates.

71
Tables VI-2 and VI-3 below refers to benefits and costs respectively covered earlier in this report. Total costs for light vehicles are calculated by summing installation costs and fuel costs due to increase in vehicle weight. Table VI-4 combines the two tables before it into a smaller summary table. Total cost per life saved is simply the quotient of the total costs and the equivalent lives saved. Net impact refers to the difference between the monetized lifetime benefits and the total lifetime costs. Net impact per vehicle is the previous value divided by the estimated sales, providing an estimation of the benefits attributed to each vehicle.
Table VI-2 Discounted Benefits
Pedestrians Pedalcyclists TOTAL PED + CYC
3% discount
3% discount factor
Total Monetized Benefits
Total ELS
3% discount factor
Total Monetized Benefits
Total ELS
3% discount factor
Total Monetized Benefits
Total ELS
(PC) 0.8034 $58,640,938 9.27 0.8034 $64,106,653 10.14 0.8034 $122,747,591 19.41 (LTV) 0.8022 $26,945,946 4.26 0.8022 $28,319,549 4.48 0.8022 $55,265,495 8.74 Total $85,586,884 13.54
$92,426,203 14.62
$178,013,086 28.15
Pedestrians Pedalcyclists TOTAL PED + CYC
7% discount
7% discount factor
Total Monetized Benefits
Total ELS
7% discount factor
Total Monetized Benefits
Total ELS
7% discount factor
Total Monetized Benefits
Total ELS
(PC) 0.6700 $48,903,944 7.73 0.6700 $53,462,108 8.46 0.6700 $102,366,052 16.19 (LTV) 0.6303 $21,171,815 3.35 0.6303 $22,251,074 3.52 0.6303 $43,422,889 6.87 Total $70,075,758 11.08 $75,713,183 11.97 $145,788,941 23.06
Table VI-3 Total Costs
3% discount Sales
Sales Impacted
Fuel Costs / Veh
Fuel Costs (Total)
Install Costs / Veh
Install Costs Total
Total Cost / Veh Total Costs
(PC) 9,032,303 439,586 $4.70 $2,066,052 $30.00 $13,187,566 $34.70 $15,253,618 (LTV) 7,164,729 231,685 $5.30 $1,227,929 $30.00 $6,950,542 $35.30 $8,178,471 Total 16,197,032 671,270 $4.91 $3,293,981 $30.00 $20,138,107 $34.91 $23,432,088
7% discount Sales
Sales Impacted
Fuel Costs / Veh
Fuel Costs (Total)
Install Costs / Veh
Install Costs Total
Total Cost / Veh Total Costs
(PC) 9,032,303 439,586 $3.80 $1,670,425 $30.00 $13,187,566 $33.80 $14,857,991 (LTV) 7,164,729 231,685 $4.20 $973,076 $30.00 $6,950,542 $34.20 $7,923,618 Total 16,197,032 671,270 $3.94 $2,643,501 $30.00 $20,138,107 $33.94 $22,781,608

72
Table VI-4 Final Results
3% Discount
Net Impact / Veh NET IMPACT Net Costs /
ELS (in $M) (PC) $244.53 $107,493,974 0.79 (LTV) $203.24 $47,087,024 0.94 Total $230.28 $154,580,998 0.83
7% Discount
Net Impact / Veh NET IMPACT Net Costs /
ELS (in $M) (PC) $199.07 $87,508,062 0.92 (LTV) $153.22 $35,499,271 1.15 Total $183.25 $123,007,333 0.99
Comparison of costs and benefits expected due to this rule provides a cost of $0.79 million (M) to $0.99M per life saved across the 3 and 7 percent discount levels. This falls under NHTSA’s value of a statistical life (VSL) of $6.3M, and therefore this rulemaking is assumed to be cost beneficial. Since the lifetime benefits of MY2016 light vehicles is expected to be between $146M and $178M,the net impact of the rule is a positive one, even with the estimated $20M required to install speakers53 and $3M in lifetime fuel costs. Even if the costs associated with medium and heavy duty trucks and buses and motorcycle are considered in comparing the costs and benefits of this proposal, this rulemaking action is expected to be cost beneficial given the low cost per equivalent life saved and the low cost of complying with this proposal for these vehicles. Due to the delicate nature of predicting the adoption of new technologies across two or three decades, NHTSA will continue to investigate the sensitivity of AEO and CAFE predictions. A sensitivity analysis given current predictions has been prepared in this report in Table VI-7. However, we note that the cost-per equivalent life saved by this rule does not depend on the number of HVs and EVs on the road.
B. Other Vehicle Types The above discussion is entirely regarding Passenger Cars and Light Truck Vehicles. As discussed previously, a subset of low-speed vehicles (LSVs), Medium/Heavy Trucks, Buses, and Motorcycles also fall under this rulemaking. NHTSA has not encountered adequate data for investigating benefits from PSEA application to any of these classes. However, NHTSA estimates 2,500 LSVs will incur costs and benefits. In order to provide proper context for the cost/benefit analysis for LSVs, it is assumed that LSVs have the exact same injury rate and severity distribution as light vehicles. While there is no data to support such a claim, in the absence of data this assumption provides bounds on possible LSV benefits and costs. First, if LSVs provide the same benefits as light vehicles, their benefits will be equal to the ratio of LSV sales to light vehicles, multiplied by light vehicle sales. Thus, (2,500 / 671,270) = 0.37 percent is multiplied by light vehicle values to provide the corresponding LSV values. For 53 Based on the assumption in this analysis that manufacturers will install speakers to meet the proposal

73
example, 0.0037 * $178M = $0.7M is the expected monetized LSV benefits at the 3% discount rate.
Table VI-5 Costs and Scaled Benefits for LSVs, MY201654
Discount Rate
Sales Ratio
LSV to Light
Vehicle
Sales Scaled Costs
Scaled Injuries (undisc.)
Scaled ELS
Scaled Benefits
Scaled Benefits Minus Scaled Costs
3% 0.37% 2,500 $87,268 10.39 0.1049 $662,971 $575,703 7% 0.37% 2,500 $84,845 10.39 0.0859 $542,959 $458,114
We estimate there will be 7,294 pedestrian and pedalcyclist injuries over the lifetime of all MY 2016 medium and heavy trucks, buses, and motorcycles. There are an unknown additional number of pedestrian and pedalcyclist injuries that would be expected if an estimated 2 percent of these vehicles were hybrid or electric vehicles (8 percent of medium and heavy trucks, 8 percent of buses; and 0.4 percent in motorcycles).
C. Sensitivity Analysis In order to examine the influence assumptions and estimations hold over the final cost-benefit analysis, a sensitivity analysis is used. This process involves altering input values and interpreting and presenting the results. This is helpful not only because of the uncertainty inherent in estimations and predictions, but also it provides insight into values chosen to represent abstract concepts, such as the value of a statistical life (VSL).
Breakeven Point While we have considerable confidence behind the $30 estimation of cost for a speaker able to meet the proposed rule plus approximately $4 for fuels costs, the benefits calculated in this report are assumed to come from the odds ratio between the pedestrian crash rates of quiet vehicles and traditional ICE vehicles. It is assumed in the main portion of this analysis that the sound that can be made by a speaker system will reduce the crash rate of quiet vehicles to the crash rate of ICE vehicles. However, there may be unforeseen or undiscovered differences (not just the sound that a speaker can make) between these two sets of vehicles contributing to the difference in crash rate. In that case, a sound alert system may eliminate the discrepancy in sound alone, addressing only a portion of the difference between those vehicles and ICE vehicles, eventually resulting in only a portion of predicted benefits. Net costs were divided by total monetized benefits to find the “breakeven point” for the equation, in which the costs become likely to outweigh the benefits, assuming our VSL is $6.3 million. The table below provides the percentage of benefits that need to be achieved in order for the benefits of the rule to outweigh the costs, assuming our current cost estimate. Essentially Table VI-6 means 54 Scaled benefits and costs for low speed vehicles are estimated directly proportional to light vehicles based on sales. Scaled costs include both installation costs for the system and fuel costs.

74
that the alert sound that a speaker system can make needs to achieve 13 percent to 15 percent of the difference in crash rates between the two vehicle types to break even with the costs and that if the sound a speaker system can achieve 18 percent or more of the discrepancy between HEVs and ICEs, the proposal would be cost effective at both discount levels.
Table VI-6 Breakeven Point
3% discount level 7% discount level 13% 15%
To further clarify, it can be interpreted that when considering the set of all pertinent differences between quiet vehicles and ICEs, the “sound” factor has to represent 15 percent of the net influence of all factors. This is encouraging because we have looked for other factors (for example using the crash data and examining rural versus urban crash rates) and found no clear evidence that other factors are significantly influencing the results at this time.
Hybrid and Electric Sales Rates Due to the complicated nature of predicting hybrid, electric, fuel cell, and other gasoline-alternative vehicles, naturally different models for adoption over time carry different assumptions and conclusions. The primary source for sales estimations in this report is AEO 2011, with predictions out to 2035. A possible alternate source is NHTSA’s preliminary CAFE estimates for vehicle sales. While those estimates may not necessarily be those used in the final publication, there is value in examining their take on possible sales distributions in the future. While the following table has headings that correspond to years within their corresponding reference, it is perhaps more instructive to interpret each column as a given installation rate, and let the following values in that column represent the costs and benefits associated therewith. Table VI-7 shows the installation costs, the net costs (which include installation costs and fuel economy costs), net impacts (which are monetized injury benefits minus net costs) and breakeven points.

75
Table VI-7
Hybrid and Electric Sales Rate Sensitivity Analysis 2016
(CAFE**) 2016
(AEO 2011) 2020
(AEO 2011) 2025
(AEO 2011) 2030
(AEO 2011) Applicable Vehicles (percentage) 3% 4% 5% 6% 7% Benefits (Injuries, undiscounted)
2,057 2,791 3,395 4,143 4,747
Install Costs (in $M)
$14.6 $20.1 $24.5 $30.0 $34.5
Net Costs (in $M) [3% discount]
$17.0 $23.4 $28.4 $34.9 $40.2
Net Costs (in $M) [7% discount]
$16.5 $22.8 $27.7 $33.9 $39.1
Net Cost / ELS (in$M) [3% discount]
$0.8 $0.8 $0.8 $0.8 $0.8
Net Cost / ELS (in$M) [7% discount]
$1.0 $1.0 $1.0 $1.0 $1.0
Net Impact (in $M) [3% discount]
$114.2 $154.6 $188.1 $229.4 $262.7
Net Impact (in $M) [7% discount]
$91.4 $123.0 $149.8 $182.3 $208.4
Breakeven Effectiveness [3% discount]
13% 13% 13% 13% 13%
Breakeven Effectiveness [7% discount]
15% 16% 16% 16% 16%
* The operating fleet of all vehicles on the road is assumed to remain fairly constant, and thus annual sales are assumed to be constant over time. This is helpful in that it controls for the influence of economic recovery when comparing sales and injury counts between 2009 and 2030. Thus, the net cost per ELS remains constant, as does the breakeven point, while the installation rate increases. **Note that the 2016 CAFE estimate above uses preliminary results from a single scenario within an unpublished NHTSA analysis, and these values are not to be interpreted as the agency’s final statement on hybrid vehicle sales. For reasons explained earlier, the AEO2011 estimate was chosen for the main analysis, and these numbers are presented as context within a sensitivity analysis. As an increasing percentage of hybrid and electric vehicles comprise annual sales, the percentage of vehicles required to meet NHTSA’s proposal also increases. However, benefits are shown to increase in kind as every vehicle the countermeasure is equipped with sees a reduction in injury risk from how they would have performed in the absence of the rulemaking. The overall up-front cost to the public will be between $14.6M and $34.5M. In addition, over the lifetime of the vehicles, between about 2,000 and 5,000 injuries would be avoided. Finally, the benefits from injuries avoided and installation costs, when combined with lifetime fuel costs, provide a net impact between $91.4M and $262.7M in benefits across the 3 and 7 percent discount levels.

76
Value of a Statistical Life (VSL) To better understand the impact in choosing a value for a statistical life, a sensitivity analysis is helpful. A low and high range estimate of $3.7 and $8.9 million were substituted in place of $6.3 million as the value of a statistical life. In addition, adjusted relative cost numbers for injuries MAIS 1 to 5 were determined to remain consistent with the low and high values of a statistical life. A table with the pertinent information follows.
Table VI-8 Monetization of Injury Subtotals, with Comprehensive Relatives
for $3.7, $6.3, and $8.9 million per life saved $3.7M VSL $6.3M VSL $8.9M VSL Injury
Subtotal Comprehensive
Relatives Injury
Subtotal Comprehensive
Relatives Injury
Subtotal Comprehensive
Relatives MAIS0 $221 0.0001 $221 0.00003 $221 0.00002 MAIS1 $12,821 0.0034 $17,669 0.0028 $22,517 0.0025 MAIS2 $177,924 0.0478 $277,103 0.0438 $376,281 0.0422 MAIS3 $375,303 0.1008 $514,714 0.0814 $654,125 0.0733 MAIS4 $859,473 0.2309 $1,276,754 0.2019 $1,694,036 0.1899 MAIS5 $2,823,059 0.7583 $4,245,210 0.6714 $5,667,362 0.6352 Fatal $3,722,858 1.0000 $6,322,857 1.0000 $8,922,858 1.0000
The very same process used to generate Table VI-7 was applied using these new fatality and injury costs. The range of values for net impacts, which are net benefits (install costs minus total monetized benefits), are provided in the table below. The proposal is very cost beneficial over the range of values of a statistical life with a cost per equivalent life saved well below the value of a statistical life.
Table VI-9 Sensitivity Analysis Summary for Value of a Statistical Life
Cost / ELS and Net Benefits across 3% and 7% discount factors, (in $M)
$3.7M per life $6.3M per life $8.9M per life
Cost / ELS $0.7 to $0.9 $0.8 to $1 $0.9 to $1.1 Net Benefits $76 to $97 $123 to $155 $170 to $212

77
VII. Regulatory Flexibility Act and Unfunded Mandates Reform Act Analysis
A. Regulatory Flexibility Act The Regulatory Flexibility Act of 1980 (5 U.S.C §601 et seq.) requires agencies to evaluate the potential effects of their proposed and final rules on small business, small organizations and small Government jurisdictions. 5 U.S.C §603 requires agencies to prepare and make available for public comments initial and final regulatory flexibility analysis (RFA) describing the impact of proposed and final rules on small entities. Section 603(b) of the Act specifies the content of a RFA. Each RFA must contain:
1. A description of the reasons why action by the agency is being considered; 2. A succinct statement of the objectives of, and legal basis for a final rule; 3. A description of and, where feasible, an estimate of the number of small entities to which
the final rule will apply; 4. A description of the projected reporting, recording keeping and other compliance
requirements of a final rule including an estimate of the classes of small entities which will be subject to the requirement and the type of professional skills necessary for preparation of the report or record;
5. An identification, to the extent practicable, of all relevant Federal rules which may duplicate, overlap or conflict with the final rule;
6. Each regulatory flexibility analysis shall also contain a description of any significant alternatives which accomplish the stated objectives of applicable statutes and which minimize any significant economic impact on small entities.
1. Description of the reason why action by the agency is being considered The Pedestrian Safety Enhancement Act requires NHTSA to conduct a rulemaking to require an alert sound for pedestrians to be emitted by all types of motor vehicles that are electric vehicles or hybrid vehicles. NHTSA has found that hybrid vehicles at low speed have higher pedestrian crash rates than similar internal combustion engines. 2. Objectives of, and legal basis for, the proposal NHTSA seeks to prevent pedestrian crashes by requiring hybrid and electric vehicles to emit a sound that would warn pedestrians that there is a vehicle operating in the area. 3. Description and estimate of the number of small entities to which the final rule will apply The proposal will affect motor vehicle manufacturers of hybrid and electric vehicles. There are several domestically owned light vehicle manufacturers that produce electric or hybrid vehicles in the categories of low-speed vehicles or light vehicles in 201155. In the low-speed vehicle group there are Columbia ParCar Corp., Club Car, LLC, Miles Electric Vehicles LLC, STAR Electric
55 There are also several (perhaps 10) foreign companies that make low-speed vehicles that are not considered in this regulatory flexibility section.

78
Car Sales, Tomberlin, Wheego Electric Cars, Inc., WILDFIRE, and many others. Some of these manufacturers also make light vehicles. Others that make exclusively light vehicles are CODA, Fisker Automotive Inc., GGT Electric, Phoenix, and Tesla. However, these manufacturers will face little or no additional costs due to the rule because we assume that they would have installed an alert sound in their cars even without the PSEA and this rule. All are small manufacturers, having much less than 1,000 employees. NHTSA believes there are more than an estimated 200 motorcycle manufacturers, including custom and factory bike builders, in the United States which can be classified as small businesses. Motorcycle manufacturers and builders include manufacturers of cruisers and touring motorcycles, sport bikes, dual purpose motorcycles, electric motorcycles, unique bikes, and builders of custom bikes and choppers. However, NHTSA does not know how many of these 200 small business motorcycle manufacturers produce electric motorcycles. A short search of the web found three companies - Brammo, Zero, and Electric Motorsport that make an electric motorcycle. Most of the electric scooters are made outside the United States. With only about 1,500 sales of electric motorcycles and electric motor-driven cycles, we suspect that the number of U.S. manufacturers of electric motorcycles is limited to 5 or less. There are very few manufacturers of heavy trucks in the United States which can be considered small businesses. The heavy truck industry is highly concentrated with large manufacturers, including Daimler Trucks North America (Freightliner, Western Star), Navistar International, Mack Trucks Inc., PACCAR (Peterbilt and Kenworth) and Volvo Trucks North America, accounting for more than 99% of the annual production. We believe that the remaining trucks (less than 1 percent) were finished by final stage manufacturers. With production volume of less than 1 percent annually, these remaining heavy truck manufacturers are most likely small businesses and probably would not get involved in electric or hybrid engine vehicles. Thus, we don’t believe there are any heavy truck manufacturers that are domestic small businesses involve in electric or hybrid heavy trucks. There are many more manufacturers of medium trucks that take the basic engine and chassis from a large manufacturer and add different bodies (dump truck, garbage truck, tow truck, fire truck, etc.). The National Truck Equipment Association shows 517 members that are manufacturers, most of which are finishers of medium trucks and most of which are small businesses. The agency does not know how many of these manufacturers also make electric vehicles. Smith showed their electric trucks at the DOT headquarters in the summer of 2011, and with a volume of 2,000 sales in 2010, we are certain that there are others in production now and there will be many more in the upcoming years. NHTSA believes there are approximately 37 bus manufacturers in the United States. Of these, 27 bus manufacturers are large business and 10 are small businesses (see Table VII-1). These 10 small volume bus manufacturers are listed in Table VII-1, below. Three of these manufacturers produce electric buses – E-bus Inc., Enova Systems, and Gillig Corporation.
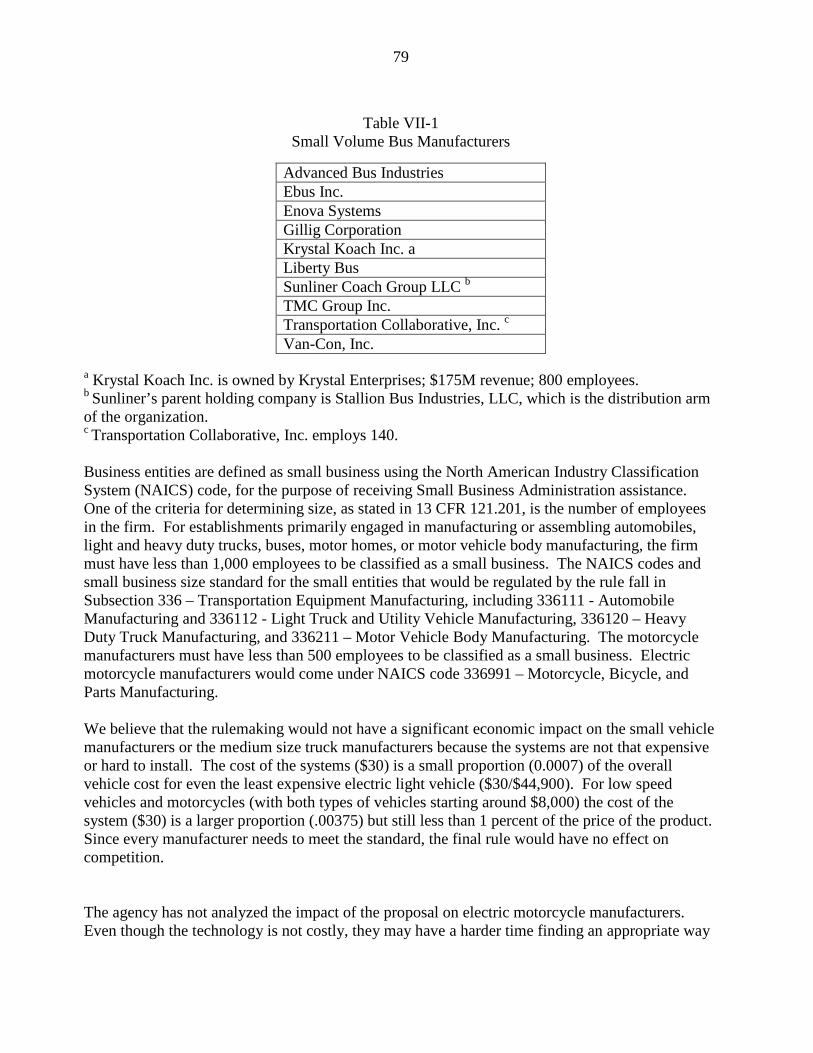
79
Table VII-1
Small Volume Bus Manufacturers
a Krystal Koach Inc. is owned by Krystal Enterprises; $175M revenue; 800 employees. b Sunliner’s parent holding company is Stallion Bus Industries, LLC, which is the distribution arm of the organization. c Transportation Collaborative, Inc. employs 140. Business entities are defined as small business using the North American Industry Classification System (NAICS) code, for the purpose of receiving Small Business Administration assistance. One of the criteria for determining size, as stated in 13 CFR 121.201, is the number of employees in the firm. For establishments primarily engaged in manufacturing or assembling automobiles, light and heavy duty trucks, buses, motor homes, or motor vehicle body manufacturing, the firm must have less than 1,000 employees to be classified as a small business. The NAICS codes and small business size standard for the small entities that would be regulated by the rule fall in Subsection 336 – Transportation Equipment Manufacturing, including 336111 - Automobile Manufacturing and 336112 - Light Truck and Utility Vehicle Manufacturing, 336120 – Heavy Duty Truck Manufacturing, and 336211 – Motor Vehicle Body Manufacturing. The motorcycle manufacturers must have less than 500 employees to be classified as a small business. Electric motorcycle manufacturers would come under NAICS code 336991 – Motorcycle, Bicycle, and Parts Manufacturing. We believe that the rulemaking would not have a significant economic impact on the small vehicle manufacturers or the medium size truck manufacturers because the systems are not that expensive or hard to install. The cost of the systems ($30) is a small proportion (0.0007) of the overall vehicle cost for even the least expensive electric light vehicle ($30/$44,900). For low speed vehicles and motorcycles (with both types of vehicles starting around $8,000) the cost of the system ($30) is a larger proportion (.00375) but still less than 1 percent of the price of the product. Since every manufacturer needs to meet the standard, the final rule would have no effect on competition.
The agency has not analyzed the impact of the proposal on electric motorcycle manufacturers. Even though the technology is not costly, they may have a harder time finding an appropriate way
Advanced Bus Industries Ebus Inc. Enova Systems Gillig Corporation Krystal Koach Inc. a Liberty Bus Sunliner Coach Group LLC b TMC Group Inc. Transportation Collaborative, Inc. c
Van-Con, Inc.

80
to connect a speaker and small computer to the electric motorcycle. And this could affect one of their selling points of being virtually quiet. Their fleet market is mainly police departments that like the quiet vehicles. While an alert sound may make more noise, it is still relatively quiet to a gasoline motorcycle. Thus, the impact on the sales of electric motorcycles is unknown.. At this point in time (2011), the agency does not believe that there are a substantial number of small business that make electric or hybrid vehicles that would be economically significantly affected by this proposal. Internet searches have found a fair number of low-speed vehicle manufacturers that will have a small economic impact ($30 per vehicle). There are just a few manufacturers that make electric or hybrid vehicles in each of the other vehicle categories (light vehicles, medium trucks, buses, motorcycles). It would appear that the most significant economic impact could occur for motorcycle manufacturers. The agency requests comments on these findings. 4. A description of the projected reporting, record keeping and other compliance requirements of a final rule including an estimate of the classes of small entities which will be subject to the requirement and the type of professional skills necessary for preparation of the report or record. This final rule includes reporting requirements for purposes of ensuring requirements with the phase-in schedule. Manufacturers defined as small businesses and those manufacturers with only one make model can meet the phase-in requirements with 100 percent of their product in year two of the phase-in and then would have no new requirements in regards to reporting or record keeping. Large manufacturers with more than one make/model that choose to phase-in the requirements would be required to report their phase-in compliance to the agency. 5. An identification, to the extent practicable, of all relevant Federal rules which may duplicate, overlap, or conflict with the final rule We know of no Federal rules which duplicate, overlap, or conflict with the final rule.
6. A description of any significant alternatives to the final rule which accomplish the stated objectives of applicable statutes and which minimize any significant economic impact of the proposal on small entities.
The agency knows of no other alternatives that can achieve the stated objectives and minimize the impacts on small entities. The Pedestrian Safety Enhancement Act requires NHTSA to conduct a rulemaking to require an alert sound for pedestrians to be emitted by all types of motor vehicles that are electric vehicles or hybrid vehicles.
B. Unfunded Mandates Reform Act The Unfunded Mandates Reform Act of 1995 (Public Law 104-4) requires agencies to prepare a written assessment of the costs, benefits, and other effects of proposed or final rules that include a Federal mandate likely to result in the expenditures by States, local or tribal governments, in the aggregate, or by the private sector, of more than $100 million annually (adjusted annually for inflation with base year of 1995). Adjusting this amount by the implicit gross domestic product price deflator for 2010 results in $136 million (110.659/81.536 = 1.36). The assessment may be included in conjunction with other assessments, as it is here.

81
82
Appendix A Calculations Related to Fuel Costs for Light Vehicles - MY 2016 vehicles Assuming 1.5 lbs. added weight per vehicle These estimates are based on the lifetime vehicle miles traveled and survivability by age of the vehicle and are calculated separately for passenger cars and light trucks. Using the passenger cars as an example, they start with projected average passenger car mpg for MY 2016 from the CAFE final of 37.8 mpg with an average weight of 3,500 lbs. An on-road factor of 20% means that the EPA test times 0.8 would equal average on the road fuel economy (.8*37.8 = 30.24 mpg). The equation for determining the new fuel economy level with added weight is (base weight/(base weight+added weight))^0.8)*baseline fuel economy = 30.231 mpg. Then you divide the actual vehicle miles traveled each year by the two different mpg levels to determine the fuel used per year, multiply by the price of gasoline, multiply by the discount factor appropriate for that year, and sum over the 26 years for passenger cars and determine the present value of the fuel cost difference between the two different mpg levels over the lifetime of the vehicle.
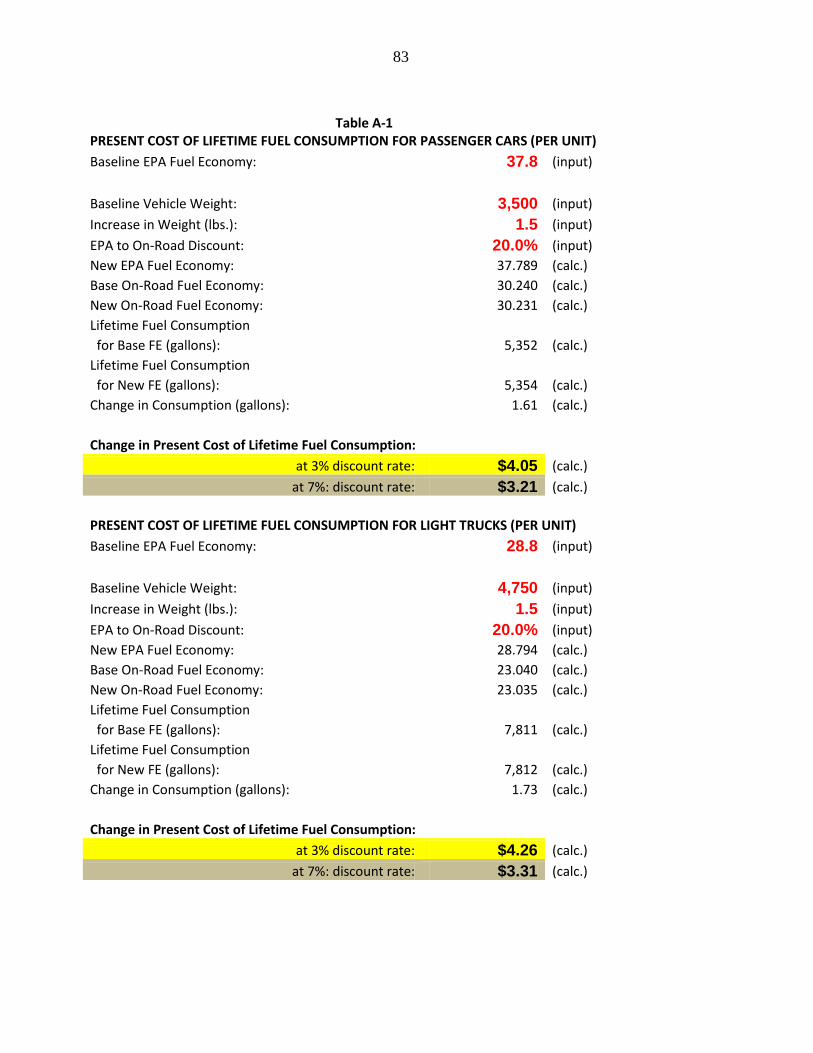
83
Table A-1
PRESENT COST OF LIFETIME FUEL CONSUMPTION FOR PASSENGER CARS (PER UNIT) Baseline EPA Fuel Economy: 37.8 (input)
Baseline Vehicle Weight: 3,500 (input)
Increase in Weight (lbs.): 1.5 (input) EPA to On-Road Discount: 20.0% (input) New EPA Fuel Economy: 37.789 (calc.) Base On-Road Fuel Economy: 30.240 (calc.) New On-Road Fuel Economy: 30.231 (calc.) Lifetime Fuel Consumption
for Base FE (gallons): 5,352 (calc.) Lifetime Fuel Consumption
for New FE (gallons): 5,354 (calc.) Change in Consumption (gallons): 1.61 (calc.)
Change in Present Cost of Lifetime Fuel Consumption: at 3% discount rate: $4.05 (calc.) at 7%: discount rate: $3.21 (calc.)
PRESENT COST OF LIFETIME FUEL CONSUMPTION FOR LIGHT TRUCKS (PER UNIT) Baseline EPA Fuel Economy: 28.8 (input)
Baseline Vehicle Weight: 4,750 (input)
Increase in Weight (lbs.): 1.5 (input) EPA to On-Road Discount: 20.0% (input) New EPA Fuel Economy: 28.794 (calc.) Base On-Road Fuel Economy: 23.040 (calc.) New On-Road Fuel Economy: 23.035 (calc.) Lifetime Fuel Consumption
for Base FE (gallons): 7,811 (calc.) Lifetime Fuel Consumption
for New FE (gallons): 7,812 (calc.) Change in Consumption (gallons): 1.73 (calc.)
Change in Present Cost of Lifetime Fuel Consumption: at 3% discount rate: $4.26 (calc.) at 7%: discount rate: $3.31 (calc.)

84
Table A-2
Present Discounted Value @ 3% of Lifetime Fuel Economy Impact
Per Passenger Car (2010$)
Vehicle
Age Vehicle Miles
Traveled
Survival Probability
Actual Vehicle Miles
Traveled
Fuel Price**
Fuel Consumption (gallons)
Present Value Cost of Fuel Consumption ($)
Base New Base New
1 14,231 0.995 14,160 $2.81 468.2 468.4 $1,295.50 $1,295.89 2 13,961 0.990 13,821 $2.88 457.0 457.2 $1,261.32 $1,261.70 3 13,669 0.983 13,438 $2.94 444.4 444.5 $1,214.83 $1,215.19 4 13,357 0.973 12,998 $2.98 429.8 429.9 $1,156.50 $1,156.85 5 13,028 0.959 12,497 $3.02 413.3 413.4 $1,093.50 $1,093.83 6 12,683 0.941 11,938 $3.04 394.8 394.9 $1,020.94 $1,021.25 7 12,325 0.919 11,324 $3.11 374.5 374.6 $960.51 $960.80 8 11,956 0.892 10,662 $3.12 352.6 352.7 $882.03 $882.29 9 11,578 0.860 9,961 $3.18 329.4 329.5 $813.81 $814.05
10 11,193 0.825 9,237 $3.21 305.4 305.5 $739.38 $739.60 11 10,804 0.787 8,499 $3.23 281.0 281.1 $665.70 $665.90 12 10,413 0.717 7,466 $3.28 246.9 247.0 $576.87 $577.04 13 10,022 0.613 6,138 $3.30 203.0 203.1 $462.60 $462.73 14 9,633 0.509 4,907 $3.35 162.3 162.3 $364.20 $364.31 15 9,249 0.414 3,831 $3.32 126.7 126.7 $273.78 $273.87 16 8,871 0.331 2,934 $3.32 97.0 97.1 $203.80 $203.86 17 8,502 0.260 2,214 $3.33 73.2 73.2 $149.73 $149.77 18 8,144 0.203 1,652 $3.34 54.6 54.6 $108.74 $108.77 19 7,799 0.157 1,220 $3.38 40.4 40.4 $78.90 $78.92 20 7,469 0.120 896 $3.40 29.6 29.6 $56.56 $56.57 21 7,157 0.092 656 $3.41 21.7 21.7 $40.39 $40.40 22 6,866 0.070 478 $3.43 15.8 15.8 $28.74 $28.75 23 6,596 0.053 348 $3.45 11.5 11.5 $20.41 $20.42 24 6,350 0.040 253 $3.47 8.4 8.4 $14.53 $14.53 25 6,131 0.030 185 $3.49 6.1 6.1 $10.33 $10.33 26 5,940 0.023 135 $3.51 4.5 4.5 $7.37 $7.37
Total: 161,847 5,352 5,354 $13,500.97 $13,505.02 Difference Between New and Base: 1.61 $4.05
**Excludes fuel taxes

85
Table A-3
Present Discounted Value @ 3% of Lifetime Fuel Economy Impact
Per Light Truck (2010$)
Vehicle Age
Vehicle Miles
Traveled
Survival Probability
Actual Vehicle Miles
Traveled
Fuel Price**
Fuel Consumption (gallons)
Present Value Cost of Fuel Consumption ($)
Base New Base New
1 16,085 0.974 15,668 $2.81 680.0 680.2 $1,881.49 $1,881.91 2 15,782 0.960 15,156 $2.88 657.8 657.9 $1,815.34 $1,815.74 3 15,442 0.942 14,547 $2.94 631.4 631.5 $1,726.05 $1,726.44 4 15,069 0.919 13,849 $2.98 601.1 601.2 $1,617.28 $1,617.63 5 14,667 0.891 13,072 $3.02 567.4 567.5 $1,501.25 $1,501.58 6 14,239 0.859 12,231 $3.04 530.9 531.0 $1,372.85 $1,373.15 7 13,790 0.823 11,343 $3.11 492.3 492.4 $1,262.83 $1,263.11 8 13,323 0.783 10,428 $3.12 452.6 452.7 $1,132.28 $1,132.53 9 12,844 0.740 9,506 $3.18 412.6 412.7 $1,019.28 $1,019.51
10 12,356 0.696 8,595 $3.21 373.0 373.1 $903.01 $903.21 11 11,863 0.650 7,712 $3.23 334.7 334.8 $792.88 $793.05 12 11,369 0.604 6,869 $3.28 298.1 298.2 $696.60 $696.76 13 10,879 0.552 6,002 $3.30 260.5 260.6 $593.64 $593.77 14 10,396 0.501 5,207 $3.35 226.0 226.1 $507.25 $507.36 15 9,924 0.452 4,488 $3.32 194.8 194.8 $420.96 $421.06 16 9,468 0.406 3,846 $3.32 166.9 167.0 $350.58 $350.66 17 9,032 0.363 3,281 $3.33 142.4 142.4 $291.28 $291.34 18 8,619 0.324 2,789 $3.34 121.1 121.1 $241.04 $241.09 19 8,234 0.287 2,366 $3.38 102.7 102.7 $200.72 $200.76 20 7,881 0.254 2,003 $3.40 87.0 87.0 $165.92 $165.96 21 7,565 0.224 1,697 $3.41 73.7 73.7 $137.26 $137.29 22 7,288 0.198 1,439 $3.43 62.5 62.5 $113.63 $113.66 23 7,055 0.174 1,224 $3.45 53.1 53.1 $94.35 $94.37 24 6,871 0.152 1,046 $3.47 45.4 45.4 $78.70 $78.72 25 6,739 0.133 898 $3.49 39.0 39.0 $65.95 $65.96 26 6,663 0.117 776 $3.51 33.7 33.7 $55.68 $55.69 27 6,648 0.102 676 $3.53 29.3 29.3 $47.35 $47.36 28 6,648 0.089 590 $3.55 25.6 25.6 $40.32 $40.32 29 6,648 0.077 514 $3.57 22.3 22.3 $34.30 $34.31 30 6,648 0.067 447 $3.59 19.4 19.4 $29.15 $29.16

86
31 6,648 0.059 390 $3.61 16.9 16.9 $24.78 $24.79 32 6,648 0.051 338 $3.63 14.7 14.7 $21.01 $21.02 33 6,648 0.044 294 $3.65 12.8 12.8 $17.85 $17.86 34 6,648 0.039 256 $3.67 11.1 11.1 $15.15 $15.15 35 6,648 0.033 222 $3.69 9.6 9.6 $12.83 $12.83 36 6,648 0.029 193 $3.71 8.4 8.4 $10.87 $10.87
Total: 179,959 7,811 7,812 $19,291.71 $19,295.97 Difference Between New and Base: 1.73 $4.26
**Excludes fuel taxes

87
Table A-4
Present Discounted Value @ 7% of Lifetime Fuel Economy Impact
Per Passenger Car (2010$)
Vehicle Age
Vehicle Miles
Traveled
Survival Probability
Actual Vehicle Miles
Traveled
Fuel Price**
Fuel Consumption (gallons)
Present Value Cost of Fuel Consumption ($)
Base New Base New
1 14,231 0.995 14,160 $2.81 468.2 468.4 $1,271.05 $1,271.44 2 13,961 0.990 13,821 $2.88 457.0 457.2 $1,191.26 $1,191.61 3 13,669 0.983 13,438 $2.94 444.4 444.5 $1,104.46 $1,104.79 4 13,357 0.973 12,998 $2.98 429.8 429.9 $1,012.12 $1,012.42 5 13,028 0.959 12,497 $3.02 413.3 413.4 $921.21 $921.49 6 12,683 0.941 11,938 $3.04 394.8 394.9 $827.93 $828.18 7 12,325 0.919 11,324 $3.11 374.5 374.6 $749.81 $750.03 8 11,956 0.892 10,662 $3.12 352.6 352.7 $662.80 $663.00 9 11,578 0.860 9,961 $3.18 329.4 329.5 $588.68 $588.85
10 11,193 0.825 9,237 $3.21 305.4 305.5 $514.84 $515.00 11 10,804 0.787 8,499 $3.23 281.0 281.1 $446.21 $446.35 12 10,413 0.717 7,466 $3.28 246.9 247.0 $372.21 $372.32 13 10,022 0.613 6,138 $3.30 203.0 203.1 $287.32 $287.41 14 9,633 0.509 4,907 $3.35 162.3 162.3 $217.75 $217.82 15 9,249 0.414 3,831 $3.32 126.7 126.7 $157.57 $157.62 16 8,871 0.331 2,934 $3.32 97.0 97.1 $112.91 $112.94 17 8,502 0.260 2,214 $3.33 73.2 73.2 $79.85 $79.88 18 8,144 0.203 1,652 $3.34 54.6 54.6 $55.83 $55.84 19 7,799 0.157 1,220 $3.38 40.4 40.4 $38.99 $39.00 20 7,469 0.120 896 $3.40 29.6 29.6 $26.90 $26.91 21 7,157 0.092 656 $3.41 21.7 21.7 $18.50 $18.50 22 6,866 0.070 478 $3.43 15.8 15.8 $12.67 $12.67 23 6,596 0.053 348 $3.45 11.5 11.5 $8.66 $8.66 24 6,350 0.040 253 $3.47 8.4 8.4 $5.93 $5.94 25 6,131 0.030 185 $3.49 6.1 6.1 $4.06 $4.06 26 5,940 0.023 135 $3.51 4.5 4.5 $2.79 $2.79
Total: 161,847 5,352 5,354 $10,692.33 $10,695.54 Difference Between New and Base: 1.61 $3.21
**Excludes fuel taxes

88
Table A-5
Present Discounted Value @ 7% of Lifetime Fuel Economy Impact
Per Light Truck (2010$)
Vehicle Age
Vehicle Miles
Traveled
Survival Probability
Actual Vehicle Miles
Traveled
Fuel Price**
Fuel Consumption (gallons)
Present Value Cost of Fuel Consumption ($)
Base New Base New
1 16,085 0.974 15,668 $2.81 680.0 680.2 $1,845.99 $1,846.40 2 15,782 0.960 15,156 $2.88 657.8 657.9 $1,714.50 $1,714.88 3 15,442 0.942 14,547 $2.94 631.4 631.5 $1,569.24 $1,569.58 4 15,069 0.919 13,849 $2.98 601.1 601.2 $1,415.37 $1,415.69 5 14,667 0.891 13,072 $3.02 567.4 567.5 $1,264.71 $1,264.99 6 14,239 0.859 12,231 $3.04 530.9 531.0 $1,113.31 $1,113.56 7 13,790 0.823 11,343 $3.11 492.3 492.4 $985.81 $986.03 8 13,323 0.783 10,428 $3.12 452.6 452.7 $850.85 $851.04 9 12,844 0.740 9,506 $3.18 412.6 412.7 $737.31 $737.47
10 12,356 0.696 8,595 $3.21 373.0 373.1 $628.78 $628.92 11 11,863 0.650 7,712 $3.23 334.7 334.8 $531.45 $531.57 12 11,369 0.604 6,869 $3.28 298.1 298.2 $449.47 $449.57 13 10,879 0.552 6,002 $3.30 260.5 260.6 $368.71 $368.80 14 10,396 0.501 5,207 $3.35 226.0 226.1 $303.28 $303.35 15 9,924 0.452 4,488 $3.32 194.8 194.8 $242.28 $242.33 16 9,468 0.406 3,846 $3.32 166.9 167.0 $194.23 $194.27 17 9,032 0.363 3,281 $3.33 142.4 142.4 $155.34 $155.38 18 8,619 0.324 2,789 $3.34 121.1 121.1 $123.74 $123.77 19 8,234 0.287 2,366 $3.38 102.7 102.7 $99.19 $99.21 20 7,881 0.254 2,003 $3.40 87.0 87.0 $78.93 $78.95 21 7,565 0.224 1,697 $3.41 73.7 73.7 $62.85 $62.87 22 7,288 0.198 1,439 $3.43 62.5 62.5 $50.09 $50.10 23 7,055 0.174 1,224 $3.45 53.1 53.1 $40.04 $40.05 24 6,871 0.152 1,046 $3.47 45.4 45.4 $32.15 $32.15 25 6,739 0.133 898 $3.49 39.0 39.0 $25.93 $25.94 26 6,663 0.117 776 $3.51 33.7 33.7 $21.08 $21.08 27 6,648 0.102 676 $3.53 29.3 29.3 $17.25 $17.25 28 6,648 0.089 590 $3.55 25.6 25.6 $14.14 $14.14 29 6,648 0.077 514 $3.57 22.3 22.3 $11.58 $11.58 30 6,648 0.067 447 $3.59 19.4 19.4 $9.47 $9.48

89
31 6,648 0.059 390 $3.61 16.9 16.9 $7.75 $7.75 32 6,648 0.051 338 $3.63 14.7 14.7 $6.33 $6.33 33 6,648 0.044 294 $3.65 12.8 12.8 $5.18 $5.18 34 6,648 0.039 256 $3.67 11.1 11.1 $4.23 $4.23 35 6,648 0.033 222 $3.69 9.6 9.6 $3.45 $3.45 36 6,648 0.029 193 $3.71 8.4 8.4 $2.81 $2.81
Total: 179,959 7,811 7,812 $14,986.83 $14,990.14 Difference Between New and Base: 1.73 $3.31
**Excludes fuel taxes