
Plug-In Hybrid Electric Vehicle Value Proposition … Hybrid Electric Vehicle Value Proposition...
218
Transcript of Plug-In Hybrid Electric Vehicle Value Proposition … Hybrid Electric Vehicle Value Proposition...

DOCUMENT AVAILABILITY
Reports produced after January 1, 1996, are generally available free via the U.S. Department of Energy (DOE) Information Bridge:
Web site: http://www.osti.gov/bridge Reports produced before January 1, 1996, may be purchased by members of the public from the following source:
National Technical Information Service 5285 Port Royal Road Springfield, VA 22161 Telephone: 703-605-6000 (1-800-553-6847) TDD: 703-487-4639 Fax: 703-605-6900 E-mail: [email protected] Web site: http://www.ntis.gov/support/ordernowabout.htm
Reports are available to DOE employees, DOE contractors, Energy Technology Data Exchange (ETDE) representatives, and International Nuclear Information System (INIS) representatives from the following source:
Office of Scientific and Technical Information P.O. Box 62 Oak Ridge, TN 37831 Telephone: 865-576-8401 Fax: 865-576-5728 E-mail: [email protected] Web site: http://www.osti.gov/contact.html
This report was prepared as an account of work sponsored by an agency of the United States Government. Neither the United States government nor any agency thereof, nor any of their employees, makes any warranty, express or implied, or assumes any legal liability or responsibility for the accuracy, completeness, or usefulness of any information, apparatus, product, or process disclosed, or represents that its use would not infringe privately owned rights. Reference herein to any specific commercial product, process, or service by trade name, trademark, manufacturer, or otherwise, does not necessarily constitute or imply its endorsement, recommendation, or favoring by the United States Government or any agency thereof. The views and opinions of authors expressed herein do not necessarily state or reflect those of the United States Government or any agency thereof.
ORNL/TM-2010/46
Plug-in Hybrid Electric Vehicle Value Proposition Study
Final Report
July 2010
OAK RIDGE NATIONAL LABORATORY Oak Ridge, Tennessee 37831
managed by UT-BATTELLE, LLC
for the U.S. DEPARTMENT OF ENERGY
under contract No. DE-AC05-00OR22725

This page intentionally left blank.

PHEV Value Proposition Study – Final Report Draft / July 2010 i
ACKNOWLEDGEMENTS
The Plug-In Hybrid Electric Vehicle (PHEV) Value Proposition Study is a collaborative effort between Sentech, Inc., Oak Ridge National Laboratory (ORNL), General Electric (GE) Global Research, Ohio State University Center for Automotive Research (OSU CAR), and Taratec Corporation. The following individuals from these organizations are among those who contributed throughout the duration of this study:
Sentech, Inc. Tim P. Cleary* Shaun C. Hinds Lawrence C. Markel Dr. Ralph McGill* Perry Jones Karen G. Sikes* Richard E. Ziegler
ORNL Robert C. DeVault Dr. David L. Greene Stanton W. Hadley* Mitchell Olszewski David E. Smith Richard L. Smith
OSU CAR Dr. Vincenzo Marano*
Taratec Corporation Chuck Meadow Howard Mueller Ed Ungar*
GE Global Research
Herman Wiegman
Consultant Thomas Gross*
EPRI
Daniel Brooks Argonne National Laboratory
Andrew Burnham
*Co-authors
Members of the PHEV Value Proposition Study’s Guidance & Evaluation Committee also provided valuable insights and feedback throughout the study. A listing of the committee’s members can be found at http://www.sentech.org/phev/pdfs/Guidance_Committee.pdf.

ii PHEV Value Proposition Study – Final Report Draft / July 2010
This page intentionally left blank.
PHEV Value Proposition Study – Final Report Draft / July 2010 iii
TABLE OF CONTENTS
ACRONYMS AND ABBREVIATIONS .............................................................................................................. X
FACT SHEET ................................................................................................................................................... XIII
EXECUTIVE SUMMARY. ............................................................................................................................. XXIV
FREQUENTLY ASKED QUESTIONS .......................................................................................................... XXIX
1. INTRODUCTION ........................................................................................................................................ 1
1.1. BACKGROUND ................................................................................................................................................ 1 1.2. OBJECTIVES ................................................................................................................................................... 1 1.3. PROJECT OVERVIEW ........................................................................................................................................ 1
1.3.1. Value Proposition Study – Phase 1 .......................................................................................................... 2 1.3.2. Market Introduction Study ....................................................................................................................... 2 1.3.3. Value Proposition Study – Phase 2 .......................................................................................................... 3
2. INDUSTRY SNAPSHOT ............................................................................................................................ 4
2.1. SUPPORTIVE POLICIES – EXISTING AND POTENTIAL ............................................................................................... 4 2.2. PHEV DEVELOPMENT AND PRODUCTION PLANS ................................................................................................... 4 2.3. PLANNING FOR PHEVS BY ELECTRIC UTILITIES .................................................................................................... 7
3. APPROACH ............................................................................................................................................... 8
3.1. PHEV VALUE PROPOSITION WORKSHOP ............................................................................................................. 8 3.2. GENERAL ASSUMPTIONS ................................................................................................................................ 10
3.2.1. Market and Regulatory .......................................................................................................................... 10 3.2.2. Vehicle .................................................................................................................................................. 11 3.2.3. Charging Behavior / Infrastructure Capabilities ..................................................................................... 11
3.3. MODELING REQUIREMENTS ............................................................................................................................. 12 3.3.1. Vehicle Operation ................................................................................................................................. 12 3.3.2. Battery Sizing ....................................................................................................................................... 13 3.3.3. Battery End-of-Life Value ...................................................................................................................... 14 3.3.4. Grid Impact ........................................................................................................................................... 14 3.3.5. Environmental Impact ........................................................................................................................... 14
3.4. DATA COLLECTION ........................................................................................................................................ 17 3.5. SELECTION OF CASE STUDIES ......................................................................................................................... 20
3.5.1. Southern California ............................................................................................................................... 20 3.5.2. ECAR / Cleveland, Ohio ......................................................................................................................... 21
3.6. SENSITIVITY ANALYSIS ................................................................................................................................... 22
4. CASE STUDY RESULTS ........................................................................................................................ 23
4.1. VEHICLE OWNERSHIP COSTS AND BENEFITS ...................................................................................................... 23 4.1.1. Vehicle Purchase Costs ........................................................................................................................ 23 4.1.2. Vehicle Operating Costs........................................................................................................................ 28 4.1.3. Vehicle End-of-Life Value ...................................................................................................................... 35 4.1.4. “Convenience” Benefits ........................................................................................................................ 35
4.2. BENEFITS TO COMMERCIAL BUILDING OWNERS WITH V2B .................................................................................... 37 4.3. IMPACTS OF PHEVS ON ELECTRIC UTILITIES ...................................................................................................... 40
4.3.1. Southern California ............................................................................................................................... 40 4.3.2. ECAR / Cleveland, Ohio ......................................................................................................................... 44
4.4. SOCIETAL BENEFITS ...................................................................................................................................... 47 4.4.1. Reduced Petroleum Imports .................................................................................................................. 47
iv PHEV Value Proposition Study – Final Report Draft / July 2010
4.4.2. Environmental Impacts ......................................................................................................................... 48 4.4.3. Increased Renewable Generation .......................................................................................................... 51
4.5. ALTERNATIVE BATTERY DESIGN AND OWNERSHIP OPTIONS .................................................................................. 52 4.5.1. Design of Base Battery.......................................................................................................................... 52 4.5.2. Alternative Battery Designs for Consideration ....................................................................................... 53 4.5.3. Third Party Ownership .......................................................................................................................... 55
5. SENSITIVITY ANALYSIS RESULTS ..................................................................................................... 57
5.1. AER ........................................................................................................................................................... 58 5.2. VEHICLE WEIGHT .......................................................................................................................................... 62 5.3. DRIVE CYCLE PATTERNS ................................................................................................................................ 65 5.4. FUEL TYPE ................................................................................................................................................... 67 5.5. CARBON TAX ................................................................................................................................................ 70 5.6. ALTERNATIVE GENERATION MIXES ................................................................................................................... 73 5.7. MARKET PENETRATION .................................................................................................................................. 74 5.8. COST OF LIQUID FUEL .................................................................................................................................... 76 5.9. COST OF ELECTRICITY .................................................................................................................................... 77 5.10. COST OF BATTERIES ...................................................................................................................................... 78
6. RESULTS OF PHEV RISK/BENEFIT ASSESSMENT ......................................................................... 79
7. CONCLUSIONS ....................................................................................................................................... 82
7.1. WILL PHEVS BE COST-COMPETITIVE BY 2030? ................................................................................................. 82 7.2. OTHER OPPORTUNITIES FOR PHEV FLEETS ....................................................................................................... 84
8. RECOMMENDATIONS ............................................................................................................................ 86
8.1. TECHNOLOGY ADVANCEMENT .......................................................................................................................... 86 8.2. GOVERNMENT INCENTIVE POLICIES ................................................................................................................... 87
8.2.1. Incentives for Vehicle Manufacturers .................................................................................................... 88 8.2.2. Incentives for Electric Utilities ............................................................................................................... 88 8.2.3. Incentives for PHEV Consumers ........................................................................................................... 89
8.3. EDUCATION AND TRAINING .............................................................................................................................. 89 8.3.1. Consumer Education ............................................................................................................................ 90 8.3.2. Workforce Training ............................................................................................................................... 90
8.4. CODES AND STANDARDS ................................................................................................................................ 90
APPENDICES
APPENDIX A. PHEV INDUSTRY STATUS AND NEAR-TERM PLANS ................................................................ A-1 APPENDIX B. VEHICLE ASSUMPTIONS ............................................................................................................ B-1 APPENDIX C. CASE STUDY SELECTION PROCESS ......................................................................................... C-1 APPENDIX D. VEHICLE COST ASSUMPTIONS .................................................................................................. D-1 APPENDIX E. FUEL CONSUMPTION CALCULATIONS ....................................................................................... E-1 APPENDIX F. VEHICLE MAINTENANCE CALCULATIONS ................................................................................... F-1 APPENDIX G. WELL-TO-WHEEL EMISSIONS ASSESSMENT ............................................................................ G-1 APPENDIX H. BATTERY LIFE ESTIMATION ...................................................................................................... H-1 APPENDIX I. BATTERY END-OF-LIFE VALUE CALCULATIONS ......................................................................... I-1 APPENDIX J. DEMAND REDUCTION USING VEHICLE-TO-BUILDING ................................................................ J-1 APPENDIX K. ELECTRIC GENERATION ANALYSIS ........................................................................................... K-1
REFERENCES
PHEV Value Proposition Study – Final Report Draft / July 2010 v
LIST OF FIGURES
FIGURE 1: CURRENT STATUS OF THE PHEV VALUE PROPOSITION STUDY. ............................................................................................. 2
FIGURE 2: NETWORK OF DATA FLOW USED IN THE REGIONAL CASE STUDY ANALYSES. ............................................................................ 19
FIGURE 3: CALIFORNIA ELECTRIC SERVICE UTILITY AREAS .................................................................................................................. 20
FIGURE 4: NERC REGION FORMERLY KNOWN AS ECAR, AS OF 2003. ................................................................................................. 21
FIGURE 5: BREAKDOWN OF COMPONENT COSTS (LEFT) AND SCHEMATIC OF POWERTRAIN (RIGHT) FOR AN ICE. ..................................... 24
FIGURE 6: BREAKDOWN OF COMPONENT COSTS (LEFT) AND SCHEMATIC OF POWERTRAIN (RIGHT) FOR HEV. ......................................... 25
FIGURE 7: BREAKDOWN OF COMPONENT COSTS (LEFT) AND SCHEMATIC OF PRE-TRANSMISSION PARALLEL POWERTRAIN (RIGHT) FOR
PHEV. ................................................................................................................................................................................... 25
FIGURE 8: INITIAL VEHICLE PURCHASE COST COMPARISON FOR ICES, HEVS, AND PHEVS PRODUCED IN BOTH 2010 AND 2030. ............ 26
FIGURE 9: OVERALL VEHICLE PURCHASE COST WITH STATE SALES TAX AND PRESENT VALUE OF MONEY INCLUDED. ................................. 27
FIGURE 10: TOTAL FUEL (LIQUID AND ELECTRICITY) COSTS OVER A TEN YEAR VEHICLE LIFETIME IN SOUTHERN CALIFORNIA. .................... 30
FIGURE 11: TOTAL FUEL (LIQUID AND ELECTRICITY) COSTS OVER A TEN YEAR VEHICLE LIFETIME IN ECAR / CLEVELAND, OHIO. ............... 31
FIGURE 12: CUMULATIVE SCHEDULED MAINTENANCE COSTS FOR ICES, HEVS, AND PHEVS OVER TEN YEAR VEHICLE LIFETIME. ............ 32
FIGURE 13: OVERALL VEHICLE OPERATING COST COMPARISON FOR ICES, HEVS, AND PHEVS IN 2030 OVER A TEN YEAR LIFETIME IN
EACH CASE STUDY LOCATION. .................................................................................................................................................. 34
FIGURE 14: TOTAL VEHICLE OPERATING COSTS FOR EACH VEHICLE TYPE ONCE PRESENT VALUE OF MONEY IS INCORPORATED. ............... 34
FIGURE 15: OUTCOME OF BUILDING OWNERS SQUARING OFF EACH DAY’S PEAK BY PURCHASING EXTRA POWER IN THE MORNING TO
COMPLETELY RECHARGE THE BATTERIES. ................................................................................................................................. 38
FIGURE 16: CHANGE IN LOAD SHAPE WITH PHEVS PLUGGING IN BEGINNING AT 7 AM. ........................................................................... 39
FIGURE 17: LOAD DURATION CURVES FOR CALIFORNIA LOADS BEFORE AND AFTER IMPORTS................................................................. 41
FIGURE 18: CALIFORNIA SYSTEM DEMANDS FROM PHEVS ................................................................................................................... 42
FIGURE 19: CALIFORNIA SUMMER LOAD DURATION CURVES WITH AND WITHOUT PHEV ADDED DEMAND ................................................. 43
FIGURE 20: CALIFORNIA GENERATING CAPACITY, INITIAL GENERATION AMOUNTS, AND ADDED GENERATION FROM PHEVS. ..................... 43
FIGURE 21: LOAD DURATION CURVES FOR ECAR LOADS. ................................................................................................................... 44
FIGURE 22: ECAR SYSTEM DEMANDS FROM PHEVS .......................................................................................................................... 45
FIGURE 23: ECAR SUMMER LOAD DURATION CURVES WITH AND WITHOUT PHEV ADDED DEMAND ......................................................... 46
FIGURE 24: NET DEMAND DURING PEAK WEEK IF ALL PHEV OWNERS PLUG IN IMMEDIATELY FOLLOWING AFTERNOON WORK COMMUTE AT
220V. .................................................................................................................................................................................... 46
FIGURE 25: ECAR GENERATING CAPACITY, INITIAL GENERATION AMOUNTS, AND ADDED GENERATION FROM PHEVS .............................. 47
FIGURE 26: REGIONAL CASE STUDY COMPARISONS OF CO2 EMISSIONS BETWEEN ICES, HEVS, AND PHEV-30S IN 2030. ..................... 50
FIGURE 27: REGIONAL CASE STUDY COMPARISONS OF CO2 EMISSIONS BETWEEN ICES, HEVS, AND PHEV-30S IN 2030. ...................... 51
FIGURE 28: PHEV-30 ENERGY STORAGE UTILIZATION DURING TEN YEAR (150,000 MILE/ OPERATION) ................................................... 53
FIGURE 29: POTENTIAL BATTERY PACK CONCEPTUAL DESIGN WITH ONLY ONE HALF OF THE ORIGINAL RESERVE STORAGE CAPACITY TO
ALLOW REDUCED BATTERY CAPACITY ....................................................................................................................................... 54
FIGURE 30: POTENTIAL BATTERY PACK CONCEPTUAL DESIGN WITHOUT RESERVE CAPACITY TO ACCOMMODATE CYCLING AND AGING LOSSES
............................................................................................................................................................................................. 55
FIGURE 31: EFFECTS OF VEHICLE AER ON TOTAL LIFETIME OWNERSHIP COST ...................................................................................... 58
vi PHEV Value Proposition Study – Final Report Draft / July 2010
FIGURE 32: EFFECTS OF VEHICLE TYPE ON W2W CO2 EMISSIONS ...................................................................................................... 59
FIGURE 33: W2W TOTAL ENERGY CONSUMED BY ICES, HEVS, AND PHEVS WITH VARIOUS AERS ........................................................ 60
FIGURE 34: IMPORTED OIL DISPLACED OVER LIFETIME OF VEHICLE RELATIVE TO AN ICE, ASSUMING A 70/30 SPLIT OF E10 AND E85 USE IN
2030. .................................................................................................................................................................................... 61
FIGURE 35: INCREASE IN ECAR GRID LOAD DUE TO PHEV FLEETS WITH VARYING AERS ...................................................................... 62
FIGURE 36: IMPORTED OIL DISPLACED OVER LIFETIME OF VEHICLE RELATIVE TO AN ICE WITH NO WEIGHT REDUCTION ............................. 63
FIGURE 37: EFFECTS OF VEHICLE GLIDER WEIGHT OF CO2 EMISSIONS .................................................................................................. 64
FIGURE 38: EFFECTS OF VEHICLE GLIDER WEIGHT ON TOTAL W2W ENERGY USED ................................................................................ 65
FIGURE 39: EFFECTS OF VARYING ELECTRICITY COST OF TOTAL LIFETIME OWNERSHIP COST .................................................................. 66
FIGURE 40: IMPORTED OIL DISPLACED OVER LIFETIME OF VEHICLE RELATIVE TO AN ICE WITH THE SAME ALTERED DRIVE CYCLES. A 70/30
SPLIT OF E10 AND E85 USE IS ASSUMED IN 2030 IS ASSUMED. .................................................................................................. 67
FIGURE 41: EFFECTS OF VARYING FUEL BLENDS ON CO2 EMISSIONS .................................................................................................... 68
FIGURE 42: EFFECTS OF VARYING FUEL BLENDS ON TOTAL W2W ENERGY USED ................................................................................... 69
FIGURE 43: IMPORTED OIL DISPLACED OVER LIFETIME OF VEHICLE RELATIVE TO AN ICE OPERATING ON E10 .......................................... 70
FIGURE 44: EFFECTS OF VARYING CARBON TAX RATES ON LIFETIME OWNERSHIP COST .......................................................................... 71
FIGURE 45: EFFECTS OF CARBON TAX RATES ON ECAR CO2 EMISSIONS .............................................................................................. 72
FIGURE 46: EFFECTS OF CARBON TAX RATES ON TOTAL W2W ENERGY USED ....................................................................................... 72
FIGURE 47: EFFECTS OF ALTERNATIVE GENERATION MIXES ON CO2 EMISSIONS .................................................................................... 73
FIGURE 48: EFFECTS OF ALTERNATIVE GENERATION MIXES ON TOTAL W2W ENERGY USED ................................................................... 74
FIGURE 49: IMPACTS OF VARYING MARKET PENETRATION RATES OF PHEV-30S ON ECAR’S GRID LOAD ................................................ 75
FIGURE 50: EFFECTS OF VARYING LIQUID FUEL PRICES ON TOTAL LIFETIME OWNERSHIP COST ................................................................ 76
FIGURE 51: EFFECTS OF VARYING ELECTRICITY COSTS ON LIFETIME OWNERSHIP COST ......................................................................... 77
FIGURE 52: EFFECTS OF VARYING ENERGY STORAGE COST ON LIFETIME OWNERSHIP COST ................................................................... 78
FIGURE 53: SUMMARY MAP OF OEMS’ PERCEIVED RISKS AND BENEFITS ASSOCIATED WITH THE EMERGING PLUG-IN ELECTRIC VEHICLE
MARKET ................................................................................................................................................................................. 80
FIGURE 54: SUMMARY OF TOTAL COST OF OWNERSHIP FOR EACH VEHICLE TYPE, ONCE PRESENT VALUE OF MONEY IS APPLIED. .............. 83
FIGURE 55: NET DEMAND DURING PEAK WEEK IF ALL PHEV OWNERS PLUG IN IMMEDIATELY FOLLOWING AFTERNOON WORK COMMUTE AT
220V. .................................................................................................................................................................................... 84
FIGURE C - 1: ELECTRIC GENERATION MIX BY FUEL TYPE AND BY STATE.............................................................................................. C-2
FIGURE C - 2: THIRTEEN NERC REGIONS, AS OF 2003, USED IN NEMS AND OTHER MODELS. [NOTE: THE ECAR REGION IS NO LONGER IN
OPERATION.] ......................................................................................................................................................................... C-3
FIGURE H - 1: PHEV BATTERY AND LIFE ESTIMATION MODEL. ........................................................................................................... H-4
FIGURE H - 2: MODELING APPROACH ............................................................................................................................................... H-5
FIGURE H - 3: BATTERY OPERATING REGIME FOR PHEV APPLICATIONS – SIZING EXAMPLE ................................................................. H-5
FIGURE H - 4: BASE CASE (PHEV 30) – SOC VS C-RATE – TRIP WORK A ........................................................................................ H-6
FIGURE H - 5: BASE CASE (PHEV 30) – SOC VS. C-RATE – TRIP WORK B........................................................................................ H-7
FIGURE H - 6: BASE CASE (PHEV 30) – SOC VS. C-RATE – TRIP ERRAND A .................................................................................... H-7
FIGURE H - 7: BASE CASE (PHEV 30) – SOC VS. C-RATE – TRIP ERRAND B .................................................................................... H-8
FIGURE H - 8: BASE CASE (PHEV 30) – SOC VS. C-RATE – TRIP ERRAND C .................................................................................... H-8
PHEV Value Proposition Study – Final Report Draft / July 2010 vii
FIGURE H - 9: BASE CASE (PHEV 30) – SOC VS. C-RATE – TRIP WEEKEND A .................................................................................. H-9
FIGURE H - 10: BASE CASE (PHEV 30) – SOC VS. C-RATE – TRIP WEEKEND B. ............................................................................... H-9
FIGURE H - 11: PHEV 10 – SOC VS. C-RATE – TRIP WORK A ........................................................................................................ H-10
FIGURE H - 12: PHEV 20 – SOC VS. C-RATE – TRIP WORK A ........................................................................................................ H-10
FIGURE H - 13: PHEV 40 – SOC VS. C-RATE – TRIP WORK A ........................................................................................................ H-11
FIGURE H - 14: VEHICLE WITH 0% WEIGHT REDUCTION – SOC VS. C-RATE – TRIP WORK A ............................................................ H-11
FIGURE H - 15: VEHICLE WITH 45% WEIGHT REDUCTION – SOC VS. C-RATE – TRIP WORK A .......................................................... H-12
FIGURE H - 16: EXTENDED WORK CYCLE – SOC VS. C-RATE – TRIP WORK A ................................................................................. H-12
FIGURE J - 1: LARGE OFFICE BUILDING (>30,000 SQ FT) TOTAL LOAD IN SCE. ..................................................................................... J-1
FIGURE J - 2: SUMMER LOADS FOR SINGLE LARGE OFFICE BUILDING IN SCE. ....................................................................................... J-2
FIGURE J - 3: FALL LOADS FOR SINGLE LARGE OFFICE BUILDING IN SCE. ............................................................................................. J-2
FIGURE J - 4: CHANGE IN LOAD SHAPE FOR JULY 24-29 WITH PHEV CHARGING USED FOR PEAK SHAVING. ............................................ J-4
FIGURE J - 5: CHANGE IN LOAD SHAPE WITH PHEVS PLUGGING IN BEGINNING AT 7 A.M. ....................................................................... J-5
FIGURE K - 1: THIRTEEN NERC REGIONS USED IN NEMS AND OTHER MODELS ................................................................................... K-2
FIGURE K - 2: AEO2009 REFERENCE SCENARIO ECAR UTILITY FUEL COSTS ...................................................................................... K-3
FIGURE K - 3: AEO2008 REFERENCE SCENARIO CALIFORNIA UTILITY FUEL COSTS ............................................................................. K=4
FIGURE K - 4: ECAR POWER PLANT GROUPS. .................................................................................................................................... K-5
FIGURE K - 5: CALIFORNIA POWER PLANT GROUPS ............................................................................................................................. K-6
FIGURE K - 6: ECAR HOURLY DEMANDS FOR 2030 BASED ON ESCALATING 2006 LOADS. ..................................................................... K-7
FIGURE K - 7: CALIFORNIA HOURLY DEMANDS FOR 2030 BASED ON ESCALATING 2006 LOADS .............................................................. K-8
FIGURE K - 8: LOAD DURATION CURVES FOR ECAR LOADS BEFORE AND AFTER IMPORTS. ................................................................... K-9
FIGURE K - 9: LOAD DURATION CURVES FOR CALIFORNIA LOADS BEFORE AND AFTER IMPORTS .......................................................... K-10
FIGURE K - 10: CALIFORNIA SYSTEM DEMANDS FROM PHEVS .......................................................................................................... K-12
FIGURE K - 11: ECAR SYSTEM DEMANDS FROM PHEVS .................................................................................................................. K-14
FIGURE K - 12: ECAR DEMAND WITH AND WITHOUT PHEVS ON THE PEAK WEEK OF THE YEAR ........................................................... K-15
FIGURE K - 13: CALIFORNIA DEMAND WITH AND WITHOUT PHEVS ON THE PEAK WEEK OF THE YEAR .................................................... K-15
FIGURE K - 14: ECAR SUMMER LOAD DURATION CURVES WITH AND WITHOUT PHEV-ADDED DEMAND ................................................. K-16
FIGURE K - 15: CALIFORNIA SUMMER LOAD DURATION CURVES WITH AND WITHOUT PHEV-ADDED DEMAND ......................................... K-16
FIGURE K - 16: HOURLY LOADS TO GENERATORS AND CORRESPONDING HOURLY MARGINAL PRICES.................................................... K-17
FIGURE K - 17: ECAR GENERATING CAPACITY, INITIAL GENERATION AMOUNTS, AND ADDED GENERATION FROM PHEVS USING THE
CHARGING PROFILE IN FIGURE K-11. ..................................................................................................................................... K-18
FIGURE K - 18: ADDED GENERATION FOR PHEVS UNDER BASE CASE AND SENSITIVITIES. ................................................................... K-18
FIGURE K - 19: ECAR BASE CAPACITY, BASE GENERATION, AND ADDED GENERATION WITH A $191/METRIC TON CARBON COST. ........... K-19
FIGURE K - 20: ECAR BASE CAPACITY, BASE GENERATION, AND ADDED GENERATION WITH A $0/METRIC TON CARBON COST. ............... K-19
FIGURE K - 21: CALIFORNIA GENERATING CAPACITY, INITIAL GENERATION AMOUNTS, AND ADDED GENERATION FROM PHEVS USING THE
CHARGING PROFILE IN FIGURE K-10. ..................................................................................................................................... K-20
viii PHEV Value Proposition Study – Final Report Draft / July 2010
LIST OF TABLES
TABLE 1: A NON-EXHAUSTIVE LIST OF ANNOUNCED PLUG-IN ELECTRIC VEHICLES SLATED FOR NEAR-TERM PRODUCTION, AS COMPILED BY
SENTECH (LAST UPDATED JUNE 2010) ....................................................................................................................................... 5
TABLE 2: COMPLETE LIST OF VALUE PROPOSITIONS GENERATED FROM THE PHEV VALUE PROPOSITION WORKSHOP ............................... 9
TABLE 3: VALUE PROPOSITIONS LISTED BY LEAD INVESTIGATOR AND REQUIRED MODELING TOOLS OR DATA. ........................................... 15
TABLE 4: BASIS FOR VEHICLE COST CALCULATIONS FOR MID-SIZE SEDAN IN 2030 (2010 $) ................................................................... 23
TABLE 5: EFFECT OF PHEV PEAK SHAVING IN JULY USING SCE RATES. ............................................................................................... 38
TABLE 6: CALIFORNIA 2030 GENERATION AND CAPACITY FACTORS FROM AEO 2008 AND FROM ORCED SIMULATIONS .......................... 40
TABLE 7: CALIFORNIA STUDY PHEV CHARGING SCENARIOS ................................................................................................................. 42
TABLE 8: ECAR 2030 GENERATION AND CAPACITY FACTORS FROM AEO 2009 AND FROM ORCED SIMULATIONS .................................. 44
TABLE 9: FUEL AND ENGINE ASSUMPTIONS FOR BOTH REGIONAL CASE STUDIES .................................................................................... 49
TABLE 10: BASE AND MARGINAL ELECTRICITY GENERATION MIX ASSUMPTIONS FOR BOTH CASE STUDIES IN 2030. IN THIS STUDY, PHEVS
ARE ASSUMED TO ALMOST ALWAYS CHARGE ON THE MARGIN. .................................................................................................... 49
TABLE 11: SUMMARY OF PARAMETERS VARIED IN THIS STUDY'S SENSITIVITY ANALYSIS. ......................................................................... 57
TABLE A - 1: A NON-EXHAUSTIVE LIST OF ANNOUNCED PLUG-IN ELECTRIC VEHICLES SLATED FOR NEAR-TERM PRODUCTION, AS COMPILED
BY SENTECH (LAST UPDATED JUNE 2010) ............................................................................................................................... A-5
TABLE B - 1: 2030 VEHICLE PARAMETER ASSUMPTIONS ..................................................................................................................... B-1
TABLE D - 1: BREAKDOWN OF PROJECTED PURCHASE PRICES FOR EACH VEHICLE TYPE IN TODAY’S MARKET AND IN 2030 (DOLLAR VALUES
FROM 2010). THE 2030 VALUES WERE USED FOR EACH REGIONAL CASE STUDY. ...................................................................... D-2
TABLE D - 2: PROJECTED PURCHASE PRICES FOR PHEVS IN 2030 WHEN CHAPTER 5’S SENSITIVITY PARAMETERS FOR AER ARE APPLIED, WHICH RANGE FROM 10 MILES TO 40 MILES. ........................................................................................................................... D-3
TABLE D - 3: PROJECTED PURCHASE PRICES FOR PHEVS IN 2030 WHEN CHAPTER 5’S SENSITIVITY PARAMETERS FOR BATTERY COST ARE
APPLIED, WHICH RANGE FROM $100 / KWH TO $400 / KWH. .................................................................................................... D-4
TABLE E - 1: CHARACTERISTICS OF EACH INDIVIDUAL EPA DRIVE CYCLES INCORPORATED INTO THIS STUDY’S WORK, ERRAND AND
WEEKEND/VACATION TRIPS. .................................................................................................................................................... E-1
TABLE E - 2: DESCRIPTION OF THE WORK, ERRAND, AND WEEKEND/VACATION TRIPS EXERCISED BY EACH VEHICLE TYPE IN THIS STUDY. . E-1
TABLE E - 3: LIQUID FUEL AND ELECTRICITY (IF APPLICABLE) CONSUMPTION CALCULATIONS FOR ICES, HEVS, AND PHEV-30S USED IN
EACH REGIONAL CASE STUDY – BASE CASE .......................................................................................................................... E-2
TABLE E - 4: LIQUID FUEL AND ELECTRICITY COST CALCULATIONS BASED ON CONSUMPTION RATES – BASE CASE ............................... E-3
TABLE E - 5: LIQUID FUEL AND ELECTRICITY CONSUMPTION CALCULATIONS FOR PHEVS OPERATING IN EACH REGIONAL CASE STUDY – 10-, 20- AND 40-MILE AER INSTEAD OF BASE CASE’S 30 MILE AER ................................................................................................. E-4
TABLE E - 6: LIQUID FUEL AND ELECTRICITY COST CALCULATIONS BASED ON CONSUMPTION RATES – 10-, 20- AND 40-MILE AER INSTEAD
OF BASE CASE’S 30 MILE AER ................................................................................................................................................ E-5
TABLE E - 7: LIQUID FUEL AND ELECTRICITY (IF APPLICABLE) CONSUMPTION CALCULATIONS FOR ICES, HEVS, AND PHEV-30S USED IN
EACH REGIONAL CASE STUDY – E85 BLEND SUBSTITUTED FOR BASE CASE’S 70/30 SPLIT OF E10 AND E85 ................................. E-6
TABLE E - 8: LIQUID FUEL AND ELECTRICITY COST CALCULATIONS BASED ON CONSUMPTION RATES - E85 BLEND SUBSTITUTED FOR BASE
CASE’S 70/30 SPLIT OF E10 AND E85 ..................................................................................................................................... E-7
TABLE E - 9: LIQUID FUEL AND ELECTRICITY (IF APPLICABLE) CONSUMPTION CALCULATIONS FOR ICES, HEVS, AND PHEV-30S USED IN
EACH REGIONAL CASE STUDY – E10 BLEND SUBSTITUTED FOR BASE CASE’S 70/30 SPLIT OF E10 AND E85 ................................. E-8
TABLE E - 10: LIQUID FUEL AND ELECTRICITY COST CALCULATIONS BASED ON CONSUMPTION RATES – E10 BLEND SUBSTITUTED FOR BASE
CASE’S 70/30 SPLIT OF E10 AND E85 ..................................................................................................................................... E-9
PHEV Value Proposition Study – Final Report Draft / July 2010 ix
TABLE E - 11: LIQUID FUEL AND ELECTRICITY (IF APPLICABLE) CONSUMPTION CALCULATIONS FOR ICES, HEVS, AND PHEV-30S USED IN
EACH REGIONAL CASE STUDY – NO GLIDER WEIGHT REDUCTION AS OPPOSED TO BASE CASE’S 30% GLIDER WEIGHT REDUCTIONE-10
TABLE E - 12: LIQUID FUEL AND ELECTRICITY COST CALCULATIONS BASED ON CONSUMPTION RATES – NO GLIDER WEIGHT REDUCTION AS
OPPOSED TO BASE CASE’S 30% GLIDER WEIGHT REDUCTION .................................................................................................. E-11
TABLE E - 13: LIQUID FUEL AND ELECTRICITY (IF APPLICABLE) CONSUMPTION CALCULATIONS FOR ICES, HEVS, AND PHEV-30S USED IN
EACH REGIONAL CASE STUDY – 45% GLIDER WEIGHT REDUCTION AS OPPOSED TO BASE CASE’S 30% GLIDER WEIGHT REDUCTION . E-12
TABLE E - 14: LIQUID FUEL AND ELECTRICITY COST CALCULATIONS BASED ON CONSUMPTION RATES – 45% GLIDER WEIGHT REDUCTION AS
OPPOSED TO BASE CASE’S 30% GLIDER WEIGHT REDUCTION .................................................................................................. E-13
TABLE E - 15: LIQUID FUEL AND ELECTRICITY CONSUMPTION CALCULATIONS FOR PHEVS OPERATING IN EACH REGIONAL CASE STUDY –
MODIFIED DRIVE CYCLES COMPARED TO BASE CASE ............................................................................................................ E-14
TABLE E - 16: LIQUID FUEL AND ELECTRICITY COST CALCULATIONS BASED ON CONSUMPTION RATES – MODIFIED DRIVE CYCLES COMPARED
TO BASE CASE .................................................................................................................................................................... E-15
TABLE E - 17: LIQUID FUEL AND ELECTRICITY (IF APPLICABLE) CONSUMPTION CALCULATIONS FOR ICES, HEVS, AND PHEV-30S USED IN
EACH REGIONAL CASE STUDY – 2.5% GRADES (UPHILL AND DOWNHILL) AS OPPOSED TO BASE CASE’S 0% GRADE. IN ADDITION, THREE DIFFERENT GLIDER WEIGHTS WERE INVESTIGATED. ...................................................................................................... E-16
TABLE F - 1: SUMMATION OF SCHEDULED MAINTENANCE COSTS FOR ICES, HEVS, AND PHEV-30S IN 2030. ........................................ F-1
TABLE G - 1: EMISSION AND ENERGY OUTPUTS FOR EACH REGIONAL CASE STUDY, MODELED IN GREET .............................................. G-1
TABLE G - 2: EMISSION AND ENERGY OUTPUTS FOR ALL SENSITIVITY CASES, MODELED IN GREET ....................................................... G-2
TABLE H - 1: EPA DRIVE CYCLES USED IN THE PRESENTED STUDY .................................................................................................... H-3
TABLE H - 2: DRIVING/CHARGING SESSIONS DURING TYPICAL WEEK .................................................................................................... H-4
TABLE H - 3: SUMMARY OF BATTERY LIFE ESTIMATION RESULTS ....................................................................................................... H-13
TABLE I - 1: ESTIMATED VALUE OF AUTOMOTIVE BATTERY PACK AT END OF LIFE. ................................................................................... I-1
TABLE J - 1: SCE TOU-8 RATES. ...................................................................................................................................................... J-3
TABLE J - 2: LADWP LARGE GENERAL SERVICE RATES....................................................................................................................... J-3
TABLE J - 3: EFFECT OF PHEV PEAK SHAVING IN JULY USING SCE RATES........................................................................................... J-5
TABLE K - 1: ECAR 2030 GENERATING CAPACITY FOR 3 SUPPLY SCENARIOS .................................................................................... K-2
TABLE K - 2: PROJECTED CALIFORNIA GENERATING CAPACITY 2030. ................................................................................................. K-3
TABLE K - 3: ECAR 2030 FUEL PRICES FOR THREE SUPPLY SCENARIOS WITH AND WITHOUT CO2 COST. .............................................. K-4
TABLE K - 4: ECAR AND CALIFORNIA 2030 BASE FUEL PRICES WITH AND WITHOUT CO2 COST ............................................................ K-5
TABLE K - 5: ECAR 2030 GENERATION AND CAPACITY FACTORS FROM AEO2009 AND ORCED .......................................................... K-6
TABLE K - 6: CALIFORNIA 2030 GENERATION AND CAPACITY FACTORS FROM AEO2008 AND ORCED .................................................. K-7
TABLE K - 7: CALIFORNIA STUDY PHEV CHARGING SCENARIOS ......................................................................................................... K-11
TABLE K - 8: ECAR PHEV CHARGING SCENARIOS ........................................................................................................................... K-13
TABLE K - 9: PHEV CHARGING PARAMETERS ................................................................................................................................... K-13
x PHEV Value Proposition Study – Final Report Draft / July 2010
ACRONYMS AND ABBREVIATIONS
ACESA American Clean Energy and Security Act of 2009 AEO2008 Annual Energy Outlook 2008 AEO2009 Annual Energy Outlook 2009 AER all-electric range ANL Argonne National Laboratory ARRA American Recovery and Reinvestment Act of 2009 ATVM Advanced Technology Vehicles Manufacturing
BOL beginning of life Btu British thermal unit
CAFE Corporate Average Fuel Economy CAISO California Independent System Operator CC combined cycle CCS carbon capture and sequestration CEC California Energy Commission CO2 carbon dioxide CT combustion turbine
DOD depth of discharge DOE U.S. Department of Energy DOT U.S. Department of Transportation
E10 10% ethanol blend gasoline E30 30% ethanol blend gasoline E85 85% ethanol blend gasoline ECAR East Central Area Reliability Coordination Agreement EESA Emergency Economic Stabilization Act of 2008 EIA Energy Information Administration EISA Energy Independence and Security Act of 2007 EOL end-of-life EPA U.S. Environmental Protection Agency EPRI Electric Power Research Institute EV electric vehicle
FCVT FreedomCAR and Vehicle Technologies program FERC Federal Energy Regulatory Commission FOA funding opportunity announcement
GE General Electric Company GHG greenhouse gas GM General Motors GPRA Government Performance and Results Act of 1993 GPS global positioning system GREET Greenhouse gas, Regulated Emissions, and Energy use in Transportation model
HEV hybrid electric vehicle HOV high-occupancy vehicle HWFET highway fuel economy test
ICE internal combustion engine IID Imperial Irrigation District ISO independent system operator
kWh kilowatt hour
LADWP Los Angeles Department of Water and Power LDC load duration curve
PHEV Value Proposition Study – Final Report Draft / July 2010 xi
LDV light duty vehicle Li-ion lithium-ion
MA3T Market Acceptance of Advanced Automotive Technologies model MBM macro business model mpg miles per gallon MIS Market Introduction Study MSRP manufacturer’s suggested retail price MTC manufacturing tax credit MYPP Multi-Year Program Plan MW h megawatt hour
NEMS National Energy Modeling System NERC North American Electric Reliability Corporation NIST National Institute of Standards and Technology NPV net present value NRC National Research Council NREL National Renewable Energy Laboratory
OEM original equipment manufacturer ORCED Oak Ridge Competitive Electricity Dispatch model ORCI Opinion Research Corporation International ORNL Oak Ridge National Laboratory OSU CAR Ohio State University Center for Automotive Research
PE&EM power electronics and electric machinery PG&E Pacific Gas and Electric Company PHEV plug-in hybrid electric vehicle PHEV-xx PHEV with an AER of equivalent of xx miles PSAT Powertrain Systems Analysis Toolkit
R&D research and development RESS rechargeable energy storage system RPS renewable portfolio standard
SCE Southern California Edison SDG&E San Diego Gas and Electric Company SMUD Sacramento Municipal Utility District SNL Sandia National Laboratory SOC state of charge SULEV super ultra low emission vehicle
T&D transmission and distribution UDDS urban dynamometer driving schedule UMTRI University of Michigan Transportation Research Institute URG utility retained generating US06 light duty drive cycle for high speed, high load
VAMMP Vehicle AutoMotitveMarketPlace model VMT vehicle miles traveled VPS Value Proposition Study V2B vehicle-to-building V2G vehicle-to-grid
W2W Well-to-Wheel WR weight reduction
ZEV zero emission vehicle

xii PHEV Value Proposition Study – Final Report Draft / July 2010
This page intentionally left blank.
PHEV Value Proposition Study – Final Report Draft / July 2010 xiii
FACT SHEET
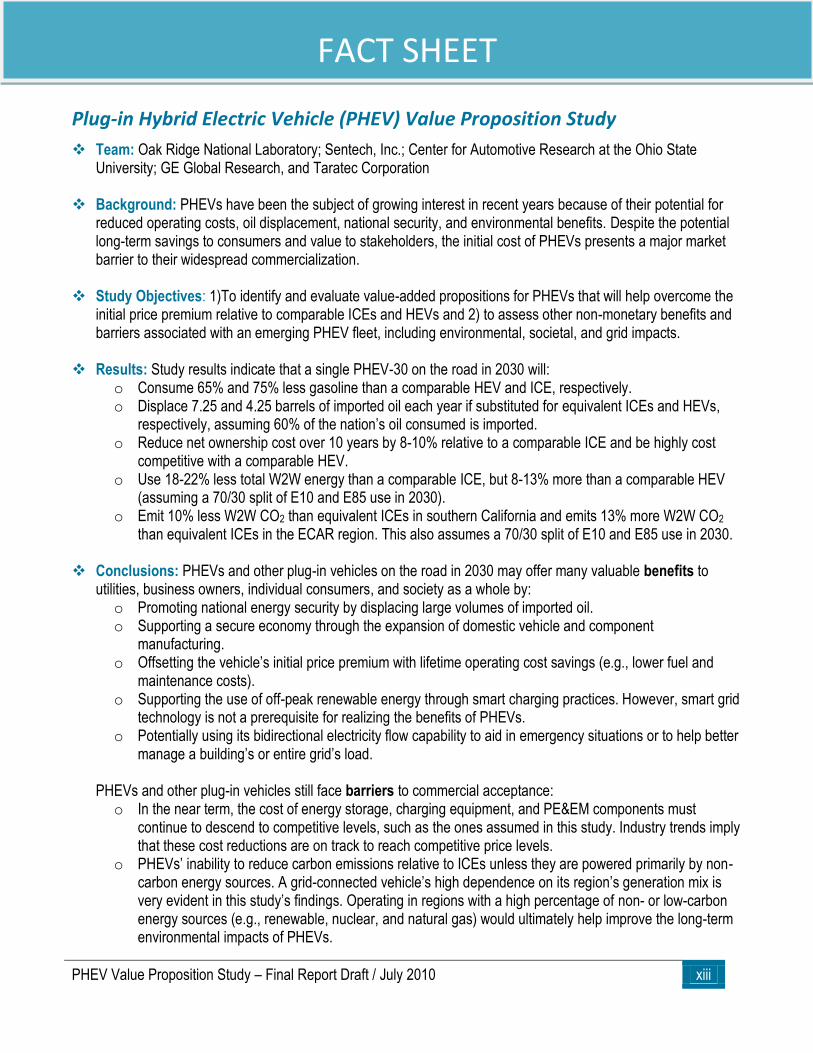
Plug-in Hybrid Electric Vehicle (PHEV) Value Proposition Study
Team: Oak Ridge National Laboratory; Sentech, Inc.; Center for Automotive Research at the Ohio State University; GE Global Research, and Taratec Corporation
Background: PHEVs have been the subject of growing interest in recent years because of their potential for reduced operating costs, oil displacement, national security, and environmental benefits. Despite the potential long-term savings to consumers and value to stakeholders, the initial cost of PHEVs presents a major market barrier to their widespread commercialization.
Study Objectives: 1)To identify and evaluate value-added propositions for PHEVs that will help overcome the
initial price premium relative to comparable ICEs and HEVs and 2) to assess other non-monetary benefits and barriers associated with an emerging PHEV fleet, including environmental, societal, and grid impacts.
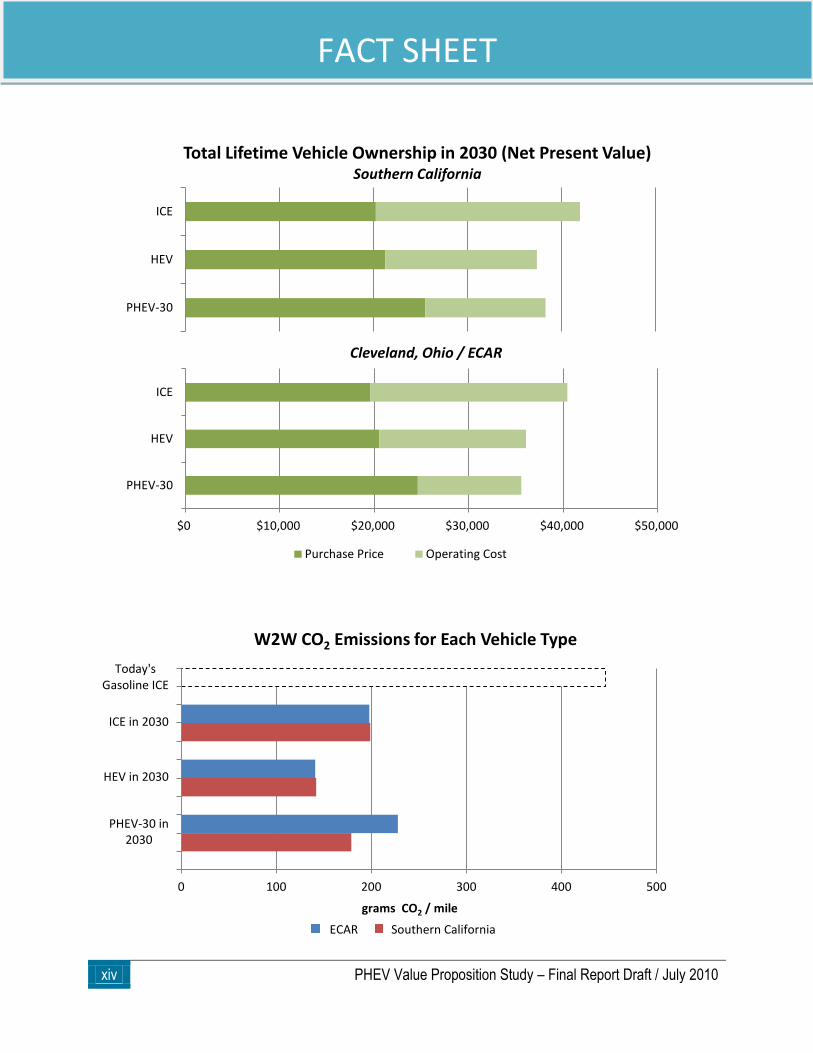
Results: Study results indicate that a single PHEV-30 on the road in 2030 will:
o Consume 65% and 75% less gasoline than a comparable HEV and ICE, respectively. o Displace 7.25 and 4.25 barrels of imported oil each year if substituted for equivalent ICEs and HEVs,
respectively, assuming 60% of the nation’s oil consumed is imported. o Reduce net ownership cost over 10 years by 8-10% relative to a comparable ICE and be highly cost
competitive with a comparable HEV. o Use 18-22% less total W2W energy than a comparable ICE, but 8-13% more than a comparable HEV
(assuming a 70/30 split of E10 and E85 use in 2030). o Emit 10% less W2W CO2 than equivalent ICEs in southern California and emits 13% more W2W CO2
than equivalent ICEs in the ECAR region. This also assumes a 70/30 split of E10 and E85 use in 2030.
Conclusions: PHEVs and other plug-in vehicles on the road in 2030 may offer many valuable benefits to utilities, business owners, individual consumers, and society as a whole by: o Promoting national energy security by displacing large volumes of imported oil. o Supporting a secure economy through the expansion of domestic vehicle and component
manufacturing. o Offsetting the vehicle’s initial price premium with lifetime operating cost savings (e.g., lower fuel and
maintenance costs). o Supporting the use of off-peak renewable energy through smart charging practices. However, smart grid
technology is not a prerequisite for realizing the benefits of PHEVs. o Potentially using its bidirectional electricity flow capability to aid in emergency situations or to help better
manage a building’s or entire grid’s load.
PHEVs and other plug-in vehicles still face barriers to commercial acceptance: o In the near term, the cost of energy storage, charging equipment, and PE&EM components must
continue to descend to competitive levels, such as the ones assumed in this study. Industry trends imply that these cost reductions are on track to reach competitive price levels.
o PHEVs’ inability to reduce carbon emissions relative to ICEs unless they are powered primarily by non-carbon energy sources. A grid-connected vehicle’s high dependence on its region’s generation mix is very evident in this study’s findings. Operating in regions with a high percentage of non- or low-carbon energy sources (e.g., renewable, nuclear, and natural gas) would ultimately help improve the long-term environmental impacts of PHEVs.
xiv PHEV Value Proposition Study – Final Report Draft / July 2010
FACT SHEET
ICE
HEV
PHEV-30
Total Lifetime Vehicle Ownership in 2030 (Net Present Value) Southern California
$0 $10,000 $20,000 $30,000 $40,000 $50,000
ICE
HEV
PHEV-30
Cleveland, Ohio / ECAR
Purchase Price Operating Cost
0 100 200 300 400 500
Today'sGasoline ICE
ICE in 2030
HEV in 2030
PHEV-30 in2030
grams CO2 / mile
W2W CO2 Emissions for Each Vehicle Type
ECAR Southern California
PHEV Value Proposition Study – Final Report Draft / July 2010 xv
EXECUTIVE SUMMARY
Plug-in Hybrid Electric Vehicle (PHEV) Value Proposition Study
OVERVIEW
Plug-in hybrid electric vehicles (PHEVs) have been the subject of growing interest in recent years because of their potential for reduced operating costs, oil displacement, national security, and environmental benefits. The primary value of PHEVs to the consumer is their likelihood to markedly reduce fuel costs by substituting gasoline with electricity. However, PHEVs are expected to cost more to purchase than comparable internal combustion engine (ICE) vehicles or hybrid electric vehicles (HEVs), in large part because of the cost of batteries. Despite the potential, long-term savings to consumers and value to stakeholders, the initial cost of PHEVs presents a major market barrier to their widespread commercialization. The purpose of the PHEV Value Proposition Study (VPS) is to identify and evaluate value-added propositions for PHEVs that will help overcome this market barrier. INDUSTRY OUTLOOK
Much government support has been established in recent years to help aid the market introduction of PHEVs and other plug-in vehicles in the United States. Some of the most significant federal government policies that support PHEV production and are being implemented include:
The plug-in vehicle tax credit that offers between $2,500 - $7,500 in tax credits to consumers, based on battery energy storage capacity (American Recovery and Reinvestment Act of 2009 (ARRA), originally established in the Emergency Economic Stabilization Act of 2008 (EESA)).
$2 billion in advanced battery manufacturing grants to domestic automotive, battery, and component manufacturers (ARRA 2009, originally authorized in the Energy Independence and Security Act of 2007 (EISA) § 135).
$400 million for electric drive vehicles and electrification infrastructure demonstration and evaluation projects (ARRA 2009, originally authorized in EISA 2007 § 131).
This type of government support has contributed to a multitude of near-term production plans by automotive original equipment manufacturers (OEM) and battery manufacturers within the electric transportation sector. Toyota, Chevrolet, Fisker Automotive, and Mercedes-Benz are just a few of the OEMs that are currently developing PHEVs. Several OEMs also have plans to introduce all-electric vehicles, including Nissan, Audi, and BMW. Announced OEM production plans of plug-in electric vehicles currently tally at just less than 500,000 units prior to 2015, although studies (e.g., ORNL’s PHEV Market Introduction Study) suggest a demand of approximately 1 million units by 2015, assuming the U.S. Department of Energy’s cost reduction goals continue to be met.
PROJECT TEAM
Oak Ridge National Laboratory
Sentech, Inc.
Center for Automotive Research at
the Ohio State University
GE Global Research
Taratec Corporation
CLIENT
U.S. Department of Energy -
Vehicle Technologies Program
and Office of Electricity Delivery
and Energy Reliability
STUDY DURATION
September 2007 – May 2010
FOR MORE INFORMATION
www.sentech.org/phev
xvi PHEV Value Proposition Study – Final Report Draft / July 2010
EXECUTIVE SUMMARY
It should be noted that this industry has evolved significantly since this study was kicked off. Advancements in energy storage technology occur frequently, and as the cost of batteries continues to fall, all-electric vehicles are becoming more affordable. As a result, OEM production plans indicate that the electric transportation sector will likely be shared by PHEVs and all-electric vehicles in the coming years. APPROACH
The PHEV Value Proposition Study is comprised of many tasks, each requiring strong collaboration among team organizations and a thorough, methodical, and achievable action plan. Below is a breakdown of this study’s major tasks:
Form a Guidance & Evaluation Committee: A Guidance & Evaluation Committee composed of representatives from various stakeholder organizations was formed to contribute expertise throughout the entire study. Committee members include executives and entrepreneurs from the automotive, energy storage, utility, and finance arenas.
Host PHEV VPS Workshop: In December 2007, the project team organized and hosted a workshop with more than 120 PHEV industry stakeholders to brainstorm value propositions of PHEVs and to ascertain a general consensus of the marketplace in 2030.
Consolidate List of Value Propositions: The extensive list of value propositions that originated at the PHEV VPS Workshop was consolidated into approximately 20 items for continued study.
Identify Necessary Modeling Tools: To accurately assess the costs and benefits of each vehicle type, and major models from national laboratories, universities, and private industry was utilized.
Complete Two Regional Case Studies: Using the necessary modeling tools, each vehicle type was modeled from an economic, societal, and commercial perspective in two diverse regions.
PHEV Market Introduction Study: Between the two regional case studies, the project team identified and assessed the effect of potential policies, regulations, and temporary incentives as key enablers for a successful PHEV market debut as part of a PHEV Market Introduction Study.
Risk Analysis: The project team performed an analysis of the market risk for PHEVs to gauge their potential for success using parameters defined in the initial regional case study.
Sensitivity Analysis: Each regional case study was revisited to identify parameters that are sensitive to market conditions and technological advancements. Instead of analyzing specific cost and technology points, entire ranges were investigated to determine how fluctuating values could affect the competitiveness of PHEVs in each case study.
KEY ASSUMPTIONS FOR CASE STUDIES
Since the world of 2030 is anticipated to undergo a variety of economic and technological transitions during the next two decades, many assumptions were made to allow realistic business scenarios to be built. To assist in defining these assumptions, the project team used recommendations from a breakout group at the PHEV VPS Workshop that was tasked with creating a ―Consensus Vision for 2030-2040.‖ As a result, the following key assumptions were established for this study:
Vehicles, including battery packs, are anticipated to have a 10-year lifetime (~150,000 miles).
PHEVs have an all-electric range equivalent of 30 miles in both regional case studies. However, PHEV-10s, -20s, and -40s are also investigated in a sensitivity study.
U.S. Department of Energy (DOE) cost targets through 2030 will be met for all powertrain components (e.g., energy storage and power electronics).
PHEV Value Proposition Study – Final Report Draft / July 2010 xvii
EXECUTIVE SUMMARY
PHEV batteries will be based on lithium-ion chemistry.
PHEVs will use a pre-transmission parallel hybrid powertrain architecture.
Fuel economy of all vehicles will benefit from a 30% glider weight reduction by 2030 relative to today’s vehicles, which is moderately conservative relative to the DOE’s Vehicle Technologies Program 2007 Multi-Year Program Plan (MYPP) goal of developing technologies to enable 40% vehicle weight reduction.
Corporate Average Fuel Economy, or CAFE, standards for light duty vehicles will be greater than 35 miles per gallon (mpg) in 2030.
A tax of $65 per metric ton of carbon dioxide (CO2) is applied to electricity and liquid fuel.
A 70/30 split of E10 and E85 use is anticipated for 2030 to be consistent with DOE’s goal of supplying 30% of 2004 motor gasoline demand with ethanol by 2030, known as the ―30 x 30‖ goal. For modeling purposes, an average ―E30‖ blend is used to represent this combination of fuels.
PHEVs were assumed to comprise approximately 10% of new vehicle sales in 2030.
Sequestration will be incorporated to some extent in regions with high amounts of coal in the electric generation mix.
PHEV owners are assumed to commute to work five days per week, run errands three nights during the week, and make extended weekend drives.
All PHEV owners will plug in each weeknight to charge during off-peak times in a garage or equipped parking facility. Some will also plug in upon arrival to work and home in the evenings.
Management systems will be in place on charging equipment to manage overall fleet charge load profiles and default to off-peak charging when possible.
As previously mentioned, two regional case studies were conducted in this study. Southern California was chosen for the initial case study because of the state’s carbon policy, the large number of early adopters of internal combustion engine (ICE) hybrids, ongoing demand for and sales of HEVs, aggressive renewable portfolio standard (RPS) targets, and emission-constrained dispatch of power plants in the Los Angeles air basin. The North American Electric Reliability Corporation (NERC) Region formerly known as ECAR (East Central Area Reliability Coordination Agreement) was chosen for the site of the second regional case study primarily to investigate the environmental impacts of PHEVs in a coal-dominated region. ANALYSIS RESULTS
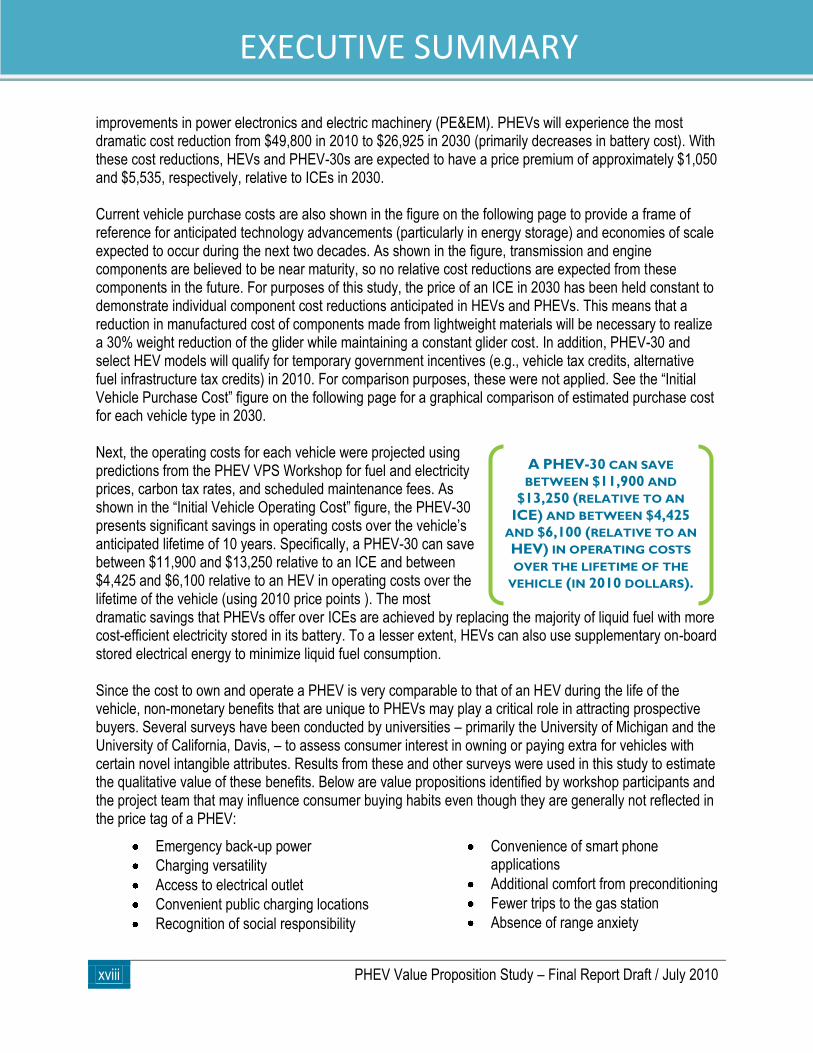
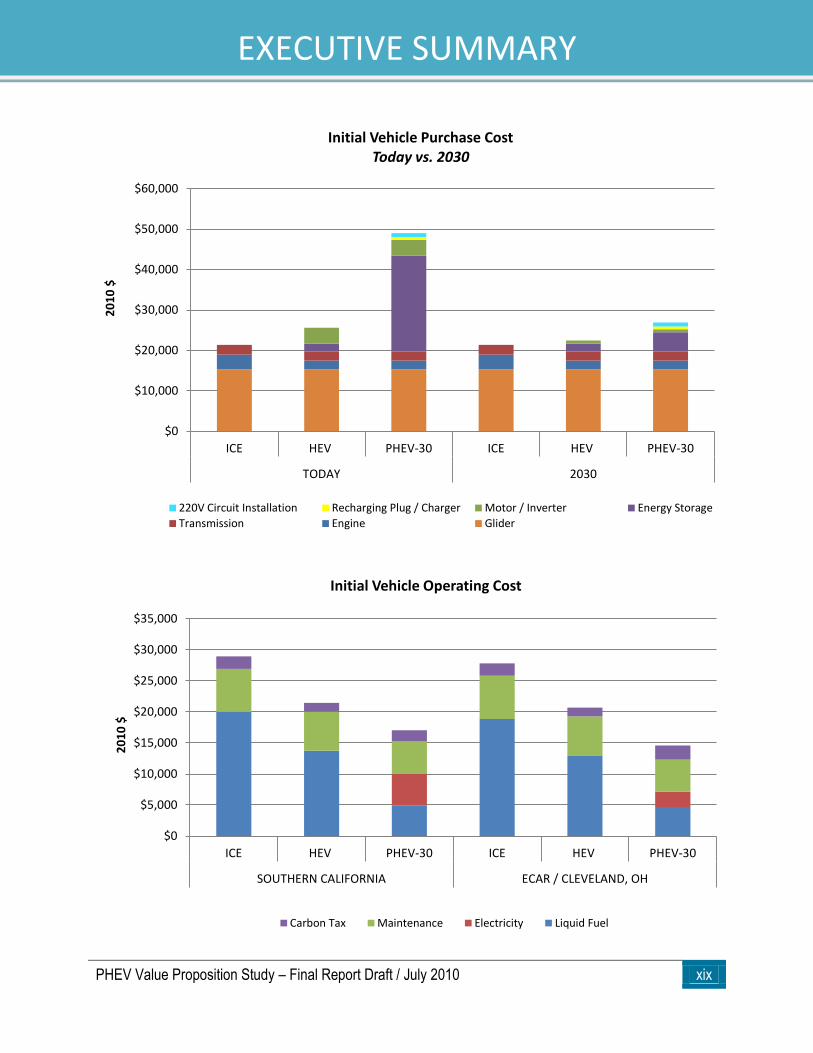
In this study, the project team assessed the value that PHEVs may present to 1) individual consumers, 2) commercial building owners, 3) electric utilities, and 4) the nation. Individual Consumers. To assess benefits to potential customers, the project team investigated whether a PHEV’s net ownership cost would be competitive with comparable vehicles in 2030, such as ICEs and HEVs. To be cost competitive, a PHEV’s operating costs savings over the life of the vehicle (relative to ICEs and HEVs) must outweigh, or nearly outweigh, the PHEV’s initial price premium. First, the purchase price was projected for each vehicle type in 2030 by summing the anticipated individual component prices for this timeframe. When the individual component costs are combined for each vehicle type, ICEs exhibit the least expensive initial cost of $21,400, which is not expected to vary significantly through 2030 (when using 2010 price points). HEVs, however, are expected to decrease in cost by $3,200 down to $22,450 because of
xviii PHEV Value Proposition Study – Final Report Draft / July 2010
EXECUTIVE SUMMARY
improvements in power electronics and electric machinery (PE&EM). PHEVs will experience the most dramatic cost reduction from $49,800 in 2010 to $26,925 in 2030 (primarily decreases in battery cost). With these cost reductions, HEVs and PHEV-30s are expected to have a price premium of approximately $1,050 and $5,535, respectively, relative to ICEs in 2030. Current vehicle purchase costs are also shown in the figure on the following page to provide a frame of reference for anticipated technology advancements (particularly in energy storage) and economies of scale expected to occur during the next two decades. As shown in the figure, transmission and engine components are believed to be near maturity, so no relative cost reductions are expected from these components in the future. For purposes of this study, the price of an ICE in 2030 has been held constant to demonstrate individual component cost reductions anticipated in HEVs and PHEVs. This means that a reduction in manufactured cost of components made from lightweight materials will be necessary to realize a 30% weight reduction of the glider while maintaining a constant glider cost. In addition, PHEV-30 and select HEV models will qualify for temporary government incentives (e.g., vehicle tax credits, alternative fuel infrastructure tax credits) in 2010. For comparison purposes, these were not applied. See the ―Initial Vehicle Purchase Cost‖ figure on the following page for a graphical comparison of estimated purchase cost for each vehicle type in 2030. Next, the operating costs for each vehicle were projected using predictions from the PHEV VPS Workshop for fuel and electricity prices, carbon tax rates, and scheduled maintenance fees. As shown in the ―Initial Vehicle Operating Cost‖ figure, the PHEV-30 presents significant savings in operating costs over the vehicle’s anticipated lifetime of 10 years. Specifically, a PHEV-30 can save between $11,900 and $13,250 relative to an ICE and between $4,425 and $6,100 relative to an HEV in operating costs over the lifetime of the vehicle (using 2010 price points ). The most dramatic savings that PHEVs offer over ICEs are achieved by replacing the majority of liquid fuel with more cost-efficient electricity stored in its battery. To a lesser extent, HEVs can also use supplementary on-board stored electrical energy to minimize liquid fuel consumption. Since the cost to own and operate a PHEV is very comparable to that of an HEV during the life of the vehicle, non-monetary benefits that are unique to PHEVs may play a critical role in attracting prospective buyers. Several surveys have been conducted by universities – primarily the University of Michigan and the University of California, Davis, – to assess consumer interest in owning or paying extra for vehicles with certain novel intangible attributes. Results from these and other surveys were used in this study to estimate the qualitative value of these benefits. Below are value propositions identified by workshop participants and the project team that may influence consumer buying habits even though they are generally not reflected in the price tag of a PHEV:
Emergency back-up power
Charging versatility
Access to electrical outlet
Convenient public charging locations
Recognition of social responsibility
Convenience of smart phone applications
Additional comfort from preconditioning
Fewer trips to the gas station
Absence of range anxiety
A PHEV-30 CAN SAVE
BETWEEN $11,900 AND
$13,250 (RELATIVE TO AN
ICE) AND BETWEEN $4,425
AND $6,100 (RELATIVE TO AN
HEV) IN OPERATING COSTS
OVER THE LIFETIME OF THE
VEHICLE (IN 2010 DOLLARS).
PHEV Value Proposition Study – Final Report Draft / July 2010 xix
EXECUTIVE SUMMARY
$0
$10,000
$20,000
$30,000
$40,000
$50,000
$60,000
ICE HEV PHEV-30 ICE HEV PHEV-30
TODAY 2030
20
10
$
Initial Vehicle Purchase Cost Today vs. 2030
220V Circuit Installation Recharging Plug / Charger Motor / Inverter Energy Storage
Transmission Engine Glider
$0
$5,000
$10,000
$15,000
$20,000
$25,000
$30,000
$35,000
ICE HEV PHEV-30 ICE HEV PHEV-30
SOUTHERN CALIFORNIA ECAR / CLEVELAND, OH
20
10
$
Initial Vehicle Operating Cost
Carbon Tax Maintenance Electricity Liquid Fuel
xx PHEV Value Proposition Study – Final Report Draft / July 2010
EXECUTIVE SUMMARY
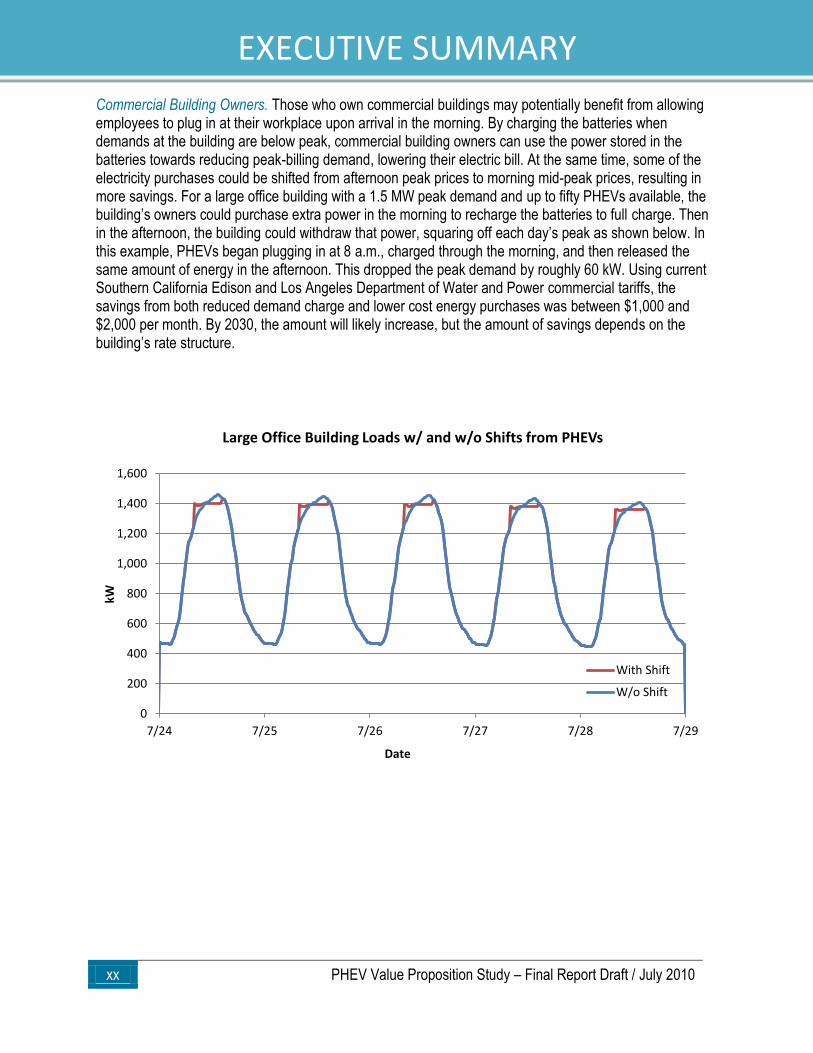
Commercial Building Owners. Those who own commercial buildings may potentially benefit from allowing employees to plug in at their workplace upon arrival in the morning. By charging the batteries when demands at the building are below peak, commercial building owners can use the power stored in the batteries towards reducing peak-billing demand, lowering their electric bill. At the same time, some of the electricity purchases could be shifted from afternoon peak prices to morning mid-peak prices, resulting in more savings. For a large office building with a 1.5 MW peak demand and up to fifty PHEVs available, the building’s owners could purchase extra power in the morning to recharge the batteries to full charge. Then in the afternoon, the building could withdraw that power, squaring off each day’s peak as shown below. In this example, PHEVs began plugging in at 8 a.m., charged through the morning, and then released the same amount of energy in the afternoon. This dropped the peak demand by roughly 60 kW. Using current Southern California Edison and Los Angeles Department of Water and Power commercial tariffs, the savings from both reduced demand charge and lower cost energy purchases was between $1,000 and $2,000 per month. By 2030, the amount will likely increase, but the amount of savings depends on the building’s rate structure.
0
200
400
600
800
1,000
1,200
1,400
1,600
7/24 7/25 7/26 7/27 7/28 7/29
kW
Date
Large Office Building Loads w/ and w/o Shifts from PHEVs
With Shift
W/o Shift
PHEV Value Proposition Study – Final Report Draft / July 2010 xxi
EXECUTIVE SUMMARY
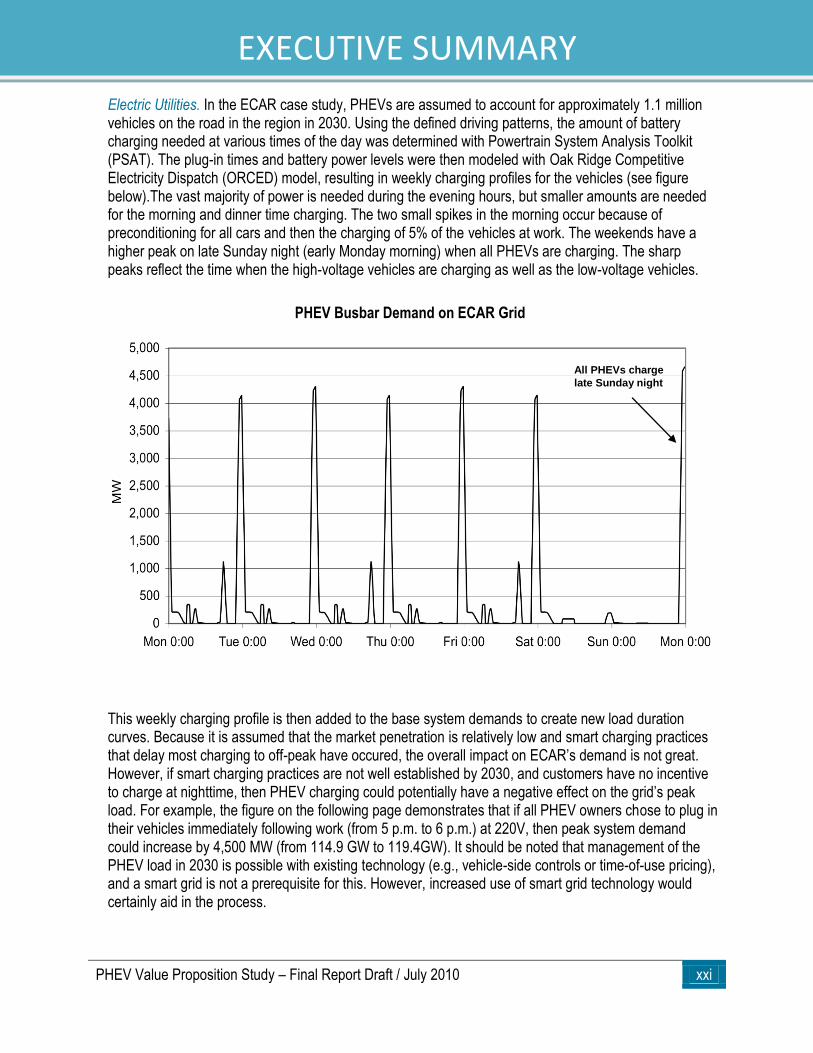
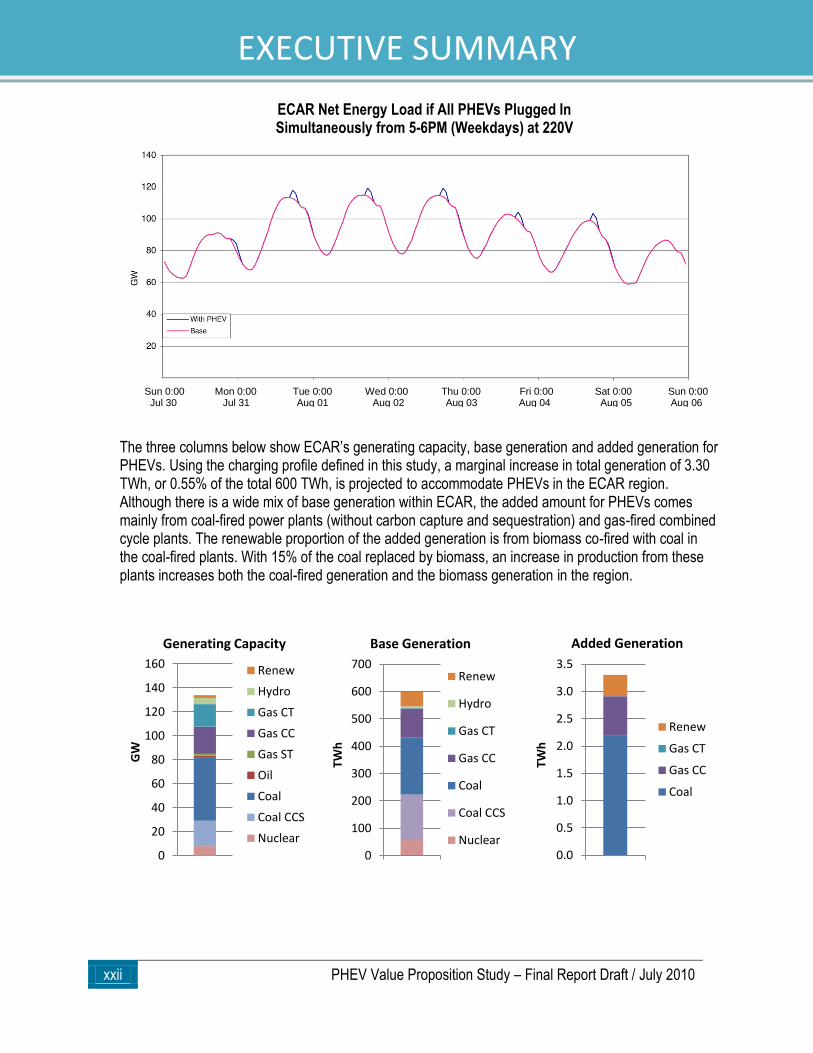
Electric Utilities. In the ECAR case study, PHEVs are assumed to account for approximately 1.1 million vehicles on the road in the region in 2030. Using the defined driving patterns, the amount of battery charging needed at various times of the day was determined with Powertrain System Analysis Toolkit (PSAT). The plug-in times and battery power levels were then modeled with Oak Ridge Competitive Electricity Dispatch (ORCED) model, resulting in weekly charging profiles for the vehicles (see figure below).The vast majority of power is needed during the evening hours, but smaller amounts are needed for the morning and dinner time charging. The two small spikes in the morning occur because of preconditioning for all cars and then the charging of 5% of the vehicles at work. The weekends have a higher peak on late Sunday night (early Monday morning) when all PHEVs are charging. The sharp peaks reflect the time when the high-voltage vehicles are charging as well as the low-voltage vehicles.
This weekly charging profile is then added to the base system demands to create new load duration curves. Because it is assumed that the market penetration is relatively low and smart charging practices that delay most charging to off-peak have occured, the overall impact on ECAR’s demand is not great. However, if smart charging practices are not well established by 2030, and customers have no incentive to charge at nighttime, then PHEV charging could potentially have a negative effect on the grid’s peak load. For example, the figure on the following page demonstrates that if all PHEV owners chose to plug in their vehicles immediately following work (from 5 p.m. to 6 p.m.) at 220V, then peak system demand could increase by 4,500 MW (from 114.9 GW to 119.4GW). It should be noted that management of the PHEV load in 2030 is possible with existing technology (e.g., vehicle-side controls or time-of-use pricing), and a smart grid is not a prerequisite for this. However, increased use of smart grid technology would certainly aid in the process.
PHEV Busbar Demand on ECAR Grid
All PHEVs charge
late Sunday night
xxii PHEV Value Proposition Study – Final Report Draft / July 2010
EXECUTIVE SUMMARY
The three columns below show ECAR’s generating capacity, base generation and added generation for PHEVs. Using the charging profile defined in this study, a marginal increase in total generation of 3.30 TWh, or 0.55% of the total 600 TWh, is projected to accommodate PHEVs in the ECAR region. Although there is a wide mix of base generation within ECAR, the added amount for PHEVs comes mainly from coal-fired power plants (without carbon capture and sequestration) and gas-fired combined cycle plants. The renewable proportion of the added generation is from biomass co-fired with coal in the coal-fired plants. With 15% of the coal replaced by biomass, an increase in production from these plants increases both the coal-fired generation and the biomass generation in the region.
0
20
40
60
80
100
120
140
160
GW
Generating Capacity
Renew
Hydro
Gas CT
Gas CC
Gas ST
Oil
Coal
Coal CCS
Nuclear
0
100
200
300
400
500
600
700
TWh
Base Generation
Renew
Hydro
Gas CT
Gas CC
Coal
Coal CCS
Nuclear0.0
0.5
1.0
1.5
2.0
2.5
3.0
3.5
TWh
Added Generation
Renew
Gas CT
Gas CC
Coal
ECAR Net Energy Load if All PHEVs Plugged In Simultaneously from 5-6PM (Weekdays) at 220V
Sun 0:00 Mon 0:00 Tue 0:00 Wed 0:00 Thu 0:00 Fri 0:00 Sat 0:00 Sun 0:00 Jul 30 Jul 31 Aug 01 Aug 02 Aug 03 Aug 04 Aug 05 Aug 06
PHEV Value Proposition Study – Final Report Draft / July 2010 xxiii
EXECUTIVE SUMMARY
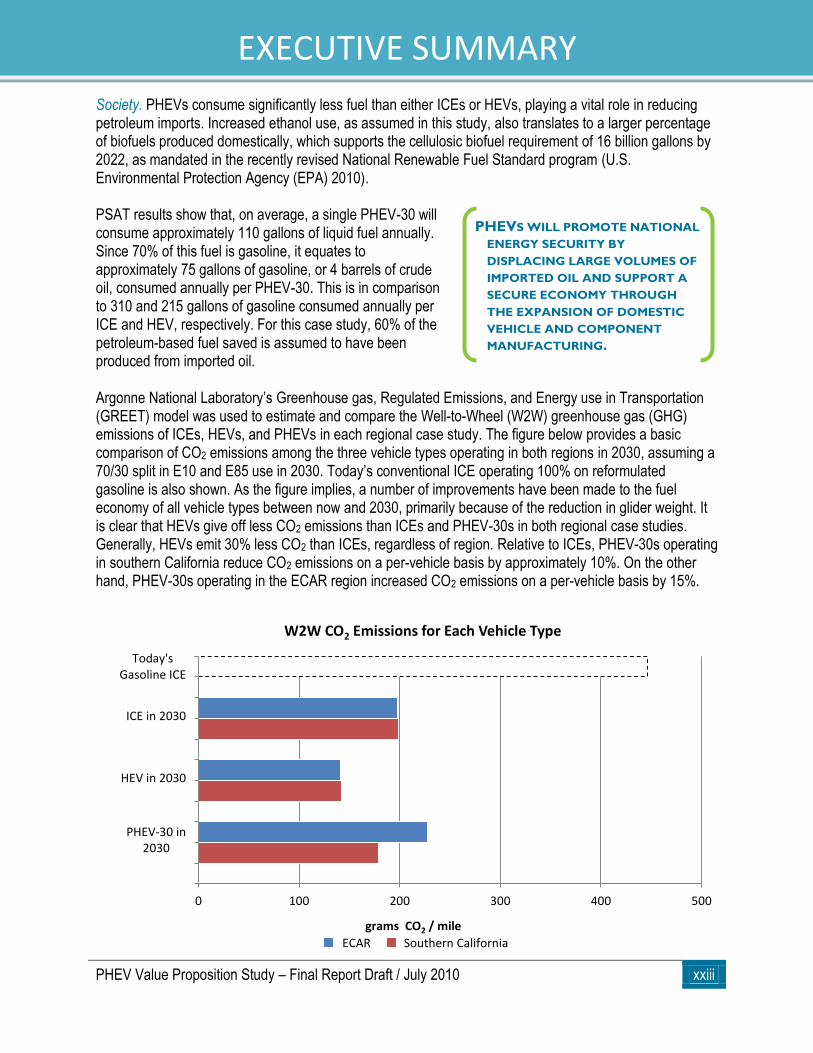
Society. PHEVs consume significantly less fuel than either ICEs or HEVs, playing a vital role in reducing petroleum imports. Increased ethanol use, as assumed in this study, also translates to a larger percentage of biofuels produced domestically, which supports the cellulosic biofuel requirement of 16 billion gallons by 2022, as mandated in the recently revised National Renewable Fuel Standard program (U.S. Environmental Protection Agency (EPA) 2010). PSAT results show that, on average, a single PHEV-30 will consume approximately 110 gallons of liquid fuel annually. Since 70% of this fuel is gasoline, it equates to approximately 75 gallons of gasoline, or 4 barrels of crude oil, consumed annually per PHEV-30. This is in comparison to 310 and 215 gallons of gasoline consumed annually per ICE and HEV, respectively. For this case study, 60% of the petroleum-based fuel saved is assumed to have been produced from imported oil. Argonne National Laboratory’s Greenhouse gas, Regulated Emissions, and Energy use in Transportation (GREET) model was used to estimate and compare the Well-to-Wheel (W2W) greenhouse gas (GHG) emissions of ICEs, HEVs, and PHEVs in each regional case study. The figure below provides a basic comparison of CO2 emissions among the three vehicle types operating in both regions in 2030, assuming a 70/30 split in E10 and E85 use in 2030. Today’s conventional ICE operating 100% on reformulated gasoline is also shown. As the figure implies, a number of improvements have been made to the fuel economy of all vehicle types between now and 2030, primarily because of the reduction in glider weight. It is clear that HEVs give off less CO2 emissions than ICEs and PHEV-30s in both regional case studies. Generally, HEVs emit 30% less CO2 than ICEs, regardless of region. Relative to ICEs, PHEV-30s operating in southern California reduce CO2 emissions on a per-vehicle basis by approximately 10%. On the other hand, PHEV-30s operating in the ECAR region increased CO2 emissions on a per-vehicle basis by 15%.
0 100 200 300 400 500
Today'sGasoline ICE
ICE in 2030
HEV in 2030
PHEV-30 in2030
grams CO2 / mile
W2W CO2 Emissions for Each Vehicle Type
ECAR Southern California
PHEVS WILL PROMOTE NATIONAL
ENERGY SECURITY BY
DISPLACING LARGE VOLUMES OF
IMPORTED OIL AND SUPPORT A
SECURE ECONOMY THROUGH
THE EXPANSION OF DOMESTIC
VEHICLE AND COMPONENT
MANUFACTURING.
xxiv PHEV Value Proposition Study – Final Report Draft / July 2010
EXECUTIVE SUMMARY
CONCLUSIONS
Based on this study’s thorough assessment of PHEV value propositions, the project team concludes that PHEVs and other plug-in vehicles may offer many valuable attributes to society as a whole, utilities, business owners, and individual consumers. PHEVs will promote national energy security by displacing large volumes of imported oil and support a secure economy through the expansion of domestic vehicle and component manufacturing. As smart grid technology matures, utilities may be able to better maximize use of off-peak energy and better manage loads throughout their most demanding seasons. However, smart grid technology is not a prerequisite for realizing the benefits of PHEVs. Business owners will likely be able to draw energy from grid-connected PHEVs to help shave the building’s peak loads. Consumers can be assured that the savings that they would accrue over the lifetime of their PHEV (assumed to be 10 years) will likely be sufficient to offset the initial price premium relative to more comparable ICE vehicles in the 2030 timeframe.
Aside from the promising attributes, PHEVs and other plug-in vehicles still face several barriers to commercial acceptance between now and 2030. First, the cost of energy storage, charging equipment, and PE&EM components must continue to descend to competitive levels, such as the ones assumed for the year 2030 in this study, within the next 10 to 20 years. Second, as this study’s GREET modeling results indicate, PHEVs should not be expected to significantly reduce carbon emissions relative to comparable vehicles until they are powered primarily by non-carbon energy sources. Operating in regions with a high percentage of non- or low-carbon energy sources (e.g., renewable, nuclear, and natural gas) would ultimately help improve the long-term environmental impact of PHEVs. Consumers. From a cost standpoint, a PHEV would be considered commercially viable if the vehicle’s reduced operating costs match or outweigh its purchase price premium compared with an ICE or HEV. The figure on the following page summarizes the total ownership cost of 150,000 miles driven for each vehicle type in their respective geographic regions. In both regions, PHEV-30s are more cost effective over the vehicle lifetime by several thousands of dollars compared to ICEs, which translates to an 8%-10% reduction in overall net ownership cost over 10 years. Because of California’s high electricity costs and state sales tax, PHEV-30s are slightly more expensive to own than HEVs in this region; however, they certainly appear to be cost competitive. In the ECAR region, lower electricity costs and state sales taxes result in the PHEV-30s being the most cost-effective of all vehicles investigated.
IN BOTH REGIONS, PHEV-
30S ARE MORE COST
EFFECTIVE OVER THE
VEHICLE LIFETIME BY
SEVERAL THOUSANDS OF
DOLLARS COMPARED TO
COMPARABLE ICES, WHICH
TRANSLATES TO AN 8-10%
REDUCTION IN OVERALL
NET OWNERSHIP COST
OVER 10 YEARS.
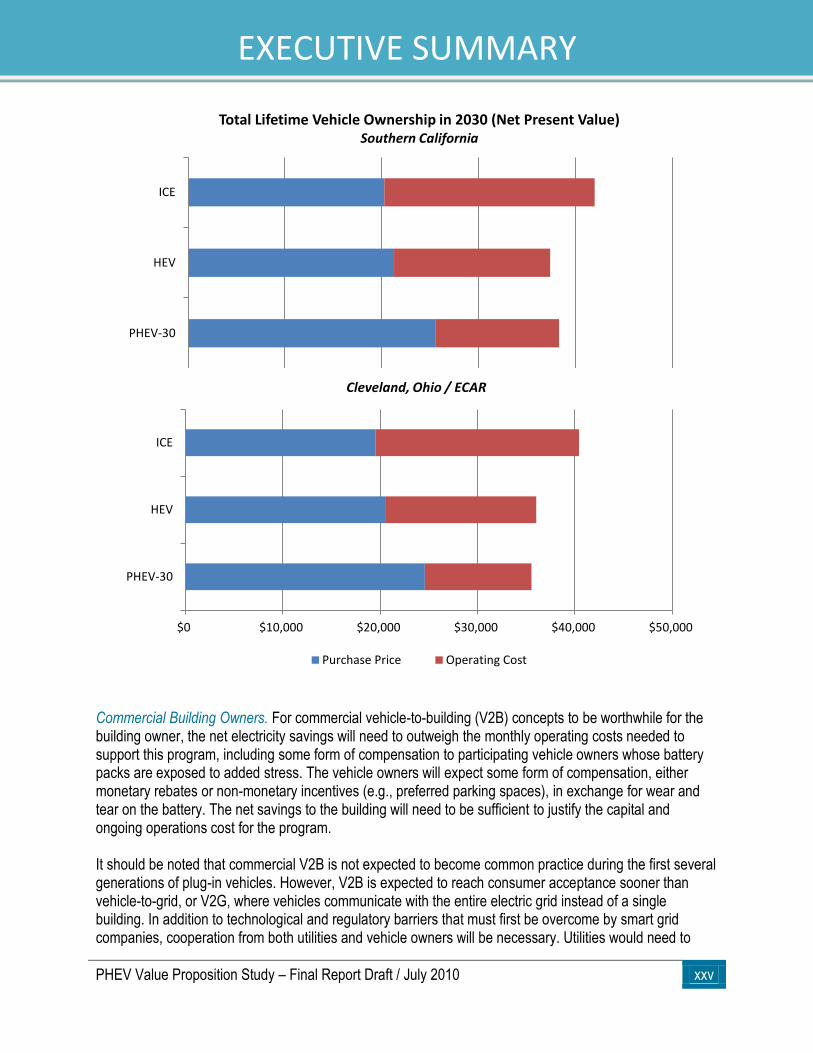
PHEV Value Proposition Study – Final Report Draft / July 2010 xxv
EXECUTIVE SUMMARY
Commercial Building Owners. For commercial vehicle-to-building (V2B) concepts to be worthwhile for the building owner, the net electricity savings will need to outweigh the monthly operating costs needed to support this program, including some form of compensation to participating vehicle owners whose battery packs are exposed to added stress. The vehicle owners will expect some form of compensation, either monetary rebates or non-monetary incentives (e.g., preferred parking spaces), in exchange for wear and tear on the battery. The net savings to the building will need to be sufficient to justify the capital and ongoing operations cost for the program. It should be noted that commercial V2B is not expected to become common practice during the first several generations of plug-in vehicles. However, V2B is expected to reach consumer acceptance sooner than vehicle-to-grid, or V2G, where vehicles communicate with the entire electric grid instead of a single building. In addition to technological and regulatory barriers that must first be overcome by smart grid companies, cooperation from both utilities and vehicle owners will be necessary. Utilities would need to
ICE
HEV
PHEV-30
Total Lifetime Vehicle Ownership in 2030 (Net Present Value) Southern California
$0 $10,000 $20,000 $30,000 $40,000 $50,000
ICE
HEV
PHEV-30
Cleveland, Ohio / ECAR
Purchase Price Operating Cost
xxvi PHEV Value Proposition Study – Final Report Draft / July 2010
EXECUTIVE SUMMARY
adopt and incorporate new software to manage the system in real time. Furthermore, until the level of risk associated with additional battery cycling is better understood, vehicle owners will likely be reluctant to participate in such programs. Finally, owners that participate will expect to have at least the same state of charge (SOC) when they leave work as they did upon arrival. Utilities. From a utility’s perspective, the relatively slow market penetration of PHEVs assumed in this study in combination with smart charging that shifts demands to off-peak times leads to very little impact on overall peak demands, while providing the utility with additional sales during off-peak times. However, if smart charging practices are not well established by 2030, and customers have no incentive to charge in the evening hours, then peak demands could potentially have a negative effect on the grid. Therefore, measures should be in place, such as time clocks with automatic off-peak scheduling, time-of-use pricing or other incentives, to encourage customers to shift to nighttime charging. While the impact of a relatively small PHEV fleet (approximately 1 million on the road in both southern California and ECAR in 2030) on the overall grid load may not be very significant with smart charging implementation, management of local and temporary load distribution requires more attention. For example, neighborhoods with multiple plug-in electric vehicles should be supported by some type of smart charging technology or schedule charging to avoid unnecessary damage to individual transformers. This is an area of research that should be considered for further study. Society. Society’s acceptance of PHEVs could answer the call for our country to reduce its dependence on foreign oil. Case study results show that, on average, a single PHEV-30 will consume approximately 75%, or about 235 gallons, less gasoline per year than ICEs and 65%, or about 140 gallons, less gasoline per year than HEVs. With 60% of oil imported from foreign countries, the southern California fleet of 1 million PHEVs has the potential to reduce imported oil by approximately 7.25 million barrels, or 140 million gallons, annually if the PHEV fleet substituted for ICEs or by approximately 4.25 million barrels, 80 million gallons, annually if the PHEV fleet substituted for HEVs. A similar volume of annually displaced oil imports is also projected within the ECAR region since just more than 1 million PHEVs are expected to be on the road there in 2030. As demonstrated in the southern California case study, PHEVs also have the potential to significantly reduce W2W GHG emissions compared to ICEs, since the electricity is generated from a low-carbon fuel mix. This is not always the case, however, as seen in the coal-dominated ECAR region. To see improvements in GHG emissions, more non-carbon sources should be transitioned into the base and margin mixes. In addition to regional generation mixes, this study’s sensitivity analysis suggested that increased use of E85 can significantly contribute to reduced W2W emissions as well as oil displacement. Vehicle lightweighting, reduction in vehicle miles traveled (VMT), and certain types of carbon taxes can also be used to reduce GHG emissions and oil displacement, albeit to a lesser extent.
CASE STUDY RESULTS SHOW
THAT, ON AVERAGE, A PHEV-
30 WILL CONSUME
APPROXIMATELY 75% LESS
GASOLINE THAN ICES AND
65% LESS GASOLINE THAN
HEVS.
PHEV Value Proposition Study – Final Report Draft / July 2010 xxvii
EXECUTIVE SUMMARY
RECOMMENDATIONS
Both industry and government could take a number of actions and make investments to significantly help PHEVs achieve sustainable commercial success. The project team considered both near and longer term goals in determining these recommendations. Specifically, these goals are to 1) Reach 1 million plug-in vehicles on the road in the United States at the end of the year 2015, and 2) Achieve a sustainable, stable and growing market for PHEVs without need for subsidies or other incentives by 2030. As it considers recommendations and takes action, DOE should coordinate its activities with other federal agencies having a stake and interest in PHEVs. Of particular importance are the EPA, the U.S. Department of Transportation (DOT), the National Institute of Standards and Technology (NIST), and the Federal Energy Regulatory Commission (FERC). Partnerships with organizations representing vehicle manufacturers, major vehicle component providers, and the electric power industry – those that enhance the quality and transparency of communications – can be a key factor in improving the productivity of PHEV investments by both government and industry. Technology advancement. Continued federal research and development (R&D) support for PHEV batteries is critical to help assure the availability of PHEV batteries that meet the required levels of durability, quality, and safety at an affordable price. Power electronics, electrical machine, and energy-efficient powertrain technologies are also key factors in competitive, high performance electric drive vehicles. Additionally, agencies at all levels should continue to support R&D of PHEV product design, new materials, and innovative manufacturing processes to help enhance development of exceptional PHEVs. If concentrated groups of consumers that own PHEVs plan to use 220V charging systems during peak demand periods, local electricity distribution systems may not be prepared to support the extra loads. DOE, working with the electric utility industry, should support continued development of technologies related to electricity delivery, monitoring, charging systems, and pricing to educate PHEV owners to avoid charging vehicles during peak periods. Pushing the initiatives, including smart grid, will make the potential benefits to PHEV owners a reality. Those are management of distributed resources and loads, feeder monitoring, time-of-day pricing, separate rate structures and alternative billing options, plus benefits for electricity providers like optimal dispatching schemes. DOE should continue to seek objective, unbiased input from industry leaders regarding its plans for support of technology R&D, as well as investments of public funds for other PHEV-related purposes. Ideally, those entities supplying vehicles and components for sale in the U.S. and those providing electricity for vehicles should have a means to express their views and perspectives. Government Incentive Policies. Unless petroleum prices increase significantly and permanently, vehicle OEMs, component suppliers and their financiers are expected to be hesitant about making the large investments required to produce vehicles using less petroleum. Concern about continued government policy support, for both vehicle producers and consumers, will also contribute to uncertainty in the private investor. In the next decade, industry PHEV production and consumer demand for electric and other vehicles using significantly less petroleum will be strongly influenced by government policies. Before undertaking new government-funded analyses that investigate the energy and environmental impacts of PHEVs, DOE should review and compare all PHEV analytical initiatives, both government and privately funded. These objectives should be: 1) an explanation of differences in results, 2) a comparison of public costs and benefits associated with the recommendations resulting from each analysis, and (3)
xxviii PHEV Value Proposition Study – Final Report Draft / July 2010
EXECUTIVE SUMMARY
examinations of key assumptions that drive each study’s conclusions and recommendations. Creation of a report that compares recently published studies on the environmental impacts of ICEs, HEVs, PHEVs (series and parallel), and EVs would be especially valuable to DOE since there is much debate on the subject.
Auto OEMs may be privy to another round of government-funded manufacturing incentives to continue the ramp up of advanced R&D and plans for new manufacturing facilities that will help OEMs further improve fuel economy and reduce vehicle component costs. This will contribute to a sustainable PHEV market. Potential incentives for electric utilities include demonstration funding for public charging installations and capability of smart metering and time-differentiated rates, both in support of PHEV infrastructure growth. In addition, government policies should support and promote the expansion of zero-to-low carbon-emitting electric generation capacity to help maximize the environmental benefits achievable with PHEVs. DOE should also work with electric utility regulators to establish provisions to enable utility investors to recover the costs of infrastructure needed to support PHEV charging.
Incentives for PHEV consumers should be in place to help offset the price differential between PHEVs and more conventional powertrains. Specifically, the existing electric drive vehicle tax credit should continue for the periods specified in ARRA. Ongoing analyses should be conducted of incentives with the most potential for supporting continued and cost-effective PHEV sales growth in the market introduction phase.
Education and Training. Introduction of plug-in electric drive vehicles in large numbers would be a significant paradigm shift in both vehicle design and fueling practices. Therefore, government-funded support for consumer education should be continued in preparation for the introduction of PHEVs into regional markets. Potential owners should be well aware of the factors which determine whether a PHEV is a wise investment for their particular lifestyle. They should also be knowledgeable about the public benefits and costs of advanced technology transportation options. Furthermore, PHEV owners will need to understand how to prolong the life of their battery pack.
To support a growing market for PHEVs, the vehicle production industry must undertake an ambitious effort to transition toward the manufacturing, sales, and servicing of electrically-powered products. The U.S. educational system can support and accelerate the transition to electric drive vehicles by training scientists, engineers, and technicians with the requisite skills. Certifications may be required for mechanics to service any plug-in vehicles. On a competitive basis, government-funded support for training should be provided to educational institutions in the first years of commercial PHEV introduction.
Codes and Standards. The development and adoption of relevant codes and standards will be important to the successful introduction of commercialized PHEVs. There are many entities who have a stake in what will become the final codes and standards content. These include vehicle, equipment and battery manufacturers, power companies and utilities involved in the recharging infrastructure, regulatory authorities and consensus standards organizations. Standards are required to assure safety of PHEVs and the electricity infrastructure with which they are connected, and the charging infrastructure interoperability with products of vehicle manufacturers. Standardized electronic protocols must be established for communications between vehicles and the electric power grid. DOE, working with NIST and other appropriate federal agencies, should continue to be an active participant in development of model codes and standards.
PHEV Value Proposition Study – Final Report Draft / July 2010 xxix
FREQUENTLY ASKED QUESTIONS Q: Why choose the 2030 time horizon instead of 2020, which may be more predictable?
A: Originally, 2020 was anticipated for this study since early generation plug-in hybrid electric vehicles (PHEV) are expected to be mass produced by this time. However, PHEV Value Proposition Study Workshop (VPS) feedback indicated that complementary technologies of interest (e.g., vehicle-to-building, vehicle-to-grid) were unlikely to be mainstream by 2020. With many potential value propositions associated with these technologies, it was recommended that the project team extend the time horizon to 2030 when these technologies may become more market-ready. Q: Why was a PHEV-30 chosen for the regional case studies? How does this compare to other PHEVs with other all-electric ranges (AER)? A: PHEVs with a 30-mile AER were chosen to be analyzed in the two regional case studies as a direct result of workshop feedback. However, PHEVs with a variety of AERs are expected to be available prior to 2030. To assess how PHEVs with other AERs compared to PHEV-30s from an economic and societal standpoint, PHEV with three additional AERs – 10-mile, 20-mile, and 40-mile – were investigated in this study’s Sensitivity Analysis (see Chapter 5 for results). Q: Why was E30 used for this study’s modeling purposes? Were other fuel mixes considered?
A: With guidance from workshop participants, the project team assumed that 30% of all transportation fuel consumed in 2030 will be cellulosic ethanol, which also supports the cellulosic biofuel requirement of 16 billion gallons by 2022, as mandated in the recently revised National Renewable Fuel Standard program (EPA 2010). This translated to roughly a 70/30 split of E10 and E85 use in 2030. For modeling purposes, this split was approximated by inputting an average blend of E30 into this study’s models; however, this does not mean that an E30 blend is dominant in 2030. For comparison purposes, all three vehicle types were analyzed using an E10 and E85 average blend in this study’s Sensitivity Analysis (see Chapter 5 for results). Q: Were additional costs included to account for the 30% weight reduction in all three vehicle types?
A: To achieve a 30% vehicle weight reduction (as outlined in the DOE’s Government Performance and Results Act of 1993 (GPRA) Study Results) and, consequently, a fuel economy of 35 mpg, an incremental cost across the board for all three 2030 vehicle types is likely. In this study, the cost to incorporate these weight reductions was assumed to be roughly the same for all three vehicles types since they each possess the same basic glider design. Therefore, it did not affect the price differentials for the three vehicle types. Q: What actions must take place for PHEVs to reach 10% of annual light-duty vehicle sales by 2030?
A: A PHEV Market Introduction Study (MIS) was performed between Phases 1 and 2 to project PHEV market penetration under a “current policy case” between 2010 and 2020. Sales projections were also made for 10 additional policies, incentives, and regulations when superposed on the “current policy case” to determine the most promising methods for accelerating near-term sales. In this case, which includes the
xxx PHEV Value Proposition Study – Final Report Draft / July 2010
existing Plug-in Vehicle Tax Credits and $2.4 billion in battery manufacturing and demonstration grants, PHEVs are only projected to account for 1.6% of annual sales. However, several of the additional policy options investigated in the MIS have the potential to achieve between 10% and 20% of annual sales in 2020, assuming the supply is sufficient. Southern California is expected to have a high percentage of early adopters, which may contribute to additional sales in the region. The 2020-2030 timeframe was not investigated in the study since the primary focus was on near-term sales; however, a steady increase in sales is expected between 2020 and 2030 since PHEVs will continue to become more cost-competitive during this period. Q: Why are time-differentiated electricity rates not used to calculate electricity costs in the southern California case study?
A: Actual time-differentiated electricity rates could not be obtained for the southern California region. Therefore, an average cost per kWh of electricity consumed by PHEVs (mostly during off-peak hours) was estimated using the regional generation mix data. Since gas-fired combined cycle plants are most likely to set the wholesale price when PHEVs would primarily be charging, the project team used the efficiencies for the region’s different plants and a natural gas price of $14/mmBtu (double of the Annual Energy Outlook 2008 reference price) to estimate an average wholesale price of electricity during off-peak hours to be $0.083/kWh. (This is prior to applying a carbon tax to the electricity rate). A $0.10 /kWh for delivery services was also included, which is similar to the price that some California utilities use for their current electric vehicle rates. Therefore, an average off-peak electricity rate of $0.183/kWh was used in the southern California case study. Q: Why is a 14kWh battery needed when only approximately 8kWh will be utilized?
A: To achieve a 10-year (~150,000 mile) life, PHEV batteries are commonly oversized to avoid certain abuses. For example, the battery must not be overcharged; therefore, a safety margin of 5% capacity, or 0.7 kWh in this case, was added to avoid operation above 95% state of charge (SOC). Similarly, if Lithium-ion (Li-ion) cells are discharged or operated at a level lower than about 25% SOC, their efficiency and performance is degraded, plus significant heating and aging will occur. The “no operation region” equivalent of 3.5 kWh was established in this study to avoid going below this level. Finally, an annual degradation of 2% is accounted for on the front end to ensure a 30-mile AER throughout the entire lifetime of the battery, and another 2.0 kWh was added to the overall capacity. The battery with 7.8 kWh of usable capacity (necessary for a 30-mile AER) was sized at 14 kWh to accommodate the safety margin, “no operation region”, and degradation buffer. Q: Why was the PHEV-30 battery constrained to an AER of 30 miles when a diminishing reserve capacity was accessible in the initial years?
A: To account for the anticipated degradation over a 10-year lifetime, 2 kWh was added to the battery’s capacity in this study to maintain the advertised 30-mile range for the entire 10 years; this essentially gives the PHEV a 35-mile AER in the initial year of operation. For this study, the AER was constrained to 30 miles throughout its lifetime to maintain simplicity in the project team’s modeling efforts. An alternative battery design that utilizes this extra capacity early in the PHEV’s life is suggested in Section 4.5.2. It should be noted that if this alternative design is used, advertising the vehicle as a PHEV-35 would be misleading since its AER will degrade 0.5 miles each year after purchase.
PHEV Value Proposition Study – Final Report Draft / July 2010 xxxi
Q: Has a disposal fee for end-of-life batteries been considered or included in this study?
A: A disposal fee was not included in this study, because various utilities have displayed significant interest in acquiring end-of-life PHEV batteries once they become available for use in secondary applications. Such applications include load leveling, transmission support, renewables firming, etc. Unlike lead-acid batteries that only offer materials salvaging through recycling at end-of-life, Li-ion batteries have years of application remaining beyond automotive use. Therefore, this study assumes no disposal fee to the vehicle owner. Q: Is the battery cost assumption for 2030 realistic?
A: The 2030 battery cost assumption was derived from the DOE’s 2007 FreedomCAR and Vehicle Technologies Program Multi-Year Program Plan (MYPP). Based on preliminary feedback of this report, some have considered the cost target to be quite aggressive while others believe the target will be met long before 2030. Overall, this study’s battery cost assumption appears to fall within this spectrum of feedback. Q: Have various “types” of travelers that result in a broad vehicle miles traveled (VMT) range been included in this study?
A: The collection of drive cycles used in this study was chosen to best represent the average commuting behavior of drivers in southern California and the Cleveland, Ohio, areas. While individual Powertrain Systems Analysis Toolkit (PSAT) simulations were not run on individual “types” of drivers (e.g., Driver A, Driver B), the average commuting style used in this study accounted for overnight charging, opportunistic charging practiced by a defined percentage of PHEV owners, and a variety of driving distances throughout the week ranging from short, all-electric trips to longer weekend trips of more than 100 miles. Q: Why does the PHEV Market Introduction Study (MIS) project higher sales than other studies?
A: Results of the PHEV MIS may seem optimistic relative to similar studies for several reasons. First, and probably the most significant reason, no capacity constraints were incorporated into the model simulations. If the consumer demand was present, then PHEVs were available. Second, the “high technology case” was exercised in the Oak Ridge National Laboratory’s (ORNL) Market Acceptance of Advanced Automotive Technologies (MA3T) model, which accelerates the maturing of new vehicle technologies to more quickly drive down prices (primarily energy storage and power electronics technologies). This case was selected to reflect large volumes of financial support to the automotive industry by the government that is expected to accelerate the cost competitiveness of PHEVs. Third, electric vehicles (EV) were outside of the PHEV MIS’s scope, so it is a fair assumption that EVs may comprise a portion of the projected PHEV sales. Finally, PHEV-12s dominated overall PHEV sales, which presents uncertainty since only one automotive manufacturer (Toyota) has production plans for a PHEV with an AER close to 12 miles. Q: Were U.S. Environmental Protection Agency’s (EPA) recent fuel economy regulations accounted for in this study?
A: The recently implemented EPA regulations that present a revised method for calculating city and highway fuel economy estimates for new passenger cars and light trucks were not included in this study’s PSAT simulations. EPA’s new estimate regulations, which use a vehicle-specific “5-cycle” fuel economy test, are generally expected to drop previous city fuel economy values by about 8% - 15% for the majority of internal combustion engines (ICE) and approximately 20% - 30% for gasoline-electric vehicles (EPA 2006). These reductions in estimated fuel economy are believed to better represent real-world driving and should be considered for future studies on the topic.

xxxii PHEV Value Proposition Study – Final Report Draft / July 2010
This page intentionally left blank.
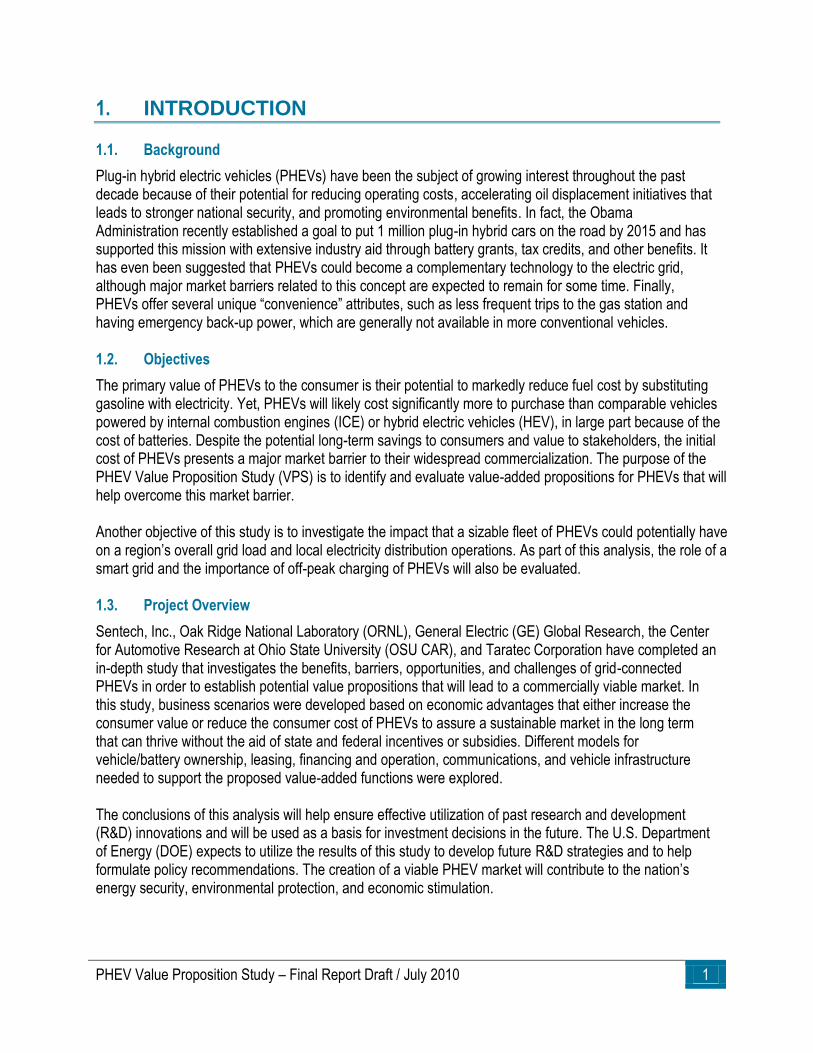
PHEV Value Proposition Study – Final Report Draft / July 2010 1
1. INTRODUCTION
1.1. Background
Plug-in hybrid electric vehicles (PHEVs) have been the subject of growing interest throughout the past decade because of their potential for reducing operating costs, accelerating oil displacement initiatives that leads to stronger national security, and promoting environmental benefits. In fact, the Obama Administration recently established a goal to put 1 million plug-in hybrid cars on the road by 2015 and has supported this mission with extensive industry aid through battery grants, tax credits, and other benefits. It has even been suggested that PHEVs could become a complementary technology to the electric grid, although major market barriers related to this concept are expected to remain for some time. Finally, PHEVs offer several unique ―convenience‖ attributes, such as less frequent trips to the gas station and having emergency back-up power, which are generally not available in more conventional vehicles.
1.2. Objectives
The primary value of PHEVs to the consumer is their potential to markedly reduce fuel cost by substituting gasoline with electricity. Yet, PHEVs will likely cost significantly more to purchase than comparable vehicles powered by internal combustion engines (ICE) or hybrid electric vehicles (HEV), in large part because of the cost of batteries. Despite the potential long-term savings to consumers and value to stakeholders, the initial cost of PHEVs presents a major market barrier to their widespread commercialization. The purpose of the PHEV Value Proposition Study (VPS) is to identify and evaluate value-added propositions for PHEVs that will help overcome this market barrier. Another objective of this study is to investigate the impact that a sizable fleet of PHEVs could potentially have on a region’s overall grid load and local electricity distribution operations. As part of this analysis, the role of a smart grid and the importance of off-peak charging of PHEVs will also be evaluated. 1.3. Project Overview
Sentech, Inc., Oak Ridge National Laboratory (ORNL), General Electric (GE) Global Research, the Center for Automotive Research at Ohio State University (OSU CAR), and Taratec Corporation have completed an in-depth study that investigates the benefits, barriers, opportunities, and challenges of grid-connected PHEVs in order to establish potential value propositions that will lead to a commercially viable market. In this study, business scenarios were developed based on economic advantages that either increase the consumer value or reduce the consumer cost of PHEVs to assure a sustainable market in the long term that can thrive without the aid of state and federal incentives or subsidies. Different models for vehicle/battery ownership, leasing, financing and operation, communications, and vehicle infrastructure needed to support the proposed value-added functions were explored. The conclusions of this analysis will help ensure effective utilization of past research and development (R&D) innovations and will be used as a basis for investment decisions in the future. The U.S. Department of Energy (DOE) expects to utilize the results of this study to develop future R&D strategies and to help formulate policy recommendations. The creation of a viable PHEV market will contribute to the nation’s energy security, environmental protection, and economic stimulation.
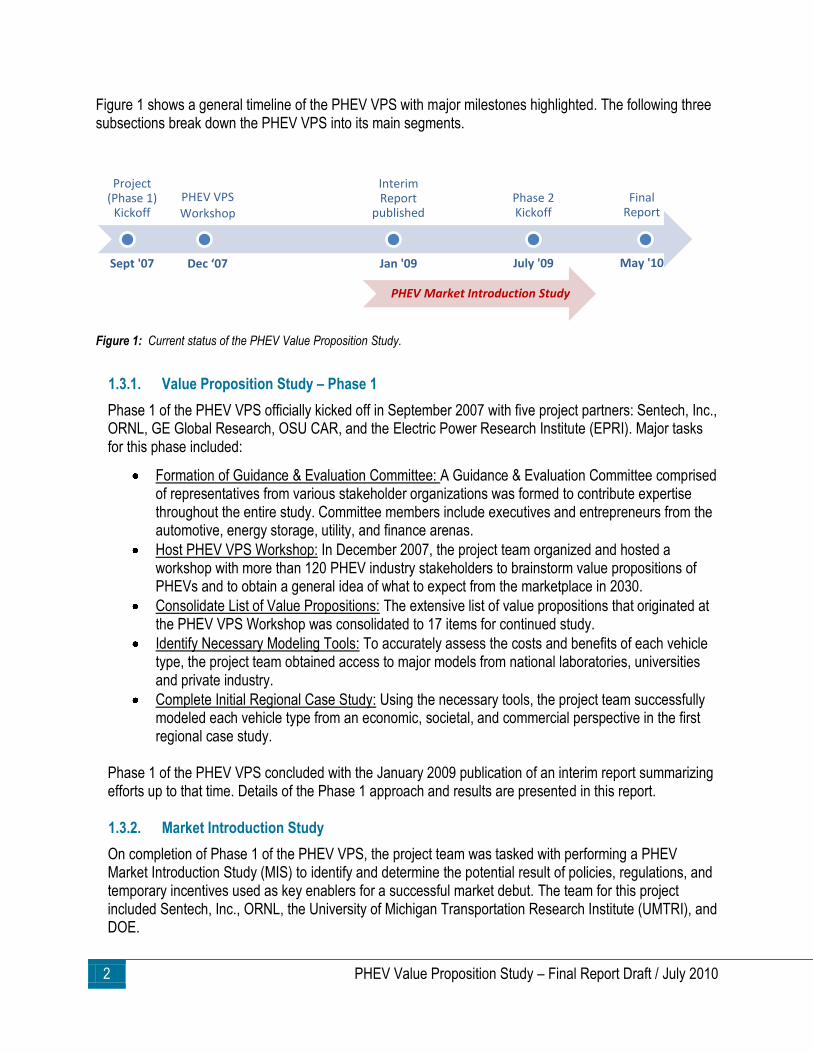
2 PHEV Value Proposition Study – Final Report Draft / July 2010
Figure 1 shows a general timeline of the PHEV VPS with major milestones highlighted. The following three subsections break down the PHEV VPS into its main segments.
Figure 1: Current status of the PHEV Value Proposition Study.
1.3.1. Value Proposition Study – Phase 1
Phase 1 of the PHEV VPS officially kicked off in September 2007 with five project partners: Sentech, Inc., ORNL, GE Global Research, OSU CAR, and the Electric Power Research Institute (EPRI). Major tasks for this phase included:
Formation of Guidance & Evaluation Committee: A Guidance & Evaluation Committee comprised of representatives from various stakeholder organizations was formed to contribute expertise throughout the entire study. Committee members include executives and entrepreneurs from the automotive, energy storage, utility, and finance arenas.
Host PHEV VPS Workshop: In December 2007, the project team organized and hosted a workshop with more than 120 PHEV industry stakeholders to brainstorm value propositions of PHEVs and to obtain a general idea of what to expect from the marketplace in 2030.
Consolidate List of Value Propositions: The extensive list of value propositions that originated at the PHEV VPS Workshop was consolidated to 17 items for continued study.
Identify Necessary Modeling Tools: To accurately assess the costs and benefits of each vehicle type, the project team obtained access to major models from national laboratories, universities and private industry.
Complete Initial Regional Case Study: Using the necessary tools, the project team successfully modeled each vehicle type from an economic, societal, and commercial perspective in the first regional case study.
Phase 1 of the PHEV VPS concluded with the January 2009 publication of an interim report summarizing efforts up to that time. Details of the Phase 1 approach and results are presented in this report. 1.3.2. Market Introduction Study
On completion of Phase 1 of the PHEV VPS, the project team was tasked with performing a PHEV Market Introduction Study (MIS) to identify and determine the potential result of policies, regulations, and temporary incentives used as key enablers for a successful market debut. The team for this project included Sentech, Inc., ORNL, the University of Michigan Transportation Research Institute (UMTRI), and DOE.
Project (Phase 1)
Kickoff
Sept '07
Interim Report
published
Jan '09
Phase 2 Kickoff
July '09
Final Report
May '10
PHEV VPS Workshop
Dec ‘07
PHEV Market Introduction Study
Interim Report
published
Jan '09
PHEV Value Proposition Study – Final Report Draft / July 2010 3
A PHEV MIS workshop held in December 2008 brought together industry experts to compile a ―short list‖ of policy options with the most potential for boosting PHEV sales during the next 10 to 20 years. ORNL’s PHEV Consumer Choice Model (now known as the Market Acceptance of Advanced Automotive Technologies Model, or MA3T) and UMTRI’s Virtual AutoMotive MarketPlace (VAMMP) model were employed to assess each of these policy options. Then, the policy options were ranked according to market impact, cost of implementation, and ability to overcome industry pinch points.
The PHEV MIS projected that, if no further policies are established in support of PHEVs, approximately 425,000 light duty vehicle (LDV) units will enter the market in 2015 alone, accounting for roughly 2.5% of LDV sales for that year. This translates to just more than 1 million PHEVs sold by 2015, potentially meeting the Obama Administration’s aggressive goal. However, incentives that directly or indirectly reduce the sticker price of PHEVs, such as state sales tax exemptions or feebate (a fee and rebate combination) programs, were found to significantly increase the impact on PHEV sales through 2020 as a reasonable investment by state and federal government. Complete results of this study can be found in the January 2010 PHEV MIS Final Report (Sikes 2010).
1.3.3. Value Proposition Study – Phase 2
Phase 2 of the VPS began in July 2009. Contributors to work in this phase included Sentech, Inc., ORNL, OSU CAR, and Taratec Corporation. (GE Global Research and EPRI did not participate in Phase 2 activities.) This portion of the study was designed to build on the results of Phase 1’s initial regional case study. Specifically, the project team accomplished the following tasks:
Second Regional Case Study: A second regional case study simulated the cost and benefits associated with PHEV value propositions in a different geographical setting using similar modeling techniques in Phase 1.
Risk Analysis: The project team performed an analysis of the market risk for PHEV success using parameters defined in Phase 1’s regional case study.
Sensitivity Analysis: Each of the regional case studies was revisited to identify parameters that are sensitive to market conditions and technological advancements. A sensitivity matrix with designated ranges (as opposed to a single data point) for each input parameter was constructed to determine how different projected or fluctuating values could affect the overall results of each case study.
Results, conclusions, and recommendations resulting from both Phase 1 and Phase 2 work are included in this report.
4 PHEV Value Proposition Study – Final Report Draft / July 2010
2. INDUSTRY SNAPSHOT
2.1. Supportive Policies – Existing and Potential
Significant government support has been established in recent years to help aid the market introduction of PHEVs and other plug-in vehicles in the U.S. Some of the most noteworthy federal government policies that support PHEV production and are being implemented include:
Between $2,500 and $7,500 in tax credits offered to consumers through the Plug-In Vehicle Tax Credit, which was established in the American Recovery and Reinvestment Act (ARRA 2009, originally established in the Emergency Economic Stabilization Act of 2008 (EESA)). Tax credit amounts are based on battery energy storage capacity.
$2 billion in advanced battery manufacturing grants to domestic automotive, battery, and component manufacturers (ARRA 2009, originally authorized in the Energy Independence and Security Act of 2007 (EISA)§ 135).
$400 million for electric drive vehicles and electrification infrastructure demonstration and evaluation projects (ARRA 2009, originally authorized in EISA 2007 § 131).
Several other policies, as well as other federal government initiatives supporting PHEVs, have been created in recent years. Such policies and legislation are described in detail in Appendix A. 2.2. PHEV Development and Production Plans
Substantial investments leading to PHEV production have already been made by industry stakeholders. These investments are relatively small in comparison to those needed to produce 1 million plug-in hybrid vehicles by 2015. Beyond this milestone, additional investments will be required to reach long-term commercial success. The cost of early production PHEVs is likely to be significantly higher relative to comparable ICE vehicles and HEVs, mostly because of the cost for PHEV batteries. A National Research Council (NRC) report released in December 2009 (Committee 2009) says while battery technology has been developing rapidly, steep declines in cost do not appear likely in the next couple of decades. Its authors conclude that a fundamental breakthrough in battery technology will be needed to make plug-in electric vehicles more affordable. When this study was kicked off, only a couple of OEMs had announced plans to produce PHEVs, and no electric vehicle (EV) production plans had been announced. Obviously, the plug-in electric vehicle industry has evolved significantly since then. Production plans by OEMs now indicate that the plug-in vehicle market will likely be shared almost equally by PHEVs and EVs in the coming years. Table 1 provides a summary of planned production by OEMs of both PHEVs and EVs in the U.S. For many of the listed vehicles, the anticipated battery supplier is provided, plus the estimated production date, expected volume, initial cost, production site, and battery manufacturer. Detailed descriptions of production plans for plug-in electric vehicles, energy storage, and other components can be found in Appendix A.
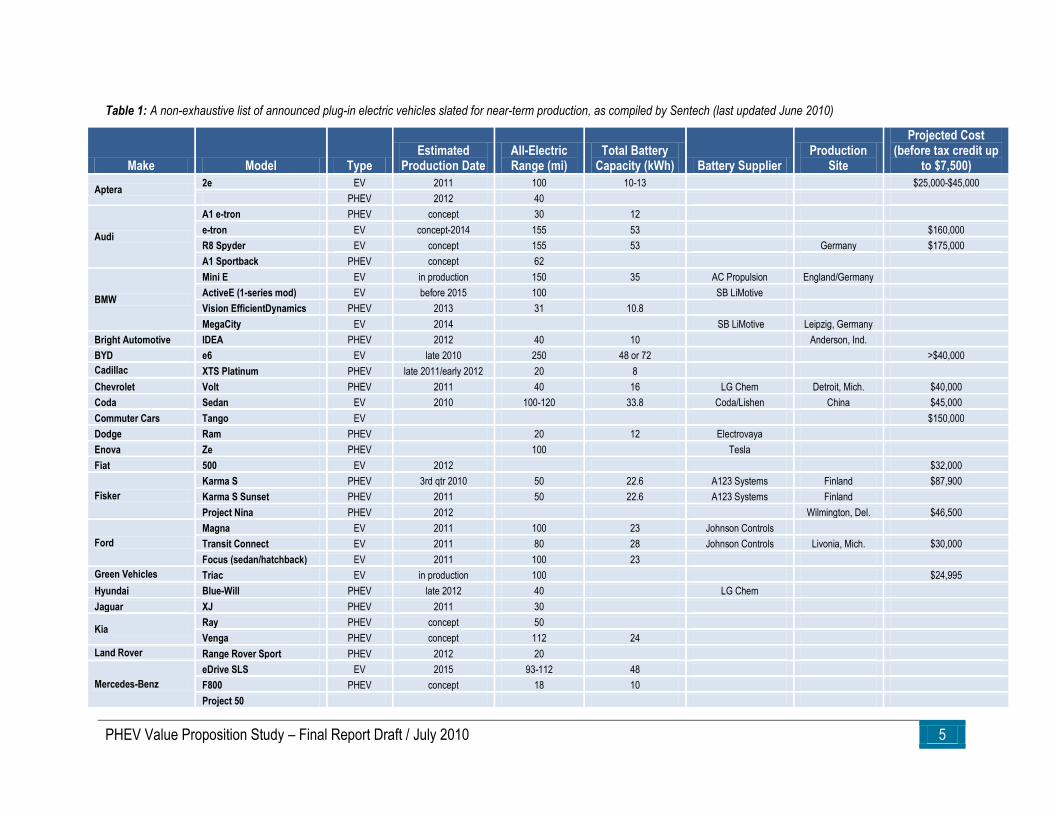
PHEV Value Proposition Study – Final Report Draft / July 2010 5
Table 1: A non-exhaustive list of announced plug-in electric vehicles slated for near-term production, as compiled by Sentech (last updated June 2010)
Make Model Type Estimated
Production Date All-Electric Range (mi)
Total Battery Capacity (kWh) Battery Supplier
Production Site
Projected Cost (before tax credit up
to $7,500)
Aptera 2e EV 2011 100 10-13 $25,000-$45,000
PHEV 2012 40
Audi
A1 e-tron PHEV concept 30 12
e-tron EV concept-2014 155 53 $160,000
R8 Spyder EV concept 155 53 Germany $175,000
A1 Sportback PHEV concept 62
BMW
Mini E EV in production 150 35 AC Propulsion England/Germany
ActiveE (1-series mod) EV before 2015 100 SB LiMotive
Vision EfficientDynamics PHEV 2013 31 10.8
MegaCity EV 2014 SB LiMotive Leipzig, Germany
Bright Automotive IDEA PHEV 2012 40 10 Anderson, Ind.
BYD e6 EV late 2010 250 48 or 72 >$40,000
Cadillac XTS Platinum PHEV late 2011/early 2012 20 8
Chevrolet Volt PHEV 2011 40 16 LG Chem Detroit, Mich. $40,000
Coda Sedan EV 2010 100-120 33.8 Coda/Lishen China $45,000
Commuter Cars Tango EV $150,000
Dodge Ram PHEV 20 12 Electrovaya
Enova Ze PHEV 100 Tesla
Fiat 500 EV 2012 $32,000
Fisker
Karma S PHEV 3rd qtr 2010 50 22.6 A123 Systems Finland $87,900
Karma S Sunset PHEV 2011 50 22.6 A123 Systems Finland
Project Nina PHEV 2012 Wilmington, Del. $46,500
Ford
Magna EV 2011 100 23 Johnson Controls
Transit Connect EV 2011 80 28 Johnson Controls Livonia, Mich. $30,000
Focus (sedan/hatchback) EV 2011 100 23
Green Vehicles Triac EV in production 100 $24,995
Hyundai Blue-Will PHEV late 2012 40 LG Chem
Jaguar XJ PHEV 2011 30
Kia Ray PHEV concept 50
Venga PHEV concept 112 24
Land Rover Range Rover Sport PHEV 2012 20
Mercedes-Benz
eDrive SLS EV 2015 93-112 48
F800 PHEV concept 18 10
Project 50
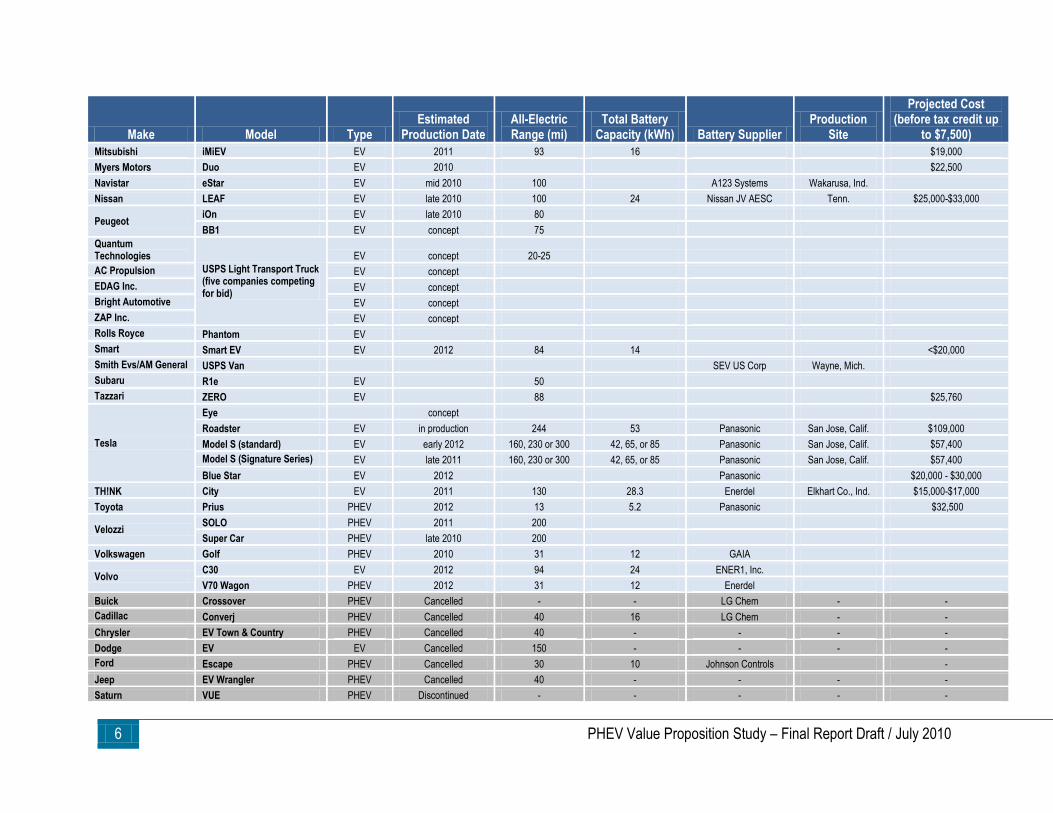
6 PHEV Value Proposition Study – Final Report Draft / July 2010
Make Model Type Estimated
Production Date All-Electric Range (mi)
Total Battery Capacity (kWh) Battery Supplier
Production Site
Projected Cost (before tax credit up
to $7,500)
Mitsubishi iMiEV EV 2011 93 16 $19,000
Myers Motors Duo EV 2010 $22,500
Navistar eStar EV mid 2010 100 A123 Systems Wakarusa, Ind.
Nissan LEAF EV late 2010 100 24 Nissan JV AESC Tenn. $25,000-$33,000
Peugeot iOn EV late 2010 80
BB1 EV concept 75
Quantum Technologies
USPS Light Transport Truck (five companies competing for bid)
EV concept 20-25
AC Propulsion EV concept
EDAG Inc. EV concept
Bright Automotive EV concept
ZAP Inc. EV concept
Rolls Royce Phantom EV
Smart Smart EV EV 2012 84 14 <$20,000
Smith Evs/AM General USPS Van SEV US Corp Wayne, Mich.
Subaru R1e EV 50
Tazzari ZERO EV 88 $25,760
Tesla
Eye concept
Roadster EV in production 244 53 Panasonic San Jose, Calif. $109,000
Model S (standard) EV early 2012 160, 230 or 300 42, 65, or 85 Panasonic San Jose, Calif. $57,400
Model S (Signature Series) EV late 2011 160, 230 or 300 42, 65, or 85 Panasonic San Jose, Calif. $57,400
Blue Star EV 2012 Panasonic $20,000 - $30,000
TH!NK City EV 2011 130 28.3 Enerdel Elkhart Co., Ind. $15,000-$17,000
Toyota Prius PHEV 2012 13 5.2 Panasonic $32,500
Velozzi SOLO PHEV 2011 200
Super Car PHEV late 2010 200
Volkswagen Golf PHEV 2010 31 12 GAIA
Volvo C30 EV 2012 94 24 ENER1, Inc.
V70 Wagon PHEV 2012 31 12 Enerdel
Buick Crossover PHEV Cancelled - - LG Chem - -
Cadillac Converj PHEV Cancelled 40 16 LG Chem - -
Chrysler EV Town & Country PHEV Cancelled 40 - - - -
Dodge EV EV Cancelled 150 - - - -
Ford Escape PHEV Cancelled 30 10 Johnson Controls -
Jeep EV Wrangler PHEV Cancelled 40 - - - -
Saturn VUE PHEV Discontinued - - - - -
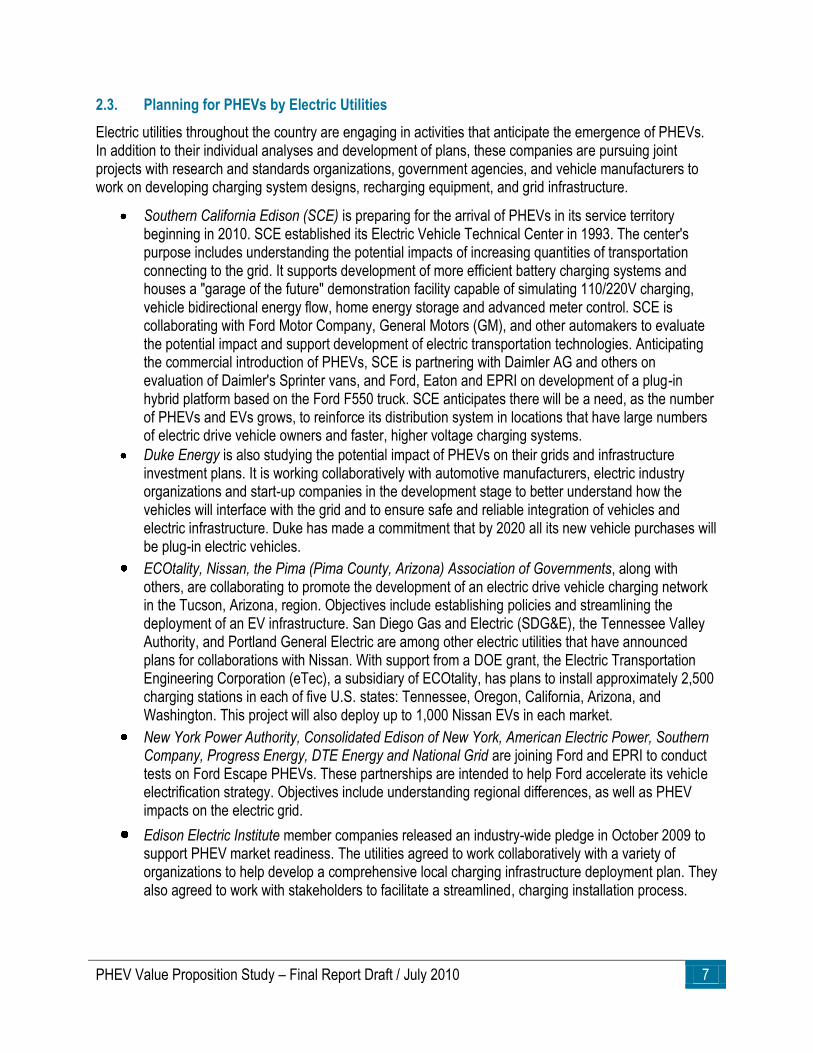
PHEV Value Proposition Study – Final Report Draft / July 2010 7
2.3. Planning for PHEVs by Electric Utilities
Electric utilities throughout the country are engaging in activities that anticipate the emergence of PHEVs. In addition to their individual analyses and development of plans, these companies are pursuing joint projects with research and standards organizations, government agencies, and vehicle manufacturers to work on developing charging system designs, recharging equipment, and grid infrastructure.
Southern California Edison (SCE) is preparing for the arrival of PHEVs in its service territory beginning in 2010. SCE established its Electric Vehicle Technical Center in 1993. The center's purpose includes understanding the potential impacts of increasing quantities of transportation connecting to the grid. It supports development of more efficient battery charging systems and houses a "garage of the future" demonstration facility capable of simulating 110/220V charging, vehicle bidirectional energy flow, home energy storage and advanced meter control. SCE is collaborating with Ford Motor Company, General Motors (GM), and other automakers to evaluate the potential impact and support development of electric transportation technologies. Anticipating the commercial introduction of PHEVs, SCE is partnering with Daimler AG and others on evaluation of Daimler's Sprinter vans, and Ford, Eaton and EPRI on development of a plug-in hybrid platform based on the Ford F550 truck. SCE anticipates there will be a need, as the number of PHEVs and EVs grows, to reinforce its distribution system in locations that have large numbers of electric drive vehicle owners and faster, higher voltage charging systems.
Duke Energy is also studying the potential impact of PHEVs on their grids and infrastructure investment plans. It is working collaboratively with automotive manufacturers, electric industry organizations and start-up companies in the development stage to better understand how the vehicles will interface with the grid and to ensure safe and reliable integration of vehicles and electric infrastructure. Duke has made a commitment that by 2020 all its new vehicle purchases will be plug-in electric vehicles.
ECOtality, Nissan, the Pima (Pima County, Arizona) Association of Governments, along with others, are collaborating to promote the development of an electric drive vehicle charging network in the Tucson, Arizona, region. Objectives include establishing policies and streamlining the deployment of an EV infrastructure. San Diego Gas and Electric (SDG&E), the Tennessee Valley Authority, and Portland General Electric are among other electric utilities that have announced plans for collaborations with Nissan. With support from a DOE grant, the Electric Transportation Engineering Corporation (eTec), a subsidiary of ECOtality, has plans to install approximately 2,500 charging stations in each of five U.S. states: Tennessee, Oregon, California, Arizona, and Washington. This project will also deploy up to 1,000 Nissan EVs in each market.
New York Power Authority, Consolidated Edison of New York, American Electric Power, Southern Company, Progress Energy, DTE Energy and National Grid are joining Ford and EPRI to conduct tests on Ford Escape PHEVs. These partnerships are intended to help Ford accelerate its vehicle electrification strategy. Objectives include understanding regional differences, as well as PHEV impacts on the electric grid.
Edison Electric Institute member companies released an industry-wide pledge in October 2009 to support PHEV market readiness. The utilities agreed to work collaboratively with a variety of organizations to help develop a comprehensive local charging infrastructure deployment plan. They also agreed to work with stakeholders to facilitate a streamlined, charging installation process.
8 PHEV Value Proposition Study – Final Report Draft / July 2010
3. APPROACH
3.1. PHEV Value Proposition Workshop
More than 120 representatives from industry, government and research institutions were in attendance at the PHEV VPS Workshop held at the L’Enfant Plaza Hotel in Washington, D.C., on December 11 and 12, 2007. The objective of the workshop was to bring together experts from a full range of stakeholders to brainstorm potential business models that would lead to a commercially viable PHEV market and supporting infrastructure. The value propositions developed at this workshop consisted of methods to enhance consumer acceptance of PHEVs and increase PHEV compatibility with the grid. Areas of interest included the operation (charge and discharge trends) by PHEV owners, capabilities or functions of PHEVs, methods for financing and leasing PHEVs and/or the batteries, grid infrastructure and communication needs, and types of non-monetary, or ―convenience‖, benefits of ownership that would be valued by consumers, such as emergency back-up power or fewer trips to the gas station. Participants were assigned to one of five highly interactive breakout sessions (listed below). Breakout Sessions 1 – 4 focused on a specific area for potential added value while participants in Breakout Session 5 used industry expertise to envision the world in 2030 and beyond, when the PHEV market is anticipated to reach sustainability. The sessions were titled:
1. “What are the Value Propositions for Unidirectional Electricity Flow?” Focus is limited to the most basic propositions achievable only through one way of electricity from the grid to the PHEV. The charging systems for these PHEVs have varying levels of intelligence. They range from ―dumb‖ (charges immediately once plugged in, like an appliance) to ―smart‖ (controlled charging based on owner’s specified constraints).
2. “What are the Value Propositions for PHEVs with Third Party Ownership of Batteries?” Focus is limited to potential leasers or owners of advanced automotive batteries.
3. “What are the Value Propositions for PHEVs with Vehicle-To-Grid (V2G) Capabilities?” Focus is limited to propositions achievable through bidirectional electricity flow between the vehicle and the electric grid.
4. “What are the Value Propositions for PHEVs with Vehicle-to-Building (V2B) Capabilities?” Focus is limited to propositions achievable through bidirectional electricity flow between the vehicle and a specific building (often a residence or workplace), creating a ―micro-grid.‖
5. “What is the Consensus Vision of 2030 and Beyond?‖ Focus is limited to key assumptions of the marketplace in 2030 including price points, regulatory actions, and technology maturation levels.
In each breakout session, participants brainstormed potential value propositions related to the topic, and all suggested value propositions were documented. Participants then ―voted‖ for their top value propositions, basing their assessment of the level of impact that the proposition would have on the PHEV industry and the mechanisms required for implementing the proposition. Once the top propositions were identified, each group defined them in greater detail, noting characteristics such as key enablers and barriers. On the morning of the closing day, top propositions from each breakout session were summarized and presented during the final plenary session. Table 2 on the following page is a comprehensive list of 32 value propositions documented at the workshop after consolidation, plus a few later added by the project team (Genung 2008). The large majority of these value propositions were analyzed in this study.
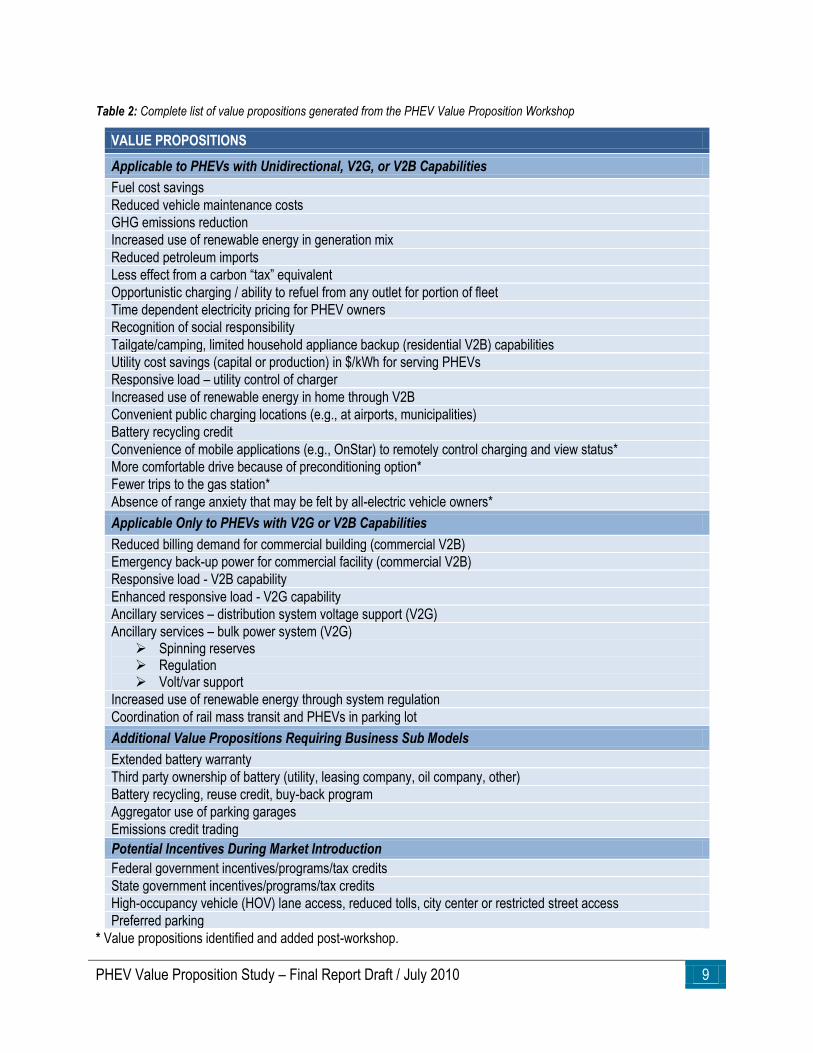
PHEV Value Proposition Study – Final Report Draft / July 2010 9
Table 2: Complete list of value propositions generated from the PHEV Value Proposition Workshop
VALUE PROPOSITIONS
Applicable to PHEVs with Unidirectional, V2G, or V2B Capabilities
Fuel cost savings
Reduced vehicle maintenance costs
GHG emissions reduction
Increased use of renewable energy in generation mix
Reduced petroleum imports
Less effect from a carbon ―tax‖ equivalent
Opportunistic charging / ability to refuel from any outlet for portion of fleet
Time dependent electricity pricing for PHEV owners
Recognition of social responsibility
Tailgate/camping, limited household appliance backup (residential V2B) capabilities
Utility cost savings (capital or production) in $/kWh for serving PHEVs
Responsive load – utility control of charger
Increased use of renewable energy in home through V2B
Convenient public charging locations (e.g., at airports, municipalities)
Battery recycling credit
Convenience of mobile applications (e.g., OnStar) to remotely control charging and view status*
More comfortable drive because of preconditioning option*
Fewer trips to the gas station*
Absence of range anxiety that may be felt by all-electric vehicle owners*
Applicable Only to PHEVs with V2G or V2B Capabilities
Reduced billing demand for commercial building (commercial V2B)
Emergency back-up power for commercial facility (commercial V2B)
Responsive load - V2B capability
Enhanced responsive load - V2G capability
Ancillary services – distribution system voltage support (V2G)
Ancillary services – bulk power system (V2G) Spinning reserves Regulation Volt/var support
Increased use of renewable energy through system regulation
Coordination of rail mass transit and PHEVs in parking lot
Additional Value Propositions Requiring Business Sub Models
Extended battery warranty
Third party ownership of battery (utility, leasing company, oil company, other)
Battery recycling, reuse credit, buy-back program
Aggregator use of parking garages
Emissions credit trading
Potential Incentives During Market Introduction
Federal government incentives/programs/tax credits
State government incentives/programs/tax credits
High-occupancy vehicle (HOV) lane access, reduced tolls, city center or restricted street access
Preferred parking
* Value propositions identified and added post-workshop.
10 PHEV Value Proposition Study – Final Report Draft / July 2010
3.2. General Assumptions
The PHEV VPS investigates how three different vehicle types – ICEs, HEVs, and PHEVs – compete in the 2030 marketplace. Since the world of 2030 is anticipated to undergo a variety of economic and technological transitions during the next two decades, many assumptions were made to allow realistic business scenarios to be built. To assist in defining these assumptions, the project team drew from the recommendations of PHEV VPS Workshop participants in Breakout Session 5 who were tasked with creating a ―Consensus Vision for 2030-2040.‖ Because the conditions of 2030 cannot be accurately forecasted, numerous sensitivity analyses on several assumptions are conducted in this study to indicate how dependent the financial attractiveness of each vehicle type is on the base assumptions.
3.2.1. Market and Regulatory
Regulatory changes, infrastructure growth, and the nature of fuel supply are just a few of the anticipated circumstances that are expected to drive PHEV market growth between now and 2030. Below is a list of assumptions that combines insight from Breakout Session 5 participants with projections developed by the project team and the Guidance & Evaluation Committee to further define the market landscape of 2030:
Corporate Average Fuel Economy (CAFE) standards for LDVs will be greater than 35 miles per gallon (mpg) in 2030.
Oil cost will continue to increase to more than $150 per barrel (dollar values from 2010) by 2030. Cost of other fuels, including electricity derived from petroleum or natural gas, will also rise significantly.
A cost will be associated with carbon emissions, which will be regulated on an international basis. The Energy Information Administration’s (EIA) projected allowance price of $65 per metric ton of carbon dioxide (CO2) under the American Clean Energy and Security Act of 2009 (ACESA) ―Basic Case‖ is assumed for 2030 (EIA 2009). This is the same as the final reference case in the Annual Energy Outlook for 2009 (AEO2009) and this cost is in addition to fuel price projections.
All vehicles produced in 2030 will meet Super Ultra Low Emission Vehicle (SULEV) standards.
A 70/30 split of E10 and E85 use is anticipated for 2030 to be consistent with DOE’s ―30 x 30‖ goal of replacing 30% of 2004 motor gasoline demand with ethanol by 2030 (Perlack, 2005). For modeling purposes, an average E30 blend is used to represent this combination of fuels.
Battery recycling capabilities will be in place because of regulations.
To be sustainable, a PHEV fleet must comprise 5%-10% of new vehicles sold annually. Workshop participants agreed that this volume may be realistically achievable by 2030. The project team assumed a 10% market penetration rate in 2030 to be able to predict any significant effects on the grid.
The value of temporary incentives (e.g., tax credits, HOV lane access, preferred parking) used to boost initial sales should not be considered in this study since they will likely saturate and be phased out by 2030. Temporary incentives were considered in the PHEV MIS report.
Sequestration will be incorporated to some extent in regions with high amounts of coal in the electric generation mix.
PHEVs’ first challenge should be to simply demonstrate the capability to provide reliable transportation before attempting more advanced applications, such as V2B or V2G. Participants agree V2B applications would likely be adopted by 2030, including supporting infrastructure. However, the broad implementation of V2G applications is believed to be unlikely before 2030.
PHEV Value Proposition Study – Final Report Draft / July 2010 11
3.2.2. Vehicle
In addition to market and regulatory development, technology breakthroughs are expected to occur between now and 2030 that will result in less expensive and better performing vehicle components. Economies of scale are expected to drive down the cost of production through 2030. Below are the major vehicle assumptions that came from the PHEV VPS Workshop:
Vehicles, including battery packs, are anticipated to have a 10-year lifetime (~150,000 miles).
PHEVs analyzed in this study will have an all-electric range (AER) equivalent of 30 miles in 2030, although a variety of electric ranges will exist for PHEVs.
DOE cost targets through 2030 will be met for all powertrain components (e.g., battery, power electronics).
Lithium-ion (Li-ion) will be the dominant battery chemistry used by the PHEV fleet in 2030. All new PHEVs sold after 2030 are assumed to have Li-ion batteries. Only Li-ion batteries were analyzed in this study.
PHEVs will use a pre-transmission parallel hybrid powertrain architecture in congruence with the powertrain configuration used to develop DOE’s Government Performance and Results Act (GPRA) analysis of 1993 outputs (GPRA 1993). While a split hybrid system may be more efficient, it would require the expense, weight, and complexity of a planetary gearbox, plus an additional electric machine and associated power electronics.
Fuel economy of all vehicles will benefit from a 30% glider weight reduction by 2030 relative to today’s vehicles, which is moderately conservative when considering the DOE Vehicle Technologies Program goal of developing technologies to enable 40% vehicle weight reduction (EERE 2007).
The majority of the PHEV fleet will be capable of only unidirectional electricity flow by 2030, though they will still be able to provide limited power for non-road use (e.g., camping, tailgating) or to power select home appliances in emergency situations or power outages.
Ninety percent of first generation PHEVs will have dual voltage charging capability, meaning the vehicle can be charged at 110V (Level 1) or 220V (Level 2) and can accommodate potential V2B and V2G applications, assuming bidirectional electricity flow is permitted. By 2030, all new PHEVs will have dual voltage charging capability.
Most vehicles will be equipped with global positioning systems (GPS) capable of optimizing blended fuel economy by recognizing recurring trips or analyzing driver-entered destinations in combination with the drivetrain controller.
A complete breakdown of established parameters for each vehicle type with information on vehicle mass, parasitic loads, engine specifications, battery specifications, and power electronics is provided in Appendix B. 3.2.3. Charging Behavior / Infrastructure Capabilities
All PHEV owners will plug in every weeknight to charge during off peak rate times in a garage or equipped parking facility.
Five percent of PHEV owners will plug in upon arrival at work following their morning commute to get a full charge prior to leaving work in the afternoon.
12 PHEV Value Proposition Study – Final Report Draft / July 2010
PHEV owners will run errands on three weeknights per week. Fifteen percent of PHEV owners will plug in at home immediately following their afternoon commute on these days to allow for a partial or full charge prior to this trip.
All PHEV owners take an extended weekend drive each week. Five percent of PHEV owners will plug in at this secondary location prior to driving back home the following day.
All PHEVs are preconditioned for five minutes prior to every work commute (to and from), errand, and weekend trip.
Most PHEVs that charge at the workplace will receive a full charge prior to departure in exchange for permitting the building owner to regulate the vehicle charge/discharge as a way to reduce its billing demand. The occasional draw-down of the batteries for this value proposition is not expected to significantly affect battery performance or lifetime.
PHEV chargers in the vehicle owners’ homes will be separately metered with a time-of-use or other price- and time-responsive rate. An electronic controller will automatically delay charging until off-peak hours begin unless the driver chooses to override this feature by pushing a ―Charge Now‖ button.
From an accounting standpoint, PHEVs will have the ability to be separately tracked and billed (i.e. a virtual meter) if a utility wanted to apply roaming charges. Most utilities currently view this approach as too costly to manage. This concept is not to be confused with the traditional model of a separately installed billing meter.
Charger management systems will be in place by the utility to manage overall fleet charge load profiles. Two examples include: o Consumers having the option to specify the hour by which the vehicle must be charged (e.g.,
―fully charged by 6 a.m.‖), and smart meter technology will accommodate the request by scheduling the chargers on a feeder or in a neighborhood to provide a system ―valley fill‖ in the utility load curve, avoiding unduly high location or spot peaks.
o A charger’s time clock could simply begin off-peak charging after a random time delay (1 to 30 minutes after off-peak rates begin) to avoid high needle peaks on the distribution system that would occur if the chargers began charging simultaneously.
Some parking facilities will be able to act as aggregators providing responsive loads and some degree of ancillary services in regulating the charging of 220V PHEVs.
3.3. Modeling Requirements
A collection of modeling tools and techniques was carefully chosen to appropriately analyze all inputs and calculate all desired outputs for this study. Selected models had been developed by national laboratories, private industry, and government agencies. In some cases, models have been modified to incorporate structural changes to coincide with the preceding assumptions. A brief description of each modeling tool is provided below, and Table 3 describes how each model was used to evaluate the individual value propositions.
3.3.1. Vehicle Operation
To simulate liquid fuel and electricity consumption by all three vehicle types, Argonne National Laboratory’s (ANL) Powertrain Systems Analysis Toolkit (PSAT) was used. PSAT is a vehicle-level modeling tool that simulates fuel economy and performance in a real world manner, accounting for transient behavior and control system characteristics. ICE, battery electric, fuel cell, series hybrid, parallel hybrid, and power split hybrid configurations can all be simulated using PSAT. For this study, the project
PHEV Value Proposition Study – Final Report Draft / July 2010 13
team developed appropriate vehicle models using PSAT and subjected them to a variety of inputs (e.g., base vehicle component data, PE&EM data, drive cycle data, V2B charge/discharge profiles, and vehicle energy management strategy information) to properly simulate battery charge/discharge profiles and resulting fuel usage. Scheduled maintenance costs are also important to consider when summing a vehicle’s lifetime operating costs. EPRI’s 2001 study titled, ―Comparing the Benefits and Impacts of Hybrid Electric Vehicle Options‖, was used as guideline for scheduled maintenance expenditures on ICEs, HEVs, and PHEVs. Values from this study have been adjusted to account for inflation and discrepancies in annual vehicle miles traveled (VMT). It should be noted that the increased number of powertrain components susceptible to failure is greater in PHEVs; therefore, it is not unreasonable to assume that unscheduled repair costs will be higher relative to ICEs, potentially canceling out cost savings from scheduled maintenance resulting from PHEVs. 3.3.2. Battery Sizing
A battery life estimation model developed at OSU CAR was used in this study to help project the energy required for the PHEV to maintain its advertised AER throughout the first 10 years of operation. The adopted life estimation algorithm is based on weighted Ah-throughput models. The main assumption is that under particular standard conditions (C-rate, temperature, depth of discharge (DOD)) a battery can achieve an overall Ah-throughput until the end of life (EOL) is reached. For automotive applications (HEV and PHEV) a battery is considered to have reached EOL when it shows capacity losses of 20% or more with respect to the original capacity. The lifetime in terms of number of cycles is usually given by the battery manufacturer (usually 100% DOD at ±1 C-rate at 25°C) and is required for lifetime estimation with the weighted Ah-throughput model. The impact of a given Ah-throughput on the battery lifetime depends on the details of the conditions during this Ah-throughput. One important advantage of this model is that it takes into account deviations from the standard operating conditions (C-rate, temperature, DOD) that may increase or decrease the physical Ah-throughput and consequently the rate of aging. This type of model is a good tool for lifetime estimation of batteries in PHEVs. It has an easy basic structure, which allows for very high computational speed and can be adapted to different battery technologies. The main issue with this model is the determination of weighting/severity factor parameters. Accurate values would require extensive data collection not yet available. Determination of the severity factor surface is typically difficult to obtain and is dependent on the particular battery chemistry, anode and cathode composition, and construction. Furthermore, all information related to aging characteristics for a given cell requires extensive and very lengthy (and costly) data collection. For the purpose of this report, a prototypical example of an aging severity factor was extracted from manufacturer data, albeit with considerable difficulty as the tests were not necessarily conducted with our framework in mind. Typically, aging is assessed by cycling a cell with 100% DOD at a
few temperatures at a set 1 C current. Alternatively, current, DOD, and temperature data were extracted from actual vehicles/testing data and/or vehicle simulations and used to develop a methodology to identify statistically representative aging protocols that mimic real life operation.
14 PHEV Value Proposition Study – Final Report Draft / July 2010
3.3.3. Battery End-of-Life Value
A recycling credit will most likely be available at the end of a PHEV battery’s useful life for vehicle applications. Vehicle owners will recuperate a percentage of the PHEV’s initial price premium. Battery recycling also benefits utilities and other entities that can obtain these used batteries at a discounted price for use in stationary applications. To assign a standard credit for recycled batteries, the estimated salvage value must be determined. A recent report published by Sandia National Laboratory (SNL) that assesses potential value for secondary use battery applications provides a methodology for estimating a recycling credit amount that was used in this study (Cready 2003). Additionally, industry representatives were interviewed to appraise the value of energy storage of these batteries and to better understand how they would be utilized by their secondary customers.
3.3.4. Grid Impact
To analyze the electricity supply system for a given region or utility system based on power generating plant information and the region's hourly electric load demands, the Oak Ridge Competitive Electricity Dispatch (ORCED) model was used. Based on the plant dispatch information, fuel costs, and the region's power demands, ORCED can calculate plant emissions, electricity costs as a function of time, renewable energy additions to the generation mix, and other operational factors of the electricity market. To obtain these outputs, information on anticipated generation mix, load forecast/profile, V2B charge/discharge profile, and grid electricity usage (previously simulated in PSAT) was input into ORCED.
3.3.5. Environmental Impact
ANL’s full lifecycle Greenhouse Gases, Regulated Emissions, and Energy Use in Transportation, or GREET, model was used to evaluate fuel-cycle energy consumption, GHG emissions (primarily CO2, methane and nitrous oxide), and five criteria pollutants (volatile organic compounds, carbon monoxides, nitrogen oxide, specific particulate matter, and sulfur oxides) emitted by various engine and fuel combinations. These calculations will help determine whether PHEVs contribute to reduced GHG emissions and pollution. CO2 emissions data are especially important to gather since they will be used to calculate a carbon tax applied to each vehicle type. Inputs to GREET include information on the vehicle construction and operational parameters, regional generation mix, and PSAT feedback (e.g., fuel type/usage and grid electricity usage).
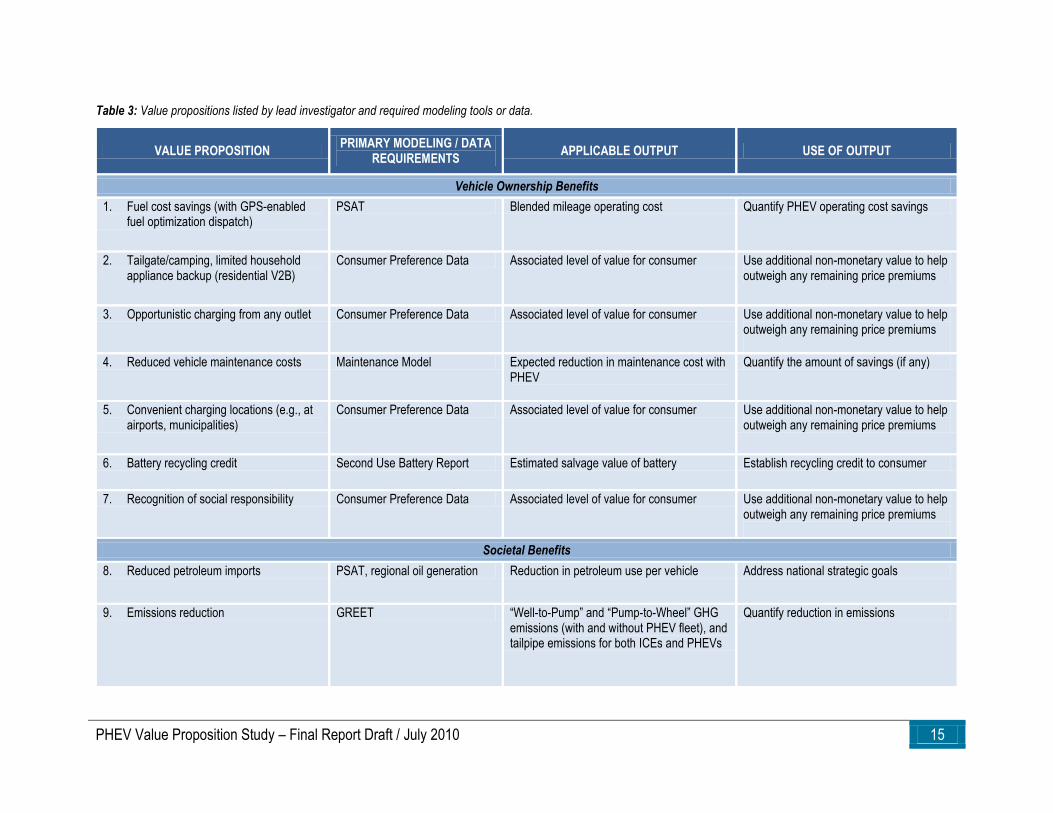
PHEV Value Proposition Study – Final Report Draft / July 2010 15
Table 3: Value propositions listed by lead investigator and required modeling tools or data.
VALUE PROPOSITION PRIMARY MODELING / DATA
REQUIREMENTS APPLICABLE OUTPUT USE OF OUTPUT
Vehicle Ownership Benefits
1. Fuel cost savings (with GPS-enabled fuel optimization dispatch)
PSAT Blended mileage operating cost Quantify PHEV operating cost savings
2. Tailgate/camping, limited household appliance backup (residential V2B)
Consumer Preference Data Associated level of value for consumer Use additional non-monetary value to help outweigh any remaining price premiums
3. Opportunistic charging from any outlet Consumer Preference Data Associated level of value for consumer Use additional non-monetary value to help outweigh any remaining price premiums
4. Reduced vehicle maintenance costs Maintenance Model Expected reduction in maintenance cost with PHEV
Quantify the amount of savings (if any)
5. Convenient charging locations (e.g., at airports, municipalities)
Consumer Preference Data Associated level of value for consumer Use additional non-monetary value to help outweigh any remaining price premiums
6. Battery recycling credit Second Use Battery Report Estimated salvage value of battery Establish recycling credit to consumer
7. Recognition of social responsibility Consumer Preference Data Associated level of value for consumer Use additional non-monetary value to help outweigh any remaining price premiums
Societal Benefits
8. Reduced petroleum imports PSAT, regional oil generation Reduction in petroleum use per vehicle Address national strategic goals
9. Emissions reduction GREET ―Well-to-Pump‖ and ―Pump-to-Wheel‖ GHG emissions (with and without PHEV fleet), and tailpipe emissions for both ICEs and PHEVs
Quantify reduction in emissions
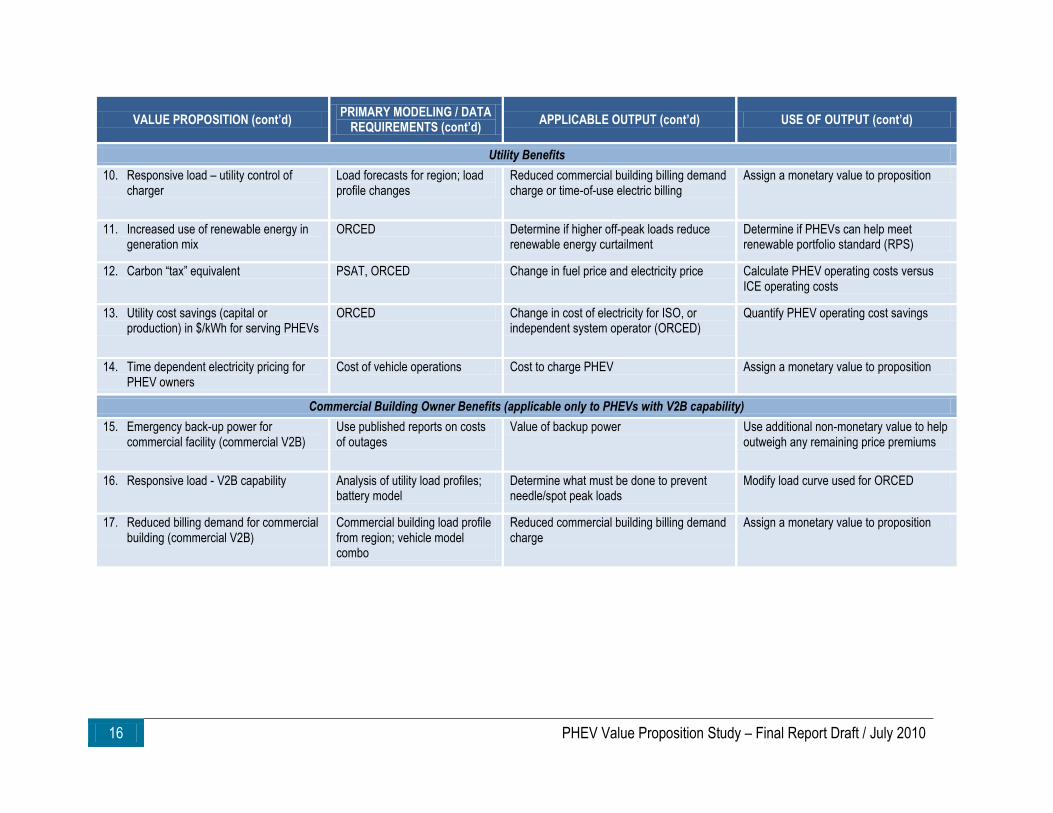
16 PHEV Value Proposition Study – Final Report Draft / July 2010
VALUE PROPOSITION (cont’d) PRIMARY MODELING / DATA
REQUIREMENTS (cont’d) APPLICABLE OUTPUT (cont’d) USE OF OUTPUT (cont’d)
Utility Benefits
10. Responsive load – utility control of charger
Load forecasts for region; load profile changes
Reduced commercial building billing demand charge or time-of-use electric billing
Assign a monetary value to proposition
11. Increased use of renewable energy in generation mix
ORCED Determine if higher off-peak loads reduce renewable energy curtailment
Determine if PHEVs can help meet renewable portfolio standard (RPS)
12. Carbon ―tax‖ equivalent PSAT, ORCED Change in fuel price and electricity price Calculate PHEV operating costs versus ICE operating costs
13. Utility cost savings (capital or production) in $/kWh for serving PHEVs
ORCED Change in cost of electricity for ISO, or independent system operator (ORCED)
Quantify PHEV operating cost savings
14. Time dependent electricity pricing for PHEV owners
Cost of vehicle operations Cost to charge PHEV Assign a monetary value to proposition
Commercial Building Owner Benefits (applicable only to PHEVs with V2B capability)
15. Emergency back-up power for commercial facility (commercial V2B)
Use published reports on costs of outages
Value of backup power Use additional non-monetary value to help outweigh any remaining price premiums
16. Responsive load - V2B capability Analysis of utility load profiles; battery model
Determine what must be done to prevent needle/spot peak loads
Modify load curve used for ORCED
17. Reduced billing demand for commercial building (commercial V2B)
Commercial building load profile from region; vehicle model combo
Reduced commercial building billing demand charge
Assign a monetary value to proposition
PHEV Value Proposition Study – Final Report Draft / July 2010 17
3.4. Data Collection
Figure 2 illustrates the summary of data flows that helped guide the extensive PHEV VPS analysis. Starting from the left of the diagram, inputs are fed into their designated models for analysis. Useful outputs from these models either feed back as additional inputs to complementary models or continue downstream as key components of the overarching macro business model (MBM), comprised of two major components: 1) costs and benefits to vehicle owners and 2) cost and benefits to non-vehicle owners. The MBM is designed to weigh the quantitative and qualitative features of each vehicle type and determine the value of PHEVs in the 2030 marketplace relative to comparable ICEs and HEVs.
1. Costs and Benefits to Vehicle Owners a) Vehicle Purchase Cost: In this portion of the model, the projected cost to purchase a
PHEV is compared to the projected cost of ICEs and HEVs in 2030. The purchase price of a PHEV is expected to have a notable premium over comparable ICEs and HEVs. Increased energy storage and PE&EM components, as well as having to install a dedicated 220V PHEV charging circuit in the home, contributes to this price premium. Ideas for incorporating a less expensive battery with a reduced energy storage system capacity and/or having a third party (someone other than the auto manufacturer or the consumer) own the batteries available for lease to the consumer are considered in this component.
b) Vehicle Operating Cost: In this portion of the model, PHEV operating costs are compared to ICEs and HEVs. Operating cost savings of PHEVs are expected to fully or partially negate their price premium over ICEs and HEVs. Primary savings are derived from reduced liquid fuel consumption through substitution of inexpensive electricity; however, reduced maintenance costs and carbon taxes are also expected to contribute to savings over the lifetime of the vehicle. A battery recycling credit is also included in this section.
c) ―Convenience‖ Benefits: PHEVs offer several unique, non-monetary benefits that other vehicle types may not possess. Such qualitative attributes include emergency back-up power, convenient charging locations and methods, ability to plug in from any outlet, and the added comfort from preconditioning capabilities. These attributes add value to PHEV ownership and may play a vital role in reaching the estimated 10% market penetration by 2030. Since most of these attributes have never been introduced in vehicles, and minimal research has been conducted on their value, assigning a monetary worth to each would be difficult. Therefore, the project team relied primarily on industry stakeholder interviews to gauge interest expressed by potential vehicle purchasers.
2. Costs and Benefits to Non-Vehicle Owners a) Commercial Building Owners: Commercial building owners may use V2B to reduce peak
billing demand for office buildings. Commercial V2B can be implemented in facilities with building energy management systems without very high additional investment in infrastructure. The charge/discharge cycle of a typical PHEV can be modified to recharge it immediately upon arriving at work, discharge to some extent during building peak period, and recharge as much as possible during minor ―valleys‖ of the building’s load profile. The value of this to the commercial building, in terms of 1) reduced billing demand, 2) reduced energy costs under time-of-use rates, and/or 3) incentive payments from the utility under utility peak reduction programs, has been calculated from regional utility rate schedules, escalated to the expected 2030 levels. Commercial building owners may also greatly benefit from emergency back-up power available from a small PHEV fleet.

18 PHEV Value Proposition Study – Final Report Draft / July 2010
b) Utilities: Several potential benefits to the utility were investigated in this study. Interactions between the semi-dispatchable PHEV recharge loads and the daily operational characteristics of a regional grid were modeled to estimate cost savings to the utilities (capital or production). The operational issues of economic dispatch of generation assets and loading of generation assets were also analyzed. The generation type, amount, cost, and associated emissions to provide the PHEV requirements based on the hourly charging cycles were evaluated as well.
c) Society: The nationwide effects that are expected to result from the infusion of a large PHEV fleet are accounted for in the social benefits section of the MBM. In some cases, these values will significantly lessen the magnitude of certain negative impacts traditionally linked to ICEs. For instance, reduced fuel usage will help decrease the country’s dependence on foreign oil, which contributes to better national security. The economy will be strengthened by encouraging increased utilization of the country’s own resources and labor to help build an electric transportation market sector. Similarly, reduced GHG and other emissions from PHEVs may ultimately improve air quality and the environment. Finally, increased amounts of PHEVs plugged in during off-peak hours may increase the percentage of renewable energy used in the generation mix, which could help utilities meet their individual state’s RPS targets.
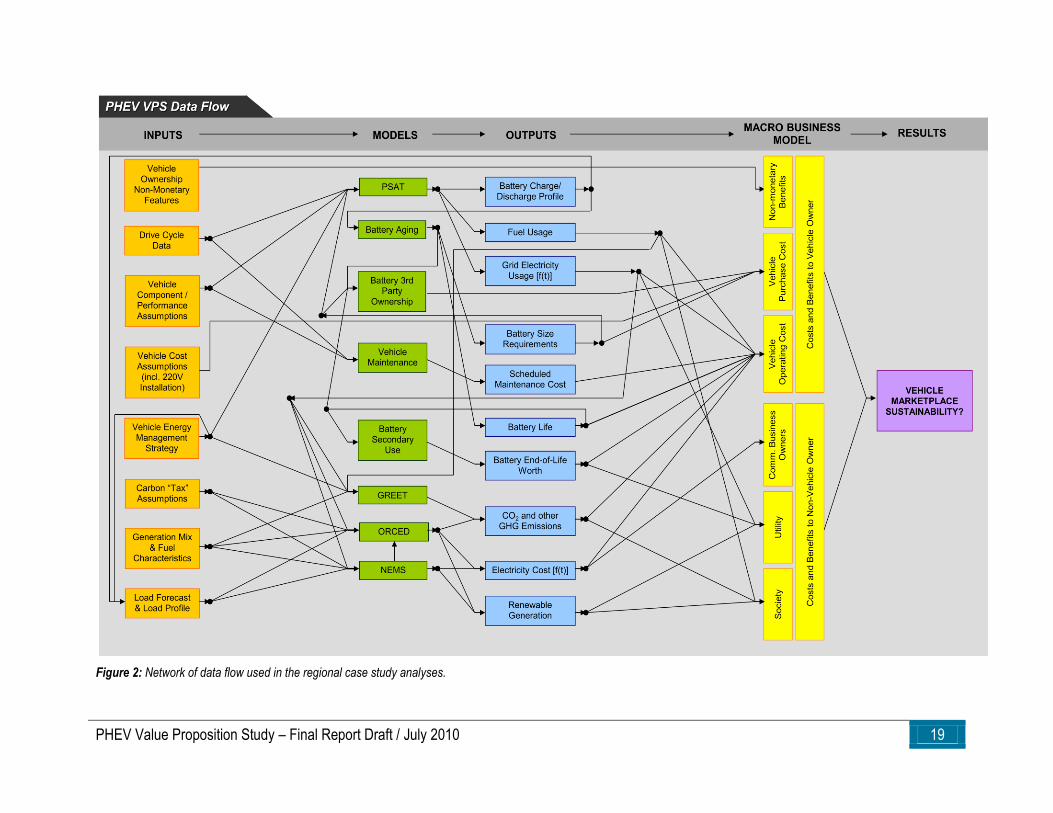
PHEV Value Proposition Study – Final Report Draft / July 2010 19
Figure 2: Network of data flow used in the regional case study analyses.
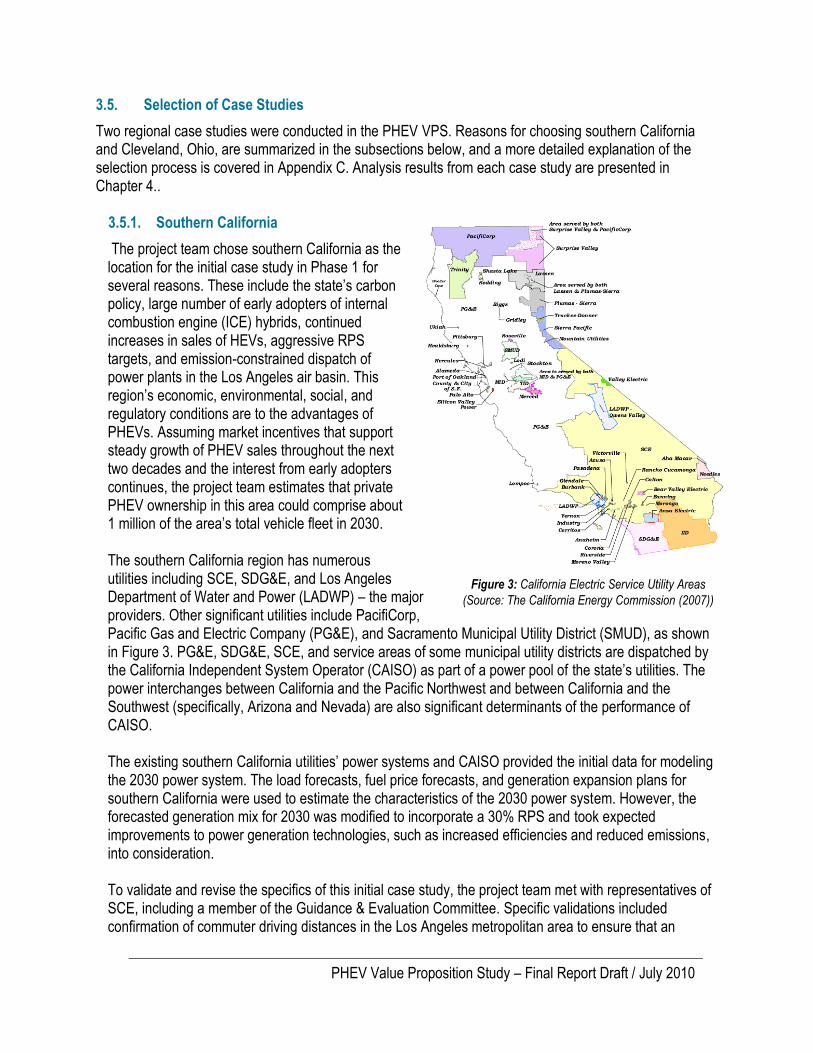
20 PHEV Value Proposition Study – Final Report Draft / July 2010
3.5. Selection of Case Studies
Two regional case studies were conducted in the PHEV VPS. Reasons for choosing southern California and Cleveland, Ohio, are summarized in the subsections below, and a more detailed explanation of the selection process is covered in Appendix C. Analysis results from each case study are presented in Chapter 4..
3.5.1. Southern California
The project team chose southern California as the location for the initial case study in Phase 1 for several reasons. These include the state’s carbon policy, large number of early adopters of internal combustion engine (ICE) hybrids, continued increases in sales of HEVs, aggressive RPS targets, and emission-constrained dispatch of power plants in the Los Angeles air basin. This region’s economic, environmental, social, and regulatory conditions are to the advantages of PHEVs. Assuming market incentives that support steady growth of PHEV sales throughout the next two decades and the interest from early adopters continues, the project team estimates that private PHEV ownership in this area could comprise about 1 million of the area’s total vehicle fleet in 2030.
The southern California region has numerous utilities including SCE, SDG&E, and Los Angeles Department of Water and Power (LADWP) – the major providers. Other significant utilities include PacifiCorp, Pacific Gas and Electric Company (PG&E), and Sacramento Municipal Utility District (SMUD), as shown in Figure 3. PG&E, SDG&E, SCE, and service areas of some municipal utility districts are dispatched by the California Independent System Operator (CAISO) as part of a power pool of the state’s utilities. The power interchanges between California and the Pacific Northwest and between California and the Southwest (specifically, Arizona and Nevada) are also significant determinants of the performance of CAISO. The existing southern California utilities’ power systems and CAISO provided the initial data for modeling the 2030 power system. The load forecasts, fuel price forecasts, and generation expansion plans for southern California were used to estimate the characteristics of the 2030 power system. However, the forecasted generation mix for 2030 was modified to incorporate a 30% RPS and took expected improvements to power generation technologies, such as increased efficiencies and reduced emissions, into consideration. To validate and revise the specifics of this initial case study, the project team met with representatives of SCE, including a member of the Guidance & Evaluation Committee. Specific validations included confirmation of commuter driving distances in the Los Angeles metropolitan area to ensure that an
Figure 3: California Electric Service Utility Areas
(Source: The California Energy Commission (2007))
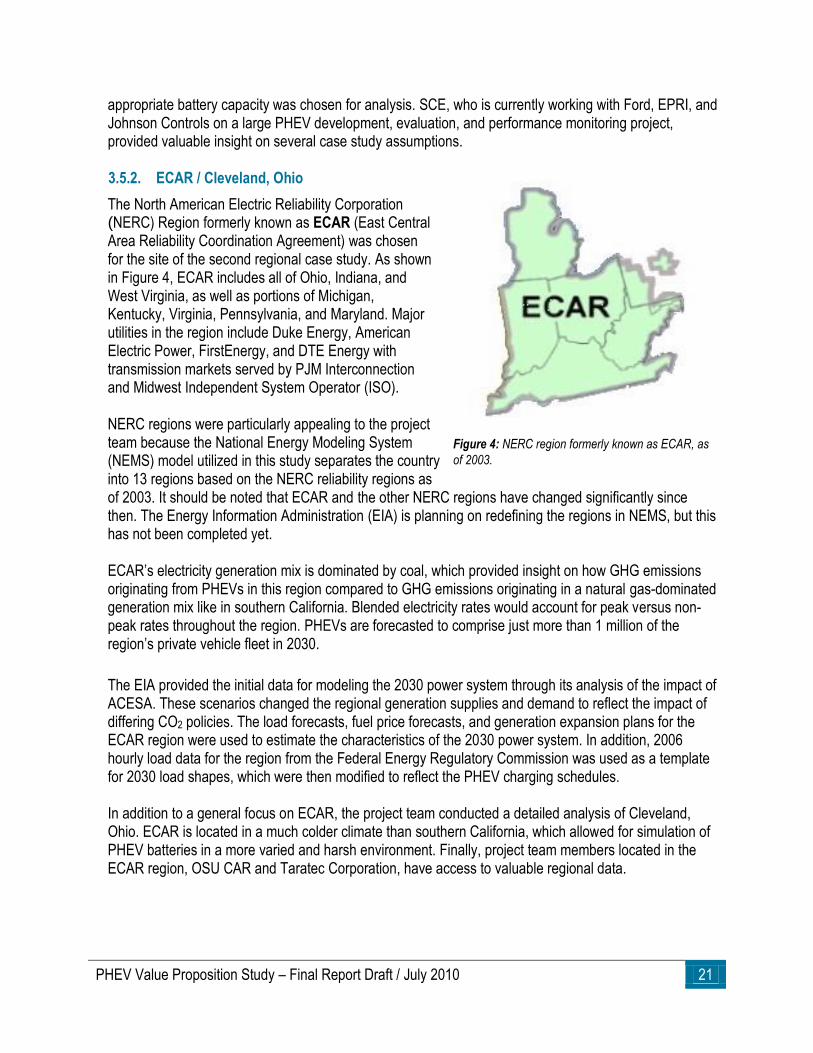
PHEV Value Proposition Study – Final Report Draft / July 2010 21
appropriate battery capacity was chosen for analysis. SCE, who is currently working with Ford, EPRI, and Johnson Controls on a large PHEV development, evaluation, and performance monitoring project, provided valuable insight on several case study assumptions. 3.5.2. ECAR / Cleveland, Ohio
The North American Electric Reliability Corporation (NERC) Region formerly known as ECAR (East Central Area Reliability Coordination Agreement) was chosen for the site of the second regional case study. As shown in Figure 4, ECAR includes all of Ohio, Indiana, and West Virginia, as well as portions of Michigan, Kentucky, Virginia, Pennsylvania, and Maryland. Major utilities in the region include Duke Energy, American Electric Power, FirstEnergy, and DTE Energy with transmission markets served by PJM Interconnection and Midwest Independent System Operator (ISO). NERC regions were particularly appealing to the project team because the National Energy Modeling System (NEMS) model utilized in this study separates the country into 13 regions based on the NERC reliability regions as of 2003. It should be noted that ECAR and the other NERC regions have changed significantly since then. The Energy Information Administration (EIA) is planning on redefining the regions in NEMS, but this has not been completed yet. ECAR’s electricity generation mix is dominated by coal, which provided insight on how GHG emissions originating from PHEVs in this region compared to GHG emissions originating in a natural gas-dominated generation mix like in southern California. Blended electricity rates would account for peak versus non-peak rates throughout the region. PHEVs are forecasted to comprise just more than 1 million of the region’s private vehicle fleet in 2030.
The EIA provided the initial data for modeling the 2030 power system through its analysis of the impact of ACESA. These scenarios changed the regional generation supplies and demand to reflect the impact of differing CO2 policies. The load forecasts, fuel price forecasts, and generation expansion plans for the ECAR region were used to estimate the characteristics of the 2030 power system. In addition, 2006 hourly load data for the region from the Federal Energy Regulatory Commission was used as a template for 2030 load shapes, which were then modified to reflect the PHEV charging schedules. In addition to a general focus on ECAR, the project team conducted a detailed analysis of Cleveland, Ohio. ECAR is located in a much colder climate than southern California, which allowed for simulation of PHEV batteries in a more varied and harsh environment. Finally, project team members located in the ECAR region, OSU CAR and Taratec Corporation, have access to valuable regional data.
Figure 4: NERC region formerly known as ECAR, as
of 2003.

22 PHEV Value Proposition Study – Final Report Draft / July 2010
3.6. Sensitivity Analysis
In each regional case study, specific vehicle and market assumptions (e.g., fuel price, vehicle component cost) were defined in an attempt to best represent the future characteristics of that region. While these parameters were chosen with the most reliable information available, the likelihood of accurately predicting each set of case study values is problematic. Therefore, the regional case studies have been revisited to assess the sensitivity of several key modeling variables. A designated range (as opposed to a single data point) was set for each variable, and models were rerun to capture the market impact at the minimum and maximum points. By completing this sensitivity analysis, the effects of unanticipated or fluctuating values may become known. A summary of results from the sensitivity analysis can be found in Chapter 5.
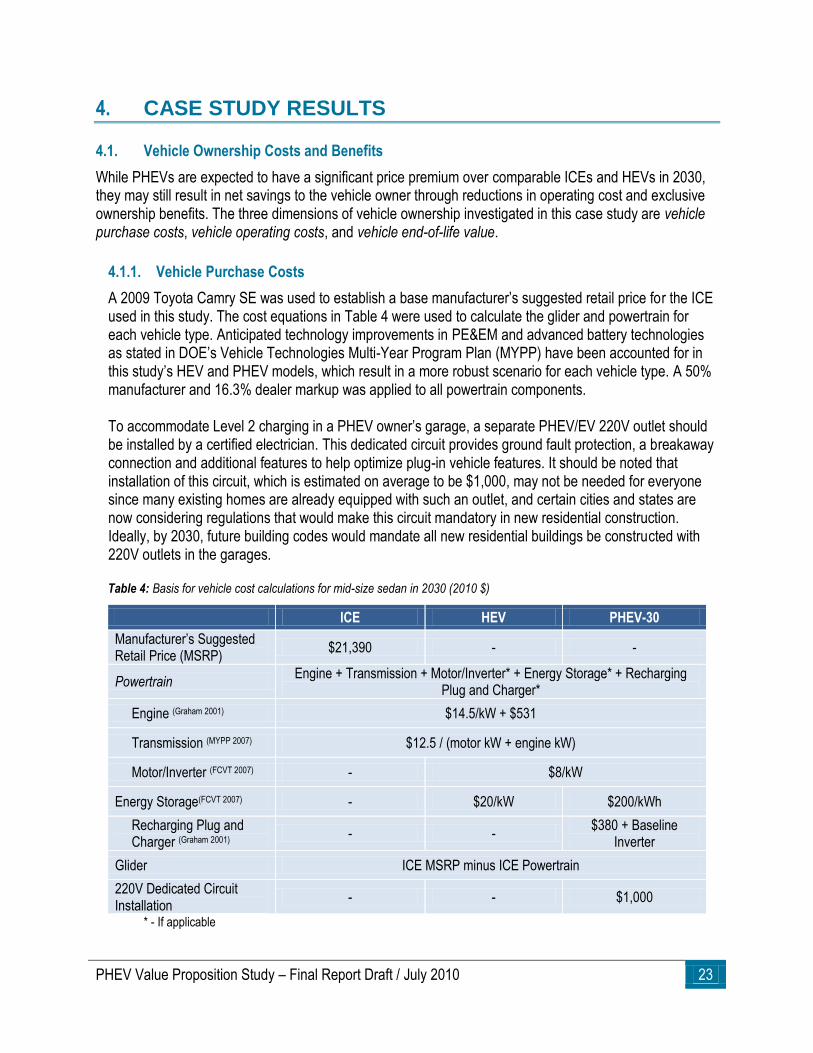
PHEV Value Proposition Study – Final Report Draft / July 2010 23
4. CASE STUDY RESULTS
4.1. Vehicle Ownership Costs and Benefits
While PHEVs are expected to have a significant price premium over comparable ICEs and HEVs in 2030, they may still result in net savings to the vehicle owner through reductions in operating cost and exclusive ownership benefits. The three dimensions of vehicle ownership investigated in this case study are vehicle purchase costs, vehicle operating costs, and vehicle end-of-life value.
4.1.1. Vehicle Purchase Costs
A 2009 Toyota Camry SE was used to establish a base manufacturer’s suggested retail price for the ICE used in this study. The cost equations in Table 4 were used to calculate the glider and powertrain for each vehicle type. Anticipated technology improvements in PE&EM and advanced battery technologies as stated in DOE’s Vehicle Technologies Multi-Year Program Plan (MYPP) have been accounted for in this study’s HEV and PHEV models, which result in a more robust scenario for each vehicle type. A 50% manufacturer and 16.3% dealer markup was applied to all powertrain components. To accommodate Level 2 charging in a PHEV owner’s garage, a separate PHEV/EV 220V outlet should be installed by a certified electrician. This dedicated circuit provides ground fault protection, a breakaway connection and additional features to help optimize plug-in vehicle features. It should be noted that installation of this circuit, which is estimated on average to be $1,000, may not be needed for everyone since many existing homes are already equipped with such an outlet, and certain cities and states are now considering regulations that would make this circuit mandatory in new residential construction. Ideally, by 2030, future building codes would mandate all new residential buildings be constructed with 220V outlets in the garages.
Table 4: Basis for vehicle cost calculations for mid-size sedan in 2030 (2010 $)
ICE HEV PHEV-30
Manufacturer’s Suggested Retail Price (MSRP)
$21,390 - -
Powertrain Engine + Transmission + Motor/Inverter* + Energy Storage* + Recharging
Plug and Charger*
Engine (Graham 2001) $14.5/kW + $531
Transmission (MYPP 2007) $12.5 / (motor kW + engine kW)
Motor/Inverter (FCVT 2007) - $8/kW
Energy Storage(FCVT 2007) - $20/kW $200/kWh
Recharging Plug and Charger (Graham 2001)
- - $380 + Baseline
Inverter
Glider ICE MSRP minus ICE Powertrain
220V Dedicated Circuit Installation
- - $1,000
* - If applicable
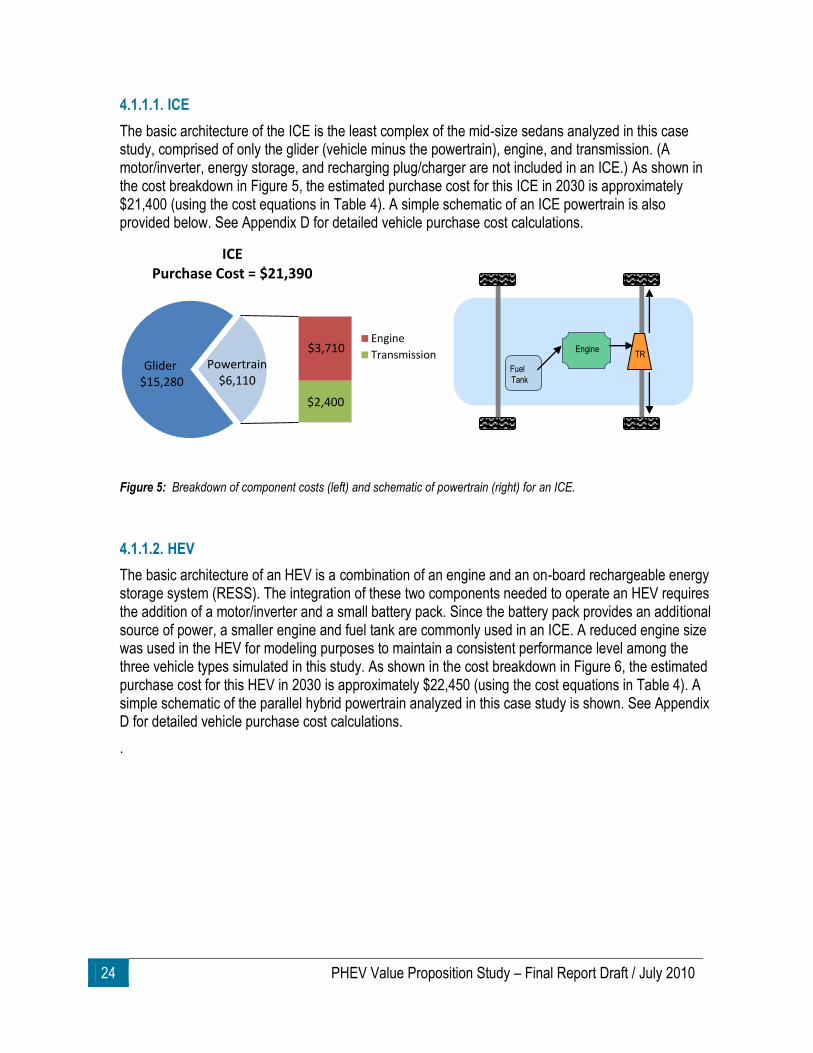
24 PHEV Value Proposition Study – Final Report Draft / July 2010
4.1.1.1. ICE
The basic architecture of the ICE is the least complex of the mid-size sedans analyzed in this case study, comprised of only the glider (vehicle minus the powertrain), engine, and transmission. (A motor/inverter, energy storage, and recharging plug/charger are not included in an ICE.) As shown in the cost breakdown in Figure 5, the estimated purchase cost for this ICE in 2030 is approximately $21,400 (using the cost equations in Table 4). A simple schematic of an ICE powertrain is also provided below. See Appendix D for detailed vehicle purchase cost calculations.
Figure 5: Breakdown of component costs (left) and schematic of powertrain (right) for an ICE.
4.1.1.2. HEV
The basic architecture of an HEV is a combination of an engine and an on-board rechargeable energy storage system (RESS). The integration of these two components needed to operate an HEV requires the addition of a motor/inverter and a small battery pack. Since the battery pack provides an additional source of power, a smaller engine and fuel tank are commonly used in an ICE. A reduced engine size was used in the HEV for modeling purposes to maintain a consistent performance level among the three vehicle types simulated in this study. As shown in the cost breakdown in Figure 6, the estimated purchase cost for this HEV in 2030 is approximately $22,450 (using the cost equations in Table 4). A simple schematic of the parallel hybrid powertrain analyzed in this case study is shown. See Appendix D for detailed vehicle purchase cost calculations.
.
Glider $15,280
$3,710
$2,400
Powertrain $6,110
ICE Purchase Cost = $21,390
Engine
Transmission
Fuel
Tank
Engine TR
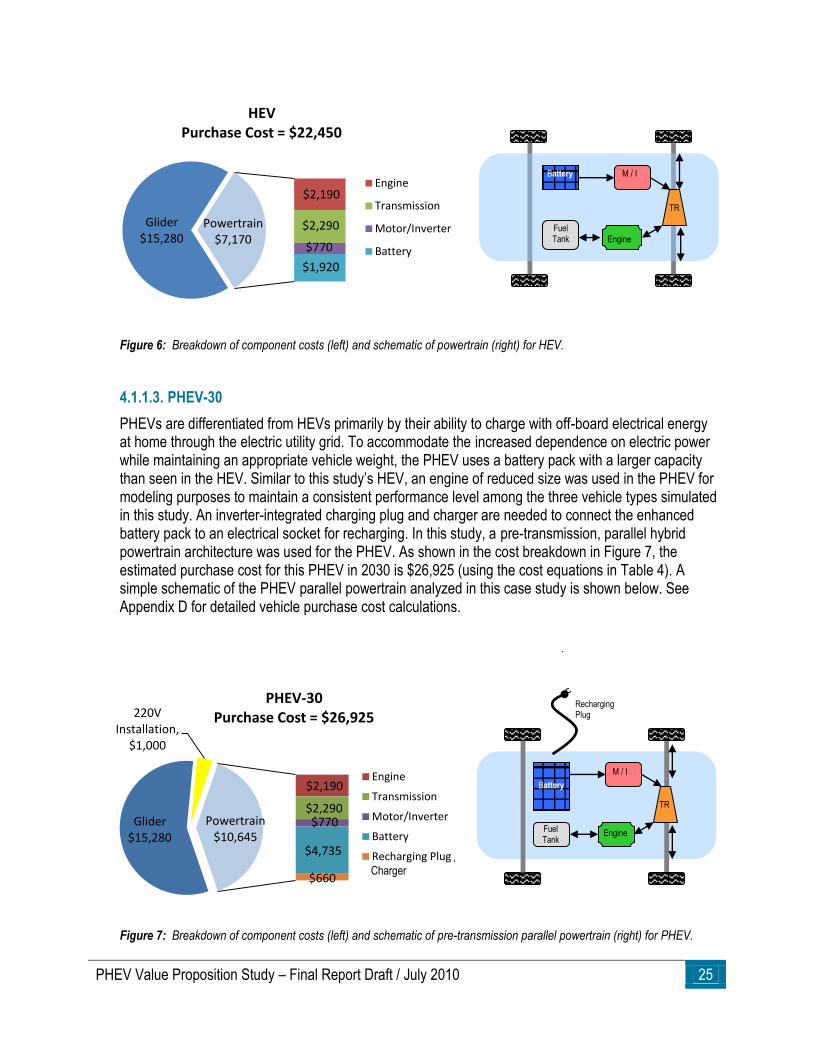
PHEV Value Proposition Study – Final Report Draft / July 2010 25
Figure 6: Breakdown of component costs (left) and schematic of powertrain (right) for HEV.
4.1.1.3. PHEV-30
PHEVs are differentiated from HEVs primarily by their ability to charge with off-board electrical energy at home through the electric utility grid. To accommodate the increased dependence on electric power while maintaining an appropriate vehicle weight, the PHEV uses a battery pack with a larger capacity than seen in the HEV. Similar to this study’s HEV, an engine of reduced size was used in the PHEV for modeling purposes to maintain a consistent performance level among the three vehicle types simulated in this study. An inverter-integrated charging plug and charger are needed to connect the enhanced battery pack to an electrical socket for recharging. In this study, a pre-transmission, parallel hybrid powertrain architecture was used for the PHEV. As shown in the cost breakdown in Figure 7, the estimated purchase cost for this PHEV in 2030 is $26,925 (using the cost equations in Table 4). A simple schematic of the PHEV parallel powertrain analyzed in this case study is shown below. See Appendix D for detailed vehicle purchase cost calculations.
Figure 7: Breakdown of component costs (left) and schematic of pre-transmission parallel powertrain (right) for PHEV.
Glider $15,280
$2,190
$2,290
$770
$1,920
Powertrain $7,170
HEV Purchase Cost = $22,450
Engine
Transmission
Motor/Inverter
Battery
Glider $15,280
$2,190
$2,290 $770
$4,735
$660
220V Installation,
$1,000
Powertrain $10,645
PHEV-30 Purchase Cost = $26,925
Engine
Transmission
Motor/Inverter
Battery
Recharging Plug / Charger
M/I
TR
Engine Fuel Tank
Battery
Charger
Recharging Plug
Battery M / I
Fuel Tank Engine
TR
Engine
TR
M / I
Battery
Fuel Tank
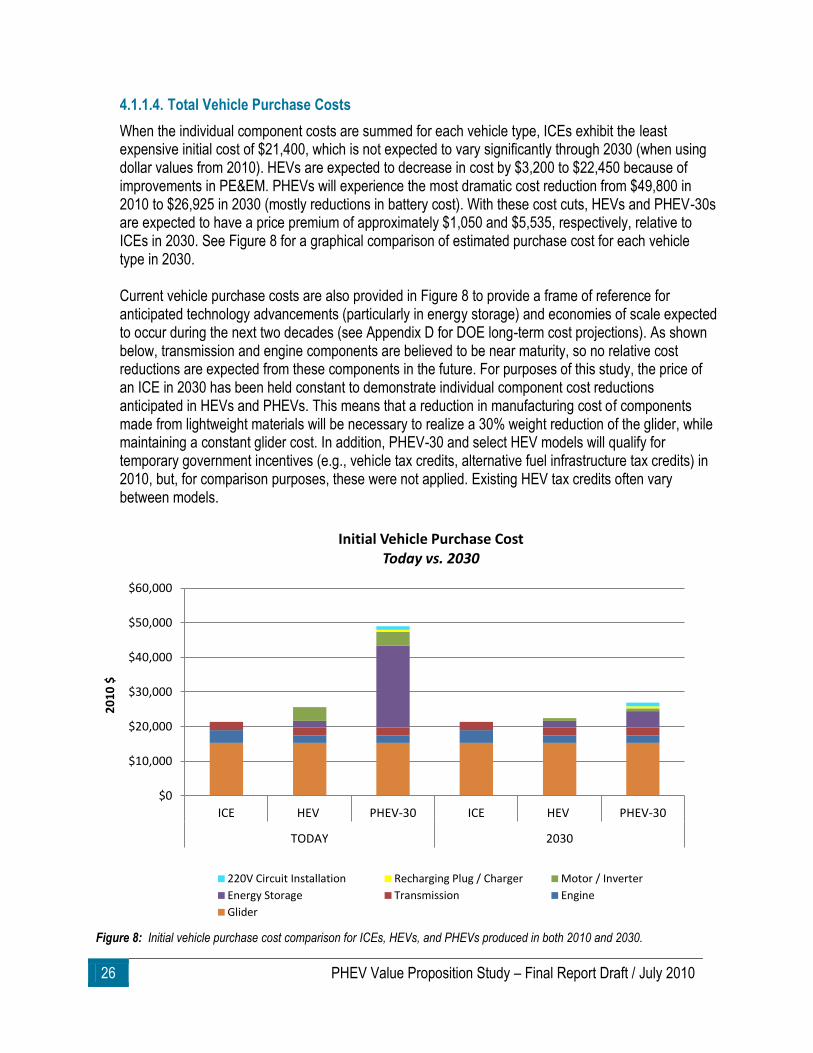
26 PHEV Value Proposition Study – Final Report Draft / July 2010
4.1.1.4. Total Vehicle Purchase Costs
When the individual component costs are summed for each vehicle type, ICEs exhibit the least expensive initial cost of $21,400, which is not expected to vary significantly through 2030 (when using dollar values from 2010). HEVs are expected to decrease in cost by $3,200 to $22,450 because of improvements in PE&EM. PHEVs will experience the most dramatic cost reduction from $49,800 in 2010 to $26,925 in 2030 (mostly reductions in battery cost). With these cost cuts, HEVs and PHEV-30s are expected to have a price premium of approximately $1,050 and $5,535, respectively, relative to ICEs in 2030. See Figure 8 for a graphical comparison of estimated purchase cost for each vehicle type in 2030. Current vehicle purchase costs are also provided in Figure 8 to provide a frame of reference for anticipated technology advancements (particularly in energy storage) and economies of scale expected to occur during the next two decades (see Appendix D for DOE long-term cost projections). As shown below, transmission and engine components are believed to be near maturity, so no relative cost reductions are expected from these components in the future. For purposes of this study, the price of an ICE in 2030 has been held constant to demonstrate individual component cost reductions anticipated in HEVs and PHEVs. This means that a reduction in manufacturing cost of components made from lightweight materials will be necessary to realize a 30% weight reduction of the glider, while maintaining a constant glider cost. In addition, PHEV-30 and select HEV models will qualify for temporary government incentives (e.g., vehicle tax credits, alternative fuel infrastructure tax credits) in 2010, but, for comparison purposes, these were not applied. Existing HEV tax credits often vary between models.
Figure 8: Initial vehicle purchase cost comparison for ICEs, HEVs, and PHEVs produced in both 2010 and 2030.
$0
$10,000
$20,000
$30,000
$40,000
$50,000
$60,000
ICE HEV PHEV-30 ICE HEV PHEV-30
TODAY 2030
20
10
$
Initial Vehicle Purchase Cost Today vs. 2030
220V Circuit Installation Recharging Plug / Charger Motor / Inverter
Energy Storage Transmission Engine
Glider
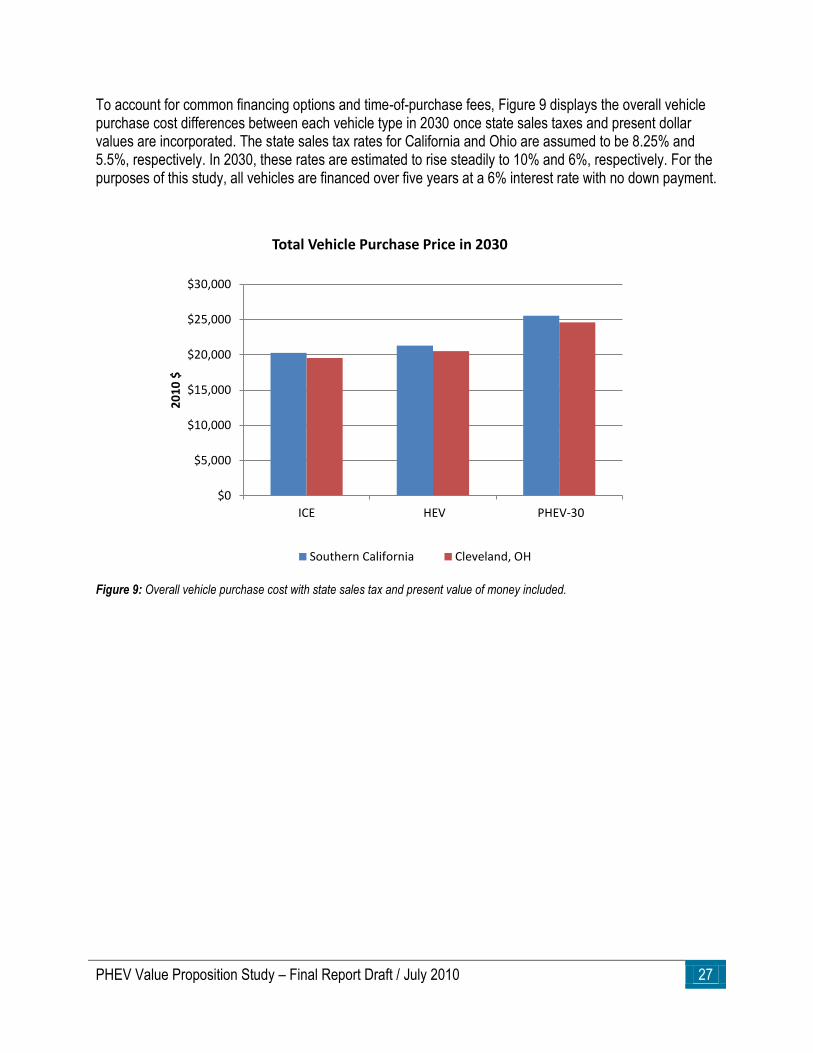
PHEV Value Proposition Study – Final Report Draft / July 2010 27
To account for common financing options and time-of-purchase fees, Figure 9 displays the overall vehicle purchase cost differences between each vehicle type in 2030 once state sales taxes and present dollar values are incorporated. The state sales tax rates for California and Ohio are assumed to be 8.25% and 5.5%, respectively. In 2030, these rates are estimated to rise steadily to 10% and 6%, respectively. For the purposes of this study, all vehicles are financed over five years at a 6% interest rate with no down payment.
Figure 9: Overall vehicle purchase cost with state sales tax and present value of money included.
$0
$5,000
$10,000
$15,000
$20,000
$25,000
$30,000
ICE HEV PHEV-30
20
10
$
Total Vehicle Purchase Price in 2030
Southern California Cleveland, OH
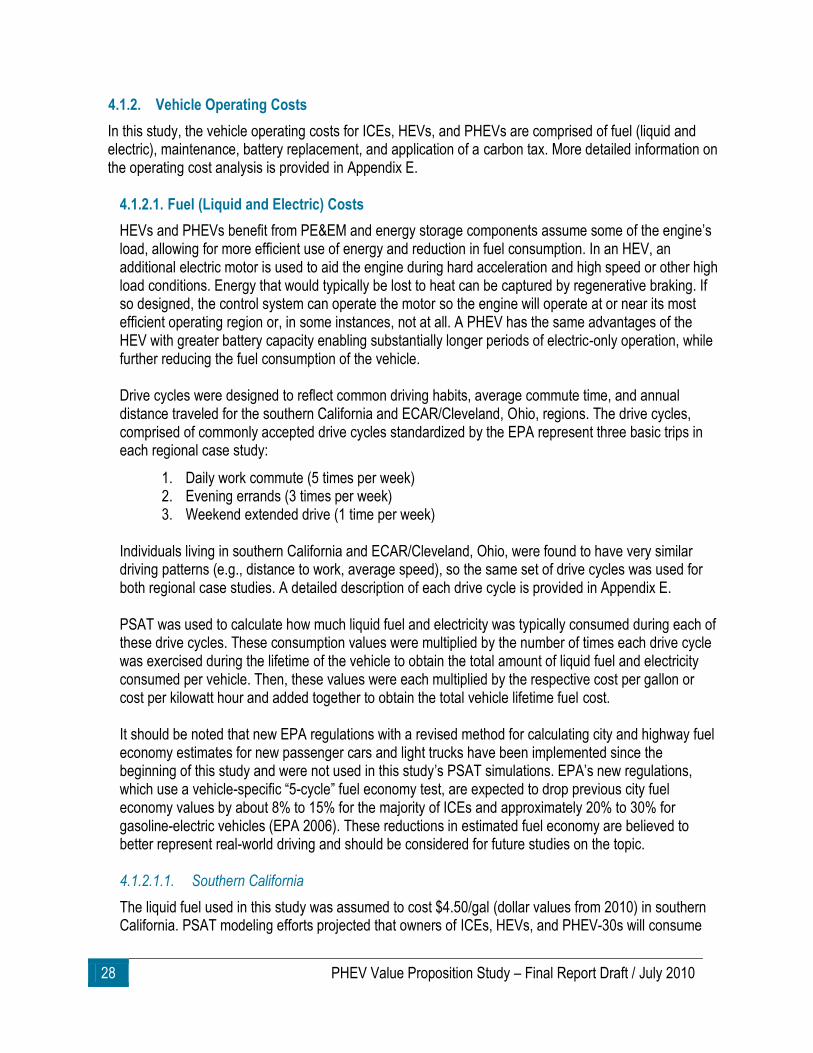
28 PHEV Value Proposition Study – Final Report Draft / July 2010
4.1.2. Vehicle Operating Costs
In this study, the vehicle operating costs for ICEs, HEVs, and PHEVs are comprised of fuel (liquid and electric), maintenance, battery replacement, and application of a carbon tax. More detailed information on the operating cost analysis is provided in Appendix E.
4.1.2.1. Fuel (Liquid and Electric) Costs
HEVs and PHEVs benefit from PE&EM and energy storage components assume some of the engine’s load, allowing for more efficient use of energy and reduction in fuel consumption. In an HEV, an additional electric motor is used to aid the engine during hard acceleration and high speed or other high load conditions. Energy that would typically be lost to heat can be captured by regenerative braking. If so designed, the control system can operate the motor so the engine will operate at or near its most efficient operating region or, in some instances, not at all. A PHEV has the same advantages of the HEV with greater battery capacity enabling substantially longer periods of electric-only operation, while further reducing the fuel consumption of the vehicle.
Drive cycles were designed to reflect common driving habits, average commute time, and annual distance traveled for the southern California and ECAR/Cleveland, Ohio, regions. The drive cycles, comprised of commonly accepted drive cycles standardized by the EPA represent three basic trips in each regional case study:
1. Daily work commute (5 times per week) 2. Evening errands (3 times per week) 3. Weekend extended drive (1 time per week)
Individuals living in southern California and ECAR/Cleveland, Ohio, were found to have very similar driving patterns (e.g., distance to work, average speed), so the same set of drive cycles was used for both regional case studies. A detailed description of each drive cycle is provided in Appendix E.
PSAT was used to calculate how much liquid fuel and electricity was typically consumed during each of these drive cycles. These consumption values were multiplied by the number of times each drive cycle was exercised during the lifetime of the vehicle to obtain the total amount of liquid fuel and electricity consumed per vehicle. Then, these values were each multiplied by the respective cost per gallon or cost per kilowatt hour and added together to obtain the total vehicle lifetime fuel cost. It should be noted that new EPA regulations with a revised method for calculating city and highway fuel economy estimates for new passenger cars and light trucks have been implemented since the beginning of this study and were not used in this study’s PSAT simulations. EPA’s new regulations, which use a vehicle-specific ―5-cycle‖ fuel economy test, are expected to drop previous city fuel economy values by about 8% to 15% for the majority of ICEs and approximately 20% to 30% for gasoline-electric vehicles (EPA 2006). These reductions in estimated fuel economy are believed to better represent real-world driving and should be considered for future studies on the topic. 4.1.2.1.1. Southern California
The liquid fuel used in this study was assumed to cost $4.50/gal (dollar values from 2010) in southern California. PSAT modeling efforts projected that owners of ICEs, HEVs, and PHEV-30s will consume
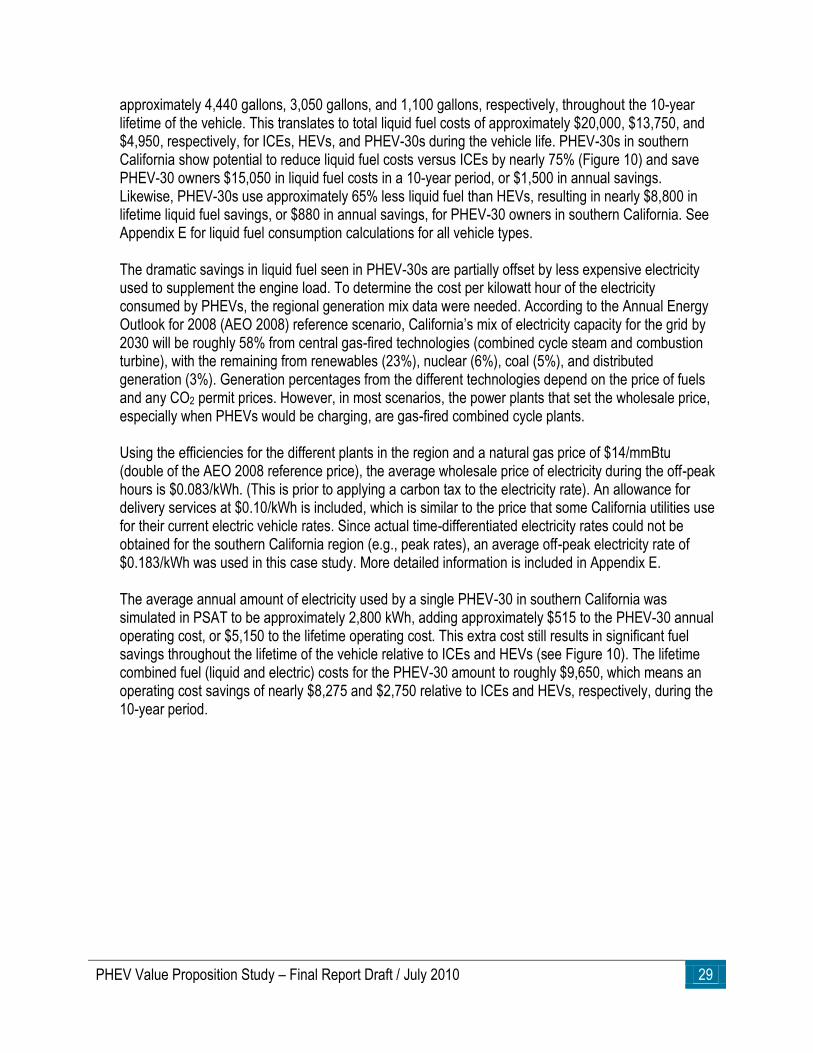
PHEV Value Proposition Study – Final Report Draft / July 2010 29
approximately 4,440 gallons, 3,050 gallons, and 1,100 gallons, respectively, throughout the 10-year lifetime of the vehicle. This translates to total liquid fuel costs of approximately $20,000, $13,750, and $4,950, respectively, for ICEs, HEVs, and PHEV-30s during the vehicle life. PHEV-30s in southern California show potential to reduce liquid fuel costs versus ICEs by nearly 75% (Figure 10) and save PHEV-30 owners $15,050 in liquid fuel costs in a 10-year period, or $1,500 in annual savings. Likewise, PHEV-30s use approximately 65% less liquid fuel than HEVs, resulting in nearly $8,800 in lifetime liquid fuel savings, or $880 in annual savings, for PHEV-30 owners in southern California. See Appendix E for liquid fuel consumption calculations for all vehicle types. The dramatic savings in liquid fuel seen in PHEV-30s are partially offset by less expensive electricity used to supplement the engine load. To determine the cost per kilowatt hour of the electricity consumed by PHEVs, the regional generation mix data were needed. According to the Annual Energy Outlook for 2008 (AEO 2008) reference scenario, California’s mix of electricity capacity for the grid by 2030 will be roughly 58% from central gas-fired technologies (combined cycle steam and combustion turbine), with the remaining from renewables (23%), nuclear (6%), coal (5%), and distributed generation (3%). Generation percentages from the different technologies depend on the price of fuels and any CO2 permit prices. However, in most scenarios, the power plants that set the wholesale price, especially when PHEVs would be charging, are gas-fired combined cycle plants. Using the efficiencies for the different plants in the region and a natural gas price of $14/mmBtu (double of the AEO 2008 reference price), the average wholesale price of electricity during the off-peak hours is $0.083/kWh. (This is prior to applying a carbon tax to the electricity rate). An allowance for delivery services at $0.10/kWh is included, which is similar to the price that some California utilities use for their current electric vehicle rates. Since actual time-differentiated electricity rates could not be obtained for the southern California region (e.g., peak rates), an average off-peak electricity rate of $0.183/kWh was used in this case study. More detailed information is included in Appendix E. The average annual amount of electricity used by a single PHEV-30 in southern California was simulated in PSAT to be approximately 2,800 kWh, adding approximately $515 to the PHEV-30 annual operating cost, or $5,150 to the lifetime operating cost. This extra cost still results in significant fuel savings throughout the lifetime of the vehicle relative to ICEs and HEVs (see Figure 10). The lifetime combined fuel (liquid and electric) costs for the PHEV-30 amount to roughly $9,650, which means an operating cost savings of nearly $8,275 and $2,750 relative to ICEs and HEVs, respectively, during the 10-year period.
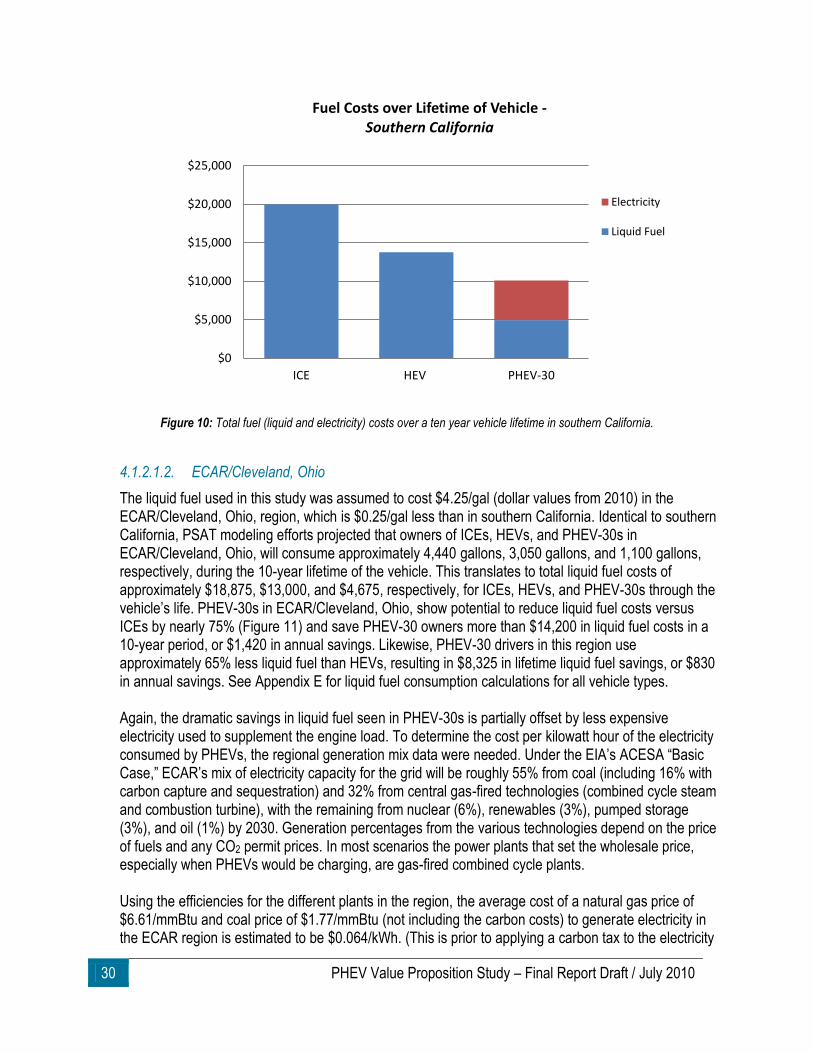
30 PHEV Value Proposition Study – Final Report Draft / July 2010
Figure 10: Total fuel (liquid and electricity) costs over a ten year vehicle lifetime in southern California.
4.1.2.1.2. ECAR/Cleveland, Ohio
The liquid fuel used in this study was assumed to cost $4.25/gal (dollar values from 2010) in the ECAR/Cleveland, Ohio, region, which is $0.25/gal less than in southern California. Identical to southern California, PSAT modeling efforts projected that owners of ICEs, HEVs, and PHEV-30s in ECAR/Cleveland, Ohio, will consume approximately 4,440 gallons, 3,050 gallons, and 1,100 gallons, respectively, during the 10-year lifetime of the vehicle. This translates to total liquid fuel costs of approximately $18,875, $13,000, and $4,675, respectively, for ICEs, HEVs, and PHEV-30s through the vehicle’s life. PHEV-30s in ECAR/Cleveland, Ohio, show potential to reduce liquid fuel costs versus ICEs by nearly 75% (Figure 11) and save PHEV-30 owners more than $14,200 in liquid fuel costs in a 10-year period, or $1,420 in annual savings. Likewise, PHEV-30 drivers in this region use approximately 65% less liquid fuel than HEVs, resulting in $8,325 in lifetime liquid fuel savings, or $830 in annual savings. See Appendix E for liquid fuel consumption calculations for all vehicle types. Again, the dramatic savings in liquid fuel seen in PHEV-30s is partially offset by less expensive electricity used to supplement the engine load. To determine the cost per kilowatt hour of the electricity consumed by PHEVs, the regional generation mix data were needed. Under the EIA’s ACESA ―Basic Case,‖ ECAR’s mix of electricity capacity for the grid will be roughly 55% from coal (including 16% with carbon capture and sequestration) and 32% from central gas-fired technologies (combined cycle steam and combustion turbine), with the remaining from nuclear (6%), renewables (3%), pumped storage (3%), and oil (1%) by 2030. Generation percentages from the various technologies depend on the price of fuels and any CO2 permit prices. In most scenarios the power plants that set the wholesale price, especially when PHEVs would be charging, are gas-fired combined cycle plants. Using the efficiencies for the different plants in the region, the average cost of a natural gas price of $6.61/mmBtu and coal price of $1.77/mmBtu (not including the carbon costs) to generate electricity in the ECAR region is estimated to be $0.064/kWh. (This is prior to applying a carbon tax to the electricity
$0
$5,000
$10,000
$15,000
$20,000
$25,000
ICE HEV PHEV-30
Fuel Costs over Lifetime of Vehicle - Southern California
Electricity
Liquid Fuel
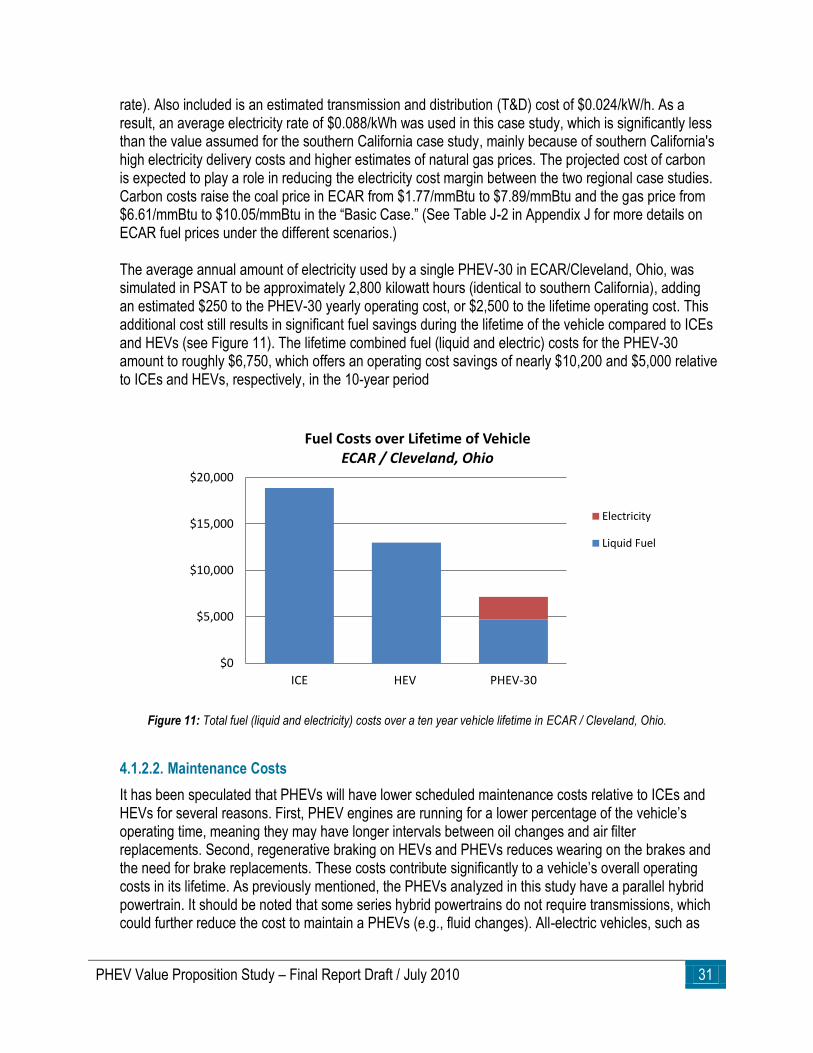
PHEV Value Proposition Study – Final Report Draft / July 2010 31
rate). Also included is an estimated transmission and distribution (T&D) cost of $0.024/kW/h. As a result, an average electricity rate of $0.088/kWh was used in this case study, which is significantly less than the value assumed for the southern California case study, mainly because of southern California's high electricity delivery costs and higher estimates of natural gas prices. The projected cost of carbon is expected to play a role in reducing the electricity cost margin between the two regional case studies. Carbon costs raise the coal price in ECAR from $1.77/mmBtu to $7.89/mmBtu and the gas price from $6.61/mmBtu to $10.05/mmBtu in the ―Basic Case.‖ (See Table J-2 in Appendix J for more details on ECAR fuel prices under the different scenarios.) The average annual amount of electricity used by a single PHEV-30 in ECAR/Cleveland, Ohio, was simulated in PSAT to be approximately 2,800 kilowatt hours (identical to southern California), adding an estimated $250 to the PHEV-30 yearly operating cost, or $2,500 to the lifetime operating cost. This additional cost still results in significant fuel savings during the lifetime of the vehicle compared to ICEs and HEVs (see Figure 11). The lifetime combined fuel (liquid and electric) costs for the PHEV-30 amount to roughly $6,750, which offers an operating cost savings of nearly $10,200 and $5,000 relative to ICEs and HEVs, respectively, in the 10-year period
Figure 11: Total fuel (liquid and electricity) costs over a ten year vehicle lifetime in ECAR / Cleveland, Ohio.
4.1.2.2. Maintenance Costs
It has been speculated that PHEVs will have lower scheduled maintenance costs relative to ICEs and HEVs for several reasons. First, PHEV engines are running for a lower percentage of the vehicle’s operating time, meaning they may have longer intervals between oil changes and air filter replacements. Second, regenerative braking on HEVs and PHEVs reduces wearing on the brakes and the need for brake replacements. These costs contribute significantly to a vehicle’s overall operating costs in its lifetime. As previously mentioned, the PHEVs analyzed in this study have a parallel hybrid powertrain. It should be noted that some series hybrid powertrains do not require transmissions, which could further reduce the cost to maintain a PHEVs (e.g., fluid changes). All-electric vehicles, such as
$0
$5,000
$10,000
$15,000
$20,000
ICE HEV PHEV-30
Fuel Costs over Lifetime of Vehicle ECAR / Cleveland, Ohio
Electricity
Liquid Fuel
32 PHEV Value Proposition Study – Final Report Draft / July 2010
the Nissan LEAF, have even fewer components than PHEVs, and are projected to have minimal scheduled maintenance costs. The lifetime scheduled vehicle maintenance costs are shown in Figure 12, using EPRI’s 2001 study titled ―Comparing the Benefits and Impacts of Hybrid Electric Vehicle Options‖ as a general guideline for cost data and intervals between individual services. According to the figure, PHEV-30s have the potential to save about $1,800 relative to a comparable ICE and $1,150 versus comparable HEVs during the assumed lifetime of the vehicle (10 years). The AAA Driving Costs 2009 was also sought for information on maintenance costs per mile for mid-size sedans for a comparison. The total lifetime scheduled maintenance cost is anticipated to be roughly the same for both the southern California and ECAR/Cleveland, Ohio, case studies. See Appendix F for detailed scheduled maintenance cost calculations.
Figure 12: Cumulative scheduled maintenance costs for ICEs, HEVs, and PHEVs over ten year vehicle lifetime.
Because of the absence of unscheduled maintenance data (e.g., unexpected repairs), an accurate cost comparison between each vehicle type could not be performed. The increased number of powertrain components susceptible to failure is greater in PHEVs than in HEVs or ICEs. So it is not unreasonable to assume that unscheduled repair costs will be higher relative to ICEs, potentially canceling out cost savings from scheduled maintenance resulting from PHEVs.
4.1.2.3. Carbon Tax
Participants in the workshop’s Breakout Session 5 forecasted that a carbon tax would be instituted in the transportation sector by 2030, which is expected to be regulated on an international basis. For each case study, a charge of $65 was applied to every metric ton (dollar values from 2010) of CO2 emitted during vehicle fuel combustion and electricity production, a charge amount which was chosen to match the EIA’s projected allowance price under the ACESA ―Basic Case‖ for 2030. To estimate the increase in operating cost attributable to a carbon tax, the CO2 emitted by each vehicle through fuel combustion and electricity consumption was simulated using GREET (see Appendix G for
$0
$2,000
$4,000
$6,000
$8,000
ICE HEV PHEV-30
Total Lifetime Maintenance Cost
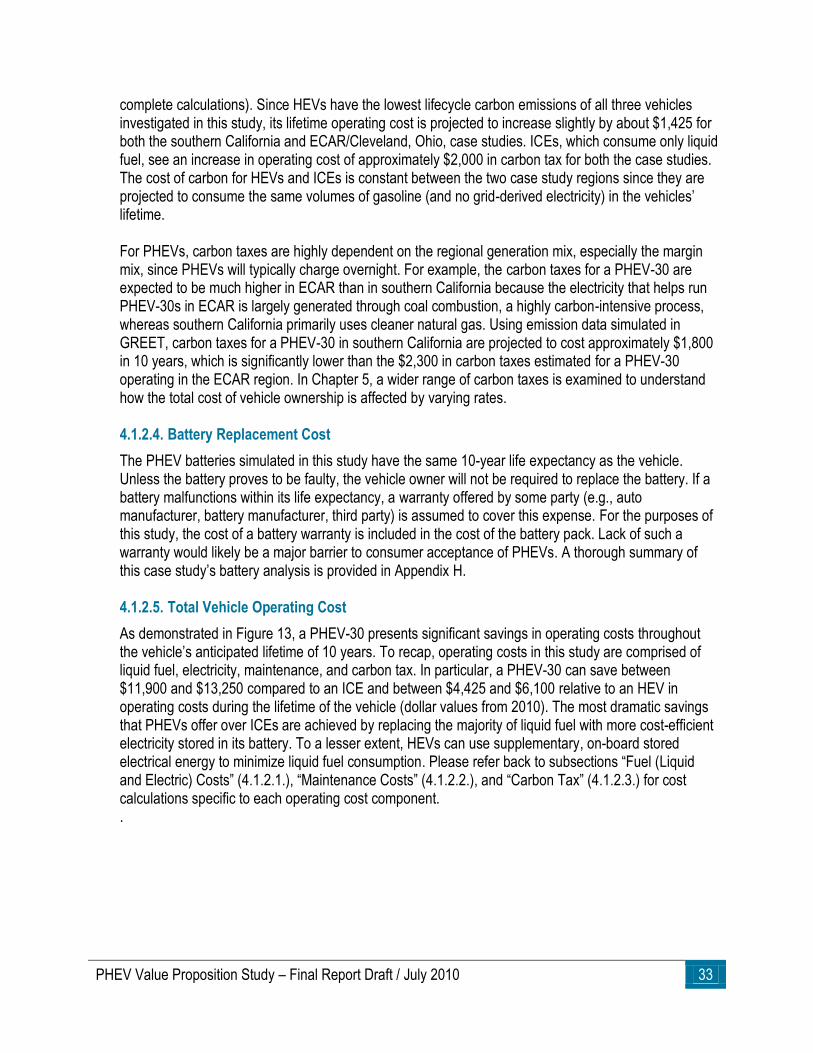
PHEV Value Proposition Study – Final Report Draft / July 2010 33
complete calculations). Since HEVs have the lowest lifecycle carbon emissions of all three vehicles investigated in this study, its lifetime operating cost is projected to increase slightly by about $1,425 for both the southern California and ECAR/Cleveland, Ohio, case studies. ICEs, which consume only liquid fuel, see an increase in operating cost of approximately $2,000 in carbon tax for both the case studies. The cost of carbon for HEVs and ICEs is constant between the two case study regions since they are projected to consume the same volumes of gasoline (and no grid-derived electricity) in the vehicles’ lifetime. For PHEVs, carbon taxes are highly dependent on the regional generation mix, especially the margin mix, since PHEVs will typically charge overnight. For example, the carbon taxes for a PHEV-30 are expected to be much higher in ECAR than in southern California because the electricity that helps run PHEV-30s in ECAR is largely generated through coal combustion, a highly carbon-intensive process, whereas southern California primarily uses cleaner natural gas. Using emission data simulated in GREET, carbon taxes for a PHEV-30 in southern California are projected to cost approximately $1,800 in 10 years, which is significantly lower than the $2,300 in carbon taxes estimated for a PHEV-30 operating in the ECAR region. In Chapter 5, a wider range of carbon taxes is examined to understand how the total cost of vehicle ownership is affected by varying rates. 4.1.2.4. Battery Replacement Cost
The PHEV batteries simulated in this study have the same 10-year life expectancy as the vehicle. Unless the battery proves to be faulty, the vehicle owner will not be required to replace the battery. If a battery malfunctions within its life expectancy, a warranty offered by some party (e.g., auto manufacturer, battery manufacturer, third party) is assumed to cover this expense. For the purposes of this study, the cost of a battery warranty is included in the cost of the battery pack. Lack of such a warranty would likely be a major barrier to consumer acceptance of PHEVs. A thorough summary of this case study’s battery analysis is provided in Appendix H.
4.1.2.5. Total Vehicle Operating Cost
As demonstrated in Figure 13, a PHEV-30 presents significant savings in operating costs throughout the vehicle’s anticipated lifetime of 10 years. To recap, operating costs in this study are comprised of liquid fuel, electricity, maintenance, and carbon tax. In particular, a PHEV-30 can save between $11,900 and $13,250 compared to an ICE and between $4,425 and $6,100 relative to an HEV in operating costs during the lifetime of the vehicle (dollar values from 2010). The most dramatic savings that PHEVs offer over ICEs are achieved by replacing the majority of liquid fuel with more cost-efficient electricity stored in its battery. To a lesser extent, HEVs can use supplementary, on-board stored electrical energy to minimize liquid fuel consumption. Please refer back to subsections ―Fuel (Liquid and Electric) Costs‖ (4.1.2.1.), ―Maintenance Costs‖ (4.1.2.2.), and ―Carbon Tax‖ (4.1.2.3.) for cost calculations specific to each operating cost component. .
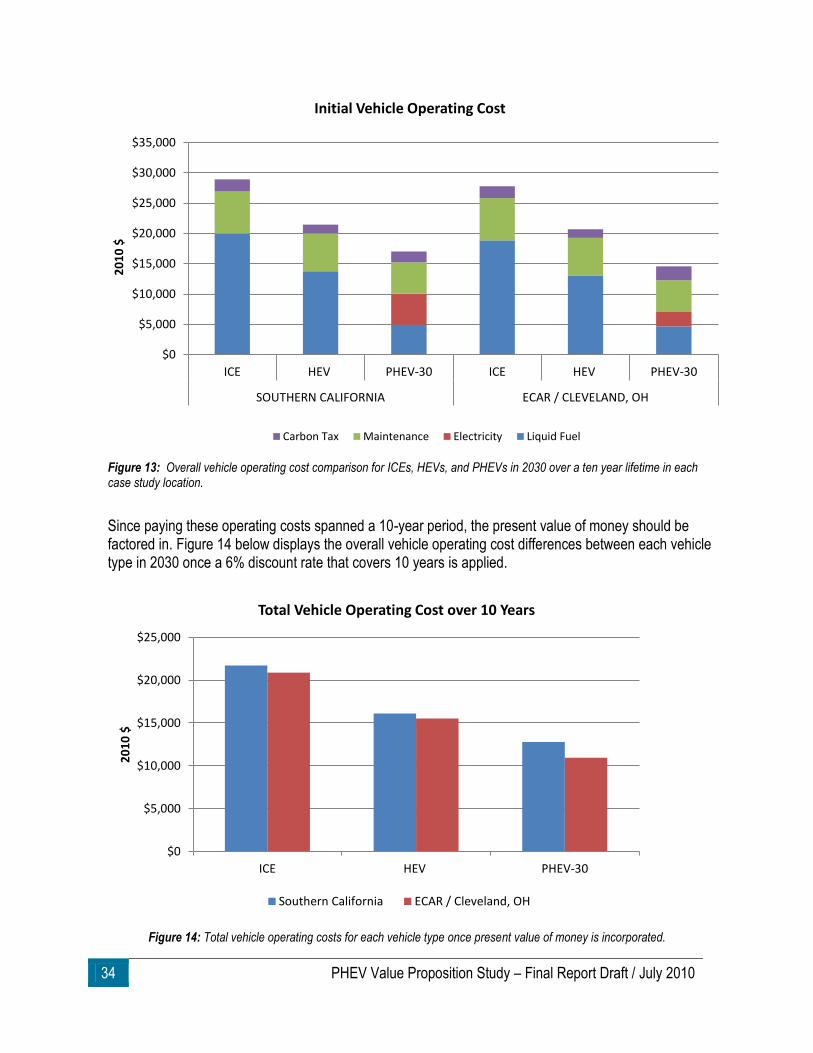
34 PHEV Value Proposition Study – Final Report Draft / July 2010
Figure 13: Overall vehicle operating cost comparison for ICEs, HEVs, and PHEVs in 2030 over a ten year lifetime in each case study location.
Since paying these operating costs spanned a 10-year period, the present value of money should be factored in. Figure 14 below displays the overall vehicle operating cost differences between each vehicle type in 2030 once a 6% discount rate that covers 10 years is applied.
Figure 14: Total vehicle operating costs for each vehicle type once present value of money is incorporated.
$0
$5,000
$10,000
$15,000
$20,000
$25,000
$30,000
$35,000
ICE HEV PHEV-30 ICE HEV PHEV-30
SOUTHERN CALIFORNIA ECAR / CLEVELAND, OH
20
10
$
Initial Vehicle Operating Cost
Carbon Tax Maintenance Electricity Liquid Fuel
$0
$5,000
$10,000
$15,000
$20,000
$25,000
ICE HEV PHEV-30
20
10
$
Total Vehicle Operating Cost over 10 Years
Southern California ECAR / Cleveland, OH
PHEV Value Proposition Study – Final Report Draft / July 2010 35
4.1.3. Vehicle End-of-Life Value
Research has shown that a multitude of secondary applications exist that can utilize the residual capacity in automotive Li-ion battery packs once they have reached end-of-life, meaning the pack can no longer provide 80% of the energy (needed for vehicle range) or 80% of the peak power (needed for acceleration) of a new pack (Cready 2003). This prompted investigating a potential battery recycling credit in this study to help PHEV owners recover a portion of costs associated with owning and operating a PHEV. For the purposes of this study, PHEV batteries are assumed to exceed 80% of energy and peak power (7.8 kWh) for at least 10 years, or approximately 150,000 miles. At 10 years, PHEV owners may salvage their PHEV batteries in exchange for a potential recycling credit. A report published by Sandia National Laboratory (SNL) estimated the value of a 1 kWh battery with 90% charging efficiency to be worth $32 annually for energy arbitrage purposes (Iannucci 2005). The value of this study’s battery (7.85 kWh at end-of-life) would then equate to roughly $250 annually. This is based on the assumption that a 0.2 kWh/yr degradation rate throughout 10 years would result in a 7 kWh average power during secondary use, which is consistent with a major utility’s estimate of end-of-use Li-ion battery value. That methodology is explained in Appendix I. If the battery pack remains in working order for an average of five to 10 years beyond its vehicle lifetime, its cumulative net present value (NPV) to the secondary owner would likely be in the range of $850-$1,250. Once dealerships and/or other third parties are compensated for collection and handling and have obtained an reasonable profit margin, an average battery recycling credit is estimated to be $500 (NPV) offered to the PHEV owner once the battery is salvaged at approximately 10 years after initial vehicle purchase. Alternatively, consumers could ―cash in‖ this residual value upfront when they purchase the PHEV, helping to partially offset the vehicle’s initial price premium. This concept, recommended by the Electrification Coalition – a committee of executive level industry stakeholder with a mission to promote government action in support of mass scale electric vehicle deployment – in its recent Electrification Roadmap, would first require the establishment of a guaranteed residual value for such batteries. As noted by the coalition, a large degree of uncertainty still exists in this young market, and secondary markets have no experience incorporating these end-of-life batteries into normal operation. A solid residual value applicable at time-of-purchase may not be attainable until the first generation of batteries has entered secondary markets.
4.1.4. “Convenience” Benefits
As shown in recent sections, the cost to own and operate a PHEV is very comparable to that of an HEV over each vehicle’s lifetime. Unique, non-monetary benefits that only PHEVs can offer may play a critical role in attracting consumers. Several surveys have been conducted by universities – mainly from the University of Michigan and the University of California, Davis, – to assess consumer interest in owning or paying extra for vehicles with certain novel attributes. While insightful, these surveys typically do not assign a monetary value for each attribute. Similarly, this study discusses the value of intangible benefits in a qualitative manner only. Below are value propositions, identified by workshop participants and the project team, that may affect consumer buying habits even though they are generally not reflected in the price tag of a PHEV.
36 PHEV Value Proposition Study – Final Report Draft / July 2010
Emergency back-up power: Most PHEVs will likely be capable of performing residential V2B functions by 2030 with the help of smart charging equipment. V2B permits bidirectional electricity flow between the vehicle and a specific building, in this case, the owner’s home. In a power outage, residential V2B allows PHEV owners to operate a few critical appliances with energy stored in the vehicle’s battery by acting as an uninterruptible power supply until the utility power has been restored. According to an Opinion Research Corporation International (ORCI) survey conducted in 2003, more than 50% of individuals would pay extra for this feature on their next vehicle purchase (Patterson 2007). It has been suggested that the monetary value of this function could be near or equivalent to the cost of a basic home standby generator, which typically starts at around $2,500.
Charging versatility: By 2030, PHEVs are expected to offer dual charging capabilities, meaning the vehicle can be charged at 110V and 220V outlets, potentially in addition to 440V rapid charging outlets. PHEVs would not be limited to a specific charging station at home, but instead can recharge at any parking space with access to one of these outlets.
Access to electrical outlet: A PHEV’s electrical outlet can act as a source of power when away from home, assuming the vehicle has bidirectional electricity flow capabilities. This is especially handy for tailgating and camping applications that utilize small appliances (e.g., televisions, cooking equipment, power tools). According to an ORCI survey conducted in 2003, 46% of individuals would pay extra for this feature on their next vehicle (Patterson 2007).
Convenient public charging locations: Special charging areas dedicated to plug-in vehicles (e.g., PHEVs, EVs) are being built, or reopened, in parking lots to accommodate charging away from home. These locations include airports, municipalities, shopping malls, and garages where plug-in vehicles are expected to be parked for extended periods of time. Charging at these locations may even be offered at no cost as an incentive to shop at specific stores.
Recognition of social responsibility: To many, purchasing a PHEV demonstrates both environmental stewardship and a contribution by the owner in reducing dependence on imported oil. A recent University of Michigan survey found that half of consumers buying a PHEV as a commitment to the environment considered this as ―very important,‖ and 54% of individuals surveyed said that was the main advantage of PHEV ownership (Univ. of Mich. 2009).
Convenience of smart phone applications: Multiple PHEV and EV manufacturers are teaming with IT companies to allow owners to remotely communicate with their vehicle. For example, GM’s new OnStar mobile application allows Chevrolet Volt owners to check the vehicle’s charge status, verify estimated electric range, schedule specific charge times and start the vehicle remotely. Nissan’s LEAF EV will offer an Apple iPhone application with similar features.
Comfort of preconditioned car: The PHEV-30 analyzed in this study is assumed to be preconditioned to a specified temperature five minutes prior to each scheduled trip, resulting in a more comfortable driving experience for the vehicle owner. Regular preconditioning may either be programmed manually on the car’s dashboard or remotely through smart phone applications.
Reduced trips to the gas station: Since PHEVs are anticipated to consume much less gasoline than ICEs and HEVs, vehicle owners will make fewer trips to fill up their gas tank, which will save them time and money.
Absence of range anxiety: PHEVs have sizeable battery packs as well as backup fuel tanks to power the vehicle, meaning owners can drive up to 300 miles before having to refuel. This will relieve ―range anxiety‖ that EV owners will likely face at some point, since they are generally constrained to driving 100 miles or less before requiring a recharge. While range anxiety is not expected to be a major hurdle to consumer acceptance of EVs in metropolitan areas (Carney
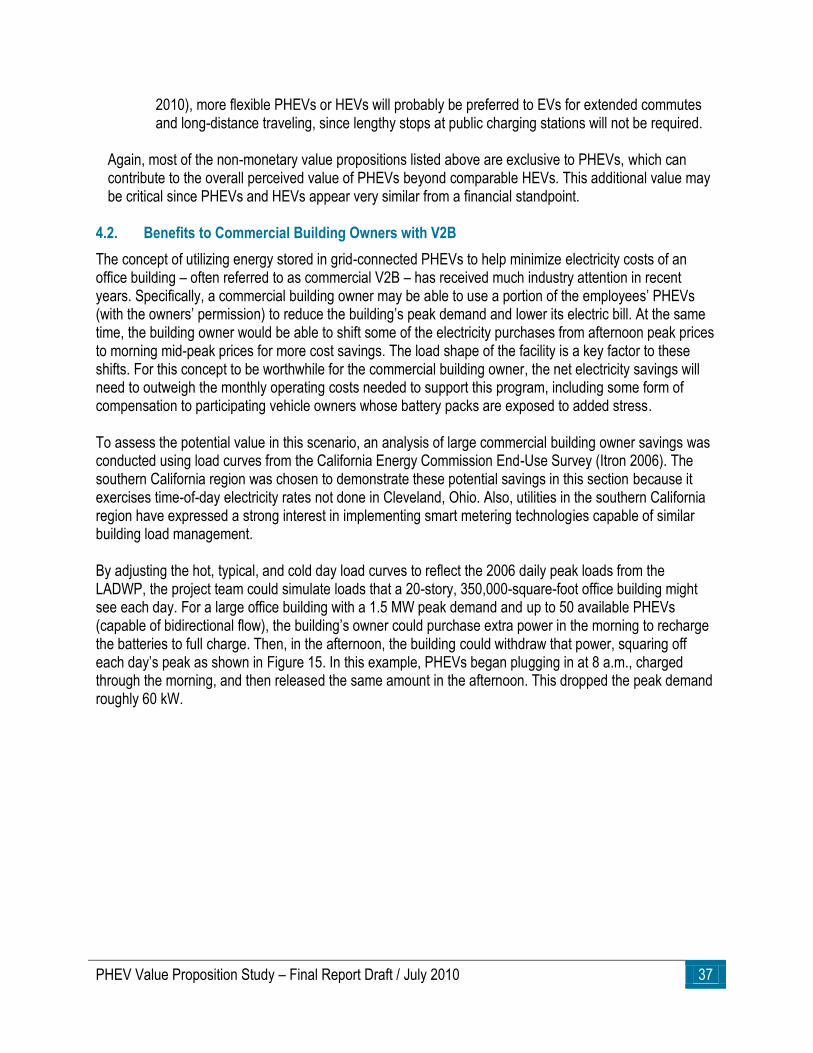
PHEV Value Proposition Study – Final Report Draft / July 2010 37
2010), more flexible PHEVs or HEVs will probably be preferred to EVs for extended commutes and long-distance traveling, since lengthy stops at public charging stations will not be required.
Again, most of the non-monetary value propositions listed above are exclusive to PHEVs, which can contribute to the overall perceived value of PHEVs beyond comparable HEVs. This additional value may be critical since PHEVs and HEVs appear very similar from a financial standpoint.
4.2. Benefits to Commercial Building Owners with V2B
The concept of utilizing energy stored in grid-connected PHEVs to help minimize electricity costs of an office building – often referred to as commercial V2B – has received much industry attention in recent years. Specifically, a commercial building owner may be able to use a portion of the employees’ PHEVs (with the owners’ permission) to reduce the building’s peak demand and lower its electric bill. At the same time, the building owner would be able to shift some of the electricity purchases from afternoon peak prices to morning mid-peak prices for more cost savings. The load shape of the facility is a key factor to these shifts. For this concept to be worthwhile for the commercial building owner, the net electricity savings will need to outweigh the monthly operating costs needed to support this program, including some form of compensation to participating vehicle owners whose battery packs are exposed to added stress. To assess the potential value in this scenario, an analysis of large commercial building owner savings was conducted using load curves from the California Energy Commission End-Use Survey (Itron 2006). The southern California region was chosen to demonstrate these potential savings in this section because it exercises time-of-day electricity rates not done in Cleveland, Ohio. Also, utilities in the southern California region have expressed a strong interest in implementing smart metering technologies capable of similar building load management. By adjusting the hot, typical, and cold day load curves to reflect the 2006 daily peak loads from the LADWP, the project team could simulate loads that a 20-story, 350,000-square-foot office building might see each day. For a large office building with a 1.5 MW peak demand and up to 50 available PHEVs (capable of bidirectional flow), the building’s owner could purchase extra power in the morning to recharge the batteries to full charge. Then, in the afternoon, the building could withdraw that power, squaring off each day’s peak as shown in Figure 15. In this example, PHEVs began plugging in at 8 a.m., charged through the morning, and then released the same amount in the afternoon. This dropped the peak demand roughly 60 kW.
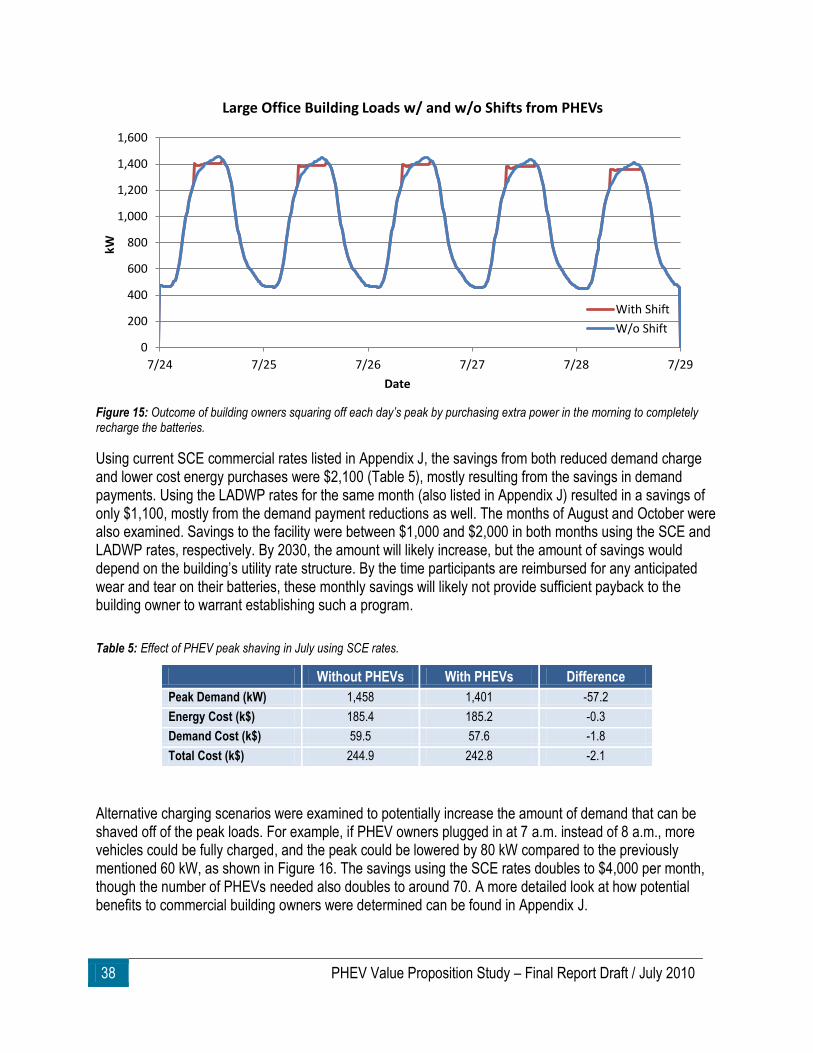
38 PHEV Value Proposition Study – Final Report Draft / July 2010
Figure 15: Outcome of building owners squaring off each day’s peak by purchasing extra power in the morning to completely recharge the batteries.
Using current SCE commercial rates listed in Appendix J, the savings from both reduced demand charge and lower cost energy purchases were $2,100 (Table 5), mostly resulting from the savings in demand payments. Using the LADWP rates for the same month (also listed in Appendix J) resulted in a savings of only $1,100, mostly from the demand payment reductions as well. The months of August and October were also examined. Savings to the facility were between $1,000 and $2,000 in both months using the SCE and LADWP rates, respectively. By 2030, the amount will likely increase, but the amount of savings would depend on the building’s utility rate structure. By the time participants are reimbursed for any anticipated wear and tear on their batteries, these monthly savings will likely not provide sufficient payback to the building owner to warrant establishing such a program.
Table 5: Effect of PHEV peak shaving in July using SCE rates.
Without PHEVs With PHEVs Difference
Peak Demand (kW) 1,458 1,401 -57.2
Energy Cost (k$) 185.4 185.2 -0.3
Demand Cost (k$) 59.5 57.6 -1.8
Total Cost (k$) 244.9 242.8 -2.1
Alternative charging scenarios were examined to potentially increase the amount of demand that can be shaved off of the peak loads. For example, if PHEV owners plugged in at 7 a.m. instead of 8 a.m., more vehicles could be fully charged, and the peak could be lowered by 80 kW compared to the previously mentioned 60 kW, as shown in Figure 16. The savings using the SCE rates doubles to $4,000 per month, though the number of PHEVs needed also doubles to around 70. A more detailed look at how potential benefits to commercial building owners were determined can be found in Appendix J.
0
200
400
600
800
1,000
1,200
1,400
1,600
7/24 7/25 7/26 7/27 7/28 7/29
kW
Date
Large Office Building Loads w/ and w/o Shifts from PHEVs
With Shift
W/o Shift
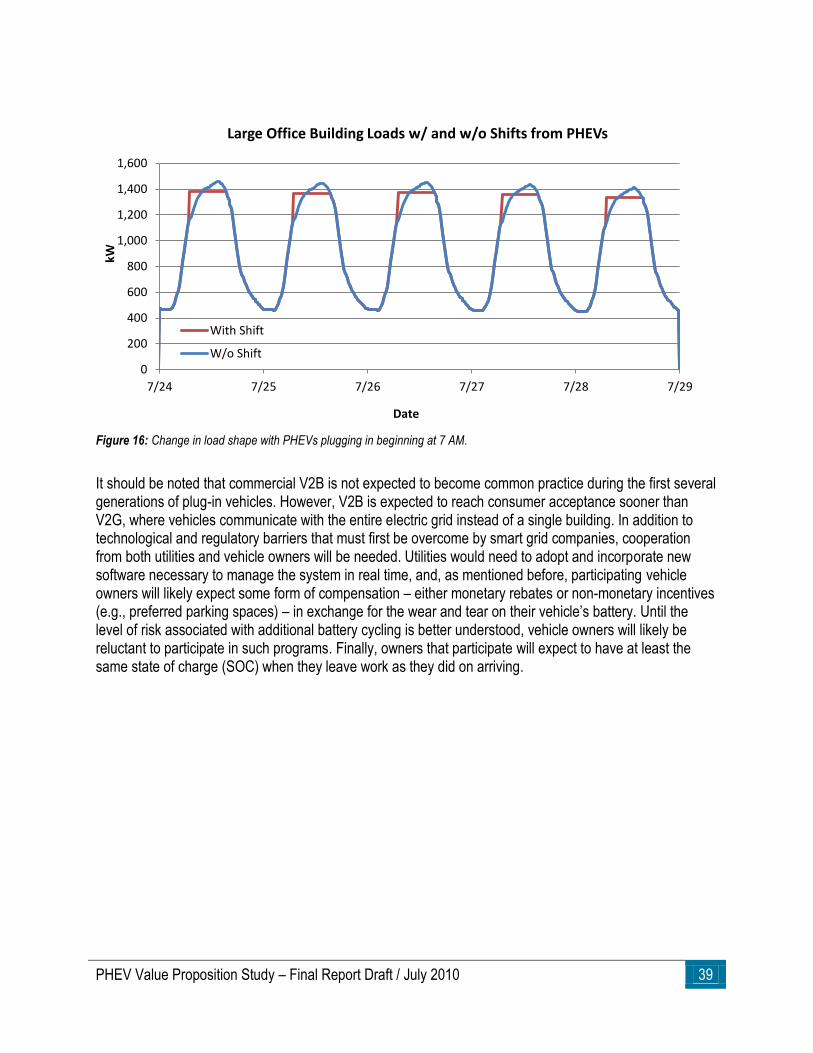
PHEV Value Proposition Study – Final Report Draft / July 2010 39
Figure 16: Change in load shape with PHEVs plugging in beginning at 7 AM.
It should be noted that commercial V2B is not expected to become common practice during the first several generations of plug-in vehicles. However, V2B is expected to reach consumer acceptance sooner than V2G, where vehicles communicate with the entire electric grid instead of a single building. In addition to technological and regulatory barriers that must first be overcome by smart grid companies, cooperation from both utilities and vehicle owners will be needed. Utilities would need to adopt and incorporate new software necessary to manage the system in real time, and, as mentioned before, participating vehicle owners will likely expect some form of compensation – either monetary rebates or non-monetary incentives (e.g., preferred parking spaces) – in exchange for the wear and tear on their vehicle’s battery. Until the level of risk associated with additional battery cycling is better understood, vehicle owners will likely be reluctant to participate in such programs. Finally, owners that participate will expect to have at least the same state of charge (SOC) when they leave work as they did on arriving.
0
200
400
600
800
1,000
1,200
1,400
1,600
7/24 7/25 7/26 7/27 7/28 7/29
kW
Date
Large Office Building Loads w/ and w/o Shifts from PHEVs
With Shift
W/o Shift
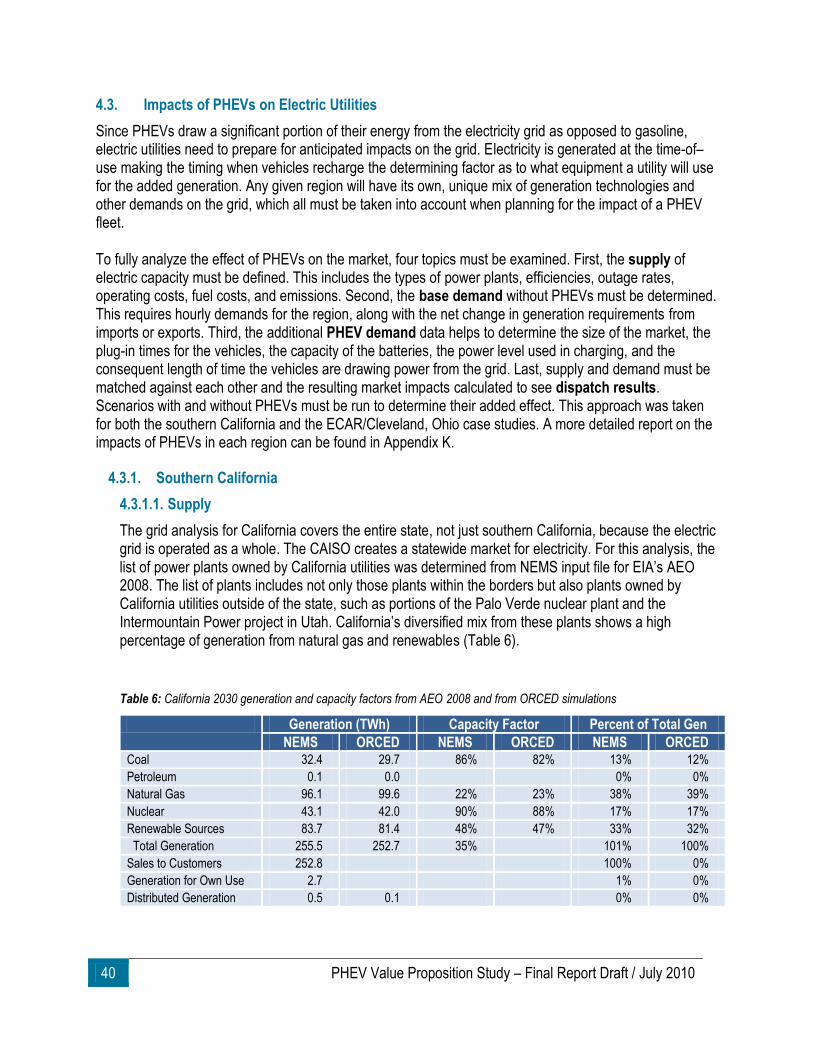
40 PHEV Value Proposition Study – Final Report Draft / July 2010
4.3. Impacts of PHEVs on Electric Utilities
Since PHEVs draw a significant portion of their energy from the electricity grid as opposed to gasoline, electric utilities need to prepare for anticipated impacts on the grid. Electricity is generated at the time-of–use making the timing when vehicles recharge the determining factor as to what equipment a utility will use for the added generation. Any given region will have its own, unique mix of generation technologies and other demands on the grid, which all must be taken into account when planning for the impact of a PHEV fleet. To fully analyze the effect of PHEVs on the market, four topics must be examined. First, the supply of electric capacity must be defined. This includes the types of power plants, efficiencies, outage rates, operating costs, fuel costs, and emissions. Second, the base demand without PHEVs must be determined. This requires hourly demands for the region, along with the net change in generation requirements from imports or exports. Third, the additional PHEV demand data helps to determine the size of the market, the plug-in times for the vehicles, the capacity of the batteries, the power level used in charging, and the consequent length of time the vehicles are drawing power from the grid. Last, supply and demand must be matched against each other and the resulting market impacts calculated to see dispatch results. Scenarios with and without PHEVs must be run to determine their added effect. This approach was taken for both the southern California and the ECAR/Cleveland, Ohio case studies. A more detailed report on the impacts of PHEVs in each region can be found in Appendix K.
4.3.1. Southern California
4.3.1.1. Supply
The grid analysis for California covers the entire state, not just southern California, because the electric grid is operated as a whole. The CAISO creates a statewide market for electricity. For this analysis, the list of power plants owned by California utilities was determined from NEMS input file for EIA’s AEO 2008. The list of plants includes not only those plants within the borders but also plants owned by California utilities outside of the state, such as portions of the Palo Verde nuclear plant and the Intermountain Power project in Utah. California’s diversified mix from these plants shows a high percentage of generation from natural gas and renewables (Table 6).
Table 6: California 2030 generation and capacity factors from AEO 2008 and from ORCED simulations
Generation (TWh) Capacity Factor Percent of Total Gen
NEMS ORCED NEMS ORCED NEMS ORCED Coal 32.4 29.7 86% 82% 13% 12%
Petroleum 0.1 0.0 0% 0%
Natural Gas 96.1 99.6 22% 23% 38% 39%
Nuclear 43.1 42.0 90% 88% 17% 17%
Renewable Sources 83.7 81.4 48% 47% 33% 32%
Total Generation 255.5 252.7 35% 101% 100%
Sales to Customers 252.8 100% 0%
Generation for Own Use 2.7 1% 0%
Distributed Generation 0.5 0.1 0% 0%
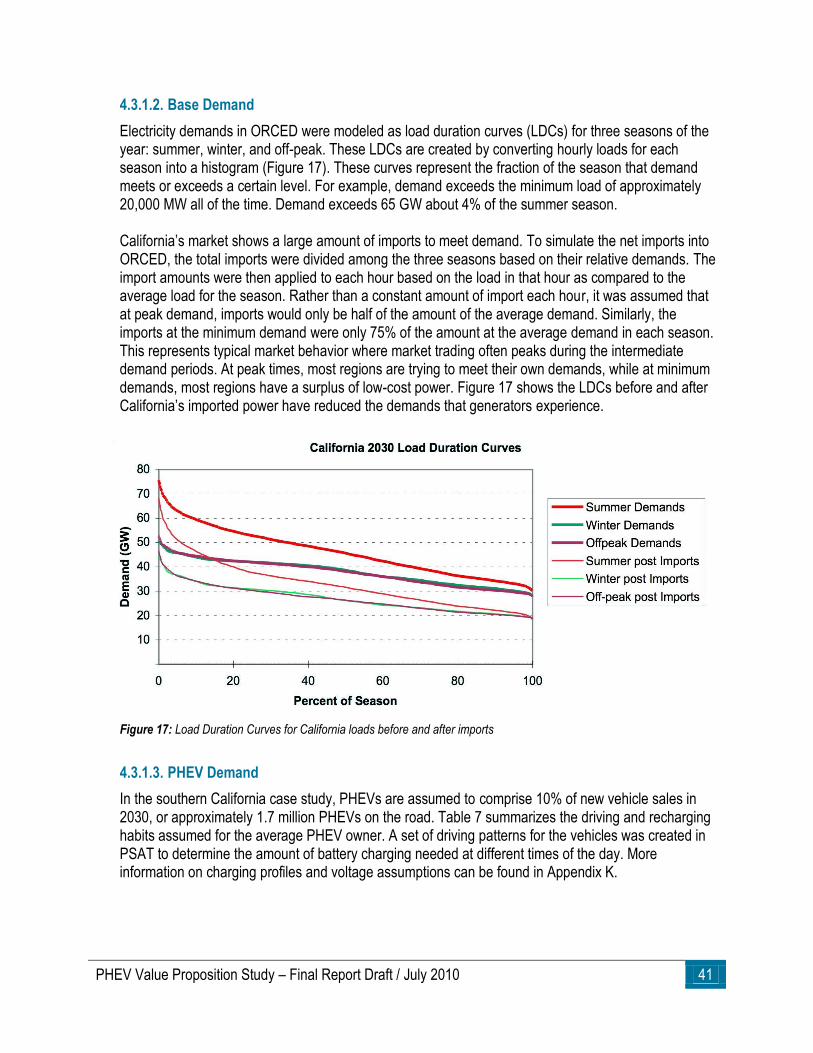
PHEV Value Proposition Study – Final Report Draft / July 2010 41
4.3.1.2. Base Demand
Electricity demands in ORCED were modeled as load duration curves (LDCs) for three seasons of the year: summer, winter, and off-peak. These LDCs are created by converting hourly loads for each season into a histogram (Figure 17). These curves represent the fraction of the season that demand meets or exceeds a certain level. For example, demand exceeds the minimum load of approximately 20,000 MW all of the time. Demand exceeds 65 GW about 4% of the summer season. California’s market shows a large amount of imports to meet demand. To simulate the net imports into ORCED, the total imports were divided among the three seasons based on their relative demands. The import amounts were then applied to each hour based on the load in that hour as compared to the average load for the season. Rather than a constant amount of import each hour, it was assumed that at peak demand, imports would only be half of the amount of the average demand. Similarly, the imports at the minimum demand were only 75% of the amount at the average demand in each season. This represents typical market behavior where market trading often peaks during the intermediate demand periods. At peak times, most regions are trying to meet their own demands, while at minimum demands, most regions have a surplus of low-cost power. Figure 17 shows the LDCs before and after California’s imported power have reduced the demands that generators experience.
Figure 17: Load Duration Curves for California loads before and after imports
4.3.1.3. PHEV Demand
In the southern California case study, PHEVs are assumed to comprise 10% of new vehicle sales in 2030, or approximately 1.7 million PHEVs on the road. Table 7 summarizes the driving and recharging habits assumed for the average PHEV owner. A set of driving patterns for the vehicles was created in PSAT to determine the amount of battery charging needed at different times of the day. More information on charging profiles and voltage assumptions can be found in Appendix K.
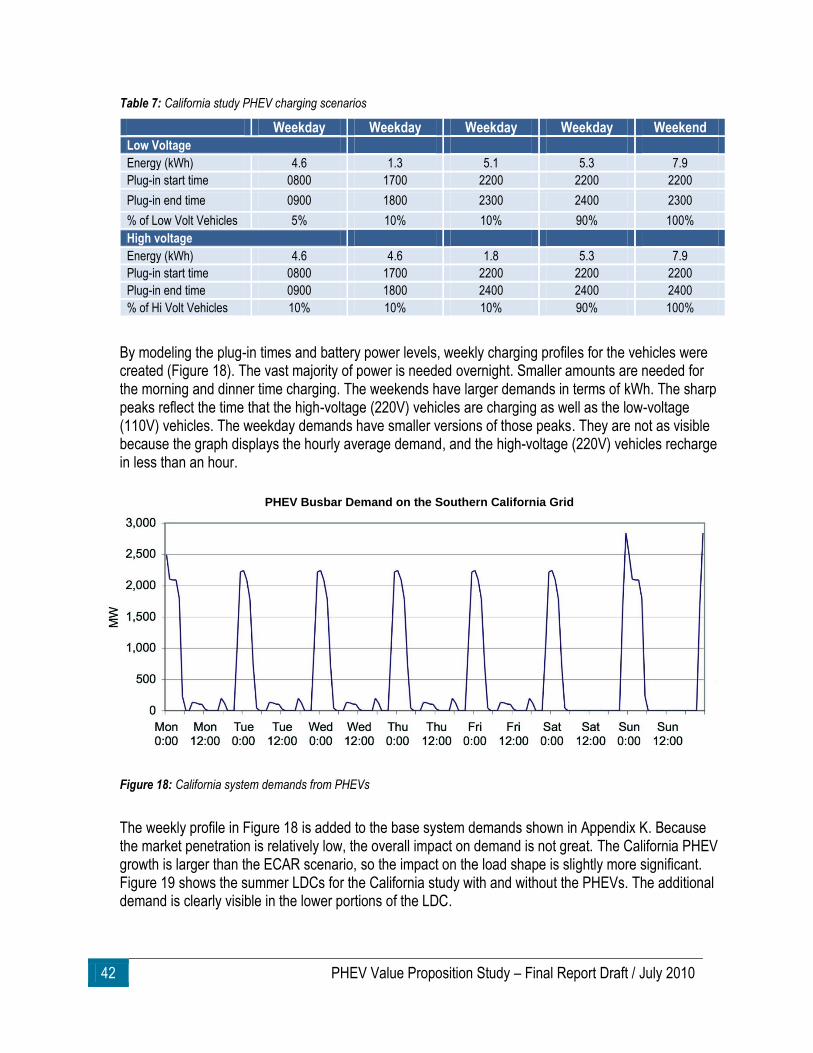
42 PHEV Value Proposition Study – Final Report Draft / July 2010
Table 7: California study PHEV charging scenarios
Weekday Weekday Weekday Weekday Weekend
Low Voltage Energy (kWh) 4.6 1.3 5.1 5.3 7.9
Plug-in start time 0800 1700 2200 2200 2200
Plug-in end time 0900 1800 2300 2400 2300
% of Low Volt Vehicles 5% 10% 10% 90% 100%
High voltage Energy (kWh) 4.6 4.6 1.8 5.3 7.9
Plug-in start time 0800 1700 2200 2200 2200
Plug-in end time 0900 1800 2400 2400 2400
% of Hi Volt Vehicles 10% 10% 10% 90% 100%
By modeling the plug-in times and battery power levels, weekly charging profiles for the vehicles were created (Figure 18). The vast majority of power is needed overnight. Smaller amounts are needed for the morning and dinner time charging. The weekends have larger demands in terms of kWh. The sharp peaks reflect the time that the high-voltage (220V) vehicles are charging as well as the low-voltage (110V) vehicles. The weekday demands have smaller versions of those peaks. They are not as visible because the graph displays the hourly average demand, and the high-voltage (220V) vehicles recharge in less than an hour.
Figure 18: California system demands from PHEVs
The weekly profile in Figure 18 is added to the base system demands shown in Appendix K. Because the market penetration is relatively low, the overall impact on demand is not great. The California PHEV growth is larger than the ECAR scenario, so the impact on the load shape is slightly more significant. Figure 19 shows the summer LDCs for the California study with and without the PHEVs. The additional demand is clearly visible in the lower portions of the LDC.
PHEV Busbar Demand on the Southern California Grid
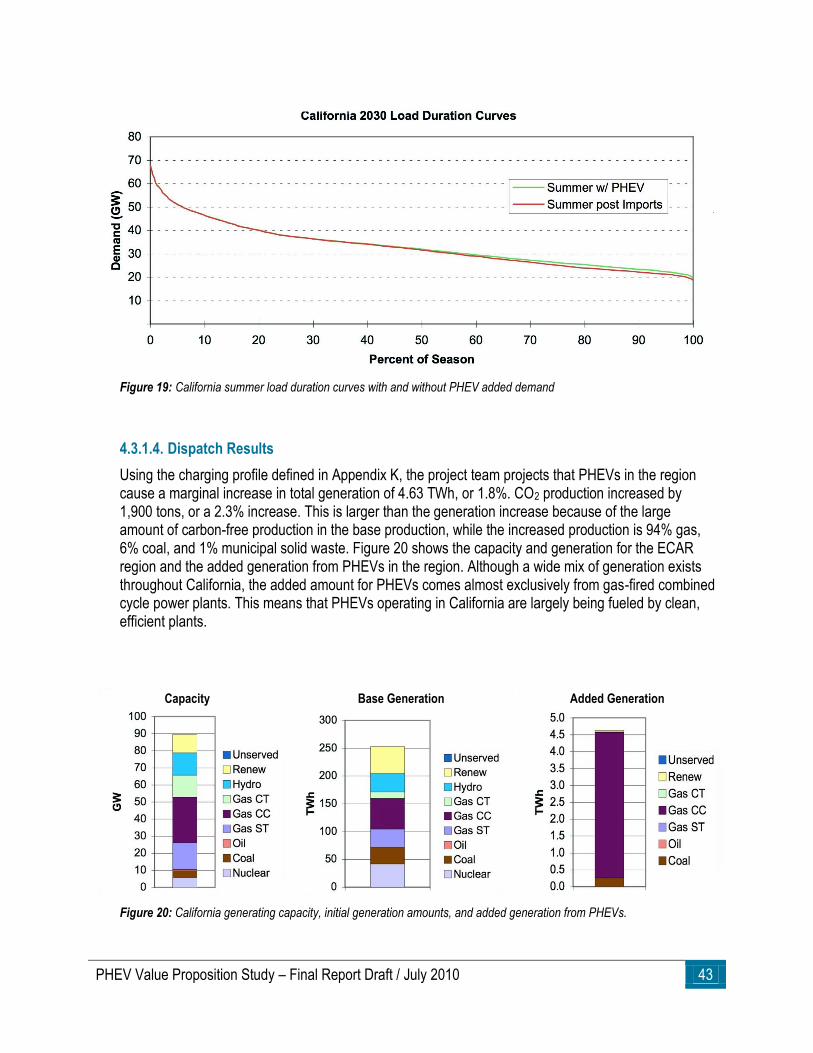
PHEV Value Proposition Study – Final Report Draft / July 2010 43
Figure 19: California summer load duration curves with and without PHEV added demand
4.3.1.4. Dispatch Results
Using the charging profile defined in Appendix K, the project team projects that PHEVs in the region cause a marginal increase in total generation of 4.63 TWh, or 1.8%. CO2 production increased by 1,900 tons, or a 2.3% increase. This is larger than the generation increase because of the large amount of carbon-free production in the base production, while the increased production is 94% gas, 6% coal, and 1% municipal solid waste. Figure 20 shows the capacity and generation for the ECAR region and the added generation from PHEVs in the region. Although a wide mix of generation exists throughout California, the added amount for PHEVs comes almost exclusively from gas-fired combined cycle power plants. This means that PHEVs operating in California are largely being fueled by clean, efficient plants.
Figure 20: California generating capacity, initial generation amounts, and added generation from PHEVs.
Capacity Base Generation Added Generation
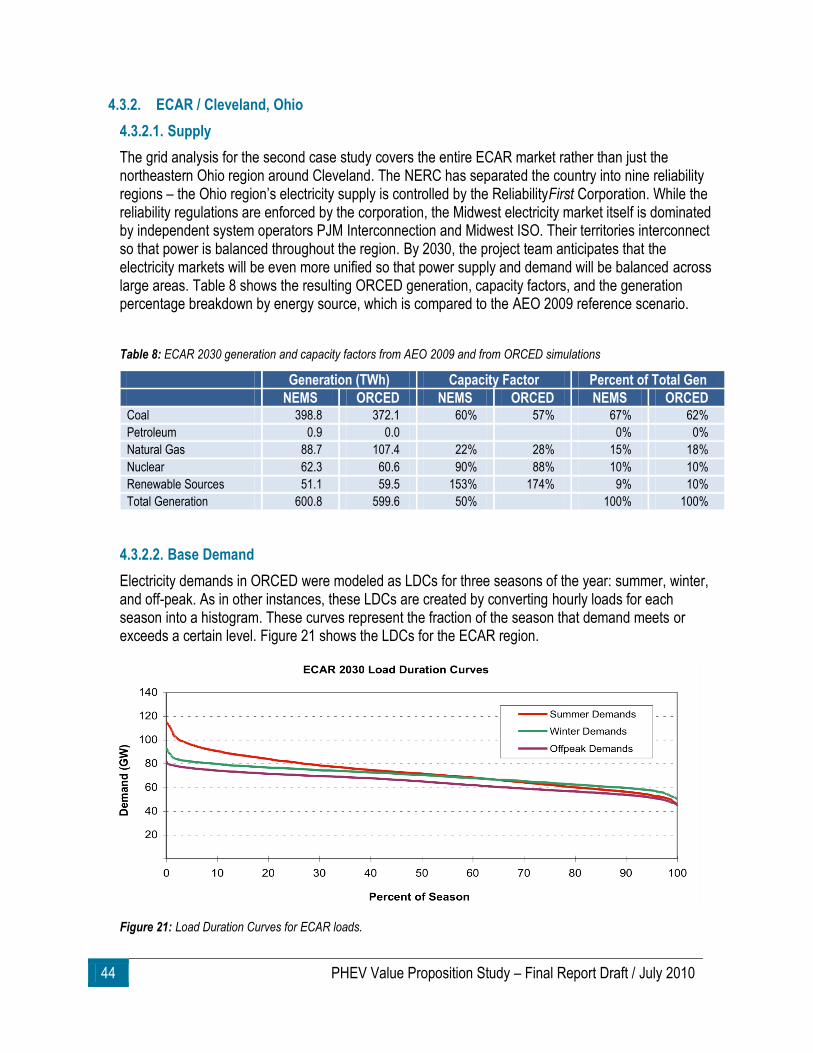
44 PHEV Value Proposition Study – Final Report Draft / July 2010
4.3.2. ECAR / Cleveland, Ohio
4.3.2.1. Supply
The grid analysis for the second case study covers the entire ECAR market rather than just the northeastern Ohio region around Cleveland. The NERC has separated the country into nine reliability regions – the Ohio region’s electricity supply is controlled by the ReliabilityFirst Corporation. While the reliability regulations are enforced by the corporation, the Midwest electricity market itself is dominated by independent system operators PJM Interconnection and Midwest ISO. Their territories interconnect so that power is balanced throughout the region. By 2030, the project team anticipates that the electricity markets will be even more unified so that power supply and demand will be balanced across large areas. Table 8 shows the resulting ORCED generation, capacity factors, and the generation percentage breakdown by energy source, which is compared to the AEO 2009 reference scenario.
Table 8: ECAR 2030 generation and capacity factors from AEO 2009 and from ORCED simulations
Generation (TWh) Capacity Factor Percent of Total Gen
NEMS ORCED NEMS ORCED NEMS ORCED Coal 398.8 372.1 60% 57% 67% 62%
Petroleum 0.9 0.0 0% 0%
Natural Gas 88.7 107.4 22% 28% 15% 18%
Nuclear 62.3 60.6 90% 88% 10% 10%
Renewable Sources 51.1 59.5 153% 174% 9% 10%
Total Generation 600.8 599.6 50% 100% 100%
4.3.2.2. Base Demand
Electricity demands in ORCED were modeled as LDCs for three seasons of the year: summer, winter, and off-peak. As in other instances, these LDCs are created by converting hourly loads for each season into a histogram. These curves represent the fraction of the season that demand meets or exceeds a certain level. Figure 21 shows the LDCs for the ECAR region.
Figure 21: Load Duration Curves for ECAR loads.
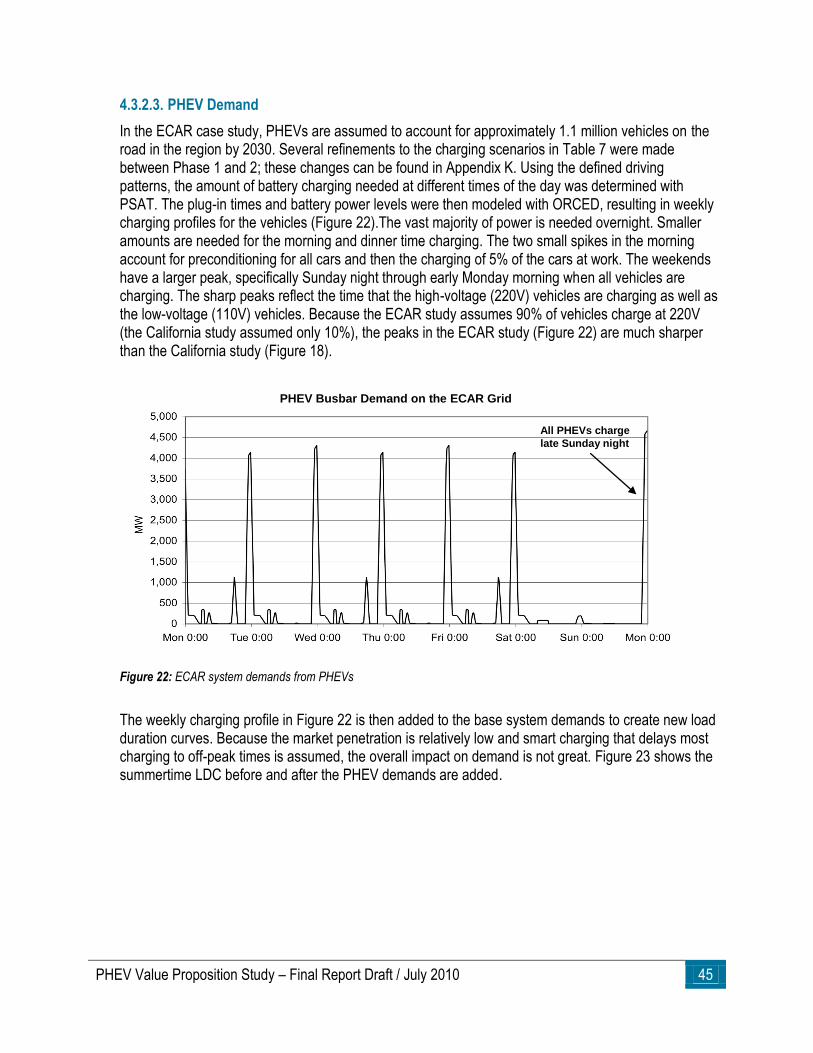
PHEV Value Proposition Study – Final Report Draft / July 2010 45
4.3.2.3. PHEV Demand
In the ECAR case study, PHEVs are assumed to account for approximately 1.1 million vehicles on the road in the region by 2030. Several refinements to the charging scenarios in Table 7 were made between Phase 1 and 2; these changes can be found in Appendix K. Using the defined driving patterns, the amount of battery charging needed at different times of the day was determined with PSAT. The plug-in times and battery power levels were then modeled with ORCED, resulting in weekly charging profiles for the vehicles (Figure 22).The vast majority of power is needed overnight. Smaller amounts are needed for the morning and dinner time charging. The two small spikes in the morning account for preconditioning for all cars and then the charging of 5% of the cars at work. The weekends have a larger peak, specifically Sunday night through early Monday morning when all vehicles are charging. The sharp peaks reflect the time that the high-voltage (220V) vehicles are charging as well as the low-voltage (110V) vehicles. Because the ECAR study assumes 90% of vehicles charge at 220V (the California study assumed only 10%), the peaks in the ECAR study (Figure 22) are much sharper than the California study (Figure 18).
Figure 22: ECAR system demands from PHEVs
The weekly charging profile in Figure 22 is then added to the base system demands to create new load duration curves. Because the market penetration is relatively low and smart charging that delays most charging to off-peak times is assumed, the overall impact on demand is not great. Figure 23 shows the summertime LDC before and after the PHEV demands are added.
PHEV Busbar Demand on the ECAR Grid
All PHEVs charge
late Sunday night
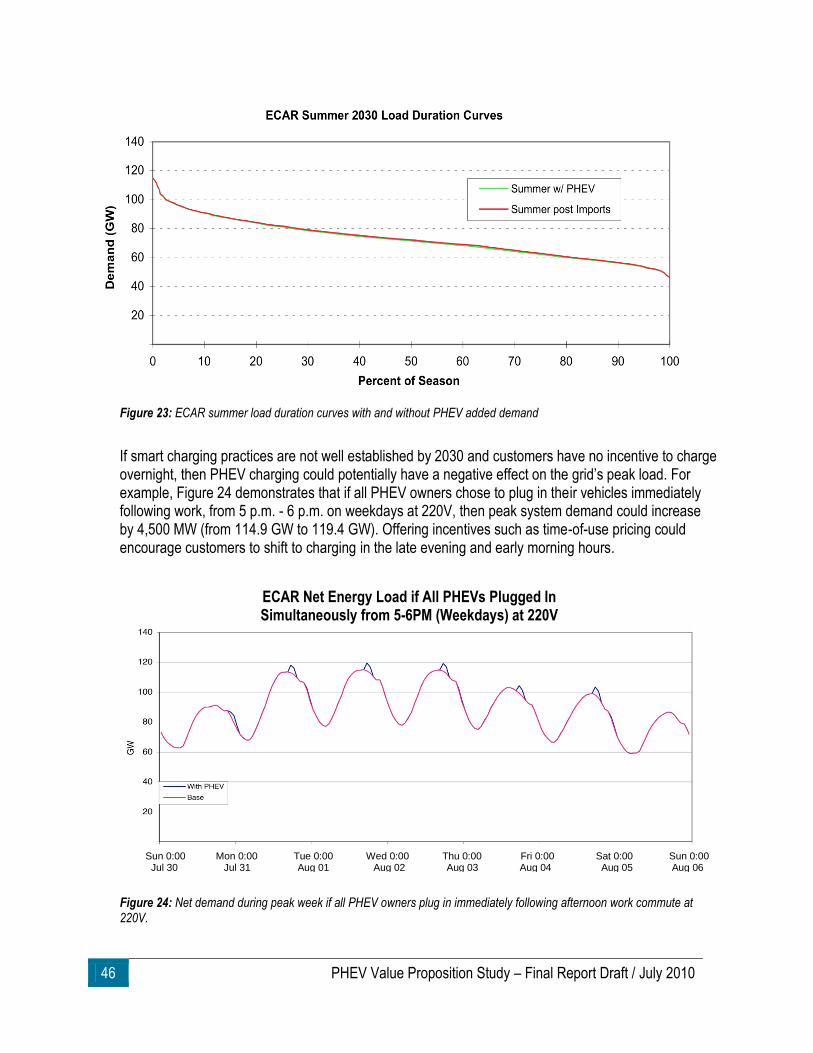
46 PHEV Value Proposition Study – Final Report Draft / July 2010
Figure 23: ECAR summer load duration curves with and without PHEV added demand
If smart charging practices are not well established by 2030 and customers have no incentive to charge overnight, then PHEV charging could potentially have a negative effect on the grid’s peak load. For example, Figure 24 demonstrates that if all PHEV owners chose to plug in their vehicles immediately following work, from 5 p.m. - 6 p.m. on weekdays at 220V, then peak system demand could increase by 4,500 MW (from 114.9 GW to 119.4 GW). Offering incentives such as time-of-use pricing could encourage customers to shift to charging in the late evening and early morning hours.
Figure 24: Net demand during peak week if all PHEV owners plug in immediately following afternoon work commute at 220V.
ECAR Net Energy Load if All PHEVs Plugged In Simultaneously from 5-6PM (Weekdays) at 220V
Sun 0:00 Mon 0:00 Tue 0:00 Wed 0:00 Thu 0:00 Fri 0:00 Sat 0:00 Sun 0:00 Jul 30 Jul 31 Aug 01 Aug 02 Aug 03 Aug 04 Aug 05 Aug 06
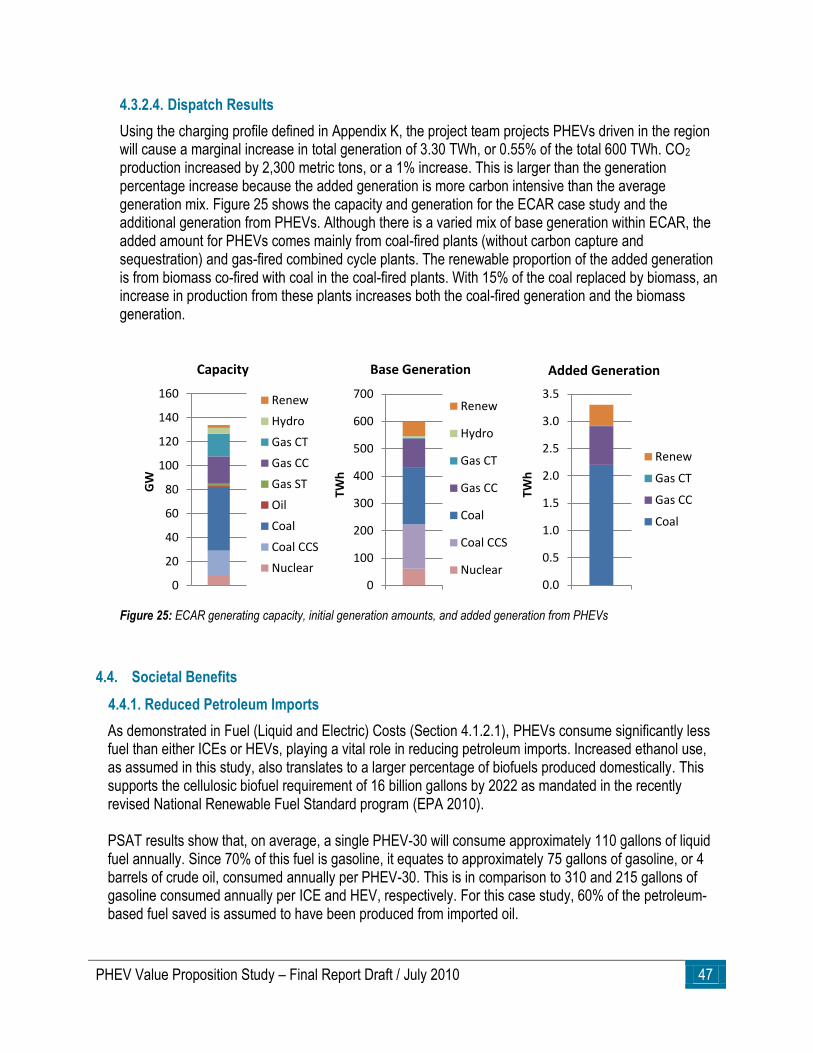
PHEV Value Proposition Study – Final Report Draft / July 2010 47
4.3.2.4. Dispatch Results
Using the charging profile defined in Appendix K, the project team projects PHEVs driven in the region will cause a marginal increase in total generation of 3.30 TWh, or 0.55% of the total 600 TWh. CO2 production increased by 2,300 metric tons, or a 1% increase. This is larger than the generation percentage increase because the added generation is more carbon intensive than the average generation mix. Figure 25 shows the capacity and generation for the ECAR case study and the additional generation from PHEVs. Although there is a varied mix of base generation within ECAR, the added amount for PHEVs comes mainly from coal-fired plants (without carbon capture and sequestration) and gas-fired combined cycle plants. The renewable proportion of the added generation is from biomass co-fired with coal in the coal-fired plants. With 15% of the coal replaced by biomass, an increase in production from these plants increases both the coal-fired generation and the biomass generation.
Figure 25: ECAR generating capacity, initial generation amounts, and added generation from PHEVs
4.4. Societal Benefits
4.4.1. Reduced Petroleum Imports
As demonstrated in Fuel (Liquid and Electric) Costs (Section 4.1.2.1), PHEVs consume significantly less fuel than either ICEs or HEVs, playing a vital role in reducing petroleum imports. Increased ethanol use, as assumed in this study, also translates to a larger percentage of biofuels produced domestically. This supports the cellulosic biofuel requirement of 16 billion gallons by 2022 as mandated in the recently revised National Renewable Fuel Standard program (EPA 2010). PSAT results show that, on average, a single PHEV-30 will consume approximately 110 gallons of liquid fuel annually. Since 70% of this fuel is gasoline, it equates to approximately 75 gallons of gasoline, or 4 barrels of crude oil, consumed annually per PHEV-30. This is in comparison to 310 and 215 gallons of gasoline consumed annually per ICE and HEV, respectively. For this case study, 60% of the petroleum-based fuel saved is assumed to have been produced from imported oil.
0
20
40
60
80
100
120
140
160
GW
Capacity
Renew
Hydro
Gas CT
Gas CC
Gas ST
Oil
Coal
Coal CCS
Nuclear
0
100
200
300
400
500
600
700
TWh
Base Generation
Renew
Hydro
Gas CT
Gas CC
Coal
Coal CCS
Nuclear0.0
0.5
1.0
1.5
2.0
2.5
3.0
3.5
TWh
Added Generation
Renew
Gas CT
Gas CC
Coal
48 PHEV Value Proposition Study – Final Report Draft / July 2010
If this percentage remains constant through for the next two decades, the southern California fleet of approximately 1 million PHEV-30s in 2030 could reduce imported oil by roughly 7.25 million barrels annually (given that the PHEV fleet replaces ICEs) or 4.25 million barrels annually (if the PHEV fleet is substituted for HEVs). A similar volume of annually displaced oil imports is also projected within the ECAR region, since just more than 1 million PHEVs are expected to be on the road in 2030. See Appendix E for detailed petroleum consumption calculations.
4.4.2. Environmental Impacts
Numerous organizations (e.g., EPRI/Natural Resources Defense Council, Massachusetts Institute of Technology) have conducted studies on a PHEV’s potential to reduce lifecycle emissions compared with ICEs, HEVs, etc. These studies factor in several characteristics of the vehicle itself, its operating characteristics, and its environment. These factors often include:
Choice of fuel blend.
Design of the hybrid system.
Baseline fuel economy of the ICE.
Mix of a region’s electric power generation.
For example, the percentage of ethanol used in a fuel blend or whether the gasoline portion was reformulated plays a significant role in lifecycle emissions. Additionally, a PHEV’s AER, which dictates the percentage of time it’s in EV mode, is a key factor. Lightweighting of vehicles should be considered as well when assessing environmental impact, since this affects the baseline fuel economy. Finally, how a region’s electricity is generated has a substantial impact on lifecycle emissions. For instance, if all electricity was produced by nuclear power, then GHG emissions would be near zero for the electric drive portion of the vehicle’s duty cycle. By comparison, generating electricity wholly from coal would render an entirely different scenario with regard to GHG emissions. Tables 9 and 10 summarize the key inputs used in this study. Variations of this data have led to a range of conclusions by different industry stakeholders. In many ways, this study’s environmental findings align with previously published results. The project team’s analysis of the coal-dominated ECAR region presented some less environmentally friendly results than those previous published. ANL’s GREET model was used to assess these subtleties and to estimate and compare the Well-to-Wheel (W2W) GHG emissions of ICEs, HEVs, and PHEVs in various scenarios. The GREET model is widely used among automotive technologists – researchers and industry – to estimate energy use and emissions for light-duty vehicles. The model contains a large number of data and assumptions about production of fuel from oil and renewable resources, the delivery of those fuels, and their end use.
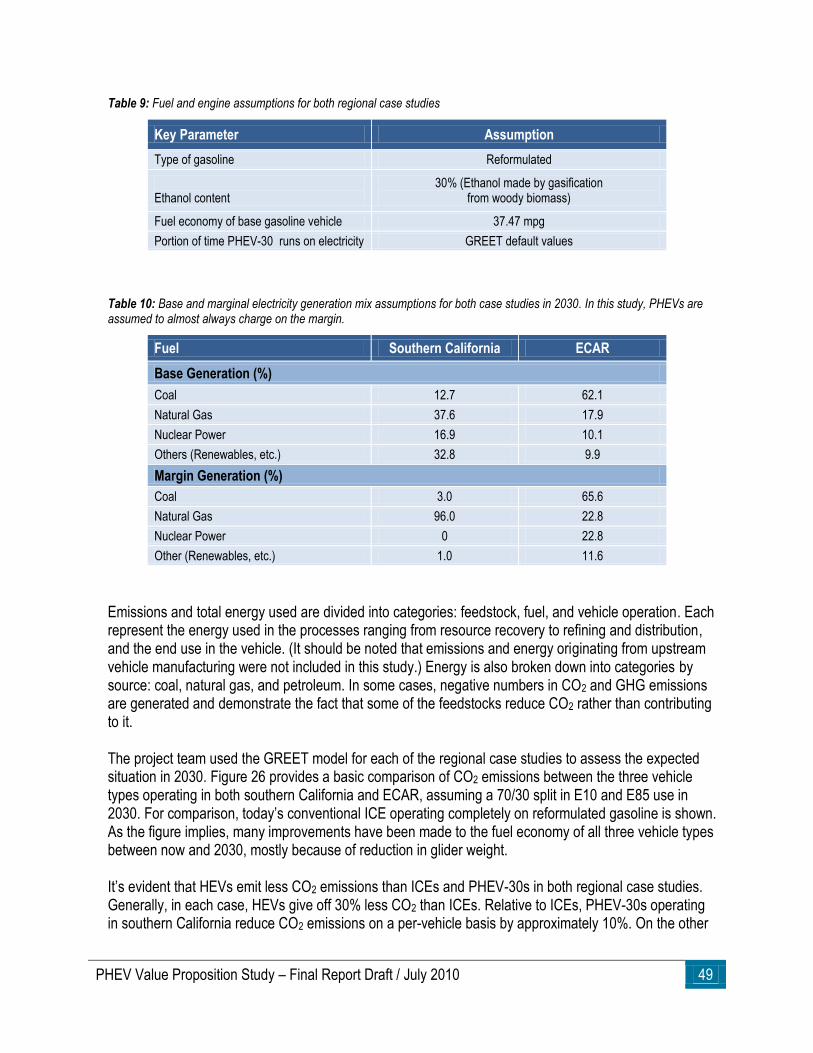
PHEV Value Proposition Study – Final Report Draft / July 2010 49
Table 9: Fuel and engine assumptions for both regional case studies
Key Parameter Assumption
Type of gasoline Reformulated
Ethanol content
30% (Ethanol made by gasification from woody biomass)
Fuel economy of base gasoline vehicle 37.47 mpg
Portion of time PHEV-30 runs on electricity GREET default values
Table 10: Base and marginal electricity generation mix assumptions for both case studies in 2030. In this study, PHEVs are assumed to almost always charge on the margin.
Fuel Southern California ECAR
Base Generation (%)
Coal 12.7 62.1
Natural Gas 37.6 17.9
Nuclear Power 16.9 10.1
Others (Renewables, etc.) 32.8 9.9
Margin Generation (%)
Coal 3.0 65.6
Natural Gas 96.0 22.8
Nuclear Power 0 22.8
Other (Renewables, etc.) 1.0 11.6
Emissions and total energy used are divided into categories: feedstock, fuel, and vehicle operation. Each represent the energy used in the processes ranging from resource recovery to refining and distribution, and the end use in the vehicle. (It should be noted that emissions and energy originating from upstream vehicle manufacturing were not included in this study.) Energy is also broken down into categories by source: coal, natural gas, and petroleum. In some cases, negative numbers in CO2 and GHG emissions are generated and demonstrate the fact that some of the feedstocks reduce CO2 rather than contributing to it. The project team used the GREET model for each of the regional case studies to assess the expected situation in 2030. Figure 26 provides a basic comparison of CO2 emissions between the three vehicle types operating in both southern California and ECAR, assuming a 70/30 split in E10 and E85 use in 2030. For comparison, today’s conventional ICE operating completely on reformulated gasoline is shown. As the figure implies, many improvements have been made to the fuel economy of all three vehicle types between now and 2030, mostly because of reduction in glider weight. It’s evident that HEVs emit less CO2 emissions than ICEs and PHEV-30s in both regional case studies. Generally, in each case, HEVs give off 30% less CO2 than ICEs. Relative to ICEs, PHEV-30s operating in southern California reduce CO2 emissions on a per-vehicle basis by approximately 10%. On the other
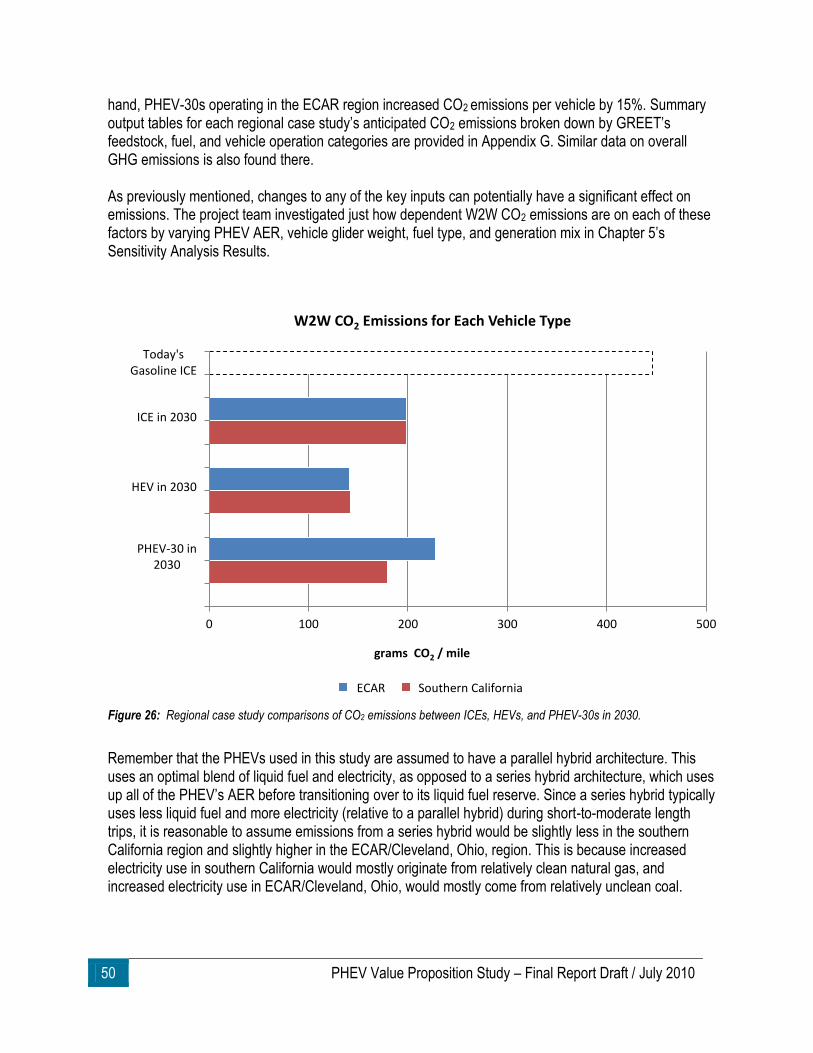
50 PHEV Value Proposition Study – Final Report Draft / July 2010
hand, PHEV-30s operating in the ECAR region increased CO2 emissions per vehicle by 15%. Summary output tables for each regional case study’s anticipated CO2 emissions broken down by GREET’s feedstock, fuel, and vehicle operation categories are provided in Appendix G. Similar data on overall GHG emissions is also found there. As previously mentioned, changes to any of the key inputs can potentially have a significant effect on emissions. The project team investigated just how dependent W2W CO2 emissions are on each of these factors by varying PHEV AER, vehicle glider weight, fuel type, and generation mix in Chapter 5’s Sensitivity Analysis Results.
Figure 26: Regional case study comparisons of CO2 emissions between ICEs, HEVs, and PHEV-30s in 2030.
Remember that the PHEVs used in this study are assumed to have a parallel hybrid architecture. This uses an optimal blend of liquid fuel and electricity, as opposed to a series hybrid architecture, which uses up all of the PHEV’s AER before transitioning over to its liquid fuel reserve. Since a series hybrid typically uses less liquid fuel and more electricity (relative to a parallel hybrid) during short-to-moderate length trips, it is reasonable to assume emissions from a series hybrid would be slightly less in the southern California region and slightly higher in the ECAR/Cleveland, Ohio, region. This is because increased electricity use in southern California would mostly originate from relatively clean natural gas, and increased electricity use in ECAR/Cleveland, Ohio, would mostly come from relatively unclean coal.
0 100 200 300 400 500
Today'sGasoline ICE
ICE in 2030
HEV in 2030
PHEV-30 in2030
grams CO2 / mile
W2W CO2 Emissions for Each Vehicle Type
ECAR Southern California
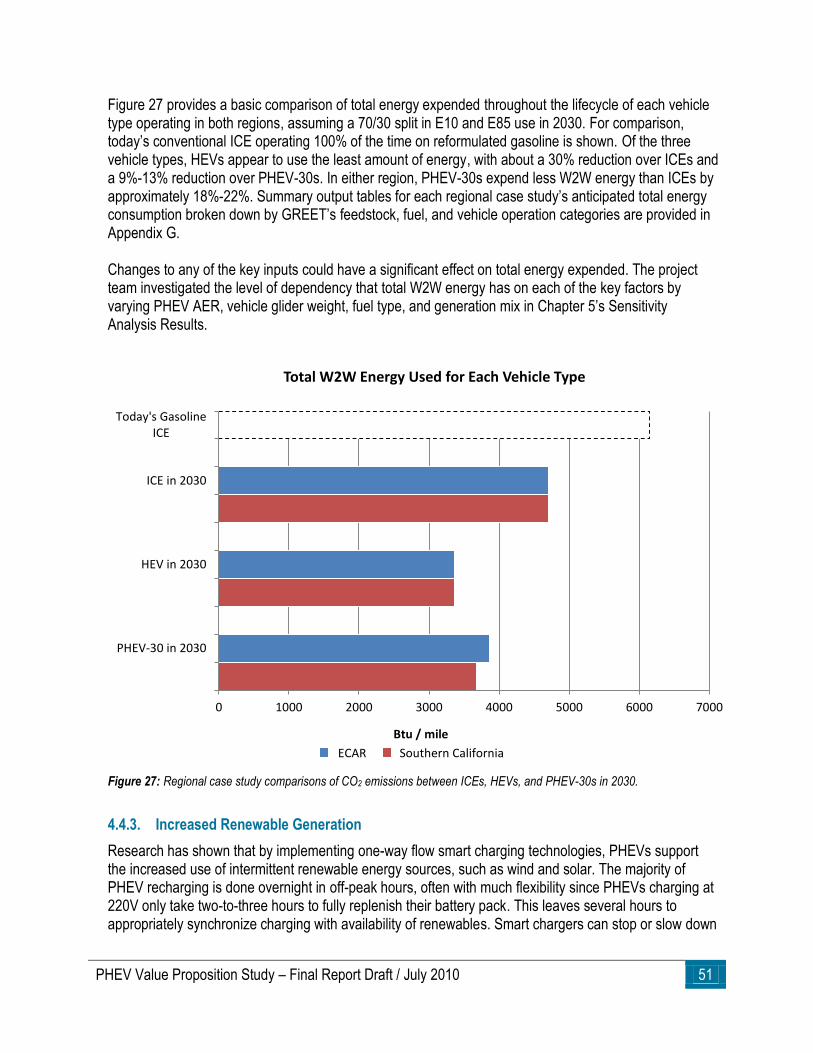
PHEV Value Proposition Study – Final Report Draft / July 2010 51
Figure 27 provides a basic comparison of total energy expended throughout the lifecycle of each vehicle type operating in both regions, assuming a 70/30 split in E10 and E85 use in 2030. For comparison, today’s conventional ICE operating 100% of the time on reformulated gasoline is shown. Of the three vehicle types, HEVs appear to use the least amount of energy, with about a 30% reduction over ICEs and a 9%-13% reduction over PHEV-30s. In either region, PHEV-30s expend less W2W energy than ICEs by approximately 18%-22%. Summary output tables for each regional case study’s anticipated total energy consumption broken down by GREET’s feedstock, fuel, and vehicle operation categories are provided in Appendix G. Changes to any of the key inputs could have a significant effect on total energy expended. The project team investigated the level of dependency that total W2W energy has on each of the key factors by varying PHEV AER, vehicle glider weight, fuel type, and generation mix in Chapter 5’s Sensitivity Analysis Results.
Figure 27: Regional case study comparisons of CO2 emissions between ICEs, HEVs, and PHEV-30s in 2030.
4.4.3. Increased Renewable Generation
Research has shown that by implementing one-way flow smart charging technologies, PHEVs support the increased use of intermittent renewable energy sources, such as wind and solar. The majority of PHEV recharging is done overnight in off-peak hours, often with much flexibility since PHEVs charging at 220V only take two-to-three hours to fully replenish their battery pack. This leaves several hours to appropriately synchronize charging with availability of renewables. Smart chargers can stop or slow down
0 1000 2000 3000 4000 5000 6000 7000
Today's GasolineICE
ICE in 2030
HEV in 2030
PHEV-30 in 2030
Btu / mile
Total W2W Energy Used for Each Vehicle Type
ECAR Southern California
52 PHEV Value Proposition Study – Final Report Draft / July 2010
the rate of charging when wind energy is below the forecasted level and start or increase charging when wind energy is above the forecasted level, all while meeting the vehicle owner’s set parameters of a full charge in time for the morning commute. A similar charging scheme can be implemented in the daytime with solar energy, although smart chargers would likely avoid charging during periods of peak demand. Renewable generation could be even further optimized with PHEVs and charging stations that are V2G compatible. PHEVs can act as absorbers and store excess energy created from wind turbines and solar photovoltaics during high output times and discharge stored energy when solar or wind generation is low. This would provide stable, predictable capacity from which utilities may draw. Broad implementation of V2G by 2030 was considered not likely by workshop participants and members of the Guidance & Evaluation Committee and was not fully analyzed in this study.&
By regularly recharging PHEVs with renewable energy sources in lieu of fossil fuels, W2W GHGs emitted by PHEVs would be significantly reduced, and air quality would consequently be improved. Increased renewable generation helps most states meet their respective RPSs – applicable in southern California – or alternative energy portfolio standards – applicable in Cleveland, Ohio. These standards set a percentage of a utility’s power plant capacity or generation mix that must originate from renewable or alternative energy sources by a future date.
4.5. Alternative Battery Design and Ownership Options
Battery cost may be the single largest impediment to large scale commercialization of PHEVs. Two general approaches to reducing this cost for the consumer have been proposed as part of this study: 1) designing a battery that can operate using a smaller overall capacity and/or 2) enlisting a third party (someone other than the auto manufacturer or the consumer) to own the batteries and lease them to the consumer. Developing a business case around either or both of these scenarios is not a trivial activity. To understand potential methods for reducing the battery capacity in the first approach described, the general battery design implemented in this study must first be understood.
4.5.1. Design of Base Battery
For a PHEV to reach a 10-year (~150,000 mile) lifespan, the battery is purposefully oversized to avoid certain abuses. Overcharging a PHEV battery could permanently damage the cells and potentially create hazardous conditions. To safeguard against this, a margin of 5% capacity is incorporated in this study to maintain stable operation below 95% state of charge (SOC). In addition, a ―no operation region‖ has been established in this study to keep Li-ion cells from discharging or operating below 25% SOC, since this leads to degradation of efficiency and performance, significant heating, and aging. Finally, the battery’s range is expected to degrade by 2% each year, so extra capacity was taken into account to maintain the PHEV’s advertised AER.
Such an operating regime is demonstrated in Figure 28 for this study’s PHEV-30. It requires a Li-ion battery pack with a total energy capacity of approximately 14 kWh, although the actual amount of energy needed to provide a 30-mile AER is only 7.8 kWh. The life expectancy of this battery design was tested in OSU CAR’s Battery Aging Laboratory to ensure that a 10-year life expectancy was indeed feasible under this study’s assumed drive patterns.
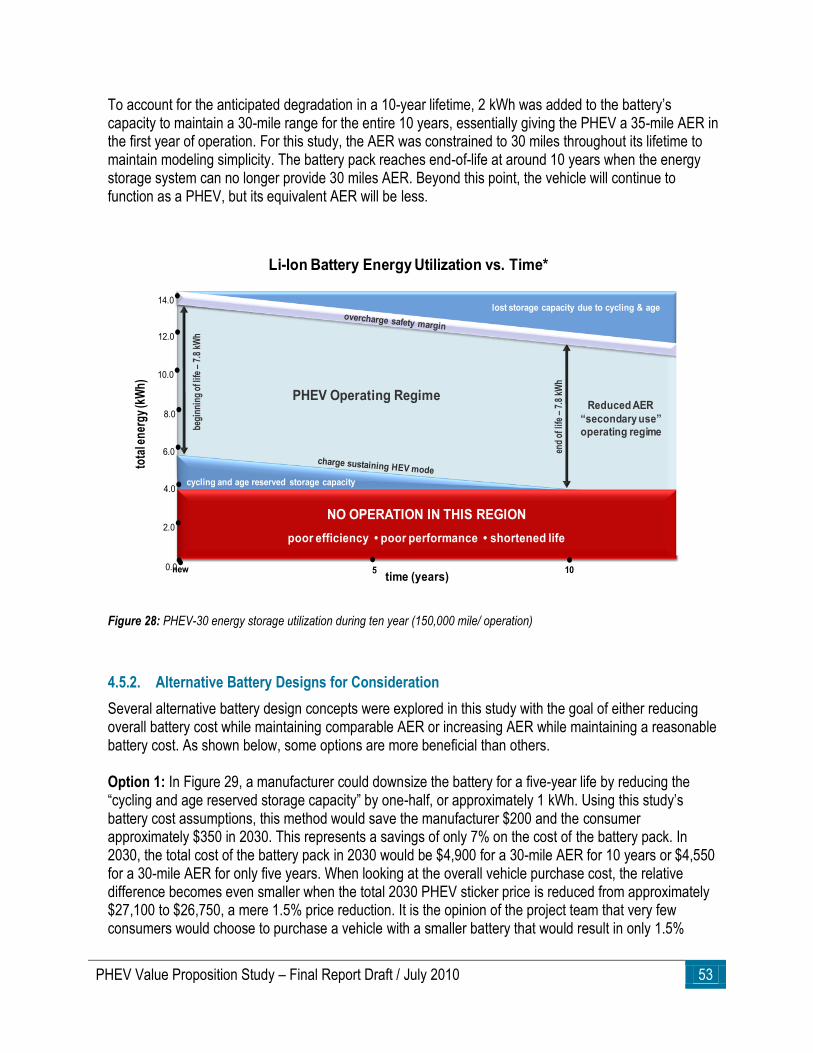
PHEV Value Proposition Study – Final Report Draft / July 2010 53
To account for the anticipated degradation in a 10-year lifetime, 2 kWh was added to the battery’s capacity to maintain a 30-mile range for the entire 10 years, essentially giving the PHEV a 35-mile AER in the first year of operation. For this study, the AER was constrained to 30 miles throughout its lifetime to maintain modeling simplicity. The battery pack reaches end-of-life at around 10 years when the energy storage system can no longer provide 30 miles AER. Beyond this point, the vehicle will continue to function as a PHEV, but its equivalent AER will be less.
Figure 28: PHEV-30 energy storage utilization during ten year (150,000 mile/ operation)
4.5.2. Alternative Battery Designs for Consideration
Several alternative battery design concepts were explored in this study with the goal of either reducing overall battery cost while maintaining comparable AER or increasing AER while maintaining a reasonable battery cost. As shown below, some options are more beneficial than others. Option 1: In Figure 29, a manufacturer could downsize the battery for a five-year life by reducing the ―cycling and age reserved storage capacity‖ by one-half, or approximately 1 kWh. Using this study’s battery cost assumptions, this method would save the manufacturer $200 and the consumer approximately $350 in 2030. This represents a savings of only 7% on the cost of the battery pack. In 2030, the total cost of the battery pack in 2030 would be $4,900 for a 30-mile AER for 10 years or $4,550 for a 30-mile AER for only five years. When looking at the overall vehicle purchase cost, the relative difference becomes even smaller when the total 2030 PHEV sticker price is reduced from approximately $27,100 to $26,750, a mere 1.5% price reduction. It is the opinion of the project team that very few consumers would choose to purchase a vehicle with a smaller battery that would result in only 1.5%
begi
nnin
g of
life
–7.
8 kW
h
0.0•
lost storage capacity due to cycling & age
NO OPERATION IN THIS REGION
poor efficiency • poor performance • shortened life
PHEV Operating Regime
end
of li
fe –
7.8
kWh
Reduced AER
“secondary use” operating regime
new 10•
tota
l en
erg
y (k
Wh
)
4.0•
6.0•
8.0•
12.0•
14.0•
•
cycling and age reserved storage capacity
10.0•
2.0•
Li-Ion Battery Energy Utilization vs. Time*
time (years)•5
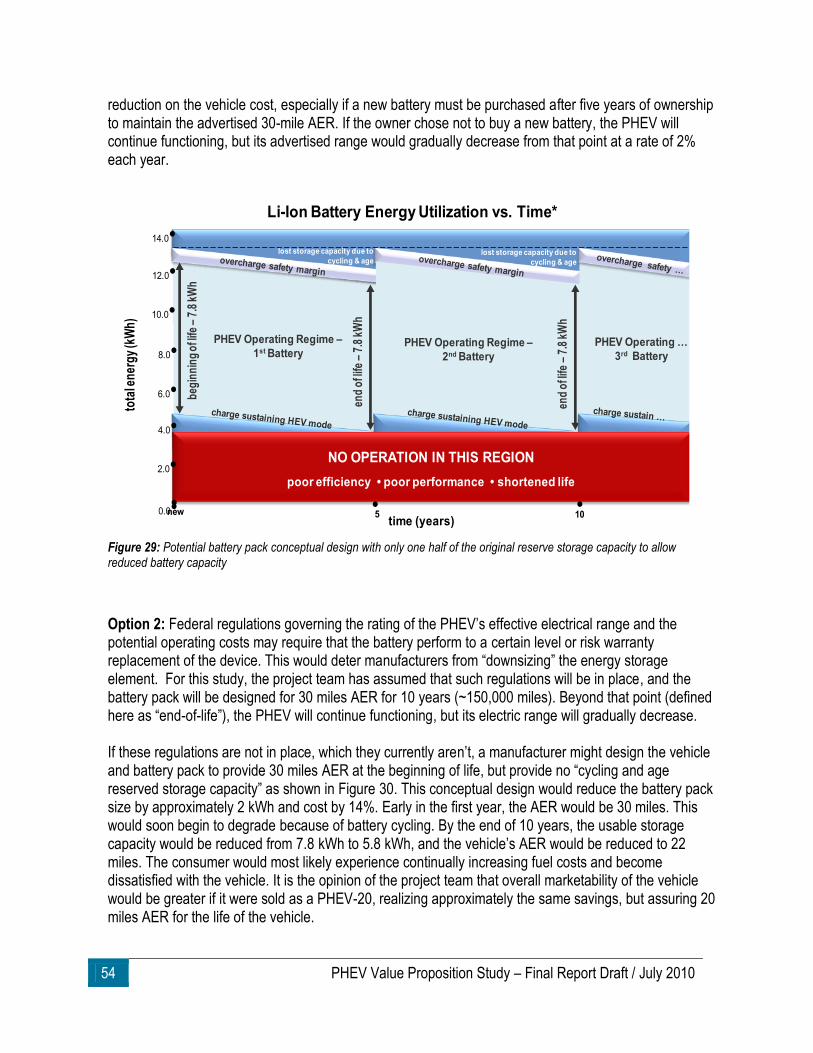
54 PHEV Value Proposition Study – Final Report Draft / July 2010
reduction on the vehicle cost, especially if a new battery must be purchased after five years of ownership to maintain the advertised 30-mile AER. If the owner chose not to buy a new battery, the PHEV will continue functioning, but its advertised range would gradually decrease from that point at a rate of 2% each year.
Figure 29: Potential battery pack conceptual design with only one half of the original reserve storage capacity to allow reduced battery capacity
Option 2: Federal regulations governing the rating of the PHEV’s effective electrical range and the potential operating costs may require that the battery perform to a certain level or risk warranty replacement of the device. This would deter manufacturers from ―downsizing‖ the energy storage element. For this study, the project team has assumed that such regulations will be in place, and the battery pack will be designed for 30 miles AER for 10 years (~150,000 miles). Beyond that point (defined here as ―end-of-life‖), the PHEV will continue functioning, but its electric range will gradually decrease. If these regulations are not in place, which they currently aren’t, a manufacturer might design the vehicle and battery pack to provide 30 miles AER at the beginning of life, but provide no ―cycling and age reserved storage capacity‖ as shown in Figure 30. This conceptual design would reduce the battery pack size by approximately 2 kWh and cost by 14%. Early in the first year, the AER would be 30 miles. This would soon begin to degrade because of battery cycling. By the end of 10 years, the usable storage capacity would be reduced from 7.8 kWh to 5.8 kWh, and the vehicle’s AER would be reduced to 22 miles. The consumer would most likely experience continually increasing fuel costs and become dissatisfied with the vehicle. It is the opinion of the project team that overall marketability of the vehicle would be greater if it were sold as a PHEV-20, realizing approximately the same savings, but assuring 20 miles AER for the life of the vehicle.
beg
inn
ing
of l
ife –
7.8
kWh
lost storage capacity due to
cycling & age
PHEV Operating Regime –
1st Batteryen
d o
f life
–7.
8 kW
h
tota
l en
erg
y (k
Wh
)
6.0•
8.0•
12.0•
14.0•
10.0•
Li-Ion Battery Energy Utilization vs. Time*
end
of l
ife –
7.8
kWh
PHEV Operating Regime –
2nd Battery
PHEV Operating …
3rd Battery
4.0•
new 10time (years)
5
NO OPERATION IN THIS REGION
poor efficiency • poor performance • shortened life2.0•
0.0• •• •
lost storage capacity due to
cycling & age
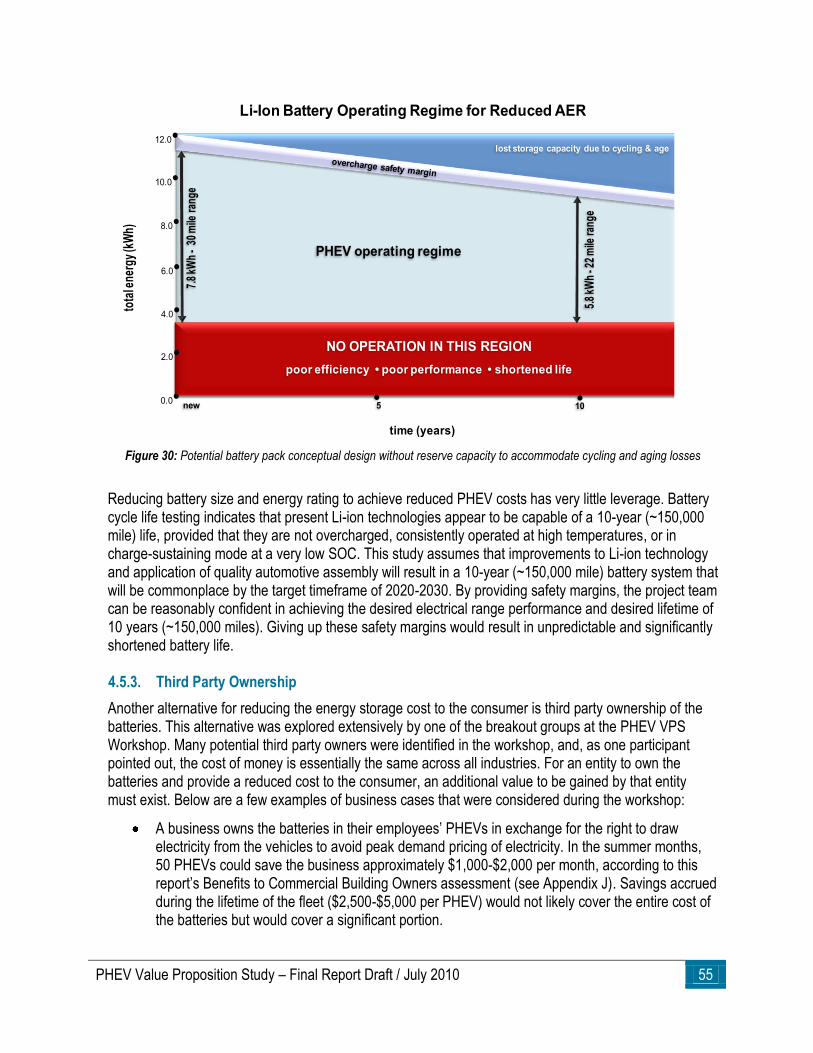
PHEV Value Proposition Study – Final Report Draft / July 2010 55
Figure 30: Potential battery pack conceptual design without reserve capacity to accommodate cycling and aging losses
Reducing battery size and energy rating to achieve reduced PHEV costs has very little leverage. Battery cycle life testing indicates that present Li-ion technologies appear to be capable of a 10-year (~150,000 mile) life, provided that they are not overcharged, consistently operated at high temperatures, or in charge-sustaining mode at a very low SOC. This study assumes that improvements to Li-ion technology and application of quality automotive assembly will result in a 10-year (~150,000 mile) battery system that will be commonplace by the target timeframe of 2020-2030. By providing safety margins, the project team can be reasonably confident in achieving the desired electrical range performance and desired lifetime of 10 years (~150,000 miles). Giving up these safety margins would result in unpredictable and significantly shortened battery life. 4.5.3. Third Party Ownership
Another alternative for reducing the energy storage cost to the consumer is third party ownership of the batteries. This alternative was explored extensively by one of the breakout groups at the PHEV VPS Workshop. Many potential third party owners were identified in the workshop, and, as one participant pointed out, the cost of money is essentially the same across all industries. For an entity to own the batteries and provide a reduced cost to the consumer, an additional value to be gained by that entity must exist. Below are a few examples of business cases that were considered during the workshop:
A business owns the batteries in their employees’ PHEVs in exchange for the right to draw electricity from the vehicles to avoid peak demand pricing of electricity. In the summer months, 50 PHEVs could save the business approximately $1,000-$2,000 per month, according to this report’s Benefits to Commercial Building Owners assessment (see Appendix J). Savings accrued during the lifetime of the fleet ($2,500-$5,000 per PHEV) would not likely cover the entire cost of the batteries but would cover a significant portion.
7.8
kWh
-30
mile
ran
ge
lost storage capacity due to cycling & age
NO OPERATION IN THIS REGION
poor efficiency • poor performance • shortened life
PHEV operating regime
5.8
kWh
-22
mile
rang
e
new 10•
tota
l ene
rgy
(kW
h)
2.0•
4.0•
6.0•
10.0•
12.0•
8.0•
Li-Ion Battery Operating Regime for Reduced AER
time (years)
•50.0•
56 PHEV Value Proposition Study – Final Report Draft / July 2010
The utility owns or partially offsets the cost of batteries in exchange for the right to discharge the batteries during times of peak demand and recharging the batteries in a controlled manner during off-peak periods. This scenario has uncertainties in the value of PHEV batteries to the utility versus the cost of permanently installed energy storage units. There are also questions of consumer acceptance and warranty issues regarding the utility’s or building owner’s responsibility for charging and discharging the PHEV batteries. Additional battery life analysis must be performed and consumer surveys should be conducted to determine if this scenario is viable.
A company that specializes in refurbishing and recycling batteries may serve as a potential owner of PHEV batteries. This company would lease the batteries to the vehicle owner for 10 years. After that point, the batteries would be removed from the vehicle, refurbished, and then leased or sold into a secondary application. For this business case to work, it must result in lower cost to the consumer, and profits from leasing and reselling batteries must outweigh the initial cost to purchase the battery.
A data mining company might own the batteries and incorporate a telemetry system to monitor battery performance and SOC. Or the company could integrate the battery pack with GPS and collect information like consumer driving and parking patterns that could be marketed. Provided privacy issues are adequately addressed, this is an example of a value that would be uniquely available to the entity owning the batteries.
To provide a related industry perspective, a recent study of third party ownership of platinum in fuel cell vehicles (Kromer 2008) concluded that, ―… such a program offers only marginal benefits to the consumer, and that reducing platinum loading is the top priority.‖ Platinum has an advantage over batteries in that its real value has been constant for more than a century. Batteries on the other hand will depreciate in value as their energy storage capacity decreases. As stated in a previous section, the secondary use net present value of the batteries in this study’s PHEV-30 is estimated at only $500. In comparison to the original vehicle cost, or even the battery cost, this number loses significance.
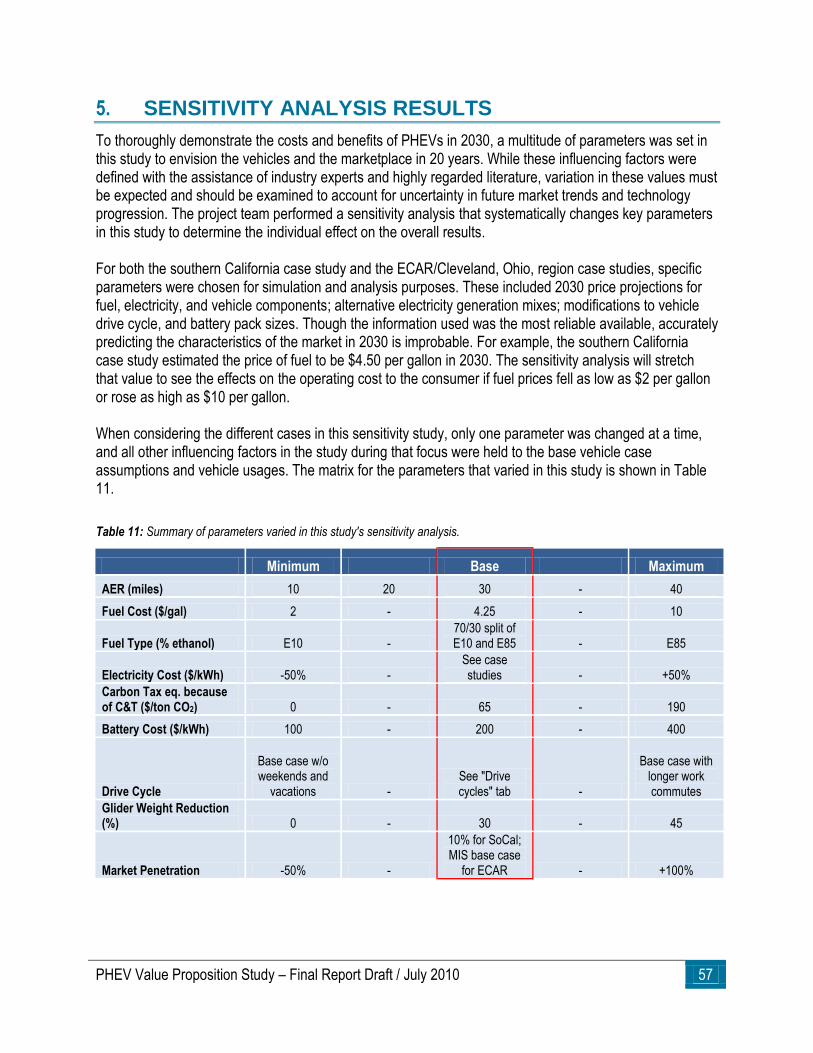
PHEV Value Proposition Study – Final Report Draft / July 2010 57
5. SENSITIVITY ANALYSIS RESULTS
To thoroughly demonstrate the costs and benefits of PHEVs in 2030, a multitude of parameters was set in this study to envision the vehicles and the marketplace in 20 years. While these influencing factors were defined with the assistance of industry experts and highly regarded literature, variation in these values must be expected and should be examined to account for uncertainty in future market trends and technology progression. The project team performed a sensitivity analysis that systematically changes key parameters in this study to determine the individual effect on the overall results. For both the southern California case study and the ECAR/Cleveland, Ohio, region case studies, specific parameters were chosen for simulation and analysis purposes. These included 2030 price projections for fuel, electricity, and vehicle components; alternative electricity generation mixes; modifications to vehicle drive cycle, and battery pack sizes. Though the information used was the most reliable available, accurately predicting the characteristics of the market in 2030 is improbable. For example, the southern California case study estimated the price of fuel to be $4.50 per gallon in 2030. The sensitivity analysis will stretch that value to see the effects on the operating cost to the consumer if fuel prices fell as low as $2 per gallon or rose as high as $10 per gallon. When considering the different cases in this sensitivity study, only one parameter was changed at a time, and all other influencing factors in the study during that focus were held to the base vehicle case assumptions and vehicle usages. The matrix for the parameters that varied in this study is shown in Table 11.
Table 11: Summary of parameters varied in this study's sensitivity analysis.
Minimum Base Maximum
AER (miles) 10 20 30 - 40
Fuel Cost ($/gal) 2 - 4.25 - 10
Fuel Type (% ethanol) E10 - 70/30 split of E10 and E85 - E85
Electricity Cost ($/kWh) -50% - See case studies - +50%
Carbon Tax eq. because of C&T ($/ton CO2) 0 - 65 - 190
Battery Cost ($/kWh) 100 - 200 - 400
Drive Cycle
Base case w/o weekends and
vacations - See "Drive cycles" tab -
Base case with longer work commutes
Glider Weight Reduction (%) 0 - 30 - 45
Market Penetration -50% -
10% for SoCal; MIS base case
for ECAR - +100%
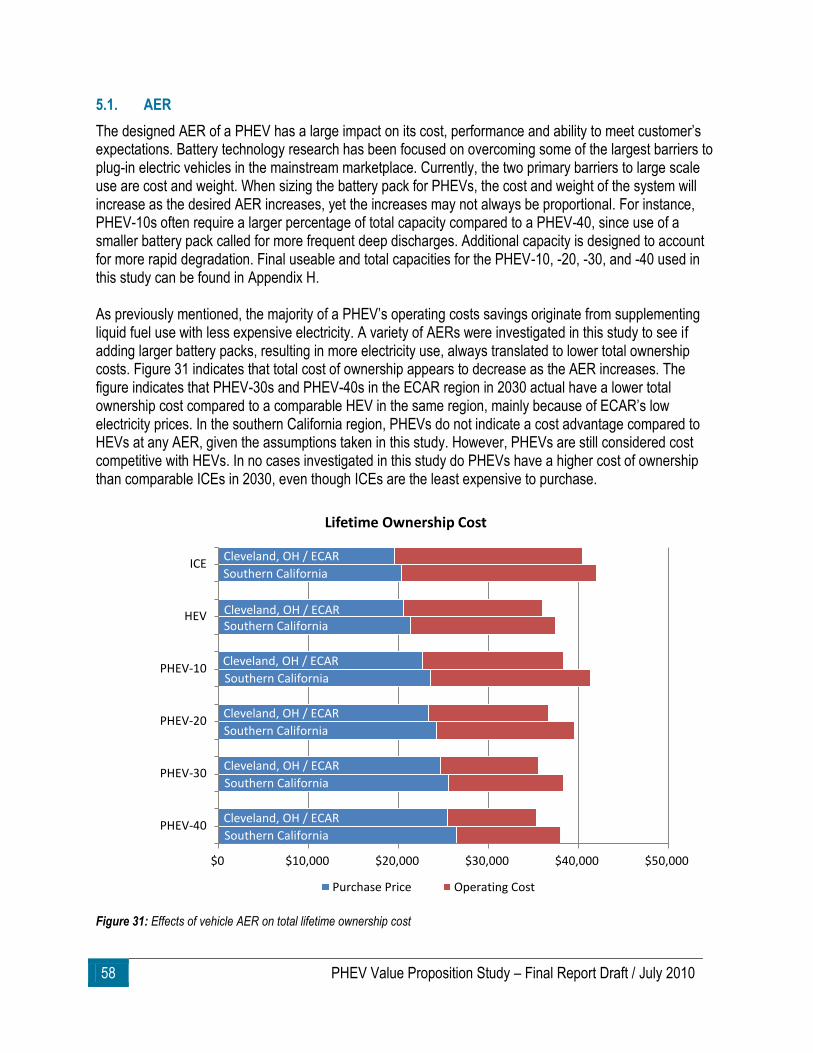
58 PHEV Value Proposition Study – Final Report Draft / July 2010
5.1. AER
The designed AER of a PHEV has a large impact on its cost, performance and ability to meet customer’s expectations. Battery technology research has been focused on overcoming some of the largest barriers to plug-in electric vehicles in the mainstream marketplace. Currently, the two primary barriers to large scale use are cost and weight. When sizing the battery pack for PHEVs, the cost and weight of the system will increase as the desired AER increases, yet the increases may not always be proportional. For instance, PHEV-10s often require a larger percentage of total capacity compared to a PHEV-40, since use of a smaller battery pack called for more frequent deep discharges. Additional capacity is designed to account for more rapid degradation. Final useable and total capacities for the PHEV-10, -20, -30, and -40 used in this study can be found in Appendix H. As previously mentioned, the majority of a PHEV’s operating costs savings originate from supplementing liquid fuel use with less expensive electricity. A variety of AERs were investigated in this study to see if adding larger battery packs, resulting in more electricity use, always translated to lower total ownership costs. Figure 31 indicates that total cost of ownership appears to decrease as the AER increases. The figure indicates that PHEV-30s and PHEV-40s in the ECAR region in 2030 actual have a lower total ownership cost compared to a comparable HEV in the same region, mainly because of ECAR’s low electricity prices. In the southern California region, PHEVs do not indicate a cost advantage compared to HEVs at any AER, given the assumptions taken in this study. However, PHEVs are still considered cost competitive with HEVs. In no cases investigated in this study do PHEVs have a higher cost of ownership than comparable ICEs in 2030, even though ICEs are the least expensive to purchase.
Figure 31: Effects of vehicle AER on total lifetime ownership cost
Cleveland, OH / ECAR
Southern California
Cleveland, OH / ECAR Southern California
Cleveland, OH / ECAR
Southern California
Cleveland, OH / ECAR
Southern California
Cleveland, OH / ECAR
Southern California
Cleveland, OH / ECAR
Southern California
$0 $10,000 $20,000 $30,000 $40,000 $50,000
ICE
HEV
PHEV-10
PHEV-20
PHEV-30
PHEV-40
Lifetime Ownership Cost
Purchase Price Operating Cost
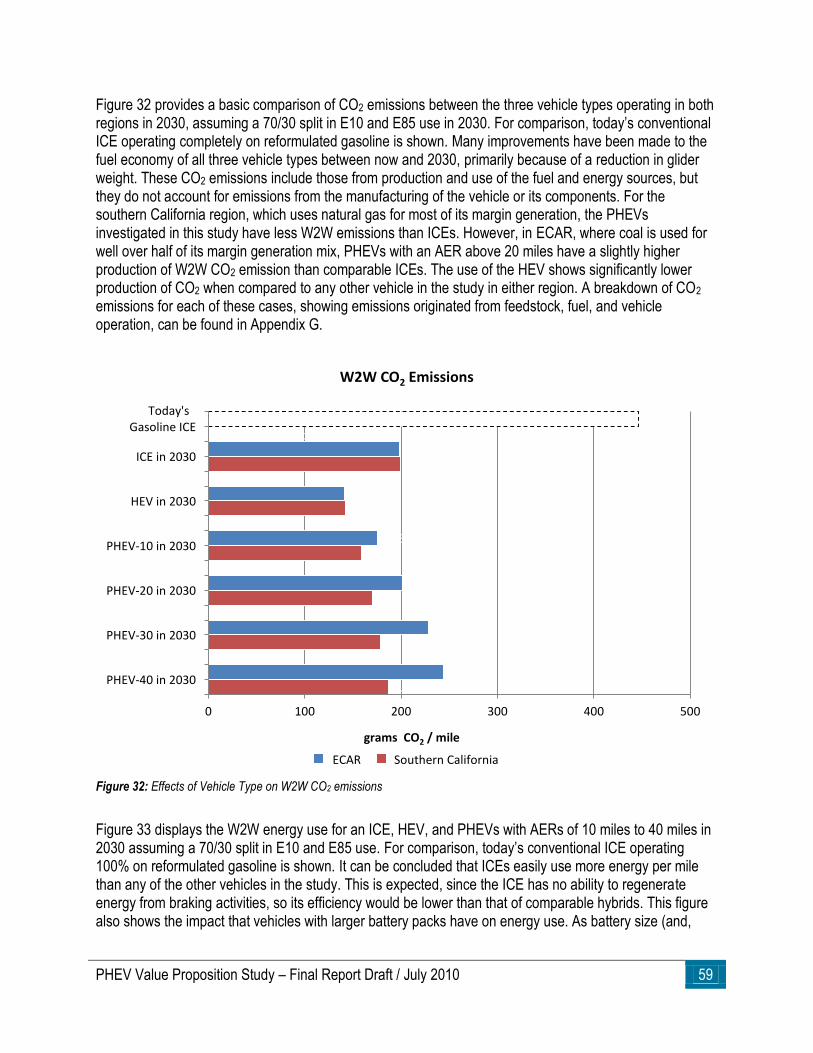
PHEV Value Proposition Study – Final Report Draft / July 2010 59
Figure 32 provides a basic comparison of CO2 emissions between the three vehicle types operating in both regions in 2030, assuming a 70/30 split in E10 and E85 use in 2030. For comparison, today’s conventional ICE operating completely on reformulated gasoline is shown. Many improvements have been made to the fuel economy of all three vehicle types between now and 2030, primarily because of a reduction in glider weight. These CO2 emissions include those from production and use of the fuel and energy sources, but they do not account for emissions from the manufacturing of the vehicle or its components. For the southern California region, which uses natural gas for most of its margin generation, the PHEVs investigated in this study have less W2W emissions than ICEs. However, in ECAR, where coal is used for well over half of its margin generation mix, PHEVs with an AER above 20 miles have a slightly higher production of W2W CO2 emission than comparable ICEs. The use of the HEV shows significantly lower production of CO2 when compared to any other vehicle in the study in either region. A breakdown of CO2 emissions for each of these cases, showing emissions originated from feedstock, fuel, and vehicle operation, can be found in Appendix G.
Figure 32: Effects of Vehicle Type on W2W CO2 emissions
Figure 33 displays the W2W energy use for an ICE, HEV, and PHEVs with AERs of 10 miles to 40 miles in 2030 assuming a 70/30 split in E10 and E85 use. For comparison, today’s conventional ICE operating 100% on reformulated gasoline is shown. It can be concluded that ICEs easily use more energy per mile than any of the other vehicles in the study. This is expected, since the ICE has no ability to regenerate energy from braking activities, so its efficiency would be lower than that of comparable hybrids. This figure also shows the impact that vehicles with larger battery packs have on energy use. As battery size (and,
Southern California 198
ECAR
141 ECAR
175 ECAR
201 ECAR
228 ECAR
244 187
0 100 200 300 400 500
Today'sGasoline ICE
ICE in 2030
HEV in 2030
PHEV-10 in 2030
PHEV-20 in 2030
PHEV-30 in 2030
PHEV-40 in 2030
grams CO2 / mile
W2W CO2 Emissions
ECAR Southern California
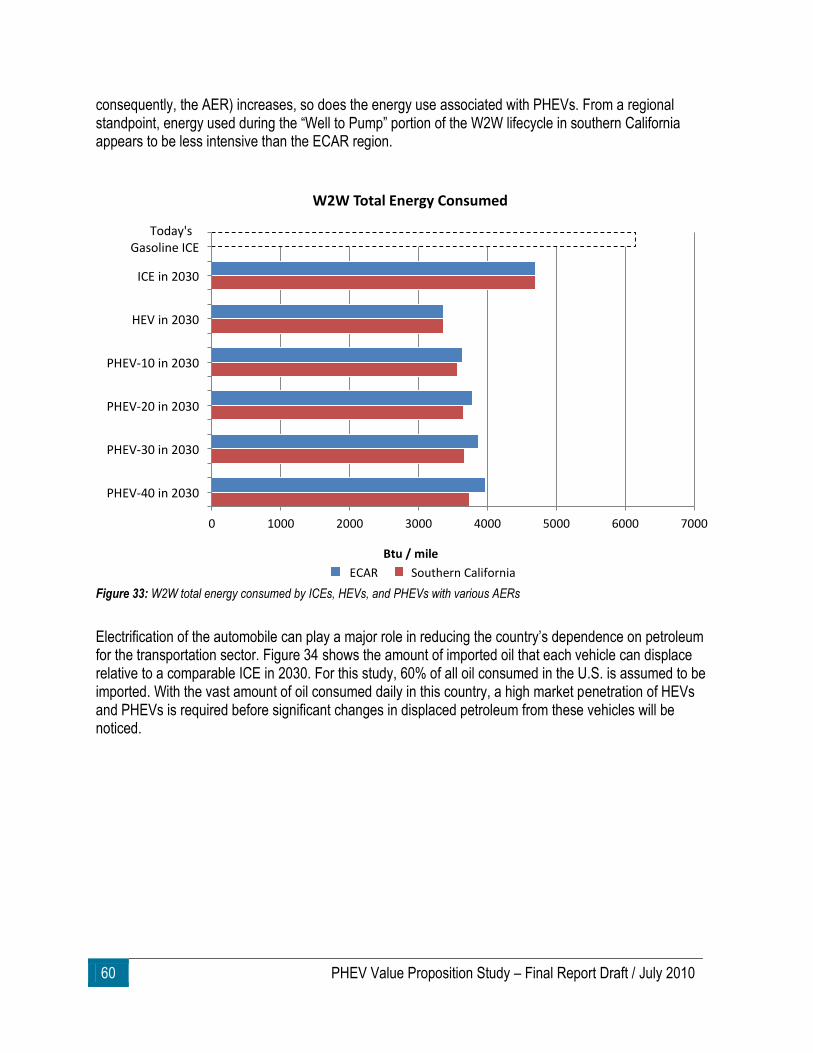
60 PHEV Value Proposition Study – Final Report Draft / July 2010
consequently, the AER) increases, so does the energy use associated with PHEVs. From a regional standpoint, energy used during the ―Well to Pump‖ portion of the W2W lifecycle in southern California appears to be less intensive than the ECAR region.
Figure 33: W2W total energy consumed by ICEs, HEVs, and PHEVs with various AERs
Electrification of the automobile can play a major role in reducing the country’s dependence on petroleum for the transportation sector. Figure 34 shows the amount of imported oil that each vehicle can displace relative to a comparable ICE in 2030. For this study, 60% of all oil consumed in the U.S. is assumed to be imported. With the vast amount of oil consumed daily in this country, a high market penetration of HEVs and PHEVs is required before significant changes in displaced petroleum from these vehicles will be noticed.
0 1000 2000 3000 4000 5000 6000 7000
Today'sGasoline ICE
ICE in 2030
HEV in 2030
PHEV-10 in 2030
PHEV-20 in 2030
PHEV-30 in 2030
PHEV-40 in 2030
Btu / mile
W2W Total Energy Consumed
ECAR Southern California
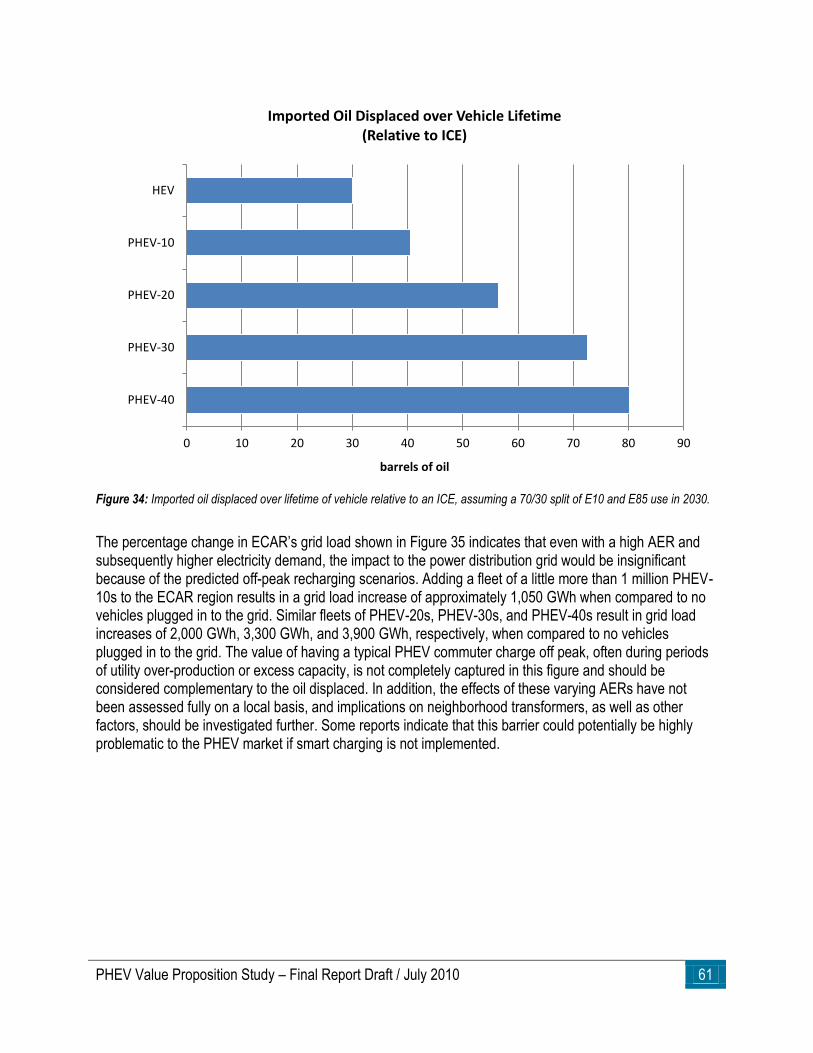
PHEV Value Proposition Study – Final Report Draft / July 2010 61
Figure 34: Imported oil displaced over lifetime of vehicle relative to an ICE, assuming a 70/30 split of E10 and E85 use in 2030.
The percentage change in ECAR’s grid load shown in Figure 35 indicates that even with a high AER and subsequently higher electricity demand, the impact to the power distribution grid would be insignificant because of the predicted off-peak recharging scenarios. Adding a fleet of a little more than 1 million PHEV-10s to the ECAR region results in a grid load increase of approximately 1,050 GWh when compared to no vehicles plugged in to the grid. Similar fleets of PHEV-20s, PHEV-30s, and PHEV-40s result in grid load increases of 2,000 GWh, 3,300 GWh, and 3,900 GWh, respectively, when compared to no vehicles plugged in to the grid. The value of having a typical PHEV commuter charge off peak, often during periods of utility over-production or excess capacity, is not completely captured in this figure and should be considered complementary to the oil displaced. In addition, the effects of these varying AERs have not been assessed fully on a local basis, and implications on neighborhood transformers, as well as other factors, should be investigated further. Some reports indicate that this barrier could potentially be highly problematic to the PHEV market if smart charging is not implemented.
0 10 20 30 40 50 60 70 80 90
HEV
PHEV-10
PHEV-20
PHEV-30
PHEV-40
barrels of oil
Imported Oil Displaced over Vehicle Lifetime (Relative to ICE)

62 PHEV Value Proposition Study – Final Report Draft / July 2010
Figure 35: Increase in ECAR grid load due to PHEV fleets with varying AERs
5.2. Vehicle Weight
For any vehicle, whether it is an advanced technology hybrid or a traditional ICE, the balance between weight, structural integrity, and feature content is played out during the development of the vehicle. Many considerations are made by the manufacturer. The Federal Motor Vehicle Safety Standards must be met in terms of crash worthiness, which has an impact on the vehicle’s minimum weight, but often different materials are available to the manufacturer that allow the structure needed with reduced weight impact. The barrier to these materials is usually cost, as is the case with lightweight, high-strength carbon fiber materials. The ICE, HEV, and PHEV-30 investigated in the southern California and ECAR case studies are assumed to have a 30% glider weight reduction compared with today’s vehicles. In this sensitivity study, the glider weight was varied from no weight reduction to an ultra light weight glider (45% less than the base glider weight) to evaluate the impact of mass on the various configurations. Figure 36 shows how these vehicle weight modifications impact projected displacement of imported oil per vehicle. The amount of oil displaced as a result of decreased glider weight is technology-dependent. The ICE and the PHEV-30 show the most significant improvement from the 30% reduction with the ICE having a slightly greater improvement when compared to either the 30% or 45% reduction. This is to be expected since a typical electrified powertrain would have less sensitivity to weight variations with regards to efficiency than an ICE-equipped vehicle. Summary output tables that show calculations for imported oil displacement achievable with different vehicle glider weights are provided in Appendix E.
0.00% 0.10% 0.20% 0.30% 0.40% 0.50% 0.60% 0.70%
PHEV-10s
PHEV-20s
PHEV-30s
PHEV-40s
Percentage Change in ECAR Grid Load
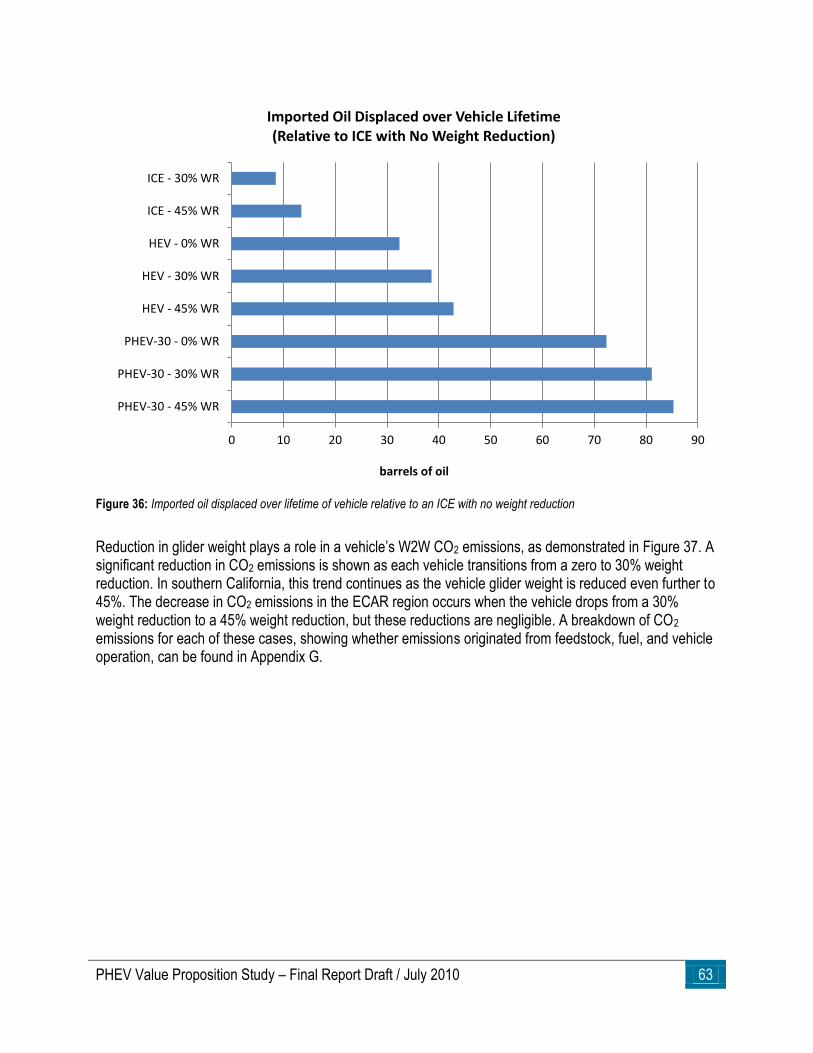
PHEV Value Proposition Study – Final Report Draft / July 2010 63
Figure 36: Imported oil displaced over lifetime of vehicle relative to an ICE with no weight reduction
Reduction in glider weight plays a role in a vehicle’s W2W CO2 emissions, as demonstrated in Figure 37. A significant reduction in CO2 emissions is shown as each vehicle transitions from a zero to 30% weight reduction. In southern California, this trend continues as the vehicle glider weight is reduced even further to 45%. The decrease in CO2 emissions in the ECAR region occurs when the vehicle drops from a 30% weight reduction to a 45% weight reduction, but these reductions are negligible. A breakdown of CO2 emissions for each of these cases, showing whether emissions originated from feedstock, fuel, and vehicle operation, can be found in Appendix G.
0 10 20 30 40 50 60 70 80 90
ICE - 30% WR
ICE - 45% WR
HEV - 0% WR
HEV - 30% WR
HEV - 45% WR
PHEV-30 - 0% WR
PHEV-30 - 30% WR
PHEV-30 - 45% WR
barrels of oil
Imported Oil Displaced over Vehicle Lifetime (Relative to ICE with No Weight Reduction)
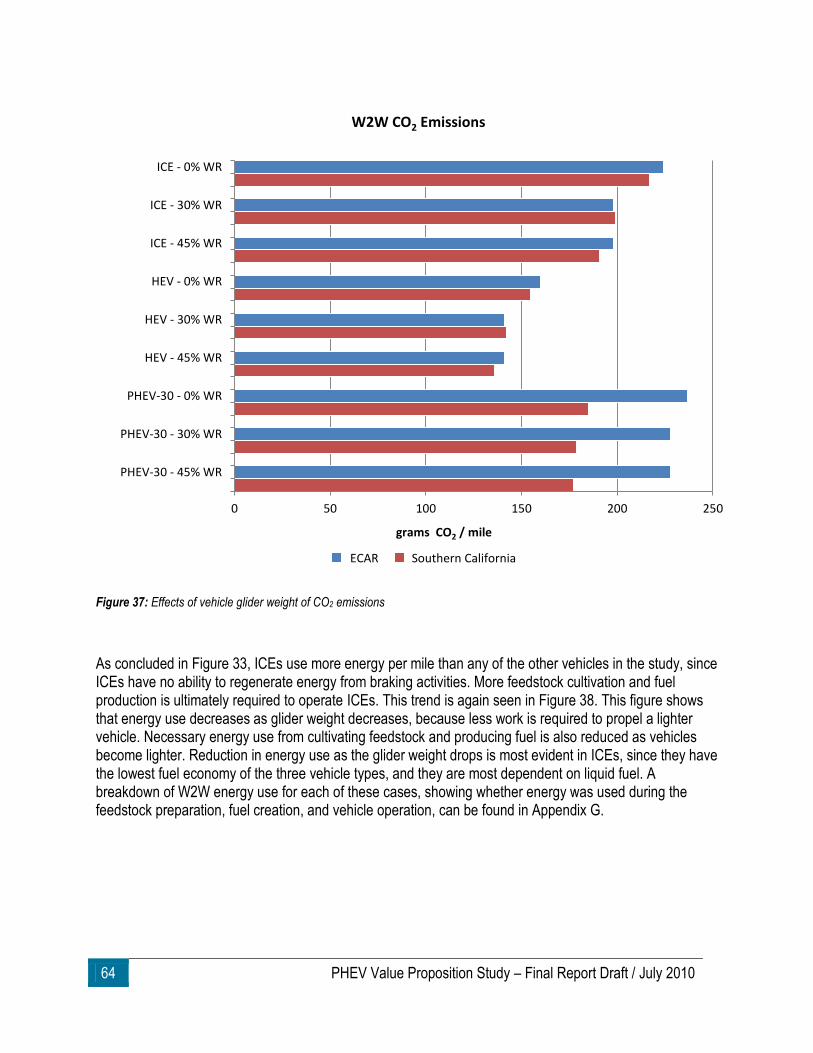
64 PHEV Value Proposition Study – Final Report Draft / July 2010
Figure 37: Effects of vehicle glider weight of CO2 emissions
As concluded in Figure 33, ICEs use more energy per mile than any of the other vehicles in the study, since ICEs have no ability to regenerate energy from braking activities. More feedstock cultivation and fuel production is ultimately required to operate ICEs. This trend is again seen in Figure 38. This figure shows that energy use decreases as glider weight decreases, because less work is required to propel a lighter vehicle. Necessary energy use from cultivating feedstock and producing fuel is also reduced as vehicles become lighter. Reduction in energy use as the glider weight drops is most evident in ICEs, since they have the lowest fuel economy of the three vehicle types, and they are most dependent on liquid fuel. A breakdown of W2W energy use for each of these cases, showing whether energy was used during the feedstock preparation, fuel creation, and vehicle operation, can be found in Appendix G.
0 50 100 150 200 250
ICE - 0% WR
ICE - 30% WR
ICE - 45% WR
HEV - 0% WR
HEV - 30% WR
HEV - 45% WR
PHEV-30 - 0% WR
PHEV-30 - 30% WR
PHEV-30 - 45% WR
grams CO2 / mile
W2W CO2 Emissions
ECAR Southern California
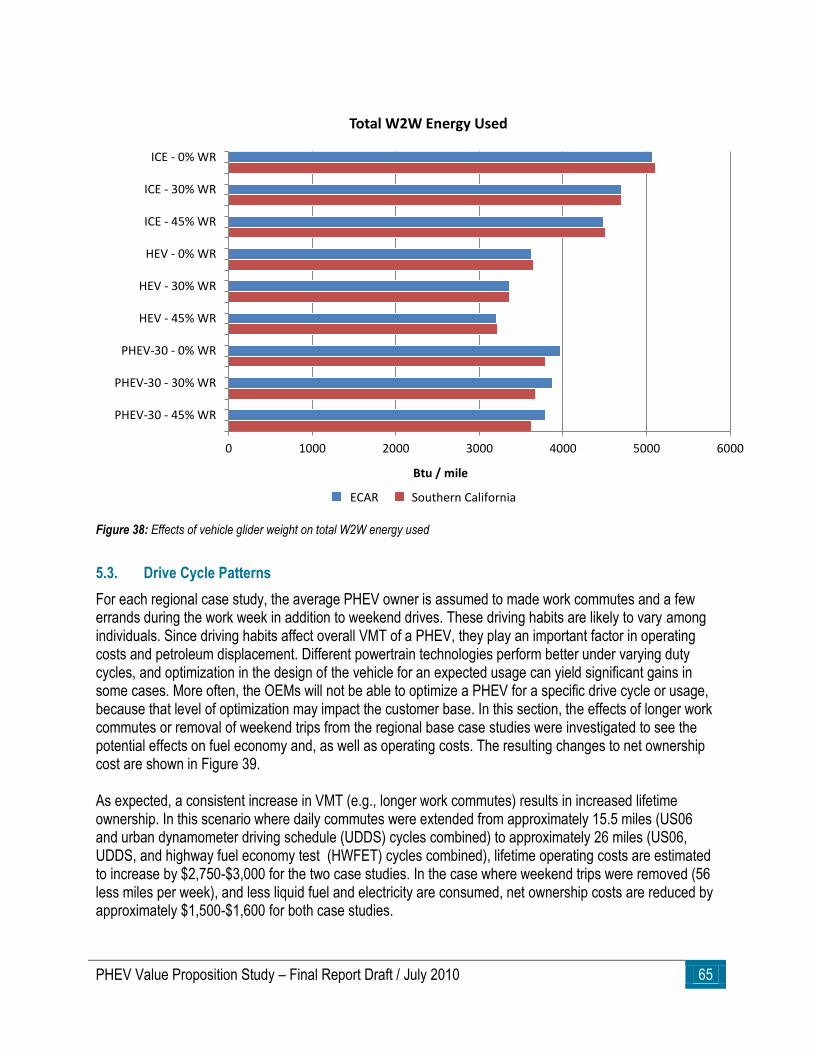
PHEV Value Proposition Study – Final Report Draft / July 2010 65
Figure 38: Effects of vehicle glider weight on total W2W energy used
5.3. Drive Cycle Patterns
For each regional case study, the average PHEV owner is assumed to made work commutes and a few errands during the work week in addition to weekend drives. These driving habits are likely to vary among individuals. Since driving habits affect overall VMT of a PHEV, they play an important factor in operating costs and petroleum displacement. Different powertrain technologies perform better under varying duty cycles, and optimization in the design of the vehicle for an expected usage can yield significant gains in some cases. More often, the OEMs will not be able to optimize a PHEV for a specific drive cycle or usage, because that level of optimization may impact the customer base. In this section, the effects of longer work commutes or removal of weekend trips from the regional base case studies were investigated to see the potential effects on fuel economy and, as well as operating costs. The resulting changes to net ownership cost are shown in Figure 39. As expected, a consistent increase in VMT (e.g., longer work commutes) results in increased lifetime ownership. In this scenario where daily commutes were extended from approximately 15.5 miles (US06 and urban dynamometer driving schedule (UDDS) cycles combined) to approximately 26 miles (US06, UDDS, and highway fuel economy test (HWFET) cycles combined), lifetime operating costs are estimated to increase by $2,750-$3,000 for the two case studies. In the case where weekend trips were removed (56 less miles per week), and less liquid fuel and electricity are consumed, net ownership costs are reduced by approximately $1,500-$1,600 for both case studies.
0 1000 2000 3000 4000 5000 6000
ICE - 0% WR
ICE - 30% WR
ICE - 45% WR
HEV - 0% WR
HEV - 30% WR
HEV - 45% WR
PHEV-30 - 0% WR
PHEV-30 - 30% WR
PHEV-30 - 45% WR
Btu / mile
Total W2W Energy Used
ECAR Southern California
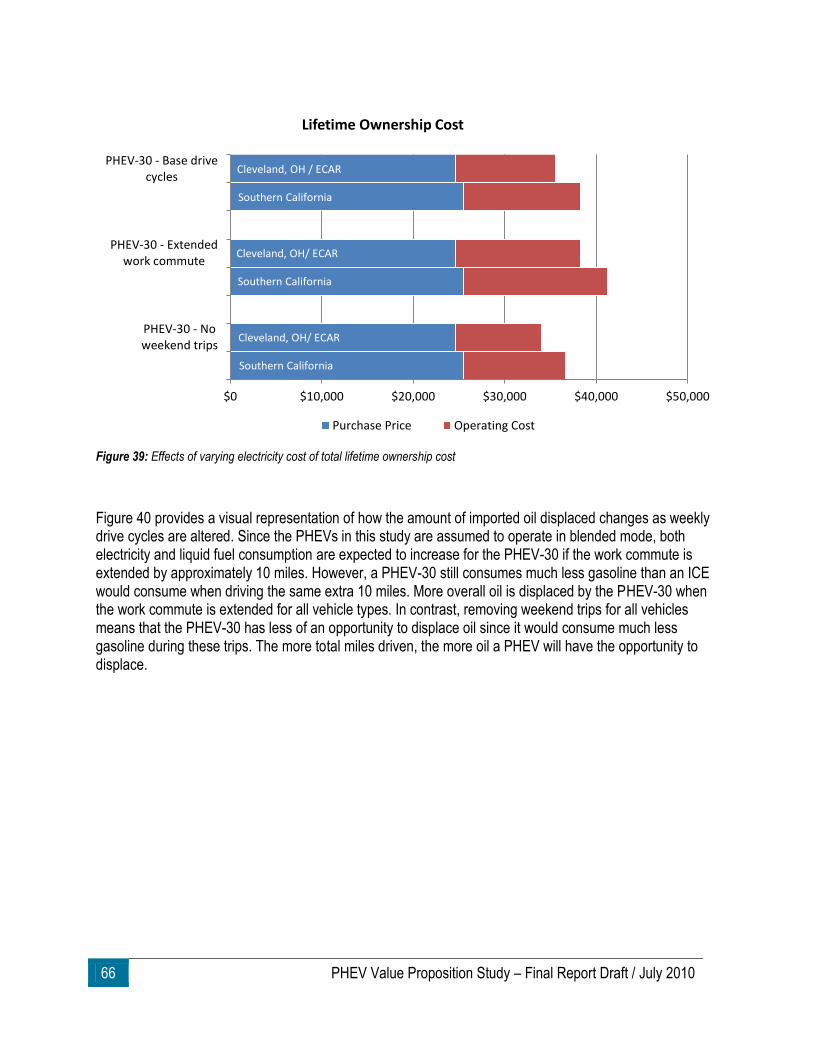
66 PHEV Value Proposition Study – Final Report Draft / July 2010
Figure 39: Effects of varying electricity cost of total lifetime ownership cost
Figure 40 provides a visual representation of how the amount of imported oil displaced changes as weekly drive cycles are altered. Since the PHEVs in this study are assumed to operate in blended mode, both electricity and liquid fuel consumption are expected to increase for the PHEV-30 if the work commute is extended by approximately 10 miles. However, a PHEV-30 still consumes much less gasoline than an ICE would consume when driving the same extra 10 miles. More overall oil is displaced by the PHEV-30 when the work commute is extended for all vehicle types. In contrast, removing weekend trips for all vehicles means that the PHEV-30 has less of an opportunity to displace oil since it would consume much less gasoline during these trips. The more total miles driven, the more oil a PHEV will have the opportunity to displace.
Cleveland, OH / ECAR
Southern California
Cleveland, OH/ ECAR
Southern California
Cleveland, OH/ ECAR
Southern California
$0 $10,000 $20,000 $30,000 $40,000 $50,000
PHEV-30 - Base drivecycles
PHEV-30 - Extendedwork commute
PHEV-30 - Noweekend trips
Lifetime Ownership Cost
Purchase Price Operating Cost
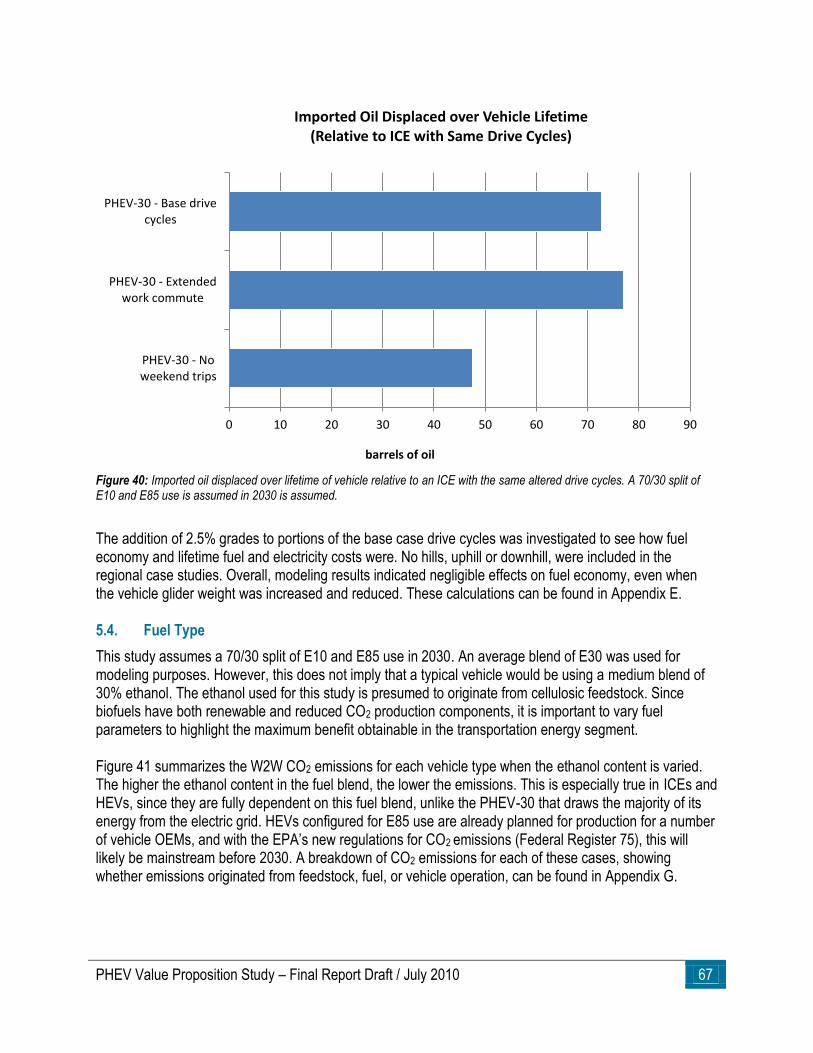
PHEV Value Proposition Study – Final Report Draft / July 2010 67
Figure 40: Imported oil displaced over lifetime of vehicle relative to an ICE with the same altered drive cycles. A 70/30 split of E10 and E85 use is assumed in 2030 is assumed.
The addition of 2.5% grades to portions of the base case drive cycles was investigated to see how fuel economy and lifetime fuel and electricity costs were. No hills, uphill or downhill, were included in the regional case studies. Overall, modeling results indicated negligible effects on fuel economy, even when the vehicle glider weight was increased and reduced. These calculations can be found in Appendix E. 5.4. Fuel Type
This study assumes a 70/30 split of E10 and E85 use in 2030. An average blend of E30 was used for modeling purposes. However, this does not imply that a typical vehicle would be using a medium blend of 30% ethanol. The ethanol used for this study is presumed to originate from cellulosic feedstock. Since biofuels have both renewable and reduced CO2 production components, it is important to vary fuel parameters to highlight the maximum benefit obtainable in the transportation energy segment. Figure 41 summarizes the W2W CO2 emissions for each vehicle type when the ethanol content is varied. The higher the ethanol content in the fuel blend, the lower the emissions. This is especially true in ICEs and HEVs, since they are fully dependent on this fuel blend, unlike the PHEV-30 that draws the majority of its energy from the electric grid. HEVs configured for E85 use are already planned for production for a number of vehicle OEMs, and with the EPA’s new regulations for CO2 emissions (Federal Register 75), this will likely be mainstream before 2030. A breakdown of CO2 emissions for each of these cases, showing whether emissions originated from feedstock, fuel, or vehicle operation, can be found in Appendix G.
0 10 20 30 40 50 60 70 80 90
PHEV-30 - Base drivecycles
PHEV-30 - Extendedwork commute
PHEV-30 - Noweekend trips
barrels of oil
Imported Oil Displaced over Vehicle Lifetime (Relative to ICE with Same Drive Cycles)
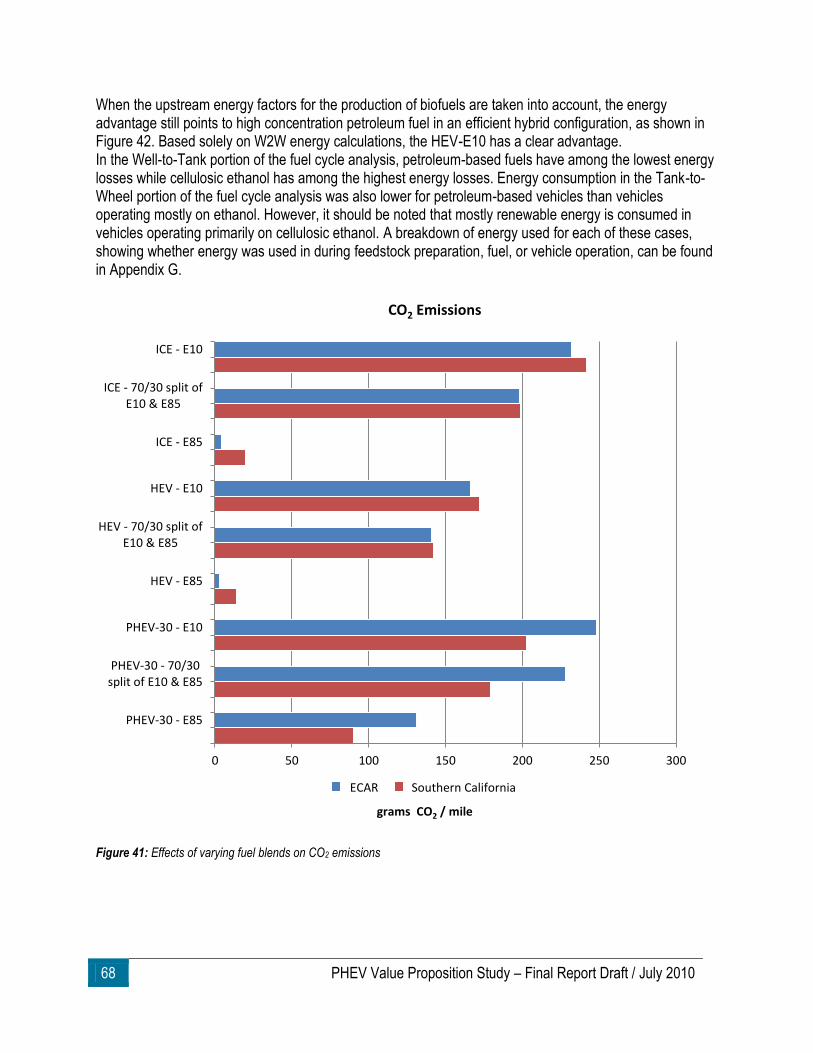
68 PHEV Value Proposition Study – Final Report Draft / July 2010
When the upstream energy factors for the production of biofuels are taken into account, the energy advantage still points to high concentration petroleum fuel in an efficient hybrid configuration, as shown in Figure 42. Based solely on W2W energy calculations, the HEV-E10 has a clear advantage. In the Well-to-Tank portion of the fuel cycle analysis, petroleum-based fuels have among the lowest energy losses while cellulosic ethanol has among the highest energy losses. Energy consumption in the Tank-to-Wheel portion of the fuel cycle analysis was also lower for petroleum-based vehicles than vehicles operating mostly on ethanol. However, it should be noted that mostly renewable energy is consumed in vehicles operating primarily on cellulosic ethanol. A breakdown of energy used for each of these cases, showing whether energy was used in during feedstock preparation, fuel, or vehicle operation, can be found in Appendix G.
Figure 41: Effects of varying fuel blends on CO2 emissions
0 50 100 150 200 250 300
ICE - E10
ICE - 70/30 split ofE10 & E85
ICE - E85
HEV - E10
HEV - 70/30 split ofE10 & E85
HEV - E85
PHEV-30 - E10
PHEV-30 - 70/30split of E10 & E85
PHEV-30 - E85
grams CO2 / mile
CO2 Emissions
ECAR Southern California
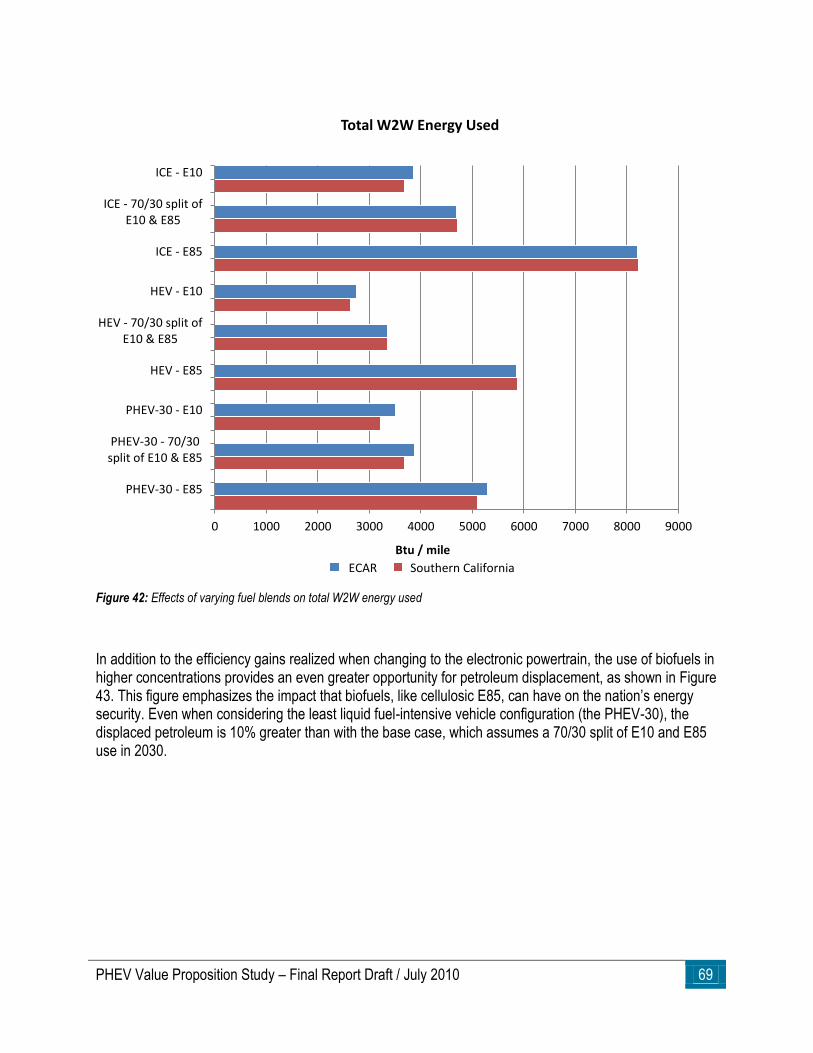
PHEV Value Proposition Study – Final Report Draft / July 2010 69
Figure 42: Effects of varying fuel blends on total W2W energy used
In addition to the efficiency gains realized when changing to the electronic powertrain, the use of biofuels in higher concentrations provides an even greater opportunity for petroleum displacement, as shown in Figure 43. This figure emphasizes the impact that biofuels, like cellulosic E85, can have on the nation’s energy security. Even when considering the least liquid fuel-intensive vehicle configuration (the PHEV-30), the displaced petroleum is 10% greater than with the base case, which assumes a 70/30 split of E10 and E85 use in 2030.
0 1000 2000 3000 4000 5000 6000 7000 8000 9000
ICE - E10
ICE - 70/30 split ofE10 & E85
ICE - E85
HEV - E10
HEV - 70/30 split ofE10 & E85
HEV - E85
PHEV-30 - E10
PHEV-30 - 70/30split of E10 & E85
PHEV-30 - E85
Btu / mile
Total W2W Energy Used
ECAR Southern California
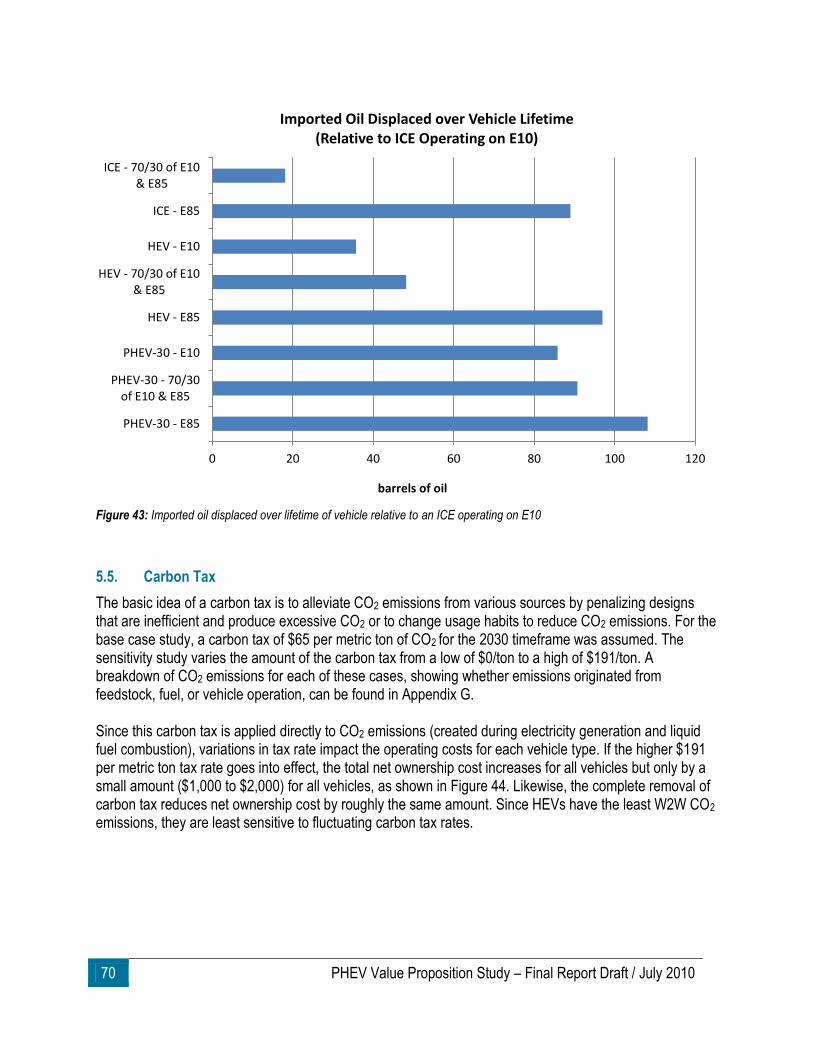
70 PHEV Value Proposition Study – Final Report Draft / July 2010
Figure 43: Imported oil displaced over lifetime of vehicle relative to an ICE operating on E10
5.5. Carbon Tax
The basic idea of a carbon tax is to alleviate CO2 emissions from various sources by penalizing designs that are inefficient and produce excessive CO2 or to change usage habits to reduce CO2 emissions. For the base case study, a carbon tax of $65 per metric ton of CO2 for the 2030 timeframe was assumed. The sensitivity study varies the amount of the carbon tax from a low of $0/ton to a high of $191/ton. A breakdown of CO2 emissions for each of these cases, showing whether emissions originated from feedstock, fuel, or vehicle operation, can be found in Appendix G. Since this carbon tax is applied directly to CO2 emissions (created during electricity generation and liquid fuel combustion), variations in tax rate impact the operating costs for each vehicle type. If the higher $191 per metric ton tax rate goes into effect, the total net ownership cost increases for all vehicles but only by a small amount ($1,000 to $2,000) for all vehicles, as shown in Figure 44. Likewise, the complete removal of carbon tax reduces net ownership cost by roughly the same amount. Since HEVs have the least W2W CO2 emissions, they are least sensitive to fluctuating carbon tax rates.
0 20 40 60 80 100 120
ICE - 70/30 of E10& E85
ICE - E85
HEV - E10
HEV - 70/30 of E10& E85
HEV - E85
PHEV-30 - E10
PHEV-30 - 70/30of E10 & E85
PHEV-30 - E85
barrels of oil
Imported Oil Displaced over Vehicle Lifetime (Relative to ICE Operating on E10)
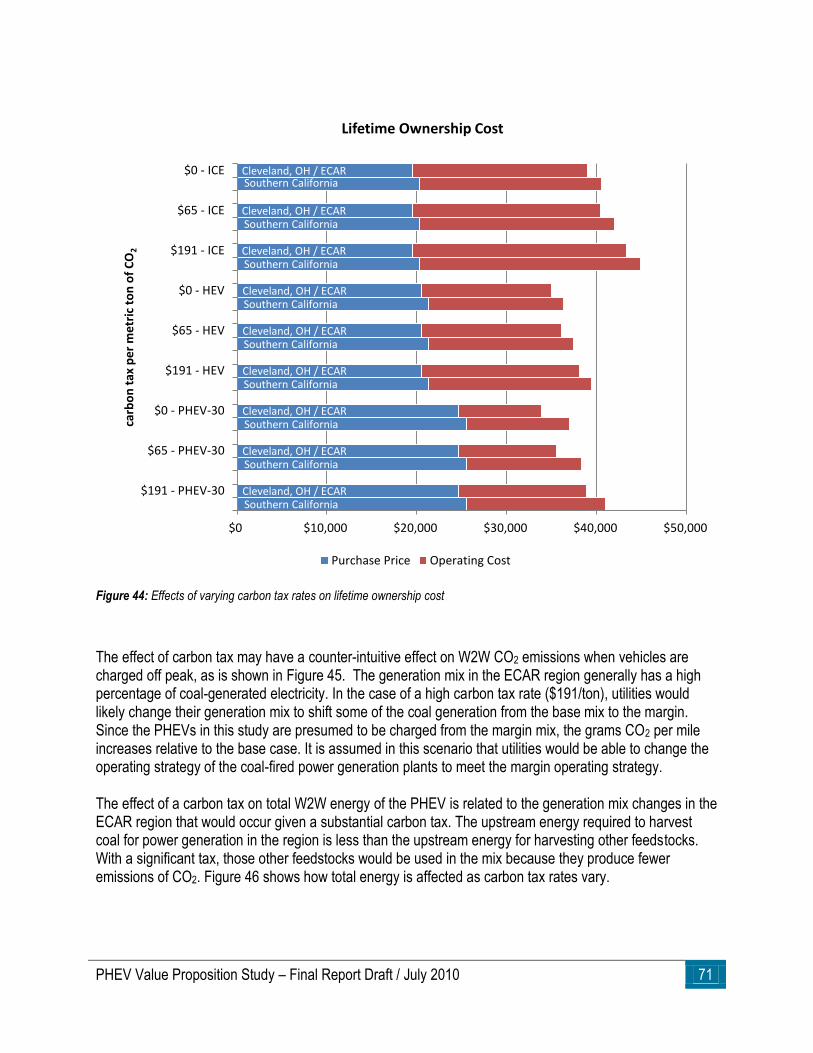
PHEV Value Proposition Study – Final Report Draft / July 2010 71
Figure 44: Effects of varying carbon tax rates on lifetime ownership cost
The effect of carbon tax may have a counter-intuitive effect on W2W CO2 emissions when vehicles are charged off peak, as is shown in Figure 45. The generation mix in the ECAR region generally has a high percentage of coal-generated electricity. In the case of a high carbon tax rate ($191/ton), utilities would likely change their generation mix to shift some of the coal generation from the base mix to the margin. Since the PHEVs in this study are presumed to be charged from the margin mix, the grams CO2 per mile increases relative to the base case. It is assumed in this scenario that utilities would be able to change the operating strategy of the coal-fired power generation plants to meet the margin operating strategy. The effect of a carbon tax on total W2W energy of the PHEV is related to the generation mix changes in the ECAR region that would occur given a substantial carbon tax. The upstream energy required to harvest coal for power generation in the region is less than the upstream energy for harvesting other feedstocks. With a significant tax, those other feedstocks would be used in the mix because they produce fewer emissions of CO2. Figure 46 shows how total energy is affected as carbon tax rates vary.
Cleveland, OH / ECAR Southern California
Cleveland, OH / ECAR Southern California
Cleveland, OH / ECAR Southern California
Cleveland, OH / ECAR Southern California
Cleveland, OH / ECAR Southern California
Cleveland, OH / ECAR Southern California
Cleveland, OH / ECAR Southern California
Cleveland, OH / ECAR Southern California
Cleveland, OH / ECAR Southern California
$0 $10,000 $20,000 $30,000 $40,000 $50,000
$0 - ICE
$65 - ICE
$191 - ICE
$0 - HEV
$65 - HEV
$191 - HEV
$0 - PHEV-30
$65 - PHEV-30
$191 - PHEV-30
carb
on
tax
pe
r m
etr
ic t
on
of
CO
2
Lifetime Ownership Cost
Purchase Price Operating Cost
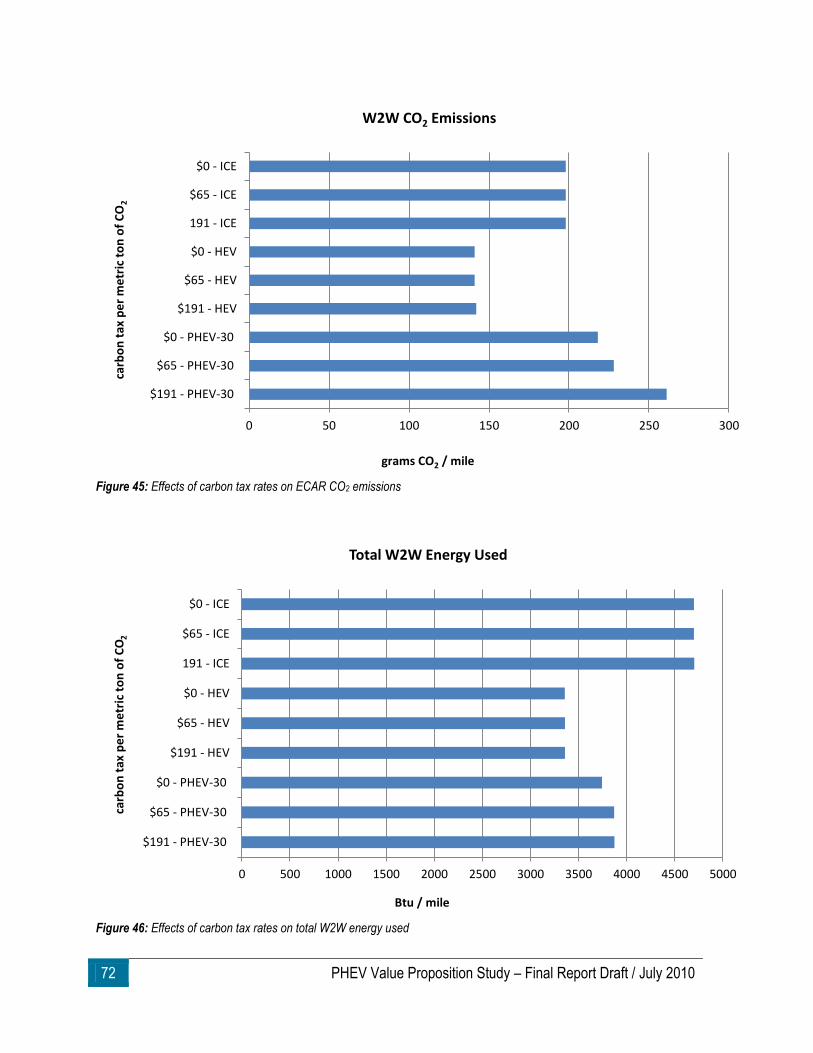
72 PHEV Value Proposition Study – Final Report Draft / July 2010
Figure 45: Effects of carbon tax rates on ECAR CO2 emissions
Figure 46: Effects of carbon tax rates on total W2W energy used
0 50 100 150 200 250 300
$0 - ICE
$65 - ICE
191 - ICE
$0 - HEV
$65 - HEV
$191 - HEV
$0 - PHEV-30
$65 - PHEV-30
$191 - PHEV-30
grams CO2 / mile
carb
on
tax
pe
r m
etr
ic t
on
of
CO
2 W2W CO2 Emissions
0 500 1000 1500 2000 2500 3000 3500 4000 4500 5000
$0 - ICE
$65 - ICE
191 - ICE
$0 - HEV
$65 - HEV
$191 - HEV
$0 - PHEV-30
$65 - PHEV-30
$191 - PHEV-30
Btu / mile
carb
on
tax
pe
r m
etr
ic t
on
of
CO
2
Total W2W Energy Used
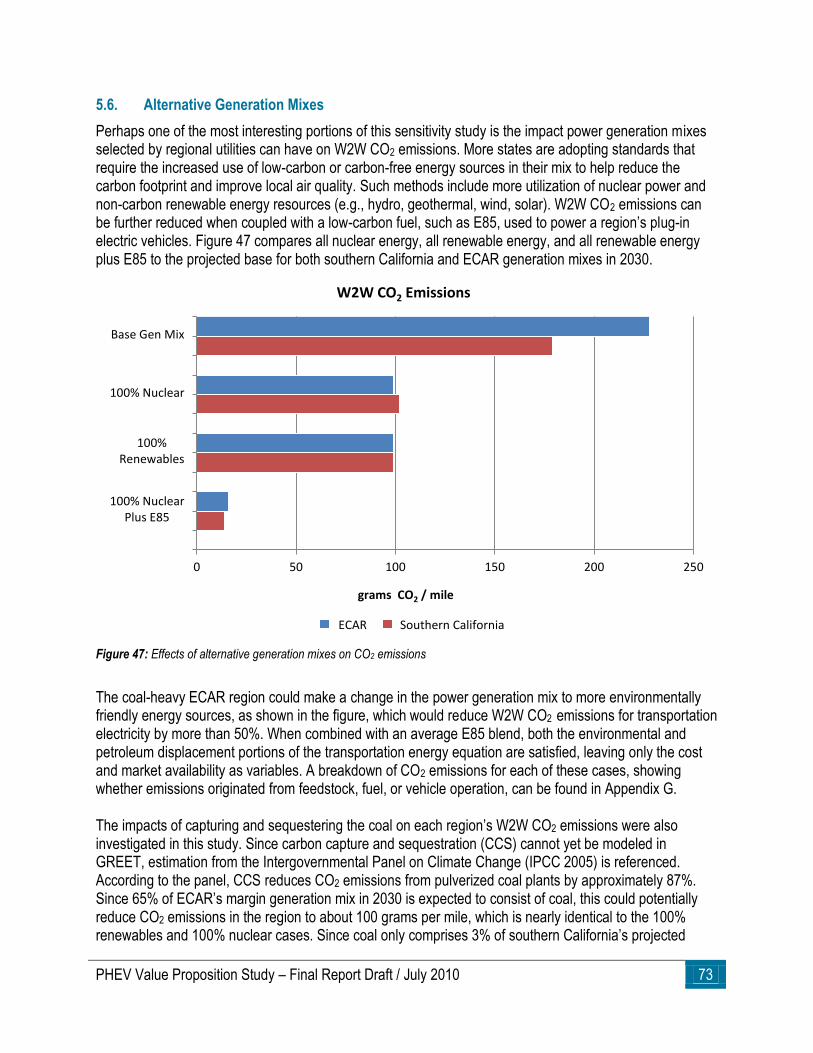
PHEV Value Proposition Study – Final Report Draft / July 2010 73
5.6. Alternative Generation Mixes
Perhaps one of the most interesting portions of this sensitivity study is the impact power generation mixes selected by regional utilities can have on W2W CO2 emissions. More states are adopting standards that require the increased use of low-carbon or carbon-free energy sources in their mix to help reduce the carbon footprint and improve local air quality. Such methods include more utilization of nuclear power and non-carbon renewable energy resources (e.g., hydro, geothermal, wind, solar). W2W CO2 emissions can be further reduced when coupled with a low-carbon fuel, such as E85, used to power a region’s plug-in electric vehicles. Figure 47 compares all nuclear energy, all renewable energy, and all renewable energy plus E85 to the projected base for both southern California and ECAR generation mixes in 2030.
Figure 47: Effects of alternative generation mixes on CO2 emissions
The coal-heavy ECAR region could make a change in the power generation mix to more environmentally friendly energy sources, as shown in the figure, which would reduce W2W CO2 emissions for transportation electricity by more than 50%. When combined with an average E85 blend, both the environmental and petroleum displacement portions of the transportation energy equation are satisfied, leaving only the cost and market availability as variables. A breakdown of CO2 emissions for each of these cases, showing whether emissions originated from feedstock, fuel, or vehicle operation, can be found in Appendix G. The impacts of capturing and sequestering the coal on each region’s W2W CO2 emissions were also investigated in this study. Since carbon capture and sequestration (CCS) cannot yet be modeled in GREET, estimation from the Intergovernmental Panel on Climate Change (IPCC 2005) is referenced. According to the panel, CCS reduces CO2 emissions from pulverized coal plants by approximately 87%. Since 65% of ECAR’s margin generation mix in 2030 is expected to consist of coal, this could potentially reduce CO2 emissions in the region to about 100 grams per mile, which is nearly identical to the 100% renewables and 100% nuclear cases. Since coal only comprises 3% of southern California’s projected
0 50 100 150 200 250
Base Gen Mix
100% Nuclear
100%Renewables
100% NuclearPlus E85
grams CO2 / mile
W2W CO2 Emissions
ECAR Southern California
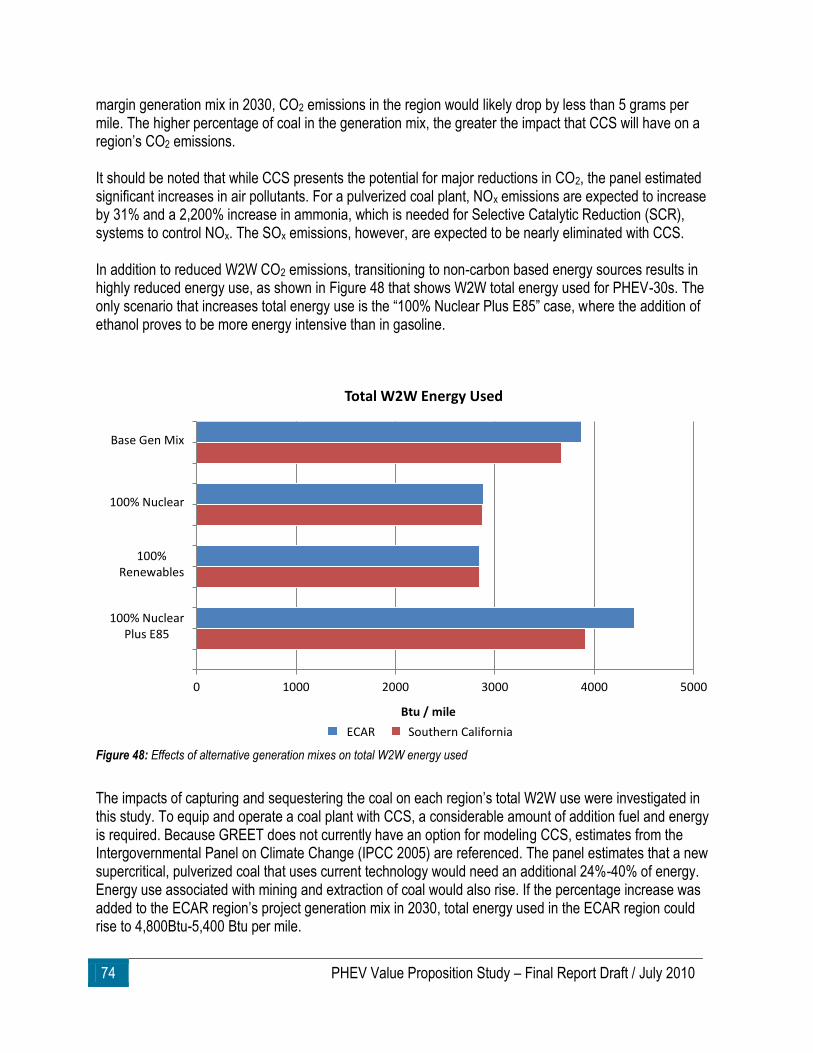
74 PHEV Value Proposition Study – Final Report Draft / July 2010
margin generation mix in 2030, CO2 emissions in the region would likely drop by less than 5 grams per mile. The higher percentage of coal in the generation mix, the greater the impact that CCS will have on a region’s CO2 emissions. It should be noted that while CCS presents the potential for major reductions in CO2, the panel estimated significant increases in air pollutants. For a pulverized coal plant, NOx emissions are expected to increase by 31% and a 2,200% increase in ammonia, which is needed for Selective Catalytic Reduction (SCR), systems to control NOx. The SOx emissions, however, are expected to be nearly eliminated with CCS. In addition to reduced W2W CO2 emissions, transitioning to non-carbon based energy sources results in highly reduced energy use, as shown in Figure 48 that shows W2W total energy used for PHEV-30s. The only scenario that increases total energy use is the ―100% Nuclear Plus E85‖ case, where the addition of ethanol proves to be more energy intensive than in gasoline.
Figure 48: Effects of alternative generation mixes on total W2W energy used
The impacts of capturing and sequestering the coal on each region’s total W2W use were investigated in this study. To equip and operate a coal plant with CCS, a considerable amount of addition fuel and energy is required. Because GREET does not currently have an option for modeling CCS, estimates from the Intergovernmental Panel on Climate Change (IPCC 2005) are referenced. The panel estimates that a new supercritical, pulverized coal that uses current technology would need an additional 24%-40% of energy. Energy use associated with mining and extraction of coal would also rise. If the percentage increase was added to the ECAR region’s project generation mix in 2030, total energy used in the ECAR region could rise to 4,800Btu-5,400 Btu per mile.
0 1000 2000 3000 4000 5000
Base Gen Mix
100% Nuclear
100%Renewables
100% NuclearPlus E85
Btu / mile
Total W2W Energy Used
ECAR Southern California
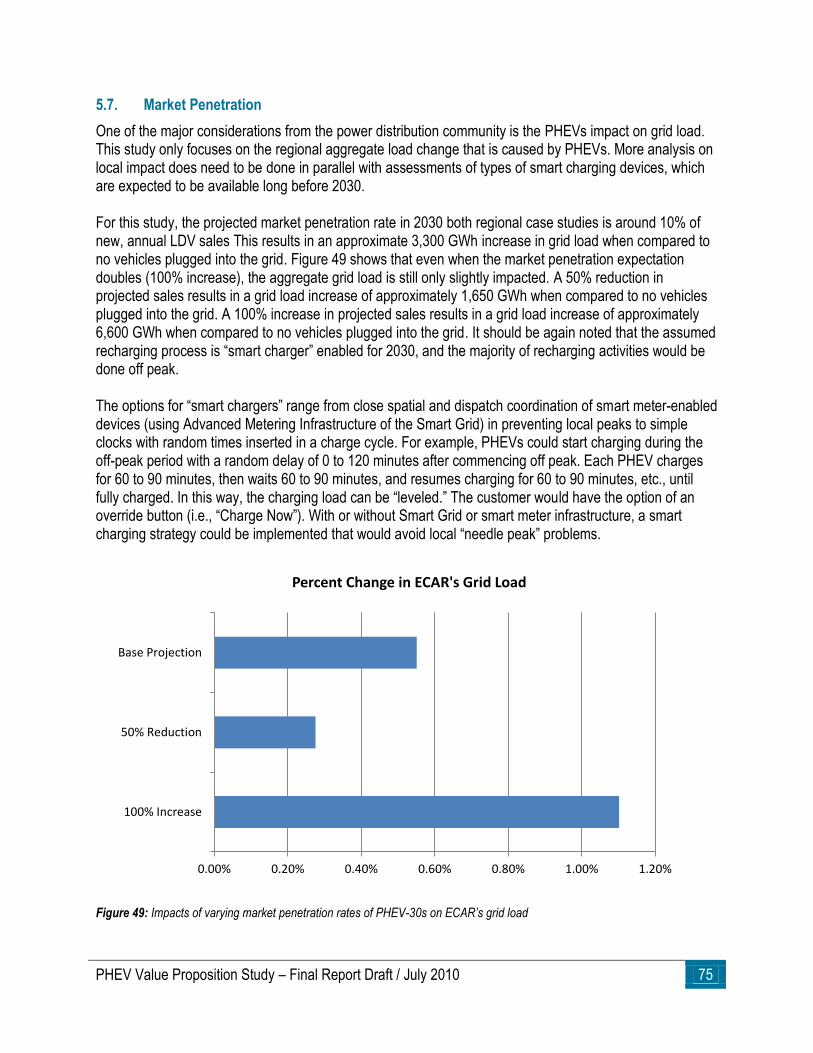
PHEV Value Proposition Study – Final Report Draft / July 2010 75
5.7. Market Penetration
One of the major considerations from the power distribution community is the PHEVs impact on grid load. This study only focuses on the regional aggregate load change that is caused by PHEVs. More analysis on local impact does need to be done in parallel with assessments of types of smart charging devices, which are expected to be available long before 2030. For this study, the projected market penetration rate in 2030 both regional case studies is around 10% of new, annual LDV sales This results in an approximate 3,300 GWh increase in grid load when compared to no vehicles plugged into the grid. Figure 49 shows that even when the market penetration expectation doubles (100% increase), the aggregate grid load is still only slightly impacted. A 50% reduction in projected sales results in a grid load increase of approximately 1,650 GWh when compared to no vehicles plugged into the grid. A 100% increase in projected sales results in a grid load increase of approximately 6,600 GWh when compared to no vehicles plugged into the grid. It should be again noted that the assumed recharging process is ―smart charger‖ enabled for 2030, and the majority of recharging activities would be done off peak. The options for ―smart chargers‖ range from close spatial and dispatch coordination of smart meter-enabled devices (using Advanced Metering Infrastructure of the Smart Grid) in preventing local peaks to simple clocks with random times inserted in a charge cycle. For example, PHEVs could start charging during the off-peak period with a random delay of 0 to 120 minutes after commencing off peak. Each PHEV charges for 60 to 90 minutes, then waits 60 to 90 minutes, and resumes charging for 60 to 90 minutes, etc., until fully charged. In this way, the charging load can be ―leveled.‖ The customer would have the option of an override button (i.e., ―Charge Now‖). With or without Smart Grid or smart meter infrastructure, a smart charging strategy could be implemented that would avoid local ―needle peak‖ problems.
Figure 49: Impacts of varying market penetration rates of PHEV-30s on ECAR’s grid load
0.00% 0.20% 0.40% 0.60% 0.80% 1.00% 1.20%
Base Projection
50% Reduction
100% Increase
Percent Change in ECAR's Grid Load
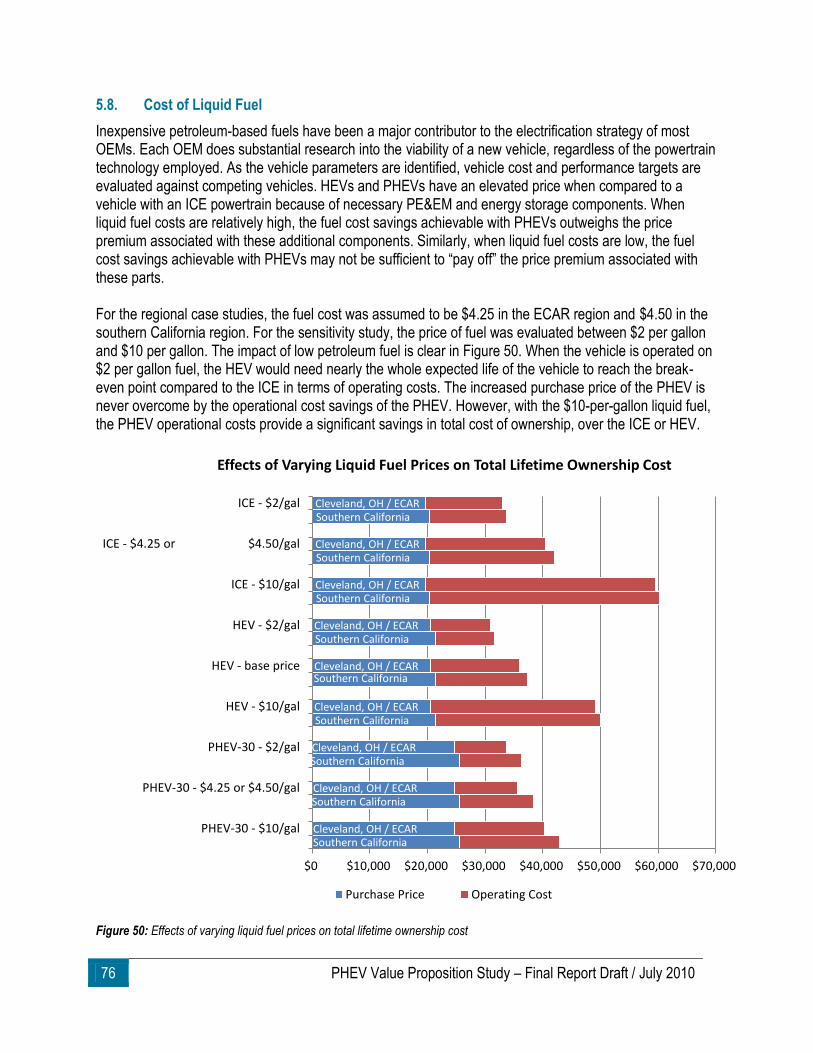
76 PHEV Value Proposition Study – Final Report Draft / July 2010
5.8. Cost of Liquid Fuel
Inexpensive petroleum-based fuels have been a major contributor to the electrification strategy of most OEMs. Each OEM does substantial research into the viability of a new vehicle, regardless of the powertrain technology employed. As the vehicle parameters are identified, vehicle cost and performance targets are evaluated against competing vehicles. HEVs and PHEVs have an elevated price when compared to a vehicle with an ICE powertrain because of necessary PE&EM and energy storage components. When liquid fuel costs are relatively high, the fuel cost savings achievable with PHEVs outweighs the price premium associated with these additional components. Similarly, when liquid fuel costs are low, the fuel cost savings achievable with PHEVs may not be sufficient to ―pay off‖ the price premium associated with these parts. For the regional case studies, the fuel cost was assumed to be $4.25 in the ECAR region and $4.50 in the southern California region. For the sensitivity study, the price of fuel was evaluated between $2 per gallon and $10 per gallon. The impact of low petroleum fuel is clear in Figure 50. When the vehicle is operated on $2 per gallon fuel, the HEV would need nearly the whole expected life of the vehicle to reach the break-even point compared to the ICE in terms of operating costs. The increased purchase price of the PHEV is never overcome by the operational cost savings of the PHEV. However, with the $10-per-gallon liquid fuel, the PHEV operational costs provide a significant savings in total cost of ownership, over the ICE or HEV.
Figure 50: Effects of varying liquid fuel prices on total lifetime ownership cost
Cleveland, OH / ECAR Southern California
Cleveland, OH / ECAR Southern California
Cleveland, OH / ECAR Southern California
Cleveland, OH / ECAR Southern California
Cleveland, OH / ECAR Southern California
Cleveland, OH / ECAR Southern California
Cleveland, OH / ECAR Southern California
Cleveland, OH / ECAR Southern California
Cleveland, OH / ECAR Southern California
$0 $10,000 $20,000 $30,000 $40,000 $50,000 $60,000 $70,000
ICE - $2/gal
ICE - $4.25 or $4.50/gal
ICE - $10/gal
HEV - $2/gal
HEV - base price
HEV - $10/gal
PHEV-30 - $2/gal
PHEV-30 - $4.25 or $4.50/gal
PHEV-30 - $10/gal
Effects of Varying Liquid Fuel Prices on Total Lifetime Ownership Cost
Purchase Price Operating Cost

PHEV Value Proposition Study – Final Report Draft / July 2010 77
5.9. Cost of Electricity
The cost of electricity has no impact on the operation of either the ICE or the HEV since their operations are fully dependent on liquid fuel. In Figure 51, it can be seen that from a cost of ownership perspective, it would take a 50% increase in the cost of electricity, with petroleum prices holding steady, for the total ownership cost of the PHEV-30 to exceed the ICE’s cost of ownership in the southern California region. For the ECAR region, the cost of electricity would have to nearly double for the PHEV-30 to exceed the total ownership cost of the ICE. While it is anticipated that the grid of the future will take time-of-use rates or other time-differentiated electricity tariffs (e.g., real-time pricing) into account, the tariffs would not markedly affect PHEV charging patterns, since most PHEVs are already charged off peak and those charging on peak will be unlikely to change their behavior significantly. For example, drivers may be required to charge on peak because of long commutes and take advantage of V2B-based incentives. Or they may charge on peak habitually because of range anxiety. If time-of-use pricing is established in the region, drivers will have to pay a higher electricity rate during on peak charging, which affects the vehicle operating cost. However, the range of electricity prices in the sensitivity analysis runs more than covers the range in electricity operating costs to be expected from advanced tariffs. No additional sensitivity runs were done to address specific tariff structures.
Figure 51: Effects of varying electricity costs on lifetime ownership cost
Cleveland, OH / ECAR
Southern California
Cleveland, OH / ECAR
Southern California
Cleveland, OH / ECAR
Southern California
Cleveland, OH / ECAR
Southern California
Cleveland, OH / ECAR
Southern California
$0 $10,000 $20,000 $30,000 $40,000 $50,000
ICE
HEV
PHEV-30 -Base price
PHEV-30 -50% reduction
PHEV-30 -50% increase
Effects of Varying Electricity Cost on Total Lifetime Ownership Cost
Purchase Price Operating Cost
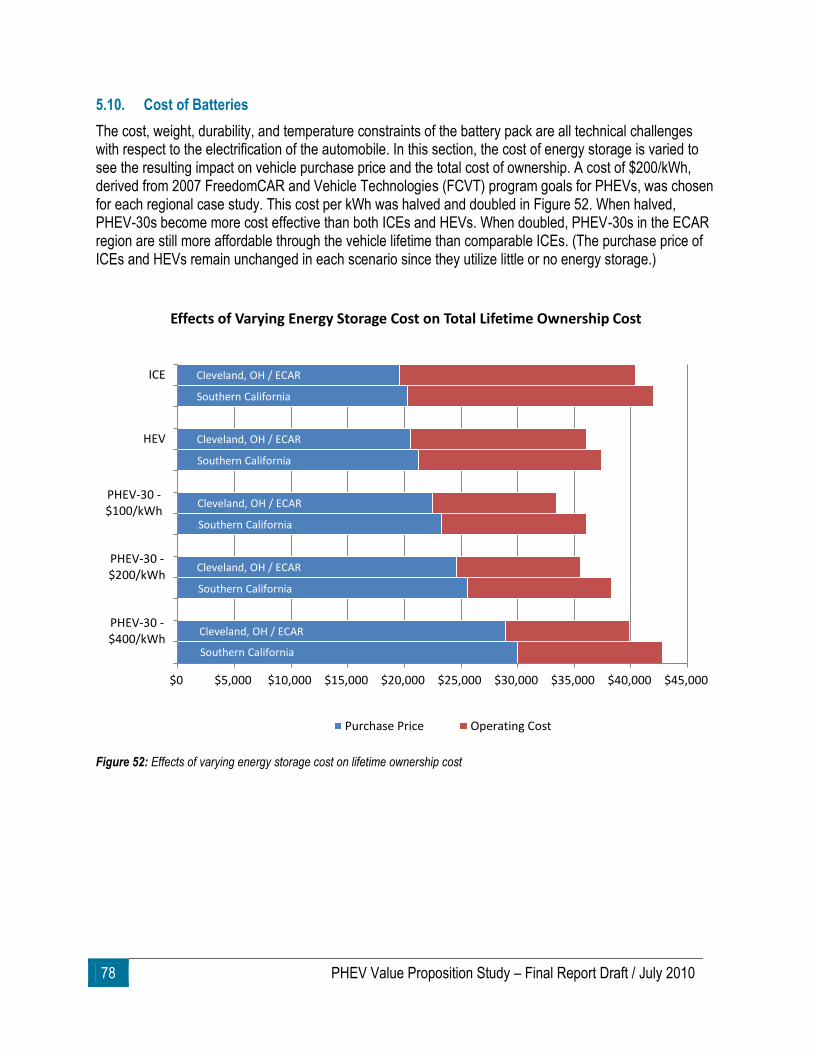
78 PHEV Value Proposition Study – Final Report Draft / July 2010
5.10. Cost of Batteries
The cost, weight, durability, and temperature constraints of the battery pack are all technical challenges with respect to the electrification of the automobile. In this section, the cost of energy storage is varied to see the resulting impact on vehicle purchase price and the total cost of ownership. A cost of $200/kWh, derived from 2007 FreedomCAR and Vehicle Technologies (FCVT) program goals for PHEVs, was chosen for each regional case study. This cost per kWh was halved and doubled in Figure 52. When halved, PHEV-30s become more cost effective than both ICEs and HEVs. When doubled, PHEV-30s in the ECAR region are still more affordable through the vehicle lifetime than comparable ICEs. (The purchase price of ICEs and HEVs remain unchanged in each scenario since they utilize little or no energy storage.)
Figure 52: Effects of varying energy storage cost on lifetime ownership cost
Cleveland, OH / ECAR
Southern California
Cleveland, OH / ECAR
Southern California
Cleveland, OH / ECAR
Southern California
Cleveland, OH / ECAR
Southern California
Cleveland, OH / ECAR
Southern California
$0 $5,000 $10,000 $15,000 $20,000 $25,000 $30,000 $35,000 $40,000 $45,000
ICE
HEV
PHEV-30 -$100/kWh
PHEV-30 -$200/kWh
PHEV-30 -$400/kWh
Effects of Varying Energy Storage Cost on Total Lifetime Ownership Cost
Purchase Price Operating Cost
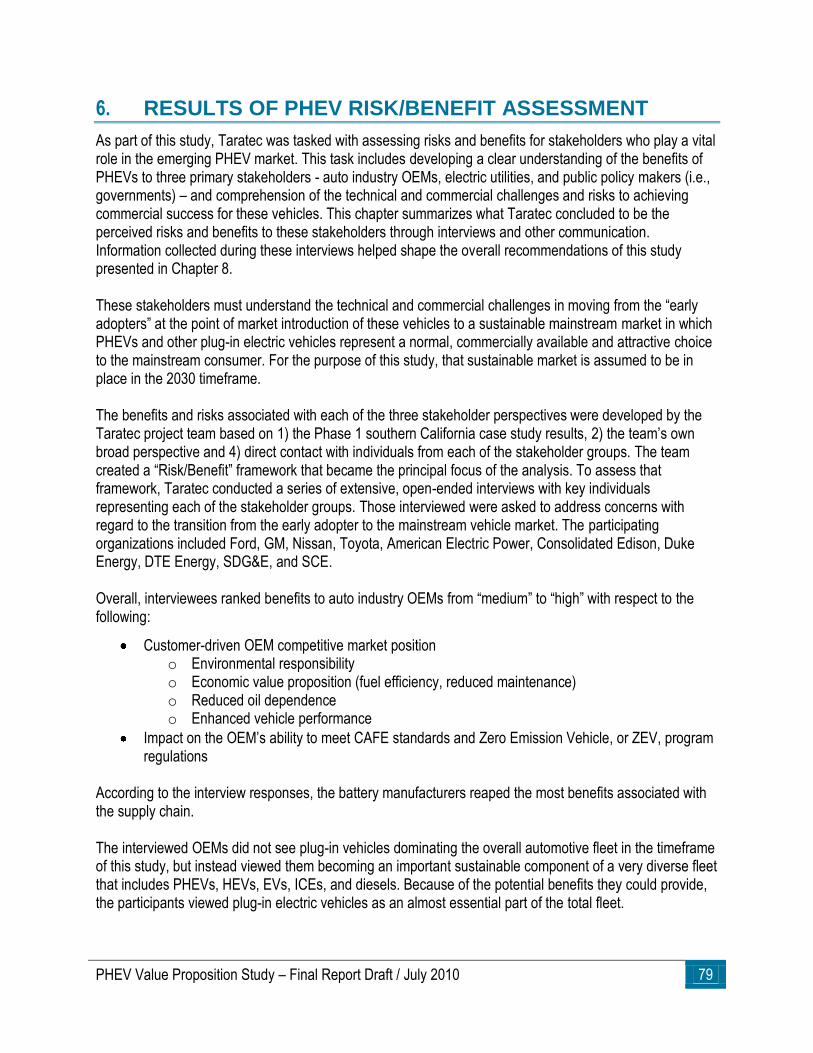
PHEV Value Proposition Study – Final Report Draft / July 2010 79
6. RESULTS OF PHEV RISK/BENEFIT ASSESSMENT
As part of this study, Taratec was tasked with assessing risks and benefits for stakeholders who play a vital role in the emerging PHEV market. This task includes developing a clear understanding of the benefits of PHEVs to three primary stakeholders - auto industry OEMs, electric utilities, and public policy makers (i.e., governments) – and comprehension of the technical and commercial challenges and risks to achieving commercial success for these vehicles. This chapter summarizes what Taratec concluded to be the perceived risks and benefits to these stakeholders through interviews and other communication. Information collected during these interviews helped shape the overall recommendations of this study presented in Chapter 8. These stakeholders must understand the technical and commercial challenges in moving from the ―early adopters‖ at the point of market introduction of these vehicles to a sustainable mainstream market in which PHEVs and other plug-in electric vehicles represent a normal, commercially available and attractive choice to the mainstream consumer. For the purpose of this study, that sustainable market is assumed to be in place in the 2030 timeframe. The benefits and risks associated with each of the three stakeholder perspectives were developed by the Taratec project team based on 1) the Phase 1 southern California case study results, 2) the team’s own broad perspective and 4) direct contact with individuals from each of the stakeholder groups. The team created a ―Risk/Benefit‖ framework that became the principal focus of the analysis. To assess that framework, Taratec conducted a series of extensive, open-ended interviews with key individuals representing each of the stakeholder groups. Those interviewed were asked to address concerns with regard to the transition from the early adopter to the mainstream vehicle market. The participating organizations included Ford, GM, Nissan, Toyota, American Electric Power, Consolidated Edison, Duke Energy, DTE Energy, SDG&E, and SCE. Overall, interviewees ranked benefits to auto industry OEMs from ―medium‖ to ―high‖ with respect to the following:
Customer-driven OEM competitive market position o Environmental responsibility o Economic value proposition (fuel efficiency, reduced maintenance) o Reduced oil dependence o Enhanced vehicle performance
Impact on the OEM’s ability to meet CAFE standards and Zero Emission Vehicle, or ZEV, program regulations
According to the interview responses, the battery manufacturers reaped the most benefits associated with the supply chain. The interviewed OEMs did not see plug-in vehicles dominating the overall automotive fleet in the timeframe of this study, but instead viewed them becoming an important sustainable component of a very diverse fleet that includes PHEVs, HEVs, EVs, ICEs, and diesels. Because of the potential benefits they could provide, the participants viewed plug-in electric vehicles as an almost essential part of the total fleet.
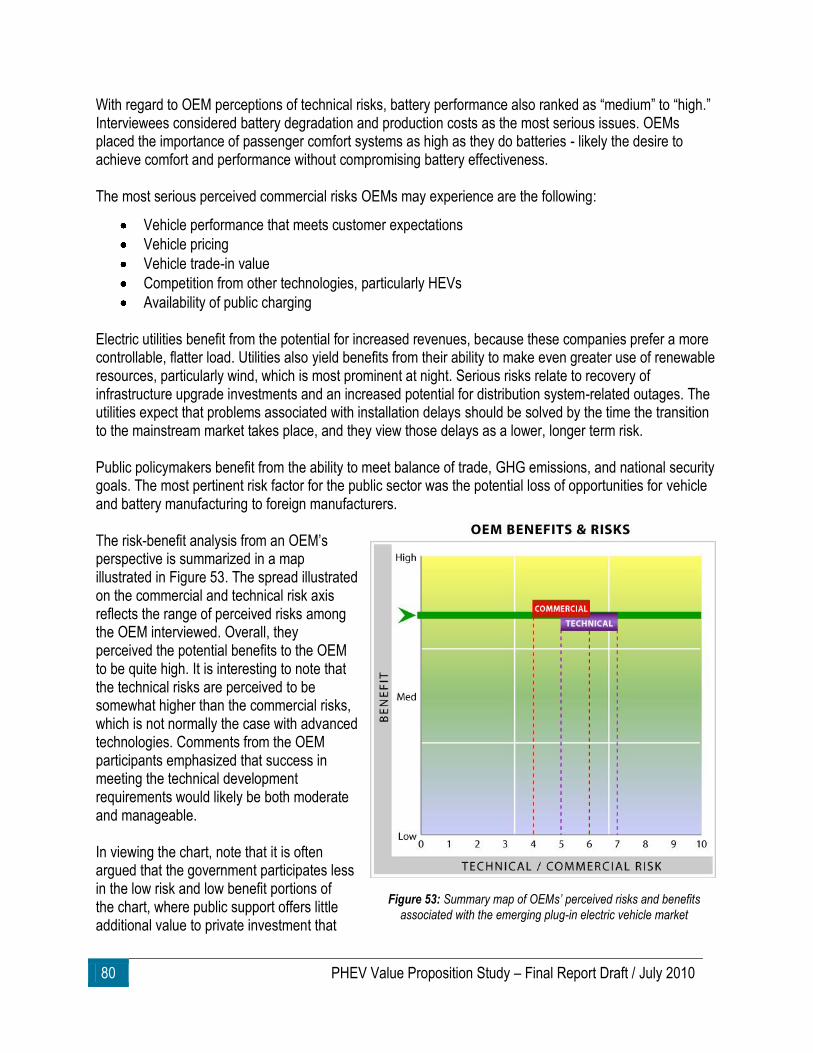
80 PHEV Value Proposition Study – Final Report Draft / July 2010
With regard to OEM perceptions of technical risks, battery performance also ranked as ―medium‖ to ―high.‖ Interviewees considered battery degradation and production costs as the most serious issues. OEMs placed the importance of passenger comfort systems as high as they do batteries - likely the desire to achieve comfort and performance without compromising battery effectiveness. The most serious perceived commercial risks OEMs may experience are the following:
Vehicle performance that meets customer expectations
Vehicle pricing
Vehicle trade-in value
Competition from other technologies, particularly HEVs
Availability of public charging Electric utilities benefit from the potential for increased revenues, because these companies prefer a more controllable, flatter load. Utilities also yield benefits from their ability to make even greater use of renewable resources, particularly wind, which is most prominent at night. Serious risks relate to recovery of infrastructure upgrade investments and an increased potential for distribution system-related outages. The utilities expect that problems associated with installation delays should be solved by the time the transition to the mainstream market takes place, and they view those delays as a lower, longer term risk. Public policymakers benefit from the ability to meet balance of trade, GHG emissions, and national security goals. The most pertinent risk factor for the public sector was the potential loss of opportunities for vehicle and battery manufacturing to foreign manufacturers. The risk-benefit analysis from an OEM’s perspective is summarized in a map illustrated in Figure 53. The spread illustrated on the commercial and technical risk axis reflects the range of perceived risks among the OEM interviewed. Overall, they perceived the potential benefits to the OEM to be quite high. It is interesting to note that the technical risks are perceived to be somewhat higher than the commercial risks, which is not normally the case with advanced technologies. Comments from the OEM participants emphasized that success in meeting the technical development requirements would likely be both moderate and manageable.
In viewing the chart, note that it is often argued that the government participates less in the low risk and low benefit portions of the chart, where public support offers little additional value to private investment that
Figure 53: Summary map of OEMs’ perceived risks and benefits
associated with the emerging plug-in electric vehicle market

PHEV Value Proposition Study – Final Report Draft / July 2010 81
would normally be forthcoming and result in incremental improvements. The high risk and high benefit portion of the chart in the upper-right corner is where it is generally argued that government investment (e.g., supportive policies and/or incentives) is particularly valuable to market development, and where private industry is inherently more difficult to sustain. In many ways, the plug-in electric vehicle risk-benefit profile shown in the Figure 53 is generally regarded as the ―sweet-spot‖ for government and industry technology collaboration. Taratec’s entire risk/benefit assessment can be found in the full report entitled ―Benefits and Challenges of Achieving a Mainstream Market for Electric Vehicles‖ (Ungar 2010).
82 PHEV Value Proposition Study – Final Report Draft / July 2010
7. CONCLUSIONS
Based on this study’s thorough assessment of PHEV value propositions, the project team concludes that PHEVs and other plug-in vehicles may offer many valuable attributes to individual consumers, business owners, utilities, and society as a whole. Consumers can be assured that the savings that they would accrue in the lifetime of their PHEV will likely be sufficient to offset the initial price premium relative to more conventional vehicles in the 2030 timeframe. Business owners will likely be able to draw energy from grid-connected PHEVs to help shave the building’s peak loads. As smart grid technology matures, utilities may be able to better maximize the use of off-peak energy and better manage loads throughout their most demanding seasons. However, smart grid technology is not a prerequisite for realizing the benefits of PHEVs. Finally, PHEVs will certainly promote national security by displacing large volumes of imported oil and support a secure economy through the expansion of domestic vehicle and component manufacturing. Aside from their promising attributes, PHEVs and other plug-in vehicles still face several barriers to commercial acceptance between now and 2030. First, the cost of energy storage, charging equipment, and PE&EM components must continue to descend to competitive levels, such as the ones assumed for the year 2030 in this study, within the next one to two decades. Second, as this study’s GREET modeling results indicate, PHEVs should not be expected to significantly reduce carbon emissions relative to comparable vehicles until they are powered by non-carbon energy sources. Operating in regions with a high percentage of non- or low-carbon energy sources (e.g., renewable, nuclear, natural gas) would ultimately help improve the long-term environmental impact of PHEVs. 7.1. Will PHEVs be Cost-Competitive by 2030?
From a cost standpoint, a PHEV would be considered commercially viable if its reduced operating costs match or outweigh its purchase price premium over a comparable ICE or HEV. The easiest method for PHEV owners to reduce their operating costs is to replace large volumes of liquid fuel with less expensive electricity. Case study results show that liquid fuel and electricity costs for a PHEV-30 are projected to be approximately $0.065 per mile. This is half the projected fuel cost for a comparable ICE at $0.13 per mile and less than three-fourths of the projected fuel cost for a comparable HEV at $0.09 per mile. An anticipated credit of approximately $500 (NPV) for recycling an end-of-life Li-ion battery pack also increases the PHEV’s competitive edge. These savings add to a variety of ―convenience‖ benefits, such as emergency back-up power and fewer trips to the gas station. Figure 54 summarizes the total ownership cost over 150,000 miles for each vehicle type in their respective geographic regions. In both regions, PHEV-30s are more cost effective through the vehicle lifetime by several thousands of dollars compared to ICEs, which translates to an 8%-10% reduction in overall net ownership cost of 10 years. Primarily because of California’s high electricity costs and state sales tax, PHEV-30s are more expensive to own than HEVs in this region, yet they certainly appear to be cost competitive. In the ECAR region, lower electricity costs and state sales taxes result in the PHEV-30s being the most cost-effective vehicles. As demonstrated in Chapter 5’s Sensitivity Analysis Results, several monetary factors can greatly (or mildly) influence the lifetime cost of these vehicles. Lifetime cost is most sensitive to fluctuating liquid fuel prices, since they typically account for the greatest percentage of a vehicle’s operating cost and historically are prone to large and frequent fluctuations. Electricity costs play a large role in a PHEV’s lifetime ownership costs but are historically more stable than fuel prices and are less prone to fluctuation in most
PHEV Value Proposition Study – Final Report Draft / July 2010 83
regions. Carbon taxes would account for a small percentage of a vehicle’s operating costs, so ebbs and flows in those rates typically do not have a strong impact. Finally, the projected cost of PHEV components (e.g., energy storage) accounts for a significant portion of the purchase price, so shortfalls in long-term cost goals may result in less financially appealing PHEVs – especially in those with high AERs and larger battery packs.
ICE
HEV
PHEV-30
Total Lifetime Vehicle Ownership Southern California
$0 $10,000 $20,000 $30,000 $40,000 $50,000
ICE
HEV
PHEV-30
Cleveland, Ohio / ECAR
Purchase Price Operating Cost
Figure 54: Summary of total cost of ownership for each vehicle type, once present value of money is applied.
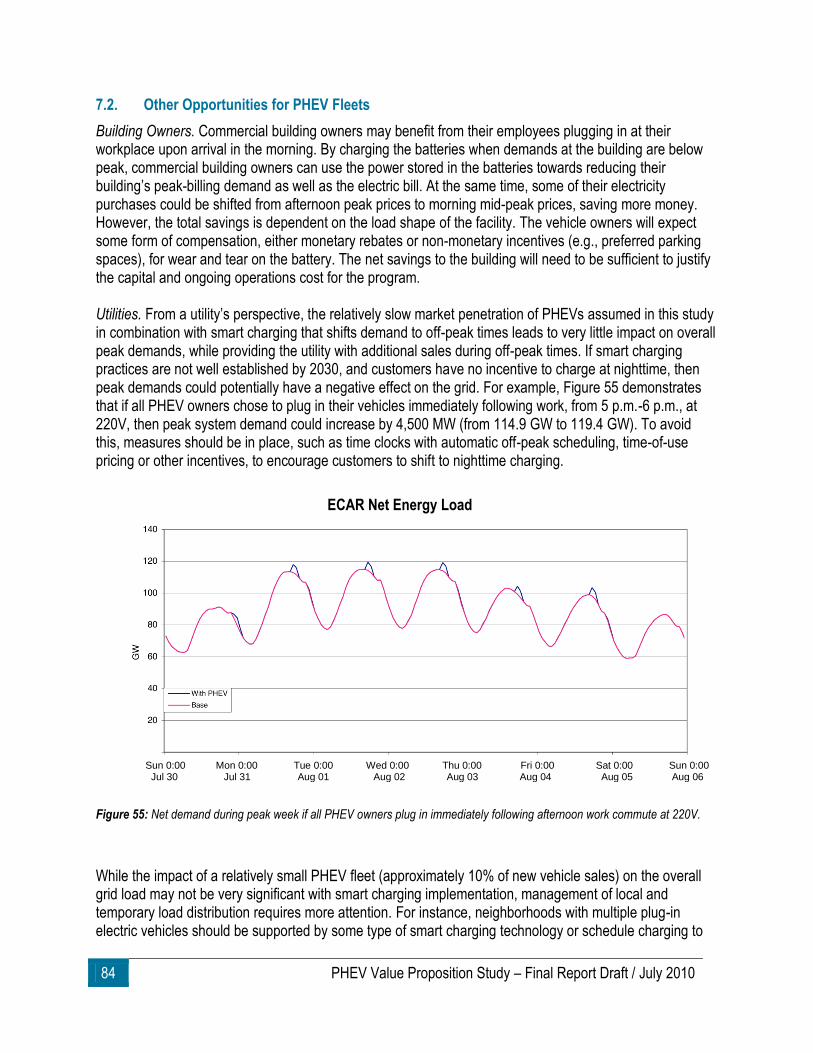
84 PHEV Value Proposition Study – Final Report Draft / July 2010
7.2. Other Opportunities for PHEV Fleets
Building Owners. Commercial building owners may benefit from their employees plugging in at their workplace upon arrival in the morning. By charging the batteries when demands at the building are below peak, commercial building owners can use the power stored in the batteries towards reducing their building’s peak-billing demand as well as the electric bill. At the same time, some of their electricity purchases could be shifted from afternoon peak prices to morning mid-peak prices, saving more money. However, the total savings is dependent on the load shape of the facility. The vehicle owners will expect some form of compensation, either monetary rebates or non-monetary incentives (e.g., preferred parking spaces), for wear and tear on the battery. The net savings to the building will need to be sufficient to justify the capital and ongoing operations cost for the program. Utilities. From a utility’s perspective, the relatively slow market penetration of PHEVs assumed in this study in combination with smart charging that shifts demand to off-peak times leads to very little impact on overall peak demands, while providing the utility with additional sales during off-peak times. If smart charging practices are not well established by 2030, and customers have no incentive to charge at nighttime, then peak demands could potentially have a negative effect on the grid. For example, Figure 55 demonstrates that if all PHEV owners chose to plug in their vehicles immediately following work, from 5 p.m.-6 p.m., at 220V, then peak system demand could increase by 4,500 MW (from 114.9 GW to 119.4 GW). To avoid this, measures should be in place, such as time clocks with automatic off-peak scheduling, time-of-use pricing or other incentives, to encourage customers to shift to nighttime charging.
Figure 55: Net demand during peak week if all PHEV owners plug in immediately following afternoon work commute at 220V.
While the impact of a relatively small PHEV fleet (approximately 10% of new vehicle sales) on the overall grid load may not be very significant with smart charging implementation, management of local and temporary load distribution requires more attention. For instance, neighborhoods with multiple plug-in electric vehicles should be supported by some type of smart charging technology or schedule charging to
ECAR Net Energy Load
Sun 0:00 Mon 0:00 Tue 0:00 Wed 0:00 Thu 0:00 Fri 0:00 Sat 0:00 Sun 0:00 Jul 30 Jul 31 Aug 01 Aug 02 Aug 03 Aug 04 Aug 05 Aug 06
PHEV Value Proposition Study – Final Report Draft / July 2010 85
avoid unnecessary damage to individual transformers. This is an area of research that should be considered for further study. Society. In addition to monetary benefits, PHEVs are able to dramatically decrease dependence on foreign oil by substituting most liquid fuel with electricity. Case study results show that, on average, a single PHEV-30 will consume approximately 75% less gasoline than ICEs (~235 fewer gallons annually) and 65% less gasoline than HEVs (~140 fewer gallons annually). With 60% of oil imported from foreign lands, the southern California fleet of 1 million PHEVs has the potential to reduce imported oil by approximately 7.25 million barrels (140 million gallons) annually if the PHEV fleet substituted for ICEs or by approximately 4.25 million barrels (80 million gallons) annually if the PHEV fleet substituted for HEVs. A similar volume of annually displaced oil imports is also projected within the ECAR region since just more than 1 million PHEVs are expected to be on the road in 2030. As demonstrated in the southern California case study, PHEVs have the potential to significantly reduce W2W GHG emissions compared to ICEs, since the electricity is generated from a relatively clean mix. This is not always the case, as seen in the coal-dominated ECAR region. To see improvements in GHG emissions, more non-carbon sources should be transitioned into the base and margin mixes. In addition to regional generation mixes, this study’s sensitivity analysis suggested that increased use of E85 can significantly contribute to reduced W2W emissions as well as oil displacement. Vehicle lightweighting, reduction in VMT, and certain carbon taxes can also contribute to the reduction of GHG emissions and oil displacement, albeit to a lesser extent.
86 PHEV Value Proposition Study – Final Report Draft / July 2010
8. RECOMMENDATIONS
Both industry and government agencies could take a number of actions and make investments to significantly help PHEVs achieve sustainable commercial success. The project team offers recommendations for actions they considered to be particularly important. Reflections on the results of this study include the PHEV MIS that was completed in conjunction with the VPS. These are actions that can be taken or influenced by the DOE. In developing these recommendations, both near-term PHEV introduction and longer term goals were considered that would result in one million PHEVs on the road in the U.S. at the end of 2015, and a sustainable, stable and growing market for PHEVs without a need for subsidies or other incentives by 2030. As it considers the team’s recommendations, DOE should coordinate its activities with other federal agencies having a stake and interest in PHEVs. Of particular importance are the U.S. Environmental Protection Agency, the Department of Transportation, the National Institute of Standards and Technology (NIST), and the Federal Energy Regulatory Commission. Partnerships with organizations representing vehicle manufacturers, major vehicle component providers, and the electric power industry, who enhance the quality and transparency of communications, can be a key factor in improving the productivity of PHEV investments by both government and industry.
8.1. Technology Advancement
Advanced Battery R&D: Battery technology, including cost of production, is generally considered to be the most significant impediment to large scale commercialization of PHEVs. To help assure availability of PHEV batteries that meet the required levels of durability, quality and safety at an affordable cost, continued federal R&D support for battery development is required. R&D targets, which should be periodically reviewed, have been established by the DOE. Further support for this work should be performed by domestic battery manufacturers, national laboratories, and university and industry researchers.
Manufacturing Processes and Capabilities: To help achieve PHEV cost reduction, efficient high-volume manufacturing processes are needed for batteries, other components and materials, and vehicle assembly. Encouraging U.S. leadership in PHEV manufacturing technologies, and investment in U.S. plants using those technologies, are key goals. The DOE, working with the vehicle production and supplier industries, should support R&D of PHEV product design, new materials, and manufacturing processes.
Electricity Distribution System Improvements: If concentrations of consumers that own PHEVs use 220V charging systems would plan to charge during peak demand periods regularly, local electricity distribution systems may not be prepared to support the extra loads. Electricity infrastructure for multiple houses served by a single transformer and apartment buildings with insufficient service capacity will need to be upgraded to handle increased loads. Advances in information technology will also be required to meet challenges associated with controlling vehicle charging. DOE, working with the electric utility industry, should support continued development of technologies related to electricity delivery, monitoring, charging systems, and pricing. Continued effort is needed on initiatives, including smart grid, which will help realize the potential benefits to PHEV owners, such as management of distributed resources and loads,
PHEV Value Proposition Study – Final Report Draft / July 2010 87
feeder monitoring, time-of-day pricing, separate rate structures, and alternative billing options, as well as benefits for electricity providers like optimal dispatching schemes.
R&D of Vehicle Technologies Other Than Batteries: Power electronics, electrical machine, and energy-efficient powertrain technologies are key factors in competitive, high-performance electric drive vehicles. Continued government funding support for R&D in these areas exists, and the rate of technology advancement in this area appears to be adequate.
Battery Recycling and Secondary Market Development: Developing processes and markets for battery recycling and for secondary use of batteries no longer suitable for use in PHEVs both reduce the effective cost of batteries and maximizes availability of lithium, which is a non-domestically produced material critical for a large PHEV fleet. DOE should support electric utility infrastructure and research, such as integration of distributed energy resources or Smart Grid technologies that can effectively utilize small, stationary energy storage devices. EPA or other agencies could establish a battery recycling program that would re-use scarce lithium and keep battery material out of the environment, as the core charges now do for lead acid batteries.
DOE should continue to seek objective, unbiased input from industry regarding its plans for support of technology R&D, as well as its plans for investments of public funds for other PHEV-related purposes. Ideally, the entire industry supplying vehicles and components for sale in the U.S. and the entities providing electricity for vehicles should have mechanisms for providing their views and perspectives.
8.2. Government Incentive Policies
Unless petroleum prices increase significantly and permanently, vehicle OEMs, component suppliers, and lenders are expected to be hesitant about making the large investments required to produce vehicles using less petroleum. Concern about continued government policy support, for both vehicle producers and consumers, will also contribute to private investor hesitancy. In the coming decade, industry PHEV production and consumer demand for electric drive and other vehicles using significantly less petroleum will be strongly influenced by government policies. Government incentives currently available for production and acquisition of PHEVs are summarized in Chapter 2. The MIS included analyses of selected policies to accelerate the introduction of PHEVs. In that report, tax and/or other policies intended to significantly raise the price of gasoline and diesel fuel for vehicles are not included among the recommendations. The MIS analysis indicated that a major increase in federal gasoline taxes would impose an excessive burden to those consumers who can least afford the purchase of a PHEV and would result in a relatively small increase in PHEV sales. However, sensitivity analyses in this study indicate that increased ICE operating costs, if gasoline were $5 per gallon or more, would make PHEVs a much more attractive option from a total life-cycle cost vantage point. Variations in ICE fuel price assumptions result in much greater differences in PHEV operating costs as opposed to the variations in electricity price assumptions. In addition to this Value Proposition Study, organizations such as the Electrification Coalition (Electrification 2009) that have an interest in promoting electric drive vehicles are publishing policy recommendations. Multiple PHEV analyses and studies have recently been completed or are ongoing.
88 PHEV Value Proposition Study – Final Report Draft / July 2010
Before undertaking new government-funded analyses that investigate the energy and environmental impacts of PHEVs, DOE should review and compare all PHEV analytical initiatives, both government and privately funded. Objectives of such a review should be: 1) an explanation of differences in results, 2) a comparison of the public costs and benefits associated with the recommendations resulting from various analyses, and 3) examinations of key assumptions that drive each study’s conclusions and recommendations. With appropriations for technology demonstration and deployment, including those for support of Clean Cities initiatives, DOE should competitively solicit and fund demonstration projects that result in substantial PHEV acquisition, leading-edge electric infrastructure development, creative approaches to PHEV life-cycle cost reduction, and significant reduction of emissions, including GHGs. Particular consideration should be given to projects that: 1) are highly leveraged through participation and cost share from both vehicle and electricity providers, 2) include fleet use of PHEVs, 3) provide for extensive documentation and evaluation of performance, 4) improve vehicle use and drive cycle data, and 5) use electricity that is generated with zero or very low carbon emissions.
8.2.1. Incentives for Vehicle Manufacturers
Federal government regulations require improved vehicle fuel economy. Final requirements for increased Corporate Average Fuel Economy for model years 2012 through 2016 were released on April 1, 2010. To help offset the major costs of successfully designing and producing vehicles that use substantially less petroleum, including PHEVs, supportive government policies are desirable. Such policies should be restricted to investments in U.S. facilities. Another round of government-funded manufacturing incentives, similar to the ARRA manufacturing grants, should be provided. Potential incentives include manufacturing grants, loans, and tax credits. The specific design of another incentive package should reflect the results of a critical review of current incentives. Consideration and analysis should be devoted to a manufacturing incentive package that rewards proposals for investments in projects designed to achieve goals such as petroleum and emissions reduction. This would be viewed separately from policies that reward investments in specific vehicle types and alternative fuels. A key result of the project team’s 2007 workshop, as well as input from the Guidance & Evaluation Committee, was an admonition to the federal government, ―don’t pick the winners, just reward results.‖ Allow the market to decide, but provide incentives to encourage those whose technologies demonstrate achievement of energy, emissions, and energy security goals. The sources of funds for these manufacturing incentives and the other incentives mentioned in this chapter will likely be a topic of debate. As indicated in the MIS, significant resources could be generated through a small increase, even a penny or two, in the vehicle gasoline tax. 8.2.2. Incentives for Electric Utilities
Electric Infrastructure Support: A large percentage of consumers do not have access to personal garages or carports for charging electric drive vehicles. During the first few years after commercial introduction of PHEVs, this is not expected to be an important issue. Even during that period, early adopters will be more inclined to purchase PHEVs if battery recharging capability exists at work sites and other public locations, such as parking garages and shopping centers. On a competitive basis, funding for demonstrations at public charging installations
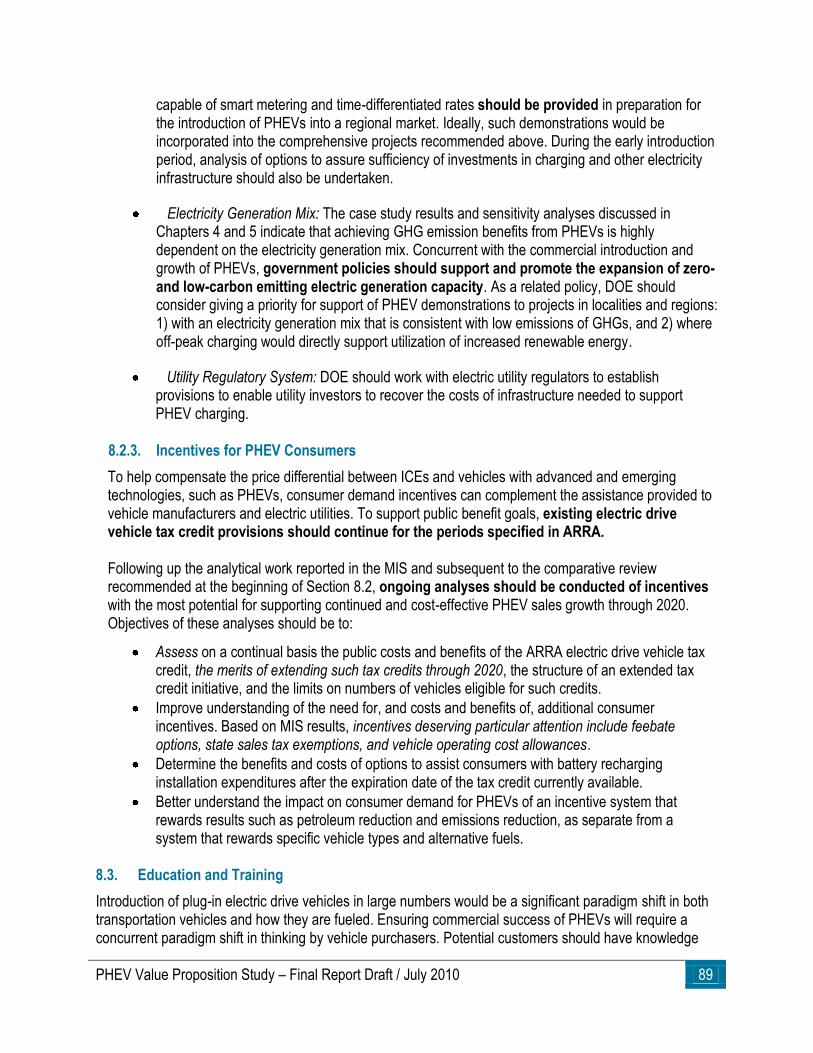
PHEV Value Proposition Study – Final Report Draft / July 2010 89
capable of smart metering and time-differentiated rates should be provided in preparation for the introduction of PHEVs into a regional market. Ideally, such demonstrations would be incorporated into the comprehensive projects recommended above. During the early introduction period, analysis of options to assure sufficiency of investments in charging and other electricity infrastructure should also be undertaken.
Electricity Generation Mix: The case study results and sensitivity analyses discussed in Chapters 4 and 5 indicate that achieving GHG emission benefits from PHEVs is highly dependent on the electricity generation mix. Concurrent with the commercial introduction and growth of PHEVs, government policies should support and promote the expansion of zero- and low-carbon emitting electric generation capacity. As a related policy, DOE should consider giving a priority for support of PHEV demonstrations to projects in localities and regions: 1) with an electricity generation mix that is consistent with low emissions of GHGs, and 2) where off-peak charging would directly support utilization of increased renewable energy.
Utility Regulatory System: DOE should work with electric utility regulators to establish provisions to enable utility investors to recover the costs of infrastructure needed to support PHEV charging.
8.2.3. Incentives for PHEV Consumers
To help compensate the price differential between ICEs and vehicles with advanced and emerging technologies, such as PHEVs, consumer demand incentives can complement the assistance provided to vehicle manufacturers and electric utilities. To support public benefit goals, existing electric drive vehicle tax credit provisions should continue for the periods specified in ARRA. Following up the analytical work reported in the MIS and subsequent to the comparative review recommended at the beginning of Section 8.2, ongoing analyses should be conducted of incentives with the most potential for supporting continued and cost-effective PHEV sales growth through 2020. Objectives of these analyses should be to:
Assess on a continual basis the public costs and benefits of the ARRA electric drive vehicle tax credit, the merits of extending such tax credits through 2020, the structure of an extended tax credit initiative, and the limits on numbers of vehicles eligible for such credits.
Improve understanding of the need for, and costs and benefits of, additional consumer incentives. Based on MIS results, incentives deserving particular attention include feebate options, state sales tax exemptions, and vehicle operating cost allowances.
Determine the benefits and costs of options to assist consumers with battery recharging installation expenditures after the expiration date of the tax credit currently available.
Better understand the impact on consumer demand for PHEVs of an incentive system that rewards results such as petroleum reduction and emissions reduction, as separate from a system that rewards specific vehicle types and alternative fuels.
8.3. Education and Training
Introduction of plug-in electric drive vehicles in large numbers would be a significant paradigm shift in both transportation vehicles and how they are fueled. Ensuring commercial success of PHEVs will require a concurrent paradigm shift in thinking by vehicle purchasers. Potential customers should have knowledge
90 PHEV Value Proposition Study – Final Report Draft / July 2010
and objective information about the benefits and costs of PHEVs relative to other vehicle options. A positive consumer experience with PHEVs is also dependent on a workforce that is well qualified to design, produce, improve, and maintain not only the vehicles, but also the electric infrastructure for recharging.
8.3.1. Consumer Education
Educated and knowledgeable consumers are required if the values and benefits documented in this report are to be realized. On a competitive basis, government-funded support for consumer education projects should be continued in preparation for the introduction of PHEVs into regional markets. Potential owners should be well aware of the factors that determine whether a PHEV is a wise investment for their particular situation. They should also be knowledgeable about the public benefits and costs of advanced technology transportation options. PHEV owners should understand how to optimally charge their vehicles. Consumer education is necessary to teach owners about recharging practices. For example, they should be aware of the financial and electric power generation implications associated with charging during off-peak hours rather than during more expensive peak hours. Customers should obtain a general understanding on how to prolong the life of their battery pack. Similar to current EPA fuel economy ratings, consumers should be made aware of simple rules of thumb that indicate what types of driving patterns are most compatible with EVs, PHEVs, and HEVs in comparison to ICEs. As an integral element of a continuing consumer education initiative, the training and involvement of DOE-supported Clean Cities coalitions should be encouraged. 8.3.2. Workforce Training
A PHEV is a marvel of both mechanical and electrical engineering. To support a growing market for PHEVs, the vehicle production industry must undertake an ambitious effort to transition toward the manufacturing, sales, and especially servicing of electrically-powered products. An intensive effort will be needed to assure that the transition is not delayed for want of a sufficient and well-trained workforce. Ideally, a sustainable, high-volume PHEV market will be one that is seamlessly integrated with the grid. This has ramifications for the capabilities required within the workforce of the electric utilities, as well as electric utility regulators. The U.S. educational system can support and accelerate the transition to electric drive vehicles by training scientists, engineers, and technicians with the requisite skills. Specifically, certifications may be required for mechanics to service any plug-in vehicles (e.g., PHEVs, EVs). On a competitive basis, government-funded support for training should be provided to educational institutions during the first years of commercial PHEV introduction. Such funding could assist with developing curricula and engineering laboratories.
8.4. Codes and Standards
The development and adoption of relevant codes and standards will be important to the successful introduction of commercialized PHEVs. There are many entities who have a stake in what will become the final codes and standards content. These include vehicle, equipment and battery manufacturers, power companies and utilities involved in the recharging infrastructure, regulatory authorities and consensus standards organizations. Standards are required to assure: safety of PHEVs and the electricity infrastructure with which they are connected, and the charging infrastructure inter-operability with products of vehicle manufacturers. Standardized electronic protocols must be established for communications between vehicles and the electric power grid. DOE, working with NIST and other appropriate federal agencies, should be an active participant in development of model codes and standards.

PHEV Value Proposition Study – Final Report Draft / July 2010 91
APPENDICES

This page intentionally left blank.
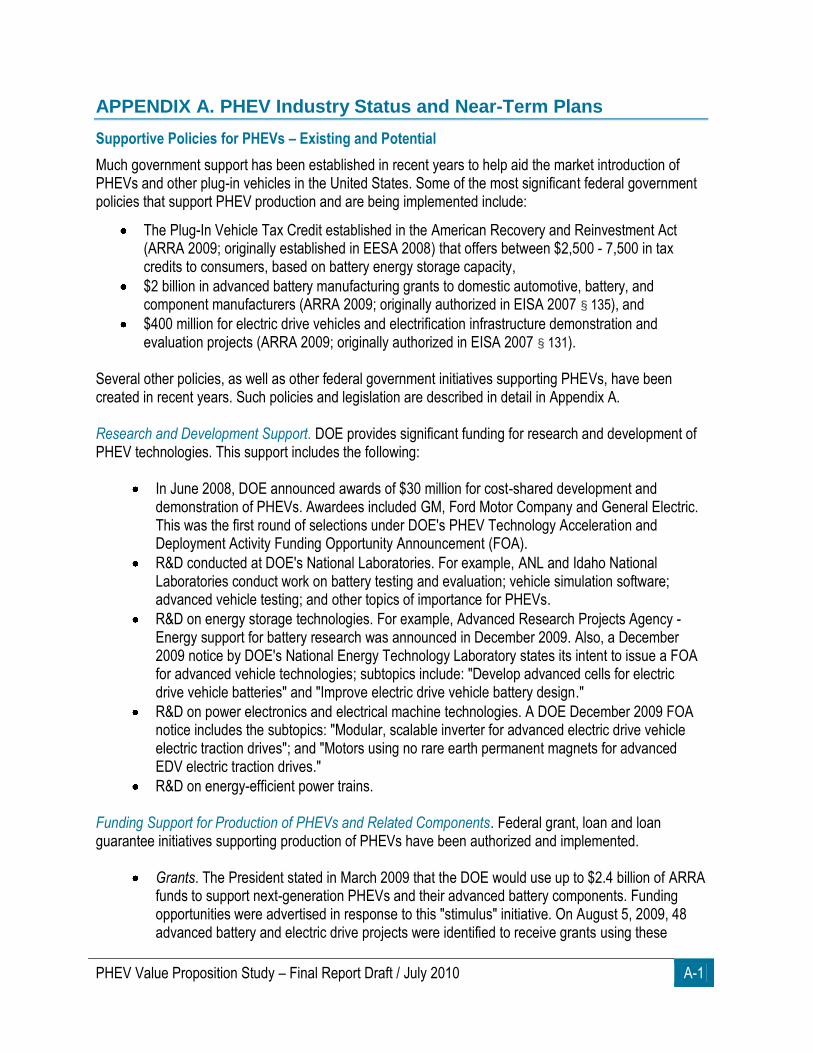
PHEV Value Proposition Study – Final Report Draft / July 2010 A-1
APPENDIX A. PHEV Industry Status and Near-Term Plans
Supportive Policies for PHEVs – Existing and Potential
Much government support has been established in recent years to help aid the market introduction of PHEVs and other plug-in vehicles in the United States. Some of the most significant federal government policies that support PHEV production and are being implemented include:
The Plug-In Vehicle Tax Credit established in the American Recovery and Reinvestment Act (ARRA 2009; originally established in EESA 2008) that offers between $2,500 - 7,500 in tax credits to consumers, based on battery energy storage capacity,
$2 billion in advanced battery manufacturing grants to domestic automotive, battery, and component manufacturers (ARRA 2009; originally authorized in EISA 2007 § 135), and
$400 million for electric drive vehicles and electrification infrastructure demonstration and evaluation projects (ARRA 2009; originally authorized in EISA 2007 § 131).
Several other policies, as well as other federal government initiatives supporting PHEVs, have been created in recent years. Such policies and legislation are described in detail in Appendix A. Research and Development Support. DOE provides significant funding for research and development of PHEV technologies. This support includes the following:
In June 2008, DOE announced awards of $30 million for cost-shared development and demonstration of PHEVs. Awardees included GM, Ford Motor Company and General Electric. This was the first round of selections under DOE's PHEV Technology Acceleration and Deployment Activity Funding Opportunity Announcement (FOA).
R&D conducted at DOE's National Laboratories. For example, ANL and Idaho National Laboratories conduct work on battery testing and evaluation; vehicle simulation software; advanced vehicle testing; and other topics of importance for PHEVs.
R&D on energy storage technologies. For example, Advanced Research Projects Agency - Energy support for battery research was announced in December 2009. Also, a December 2009 notice by DOE's National Energy Technology Laboratory states its intent to issue a FOA for advanced vehicle technologies; subtopics include: "Develop advanced cells for electric drive vehicle batteries" and "Improve electric drive vehicle battery design."
R&D on power electronics and electrical machine technologies. A DOE December 2009 FOA notice includes the subtopics: "Modular, scalable inverter for advanced electric drive vehicle electric traction drives"; and "Motors using no rare earth permanent magnets for advanced EDV electric traction drives."
R&D on energy-efficient power trains.
Funding Support for Production of PHEVs and Related Components. Federal grant, loan and loan guarantee initiatives supporting production of PHEVs have been authorized and implemented.
Grants. The President stated in March 2009 that the DOE would use up to $2.4 billion of ARRA funds to support next-generation PHEVs and their advanced battery components. Funding opportunities were advertised in response to this "stimulus" initiative. On August 5, 2009, 48 advanced battery and electric drive projects were identified to receive grants using these
A-2 PHEV Value Proposition Study – Final Report Draft / July 2010
funds. The White House statement said, "These projects, selected through a highly competitive process by the Department of Energy, will accelerate the development of U.S. manufacturing capacity for batteries and electric drive components as well as the deployment of electric drive vehicles, helping to establish American leadership in creating the next generation of advanced vehicles. . ." The awards include:
• $1.5 billion in grants to U.S.-based manufacturers to produce batteries and their components and to expand battery recycling capacity;
• $500 million in grants to U.S.-based manufacturers to produce electric drive components for vehicles, including electric motors, power electronics, and other drive train components; and
• $400 million in grants to: purchase thousands of plug-in hybrid and all-electric vehicles for test demonstrations in several dozen locations; deploy them and evaluate their performance; install electric charging infrastructure; and provide education and workforce training to support the transition to advanced electric transportation systems.
Loans. Section 136 of EISA establishes an incentive program consisting of both grants and direct loans to support the development of advanced technology vehicles and associated components. DOE is charged with administering this program, known as the Advanced Technology Vehicles Manufacturing Loan Program (ATVM). The ATVM provides loans to automobile and automobile parts manufacturers for the cost of re-equipping, expanding, or establishing manufacturing facilities in the United States to produce advanced technology vehicles or qualified components, and for associated engineering integration costs. Loans in the following amounts have been announced:
• $ 5.9 billion to Ford Motor Company; • $1.6 billion to Nissan North America ; • $465 million to Tesla Motors Corporation; and • $528.7 million to Fisker Automotive.
Loan Guarantees. Under Title XVII of the Energy Policy Act of 2005, the Secretary of Energy is authorized to make loan guarantees for qualified projects that will accelerate commercial use of new or improved technologies that help sustain economic growth, yield environmental benefits, and produce a more stable and secure energy supply. No loan guarantees were offered until 2009, and those issued to date are not for PHEV technologies. However, it is possible that loan guarantees can be used in the future for support of PHEV projects.
Tax Credits. Federal tax credits are authorized for both purchasers and manufacturers of PHEVs. The Emergency Economic Stabilization Act of 2008 included a tax credit for purchase of plug-in electric drive vehicles. In February 2009, ARRA provided further tax credit incentives for plug-in electric vehicles, including PHEVs.
The tax credit was modified by ARRA for qualified plug-in electric drive vehicles purchased after 2009. To qualify, vehicles must be newly purchased, have four or more wheels, have a gross vehicle weight rating of less than 14,000 pounds, and draw propulsion using a battery with at least four kWh that can be recharged from an external source of electricity. The minimum amount of the credit for qualified plug-in electric drive vehicles is $2,500, and the
PHEV Value Proposition Study – Final Report Draft / July 2010 A-3
credit tops out at $7,500, depending on the battery capacity. The full amount of the credit is reduced when a manufacturer has sold at least 200,000 vehicles.
A special tax credit was provided for certain low-speed EVs and two- or three-wheeled vehicles. The amount of the credit is 10 percent of the cost of the vehicle, up to a maximum credit of $2,500 for purchases made after February 17, 2009, and before January 1, 2012.
A tax credit was provided for plug-in electric drive conversion kits. The credit is equal to 10 percent of the cost of converting a vehicle to a qualified plug-in electric drive motor vehicle that is placed in service after February 17, 2009. The maximum amount of the credit is $4,000. The credit does not apply to conversions made after December 31, 2011.
The Department of the Treasury is authorized to award $2.3 billion in tax credits for qualified investments in advanced energy projects that support new, expanded, or re-equipped domestic manufacturing facilities. The Advanced Energy Manufacturing Tax Credit (MTC) was authorized in Section 1302 of ARRA. The MTC provides a 30% credit for investments. The eligible advanced energy facilities described in Section 1302 include: energy storage technologies used in electric vehicles; and plug-in electric vehicles and vehicle components.
Deployment Support. ARRA includes a provision authorizing $300 million for acquisition of vehicles with higher fuel economy for the federal fleet. These vehicles include hybrid vehicles, electric vehicles and "commercially-available plug-in hybrid vehicles." The funds are to remain available until September 30, 2011. It is not likely that many PHEVs will be acquired for the federal fleet prior to that date. However, it is anticipated that federal fleet requirements, Clean Cities grants and other government initiatives will be implemented with requirements to purchase PHEVs as they are introduced in the commercial market.
PHEV Production Plans and Announcements
Automotive OEMs. Vehicle manufacturers ranging from major, well-established, international Original Equipment Manufacturers (OEM) to small, venture capital funded start-ups have announced plans for production and commercial sale of PHEVs. Some of those are listed here.
In December 2009, GM announced that it will invest $336 million in the Detroit-Hamtramck assembly plant to begin production of the Chevrolet Volt. This plant will be the final assembly location for the Volt. GM's announcement noted that its PHEV challengers and partners have grown significantly, and that the resulting competition will expedite the development of electric vehicle technology and infrastructure. Assembly of Volt prototype vehicles is expected to begin in the spring of 2010, with the regular production scheduled to start in late 2010. The Volt is designed to travel up to 40 miles on electricity without using gasoline. First year production is expected to be between 7,000 and 10,000 units, with a cost of about $40,000 each.
In early 2009, Ford Motor Company publicized its plans to bring pure battery-powered vehicles, HEVs and PHEVs to market. Ford's plans include North American introductions of:
• A new battery electric commercial van in 2010. • A battery electric small car in 2011, to be developed jointly with Magna International. • An electric sedan/hatchback Focus in 2011.
Ford and other major manufacturers have undertaken collaborations and partnerships intended to accelerate electric drive vehicle commercialization. For example, in partnership with SCE and EPRI, Ford road tested a fleet of prototype PHEVs. In November 2009, Ford announced its teaming with the University of Detroit Mercy to retrain traditional automotive engineers,
A-4 PHEV Value Proposition Study – Final Report Draft / July 2010
providing them with the skills and expertise to develop the next generation of advanced electric and hybrid vehicles.
In December 2009, Toyota Motor Company introduced its Prius PHEV at the Los Angeles Auto Show. When fully charged, the vehicle is targeted to achieve a maximum electric-only range of approximately 13 miles. Beginning early in 2010 Toyota intends to begin delivery of 150 of these vehicles to the United States, where they will be placed in regional clusters with select partners for market/consumer analysis and technical demonstration. In November 2009, production of Li-ion batteries for these vehicles began in Japan. Large-scale production of the Prius PHEV is anticipated in 2012, with expected first year output of 20,000 to 30,000 cars.
In a December 2009 news release, Fisker Automotive indicated plans to begin delivering its luxury Karma PHEV to retailers and distributors in the third quarter of 2010. This vehicle has a base price of $87,900 and will be assembled in Finland. Fisker has also announced development of an affordable, family-oriented PHEV sedan for introduction in 2012. Most of its DOE loan will be used to finance U.S. production of this $40,000 sedan. The company forecasts sales of 7,500 PHEVs in 2010 and 15,000 in 2011.
China's BYD Automotive Company is planning to sell both pure electric and plug-in hybrid cars in the United States and Europe. During 2009, its executives also stated plans to establish manufacturing facilities in the United States. Warren Buffett's Berkshire Hathaway has acquired a 10% stake in BYD Auto’s parent company. MidAmerican Energy Holdings, an energy subsidiary of Berkshire Hathaway, is working with BYD on developing charging technologies and infrastructure for PHEVs, and on demonstration projects. BYD's PHEV, with a base price of $22,000 and an AER of 60 miles, was introduced in China in 2009 to fleet customers; BYD intended to introduce the vehicle to the United States and Europe in upcoming years.
Other international vehicle manufacturers are also laying the groundwork for production of PHEVs. A review of Plug-in America's Vehicle Tracker website indicates that Audi, Hyundai and Volvo have 2012 or earlier targets for PHEV production. Other companies have developed and are testing prototype PHEVs. Plans for the introduction of three-wheel PHEVs in the United States and Europe have been announced by small manufacturers. Plans have also been announced for PHEV models of commercial vehicles. Bright Automotive stated its intent to sell delivery vans to U.S. fleets in 2012; a school bus produced by IC Bus is now available in the United States.
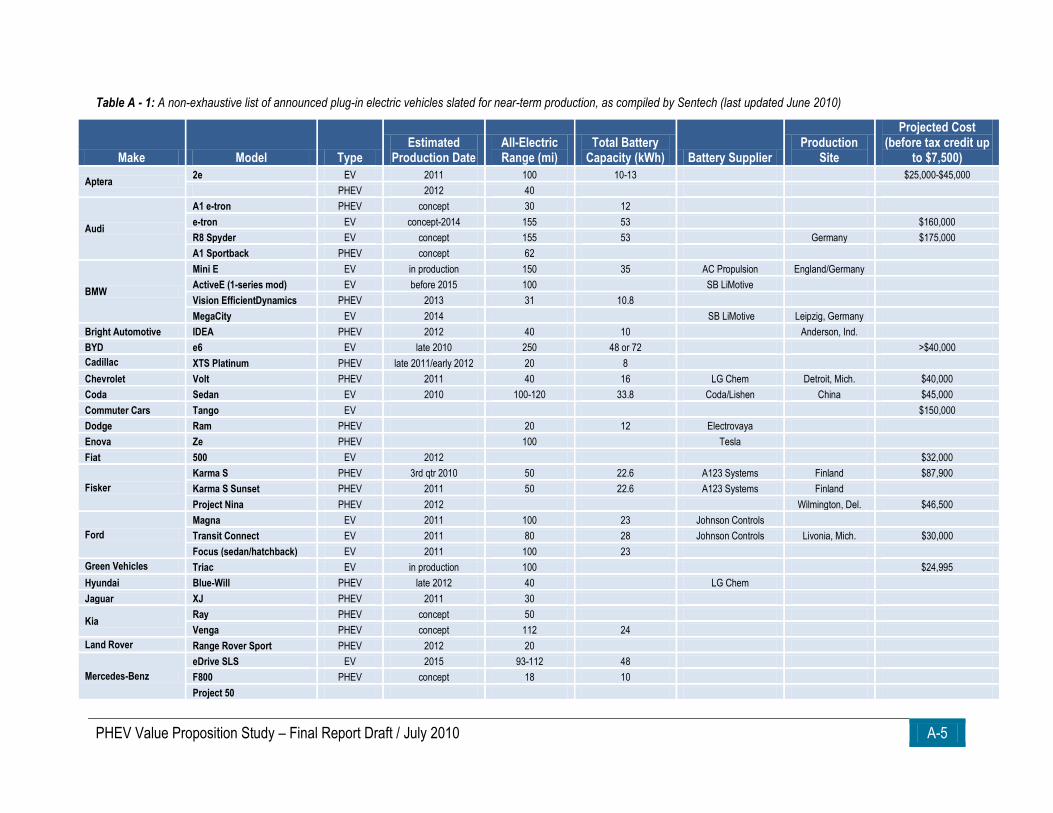
PHEV Value Proposition Study – Final Report Draft / July 2010 A-5
Table A - 1: A non-exhaustive list of announced plug-in electric vehicles slated for near-term production, as compiled by Sentech (last updated June 2010)
Make Model Type Estimated
Production Date All-Electric Range (mi)
Total Battery Capacity (kWh) Battery Supplier
Production Site
Projected Cost (before tax credit up
to $7,500)
Aptera 2e EV 2011 100 10-13 $25,000-$45,000
PHEV 2012 40
Audi
A1 e-tron PHEV concept 30 12
e-tron EV concept-2014 155 53 $160,000
R8 Spyder EV concept 155 53 Germany $175,000
A1 Sportback PHEV concept 62
BMW
Mini E EV in production 150 35 AC Propulsion England/Germany
ActiveE (1-series mod) EV before 2015 100 SB LiMotive
Vision EfficientDynamics PHEV 2013 31 10.8
MegaCity EV 2014 SB LiMotive Leipzig, Germany
Bright Automotive IDEA PHEV 2012 40 10 Anderson, Ind.
BYD e6 EV late 2010 250 48 or 72 >$40,000
Cadillac XTS Platinum PHEV late 2011/early 2012 20 8
Chevrolet Volt PHEV 2011 40 16 LG Chem Detroit, Mich. $40,000
Coda Sedan EV 2010 100-120 33.8 Coda/Lishen China $45,000
Commuter Cars Tango EV $150,000
Dodge Ram PHEV 20 12 Electrovaya
Enova Ze PHEV 100 Tesla
Fiat 500 EV 2012 $32,000
Fisker
Karma S PHEV 3rd qtr 2010 50 22.6 A123 Systems Finland $87,900
Karma S Sunset PHEV 2011 50 22.6 A123 Systems Finland
Project Nina PHEV 2012 Wilmington, Del. $46,500
Ford
Magna EV 2011 100 23 Johnson Controls
Transit Connect EV 2011 80 28 Johnson Controls Livonia, Mich. $30,000
Focus (sedan/hatchback) EV 2011 100 23
Green Vehicles Triac EV in production 100 $24,995
Hyundai Blue-Will PHEV late 2012 40 LG Chem
Jaguar XJ PHEV 2011 30
Kia Ray PHEV concept 50
Venga PHEV concept 112 24
Land Rover Range Rover Sport PHEV 2012 20
Mercedes-Benz
eDrive SLS EV 2015 93-112 48
F800 PHEV concept 18 10
Project 50
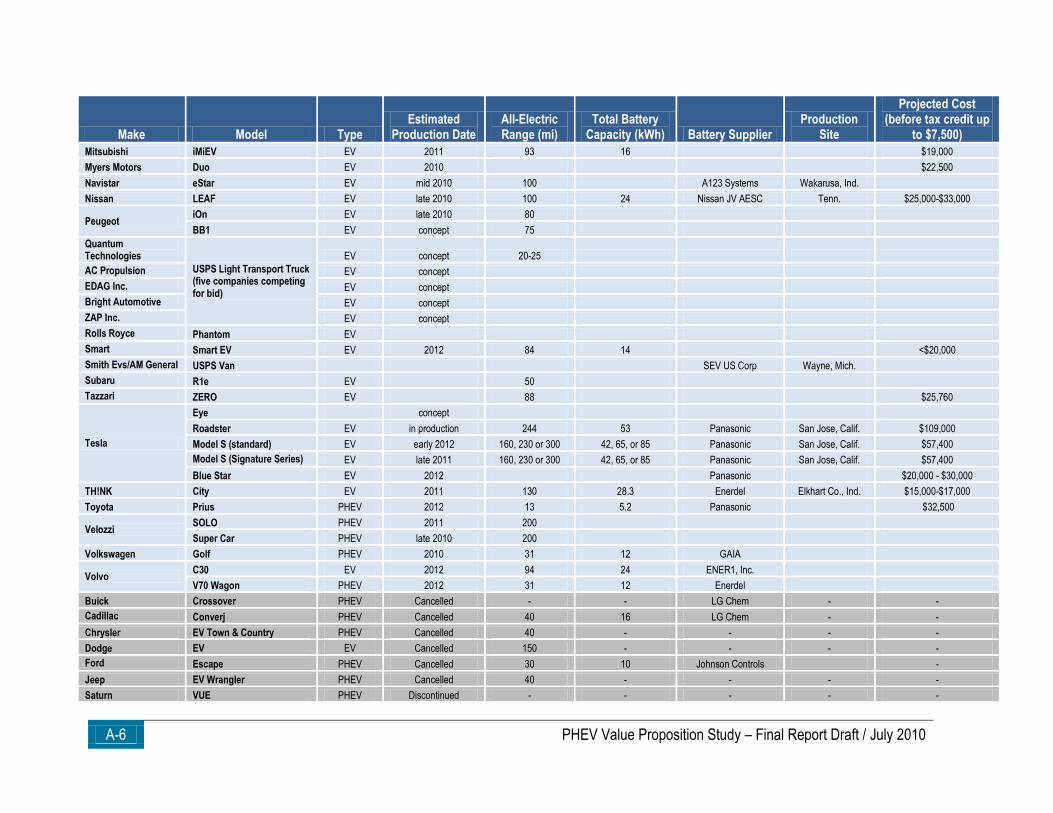
A-6 PHEV Value Proposition Study – Final Report Draft / July 2010
Make Model Type Estimated
Production Date All-Electric Range (mi)
Total Battery Capacity (kWh) Battery Supplier
Production Site
Projected Cost (before tax credit up
to $7,500)
Mitsubishi iMiEV EV 2011 93 16 $19,000
Myers Motors Duo EV 2010 $22,500
Navistar eStar EV mid 2010 100 A123 Systems Wakarusa, Ind.
Nissan LEAF EV late 2010 100 24 Nissan JV AESC Tenn. $25,000-$33,000
Peugeot iOn EV late 2010 80
BB1 EV concept 75
Quantum Technologies
USPS Light Transport Truck (five companies competing for bid)
EV concept 20-25
AC Propulsion EV concept
EDAG Inc. EV concept
Bright Automotive EV concept
ZAP Inc. EV concept
Rolls Royce Phantom EV
Smart Smart EV EV 2012 84 14 <$20,000
Smith Evs/AM General USPS Van SEV US Corp Wayne, Mich.
Subaru R1e EV 50
Tazzari ZERO EV 88 $25,760
Tesla
Eye concept
Roadster EV in production 244 53 Panasonic San Jose, Calif. $109,000
Model S (standard) EV early 2012 160, 230 or 300 42, 65, or 85 Panasonic San Jose, Calif. $57,400
Model S (Signature Series) EV late 2011 160, 230 or 300 42, 65, or 85 Panasonic San Jose, Calif. $57,400
Blue Star EV 2012 Panasonic $20,000 - $30,000
TH!NK City EV 2011 130 28.3 Enerdel Elkhart Co., Ind. $15,000-$17,000
Toyota Prius PHEV 2012 13 5.2 Panasonic $32,500
Velozzi SOLO PHEV 2011 200
Super Car PHEV late 2010 200
Volkswagen Golf PHEV 2010 31 12 GAIA
Volvo C30 EV 2012 94 24 ENER1, Inc.
V70 Wagon PHEV 2012 31 12 Enerdel
Buick Crossover PHEV Cancelled - - LG Chem - -
Cadillac Converj PHEV Cancelled 40 16 LG Chem - -
Chrysler EV Town & Country PHEV Cancelled 40 - - - -
Dodge EV EV Cancelled 150 - - - -
Ford Escape PHEV Cancelled 30 10 Johnson Controls -
Jeep EV Wrangler PHEV Cancelled 40 - - - -
Saturn VUE PHEV Discontinued - - - - -
PHEV Value Proposition Study – Final Report Draft / July 2010 A-7
Battery and Component Manufacturers. The cost of early production PHEVs is likely to be significantly higher relative to comparable ICE vehicles and HEVs, primarily due to the cost for PHEV batteries. The Li-ion battery technology planned for most of the PHEVs to be introduced during the next few years is the key determinant of their cost and AER. An NRC report released in December 2009 states that, while battery technology has been developing rapidly, steep declines in cost do not appear likely over the next couple of decades. Its authors also conclude that a fundamental breakthrough in battery technology will be needed to make plug-ins widely affordable. Consistent with the importance of battery technology and cost for electric drive vehicles, many companies worldwide, with significant funding support from governments in the United States and elsewhere, continue intense work on battery research, development and lower cost manufacturing. In August 2009, ARRA grant awards (see Section 2.1.2 above) to nine companies were announced for "cell, battery, and materials manufacturing facilities." Grant awards to ten manufacturers were also announced for "advanced battery supplier manufacturing facilities." In addition, a grant was made for advanced Li-ion battery recycling facilities. (Recycling also addresses a potential shortage of lithium needed for the numbers of PHEVs required to form a viable market. This potential market barrier was identified in the project team’s December 2007 workshop.) In June 2009, a DOE $1.6 billion loan (see Section 2.1.2 above) to Nissan North America was announced. This will support Nissan's modification of its Smyrna, TN manufacturing plant to produce electric vehicles and state-of-the-art Li-ion battery packs. The plant will have the capability to build 200,000 Li-ion batteries per year. As a counterpoint to the NRC report, battery production cost estimates and studies done by others since 2000 conclude that cost will decline significantly with volume production. These estimates indicate that battery packs costing $1,000 and more per kWh when only a few are produced could cost in the range of $250 to $400 per kWh with production volumes of 200,000 and higher. A May 2009 paper delivered at Electric Vehicle Symposium 24 notes that newer cost projections tend to converge at these lower costs, particularly with mass production (Kalhammer 2009). ARRA grant awards have also been made for electric drive vehicle battery and component manufacturing. Grants have been made to seven manufacturers, including GM and Ford, for "electric drive component manufacturing facilities." Three grants have been made to manufacturers for "electric drive subcomponent manufacturing facilities."
Planning for PHEVs by Electric Utilities
Electric utilities throughout the country are engaging in activities that anticipate the emergence of PHEVs. In addition to their individual analyses and development of plans, they are pursuing joint projects with research and standards organizations, government agencies and vehicle manufacturers, for work on development of charging system designs, recharging equipment and grid infrastructure.
SCE is working to prepare for the expected arrival of PHEVs in its service territory beginning in 2010. SCE established its Electric Vehicle Technical Center in 1993. The Center's purposes include understanding the potential impacts of increasing quantities of transportation connecting to the grid. It supports development of more efficient battery charging systems and houses a "garage of the future" demonstration facility capable of simulating 110/220V charging, vehicle bidirectional energy flow, home energy storage and advanced meter control. SCE is collaborating with Ford, GM and other automakers to evaluate the potential impact and support development of electric transportation technologies. Anticipating the commercial introduction of PHEVs, SCE
A-8 PHEV Value Proposition Study – Final Report Draft / July 2010
is partnering with: Daimler AG and others on evaluation of Daimler's Sprinter vans; and Ford, Eaton and EPRI on development of a plug-in hybrid platform based on the Ford F550 truck. It anticipates there will be a need, as the number of PHEVs and EVs grows, to reinforce its distribution system in locations that have large numbers of electric drive vehicle owners and faster, higher voltage charging systems.
Duke Energy is among other utilities that are also studying the potential impact of PHEVs on their grids and infrastructure investment plans. It is working collaboratively with automotive manufacturers, electric industry organizations and start-up companies in the development stage to better understand how the vehicles will interface with the grid, and to ensure safe and reliable integration of vehicles and electric infrastructure. Duke has made a commitment that by 2020 all its own new vehicle purchases will be plug-in electric vehicles.
ECOtality, Nissan, the PIMA Association of Governments, utilities and other organizations are collaborating to promote the development of an electric drive vehicle charging network in the Tucson, Arizona region. Objectives include coordinating establishment of policies and streamlining the deployment of an EV infrastructure. San Diego Gas and Electric (SDG&E), the Tennessee Valley Authority and Portland General Electric are among other electric utilities that have announced plans for collaborations with Nissan. With support from a Department of Energy grant, the Electric Transportation Engineering Corporation (eTec), a subsidiary of ECOtality, has plans to install approximately 2,500 charging stations in each of five U.S. markets: Tennessee, Oregon, San Diego, San Diego and the Phoenix/Tucson region. This project will also deploy up to 1,000 Nissan EVs in each market.
Seven regional utilities – New York Power Authority, Consolidated Edison of New York, American Electric Power, Southern Company, Progress Energy, DTE Energy and National Grid – are joining Ford and EPRI to conduct tests on Ford Escape PHEVs. These partnerships are intended to help Ford accelerate its vehicle electrification strategy. Objectives include understanding regional differences, as well as PHEV impacts on the electric grid.
In October 2009, Edison Electric Institute member companies released an industry-wide pledge to support PHEV market readiness. The utilities agreed to work collaboratively with a variety of organizations to help develop a comprehensive local charging infrastructure deployment plan. They also agreed to work with stakeholders to facilitate a streamlined charging installation process.
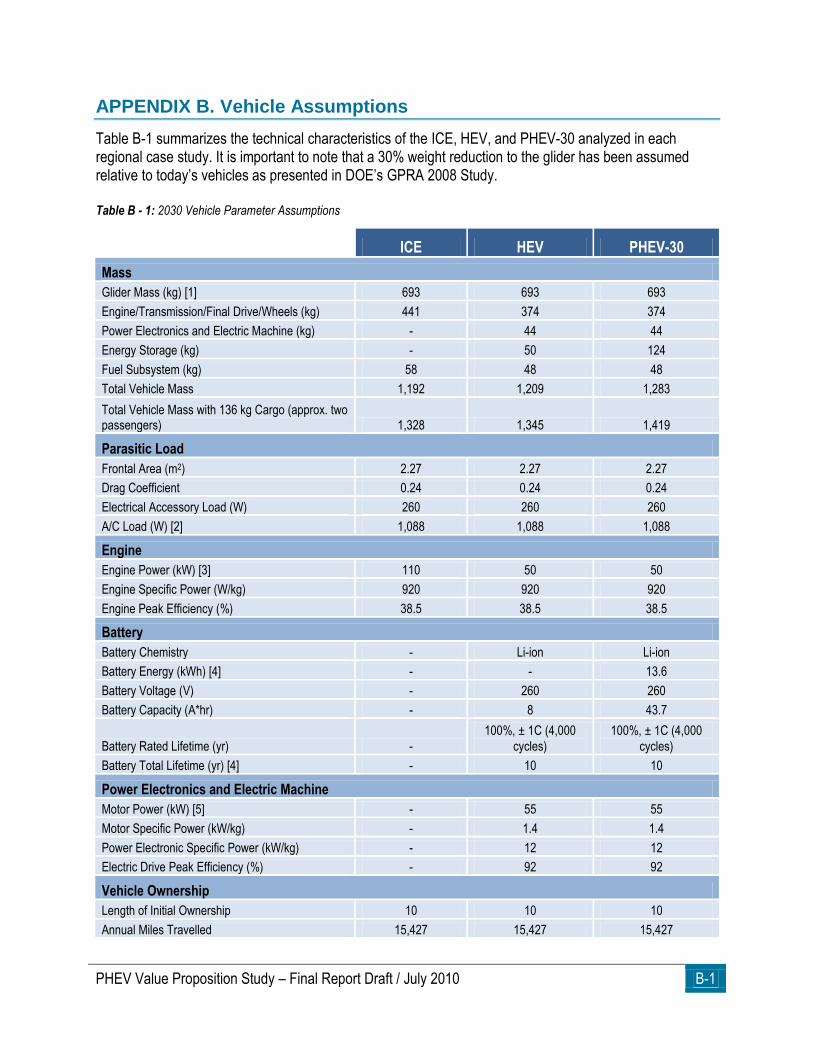
PHEV Value Proposition Study – Final Report Draft / July 2010 B-1
APPENDIX B. Vehicle Assumptions
Table B-1 summarizes the technical characteristics of the ICE, HEV, and PHEV-30 analyzed in each regional case study. It is important to note that a 30% weight reduction to the glider has been assumed relative to today’s vehicles as presented in DOE’s GPRA 2008 Study. Table B - 1: 2030 Vehicle Parameter Assumptions
ICE HEV PHEV-30
Mass
Glider Mass (kg) [1] 693 693 693
Engine/Transmission/Final Drive/Wheels (kg) 441 374 374
Power Electronics and Electric Machine (kg) - 44 44
Energy Storage (kg) - 50 124
Fuel Subsystem (kg) 58 48 48
Total Vehicle Mass 1,192 1,209 1,283
Total Vehicle Mass with 136 kg Cargo (approx. two passengers) 1,328 1,345 1,419
Parasitic Load
Frontal Area (m2) 2.27 2.27 2.27
Drag Coefficient 0.24 0.24 0.24
Electrical Accessory Load (W) 260 260 260
A/C Load (W) [2] 1,088 1,088 1,088
Engine
Engine Power (kW) [3] 110 50 50
Engine Specific Power (W/kg) 920 920 920
Engine Peak Efficiency (%) 38.5 38.5 38.5
Battery
Battery Chemistry - Li-ion Li-ion
Battery Energy (kWh) [4] - - 13.6
Battery Voltage (V) - 260 260
Battery Capacity (A*hr) - 8 43.7
Battery Rated Lifetime (yr) -
100%, ± 1C (4,000
cycles)
100%, ± 1C (4,000
cycles)
Battery Total Lifetime (yr) [4] - 10 10
Power Electronics and Electric Machine
Motor Power (kW) [5] - 55 55
Motor Specific Power (kW/kg) - 1.4 1.4
Power Electronic Specific Power (kW/kg) - 12 12
Electric Drive Peak Efficiency (%) - 92 92
Vehicle Ownership
Length of Initial Ownership 10 10 10
Annual Miles Travelled 15,427 15,427 15,427

B-2 PHEV Value Proposition Study – Final Report Draft / July 2010
[1] Glider mass = Vehicle– (Engine+Motor+Batteries+Transmission+Final Drive+Fuel Storage+Wheel) Based on 30% reduction in current glider mass as per GPRA 2008 DOE Study Original glider mass is 990 kg. [2] Data provided by John Rugh (National Renewable Energy Laboratory) - assumed 50% of the time when the A/C is on, the vehicle is undergoing a cool down from a solar soak when the initial interior air and mass will be 60-80°C. The other 50% is steady state operation. The humidity was as 65% during the ARCRP tests.
[3] Part of in-house energy management strategy; validated by lab testing
[4] Capacities established with OSU CAR battery life estimation model iterations
[5] PEEM Development Target for 2010-2020; FCVT Program (FCVT) PHEV R&D Plan, Feb 2007
PHEV Value Proposition Study – Final Report Draft / July 2010 C-1
APPENDIX C. Case Study Selection Process
Two regional case studies – southern California and ECAR / Cleveland, Ohio – were focal points throughout the PHEV Value Proposition Study. In each case study, the project team assessed how PHEV-30s might potentially contend with ICEs and HEVs in the 2030 marketplace. Several factors that are unique to geographic regions were considered when selecting the locations of these case studies:
Electricity Generation Mix: The environmental impact of PHEVs is highly dependent on a region’s generation mix.
Climate: Very cold or hot climates (e.g., frigid winters) may negatively affect the performance or battery life expectancy in PHEVs.
Expressed Interest in Plug-in Electric Vehicle Technologies: States or organizations that support the introduction of plug-in vehicles, smart grid utilization, and charging infrastructure through legislation or financial support create an environment that is conducive to healthy and sustainable growth of these technologies.
Commute distance: Commute distances within a PHEV’s AER are ideal to minimize gasoline consumption.
REGIONAL CASE STUDY #1
The southern California region was unanimously chosen by the project team as the site of the initial case study for a multitude of reasons, including the state’s carbon policy, large number of early adopters of ICE hybrids, continued high sales of HEVs, aggressive RPS targets, and emission-constrained dispatch of power plants in the Los Angeles air basin. In addition, southern California’s mild climate was not anticipated to have adverse effects on battery life. These economic, environmental, social and regulatory conditions are conducive to the advantages of PHEVs, making southern California a natural starting point for investigating the viability of PHEVs in 2030.
REGIONAL CASE STUDY #2
After sharing the promising conclusions of the southern California case study in the PHEV VPS Interim Report, the search began for a second geographic location that would more broadly depict how PHEV feasibility in other parts of the country. While southern California’s relatively clean margin generation mix and progressive culture presents a near ―best case scenario‖ for PHEVs, many states are powered by large amounts of coal-derived electricity and have not set renewable portfolio standards. Since the environmental impacts of PHEVs are so highly dependent on electricity generation mixes, the project team first narrowed down the search to regions with mixes dominated by coal. Figure C-1 displays state generation mixes by fuel type; over half of the states are dominated coal-derived electricity (shown in black). For the next set of criteria, a region with a large enough population – and, hence, PHEV population – was sought in order to observe a sufficient impact on the electric grid. This consequently eliminated much of the Midwest and the upper Northeast regions. From this point, the project team narrowed the list of eligible states to ten:
Ohio
West Virginia
Tennessee
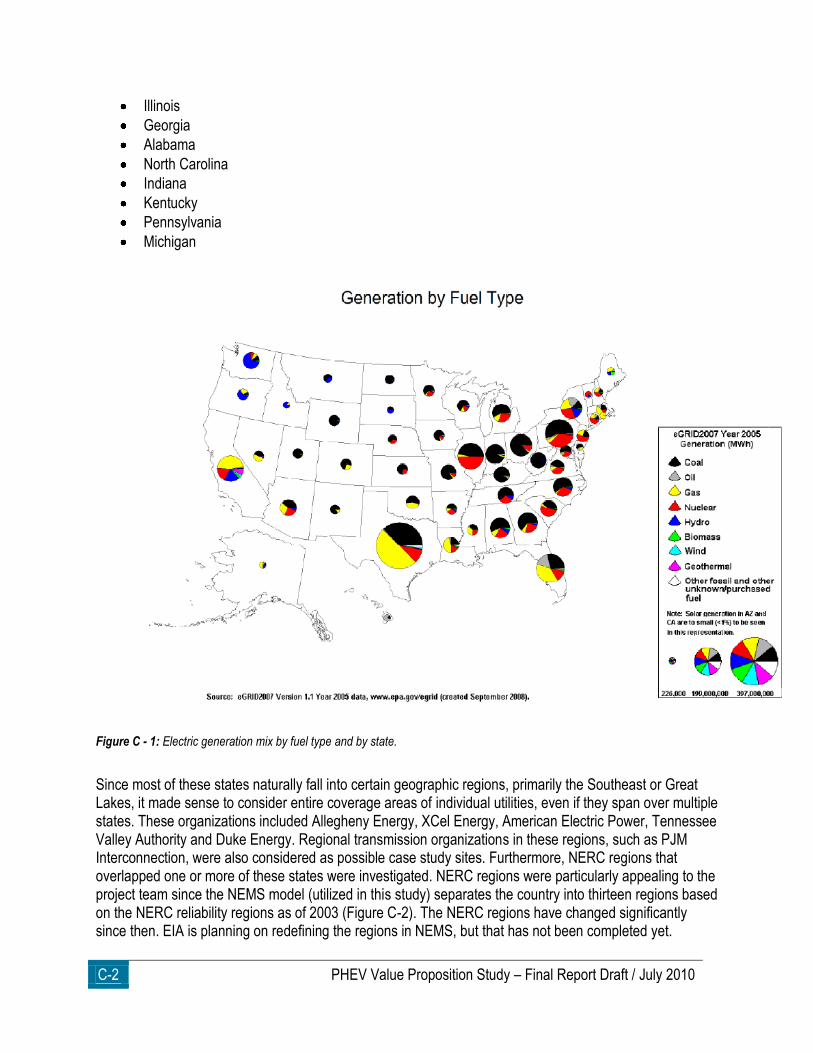
C-2 PHEV Value Proposition Study – Final Report Draft / July 2010
Illinois
Georgia
Alabama
North Carolina
Indiana
Kentucky
Pennsylvania
Michigan
Figure C - 1: Electric generation mix by fuel type and by state.
Since most of these states naturally fall into certain geographic regions, primarily the Southeast or Great Lakes, it made sense to consider entire coverage areas of individual utilities, even if they span over multiple states. These organizations included Allegheny Energy, XCel Energy, American Electric Power, Tennessee Valley Authority and Duke Energy. Regional transmission organizations in these regions, such as PJM Interconnection, were also considered as possible case study sites. Furthermore, NERC regions that overlapped one or more of these states were investigated. NERC regions were particularly appealing to the project team since the NEMS model (utilized in this study) separates the country into thirteen regions based on the NERC reliability regions as of 2003 (Figure C-2). The NERC regions have changed significantly since then. EIA is planning on redefining the regions in NEMS, but that has not been completed yet.
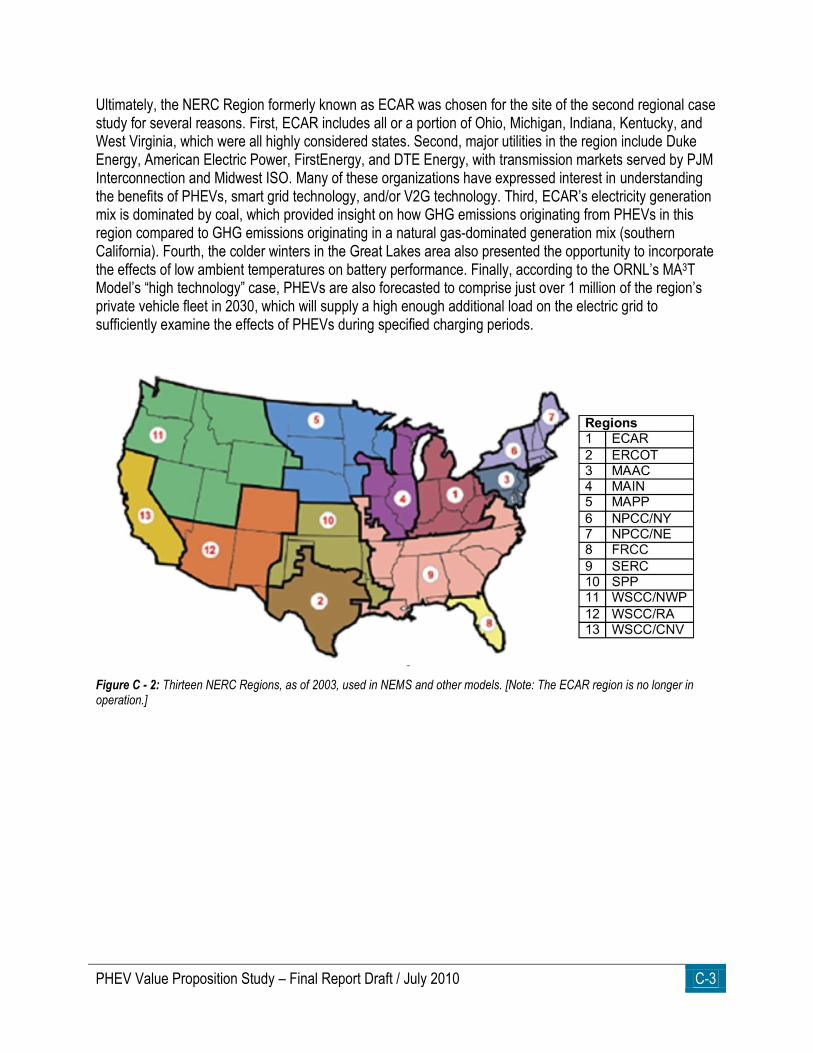
PHEV Value Proposition Study – Final Report Draft / July 2010 C-3
Ultimately, the NERC Region formerly known as ECAR was chosen for the site of the second regional case study for several reasons. First, ECAR includes all or a portion of Ohio, Michigan, Indiana, Kentucky, and West Virginia, which were all highly considered states. Second, major utilities in the region include Duke Energy, American Electric Power, FirstEnergy, and DTE Energy, with transmission markets served by PJM Interconnection and Midwest ISO. Many of these organizations have expressed interest in understanding the benefits of PHEVs, smart grid technology, and/or V2G technology. Third, ECAR’s electricity generation mix is dominated by coal, which provided insight on how GHG emissions originating from PHEVs in this region compared to GHG emissions originating in a natural gas-dominated generation mix (southern California). Fourth, the colder winters in the Great Lakes area also presented the opportunity to incorporate the effects of low ambient temperatures on battery performance. Finally, according to the ORNL’s MA3T Model’s ―high technology‖ case, PHEVs are also forecasted to comprise just over 1 million of the region’s private vehicle fleet in 2030, which will supply a high enough additional load on the electric grid to sufficiently examine the effects of PHEVs during specified charging periods.
Figure C - 2: Thirteen NERC Regions, as of 2003, used in NEMS and other models. [Note: The ECAR region is no longer in operation.]

C-4 PHEV Value Proposition Study – Final Report Draft / July 2010
This page intentionally left blank.
PHEV Value Proposition Study – Final Report Draft / July 2010 D-1
APPENDIX D. Vehicle Cost Assumptions
To compare the costs associated with purchasing comparable ICEs, HEVs, and PHEV-30, many assumptions were defined. This report’s two case studies are based in 2030, so cost projections of all vehicle components at or near 2030 were sought. In addition to 2030 projections, the cost to purchase each of the three vehicle types today was also calculated based on current industry price points. Two primary sources were used to gather this information:
1. The FCVT Program MYPP (2007) and 2. The FCVT Program PHEV R&D Plan (2007)
A mid-size sedan was used to represent each vehicle type – ICE, HEV, and PHEV-30. Vehicle components were sized based on DOE’s performance requirements and GPRA study results for 2030. This incorporates component efficiency improvements as well as light-weighting projections. All powertrain components (excluding the glider) received a manufacturer's markup of 50% in addition to a dealer's markup of 16.3%. Once the total powertrain cost was calculated for each vehicle type, it was subtracted from the MSRP of a 2009 Toyota Camry SE to estimate the cost of the glider for the ICE. This same glider cost was applied to the HEV and PHEV-30. Since state sales tax comprises a significant portion of the vehicle purchase price, especially in California, it is included in both case studies. County and city taxes were not included. Currently, California and Ohio have state sales tax rates of 8.25% and 5.5%, respectively. Using historic trends, the state sales tax rate in 2030 is projected to be 10% and 6% for California and Ohio, respectively. Present value of money was also applied to the initial purchase cost, assuming monthly payments over five years) with no down payment and a 6% interest rate. Table D-1 provides a breakdown of projected purchase prices for each vehicle type in both today’s market and in 2030 (dollar values from 2010). For purposes of this study, the cost of an ICE in 2030 has been held constant to demonstrate individual component cost reductions expected in HEVs and PHEVs. However, an incremental cost for all 2030 vehicles will likely be necessary to accommodate the 30% reduction in vehicle weight and minimum fuel efficiency of 35 mpg assumed in this study. With that said, the transmission and engine components are believed to be near maturity, so no relative cost reductions are expected from these components in future years. Electric powertrain components (e.g., motor/inverter, battery), on the other hand, are expected to decrease in cost significantly over the next two decades. To account for uncertainty of cost projections and variability in PHEV model types, two sensitivity scenarios related to vehicle purchase price were run. Table D-2 demonstrates how the estimated purchase price of PHEVs change as the AER varies from 10 miles to 40 miles. Values affected by this change are shown in red. In Table D-3, values in red indicate how the estimated price of a PHEV-30 changes as the cost of batteries range from $100/kWh to $400/kWh.
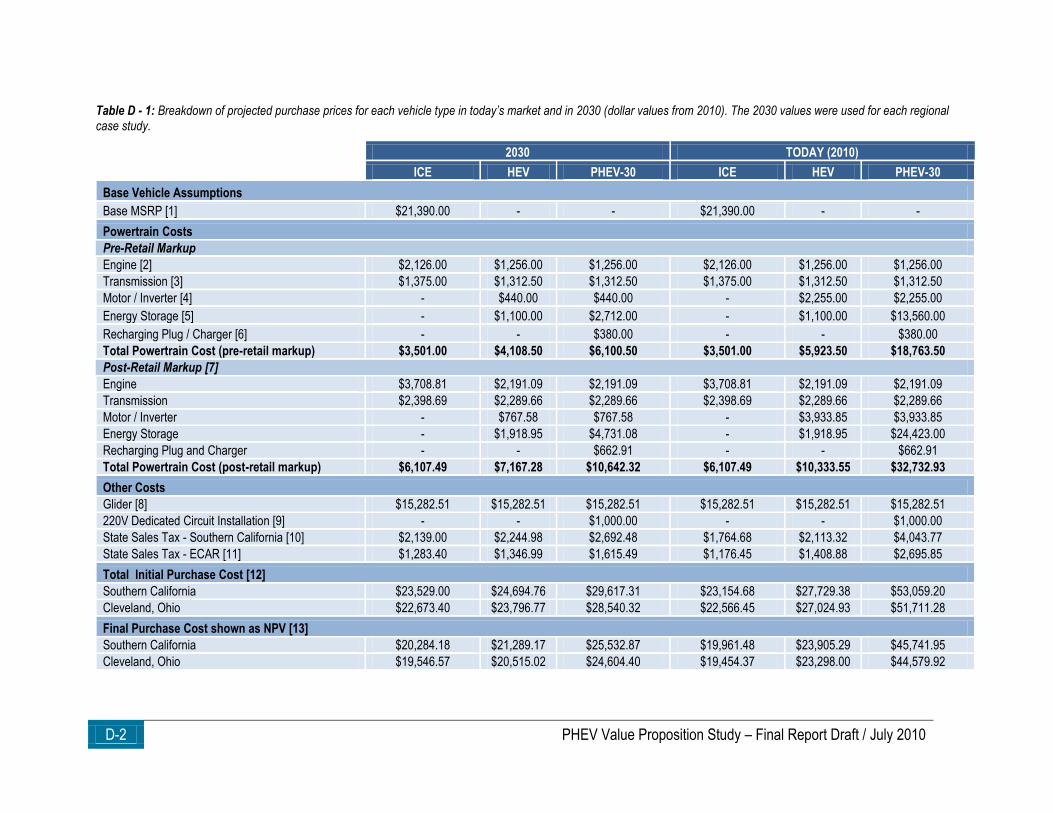
D-2 PHEV Value Proposition Study – Final Report Draft / July 2010
Table D - 1: Breakdown of projected purchase prices for each vehicle type in today’s market and in 2030 (dollar values from 2010). The 2030 values were used for each regional case study.
2030 TODAY (2010)
ICE HEV PHEV-30 ICE HEV PHEV-30
Base Vehicle Assumptions
Base MSRP [1] $21,390.00 - - $21,390.00 - -
Powertrain Costs
Pre-Retail Markup
Engine [2] $2,126.00 $1,256.00 $1,256.00 $2,126.00 $1,256.00 $1,256.00
Transmission [3] $1,375.00 $1,312.50 $1,312.50 $1,375.00 $1,312.50 $1,312.50
Motor / Inverter [4] - $440.00 $440.00 - $2,255.00 $2,255.00
Energy Storage [5] - $1,100.00 $2,712.00 - $1,100.00 $13,560.00
Recharging Plug / Charger [6] - - $380.00 - - $380.00
Total Powertrain Cost (pre-retail markup) $3,501.00 $4,108.50 $6,100.50 $3,501.00 $5,923.50 $18,763.50
Post-Retail Markup [7]
Engine $3,708.81 $2,191.09 $2,191.09 $3,708.81 $2,191.09 $2,191.09
Transmission $2,398.69 $2,289.66 $2,289.66 $2,398.69 $2,289.66 $2,289.66
Motor / Inverter - $767.58 $767.58 - $3,933.85 $3,933.85
Energy Storage - $1,918.95 $4,731.08 - $1,918.95 $24,423.00
Recharging Plug and Charger - - $662.91 - - $662.91
Total Powertrain Cost (post-retail markup) $6,107.49 $7,167.28 $10,642.32 $6,107.49 $10,333.55 $32,732.93
Other Costs
Glider [8] $15,282.51 $15,282.51 $15,282.51 $15,282.51 $15,282.51 $15,282.51
220V Dedicated Circuit Installation [9] - - $1,000.00 - - $1,000.00
State Sales Tax - Southern California [10] $2,139.00 $2,244.98 $2,692.48 $1,764.68 $2,113.32 $4,043.77
State Sales Tax - ECAR [11] $1,283.40 $1,346.99 $1,615.49 $1,176.45 $1,408.88 $2,695.85
Total Initial Purchase Cost [12]
Southern California $23,529.00 $24,694.76 $29,617.31 $23,154.68 $27,729.38 $53,059.20
Cleveland, Ohio $22,673.40 $23,796.77 $28,540.32 $22,566.45 $27,024.93 $51,711.28
Final Purchase Cost shown as NPV [13]
Southern California $20,284.18 $21,289.17 $25,532.87 $19,961.48 $23,905.29 $45,741.95
Cleveland, Ohio $19,546.57 $20,515.02 $24,604.40 $19,454.37 $23,298.00 $44,579.92

PHEV Value Proposition Study – Final Report Draft / July 2010 D-3
Table D - 2: Projected purchase prices for PHEVs in 2030 when Chapter 5’s sensitivity parameters for AER are applied, which range from 10 miles to 40 miles.
ICE HEV PHEV-30 PHEV-10 PHEV-20 PHEV-40
Base Vehicle Assumptions
Base MSRP [1] $21,390.00 - - - - -
Powertrain Costs
Pre-Retail Markup
Engine [2] $2,126.00 $1,256.00 $1,256.00 $1,256.00 $1,256.00 $1,256.00
Transmission [3] $1,375.00 $1,312.50 $1,312.50 $1,312.50 $1,312.50 $1,312.50
Motor / Inverter [4] - $440.00 $440.00 $440.00 $440.00 $440.00
Energy Storage [5] - $1,100.00 $2,712.00 $1,492.00 $1,930.00 $3,252.00
Recharging Plug / Charger [6] - - $380.00 $380.00 $380.00 $380.00
Total Powertrain Cost (pre-retail markup) $3,501.00 $4,108.50 $6,100.50 $4,880.50 $5,318.50 $6,640.50
Post-Retail Markup [7]
Engine $3,708.81 $2,191.09 $2,191.09 $2,191.09 $2,191.09 $2,191.09
Transmission $2,398.69 $2,289.66 $2,289.66 $2,289.66 $2,289.66 $2,289.66
Motor / Inverter - $767.58 $767.58 $767.58 $767.58 $767.58
Energy Storage - $1,918.95 $4,731.08 $2,602.79 $3,366.89 $5,673.11
Recharging Plug and Charger - - $662.91 $662.91 $662.91 $662.91
Total Powertrain Cost (post-retail markup) $6,107.49 $7,167.28 $10,642.32 $8,514.03 $9,278.12 $11,584.35
Other Costs
Glider [8] $15,282.51 $15,282.51 $15,282.51 $15,282.51 $15,282.51 $15,282.51
220V Dedicated Circuit Installation [9] - - $1,000.00 $1,000.00 $1,000.00 $1,000.00
State Sales Tax - Southern California [10] $2,139.00 $2,244.98 $2,692.48 $2,479.65 $2,556.06 $2,786.69
State Sales Tax - ECAR [11] $1,283.40 $1,346.99 $1,615.49 $1,487.79 $1,533.64 $1,672.01
Total Initial Purchase Cost [12]
Southern California $23,529.00 $24,694.76 $29,617.31 $27,276.19 $28,116.69 $30,653.54
Cleveland, Ohio $22,673.40 $23,796.77 $28,540.32 $26,284.33 $27,094.27 $29,538.87
Final Purchase Cost shown as NPV [13]
Southern California $20,284.18 $21,289.17 $25,532.87 $23,514.61 $24,239.19 $26,426.20
Cleveland, Ohio $19,546.57 $20,515.02 $24,604.40 $22,659.53 $23,357.77 $25,465.24
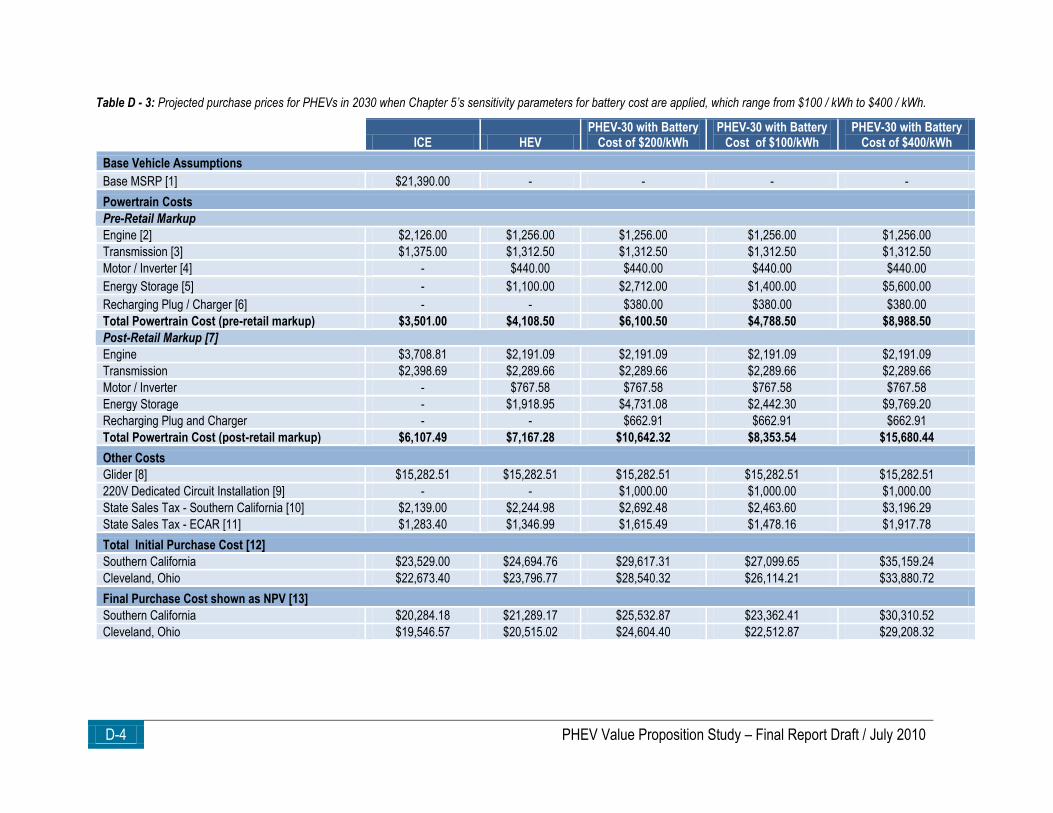
D-4 PHEV Value Proposition Study – Final Report Draft / July 2010
Table D - 3: Projected purchase prices for PHEVs in 2030 when Chapter 5’s sensitivity parameters for battery cost are applied, which range from $100 / kWh to $400 / kWh.
ICE HEV PHEV-30 with Battery
Cost of $200/kWh PHEV-30 with Battery
Cost of $100/kWh PHEV-30 with Battery
Cost of $400/kWh
Base Vehicle Assumptions
Base MSRP [1] $21,390.00 - - - -
Powertrain Costs
Pre-Retail Markup
Engine [2] $2,126.00 $1,256.00 $1,256.00 $1,256.00 $1,256.00
Transmission [3] $1,375.00 $1,312.50 $1,312.50 $1,312.50 $1,312.50
Motor / Inverter [4] - $440.00 $440.00 $440.00 $440.00
Energy Storage [5] - $1,100.00 $2,712.00 $1,400.00 $5,600.00
Recharging Plug / Charger [6] - - $380.00 $380.00 $380.00
Total Powertrain Cost (pre-retail markup) $3,501.00 $4,108.50 $6,100.50 $4,788.50 $8,988.50
Post-Retail Markup [7]
Engine $3,708.81 $2,191.09 $2,191.09 $2,191.09 $2,191.09
Transmission $2,398.69 $2,289.66 $2,289.66 $2,289.66 $2,289.66
Motor / Inverter - $767.58 $767.58 $767.58 $767.58
Energy Storage - $1,918.95 $4,731.08 $2,442.30 $9,769.20
Recharging Plug and Charger - - $662.91 $662.91 $662.91
Total Powertrain Cost (post-retail markup) $6,107.49 $7,167.28 $10,642.32 $8,353.54 $15,680.44
Other Costs
Glider [8] $15,282.51 $15,282.51 $15,282.51 $15,282.51 $15,282.51
220V Dedicated Circuit Installation [9] - - $1,000.00 $1,000.00 $1,000.00
State Sales Tax - Southern California [10] $2,139.00 $2,244.98 $2,692.48 $2,463.60 $3,196.29
State Sales Tax - ECAR [11] $1,283.40 $1,346.99 $1,615.49 $1,478.16 $1,917.78
Total Initial Purchase Cost [12]
Southern California $23,529.00 $24,694.76 $29,617.31 $27,099.65 $35,159.24
Cleveland, Ohio $22,673.40 $23,796.77 $28,540.32 $26,114.21 $33,880.72
Final Purchase Cost shown as NPV [13]
Southern California $20,284.18 $21,289.17 $25,532.87 $23,362.41 $30,310.52
Cleveland, Ohio $19,546.57 $20,515.02 $24,604.40 $22,512.87 $29,208.32

PHEV Value Proposition Study – Final Report Draft / July 2010 D-5
[1] Based on 2009 Toyota Camry SE, Toyota website.
[2] "$14.5 * engine kW + 531," National Renewable Energy Laboratory (NREL) /CP-540-40485, Nov 2006.
[3] "$12.5 * (motor kW + engine kW)," DOE FCVT Multi-year Program Plan, 2007. [4] DOE near term: "$41 * motor kW." DOE long term cost target: "$8 * motor kW" (for HEVs and PHEVs). The FCVT PHEV R&D Plan, Feb 2007. [5] DOE HEV cost target: "$20 * motor kW." PHEV current value: $1,000 * kWh; PHEV long term cost target: $200 * kWh. The FCVT PHEV R&D Plan, Feb 2007.
[6] Graham, R. et al. "Comparing the Benefits and Impacts of Hybrid Electric Vehicle Options." Electric Power Research Institute (EPRI), 2001.
[7] Assume a manufacturer's markup of 50% and a dealer's markup of 16.3%.
[8] Base MSRP minus ICE power train cost after retail markup and charging plug. NREL/CP-540-40485, Nov 2006. [9] Morrow, et al. "U.S. Department of Energy Vehicle Technologies Program - Advanced Vehicle Testing Activity: Plug-in Hybrid Electric Vehicle Charging Infrastructure Review." Nov 2008. INL/EXT-08-15058.
[10] California state sales tax is assumed to be 8.25% in 2010 and 10% in 2030.
[11] Ohio state sales tax is assumed to be 5.5% in 2010 and 6% in 2030.
[12] Sum of "Total Powertrain Cost (post-retail markup)" and "Other Costs" applicable to each region. [13] Incorporates Present Value of Money (assuming monthly payments for 5 years) / no down payment / 6% interest rate

D-6 PHEV Value Proposition Study – Final Report Draft / July 2010
This page intentionally left blank.

PHEV Value Proposition Study – Final Report Draft / July 2010 E-1
APPENDIX E. Fuel Consumption Calculations
Using PSAT, a combination of drive cycles was simulated for each vehicle type to determine how much liquid fuel and/or electricity was consumed. The drive cycles were based on commonly accepted standardized drive schedules. The cycles were combined to reflect typical driving habits, average commute time, and annual distance traveled for the southern California region.
Table E - 1: Characteristics of each individual EPA drive cycles incorporated into this study’s work, errand and weekend/vacation trips.
Table E - 2: Description of the work, errand, and weekend/vacation trips exercised by each vehicle type in this study.
Individual Trips
Trip Frequency Drive Cycle Combos
Subtrips Represents
Work Twice daily, 5 days/wk, 48 wk/yr
UDDS + US06 A Commute to work after full overnight charge (always); ALSO APPLICABLE FOR Commute home after fully charged at work (5% likelihood)
B Commute home after no recharging while at work (95% likelihood)
Errand 3 days/wk, 48 wk/yr
UDDS
A Evening round trip after fully recharged at home (15% likelihood)
B Evening round trip starting at same SOC as when returned from Trip 1 (85% likelihood) (recharged at work)
C Evening round trip starting at same SOC as when returned from Trip 1 (85% likelihood) (did not recharge at work)
Weekend / Vacation
124 days/yr
UDDS + HWFET + HWFET + HWFET + HWFET + UDDS
A Weekend round trips after full overnight charge (95% likelihood)
UDDS + HWFET + HWFET
B Weekend trip one way after a full recharge (5% likelihood)
Individual EPA Drive Cycles Used
Length (sec) Distance (mi) Avg Speed (mph)
UDDS 1,369 7.45 19.59
US06 596 8.01 48.37
HWFET 765 10.26 48.30
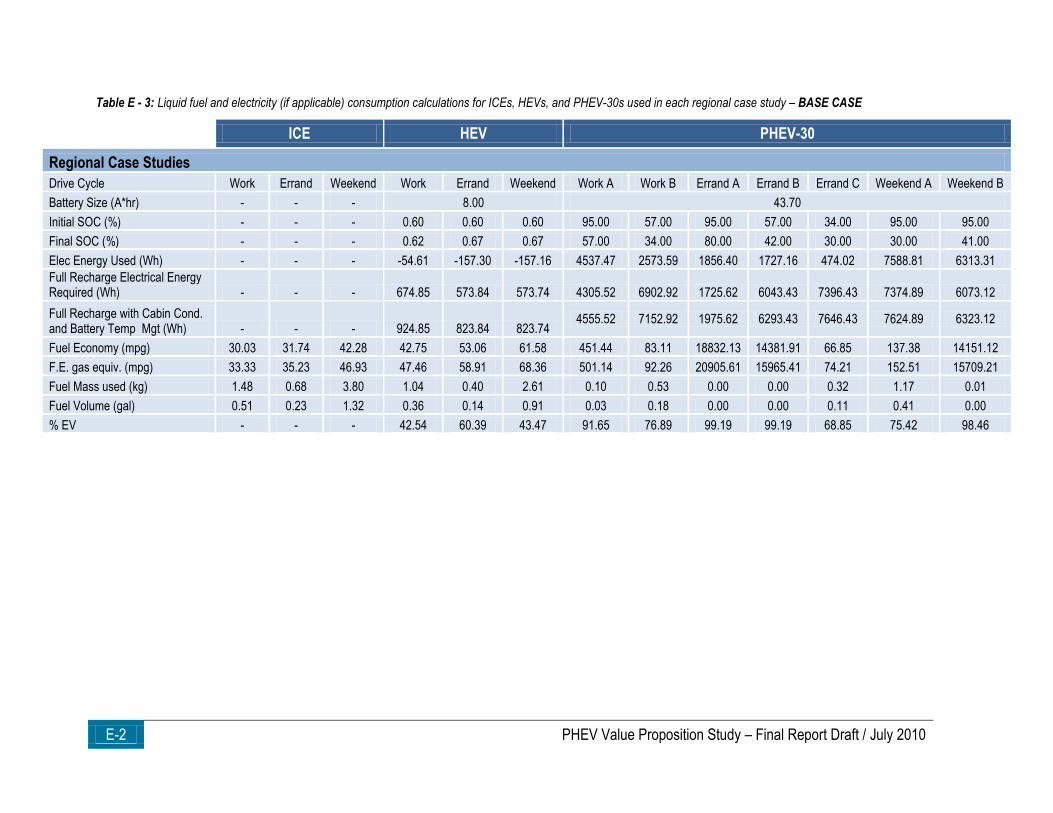
E-2 PHEV Value Proposition Study – Final Report Draft / July 2010
Table E - 3: Liquid fuel and electricity (if applicable) consumption calculations for ICEs, HEVs, and PHEV-30s used in each regional case study – BASE CASE
ICE HEV PHEV-30
Regional Case Studies
Drive Cycle Work Errand Weekend Work Errand Weekend Work A Work B Errand A Errand B Errand C Weekend A Weekend B
Battery Size (A*hr) - - - 8.00 43.70
Initial SOC (%) - - - 0.60 0.60 0.60 95.00 57.00 95.00 57.00 34.00 95.00 95.00
Final SOC (%) - - - 0.62 0.67 0.67 57.00 34.00 80.00 42.00 30.00 30.00 41.00
Elec Energy Used (Wh) - - - -54.61 -157.30 -157.16 4537.47 2573.59 1856.40 1727.16 474.02 7588.81 6313.31
Full Recharge Electrical Energy Required (Wh) - - - 674.85 573.84 573.74 4305.52 6902.92 1725.62 6043.43 7396.43 7374.89 6073.12
Full Recharge with Cabin Cond. and Battery Temp Mgt (Wh) - - - 924.85 823.84 823.74
4555.52 7152.92 1975.62 6293.43 7646.43 7624.89 6323.12
Fuel Economy (mpg) 30.03 31.74 42.28 42.75 53.06 61.58 451.44 83.11 18832.13 14381.91 66.85 137.38 14151.12
F.E. gas equiv. (mpg) 33.33 35.23 46.93 47.46 58.91 68.36 501.14 92.26 20905.61 15965.41 74.21 152.51 15709.21
Fuel Mass used (kg) 1.48 0.68 3.80 1.04 0.40 2.61 0.10 0.53 0.00 0.00 0.32 1.17 0.01
Fuel Volume (gal) 0.51 0.23 1.32 0.36 0.14 0.91 0.03 0.18 0.00 0.00 0.11 0.41 0.00
% EV - - - 42.54 60.39 43.47 91.65 76.89 99.19 99.19 68.85 75.42 98.46

PHEV Value Proposition Study – Final Report Draft / July 2010 E-3
Table E - 4: Liquid fuel and electricity cost calculations based on consumption rates – BASE CASE
Total Liquid Fuel Consumed Total Electricity
Consumed
ICE HEV PHEV-30 PHEV-30
Regional Case Studies
Annual Fuel Consumption
Work (gal or kWh) 246.24 173.00 48.77 1,730.22
Errand (gal or kWh) 33.81 20.14 12.84 105.34
Weekend (gal or kWh) 163.98 112.46 48.32 972.25
Total (gal or kWh) 444.03 305.60 109.93 2,807.80
Total (bbl crude oil eq) 16.09 11.07 3.98 -
Vehicle Lifetime Fuel Consumption
Total (gal or kWh) 4440.29 3055.96 1099.30 28,078.03
Total (bbl crude oil eq) 160.88 110.72 39.83 -
Total Imported (bbl crude oil eq) 96.53 66.43 23.90 -
Crude Oil (Imported) Comparison Between Vehicle Types
Relative to ICE (bbl) - 30.09 72.63 -
Relative to HEV (bbl) - - 42.54 -
Liquid Fuel and Electricity Cost Southern CA ECAR /
Cleveland Southern CA ECAR /
Cleveland Southern CA ECAR /
Cleveland Southern CA ECAR /
Cleveland
Annual Cost $1,998.13 $1,887.12 $1,375.18 $1,298.78 $494.68 $467.20 $513.83 $247.09
Lifetime Cost $19,981.30 $18,871.23 $13,751.82 $12,987.83 $4,946.84 $4,672.01 $5,138.28 $2,470.87
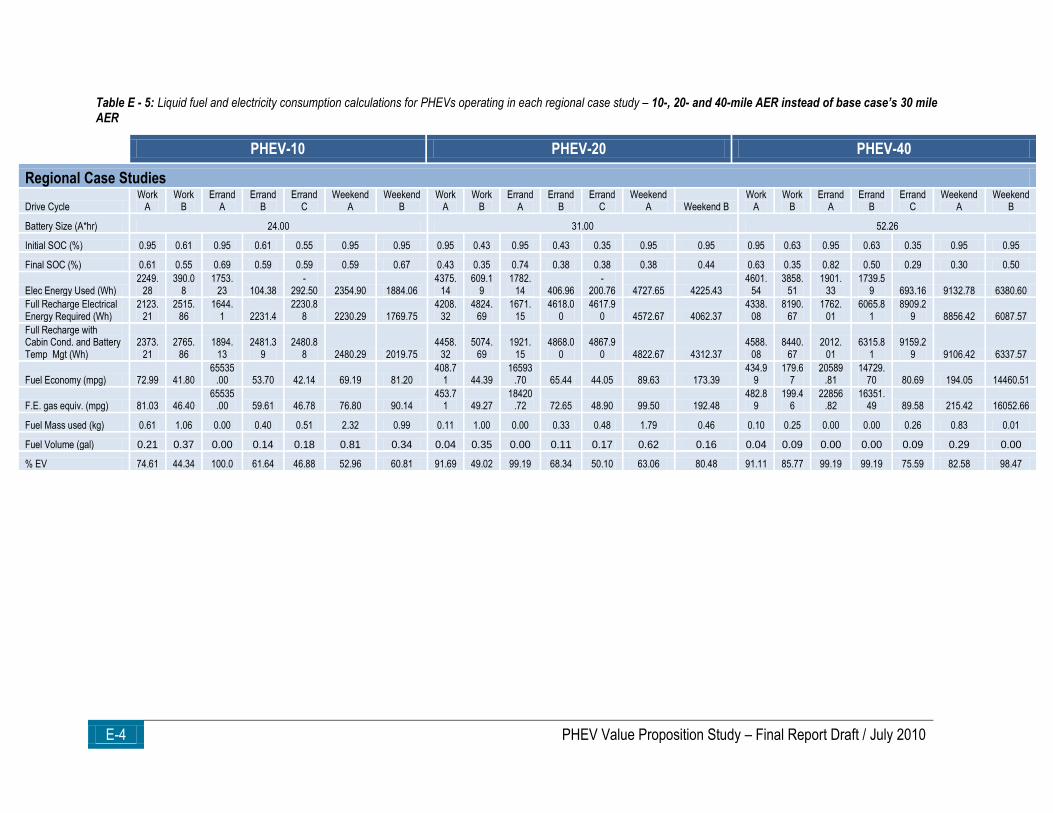
E-4 PHEV Value Proposition Study – Final Report Draft / July 2010
Table E - 5: Liquid fuel and electricity consumption calculations for PHEVs operating in each regional case study – 10-, 20- and 40-mile AER instead of base case’s 30 mile AER
PHEV-10 PHEV-20 PHEV-40
Regional Case Studies
Drive Cycle Work
A Work
B Errand
A Errand
B Errand
C Weekend
A Weekend
B Work
A Work
B Errand
A Errand
B Errand
C Weekend
A Weekend B Work
A Work
B Errand
A Errand
B Errand
C Weekend
A Weekend
B
Battery Size (A*hr) 24.00 31.00 52.26
Initial SOC (%) 0.95 0.61 0.95 0.61 0.55 0.95 0.95 0.95 0.43 0.95 0.43 0.35 0.95 0.95 0.95 0.63 0.95 0.63 0.35 0.95 0.95
Final SOC (%) 0.61 0.55 0.69 0.59 0.59 0.59 0.67 0.43 0.35 0.74 0.38 0.38 0.38 0.44 0.63 0.35 0.82 0.50 0.29 0.30 0.50
Elec Energy Used (Wh) 2249.
28 390.0
8 1753.
23 104.38 -
292.50 2354.90 1884.06 4375.
14 609.1
9 1782.
14 406.96 -
200.76 4727.65 4225.43 4601.
54 3858.
51 1901.
33 1739.5
9 693.16 9132.78 6380.60
Full Recharge Electrical Energy Required (Wh)
2123.21
2515.86
1644.1 2231.4
2230.88 2230.29 1769.75
4208.32
4824.69
1671.15
4618.00
4617.90 4572.67 4062.37
4338.08
8190.67
1762.01
6065.81
8909.29 8856.42 6087.57
Full Recharge with Cabin Cond. and Battery Temp Mgt (Wh)
2373.21
2765.86
1894.13
2481.39
2480.88 2480.29 2019.75
4458.32
5074.69
1921.15
4868.00
4867.90 4822.67 4312.37
4588.08
8440.67
2012.01
6315.81
9159.29 9106.42 6337.57
Fuel Economy (mpg) 72.99 41.80 65535
.00 53.70 42.14 69.19 81.20 408.7
1 44.39 16593
.70 65.44 44.05 89.63 173.39 434.9
9 179.6
7 20589
.81 14729.
70 80.69 194.05 14460.51
F.E. gas equiv. (mpg) 81.03 46.40 65535
.00 59.61 46.78 76.80 90.14 453.7
1 49.27 18420
.72 72.65 48.90 99.50 192.48 482.8
9 199.4
6 22856
.82 16351.
49 89.58 215.42 16052.66
Fuel Mass used (kg) 0.61 1.06 0.00 0.40 0.51 2.32 0.99 0.11 1.00 0.00 0.33 0.48 1.79 0.46 0.10 0.25 0.00 0.00 0.26 0.83 0.01
Fuel Volume (gal) 0.21 0.37 0.00 0.14 0.18 0.81 0.34 0.04 0.35 0.00 0.11 0.17 0.62 0.16 0.04 0.09 0.00 0.00 0.09 0.29 0.00
% EV 74.61 44.34 100.0 61.64 46.88 52.96 60.81 91.69 49.02 99.19 68.34 50.10 63.06 80.48 91.11 85.77 99.19 99.19 75.59 82.58 98.47
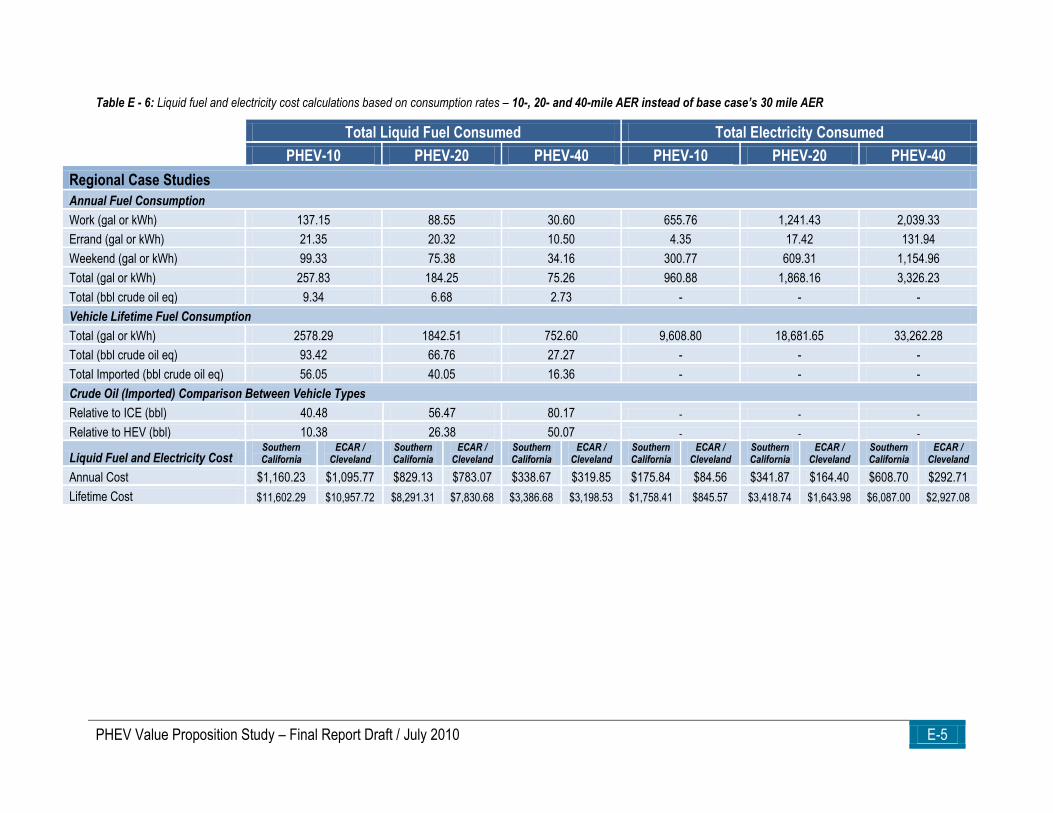
PHEV Value Proposition Study – Final Report Draft / July 2010 E-5
Table E - 6: Liquid fuel and electricity cost calculations based on consumption rates – 10-, 20- and 40-mile AER instead of base case’s 30 mile AER
Total Liquid Fuel Consumed Total Electricity Consumed
PHEV-10 PHEV-20 PHEV-40 PHEV-10 PHEV-20 PHEV-40
Regional Case Studies
Annual Fuel Consumption
Work (gal or kWh) 137.15 88.55 30.60 655.76 1,241.43 2,039.33
Errand (gal or kWh) 21.35 20.32 10.50 4.35 17.42 131.94
Weekend (gal or kWh) 99.33 75.38 34.16 300.77 609.31 1,154.96
Total (gal or kWh) 257.83 184.25 75.26 960.88 1,868.16 3,326.23
Total (bbl crude oil eq) 9.34 6.68 2.73 - - -
Vehicle Lifetime Fuel Consumption
Total (gal or kWh) 2578.29 1842.51 752.60 9,608.80 18,681.65 33,262.28
Total (bbl crude oil eq) 93.42 66.76 27.27 - - -
Total Imported (bbl crude oil eq) 56.05 40.05 16.36 - - -
Crude Oil (Imported) Comparison Between Vehicle Types
Relative to ICE (bbl) 40.48 56.47 80.17 - - -
Relative to HEV (bbl) 10.38 26.38 50.07 - - -
Liquid Fuel and Electricity Cost Southern California
ECAR / Cleveland
Southern California
ECAR / Cleveland
Southern California
ECAR / Cleveland
Southern California
ECAR / Cleveland
Southern California
ECAR / Cleveland
Southern California
ECAR / Cleveland
Annual Cost $1,160.23 $1,095.77 $829.13 $783.07 $338.67 $319.85 $175.84 $84.56 $341.87 $164.40 $608.70 $292.71
Lifetime Cost $11,602.29 $10,957.72 $8,291.31 $7,830.68 $3,386.68 $3,198.53 $1,758.41 $845.57 $3,418.74 $1,643.98 $6,087.00 $2,927.08

E-6 PHEV Value Proposition Study – Final Report Draft / July 2010
Table E - 7: Liquid fuel and electricity (if applicable) consumption calculations for ICEs, HEVs, and PHEV-30s used in each regional case study – E85 blend substituted for base case’s 70/30 split of E10 and E85
ICE HEV PHEV-30
Regional Case Studies
Drive Cycle Work Errand Weekend Work Errand Weekend Work A Work B Errand A Errand B Errand C Weekend A Weekend B
Battery Size (A*hr) - - - 8.00 43.70
Initial SOC (%) - - - 0.60 0.60 0.60 0.95 0.57 0.95 0.95 0.57 0.95 0.95
Final SOC (%) - - - 0.62 0.67 0.67 0.57 0.34 0.80 0.57 0.34 0.80 0.57
Elec Energy Used (Wh) - - - -53.64 -157.16 -156.80 4549.31 2589.66 1864.75 4549.31 2589.66 1864.75 4549.31
Full Recharge Electrical Energy Required (Wh) - - - 675.52 573.77 573.74 4308.88 6904.75 1726.50 4308.88 6904.75 1726.50 4308.88
Full Recharge with Cabin Cond. and Battery Temp Mgt (Wh) - - - 925.52 823.77 823.74 4558.88 7154.75 1976.50 4558.88 7154.75 1976.50 4558.88
Fuel Economy (mpg) 24.21 25.59 34.09 34.47 42.78 49.65 361.19 67.04 15264.84 361.19 67.04 15264.84 361.19
F.E. gas equiv. (mpg) 33.32 35.22 46.92 47.44 58.87 68.33 497.06 92.26 21006.92 497.06 92.26 21006.92 497.06
Fuel Mass used (kg) 1.89 0.87 4.88 1.33 0.52 3.35 0.13 0.68 0.00 0.13 0.68 0.00 0.13
Fuel Volume (gal) 0.64 0.29 1.64 0.45 0.17 1.12 0.04 0.23 0.00 0.00 0.14 0.50 0.00
% EV - - - 42.54 60.39 43.47 91.67 76.90 99.19 91.67 76.90 99.19 91.67
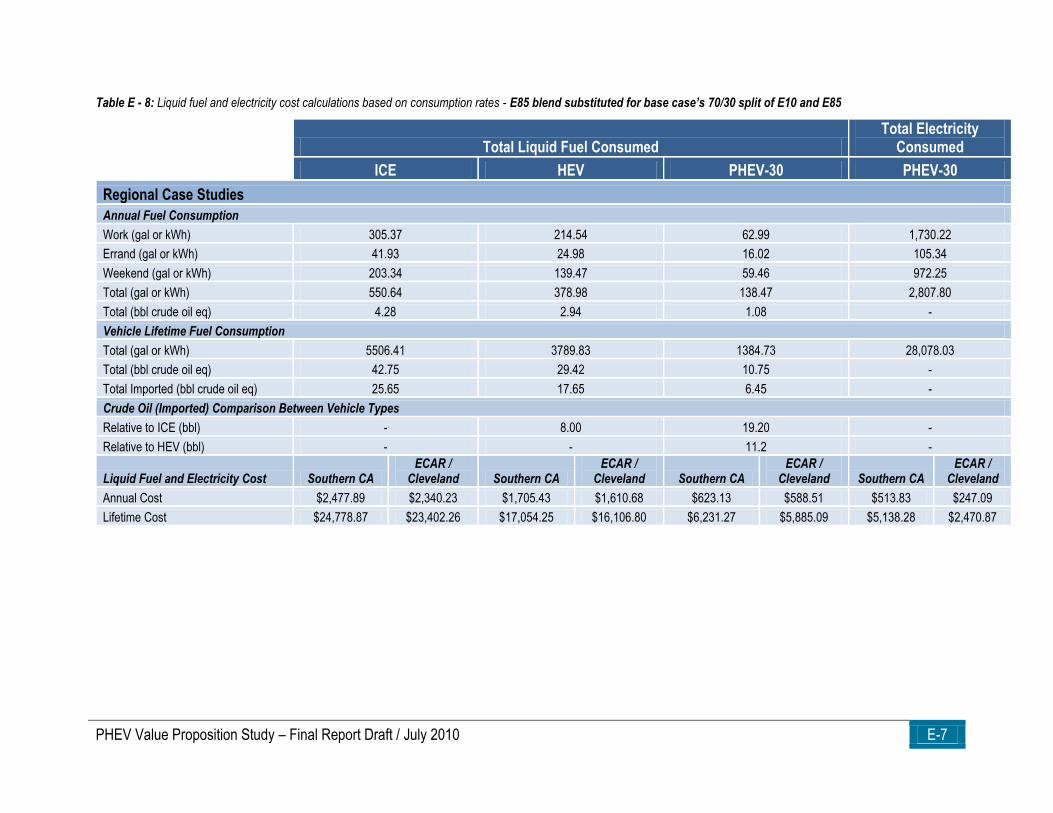
PHEV Value Proposition Study – Final Report Draft / July 2010 E-7
Table E - 8: Liquid fuel and electricity cost calculations based on consumption rates - E85 blend substituted for base case’s 70/30 split of E10 and E85
Total Liquid Fuel Consumed Total Electricity
Consumed
ICE HEV PHEV-30 PHEV-30
Regional Case Studies
Annual Fuel Consumption
Work (gal or kWh) 305.37 214.54 62.99 1,730.22
Errand (gal or kWh) 41.93 24.98 16.02 105.34
Weekend (gal or kWh) 203.34 139.47 59.46 972.25
Total (gal or kWh) 550.64 378.98 138.47 2,807.80
Total (bbl crude oil eq) 4.28 2.94 1.08 -
Vehicle Lifetime Fuel Consumption
Total (gal or kWh) 5506.41 3789.83 1384.73 28,078.03
Total (bbl crude oil eq) 42.75 29.42 10.75 -
Total Imported (bbl crude oil eq) 25.65 17.65 6.45 -
Crude Oil (Imported) Comparison Between Vehicle Types
Relative to ICE (bbl) - 8.00 19.20 -
Relative to HEV (bbl) - - 11.2 -
Liquid Fuel and Electricity Cost Southern CA ECAR /
Cleveland Southern CA ECAR /
Cleveland Southern CA ECAR /
Cleveland Southern CA ECAR /
Cleveland
Annual Cost $2,477.89 $2,340.23 $1,705.43 $1,610.68 $623.13 $588.51 $513.83 $247.09
Lifetime Cost $24,778.87 $23,402.26 $17,054.25 $16,106.80 $6,231.27 $5,885.09 $5,138.28 $2,470.87
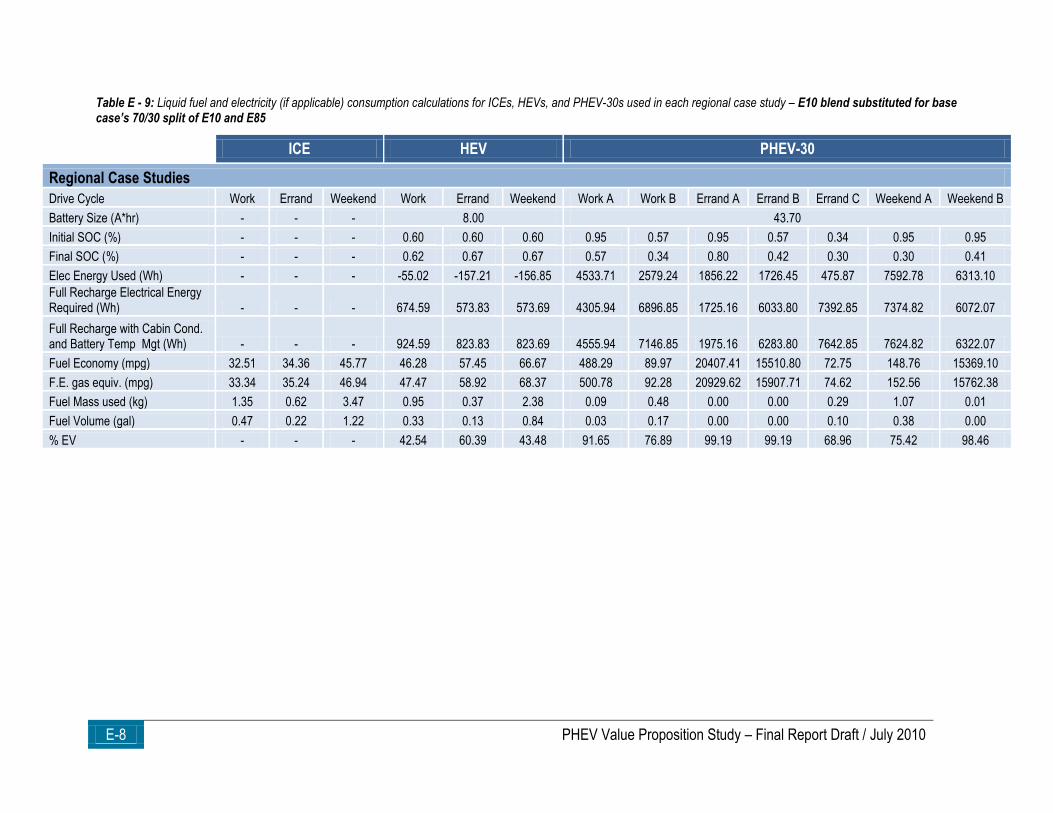
E-8 PHEV Value Proposition Study – Final Report Draft / July 2010
Table E - 9: Liquid fuel and electricity (if applicable) consumption calculations for ICEs, HEVs, and PHEV-30s used in each regional case study – E10 blend substituted for base case’s 70/30 split of E10 and E85
ICE HEV PHEV-30
Regional Case Studies
Drive Cycle Work Errand Weekend Work Errand Weekend Work A Work B Errand A Errand B Errand C Weekend A Weekend B
Battery Size (A*hr) - - - 8.00 43.70
Initial SOC (%) - - - 0.60 0.60 0.60 0.95 0.57 0.95 0.57 0.34 0.95 0.95
Final SOC (%) - - - 0.62 0.67 0.67 0.57 0.34 0.80 0.42 0.30 0.30 0.41
Elec Energy Used (Wh) - - - -55.02 -157.21 -156.85 4533.71 2579.24 1856.22 1726.45 475.87 7592.78 6313.10
Full Recharge Electrical Energy Required (Wh) - - - 674.59 573.83 573.69 4305.94 6896.85 1725.16 6033.80 7392.85 7374.82 6072.07
Full Recharge with Cabin Cond. and Battery Temp Mgt (Wh) - - - 924.59 823.83 823.69 4555.94 7146.85 1975.16 6283.80 7642.85 7624.82 6322.07
Fuel Economy (mpg) 32.51 34.36 45.77 46.28 57.45 66.67 488.29 89.97 20407.41 15510.80 72.75 148.76 15369.10
F.E. gas equiv. (mpg) 33.34 35.24 46.94 47.47 58.92 68.37 500.78 92.28 20929.62 15907.71 74.62 152.56 15762.38
Fuel Mass used (kg) 1.35 0.62 3.47 0.95 0.37 2.38 0.09 0.48 0.00 0.00 0.29 1.07 0.01
Fuel Volume (gal) 0.47 0.22 1.22 0.33 0.13 0.84 0.03 0.17 0.00 0.00 0.10 0.38 0.00
% EV - - - 42.54 60.39 43.48 91.65 76.89 99.19 99.19 68.96 75.42 98.46
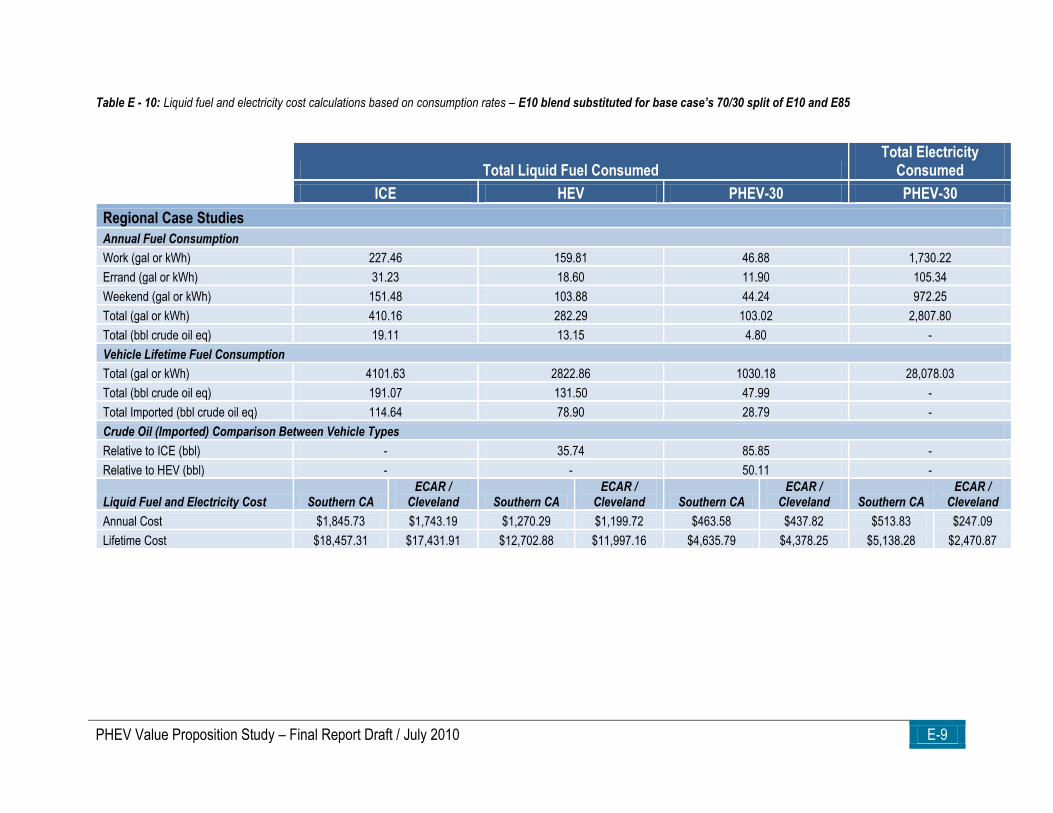
PHEV Value Proposition Study – Final Report Draft / July 2010 E-9
Table E - 10: Liquid fuel and electricity cost calculations based on consumption rates – E10 blend substituted for base case’s 70/30 split of E10 and E85
Total Liquid Fuel Consumed Total Electricity
Consumed
ICE HEV PHEV-30 PHEV-30
Regional Case Studies
Annual Fuel Consumption
Work (gal or kWh) 227.46 159.81 46.88 1,730.22
Errand (gal or kWh) 31.23 18.60 11.90 105.34
Weekend (gal or kWh) 151.48 103.88 44.24 972.25
Total (gal or kWh) 410.16 282.29 103.02 2,807.80
Total (bbl crude oil eq) 19.11 13.15 4.80 -
Vehicle Lifetime Fuel Consumption
Total (gal or kWh) 4101.63 2822.86 1030.18 28,078.03
Total (bbl crude oil eq) 191.07 131.50 47.99 -
Total Imported (bbl crude oil eq) 114.64 78.90 28.79 -
Crude Oil (Imported) Comparison Between Vehicle Types
Relative to ICE (bbl) - 35.74 85.85 -
Relative to HEV (bbl) - - 50.11 -
Liquid Fuel and Electricity Cost Southern CA ECAR /
Cleveland Southern CA ECAR /
Cleveland Southern CA ECAR /
Cleveland Southern CA ECAR /
Cleveland
Annual Cost $1,845.73 $1,743.19 $1,270.29 $1,199.72 $463.58 $437.82 $513.83 $247.09
Lifetime Cost $18,457.31 $17,431.91 $12,702.88 $11,997.16 $4,635.79 $4,378.25 $5,138.28 $2,470.87
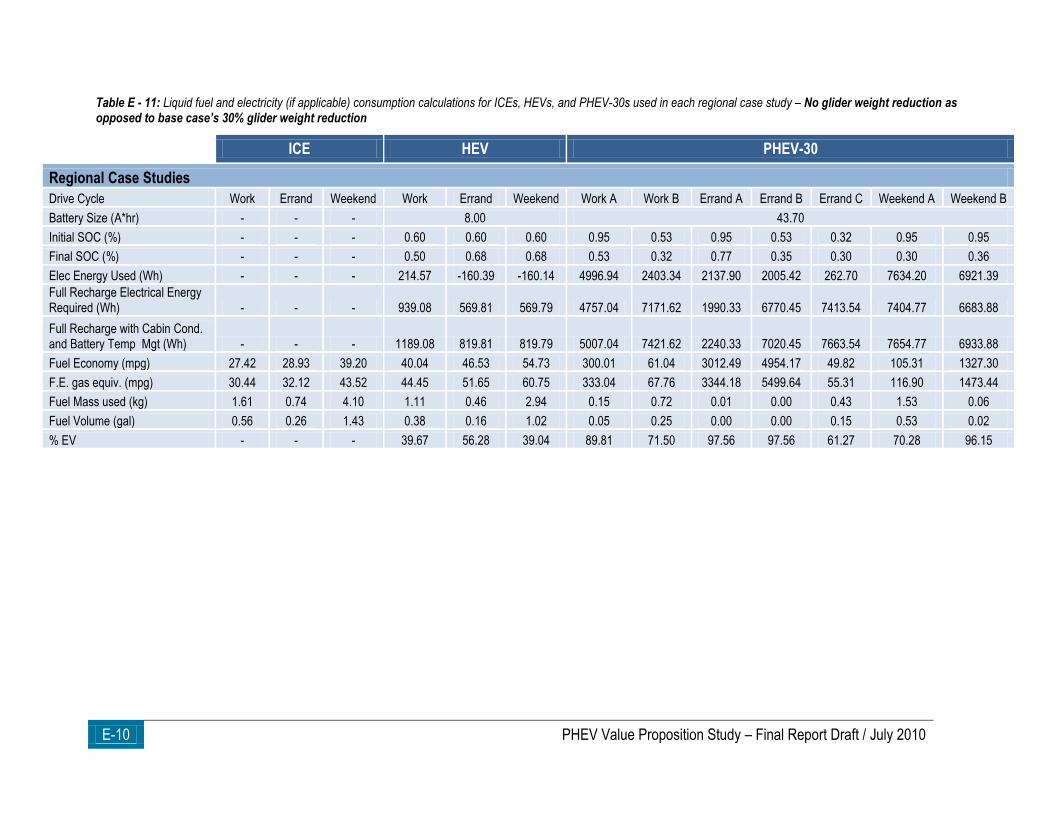
E-10 PHEV Value Proposition Study – Final Report Draft / July 2010
Table E - 11: Liquid fuel and electricity (if applicable) consumption calculations for ICEs, HEVs, and PHEV-30s used in each regional case study – No glider weight reduction as opposed to base case’s 30% glider weight reduction
ICE HEV PHEV-30
Regional Case Studies
Drive Cycle Work Errand Weekend Work Errand Weekend Work A Work B Errand A Errand B Errand C Weekend A Weekend B
Battery Size (A*hr) - - - 8.00 43.70
Initial SOC (%) - - - 0.60 0.60 0.60 0.95 0.53 0.95 0.53 0.32 0.95 0.95
Final SOC (%) - - - 0.50 0.68 0.68 0.53 0.32 0.77 0.35 0.30 0.30 0.36
Elec Energy Used (Wh) - - - 214.57 -160.39 -160.14 4996.94 2403.34 2137.90 2005.42 262.70 7634.20 6921.39
Full Recharge Electrical Energy Required (Wh) - - - 939.08 569.81 569.79 4757.04 7171.62 1990.33 6770.45 7413.54 7404.77 6683.88
Full Recharge with Cabin Cond. and Battery Temp Mgt (Wh) - - - 1189.08 819.81 819.79 5007.04 7421.62 2240.33 7020.45 7663.54 7654.77 6933.88
Fuel Economy (mpg) 27.42 28.93 39.20 40.04 46.53 54.73 300.01 61.04 3012.49 4954.17 49.82 105.31 1327.30
F.E. gas equiv. (mpg) 30.44 32.12 43.52 44.45 51.65 60.75 333.04 67.76 3344.18 5499.64 55.31 116.90 1473.44
Fuel Mass used (kg) 1.61 0.74 4.10 1.11 0.46 2.94 0.15 0.72 0.01 0.00 0.43 1.53 0.06
Fuel Volume (gal) 0.56 0.26 1.43 0.38 0.16 1.02 0.05 0.25 0.00 0.00 0.15 0.53 0.02
% EV - - - 39.67 56.28 39.04 89.81 71.50 97.56 97.56 61.27 70.28 96.15
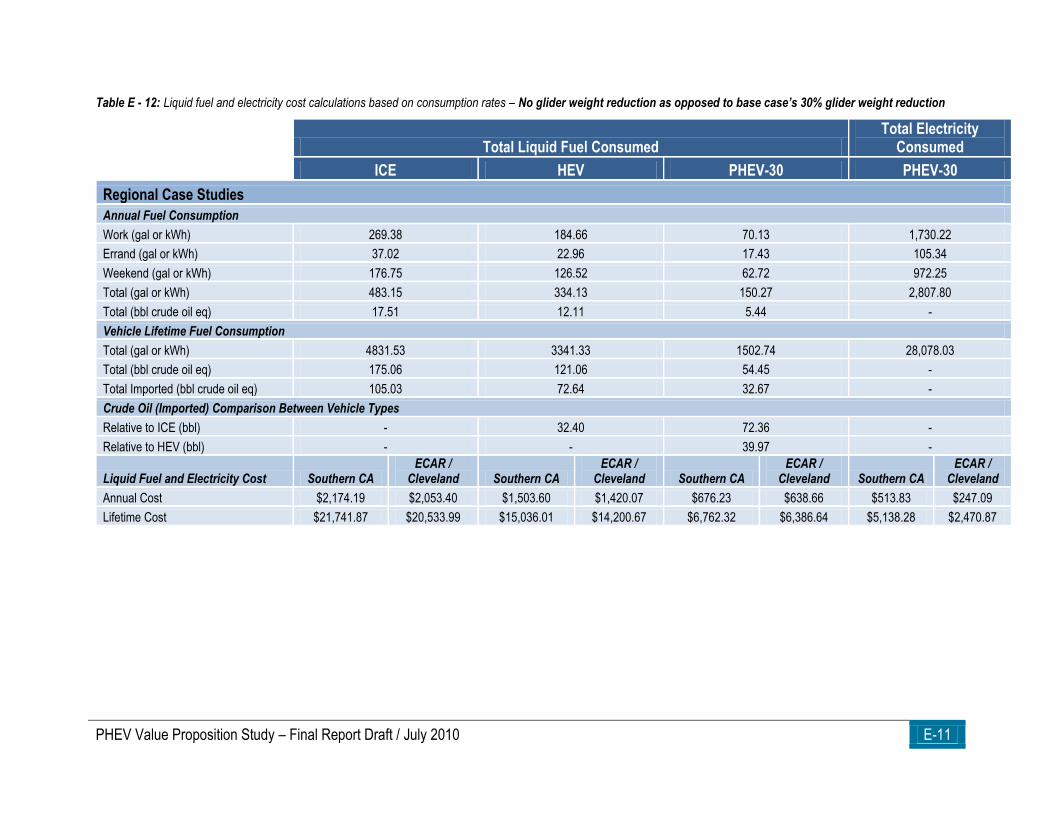
PHEV Value Proposition Study – Final Report Draft / July 2010 E-11
Table E - 12: Liquid fuel and electricity cost calculations based on consumption rates – No glider weight reduction as opposed to base case’s 30% glider weight reduction
Total Liquid Fuel Consumed Total Electricity
Consumed
ICE HEV PHEV-30 PHEV-30
Regional Case Studies
Annual Fuel Consumption
Work (gal or kWh) 269.38 184.66 70.13 1,730.22
Errand (gal or kWh) 37.02 22.96 17.43 105.34
Weekend (gal or kWh) 176.75 126.52 62.72 972.25
Total (gal or kWh) 483.15 334.13 150.27 2,807.80
Total (bbl crude oil eq) 17.51 12.11 5.44 -
Vehicle Lifetime Fuel Consumption
Total (gal or kWh) 4831.53 3341.33 1502.74 28,078.03
Total (bbl crude oil eq) 175.06 121.06 54.45 -
Total Imported (bbl crude oil eq) 105.03 72.64 32.67 -
Crude Oil (Imported) Comparison Between Vehicle Types
Relative to ICE (bbl) - 32.40 72.36 -
Relative to HEV (bbl) - - 39.97 -
Liquid Fuel and Electricity Cost Southern CA ECAR /
Cleveland Southern CA ECAR /
Cleveland Southern CA ECAR /
Cleveland Southern CA ECAR /
Cleveland
Annual Cost $2,174.19 $2,053.40 $1,503.60 $1,420.07 $676.23 $638.66 $513.83 $247.09
Lifetime Cost $21,741.87 $20,533.99 $15,036.01 $14,200.67 $6,762.32 $6,386.64 $5,138.28 $2,470.87

E-12 PHEV Value Proposition Study – Final Report Draft / July 2010
Table E - 13: Liquid fuel and electricity (if applicable) consumption calculations for ICEs, HEVs, and PHEV-30s used in each regional case study – 45% glider weight reduction as opposed to base case’s 30% glider weight reduction
ICE HEV PHEV-30
Regional Case Studies
Drive Cycle Work Errand Weekend Work Errand Weekend Work A Work B Errand A Errand B Errand C Weekend A Weekend B
Battery Size (A*hr) - - - 8.00 43.70
Initial SOC (%) - - - 0.60 0.60 0.60 0.95 0.59 0.95 0.59 0.34 0.95 0.95
Final SOC (%) - - - 0.64 0.67 0.67 0.59 0.34 0.81 0.45 0.30 0.30 0.45
Elec Energy Used (Wh) - - - -81.53 -155.49 -154.45 4294.69 2823.49 1734.98 1616.44 486.17 7611.71 5942.73
Full Recharge Electrical Energy Required (Wh) - - - 646.53 575.10 575.06 4060.50 6885.41 1608.19 5665.13 7374.77 7389.77 5701.12
Full Recharge with Cabin Cond. and Battery Temp Mgt (Wh) - - - 896.53 825.10 825.06 4310.50 7135.41 1858.19 5915.13 7624.77 7639.77 5951.12
Fuel Economy (mpg) 32.02 33.18 43.91 45.93 56.69 65.22 567.80 111.02 7726.53 7784.97 73.56 162.27 15422.01
F.E. gas equiv. (mpg) 35.55 36.83 48.75 50.99 62.94 72.41 630.31 123.24 8577.25 8642.12 81.66 180.14 17120.02
Fuel Mass used (kg) 1.39 0.65 3.66 0.97 0.38 2.46 0.08 0.40 0.00 0.00 0.29 0.99 0.01
Fuel Volume (gal) 0.48 0.22 1.27 0.34 0.13 0.86 0.03 0.14 0.00 0.00 0.10 0.34 0.48
% EV - - - 45.94 61.27 45.13 92.14 82.56 98.37 98.38 69.91 78.53 98.47

PHEV Value Proposition Study – Final Report Draft / July 2010 E-13
Table E - 14: Liquid fuel and electricity cost calculations based on consumption rates – 45% glider weight reduction as opposed to base case’s 30% glider weight reduction
Total Liquid Fuel Consumed Total Electricity
Consumed
ICE HEV PHEV-30 PHEV-30
Regional Case Studies
Annual Fuel Consumption
Work (gal or kWh) 231.12 161.10 38.41 1,730.22
Errand (gal or kWh) 32.36 18.86 11.80 105.34
Weekend (gal or kWh) 157.90 106.19 40.56 972.25
Total (gal or kWh) 421.38 286.14 90.76 2,807.80
Total (bbl crude oil eq) 15.27 10.37 3.29 -
Vehicle Lifetime Fuel Consumption
Total (gal or kWh) 4213.81 2861.41 907.64 28,078.03
Total (bbl crude oil eq) 152.67 103.67 32.89 -
Total Imported (bbl crude oil eq) 91.60 62.20 19.73 -
Crude Oil (Imported) Comparison Between Vehicle Types
Relative to ICE (bbl) - 29.40 71.87 -
Relative to HEV (bbl) - - 42.47 -
Liquid Fuel and Electricity Cost Southern CA ECAR /
Cleveland Southern CA ECAR /
Cleveland Southern CA ECAR /
Cleveland Southern CA ECAR /
Cleveland
Annual Cost $1,896.21 $1,790.87 $1,287.63 $1,216.10 $408.44 $385.75 $513.83 $247.09
Lifetime Cost $18,962.12 $17,908.67 $12,876.34 $12,160.99 $4,084.38 $3,857.47 $5,138.28 $2,470.87
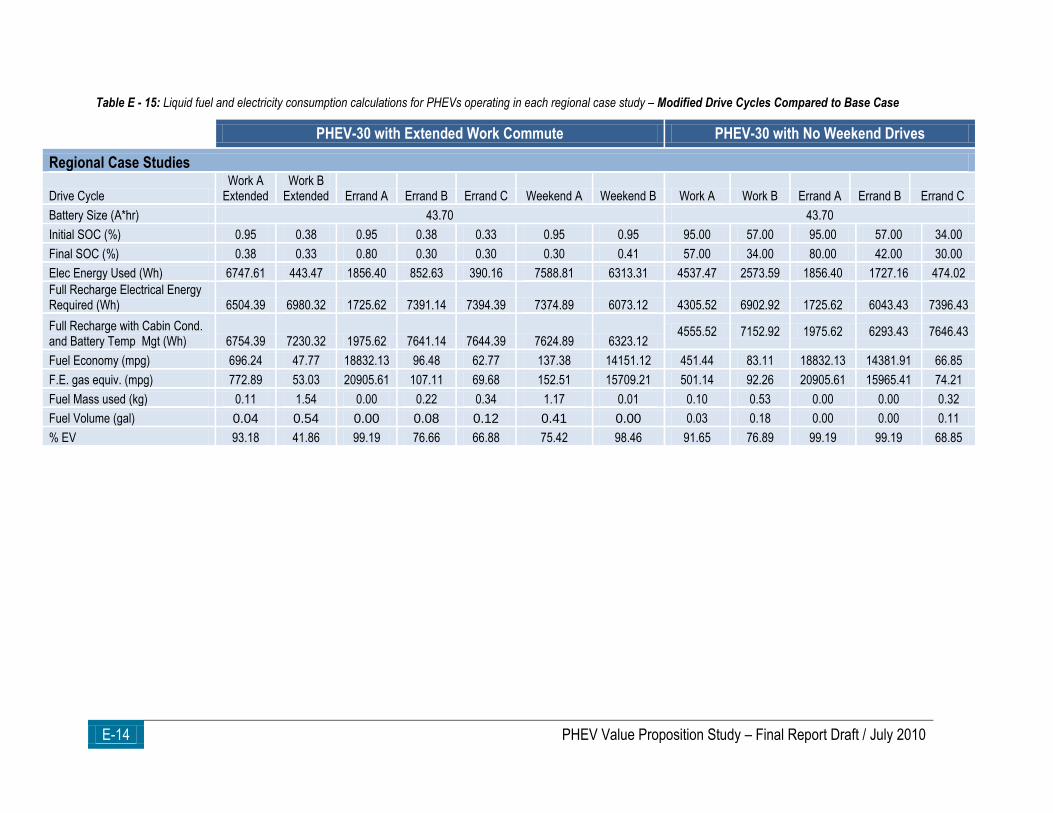
E-14 PHEV Value Proposition Study – Final Report Draft / July 2010
Table E - 15: Liquid fuel and electricity consumption calculations for PHEVs operating in each regional case study – Modified Drive Cycles Compared to Base Case
PHEV-30 with Extended Work Commute PHEV-30 with No Weekend Drives
Regional Case Studies
Drive Cycle Work A
Extended Work B
Extended Errand A Errand B Errand C Weekend A Weekend B Work A Work B Errand A Errand B Errand C
Battery Size (A*hr) 43.70 43.70
Initial SOC (%) 0.95 0.38 0.95 0.38 0.33 0.95 0.95 95.00 57.00 95.00 57.00 34.00
Final SOC (%) 0.38 0.33 0.80 0.30 0.30 0.30 0.41 57.00 34.00 80.00 42.00 30.00
Elec Energy Used (Wh) 6747.61 443.47 1856.40 852.63 390.16 7588.81 6313.31 4537.47 2573.59 1856.40 1727.16 474.02
Full Recharge Electrical Energy Required (Wh) 6504.39 6980.32 1725.62 7391.14 7394.39 7374.89 6073.12 4305.52 6902.92 1725.62 6043.43 7396.43
Full Recharge with Cabin Cond. and Battery Temp Mgt (Wh) 6754.39 7230.32 1975.62 7641.14 7644.39 7624.89 6323.12
4555.52 7152.92 1975.62 6293.43 7646.43
Fuel Economy (mpg) 696.24 47.77 18832.13 96.48 62.77 137.38 14151.12 451.44 83.11 18832.13 14381.91 66.85
F.E. gas equiv. (mpg) 772.89 53.03 20905.61 107.11 69.68 152.51 15709.21 501.14 92.26 20905.61 15965.41 74.21
Fuel Mass used (kg) 0.11 1.54 0.00 0.22 0.34 1.17 0.01 0.10 0.53 0.00 0.00 0.32
Fuel Volume (gal) 0.04 0.54 0.00 0.08 0.12 0.41 0.00 0.03 0.18 0.00 0.00 0.11
% EV 93.18 41.86 99.19 76.66 66.88 75.42 98.46 91.65 76.89 99.19 99.19 68.85
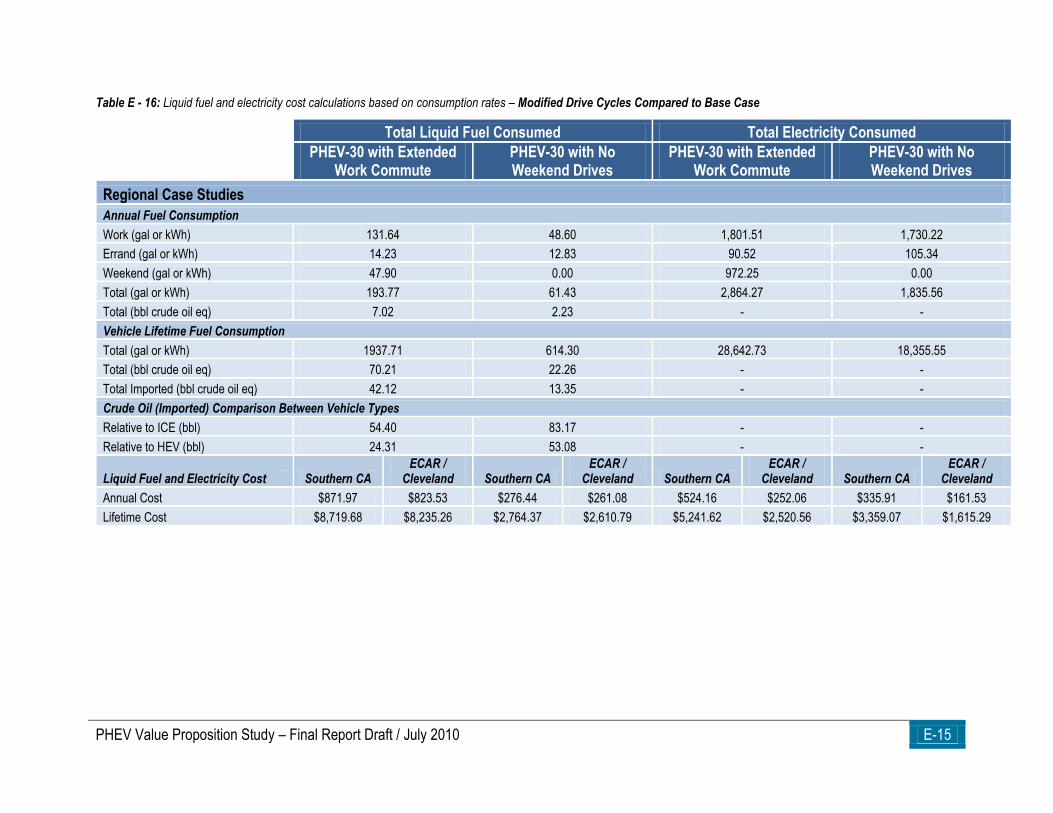
PHEV Value Proposition Study – Final Report Draft / July 2010 E-15
Table E - 16: Liquid fuel and electricity cost calculations based on consumption rates – Modified Drive Cycles Compared to Base Case
Total Liquid Fuel Consumed Total Electricity Consumed
PHEV-30 with Extended Work Commute
PHEV-30 with No Weekend Drives
PHEV-30 with Extended Work Commute
PHEV-30 with No Weekend Drives
Regional Case Studies
Annual Fuel Consumption
Work (gal or kWh) 131.64 48.60 1,801.51 1,730.22
Errand (gal or kWh) 14.23 12.83 90.52 105.34
Weekend (gal or kWh) 47.90 0.00 972.25 0.00
Total (gal or kWh) 193.77 61.43 2,864.27 1,835.56
Total (bbl crude oil eq) 7.02 2.23 - -
Vehicle Lifetime Fuel Consumption
Total (gal or kWh) 1937.71 614.30 28,642.73 18,355.55
Total (bbl crude oil eq) 70.21 22.26 - -
Total Imported (bbl crude oil eq) 42.12 13.35 - -
Crude Oil (Imported) Comparison Between Vehicle Types
Relative to ICE (bbl) 54.40 83.17 - -
Relative to HEV (bbl) 24.31 53.08 - -
Liquid Fuel and Electricity Cost Southern CA ECAR /
Cleveland Southern CA ECAR /
Cleveland Southern CA ECAR /
Cleveland Southern CA ECAR /
Cleveland
Annual Cost $871.97 $823.53 $276.44 $261.08 $524.16 $252.06 $335.91 $161.53
Lifetime Cost $8,719.68 $8,235.26 $2,764.37 $2,610.79 $5,241.62 $2,520.56 $3,359.07 $1,615.29
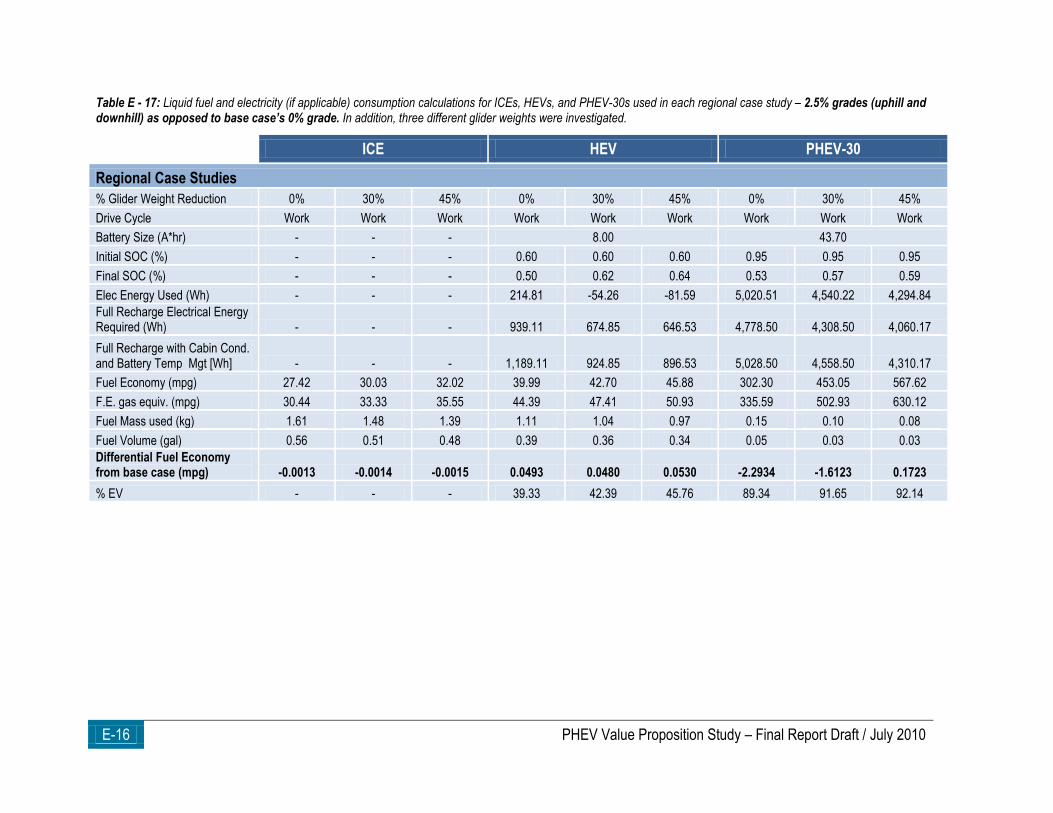
E-16 PHEV Value Proposition Study – Final Report Draft / July 2010
Table E - 17: Liquid fuel and electricity (if applicable) consumption calculations for ICEs, HEVs, and PHEV-30s used in each regional case study – 2.5% grades (uphill and downhill) as opposed to base case’s 0% grade. In addition, three different glider weights were investigated.
ICE HEV PHEV-30
Regional Case Studies
% Glider Weight Reduction 0% 30% 45% 0% 30% 45% 0% 30% 45%
Drive Cycle Work Work Work Work Work Work Work Work Work
Battery Size (A*hr) - - - 8.00 43.70
Initial SOC (%) - - - 0.60 0.60 0.60 0.95 0.95 0.95
Final SOC (%) - - - 0.50 0.62 0.64 0.53 0.57 0.59
Elec Energy Used (Wh) - - - 214.81 -54.26 -81.59 5,020.51 4,540.22 4,294.84
Full Recharge Electrical Energy Required (Wh) - - - 939.11 674.85 646.53 4,778.50 4,308.50 4,060.17
Full Recharge with Cabin Cond. and Battery Temp Mgt [Wh] - - - 1,189.11 924.85 896.53 5,028.50 4,558.50 4,310.17
Fuel Economy (mpg) 27.42 30.03 32.02 39.99 42.70 45.88 302.30 453.05 567.62
F.E. gas equiv. (mpg) 30.44 33.33 35.55 44.39 47.41 50.93 335.59 502.93 630.12
Fuel Mass used (kg) 1.61 1.48 1.39 1.11 1.04 0.97 0.15 0.10 0.08
Fuel Volume (gal) 0.56 0.51 0.48 0.39 0.36 0.34 0.05 0.03 0.03
Differential Fuel Economy from base case (mpg) -0.0013 -0.0014 -0.0015 0.0493 0.0480 0.0530 -2.2934 -1.6123 0.1723
% EV - - - 39.33 42.39 45.76 89.34 91.65 92.14
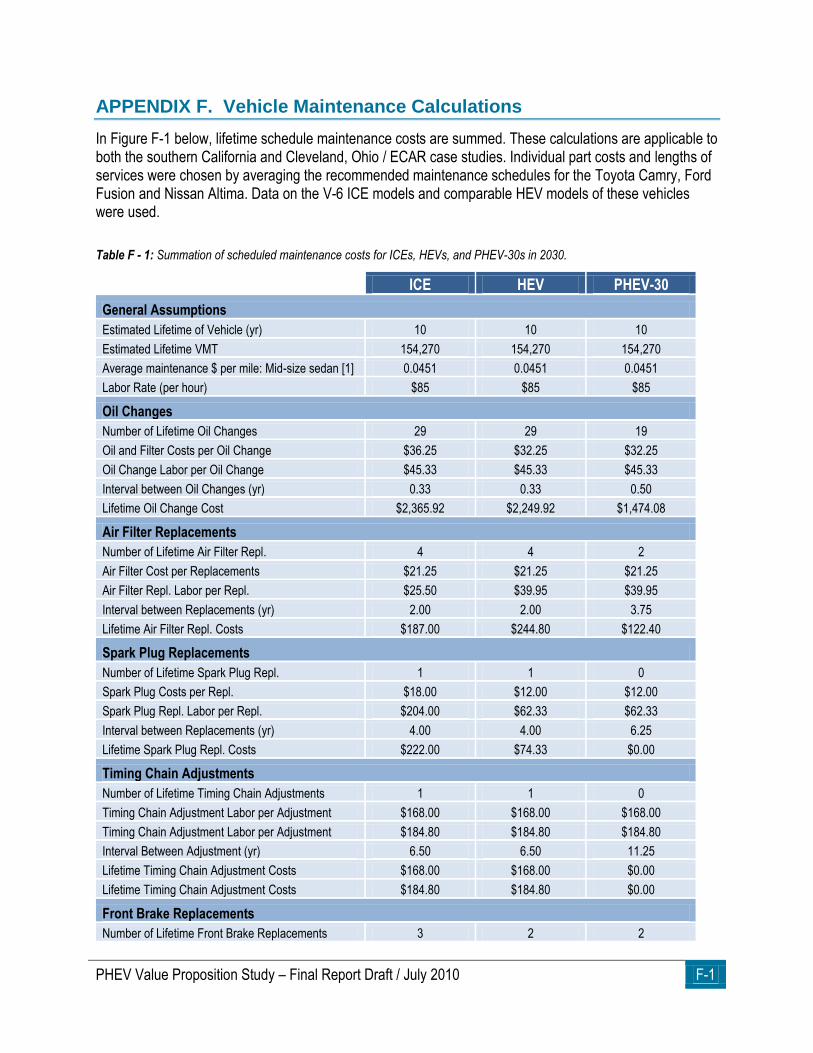
PHEV Value Proposition Study – Final Report Draft / July 2010 F-1
APPENDIX F. Vehicle Maintenance Calculations
In Figure F-1 below, lifetime schedule maintenance costs are summed. These calculations are applicable to both the southern California and Cleveland, Ohio / ECAR case studies. Individual part costs and lengths of services were chosen by averaging the recommended maintenance schedules for the Toyota Camry, Ford Fusion and Nissan Altima. Data on the V-6 ICE models and comparable HEV models of these vehicles were used.
Table F - 1: Summation of scheduled maintenance costs for ICEs, HEVs, and PHEV-30s in 2030.
ICE HEV PHEV-30
General Assumptions
Estimated Lifetime of Vehicle (yr) 10 10 10
Estimated Lifetime VMT 154,270 154,270 154,270
Average maintenance $ per mile: Mid-size sedan [1] 0.0451 0.0451 0.0451
Labor Rate (per hour) $85 $85 $85
Oil Changes
Number of Lifetime Oil Changes 29 29 19
Oil and Filter Costs per Oil Change $36.25 $32.25 $32.25
Oil Change Labor per Oil Change $45.33 $45.33 $45.33
Interval between Oil Changes (yr) 0.33 0.33 0.50
Lifetime Oil Change Cost $2,365.92 $2,249.92 $1,474.08
Air Filter Replacements
Number of Lifetime Air Filter Repl. 4 4 2
Air Filter Cost per Replacements $21.25 $21.25 $21.25
Air Filter Repl. Labor per Repl. $25.50 $39.95 $39.95
Interval between Replacements (yr) 2.00 2.00 3.75
Lifetime Air Filter Repl. Costs $187.00 $244.80 $122.40
Spark Plug Replacements
Number of Lifetime Spark Plug Repl. 1 1 0
Spark Plug Costs per Repl. $18.00 $12.00 $12.00
Spark Plug Repl. Labor per Repl. $204.00 $62.33 $62.33
Interval between Replacements (yr) 4.00 4.00 6.25
Lifetime Spark Plug Repl. Costs $222.00 $74.33 $0.00
Timing Chain Adjustments
Number of Lifetime Timing Chain Adjustments 1 1 0
Timing Chain Adjustment Labor per Adjustment $168.00 $168.00 $168.00
Timing Chain Adjustment Labor per Adjustment $184.80 $184.80 $184.80
Interval Between Adjustment (yr) 6.50 6.50 11.25
Lifetime Timing Chain Adjustment Costs $168.00 $168.00 $0.00
Lifetime Timing Chain Adjustment Costs $184.80 $184.80 $0.00
Front Brake Replacements
Number of Lifetime Front Brake Replacements 3 2 2
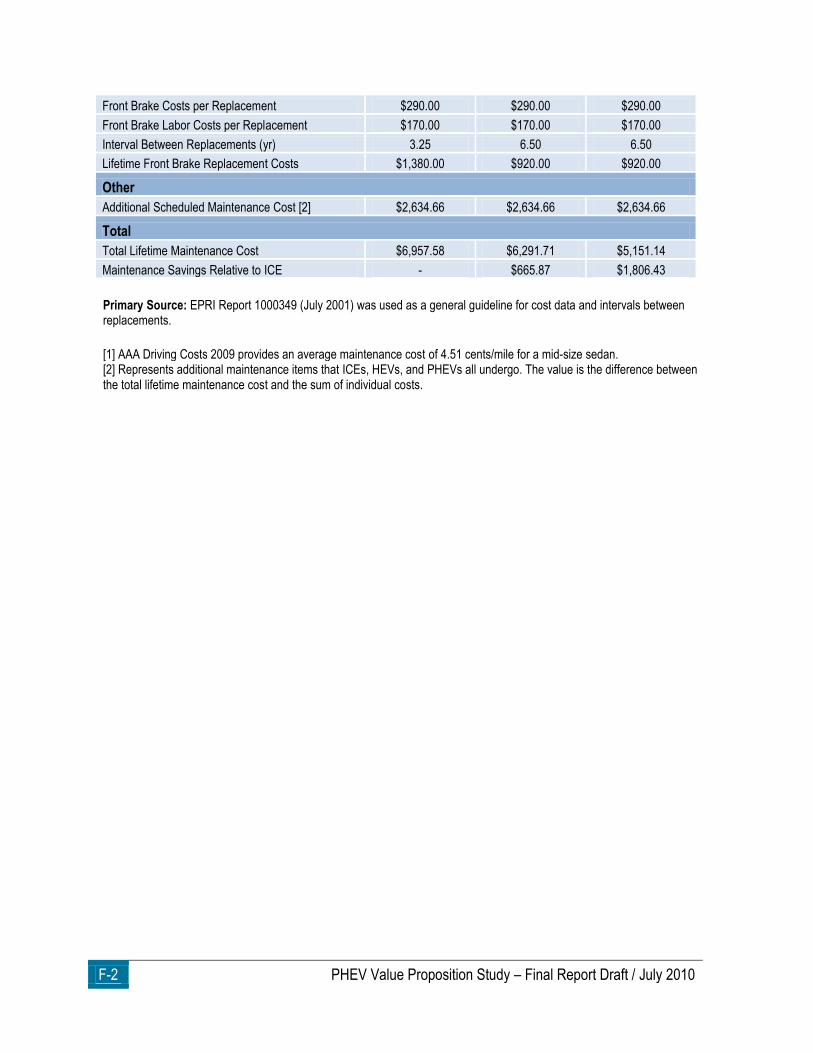
F-2 PHEV Value Proposition Study – Final Report Draft / July 2010
Front Brake Costs per Replacement $290.00 $290.00 $290.00
Front Brake Labor Costs per Replacement $170.00 $170.00 $170.00
Interval Between Replacements (yr) 3.25 6.50 6.50
Lifetime Front Brake Replacement Costs $1,380.00 $920.00 $920.00
Other
Additional Scheduled Maintenance Cost [2] $2,634.66 $2,634.66 $2,634.66
Total
Total Lifetime Maintenance Cost $6,957.58 $6,291.71 $5,151.14
Maintenance Savings Relative to ICE - $665.87 $1,806.43
Primary Source: EPRI Report 1000349 (July 2001) was used as a general guideline for cost data and intervals between replacements.
[1] AAA Driving Costs 2009 provides an average maintenance cost of 4.51 cents/mile for a mid-size sedan. [2] Represents additional maintenance items that ICEs, HEVs, and PHEVs all undergo. The value is the difference between the total lifetime maintenance cost and the sum of individual costs.
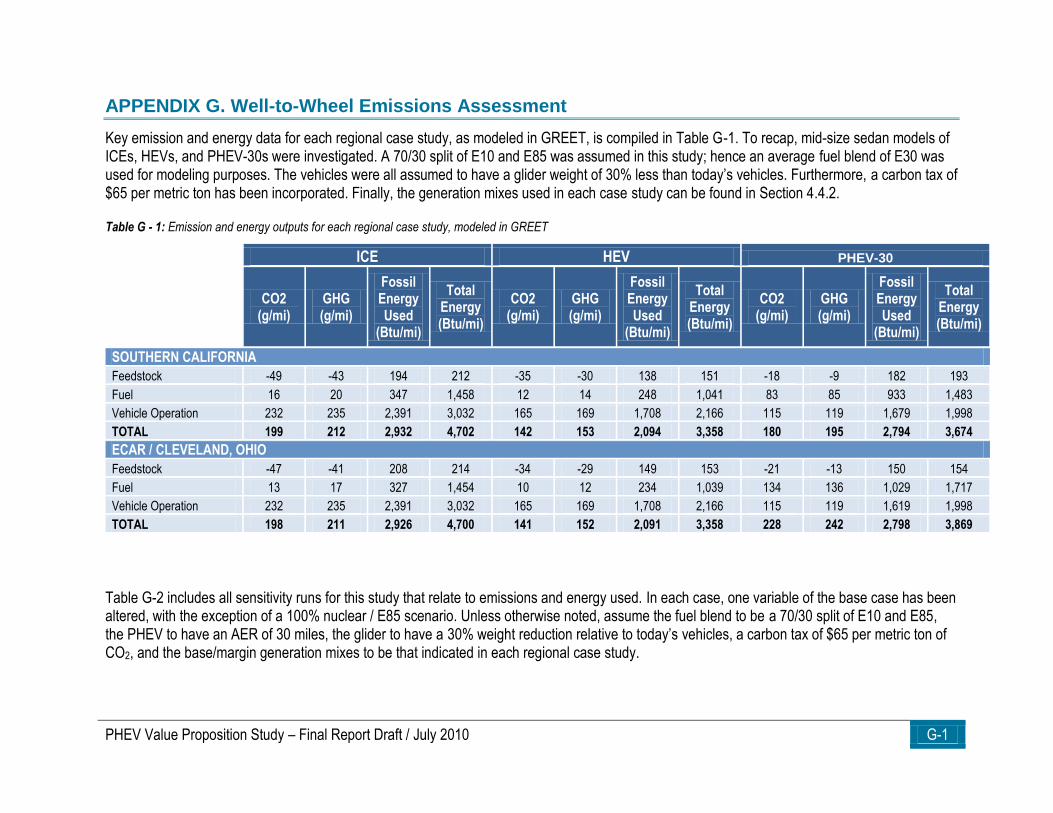
PHEV Value Proposition Study – Final Report Draft / July 2010 G-1
APPENDIX G. Well-to-Wheel Emissions Assessment
Key emission and energy data for each regional case study, as modeled in GREET, is compiled in Table G-1. To recap, mid-size sedan models of ICEs, HEVs, and PHEV-30s were investigated. A 70/30 split of E10 and E85 was assumed in this study; hence an average fuel blend of E30 was used for modeling purposes. The vehicles were all assumed to have a glider weight of 30% less than today’s vehicles. Furthermore, a carbon tax of $65 per metric ton has been incorporated. Finally, the generation mixes used in each case study can be found in Section 4.4.2.
Table G - 1: Emission and energy outputs for each regional case study, modeled in GREET
ICE HEV PHEV-30
CO2
(g/mi) GHG (g/mi)
Fossil Energy Used
(Btu/mi)
Total Energy (Btu/mi)
CO2 (g/mi)
GHG (g/mi)
Fossil Energy Used
(Btu/mi)
Total Energy (Btu/mi)
CO2 (g/mi)
GHG (g/mi)
Fossil Energy Used
(Btu/mi)
Total Energy (Btu/mi)
SOUTHERN CALIFORNIA
Feedstock -49 -43 194 212 -35 -30 138 151 -18 -9 182 193
Fuel 16 20 347 1,458 12 14 248 1,041 83 85 933 1,483
Vehicle Operation 232 235 2,391 3,032 165 169 1,708 2,166 115 119 1,679 1,998
TOTAL 199 212 2,932 4,702 142 153 2,094 3,358 180 195 2,794 3,674
ECAR / CLEVELAND, OHIO
Feedstock -47 -41 208 214 -34 -29 149 153 -21 -13 150 154
Fuel 13 17 327 1,454 10 12 234 1,039 134 136 1,029 1,717
Vehicle Operation 232 235 2,391 3,032 165 169 1,708 2,166 115 119 1,619 1,998
TOTAL 198 211 2,926 4,700 141 152 2,091 3,358 228 242 2,798 3,869
Table G-2 includes all sensitivity runs for this study that relate to emissions and energy used. In each case, one variable of the base case has been altered, with the exception of a 100% nuclear / E85 scenario. Unless otherwise noted, assume the fuel blend to be a 70/30 split of E10 and E85, the PHEV to have an AER of 30 miles, the glider to have a 30% weight reduction relative to today’s vehicles, a carbon tax of $65 per metric ton of CO2, and the base/margin generation mixes to be that indicated in each regional case study.
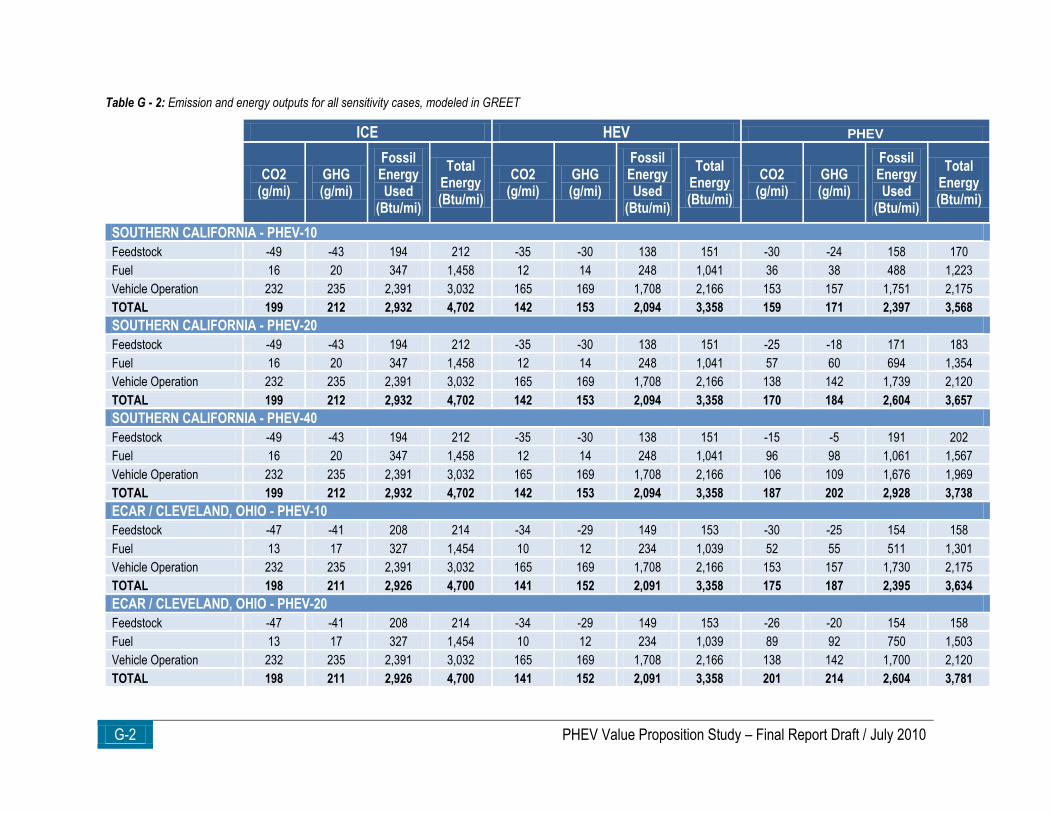
G-2 PHEV Value Proposition Study – Final Report Draft / July 2010
Table G - 2: Emission and energy outputs for all sensitivity cases, modeled in GREET
ICE HEV PHEV
CO2
(g/mi) GHG (g/mi)
Fossil Energy Used
(Btu/mi)
Total Energy (Btu/mi)
CO2 (g/mi)
GHG (g/mi)
Fossil Energy Used
(Btu/mi)
Total Energy (Btu/mi)
CO2 (g/mi)
GHG (g/mi)
Fossil Energy Used
(Btu/mi)
Total Energy (Btu/mi)
SOUTHERN CALIFORNIA - PHEV-10
Feedstock -49 -43 194 212 -35 -30 138 151 -30 -24 158 170
Fuel 16 20 347 1,458 12 14 248 1,041 36 38 488 1,223
Vehicle Operation 232 235 2,391 3,032 165 169 1,708 2,166 153 157 1,751 2,175
TOTAL 199 212 2,932 4,702 142 153 2,094 3,358 159 171 2,397 3,568
SOUTHERN CALIFORNIA - PHEV-20
Feedstock -49 -43 194 212 -35 -30 138 151 -25 -18 171 183
Fuel 16 20 347 1,458 12 14 248 1,041 57 60 694 1,354
Vehicle Operation 232 235 2,391 3,032 165 169 1,708 2,166 138 142 1,739 2,120
TOTAL 199 212 2,932 4,702 142 153 2,094 3,358 170 184 2,604 3,657
SOUTHERN CALIFORNIA - PHEV-40
Feedstock -49 -43 194 212 -35 -30 138 151 -15 -5 191 202
Fuel 16 20 347 1,458 12 14 248 1,041 96 98 1,061 1,567
Vehicle Operation 232 235 2,391 3,032 165 169 1,708 2,166 106 109 1,676 1,969
TOTAL 199 212 2,932 4,702 142 153 2,094 3,358 187 202 2,928 3,738
ECAR / CLEVELAND, OHIO - PHEV-10
Feedstock -47 -41 208 214 -34 -29 149 153 -30 -25 154 158
Fuel 13 17 327 1,454 10 12 234 1,039 52 55 511 1,301
Vehicle Operation 232 235 2,391 3,032 165 169 1,708 2,166 153 157 1,730 2,175
TOTAL 198 211 2,926 4,700 141 152 2,091 3,358 175 187 2,395 3,634
ECAR / CLEVELAND, OHIO - PHEV-20
Feedstock -47 -41 208 214 -34 -29 149 153 -26 -20 154 158
Fuel 13 17 327 1,454 10 12 234 1,039 89 92 750 1,503
Vehicle Operation 232 235 2,391 3,032 165 169 1,708 2,166 138 142 1,700 2,120
TOTAL 198 211 2,926 4,700 141 152 2,091 3,358 201 214 2,604 3,781
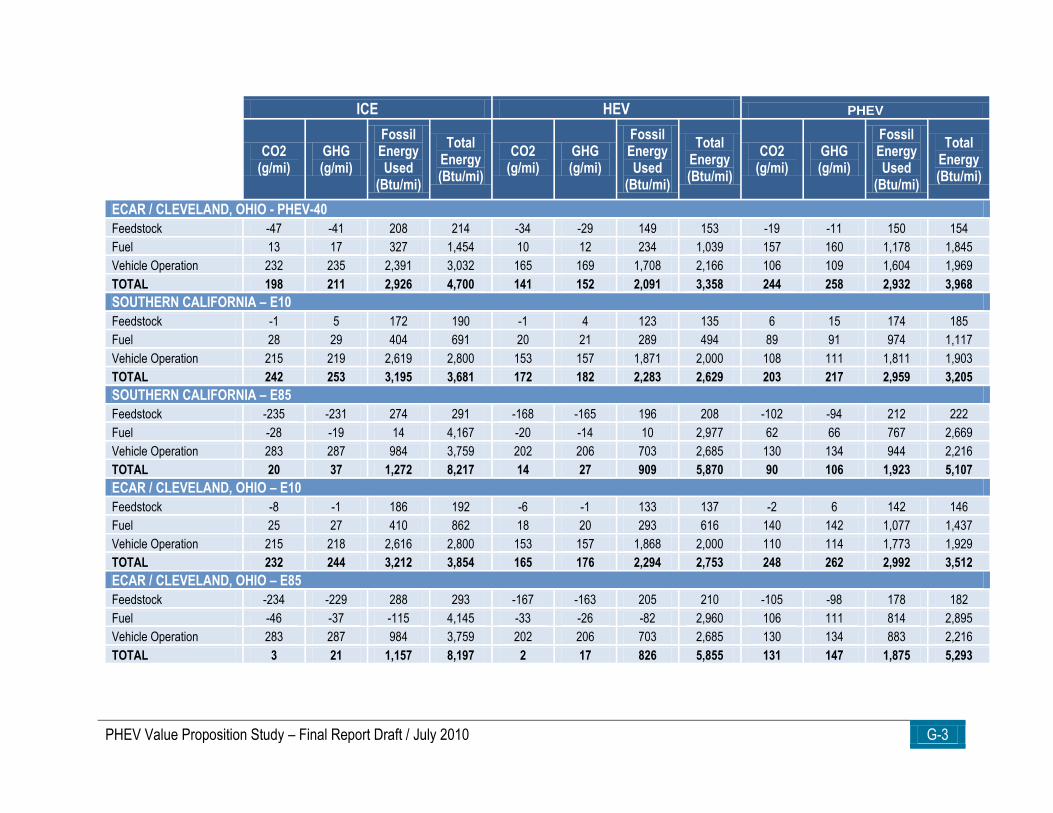
PHEV Value Proposition Study – Final Report Draft / July 2010 G-3
ICE HEV PHEV
CO2
(g/mi) GHG (g/mi)
Fossil Energy Used
(Btu/mi)
Total Energy (Btu/mi)
CO2 (g/mi)
GHG (g/mi)
Fossil Energy Used
(Btu/mi)
Total Energy (Btu/mi)
CO2 (g/mi)
GHG (g/mi)
Fossil Energy Used
(Btu/mi)
Total Energy (Btu/mi)
ECAR / CLEVELAND, OHIO - PHEV-40
Feedstock -47 -41 208 214 -34 -29 149 153 -19 -11 150 154
Fuel 13 17 327 1,454 10 12 234 1,039 157 160 1,178 1,845
Vehicle Operation 232 235 2,391 3,032 165 169 1,708 2,166 106 109 1,604 1,969
TOTAL 198 211 2,926 4,700 141 152 2,091 3,358 244 258 2,932 3,968
SOUTHERN CALIFORNIA – E10
Feedstock -1 5 172 190 -1 4 123 135 6 15 174 185
Fuel 28 29 404 691 20 21 289 494 89 91 974 1,117
Vehicle Operation 215 219 2,619 2,800 153 157 1,871 2,000 108 111 1,811 1,903
TOTAL 242 253 3,195 3,681 172 182 2,283 2,629 203 217 2,959 3,205
SOUTHERN CALIFORNIA – E85
Feedstock -235 -231 274 291 -168 -165 196 208 -102 -94 212 222
Fuel -28 -19 14 4,167 -20 -14 10 2,977 62 66 767 2,669
Vehicle Operation 283 287 984 3,759 202 206 703 2,685 130 134 944 2,216
TOTAL 20 37 1,272 8,217 14 27 909 5,870 90 106 1,923 5,107
ECAR / CLEVELAND, OHIO – E10
Feedstock -8 -1 186 192 -6 -1 133 137 -2 6 142 146
Fuel 25 27 410 862 18 20 293 616 140 142 1,077 1,437
Vehicle Operation 215 218 2,616 2,800 153 157 1,868 2,000 110 114 1,773 1,929
TOTAL 232 244 3,212 3,854 165 176 2,294 2,753 248 262 2,992 3,512
ECAR / CLEVELAND, OHIO – E85
Feedstock -234 -229 288 293 -167 -163 205 210 -105 -98 178 182
Fuel -46 -37 -115 4,145 -33 -26 -82 2,960 106 111 814 2,895
Vehicle Operation 283 287 984 3,759 202 206 703 2,685 130 134 883 2,216
TOTAL 3 21 1,157 8,197 2 17 826 5,855 131 147 1,875 5,293
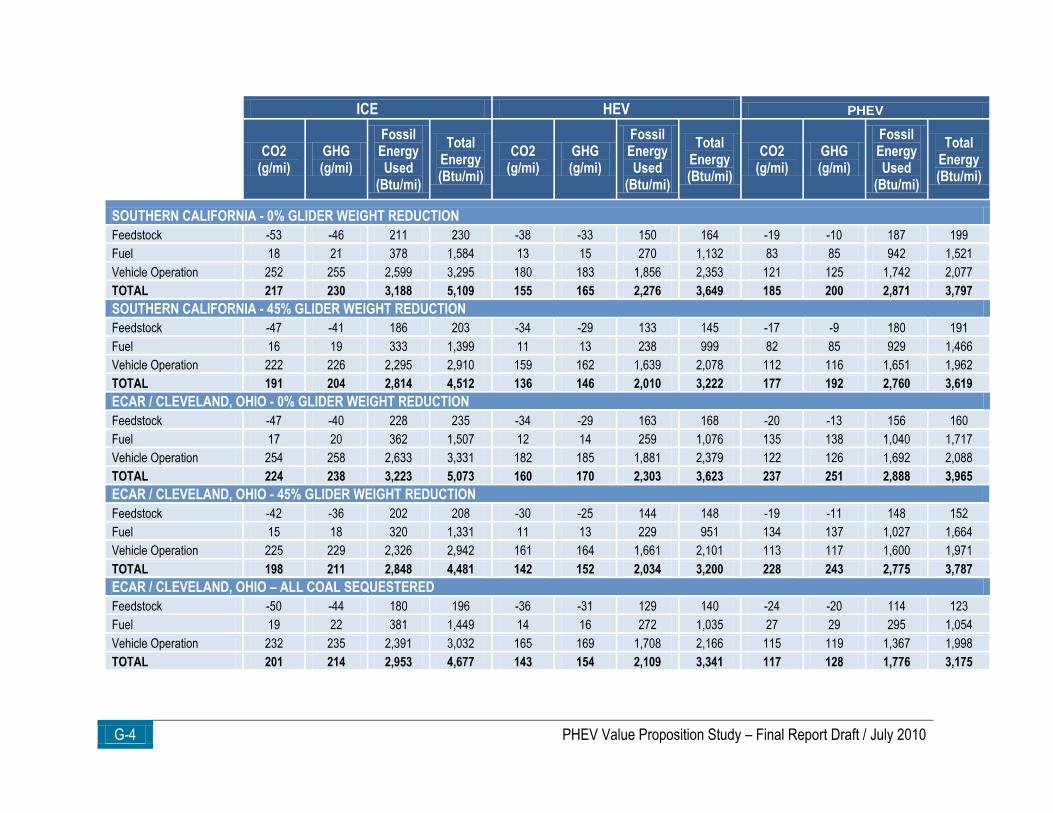
G-4 PHEV Value Proposition Study – Final Report Draft / July 2010
ICE HEV PHEV
CO2
(g/mi) GHG (g/mi)
Fossil Energy Used
(Btu/mi)
Total Energy (Btu/mi)
CO2 (g/mi)
GHG (g/mi)
Fossil Energy Used
(Btu/mi)
Total Energy (Btu/mi)
CO2 (g/mi)
GHG (g/mi)
Fossil Energy Used
(Btu/mi)
Total Energy (Btu/mi)
SOUTHERN CALIFORNIA - 0% GLIDER WEIGHT REDUCTION
Feedstock -53 -46 211 230 -38 -33 150 164 -19 -10 187 199
Fuel 18 21 378 1,584 13 15 270 1,132 83 85 942 1,521
Vehicle Operation 252 255 2,599 3,295 180 183 1,856 2,353 121 125 1,742 2,077
TOTAL 217 230 3,188 5,109 155 165 2,276 3,649 185 200 2,871 3,797
SOUTHERN CALIFORNIA - 45% GLIDER WEIGHT REDUCTION
Feedstock -47 -41 186 203 -34 -29 133 145 -17 -9 180 191
Fuel 16 19 333 1,399 11 13 238 999 82 85 929 1,466
Vehicle Operation 222 226 2,295 2,910 159 162 1,639 2,078 112 116 1,651 1,962
TOTAL 191 204 2,814 4,512 136 146 2,010 3,222 177 192 2,760 3,619
ECAR / CLEVELAND, OHIO - 0% GLIDER WEIGHT REDUCTION
Feedstock -47 -40 228 235 -34 -29 163 168 -20 -13 156 160
Fuel 17 20 362 1,507 12 14 259 1,076 135 138 1,040 1,717
Vehicle Operation 254 258 2,633 3,331 182 185 1,881 2,379 122 126 1,692 2,088
TOTAL 224 238 3,223 5,073 160 170 2,303 3,623 237 251 2,888 3,965
ECAR / CLEVELAND, OHIO - 45% GLIDER WEIGHT REDUCTION
Feedstock -42 -36 202 208 -30 -25 144 148 -19 -11 148 152
Fuel 15 18 320 1,331 11 13 229 951 134 137 1,027 1,664
Vehicle Operation 225 229 2,326 2,942 161 164 1,661 2,101 113 117 1,600 1,971
TOTAL 198 211 2,848 4,481 142 152 2,034 3,200 228 243 2,775 3,787
ECAR / CLEVELAND, OHIO – ALL COAL SEQUESTERED
Feedstock -50 -44 180 196 -36 -31 129 140 -24 -20 114 123
Fuel 19 22 381 1,449 14 16 272 1,035 27 29 295 1,054
Vehicle Operation 232 235 2,391 3,032 165 169 1,708 2,166 115 119 1,367 1,998
TOTAL 201 214 2,953 4,677 143 154 2,109 3,341 117 128 1,776 3,175
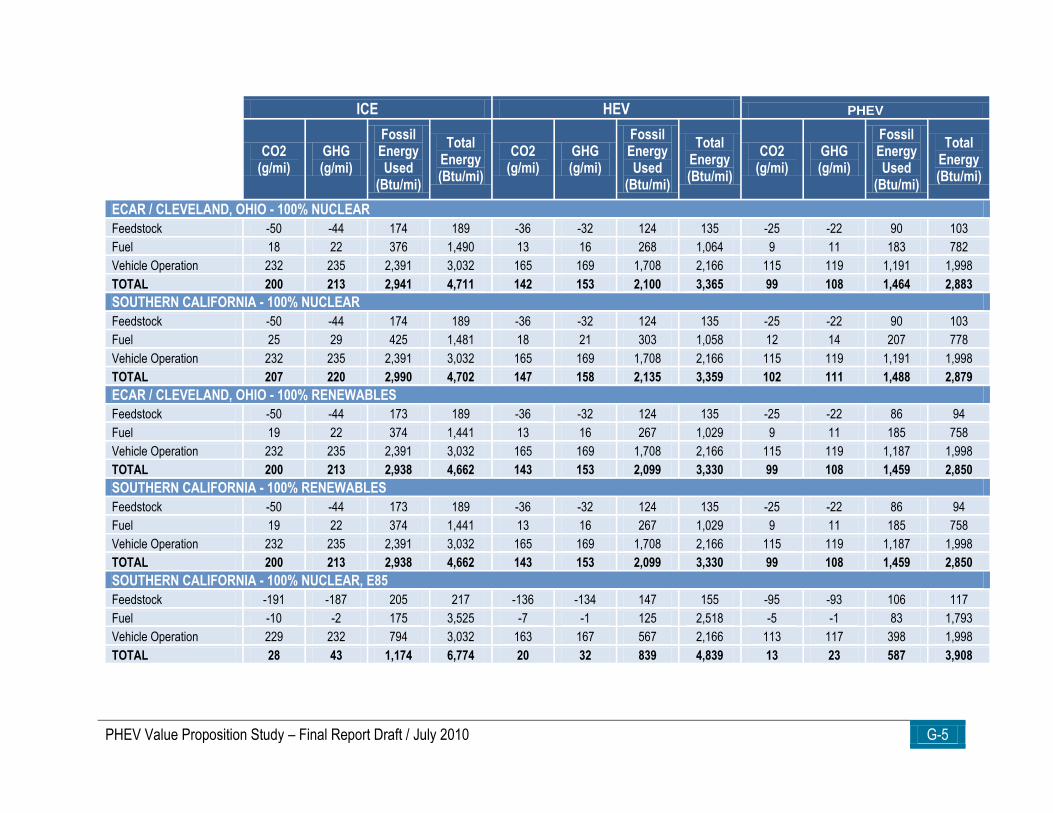
PHEV Value Proposition Study – Final Report Draft / July 2010 G-5
ICE HEV PHEV
CO2
(g/mi) GHG (g/mi)
Fossil Energy Used
(Btu/mi)
Total Energy (Btu/mi)
CO2 (g/mi)
GHG (g/mi)
Fossil Energy Used
(Btu/mi)
Total Energy (Btu/mi)
CO2 (g/mi)
GHG (g/mi)
Fossil Energy Used
(Btu/mi)
Total Energy (Btu/mi)
ECAR / CLEVELAND, OHIO - 100% NUCLEAR
Feedstock -50 -44 174 189 -36 -32 124 135 -25 -22 90 103
Fuel 18 22 376 1,490 13 16 268 1,064 9 11 183 782
Vehicle Operation 232 235 2,391 3,032 165 169 1,708 2,166 115 119 1,191 1,998
TOTAL 200 213 2,941 4,711 142 153 2,100 3,365 99 108 1,464 2,883
SOUTHERN CALIFORNIA - 100% NUCLEAR
Feedstock -50 -44 174 189 -36 -32 124 135 -25 -22 90 103
Fuel 25 29 425 1,481 18 21 303 1,058 12 14 207 778
Vehicle Operation 232 235 2,391 3,032 165 169 1,708 2,166 115 119 1,191 1,998
TOTAL 207 220 2,990 4,702 147 158 2,135 3,359 102 111 1,488 2,879
ECAR / CLEVELAND, OHIO - 100% RENEWABLES
Feedstock -50 -44 173 189 -36 -32 124 135 -25 -22 86 94
Fuel 19 22 374 1,441 13 16 267 1,029 9 11 185 758
Vehicle Operation 232 235 2,391 3,032 165 169 1,708 2,166 115 119 1,187 1,998
TOTAL 200 213 2,938 4,662 143 153 2,099 3,330 99 108 1,459 2,850
SOUTHERN CALIFORNIA - 100% RENEWABLES
Feedstock -50 -44 173 189 -36 -32 124 135 -25 -22 86 94
Fuel 19 22 374 1,441 13 16 267 1,029 9 11 185 758
Vehicle Operation 232 235 2,391 3,032 165 169 1,708 2,166 115 119 1,187 1,998
TOTAL 200 213 2,938 4,662 143 153 2,099 3,330 99 108 1,459 2,850
SOUTHERN CALIFORNIA - 100% NUCLEAR, E85
Feedstock -191 -187 205 217 -136 -134 147 155 -95 -93 106 117
Fuel -10 -2 175 3,525 -7 -1 125 2,518 -5 -1 83 1,793
Vehicle Operation 229 232 794 3,032 163 167 567 2,166 113 117 398 1,998
TOTAL 28 43 1,174 6,774 20 32 839 4,839 13 23 587 3,908
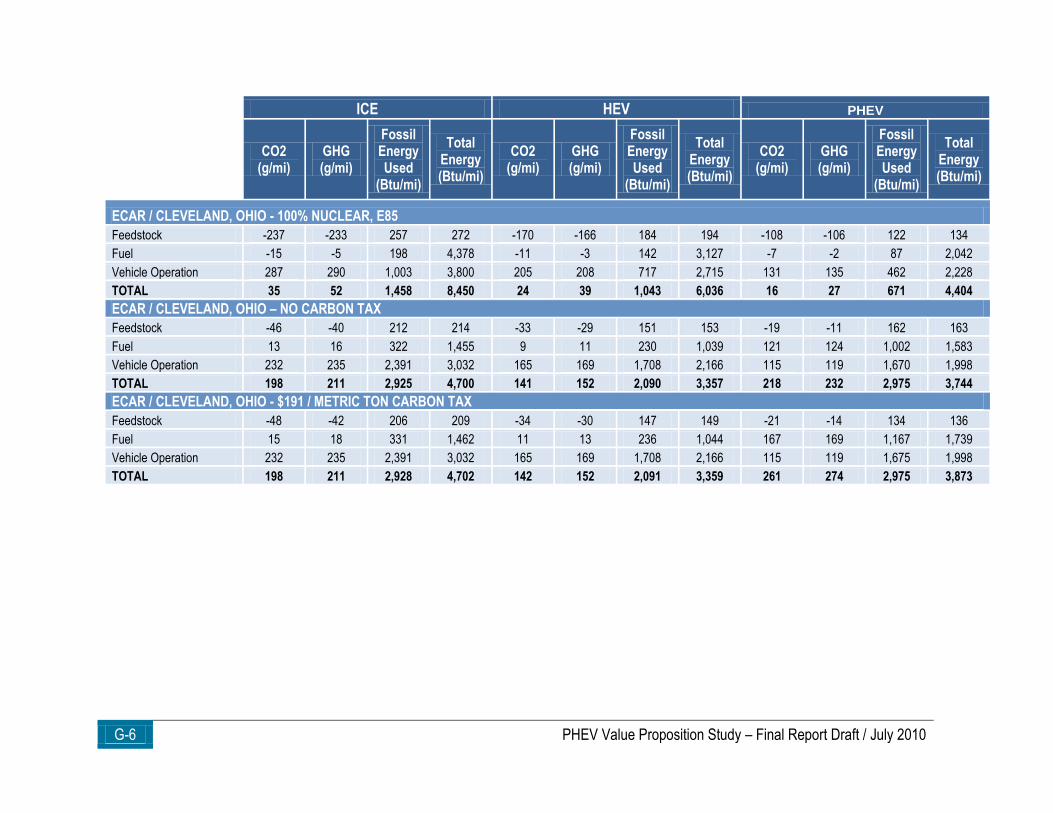
G-6 PHEV Value Proposition Study – Final Report Draft / July 2010
ICE HEV PHEV
CO2
(g/mi) GHG (g/mi)
Fossil Energy Used
(Btu/mi)
Total Energy (Btu/mi)
CO2 (g/mi)
GHG (g/mi)
Fossil Energy Used
(Btu/mi)
Total Energy (Btu/mi)
CO2 (g/mi)
GHG (g/mi)
Fossil Energy Used
(Btu/mi)
Total Energy (Btu/mi)
ECAR / CLEVELAND, OHIO - 100% NUCLEAR, E85
Feedstock -237 -233 257 272 -170 -166 184 194 -108 -106 122 134
Fuel -15 -5 198 4,378 -11 -3 142 3,127 -7 -2 87 2,042
Vehicle Operation 287 290 1,003 3,800 205 208 717 2,715 131 135 462 2,228
TOTAL 35 52 1,458 8,450 24 39 1,043 6,036 16 27 671 4,404
ECAR / CLEVELAND, OHIO – NO CARBON TAX
Feedstock -46 -40 212 214 -33 -29 151 153 -19 -11 162 163
Fuel 13 16 322 1,455 9 11 230 1,039 121 124 1,002 1,583
Vehicle Operation 232 235 2,391 3,032 165 169 1,708 2,166 115 119 1,670 1,998
TOTAL 198 211 2,925 4,700 141 152 2,090 3,357 218 232 2,975 3,744
ECAR / CLEVELAND, OHIO - $191 / METRIC TON CARBON TAX
Feedstock -48 -42 206 209 -34 -30 147 149 -21 -14 134 136
Fuel 15 18 331 1,462 11 13 236 1,044 167 169 1,167 1,739
Vehicle Operation 232 235 2,391 3,032 165 169 1,708 2,166 115 119 1,675 1,998
TOTAL 198 211 2,928 4,702 142 152 2,091 3,359 261 274 2,975 3,873
PHEV Value Proposition Study – Final Report Draft / July 2010 H-1
APPENDIX H. Battery Life Estimation
Performed by Dr. Vincenzo Marano, Center for Automotive Research, The Ohio State University Overview
Work in this study covers the life estimation of Li-ion batteries for PHEVs. A life estimation model, based on the concept of accumulated ampere-hour (Ah) throughput, i.e. accumulated charge-transfer in/out of the battery, has been developed to estimate battery life under typical driving, reflecting the common driving habits, and average commute time over a year. The objective is to determine, in simulation, the ―damage‖ on the life related to each driving/charging pattern to determine equivalent miles/years. The presented methodology is a tool to estimate battery life, in terms of miles/years, starting from limited battery data provided by manufacturer. The aim of this project is to quantify the calendar life and remaining mileage life of Li-Ion batteries for PHEV applications. The project leverages previous activities developed at OSU CAR, capabilities of the Energy Storage Systems Laboratory at OSU CAR, and previous work developed within the PHEV VPS with Sentech. This project intends to improve the current ―battery life estimation‖ model that is directly linked to duty cycles and permits battery life estimation under different conditions. Tasks
1. Regional Case Study Assessment In this study, two regional case studies were conducted to simulate the cost and benefits associated with PHEV value propositions in two different geographic settings. Battery life estimations for each case study were performed with the same general approach, including use of consistent modeling techniques and similar vehicle assumptions. Inputs that might be unique to each region, and could potentially affect the battery’s expected life, were considered. These inputs included driving/ charging habits and climate.
Driving/Charging Habits: A set of typical driving/charging patterns for each region was defined based on statistical data. These ―driving/charging events‖ were then combined in typical statistically meaningful days/years, as shown in the following. It was decided that typical commuting distances were very similar for both regions studied, so no differentiations between the regions were ultimately used.
Climate/Weather: One region has a climate characterized by colder and more variable temperature, and it was possible that this climate could affect battery life. However, since the battery temperature is controlled to 25°C, temperature will not impact aging directly, but indirectly. Specifically, more energy will be required to keep the battery at the desired temperature, thus increasing its usage and decreasing life.
2. Sensitivity Analysis For each regional case study, a specific set of parameters was chosen for simulation purposes, including 2030 price projections for fuel, electricity, and vehicle components. This task assesses a designated range, as opposed to a single data point, for input parameters (e.g., AER, vehicle weight, varying drive cycles) to see how uncertainty in values may affect the overall results of the case study.
H-2 PHEV Value Proposition Study – Final Report Draft / July 2010
Life Estimation Approach
The adopted life estimation algorithm is based on weighted Ah-throughput models. The main assumption is that under particular standard conditions (C-rate, temperature, DOD) a battery can achieve an overall Ah-throughput until the end of life is reached. For automotive applications (HEV, PHEV) a battery is considered to have reached end of life (EOL) when it shows capacity losses of 20% or more with respect to the original capacity. The lifetime in terms of number of cycles is usually given by the battery manufacturer (usually 100% DOD at ±1C-rate at 25C) and is required for lifetime estimation with the weighted Ah-throughput model. The impact of a given Ah-throughput on the battery lifetime depends on the details of the conditions during this Ah-throughput. One important advantage of this model is that it takes into account deviations from the standard operating conditions (C-rate, temperature, DOD) that may increase or decrease the physical Ah-throughput and consequently the rate of aging. The equation for the effective Ah-throughput is given by:
Eq. H-1
Equation Eq. H-1 states that the sum over all events, E, consists of AhE being the Ah-throughput of an event E, nE the number of events E, and wE the weighting factor for the event E. The weighting factor can consider the magnitude and rate of the current during this event, temperature, or the DOD. An event, E, is a current load characterized by a fixed magnitude and rate under a given temperature, DOD, and initial SOC. There can also be multiple weighting factors considering different operating conditions (e.g., wEI for the current I, wET for the temperature and so on). The battery is considered to fail and reach end of life once the effective Ah-throughput is greater than the total Ah-throughput that has been measured under nominal operating conditions provided by the manufacturer. This type of model represents a good tool for lifetime estimation of batteries in PHEVs because of various advantages. It has an easy basic structure, which allows for very high computational speed and can be adapted to different battery technologies. The main issue with this model is the determination of weighting factors (severity factors) parameters. Accurate values would require extensive data collection, not yet available. The PHEV battery life estimation model used in this study is based on the concept of accumulated charge throughput and considers as an input load duty cycles based on a typical/predicted usage patterns and as an output the battery life as a function of the input duty cycles. Profiles of one or more typical week/month/year driving cycles, identified based on customer driving habits, enter the battery model; the model estimates the ―damage‖ occurring at the battery related to each driving/charging pattern and provides the number of miles/years that the PHEV battery could run within a capacity loss lower than 20%. Battery aging nominally depends on accumulated charge-transfer in/out of the battery and the severity of this charge transfer at each instant. At the cell level, the severity of the charge transfer depends on:
• Current severity relative to battery size (i.e., C-rate) • Temperature
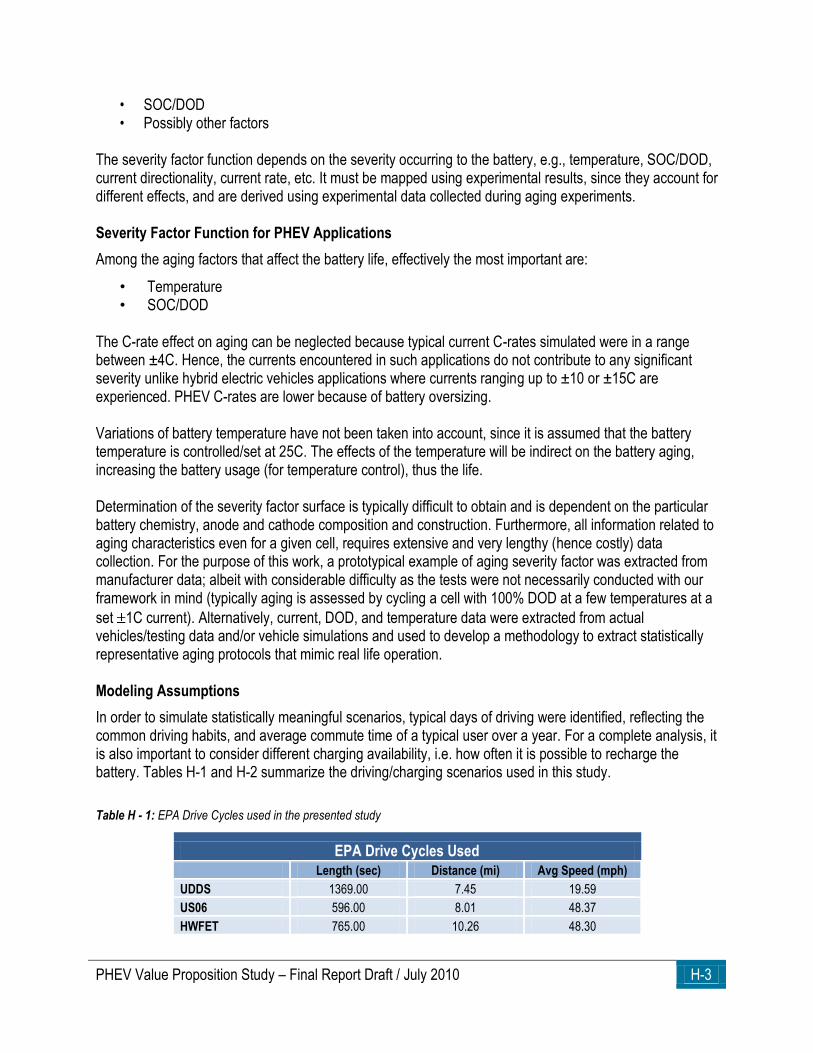
PHEV Value Proposition Study – Final Report Draft / July 2010 H-3
• SOC/DOD • Possibly other factors
The severity factor function depends on the severity occurring to the battery, e.g., temperature, SOC/DOD, current directionality, current rate, etc. It must be mapped using experimental results, since they account for different effects, and are derived using experimental data collected during aging experiments. Severity Factor Function for PHEV Applications
Among the aging factors that affect the battery life, effectively the most important are:
• Temperature • SOC/DOD
The C-rate effect on aging can be neglected because typical current C-rates simulated were in a range between ±4C. Hence, the currents encountered in such applications do not contribute to any significant severity unlike hybrid electric vehicles applications where currents ranging up to ±10 or ±15C are experienced. PHEV C-rates are lower because of battery oversizing. Variations of battery temperature have not been taken into account, since it is assumed that the battery temperature is controlled/set at 25C. The effects of the temperature will be indirect on the battery aging, increasing the battery usage (for temperature control), thus the life. Determination of the severity factor surface is typically difficult to obtain and is dependent on the particular battery chemistry, anode and cathode composition and construction. Furthermore, all information related to aging characteristics even for a given cell, requires extensive and very lengthy (hence costly) data collection. For the purpose of this work, a prototypical example of aging severity factor was extracted from manufacturer data; albeit with considerable difficulty as the tests were not necessarily conducted with our framework in mind (typically aging is assessed by cycling a cell with 100% DOD at a few temperatures at a
set 1C current). Alternatively, current, DOD, and temperature data were extracted from actual vehicles/testing data and/or vehicle simulations and used to develop a methodology to extract statistically representative aging protocols that mimic real life operation. Modeling Assumptions
In order to simulate statistically meaningful scenarios, typical days of driving were identified, reflecting the common driving habits, and average commute time of a typical user over a year. For a complete analysis, it is also important to consider different charging availability, i.e. how often it is possible to recharge the battery. Tables H-1 and H-2 summarize the driving/charging scenarios used in this study.
Table H - 1: EPA Drive Cycles used in the presented study
EPA Drive Cycles Used Length (sec) Distance (mi) Avg Speed (mph)
UDDS 1369.00 7.45 19.59
US06 596.00 8.01 48.37
HWFET 765.00 10.26 48.30
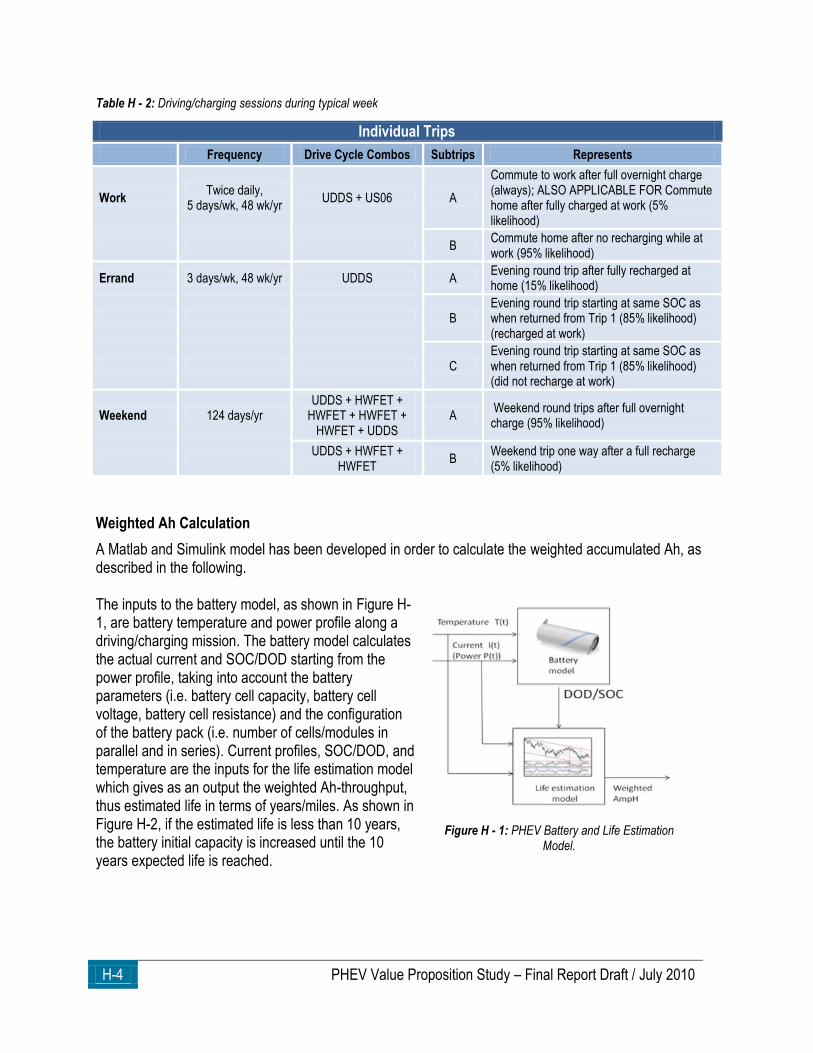
H-4 PHEV Value Proposition Study – Final Report Draft / July 2010
Table H - 2: Driving/charging sessions during typical week
Individual Trips
Frequency Drive Cycle Combos Subtrips Represents
Work Twice daily,
5 days/wk, 48 wk/yr UDDS + US06 A
Commute to work after full overnight charge (always); ALSO APPLICABLE FOR Commute home after fully charged at work (5% likelihood)
B Commute home after no recharging while at work (95% likelihood)
Errand 3 days/wk, 48 wk/yr UDDS A Evening round trip after fully recharged at home (15% likelihood)
B Evening round trip starting at same SOC as when returned from Trip 1 (85% likelihood) (recharged at work)
C Evening round trip starting at same SOC as when returned from Trip 1 (85% likelihood) (did not recharge at work)
Weekend 124 days/yr UDDS + HWFET +
HWFET + HWFET + HWFET + UDDS
A Weekend round trips after full overnight charge (95% likelihood)
UDDS + HWFET +
HWFET B
Weekend trip one way after a full recharge (5% likelihood)
Weighted Ah Calculation
A Matlab and Simulink model has been developed in order to calculate the weighted accumulated Ah, as described in the following. The inputs to the battery model, as shown in Figure H-1, are battery temperature and power profile along a driving/charging mission. The battery model calculates the actual current and SOC/DOD starting from the power profile, taking into account the battery parameters (i.e. battery cell capacity, battery cell voltage, battery cell resistance) and the configuration of the battery pack (i.e. number of cells/modules in parallel and in series). Current profiles, SOC/DOD, and temperature are the inputs for the life estimation model which gives as an output the weighted Ah-throughput, thus estimated life in terms of years/miles. As shown in Figure H-2, if the estimated life is less than 10 years, the battery initial capacity is increased until the 10 years expected life is reached.
Figure H - 1: PHEV Battery and Life Estimation Model.
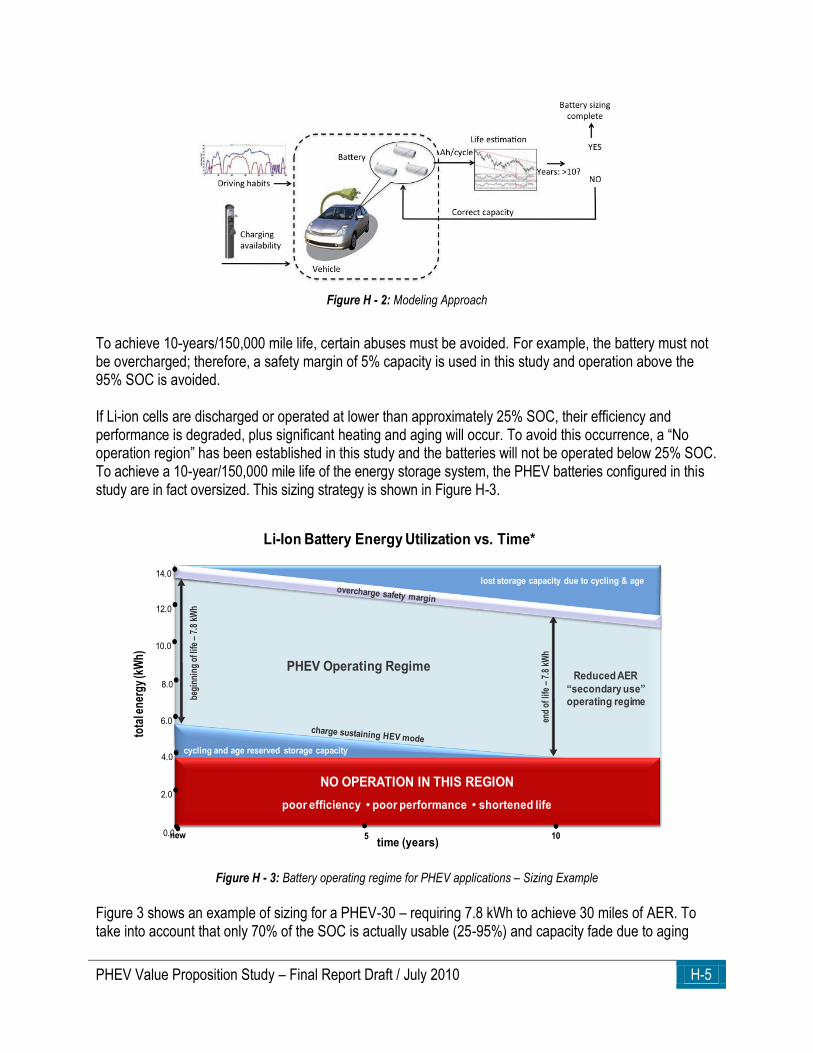
PHEV Value Proposition Study – Final Report Draft / July 2010 H-5
Figure H - 2: Modeling Approach
To achieve 10-years/150,000 mile life, certain abuses must be avoided. For example, the battery must not be overcharged; therefore, a safety margin of 5% capacity is used in this study and operation above the 95% SOC is avoided. If Li-ion cells are discharged or operated at lower than approximately 25% SOC, their efficiency and performance is degraded, plus significant heating and aging will occur. To avoid this occurrence, a ―No operation region‖ has been established in this study and the batteries will not be operated below 25% SOC. To achieve a 10-year/150,000 mile life of the energy storage system, the PHEV batteries configured in this study are in fact oversized. This sizing strategy is shown in Figure H-3.
Figure H - 3: Battery operating regime for PHEV applications – Sizing Example
Figure 3 shows an example of sizing for a PHEV-30 – requiring 7.8 kWh to achieve 30 miles of AER. To take into account that only 70% of the SOC is actually usable (25-95%) and capacity fade due to aging
begi
nnin
g of
life
–7.
8 kW
h
0.0•
lost storage capacity due to cycling & age
NO OPERATION IN THIS REGION
poor efficiency • poor performance • shortened life
PHEV Operating Regime
end
of li
fe –
7.8
kWh
Reduced AER
“secondary use” operating regime
new 10•
tota
l en
erg
y (k
Wh
)
4.0•
6.0•
8.0•
12.0•
14.0•
•
cycling and age reserved storage capacity
10.0•
2.0•
Li-Ion Battery Energy Utilization vs. Time*
time (years)•5
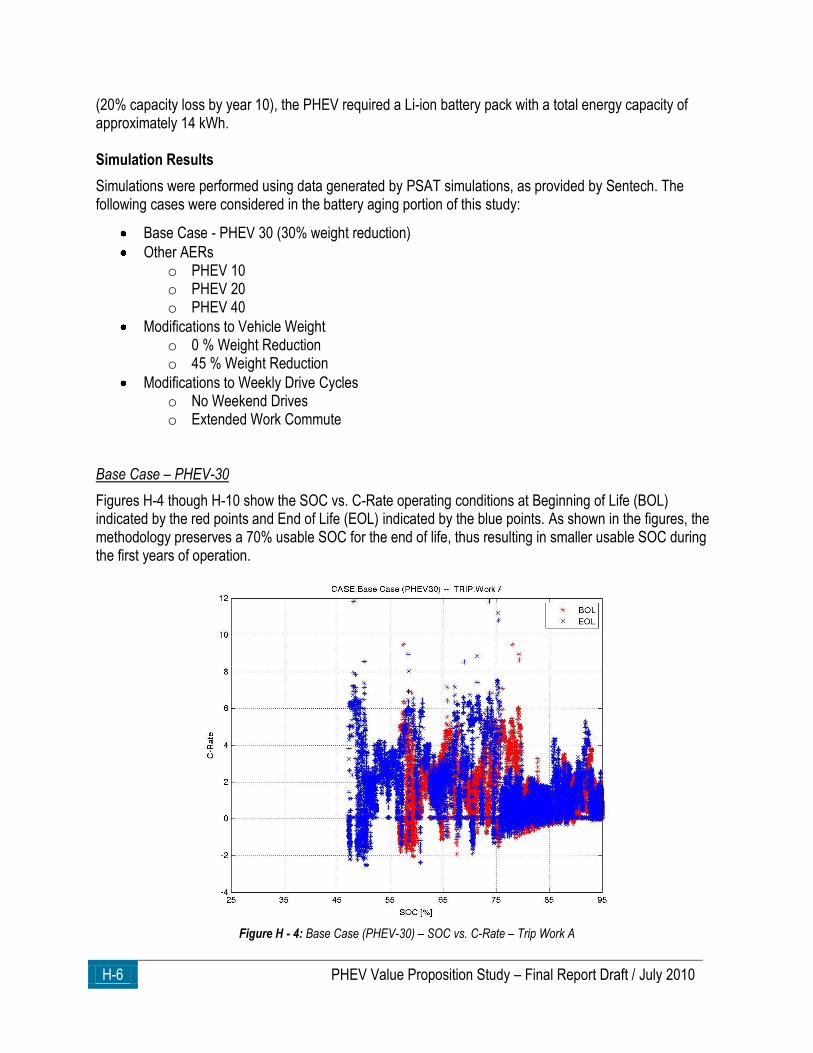
H-6 PHEV Value Proposition Study – Final Report Draft / July 2010
(20% capacity loss by year 10), the PHEV required a Li-ion battery pack with a total energy capacity of approximately 14 kWh. Simulation Results
Simulations were performed using data generated by PSAT simulations, as provided by Sentech. The following cases were considered in the battery aging portion of this study:
Base Case - PHEV 30 (30% weight reduction)
Other AERs o PHEV 10 o PHEV 20 o PHEV 40
Modifications to Vehicle Weight o 0 % Weight Reduction o 45 % Weight Reduction
Modifications to Weekly Drive Cycles o No Weekend Drives o Extended Work Commute
Base Case – PHEV-30
Figures H-4 though H-10 show the SOC vs. C-Rate operating conditions at Beginning of Life (BOL) indicated by the red points and End of Life (EOL) indicated by the blue points. As shown in the figures, the methodology preserves a 70% usable SOC for the end of life, thus resulting in smaller usable SOC during the first years of operation.
Figure H - 4: Base Case (PHEV-30) – SOC vs. C-Rate – Trip Work A
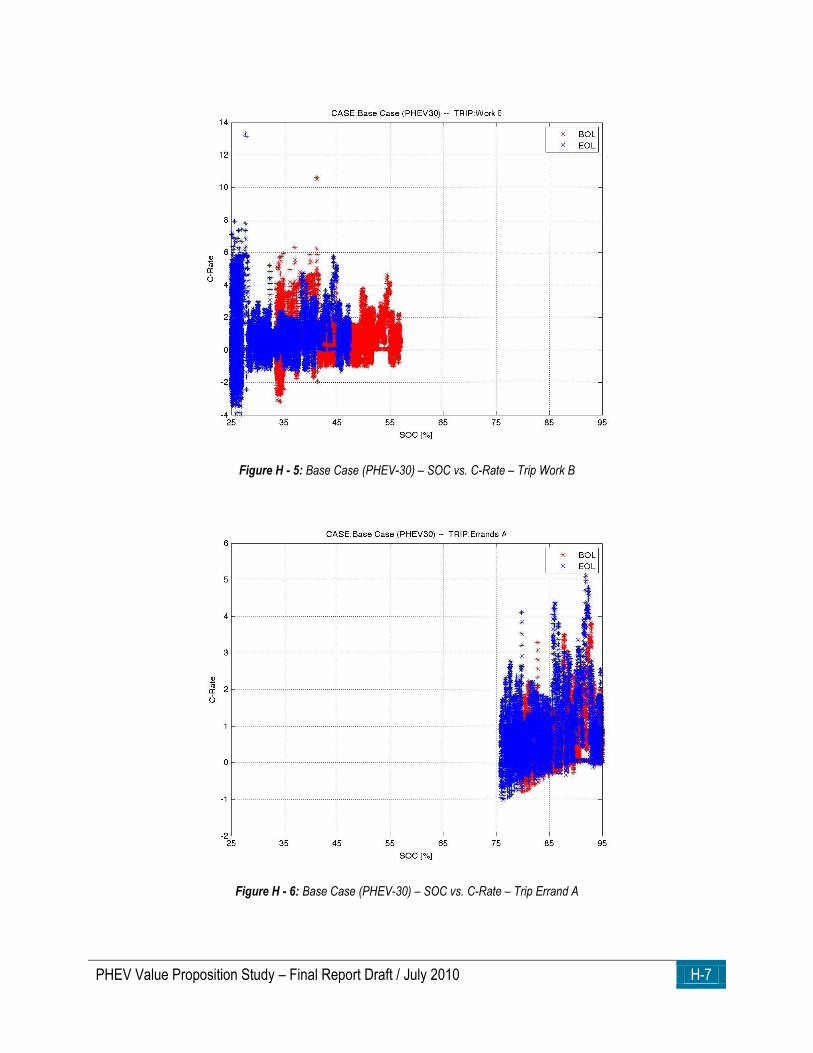
PHEV Value Proposition Study – Final Report Draft / July 2010 H-7
Figure H - 5: Base Case (PHEV-30) – SOC vs. C-Rate – Trip Work B
Figure H - 6: Base Case (PHEV-30) – SOC vs. C-Rate – Trip Errand A
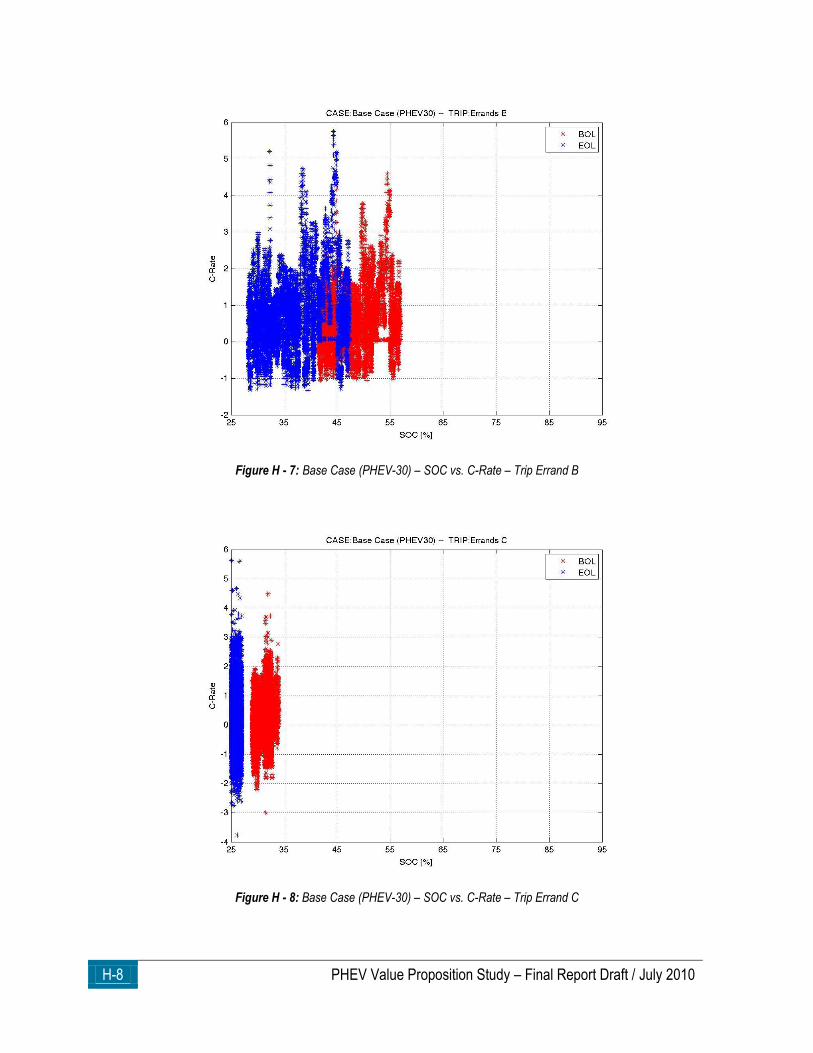
H-8 PHEV Value Proposition Study – Final Report Draft / July 2010
Figure H - 7: Base Case (PHEV-30) – SOC vs. C-Rate – Trip Errand B
Figure H - 8: Base Case (PHEV-30) – SOC vs. C-Rate – Trip Errand C
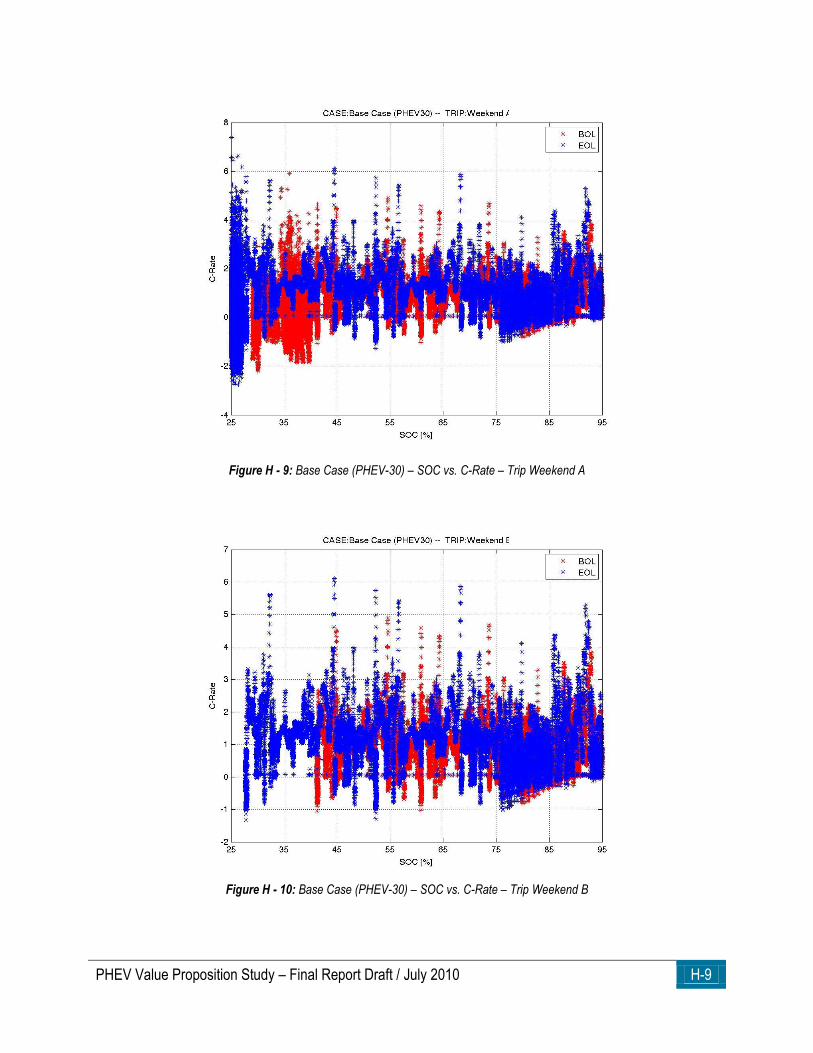
PHEV Value Proposition Study – Final Report Draft / July 2010 H-9
Figure H - 9: Base Case (PHEV-30) – SOC vs. C-Rate – Trip Weekend A
Figure H - 10: Base Case (PHEV-30) – SOC vs. C-Rate – Trip Weekend B
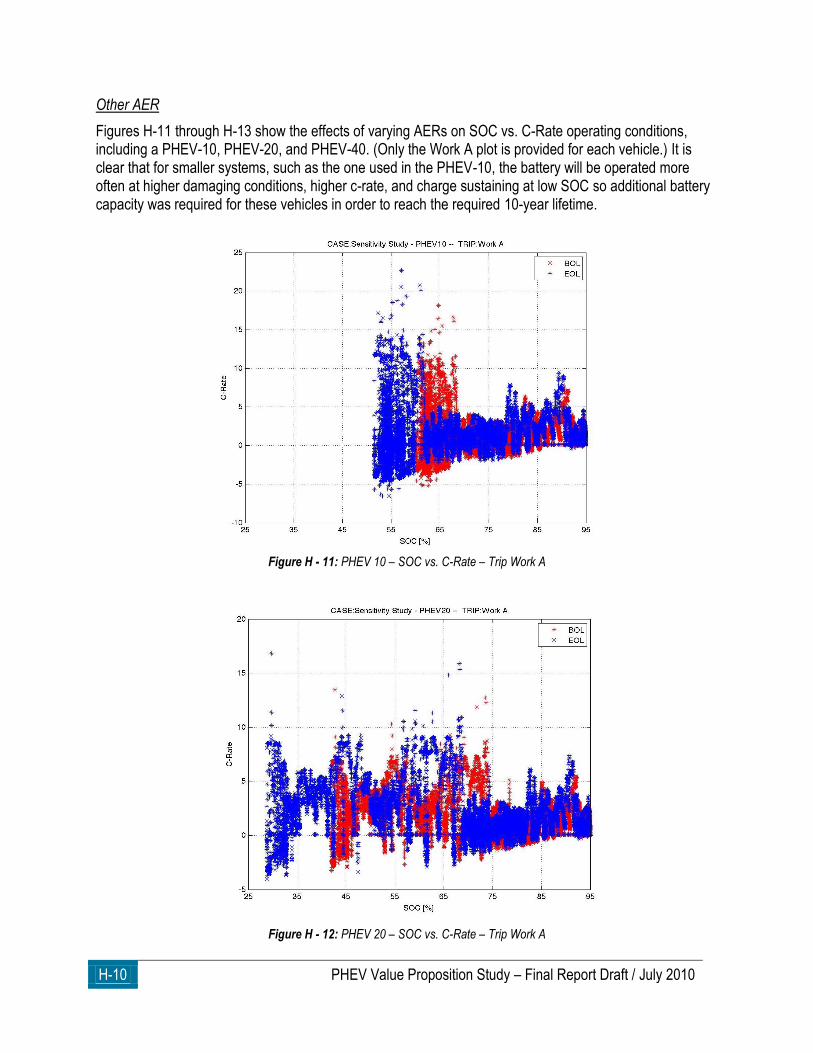
H-10 PHEV Value Proposition Study – Final Report Draft / July 2010
Other AER
Figures H-11 through H-13 show the effects of varying AERs on SOC vs. C-Rate operating conditions, including a PHEV-10, PHEV-20, and PHEV-40. (Only the Work A plot is provided for each vehicle.) It is clear that for smaller systems, such as the one used in the PHEV-10, the battery will be operated more often at higher damaging conditions, higher c-rate, and charge sustaining at low SOC so additional battery capacity was required for these vehicles in order to reach the required 10-year lifetime.
Figure H - 11: PHEV 10 – SOC vs. C-Rate – Trip Work A
Figure H - 12: PHEV 20 – SOC vs. C-Rate – Trip Work A
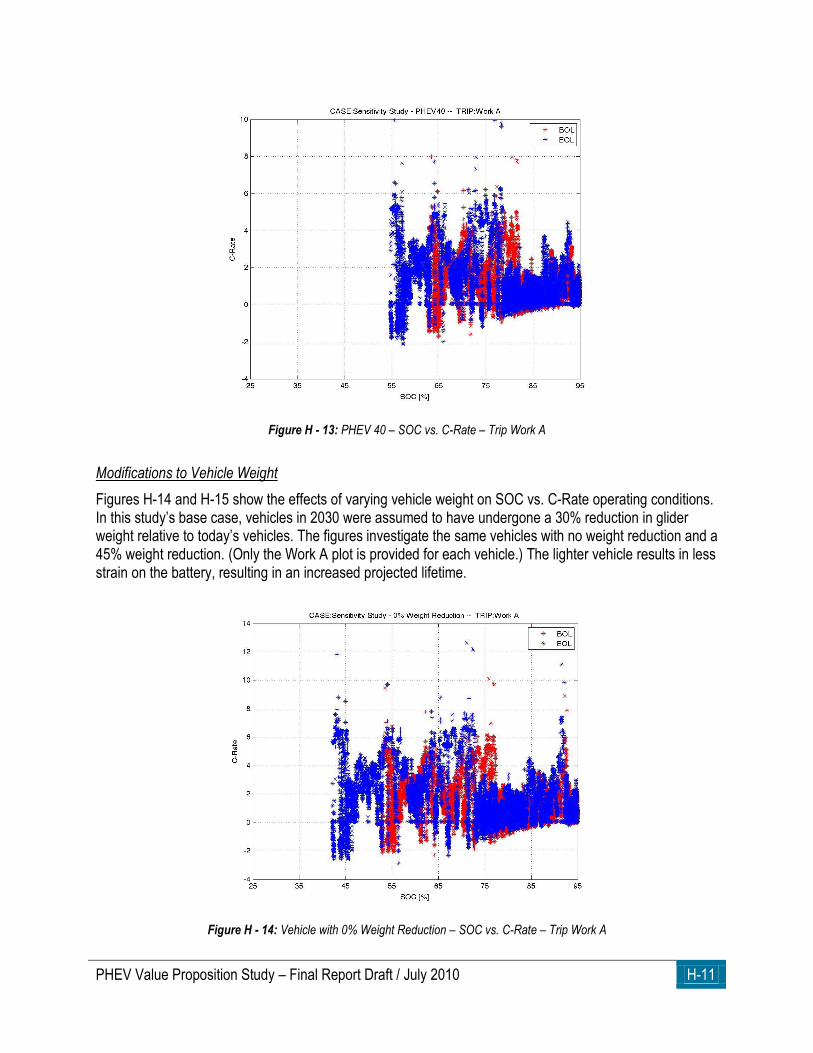
PHEV Value Proposition Study – Final Report Draft / July 2010 H-11
Figure H - 13: PHEV 40 – SOC vs. C-Rate – Trip Work A
Modifications to Vehicle Weight
Figures H-14 and H-15 show the effects of varying vehicle weight on SOC vs. C-Rate operating conditions. In this study’s base case, vehicles in 2030 were assumed to have undergone a 30% reduction in glider weight relative to today’s vehicles. The figures investigate the same vehicles with no weight reduction and a 45% weight reduction. (Only the Work A plot is provided for each vehicle.) The lighter vehicle results in less strain on the battery, resulting in an increased projected lifetime.
Figure H - 14: Vehicle with 0% Weight Reduction – SOC vs. C-Rate – Trip Work A

H-12 PHEV Value Proposition Study – Final Report Draft / July 2010
Figure H - 15: Vehicle with 45% Weight Reduction – SOC vs. C-Rate – Trip Work A
Modifications to Weekly Drive Cycles Modified driving habits also affect SOC vs. C-Rate operating conditions. In this case, the commute to work was extended by adding an HWFET cycle between the Work A’s existing UDDS and US06 cycles. The modified Work A plot is provided in the figure. As expected, the increased VMT from a longer daily commute decreases the projected life of the battery. A scenario with no weekend cycles was also conducted, which reduced lifetime VMT, resulting in increased the battery life expectancy. (Since this scenario did not affect the work commute, no plot is provided.
Figure H - 16: Extended Work Cycle – SOC vs. C-Rate – Trip Work A
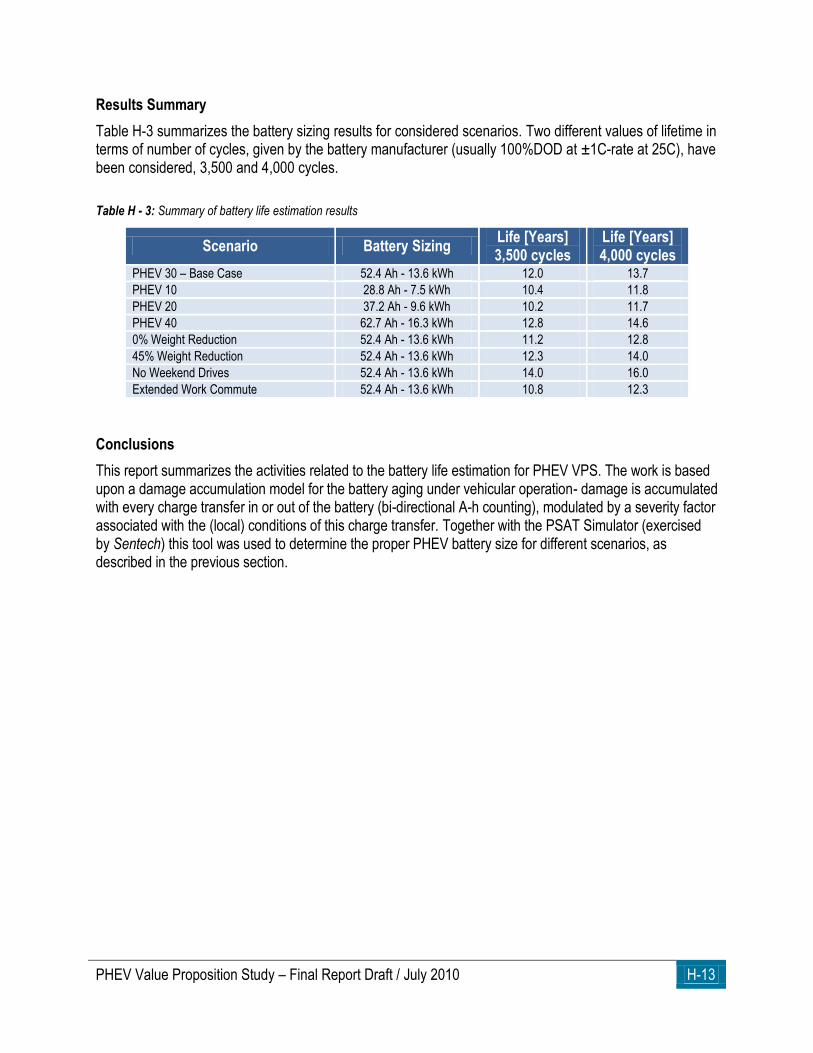
PHEV Value Proposition Study – Final Report Draft / July 2010 H-13
Results Summary
Table H-3 summarizes the battery sizing results for considered scenarios. Two different values of lifetime in terms of number of cycles, given by the battery manufacturer (usually 100%DOD at ±1C-rate at 25C), have been considered, 3,500 and 4,000 cycles.
Table H - 3: Summary of battery life estimation results
Scenario Battery Sizing Life [Years] 3,500 cycles
Life [Years] 4,000 cycles
PHEV 30 – Base Case 52.4 Ah - 13.6 kWh 12.0 13.7
PHEV 10 28.8 Ah - 7.5 kWh 10.4 11.8
PHEV 20 37.2 Ah - 9.6 kWh 10.2 11.7
PHEV 40 62.7 Ah - 16.3 kWh 12.8 14.6
0% Weight Reduction 52.4 Ah - 13.6 kWh 11.2 12.8
45% Weight Reduction 52.4 Ah - 13.6 kWh 12.3 14.0
No Weekend Drives 52.4 Ah - 13.6 kWh 14.0 16.0
Extended Work Commute 52.4 Ah - 13.6 kWh 10.8 12.3
Conclusions
This report summarizes the activities related to the battery life estimation for PHEV VPS. The work is based upon a damage accumulation model for the battery aging under vehicular operation- damage is accumulated with every charge transfer in or out of the battery (bi-directional A-h counting), modulated by a severity factor associated with the (local) conditions of this charge transfer. Together with the PSAT Simulator (exercised by Sentech) this tool was used to determine the proper PHEV battery size for different scenarios, as described in the previous section.

H-14 PHEV Value Proposition Study – Final Report Draft / July 2010
This page intentionally left blank.
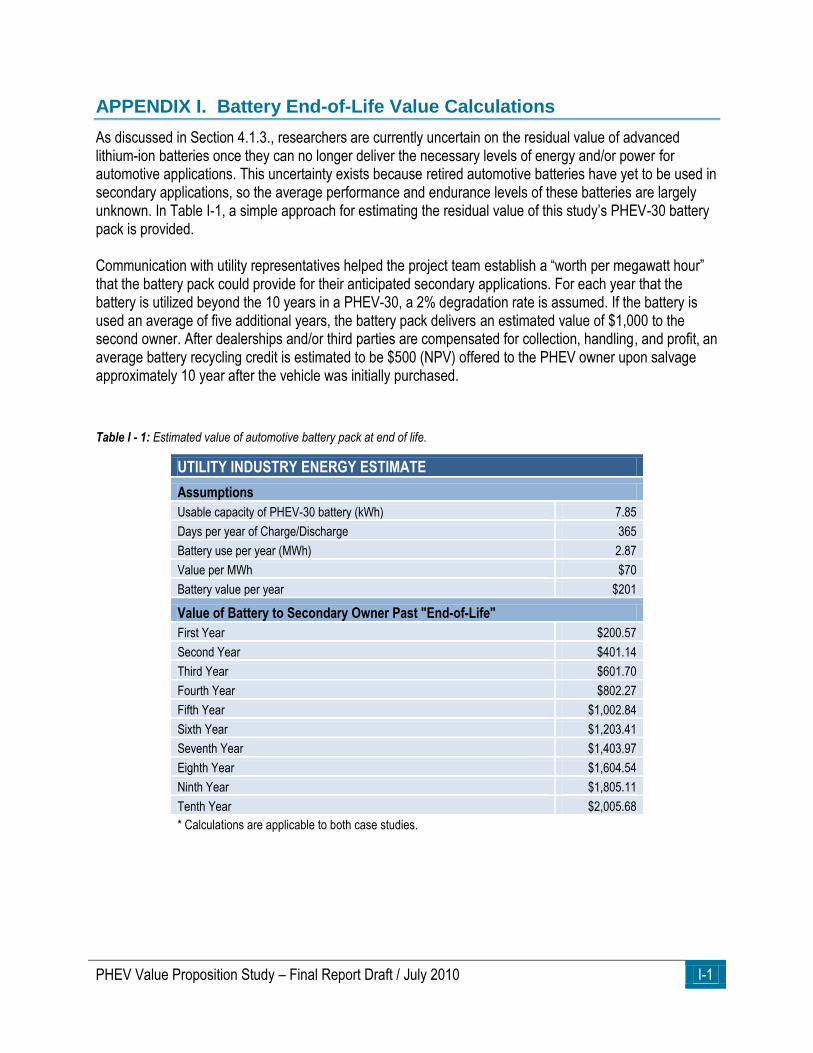
PHEV Value Proposition Study – Final Report Draft / July 2010 I-1
APPENDIX I. Battery End-of-Life Value Calculations
As discussed in Section 4.1.3., researchers are currently uncertain on the residual value of advanced lithium-ion batteries once they can no longer deliver the necessary levels of energy and/or power for automotive applications. This uncertainty exists because retired automotive batteries have yet to be used in secondary applications, so the average performance and endurance levels of these batteries are largely unknown. In Table I-1, a simple approach for estimating the residual value of this study’s PHEV-30 battery pack is provided.
Communication with utility representatives helped the project team establish a ―worth per megawatt hour‖ that the battery pack could provide for their anticipated secondary applications. For each year that the battery is utilized beyond the 10 years in a PHEV-30, a 2% degradation rate is assumed. If the battery is used an average of five additional years, the battery pack delivers an estimated value of $1,000 to the second owner. After dealerships and/or third parties are compensated for collection, handling, and profit, an average battery recycling credit is estimated to be $500 (NPV) offered to the PHEV owner upon salvage approximately 10 year after the vehicle was initially purchased.
Table I - 1: Estimated value of automotive battery pack at end of life.
UTILITY INDUSTRY ENERGY ESTIMATE
Assumptions
Usable capacity of PHEV-30 battery (kWh) 7.85
Days per year of Charge/Discharge 365
Battery use per year (MWh) 2.87
Value per MWh $70
Battery value per year $201
Value of Battery to Secondary Owner Past "End-of-Life"
First Year $200.57
Second Year $401.14
Third Year $601.70
Fourth Year $802.27
Fifth Year $1,002.84
Sixth Year $1,203.41
Seventh Year $1,403.97
Eighth Year $1,604.54
Ninth Year $1,805.11
Tenth Year $2,005.68
* Calculations are applicable to both case studies.

I-2 PHEV Value Proposition Study – Final Report Draft / July 2010
This page intentionally left blank.
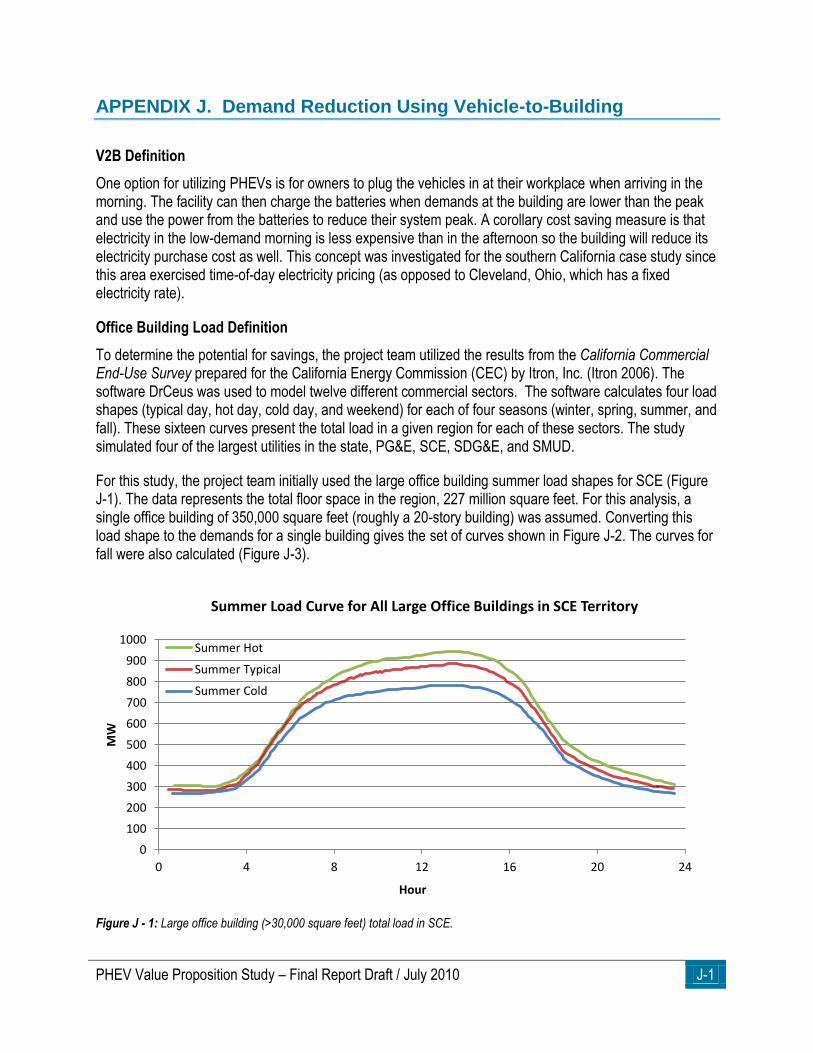
PHEV Value Proposition Study – Final Report Draft / July 2010 J-1
APPENDIX J. Demand Reduction Using Vehicle-to-Building
V2B Definition
One option for utilizing PHEVs is for owners to plug the vehicles in at their workplace when arriving in the morning. The facility can then charge the batteries when demands at the building are lower than the peak and use the power from the batteries to reduce their system peak. A corollary cost saving measure is that electricity in the low-demand morning is less expensive than in the afternoon so the building will reduce its electricity purchase cost as well. This concept was investigated for the southern California case study since this area exercised time-of-day electricity pricing (as opposed to Cleveland, Ohio, which has a fixed electricity rate).
Office Building Load Definition
To determine the potential for savings, the project team utilized the results from the California Commercial End-Use Survey prepared for the California Energy Commission (CEC) by Itron, Inc. (Itron 2006). The software DrCeus was used to model twelve different commercial sectors. The software calculates four load shapes (typical day, hot day, cold day, and weekend) for each of four seasons (winter, spring, summer, and fall). These sixteen curves present the total load in a given region for each of these sectors. The study simulated four of the largest utilities in the state, PG&E, SCE, SDG&E, and SMUD.
For this study, the project team initially used the large office building summer load shapes for SCE (Figure J-1). The data represents the total floor space in the region, 227 million square feet. For this analysis, a single office building of 350,000 square feet (roughly a 20-story building) was assumed. Converting this load shape to the demands for a single building gives the set of curves shown in Figure J-2. The curves for fall were also calculated (Figure J-3).
Figure J - 1: Large office building (>30,000 square feet) total load in SCE.
0
100
200
300
400
500
600
700
800
900
1000
0 4 8 12 16 20 24
MW
Hour
Summer Load Curve for All Large Office Buildings in SCE Territory
Summer Hot
Summer Typical
Summer Cold
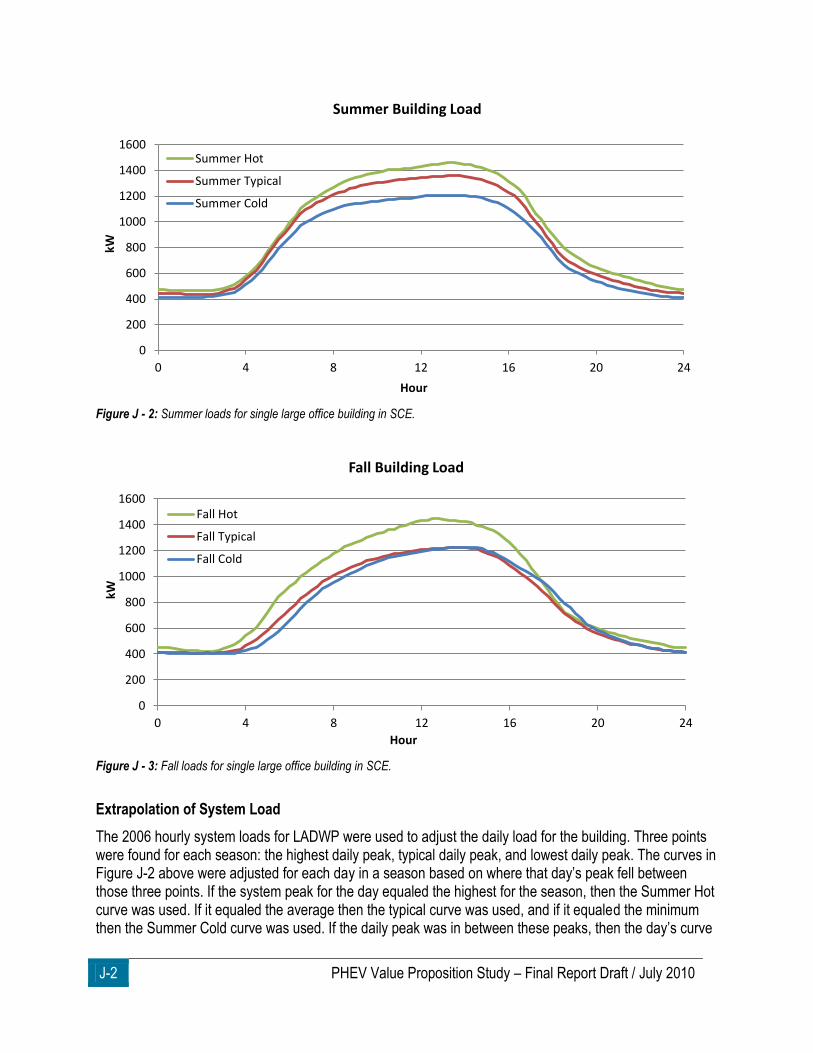
J-2 PHEV Value Proposition Study – Final Report Draft / July 2010
Figure J - 2: Summer loads for single large office building in SCE.
Figure J - 3: Fall loads for single large office building in SCE.
Extrapolation of System Load
The 2006 hourly system loads for LADWP were used to adjust the daily load for the building. Three points were found for each season: the highest daily peak, typical daily peak, and lowest daily peak. The curves in Figure J-2 above were adjusted for each day in a season based on where that day’s peak fell between those three points. If the system peak for the day equaled the highest for the season, then the Summer Hot curve was used. If it equaled the average then the typical curve was used, and if it equaled the minimum then the Summer Cold curve was used. If the daily peak was in between these peaks, then the day’s curve
0
200
400
600
800
1000
1200
1400
1600
0 4 8 12 16 20 24
kW
Hour
Summer Building Load
Summer Hot
Summer Typical
Summer Cold
0
200
400
600
800
1000
1200
1400
1600
0 4 8 12 16 20 24
kW
Hour
Fall Building Load
Fall Hot
Fall Typical
Fall Cold
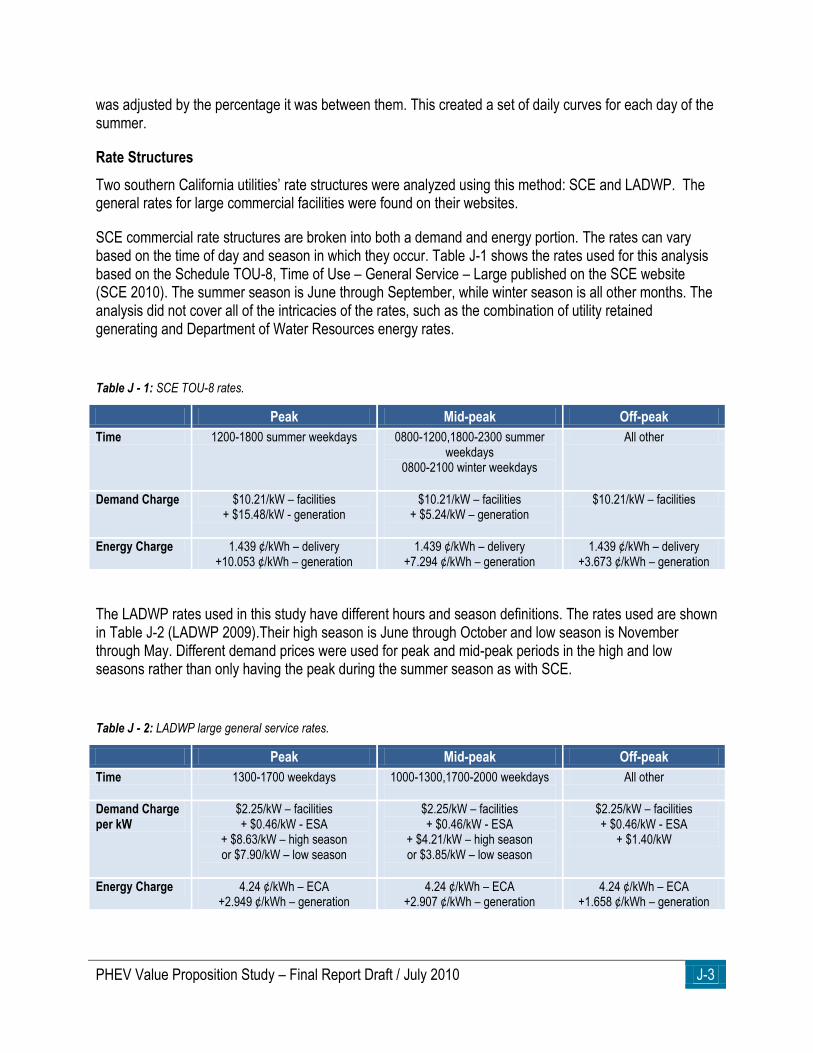
PHEV Value Proposition Study – Final Report Draft / July 2010 J-3
was adjusted by the percentage it was between them. This created a set of daily curves for each day of the summer.
Rate Structures
Two southern California utilities’ rate structures were analyzed using this method: SCE and LADWP. The general rates for large commercial facilities were found on their websites.
SCE commercial rate structures are broken into both a demand and energy portion. The rates can vary based on the time of day and season in which they occur. Table J-1 shows the rates used for this analysis based on the Schedule TOU-8, Time of Use – General Service – Large published on the SCE website (SCE 2010). The summer season is June through September, while winter season is all other months. The analysis did not cover all of the intricacies of the rates, such as the combination of utility retained generating and Department of Water Resources energy rates.
Table J - 1: SCE TOU-8 rates.
Peak Mid-peak Off-peak
Time 1200-1800 summer weekdays 0800-1200,1800-2300 summer weekdays
0800-2100 winter weekdays
All other
Demand Charge $10.21/kW – facilities + $15.48/kW - generation
$10.21/kW – facilities + $5.24/kW – generation
$10.21/kW – facilities
Energy Charge 1.439 ¢/kWh – delivery +10.053 ¢/kWh – generation
1.439 ¢/kWh – delivery +7.294 ¢/kWh – generation
1.439 ¢/kWh – delivery +3.673 ¢/kWh – generation
The LADWP rates used in this study have different hours and season definitions. The rates used are shown in Table J-2 (LADWP 2009).Their high season is June through October and low season is November through May. Different demand prices were used for peak and mid-peak periods in the high and low seasons rather than only having the peak during the summer season as with SCE.
Table J - 2: LADWP large general service rates.
Peak Mid-peak Off-peak
Time 1300-1700 weekdays 1000-1300,1700-2000 weekdays
All other
Demand Charge per kW
$2.25/kW – facilities + $0.46/kW - ESA
+ $8.63/kW – high season or $7.90/kW – low season
$2.25/kW – facilities + $0.46/kW - ESA
+ $4.21/kW – high season or $3.85/kW – low season
$2.25/kW – facilities + $0.46/kW - ESA
+ $1.40/kW
Energy Charge 4.24 ¢/kWh – ECA +2.949 ¢/kWh – generation
4.24 ¢/kWh – ECA +2.907 ¢/kWh – generation
4.24 ¢/kWh – ECA +1.658 ¢/kWh – generation
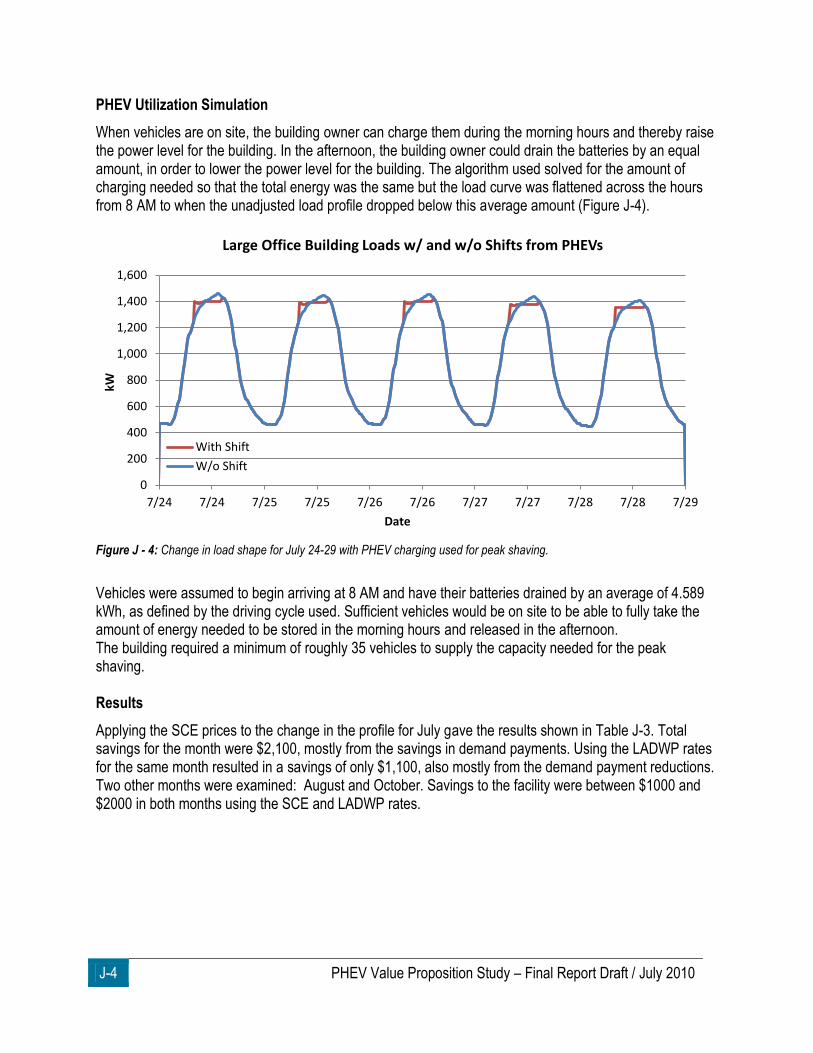
J-4 PHEV Value Proposition Study – Final Report Draft / July 2010
PHEV Utilization Simulation
When vehicles are on site, the building owner can charge them during the morning hours and thereby raise the power level for the building. In the afternoon, the building owner could drain the batteries by an equal amount, in order to lower the power level for the building. The algorithm used solved for the amount of charging needed so that the total energy was the same but the load curve was flattened across the hours from 8 AM to when the unadjusted load profile dropped below this average amount (Figure J-4).
Figure J - 4: Change in load shape for July 24-29 with PHEV charging used for peak shaving.
Vehicles were assumed to begin arriving at 8 AM and have their batteries drained by an average of 4.589 kWh, as defined by the driving cycle used. Sufficient vehicles would be on site to be able to fully take the amount of energy needed to be stored in the morning hours and released in the afternoon. The building required a minimum of roughly 35 vehicles to supply the capacity needed for the peak shaving. Results
Applying the SCE prices to the change in the profile for July gave the results shown in Table J-3. Total savings for the month were $2,100, mostly from the savings in demand payments. Using the LADWP rates for the same month resulted in a savings of only $1,100, also mostly from the demand payment reductions. Two other months were examined: August and October. Savings to the facility were between $1000 and $2000 in both months using the SCE and LADWP rates.
0
200
400
600
800
1,000
1,200
1,400
1,600
7/24 7/24 7/25 7/25 7/26 7/26 7/27 7/27 7/28 7/28 7/29
kW
Date
Large Office Building Loads w/ and w/o Shifts from PHEVs
With Shift
W/o Shift
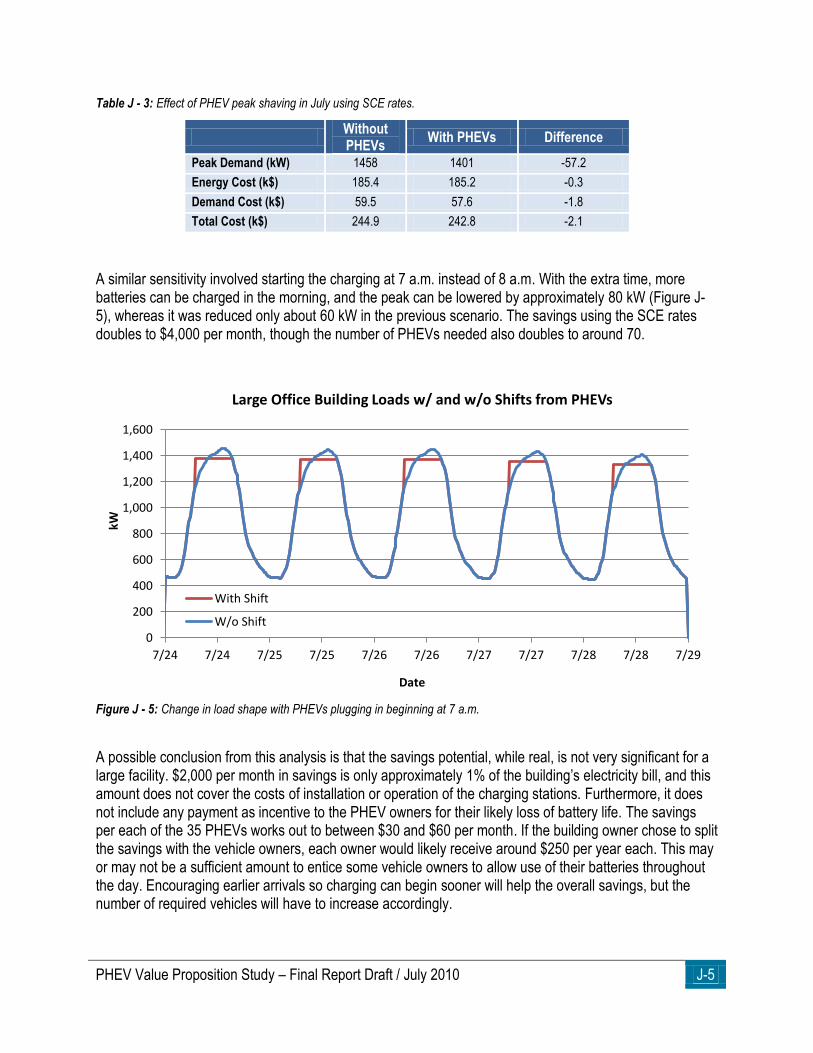
PHEV Value Proposition Study – Final Report Draft / July 2010 J-5
Table J - 3: Effect of PHEV peak shaving in July using SCE rates.
Without PHEVs
With PHEVs Difference
Peak Demand (kW) 1458 1401 -57.2
Energy Cost (k$) 185.4 185.2 -0.3
Demand Cost (k$) 59.5 57.6 -1.8
Total Cost (k$) 244.9 242.8 -2.1
A similar sensitivity involved starting the charging at 7 a.m. instead of 8 a.m. With the extra time, more batteries can be charged in the morning, and the peak can be lowered by approximately 80 kW (Figure J-5), whereas it was reduced only about 60 kW in the previous scenario. The savings using the SCE rates doubles to $4,000 per month, though the number of PHEVs needed also doubles to around 70.
Figure J - 5: Change in load shape with PHEVs plugging in beginning at 7 a.m.
A possible conclusion from this analysis is that the savings potential, while real, is not very significant for a large facility. $2,000 per month in savings is only approximately 1% of the building’s electricity bill, and this amount does not cover the costs of installation or operation of the charging stations. Furthermore, it does not include any payment as incentive to the PHEV owners for their likely loss of battery life. The savings per each of the 35 PHEVs works out to between $30 and $60 per month. If the building owner chose to split the savings with the vehicle owners, each owner would likely receive around $250 per year each. This may or may not be a sufficient amount to entice some vehicle owners to allow use of their batteries throughout the day. Encouraging earlier arrivals so charging can begin sooner will help the overall savings, but the number of required vehicles will have to increase accordingly.
0
200
400
600
800
1,000
1,200
1,400
1,600
7/24 7/24 7/25 7/25 7/26 7/26 7/27 7/27 7/28 7/28 7/29
kW
Date
Large Office Building Loads w/ and w/o Shifts from PHEVs
With Shift
W/o Shift

J-6 PHEV Value Proposition Study – Final Report Draft / July 2010
This page intentionally left blank.
PHEV Value Proposition Study – Final Report Draft / July 2010 K-1
APPENDIX K. Electric Generation Analysis
The key characteristic of PHEVs is that they recharge from the electricity grid to substitute/supplement gasoline use. Because electricity is generated at the time of use, the timing when vehicles recharge can greatly affect what equipment a utility will use for the generation. Furthermore, any given region will have a different mix of generation technologies and other demands on the grid, and these must all be taken into account when determining the impact of PHEVs. For this analysis, we used the ORCED model (Hadley 2008). The model has been used for over a decade on a wide variety of generation studies. The most recent work was a study of the impact of PHEVs on all thirteen regions of the country (Hadley and Tsvetkova 2008). The model utilizes inputs and results from the EIA NEMS model. Specific cases from studies by EIA are downloaded from their website and run locally to collect additional region-specific information. There are four topics that need to be examined to complete an analysis of PHEVs on the market. First, the supply of electric capacity must be defined. This includes the types of plants, efficiencies, outage rates, operating costs, fuel costs, and emissions. Second, the base demand without PHEVs must be determined. This requires hourly demands for the region, along with the net change in generation requirements due to imports or exports. Third, the total demand from PHEVs is required. This involves finding the size of the market, the plug-in times for the vehicles, the capacity of the batteries, and consequent length of time the vehicles are drawing power from the grid. Last, supply and demand must be matched against each other and the consequent market impacts calculated. At least two scenarios must be run, with and without the PHEVs, to determine the added effect from the vehicles. The analysis process and results for the California study are documented in Appendix G of the Interim Report (Genung et al, 2009) and is summarized in this appendix as well. The analysis of the ECAR region required establishment of three supply and demand scenarios, each based on a different NEMS run. The cases were all developed by EIA for their analysis of the ACESA (DOE 2009). Our reference scenario is based on the ―Basic‖ scenario, which includes CO2 costs of roughly $65 per metric ton in 2030. Another scenario, their reference, is based on the updated AEO2009 and does not include any CO2 cost impacts. The last one used, the ―no international offset and limited alternatives‖ resulted in the highest cost for CO2 at $191 per metric ton by 2030. Supply
Our grid analysis covers the entire ECAR market rather than just the northern Ohio region around Cleveland. The NERC has separated the country into multiple reliability regions. The Ohio region’s electricity supply is controlled by the ReliabilityFirst Corporation. While the reliability regulations are enforced by the corporation, the Midwest electricity market itself is dominated by two independent system operators, PJM and Midwest ISO. Their territories interconnect so that power is balanced throughout the region. It is expected that by 2030 the electricity markets will be even more unified so that power supply and demand will be balanced over large areas. Our grid analysis for California covers the entire state rather than just southern California. In California, the electric grid is operated as a whole, with the California ISO creating a statewide market for electricity. Some municipal utilities are outside of the CAISO market, but still purchase and sell into that market. Data is available for the regional market, but generally not for individual utilities.

K-2 PHEV Value Proposition Study – Final Report Draft / July 2010
For the electricity market, the NEMS model separates the country into thirteen regions based on the NERC reliability regions as of 2003 (Figure K-1). The NERC regions have changed significantly since then and EIA is planning on redefining the regions in NEMS but that has not been completed yet. As a consequence, the best method for modeling the electricity market in ORCED is to use the NERC regions as used in NEMS. This allows easy transfer of data from that model into ORCED.
Figure K - 1: Thirteen NERC Regions used in NEMS and other models
The EIA NEMS model calculates the power production and sales for the entire ECAR region as a whole through 2030. We determined the list of power plants operated within the region from NEMS input file for the Annual Energy Outlook 2009 (which are the same plants as for the HR2454 analyses). We then added the ―unplanned‖ capacity that the model calculated as needed in each scenario from the EIA HR2454 analysis: Base, No CO2 Cost, and High CO2 Cost. Retirements were also accounted for. The resulting total capacity by technology in ORCED roughly matched the capacity defined in the each NEMS scenario (Table K-1). Table K - 1: ECAR 2030 Generating Capacity for Three Supply Scenarios
Generating Capacity (GW) NEMS- Base
ORCED-Base
NEMS-No CO2 Cost
ORCED-No CO2 Cost
NEMS-High CO2
cost
ORCED-High CO2 cost
Coal 75.5 74.3 86.4 84.7 43.8 42.6
Oil and Natural Gas Steam 1.3 1.3 1.2 1.2 3.3 3.3
Combined Cycle 22.8 22.7 14.8 14.7 28.7 28.6
Combustion Turbine/Diesel 21.0 20.2 30.0 28.8 27.2 26.4
Nuclear Power 7.9 7.9 7.9 7.9 7.9 7.9
Pumped Storage 3.7 3.6 3.7 3.6 3.7 3.6
Renewable Sources 3.8 3.9 2.5 3.2 6.6 6.7
Total Capacity 136.0 133.9 146.5 144.0 121.2 119.1
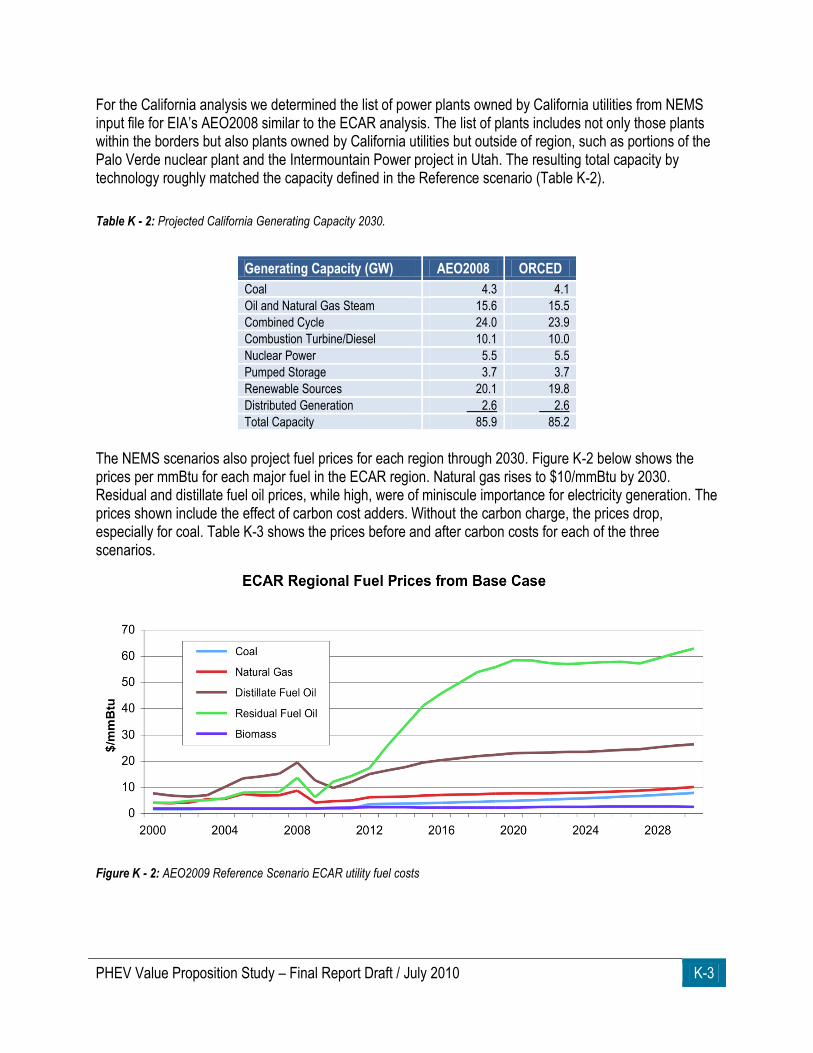
PHEV Value Proposition Study – Final Report Draft / July 2010 K-3
For the California analysis we determined the list of power plants owned by California utilities from NEMS input file for EIA’s AEO2008 similar to the ECAR analysis. The list of plants includes not only those plants within the borders but also plants owned by California utilities but outside of region, such as portions of the Palo Verde nuclear plant and the Intermountain Power project in Utah. The resulting total capacity by technology roughly matched the capacity defined in the Reference scenario (Table K-2).
Table K - 2: Projected California Generating Capacity 2030.
Generating Capacity (GW) AEO2008 ORCED
Coal 4.3 4.1
Oil and Natural Gas Steam 15.6 15.5
Combined Cycle 24.0 23.9
Combustion Turbine/Diesel 10.1 10.0
Nuclear Power 5.5 5.5
Pumped Storage 3.7 3.7
Renewable Sources 20.1 19.8
Distributed Generation 2.6 2.6
Total Capacity 85.9 85.2
The NEMS scenarios also project fuel prices for each region through 2030. Figure K-2 below shows the prices per mmBtu for each major fuel in the ECAR region. Natural gas rises to $10/mmBtu by 2030. Residual and distillate fuel oil prices, while high, were of miniscule importance for electricity generation. The prices shown include the effect of carbon cost adders. Without the carbon charge, the prices drop, especially for coal. Table K-3 shows the prices before and after carbon costs for each of the three scenarios.
Figure K - 2: AEO2009 Reference Scenario ECAR utility fuel costs
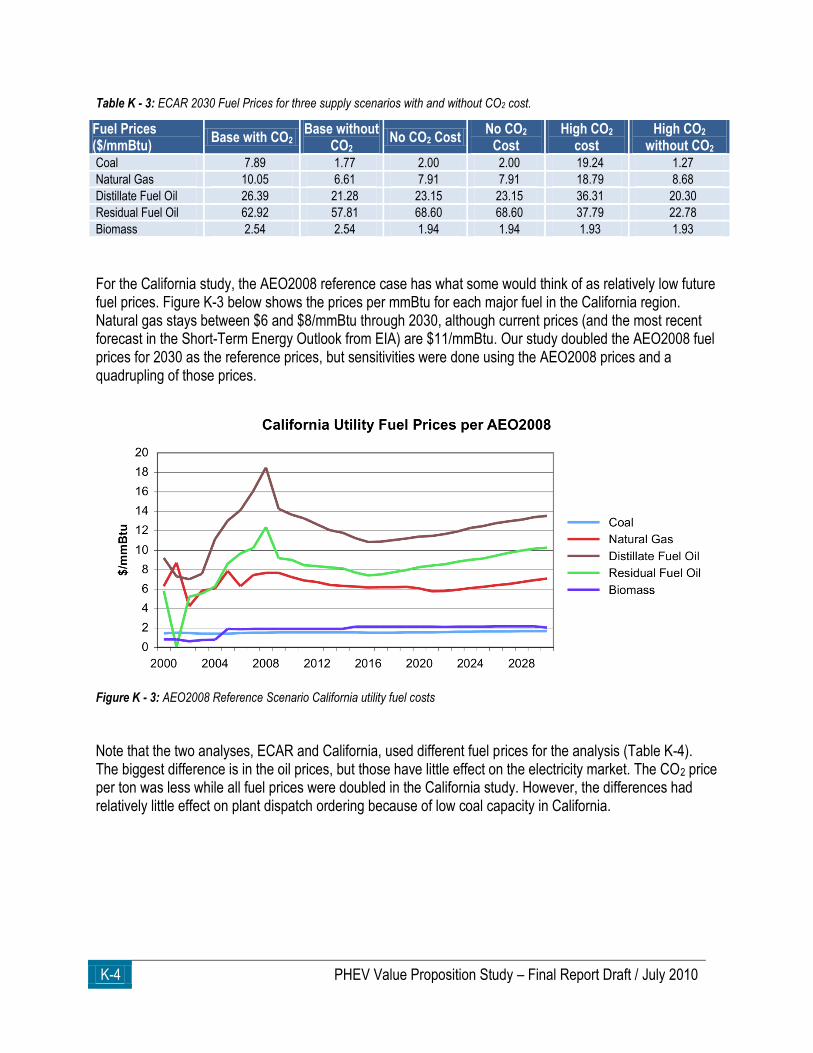
K-4 PHEV Value Proposition Study – Final Report Draft / July 2010
Table K - 3: ECAR 2030 Fuel Prices for three supply scenarios with and without CO2 cost.
Fuel Prices ($/mmBtu)
Base with CO2 Base without
CO2 No CO2 Cost
No CO2 Cost
High CO2 cost
High CO2 without CO2
Coal 7.89 1.77 2.00 2.00 19.24 1.27
Natural Gas 10.05 6.61 7.91 7.91 18.79 8.68
Distillate Fuel Oil 26.39 21.28 23.15 23.15 36.31 20.30
Residual Fuel Oil 62.92 57.81 68.60 68.60 37.79 22.78
Biomass 2.54 2.54 1.94 1.94 1.93 1.93
For the California study, the AEO2008 reference case has what some would think of as relatively low future fuel prices. Figure K-3 below shows the prices per mmBtu for each major fuel in the California region. Natural gas stays between $6 and $8/mmBtu through 2030, although current prices (and the most recent forecast in the Short-Term Energy Outlook from EIA) are $11/mmBtu. Our study doubled the AEO2008 fuel prices for 2030 as the reference prices, but sensitivities were done using the AEO2008 prices and a quadrupling of those prices.
Figure K - 3: AEO2008 Reference Scenario California utility fuel costs
Note that the two analyses, ECAR and California, used different fuel prices for the analysis (Table K-4). The biggest difference is in the oil prices, but those have little effect on the electricity market. The CO2 price per ton was less while all fuel prices were doubled in the California study. However, the differences had relatively little effect on plant dispatch ordering because of low coal capacity in California.
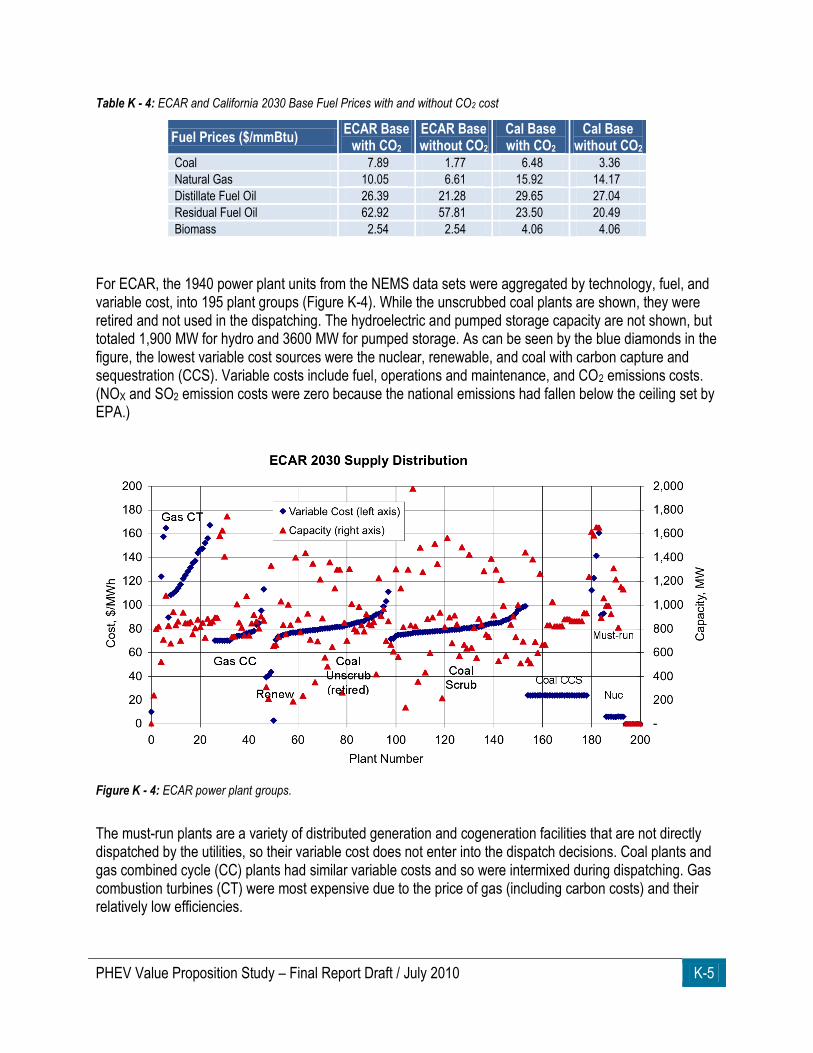
PHEV Value Proposition Study – Final Report Draft / July 2010 K-5
Table K - 4: ECAR and California 2030 Base Fuel Prices with and without CO2 cost
Fuel Prices ($/mmBtu) ECAR Base
with CO2 ECAR Base without CO2
Cal Base with CO2
Cal Base without CO2
Coal 7.89 1.77 6.48 3.36
Natural Gas 10.05 6.61 15.92 14.17
Distillate Fuel Oil 26.39 21.28 29.65 27.04
Residual Fuel Oil 62.92 57.81 23.50 20.49
Biomass 2.54 2.54 4.06 4.06
For ECAR, the 1940 power plant units from the NEMS data sets were aggregated by technology, fuel, and variable cost, into 195 plant groups (Figure K-4). While the unscrubbed coal plants are shown, they were retired and not used in the dispatching. The hydroelectric and pumped storage capacity are not shown, but totaled 1,900 MW for hydro and 3600 MW for pumped storage. As can be seen by the blue diamonds in the figure, the lowest variable cost sources were the nuclear, renewable, and coal with carbon capture and sequestration (CCS). Variable costs include fuel, operations and maintenance, and CO2 emissions costs. (NOX and SO2 emission costs were zero because the national emissions had fallen below the ceiling set by EPA.)
Figure K - 4: ECAR power plant groups.
The must-run plants are a variety of distributed generation and cogeneration facilities that are not directly dispatched by the utilities, so their variable cost does not enter into the dispatch decisions. Coal plants and gas combined cycle (CC) plants had similar variable costs and so were intermixed during dispatching. Gas combustion turbines (CT) were most expensive due to the price of gas (including carbon costs) and their relatively low efficiencies.
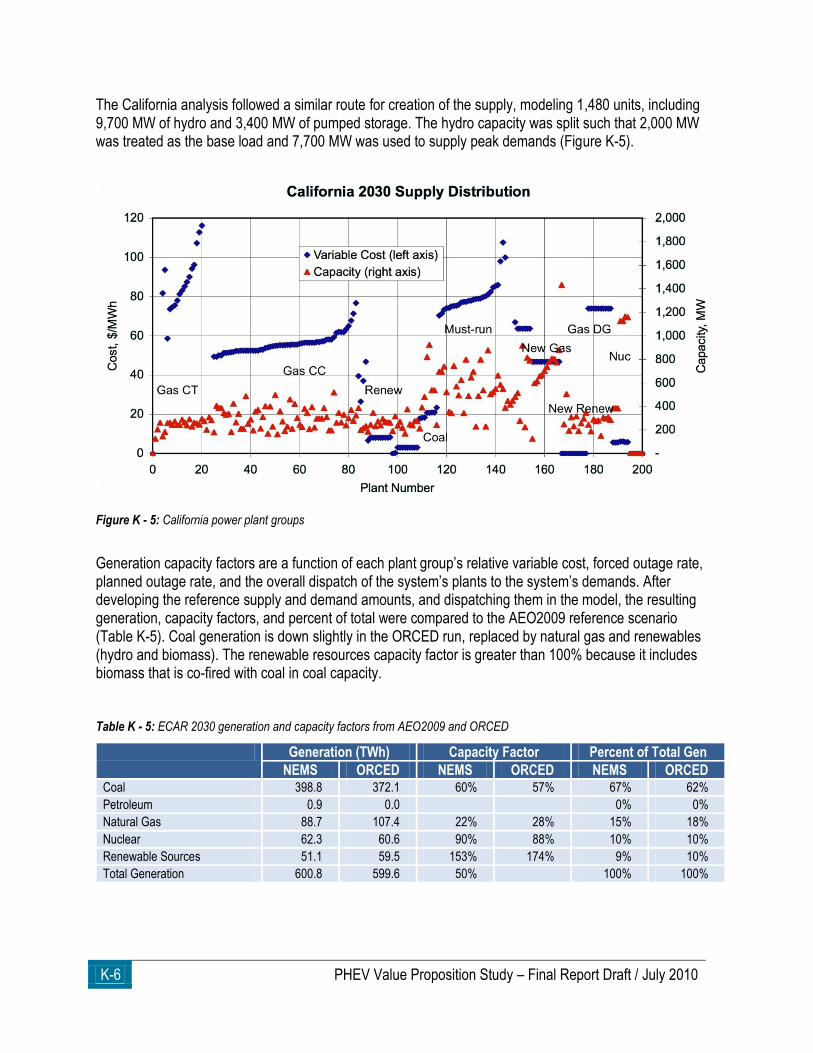
K-6 PHEV Value Proposition Study – Final Report Draft / July 2010
The California analysis followed a similar route for creation of the supply, modeling 1,480 units, including 9,700 MW of hydro and 3,400 MW of pumped storage. The hydro capacity was split such that 2,000 MW was treated as the base load and 7,700 MW was used to supply peak demands (Figure K-5).
Figure K - 5: California power plant groups
Generation capacity factors are a function of each plant group’s relative variable cost, forced outage rate, planned outage rate, and the overall dispatch of the system’s plants to the system’s demands. After developing the reference supply and demand amounts, and dispatching them in the model, the resulting generation, capacity factors, and percent of total were compared to the AEO2009 reference scenario (Table K-5). Coal generation is down slightly in the ORCED run, replaced by natural gas and renewables (hydro and biomass). The renewable resources capacity factor is greater than 100% because it includes biomass that is co-fired with coal in coal capacity. Table K - 5: ECAR 2030 generation and capacity factors from AEO2009 and ORCED
Generation (TWh) Capacity Factor Percent of Total Gen
NEMS ORCED NEMS ORCED NEMS ORCED Coal 398.8 372.1 60% 57% 67% 62%
Petroleum 0.9 0.0 0% 0%
Natural Gas 88.7 107.4 22% 28% 15% 18%
Nuclear 62.3 60.6 90% 88% 10% 10%
Renewable Sources 51.1 59.5 153% 174% 9% 10%
Total Generation 600.8 599.6 50% 100% 100%
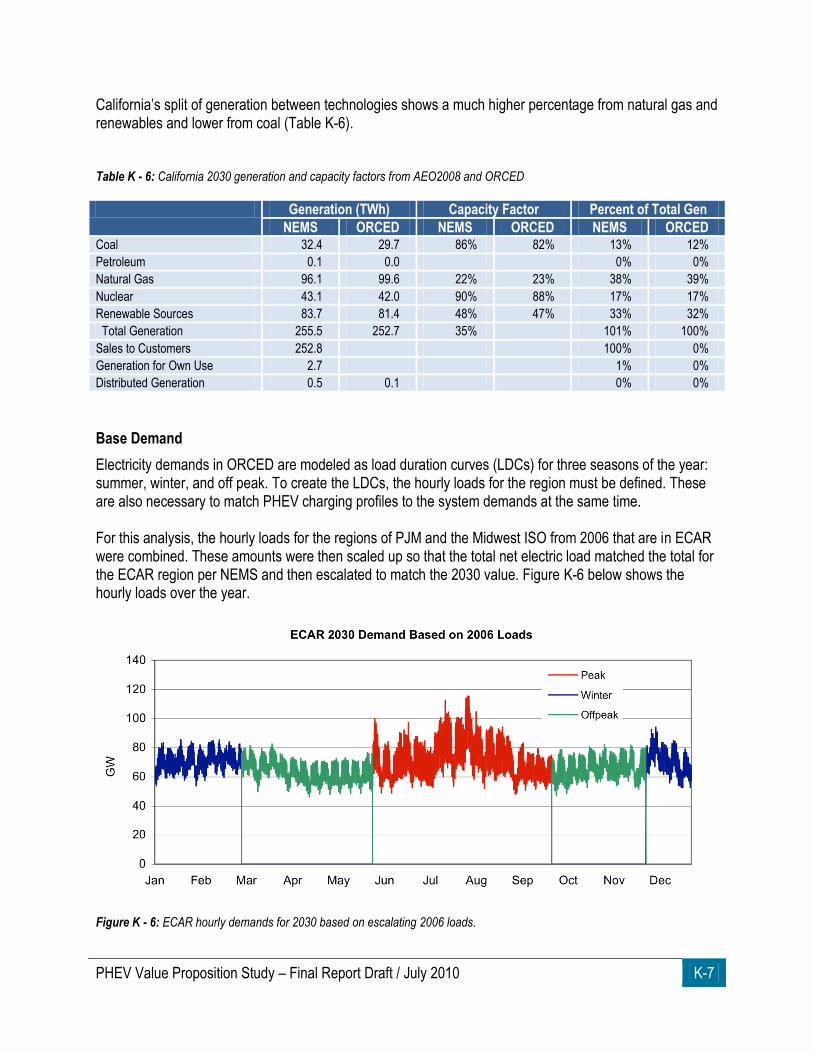
PHEV Value Proposition Study – Final Report Draft / July 2010 K-7
California’s split of generation between technologies shows a much higher percentage from natural gas and renewables and lower from coal (Table K-6). Table K - 6: California 2030 generation and capacity factors from AEO2008 and ORCED
Generation (TWh) Capacity Factor Percent of Total Gen
NEMS ORCED NEMS ORCED NEMS ORCED Coal 32.4 29.7 86% 82% 13% 12%
Petroleum 0.1 0.0 0% 0%
Natural Gas 96.1 99.6 22% 23% 38% 39%
Nuclear 43.1 42.0 90% 88% 17% 17%
Renewable Sources 83.7 81.4 48% 47% 33% 32%
Total Generation 255.5 252.7 35% 101% 100%
Sales to Customers 252.8 100% 0%
Generation for Own Use 2.7 1% 0%
Distributed Generation 0.5 0.1 0% 0%
Base Demand
Electricity demands in ORCED are modeled as load duration curves (LDCs) for three seasons of the year: summer, winter, and off peak. To create the LDCs, the hourly loads for the region must be defined. These are also necessary to match PHEV charging profiles to the system demands at the same time. For this analysis, the hourly loads for the regions of PJM and the Midwest ISO from 2006 that are in ECAR were combined. These amounts were then scaled up so that the total net electric load matched the total for the ECAR region per NEMS and then escalated to match the 2030 value. Figure K-6 below shows the hourly loads over the year.
Figure K - 6: ECAR hourly demands for 2030 based on escalating 2006 loads.
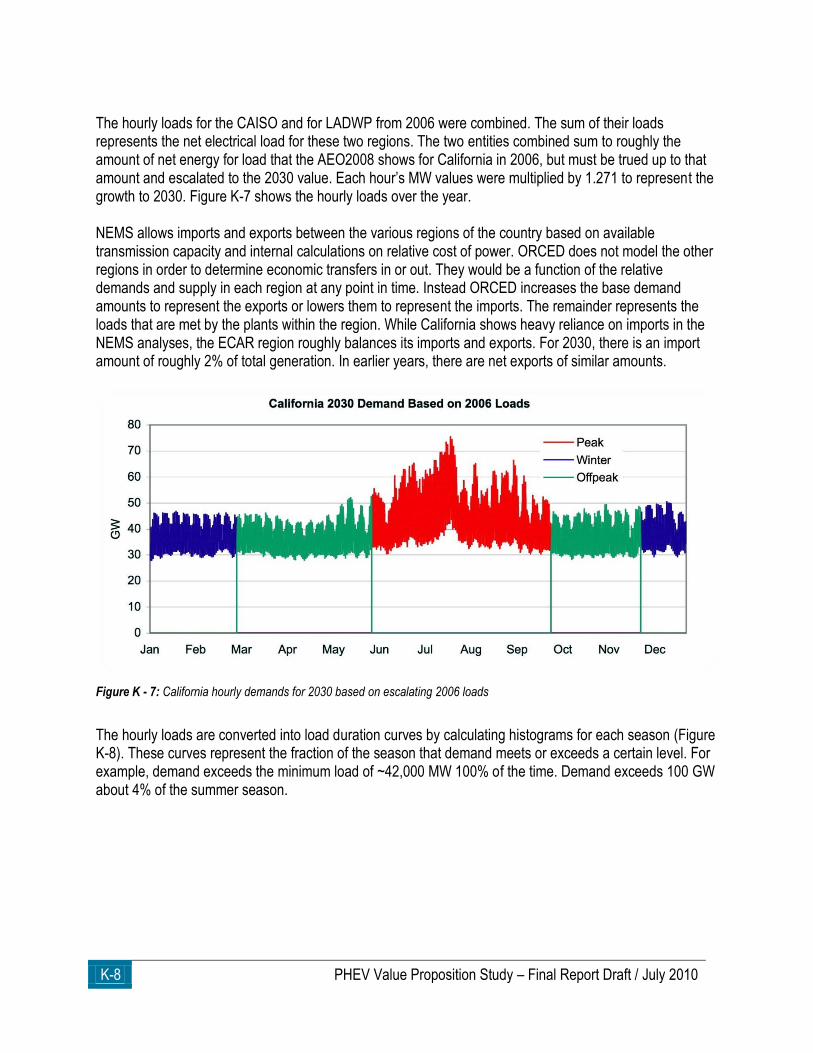
K-8 PHEV Value Proposition Study – Final Report Draft / July 2010
The hourly loads for the CAISO and for LADWP from 2006 were combined. The sum of their loads represents the net electrical load for these two regions. The two entities combined sum to roughly the amount of net energy for load that the AEO2008 shows for California in 2006, but must be trued up to that amount and escalated to the 2030 value. Each hour’s MW values were multiplied by 1.271 to represent the growth to 2030. Figure K-7 shows the hourly loads over the year. NEMS allows imports and exports between the various regions of the country based on available transmission capacity and internal calculations on relative cost of power. ORCED does not model the other regions in order to determine economic transfers in or out. They would be a function of the relative demands and supply in each region at any point in time. Instead ORCED increases the base demand amounts to represent the exports or lowers them to represent the imports. The remainder represents the loads that are met by the plants within the region. While California shows heavy reliance on imports in the NEMS analyses, the ECAR region roughly balances its imports and exports. For 2030, there is an import amount of roughly 2% of total generation. In earlier years, there are net exports of similar amounts.
Figure K - 7: California hourly demands for 2030 based on escalating 2006 loads
The hourly loads are converted into load duration curves by calculating histograms for each season (Figure K-8). These curves represent the fraction of the season that demand meets or exceeds a certain level. For example, demand exceeds the minimum load of ~42,000 MW 100% of the time. Demand exceeds 100 GW about 4% of the summer season.
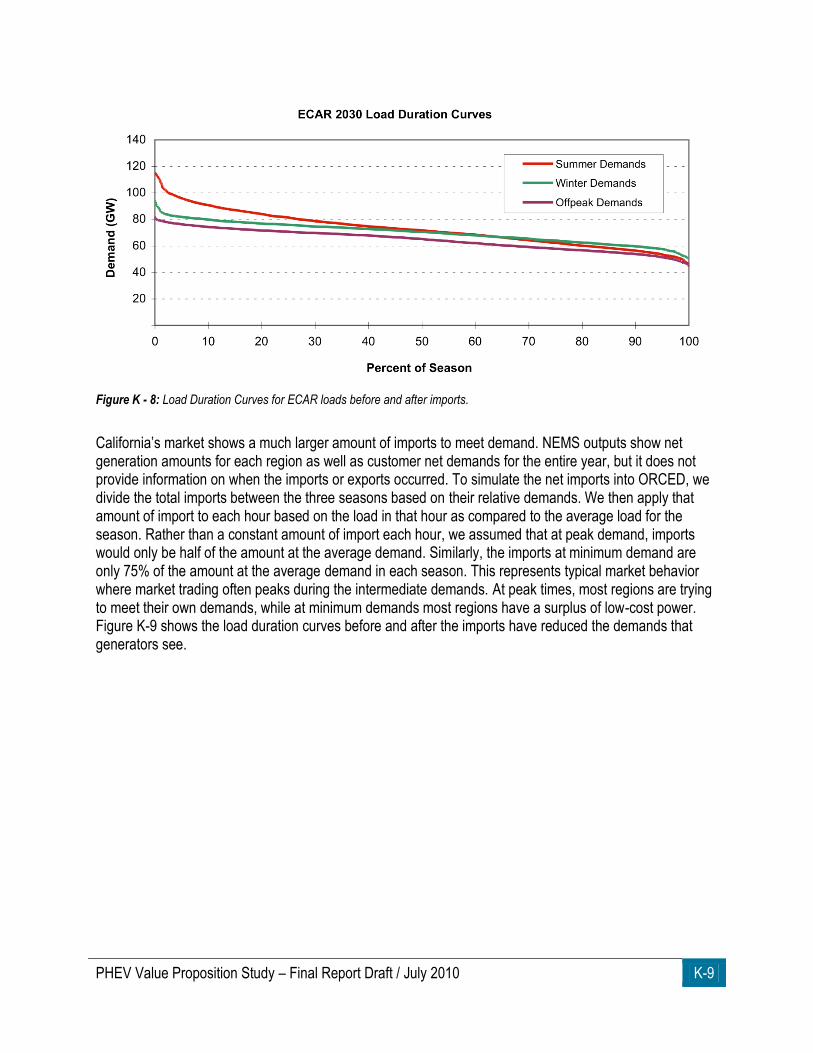
PHEV Value Proposition Study – Final Report Draft / July 2010 K-9
Figure K - 8: Load Duration Curves for ECAR loads before and after imports.
California’s market shows a much larger amount of imports to meet demand. NEMS outputs show net generation amounts for each region as well as customer net demands for the entire year, but it does not provide information on when the imports or exports occurred. To simulate the net imports into ORCED, we divide the total imports between the three seasons based on their relative demands. We then apply that amount of import to each hour based on the load in that hour as compared to the average load for the season. Rather than a constant amount of import each hour, we assumed that at peak demand, imports would only be half of the amount at the average demand. Similarly, the imports at minimum demand are only 75% of the amount at the average demand in each season. This represents typical market behavior where market trading often peaks during the intermediate demands. At peak times, most regions are trying to meet their own demands, while at minimum demands most regions have a surplus of low-cost power. Figure K-9 shows the load duration curves before and after the imports have reduced the demands that generators see.
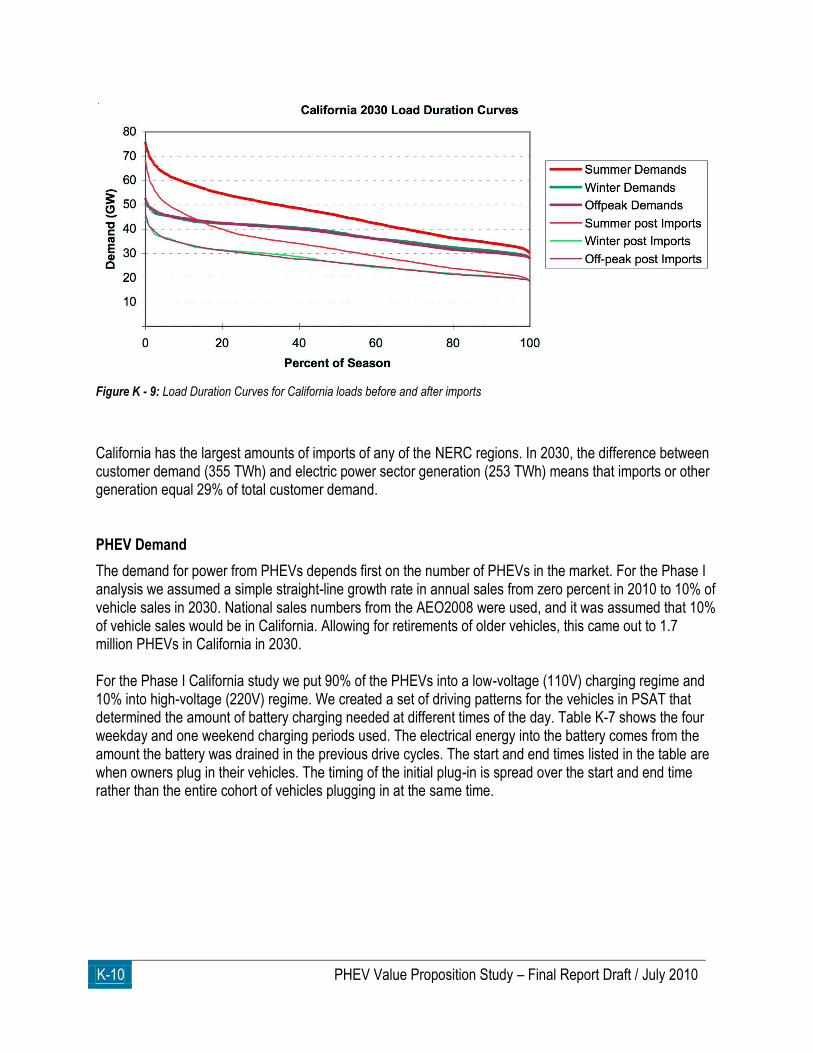
K-10 PHEV Value Proposition Study – Final Report Draft / July 2010
Figure K - 9: Load Duration Curves for California loads before and after imports
California has the largest amounts of imports of any of the NERC regions. In 2030, the difference between customer demand (355 TWh) and electric power sector generation (253 TWh) means that imports or other generation equal 29% of total customer demand. PHEV Demand
The demand for power from PHEVs depends first on the number of PHEVs in the market. For the Phase I analysis we assumed a simple straight-line growth rate in annual sales from zero percent in 2010 to 10% of vehicle sales in 2030. National sales numbers from the AEO2008 were used, and it was assumed that 10% of vehicle sales would be in California. Allowing for retirements of older vehicles, this came out to 1.7 million PHEVs in California in 2030. For the Phase I California study we put 90% of the PHEVs into a low-voltage (110V) charging regime and 10% into high-voltage (220V) regime. We created a set of driving patterns for the vehicles in PSAT that determined the amount of battery charging needed at different times of the day. Table K-7 shows the four weekday and one weekend charging periods used. The electrical energy into the battery comes from the amount the battery was drained in the previous drive cycles. The start and end times listed in the table are when owners plug in their vehicles. The timing of the initial plug-in is spread over the start and end time rather than the entire cohort of vehicles plugging in at the same time.
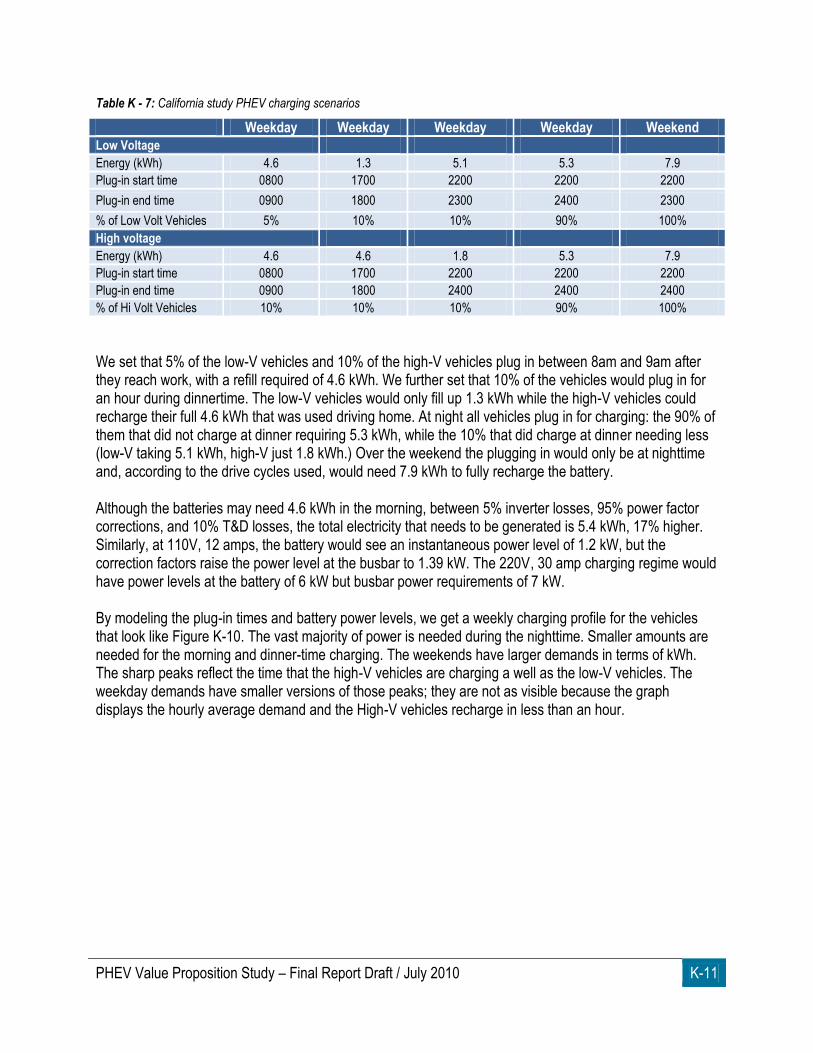
PHEV Value Proposition Study – Final Report Draft / July 2010 K-11
Table K - 7: California study PHEV charging scenarios
Weekday Weekday Weekday Weekday Weekend
Low Voltage Energy (kWh) 4.6 1.3 5.1 5.3 7.9
Plug-in start time 0800 1700 2200 2200 2200
Plug-in end time 0900 1800 2300 2400 2300
% of Low Volt Vehicles 5% 10% 10% 90% 100%
High voltage Energy (kWh) 4.6 4.6 1.8 5.3 7.9
Plug-in start time 0800 1700 2200 2200 2200
Plug-in end time 0900 1800 2400 2400 2400
% of Hi Volt Vehicles 10% 10% 10% 90% 100%
We set that 5% of the low-V vehicles and 10% of the high-V vehicles plug in between 8am and 9am after they reach work, with a refill required of 4.6 kWh. We further set that 10% of the vehicles would plug in for an hour during dinnertime. The low-V vehicles would only fill up 1.3 kWh while the high-V vehicles could recharge their full 4.6 kWh that was used driving home. At night all vehicles plug in for charging: the 90% of them that did not charge at dinner requiring 5.3 kWh, while the 10% that did charge at dinner needing less (low-V taking 5.1 kWh, high-V just 1.8 kWh.) Over the weekend the plugging in would only be at nighttime and, according to the drive cycles used, would need 7.9 kWh to fully recharge the battery. Although the batteries may need 4.6 kWh in the morning, between 5% inverter losses, 95% power factor corrections, and 10% T&D losses, the total electricity that needs to be generated is 5.4 kWh, 17% higher. Similarly, at 110V, 12 amps, the battery would see an instantaneous power level of 1.2 kW, but the correction factors raise the power level at the busbar to 1.39 kW. The 220V, 30 amp charging regime would have power levels at the battery of 6 kW but busbar power requirements of 7 kW. By modeling the plug-in times and battery power levels, we get a weekly charging profile for the vehicles that look like Figure K-10. The vast majority of power is needed during the nighttime. Smaller amounts are needed for the morning and dinner-time charging. The weekends have larger demands in terms of kWh. The sharp peaks reflect the time that the high-V vehicles are charging a well as the low-V vehicles. The weekday demands have smaller versions of those peaks; they are not as visible because the graph displays the hourly average demand and the High-V vehicles recharge in less than an hour.
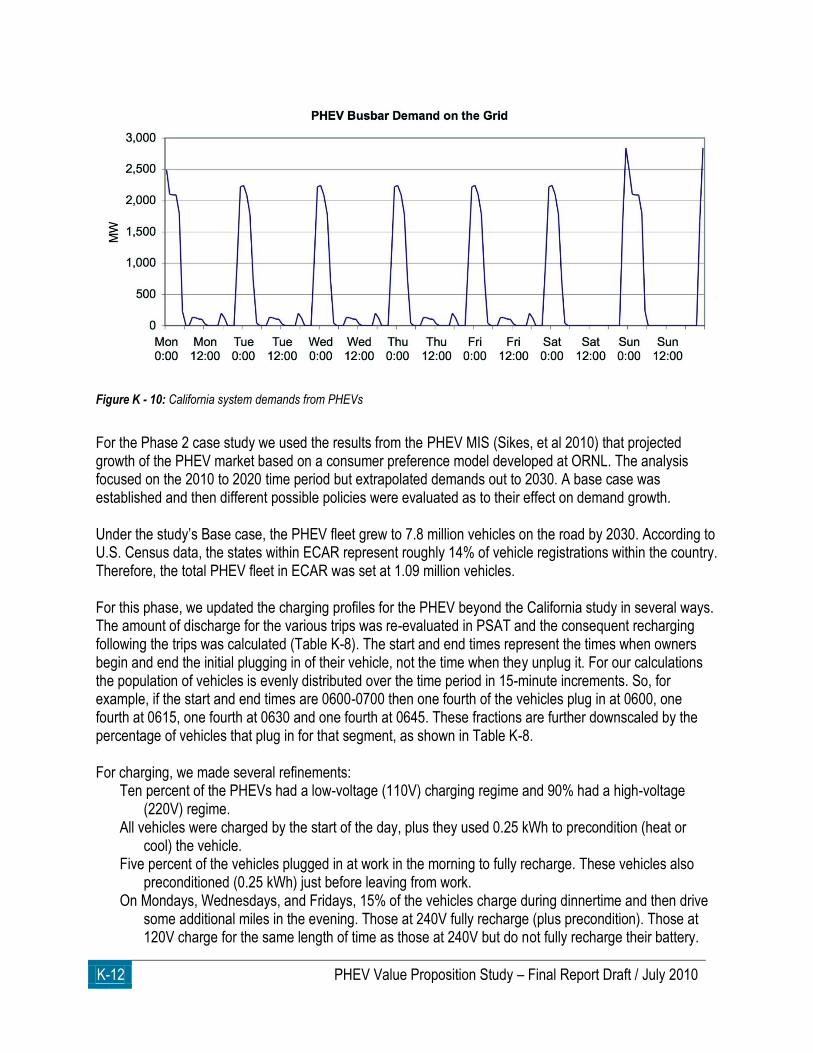
K-12 PHEV Value Proposition Study – Final Report Draft / July 2010
Figure K - 10: California system demands from PHEVs
For the Phase 2 case study we used the results from the PHEV MIS (Sikes, et al 2010) that projected growth of the PHEV market based on a consumer preference model developed at ORNL. The analysis focused on the 2010 to 2020 time period but extrapolated demands out to 2030. A base case was established and then different possible policies were evaluated as to their effect on demand growth. Under the study’s Base case, the PHEV fleet grew to 7.8 million vehicles on the road by 2030. According to U.S. Census data, the states within ECAR represent roughly 14% of vehicle registrations within the country. Therefore, the total PHEV fleet in ECAR was set at 1.09 million vehicles. For this phase, we updated the charging profiles for the PHEV beyond the California study in several ways. The amount of discharge for the various trips was re-evaluated in PSAT and the consequent recharging following the trips was calculated (Table K-8). The start and end times represent the times when owners begin and end the initial plugging in of their vehicle, not the time when they unplug it. For our calculations the population of vehicles is evenly distributed over the time period in 15-minute increments. So, for example, if the start and end times are 0600-0700 then one fourth of the vehicles plug in at 0600, one fourth at 0615, one fourth at 0630 and one fourth at 0645. These fractions are further downscaled by the percentage of vehicles that plug in for that segment, as shown in Table K-8.
For charging, we made several refinements: Ten percent of the PHEVs had a low-voltage (110V) charging regime and 90% had a high-voltage
(220V) regime. All vehicles were charged by the start of the day, plus they used 0.25 kWh to precondition (heat or
cool) the vehicle. Five percent of the vehicles plugged in at work in the morning to fully recharge. These vehicles also
preconditioned (0.25 kWh) just before leaving from work. On Mondays, Wednesdays, and Fridays, 15% of the vehicles charge during dinnertime and then drive
some additional miles in the evening. Those at 240V fully recharge (plus precondition). Those at 120V charge for the same length of time as those at 240V but do not fully recharge their battery.
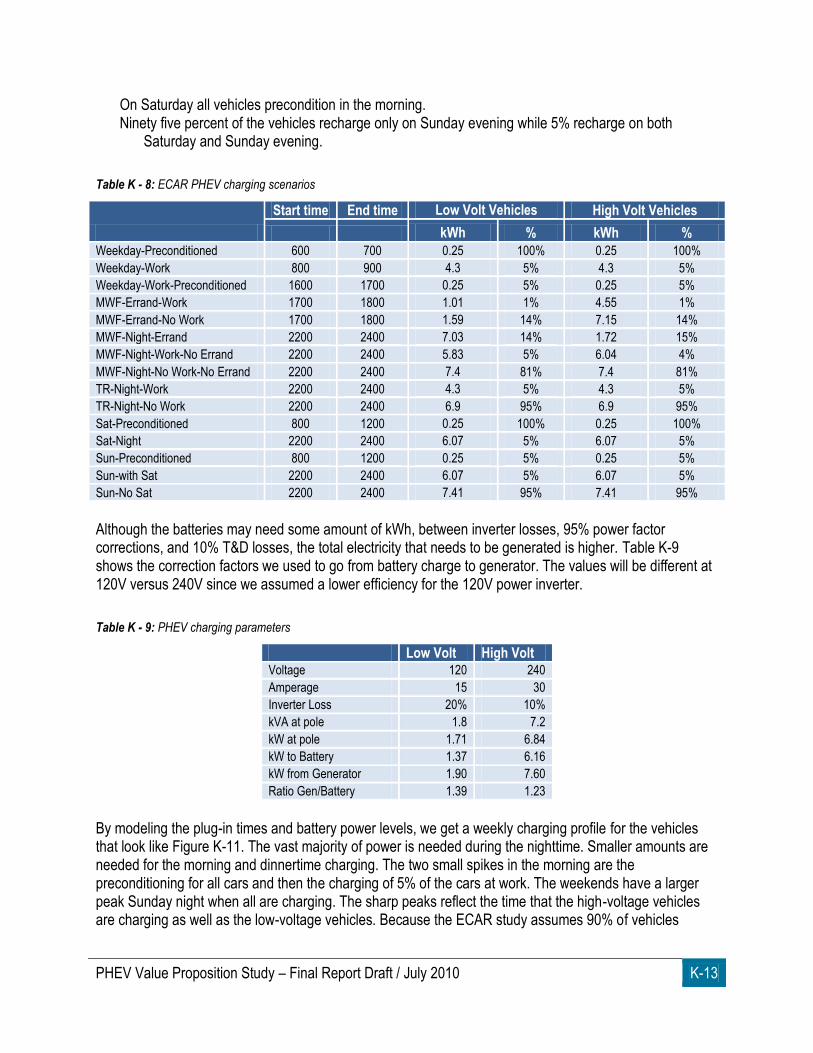
PHEV Value Proposition Study – Final Report Draft / July 2010 K-13
On Saturday all vehicles precondition in the morning. Ninety five percent of the vehicles recharge only on Sunday evening while 5% recharge on both
Saturday and Sunday evening.
Table K - 8: ECAR PHEV charging scenarios
Start time End time Low Volt Vehicles High Volt Vehicles
kWh % kWh %
Weekday-Preconditioned 600 700 0.25 100% 0.25 100%
Weekday-Work 800 900 4.3 5% 4.3 5%
Weekday-Work-Preconditioned 1600 1700 0.25 5% 0.25 5%
MWF-Errand-Work 1700 1800 1.01 1% 4.55 1%
MWF-Errand-No Work 1700 1800 1.59 14% 7.15 14%
MWF-Night-Errand 2200 2400 7.03 14% 1.72 15%
MWF-Night-Work-No Errand 2200 2400 5.83 5% 6.04 4%
MWF-Night-No Work-No Errand 2200 2400 7.4 81% 7.4 81%
TR-Night-Work 2200 2400 4.3 5% 4.3 5%
TR-Night-No Work 2200 2400 6.9 95% 6.9 95%
Sat-Preconditioned 800 1200 0.25 100% 0.25 100%
Sat-Night 2200 2400 6.07 5% 6.07 5%
Sun-Preconditioned 800 1200 0.25 5% 0.25 5%
Sun-with Sat 2200 2400 6.07 5% 6.07 5%
Sun-No Sat 2200 2400 7.41 95% 7.41 95%
Although the batteries may need some amount of kWh, between inverter losses, 95% power factor corrections, and 10% T&D losses, the total electricity that needs to be generated is higher. Table K-9 shows the correction factors we used to go from battery charge to generator. The values will be different at 120V versus 240V since we assumed a lower efficiency for the 120V power inverter.
Table K - 9: PHEV charging parameters
Low Volt High Volt Voltage 120 240
Amperage 15 30
Inverter Loss 20% 10%
kVA at pole 1.8 7.2
kW at pole 1.71 6.84
kW to Battery 1.37 6.16
kW from Generator 1.90 7.60
Ratio Gen/Battery 1.39 1.23
By modeling the plug-in times and battery power levels, we get a weekly charging profile for the vehicles that look like Figure K-11. The vast majority of power is needed during the nighttime. Smaller amounts are needed for the morning and dinnertime charging. The two small spikes in the morning are the preconditioning for all cars and then the charging of 5% of the cars at work. The weekends have a larger peak Sunday night when all are charging. The sharp peaks reflect the time that the high-voltage vehicles are charging as well as the low-voltage vehicles. Because the ECAR study assumes 90% of vehicles
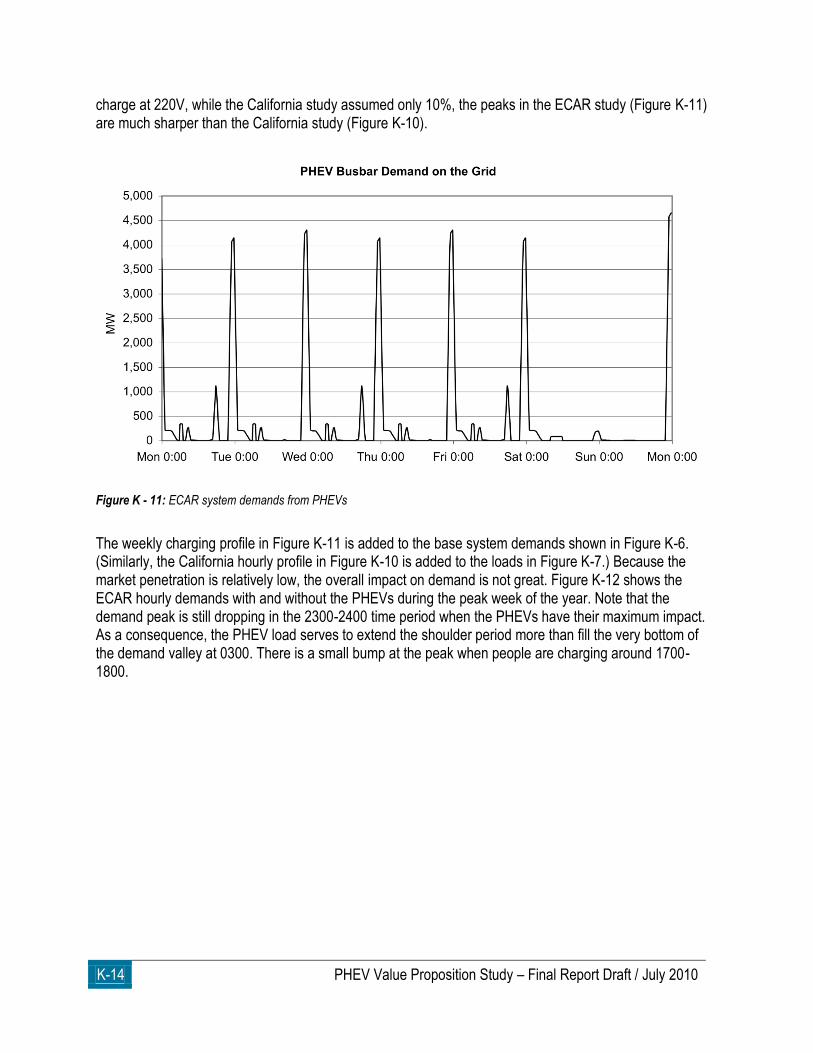
K-14 PHEV Value Proposition Study – Final Report Draft / July 2010
charge at 220V, while the California study assumed only 10%, the peaks in the ECAR study (Figure K-11) are much sharper than the California study (Figure K-10).
Figure K - 11: ECAR system demands from PHEVs
The weekly charging profile in Figure K-11 is added to the base system demands shown in Figure K-6. (Similarly, the California hourly profile in Figure K-10 is added to the loads in Figure K-7.) Because the market penetration is relatively low, the overall impact on demand is not great. Figure K-12 shows the ECAR hourly demands with and without the PHEVs during the peak week of the year. Note that the demand peak is still dropping in the 2300-2400 time period when the PHEVs have their maximum impact. As a consequence, the PHEV load serves to extend the shoulder period more than fill the very bottom of the demand valley at 0300. There is a small bump at the peak when people are charging around 1700-1800.
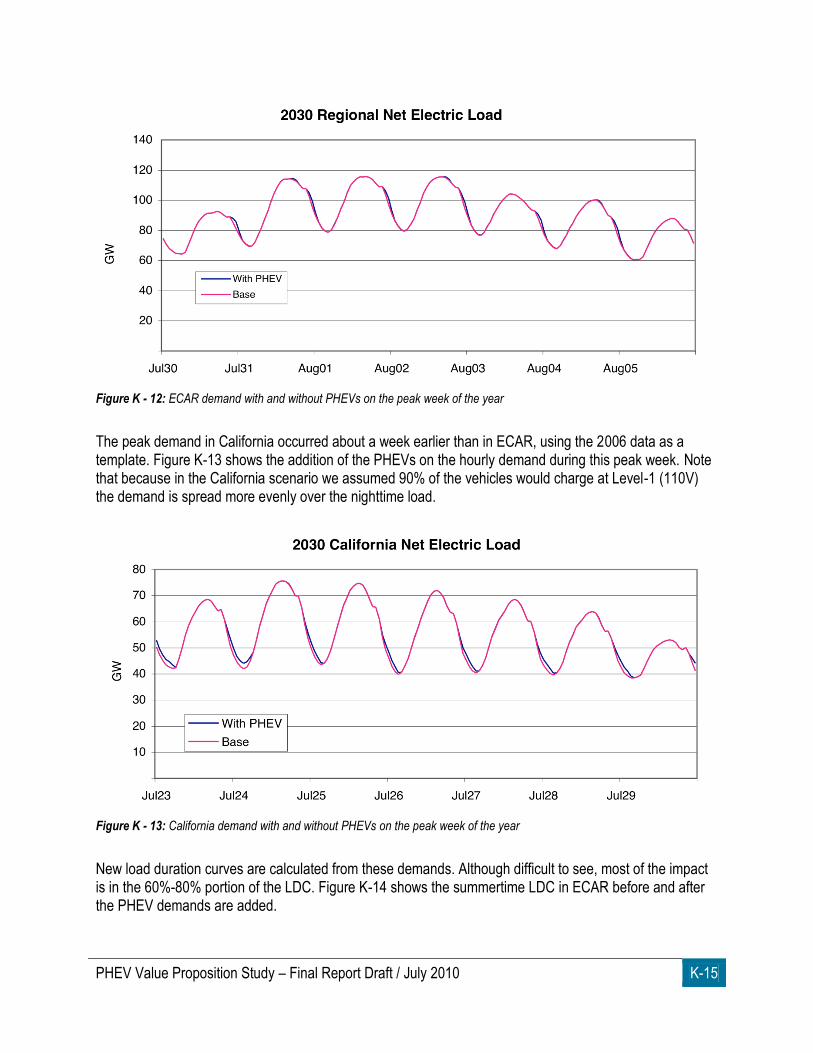
PHEV Value Proposition Study – Final Report Draft / July 2010 K-15
Figure K - 12: ECAR demand with and without PHEVs on the peak week of the year
The peak demand in California occurred about a week earlier than in ECAR, using the 2006 data as a template. Figure K-13 shows the addition of the PHEVs on the hourly demand during this peak week. Note that because in the California scenario we assumed 90% of the vehicles would charge at Level-1 (110V) the demand is spread more evenly over the nighttime load.
Figure K - 13: California demand with and without PHEVs on the peak week of the year
New load duration curves are calculated from these demands. Although difficult to see, most of the impact is in the 60%-80% portion of the LDC. Figure K-14 shows the summertime LDC in ECAR before and after the PHEV demands are added.

K-16 PHEV Value Proposition Study – Final Report Draft / July 2010
Figure K - 14: ECAR summer load duration curves with and without PHEV-added demand
Because the California PHEV growth is larger than the ECAR scenario, the impact on the load shape is slightly more significant. Figure K-15 shows the summer load duration curves for the California study with and without the PHEVs. The additional demand is clearly visible in the lower portions of the LDC.
Figure K - 15: California summer load duration curves with and without PHEV-added demand
Dispatch Results
Once Supply and Demands have been calculated, they are transferred to the Dispatch module of ORCED. Here an intricate set of recursive and probabilistic dispatch calculations are done to determine the amount of time each generating plant group is called upon to provide power. From this, financial and environmental

PHEV Value Proposition Study – Final Report Draft / July 2010 K-17
impacts of the generation are determined. PHEV scenarios are compared to the base scenario to determine the impact of the added PHEV demand. First, a reference case was run to simulate the conditions from the HR2454cap scenario without PHEVs and the resulting wholesale electricity prices were found. These can be back-calculated to the corresponding demands to determine hourly wholesale electricity prices (Figure K-16). Prices average around 7.4 ¢/kWh, the marginal cost of many of the coal and natural gas combined cycle plants seen in Figure K-3. Daily peak prices are higher, especially in the summer when the annual peak is reached and prices climb up to 98 ¢/kWh. Because of the carbon charge of $65 per metric ton of CO2, the variable costs from coal and natural gas combined cycle are around the same. As a result, prices do not stray far and depend on the price of gas and efficiency of the plant. Combustion turbines are called for only at peak times.
Figure K - 16: Hourly loads to generators and corresponding hourly marginal prices
The same analysis was run with the LDCs that include the PHEV charging profile from Figure K-11 included. Overall prices do not change significantly, which is to be expected with the small additions. However, subtracting the results of the PHEV case from the no-PHEV case shows the marginal impact on generation and emissions. Total generation increased by 3.30 TWh, or 0.55% of the total 600 TWh for the region. CO2 production increased by 2,300 metric tons, accounting for a 1.0% increase. This is larger than the generation percentage increase because the added generation is more carbon intensive than the average generation mix. Figure K-17 shows the capacity and generation for base case and the added generation for PHEVs. Although there is a wide mix of base generation within ECAR, the added amount for PHEVs comes mainly from coal-fired plants (without carbon capture and sequestration) and gas-fired combined cycle plants. The renewable proportion of the added generation is from biomass cofired with coal in the coal-fired plants. With 15% of the coal replaced by biomass, an increase in production from these plants increases both the coal-fired generation and the biomass generation.
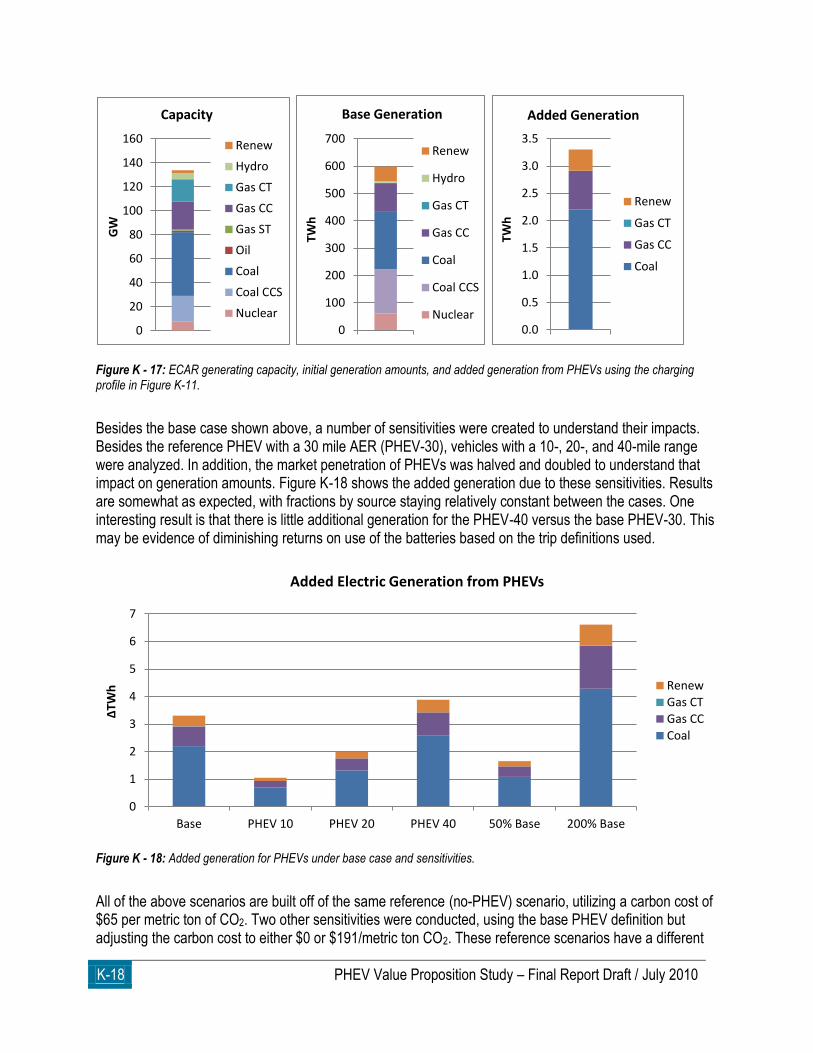
K-18 PHEV Value Proposition Study – Final Report Draft / July 2010
Figure K - 17: ECAR generating capacity, initial generation amounts, and added generation from PHEVs using the charging profile in Figure K-11.
Besides the base case shown above, a number of sensitivities were created to understand their impacts. Besides the reference PHEV with a 30 mile AER (PHEV-30), vehicles with a 10-, 20-, and 40-mile range were analyzed. In addition, the market penetration of PHEVs was halved and doubled to understand that impact on generation amounts. Figure K-18 shows the added generation due to these sensitivities. Results are somewhat as expected, with fractions by source staying relatively constant between the cases. One interesting result is that there is little additional generation for the PHEV-40 versus the base PHEV-30. This may be evidence of diminishing returns on use of the batteries based on the trip definitions used.
Figure K - 18: Added generation for PHEVs under base case and sensitivities.
All of the above scenarios are built off of the same reference (no-PHEV) scenario, utilizing a carbon cost of $65 per metric ton of CO2. Two other sensitivities were conducted, using the base PHEV definition but adjusting the carbon cost to either $0 or $191/metric ton CO2. These reference scenarios have a different
0
20
40
60
80
100
120
140
160
GW
Capacity
Renew
Hydro
Gas CT
Gas CC
Gas ST
Oil
Coal
Coal CCS
Nuclear
0
100
200
300
400
500
600
700
TWh
Base Generation
Renew
Hydro
Gas CT
Gas CC
Coal
Coal CCS
Nuclear0.0
0.5
1.0
1.5
2.0
2.5
3.0
3.5
TWh
Added Generation
Renew
Gas CT
Gas CC
Coal
0
1
2
3
4
5
6
7
Base PHEV 10 PHEV 20 PHEV 40 50% Base 200% Base
∆TW
h
Added Electric Generation from PHEVs
Renew
Gas CT
Gas CC
Coal
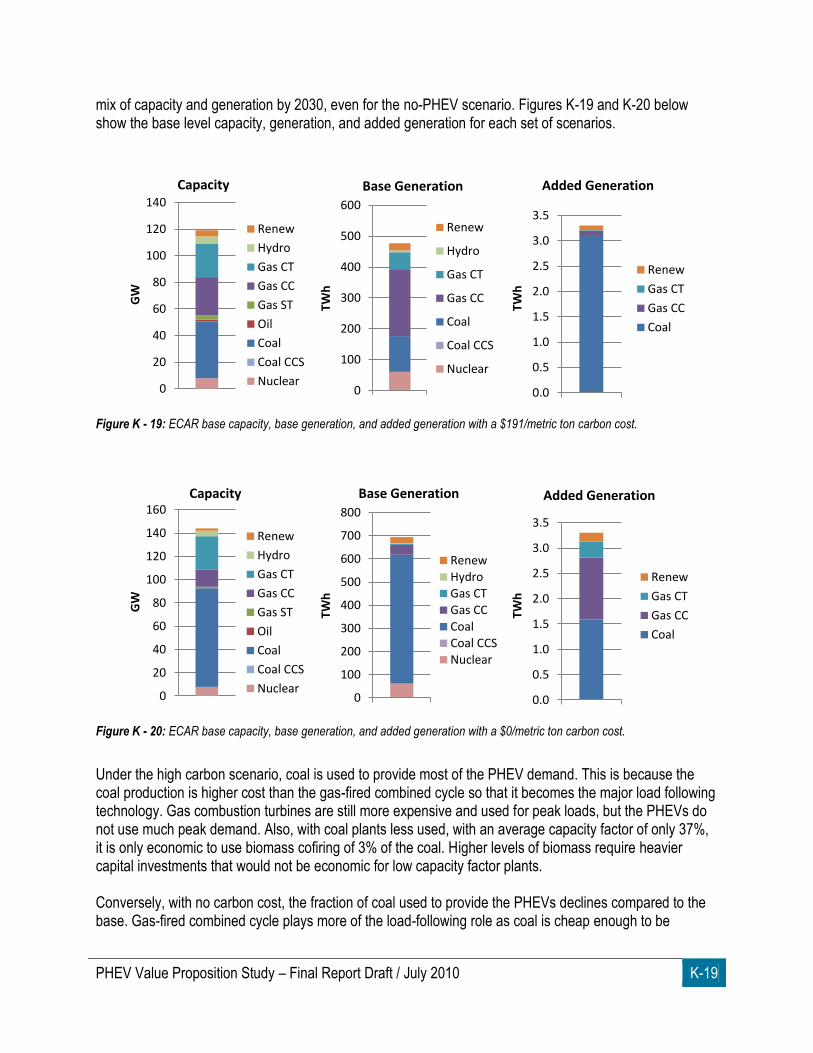
PHEV Value Proposition Study – Final Report Draft / July 2010 K-19
mix of capacity and generation by 2030, even for the no-PHEV scenario. Figures K-19 and K-20 below show the base level capacity, generation, and added generation for each set of scenarios.
Figure K - 19: ECAR base capacity, base generation, and added generation with a $191/metric ton carbon cost.
Figure K - 20: ECAR base capacity, base generation, and added generation with a $0/metric ton carbon cost.
Under the high carbon scenario, coal is used to provide most of the PHEV demand. This is because the coal production is higher cost than the gas-fired combined cycle so that it becomes the major load following technology. Gas combustion turbines are still more expensive and used for peak loads, but the PHEVs do not use much peak demand. Also, with coal plants less used, with an average capacity factor of only 37%, it is only economic to use biomass cofiring of 3% of the coal. Higher levels of biomass require heavier capital investments that would not be economic for low capacity factor plants. Conversely, with no carbon cost, the fraction of coal used to provide the PHEVs declines compared to the base. Gas-fired combined cycle plays more of the load-following role as coal is cheap enough to be
0
20
40
60
80
100
120
140
GW
Capacity
Renew
Hydro
Gas CT
Gas CC
Gas ST
Oil
Coal
Coal CCS
Nuclear0
100
200
300
400
500
600
TWh
Base Generation
Renew
Hydro
Gas CT
Gas CC
Coal
Coal CCS
Nuclear
0.0
0.5
1.0
1.5
2.0
2.5
3.0
3.5
TWh
Added Generation
Renew
Gas CT
Gas CC
Coal
0
20
40
60
80
100
120
140
160
GW
Capacity
Renew
Hydro
Gas CT
Gas CC
Gas ST
Oil
Coal
Coal CCS
Nuclear0
100
200
300
400
500
600
700
800
TWh
Base Generation
RenewHydro
Gas CT
Gas CC
CoalCoal CCS
Nuclear
0.0
0.5
1.0
1.5
2.0
2.5
3.0
3.5TW
h
Added Generation
Renew
Gas CT
Gas CC
Coal
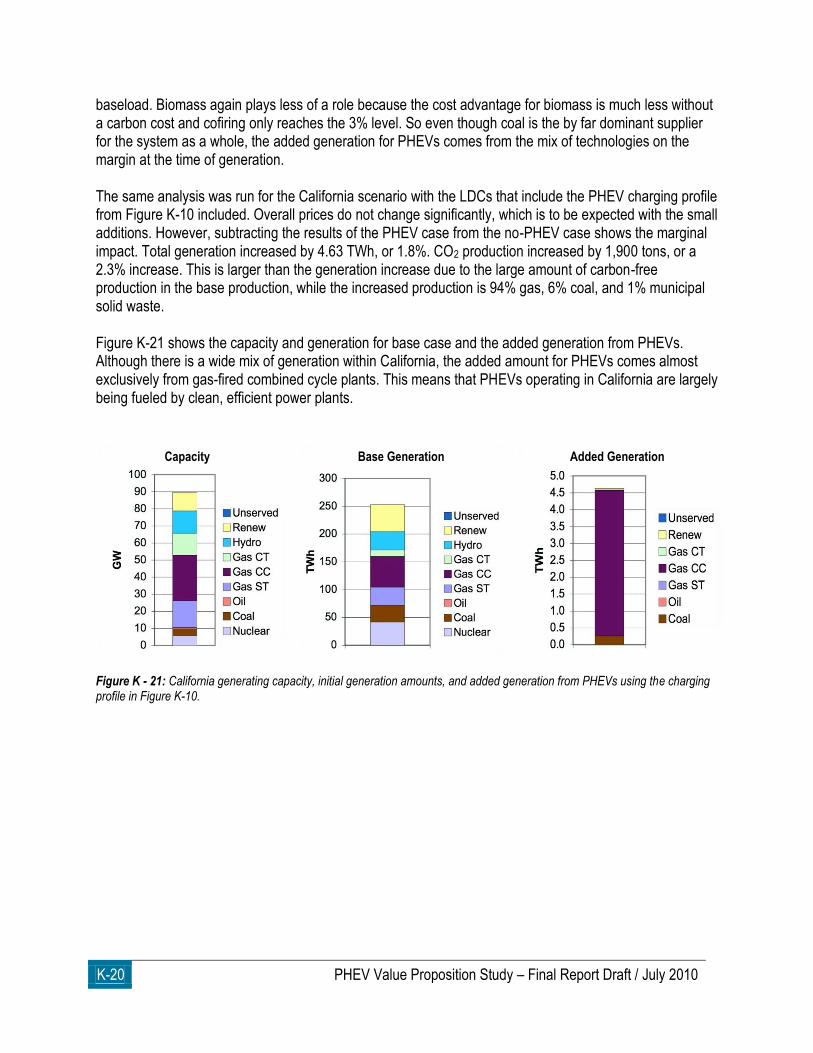
K-20 PHEV Value Proposition Study – Final Report Draft / July 2010
baseload. Biomass again plays less of a role because the cost advantage for biomass is much less without a carbon cost and cofiring only reaches the 3% level. So even though coal is the by far dominant supplier for the system as a whole, the added generation for PHEVs comes from the mix of technologies on the margin at the time of generation. The same analysis was run for the California scenario with the LDCs that include the PHEV charging profile from Figure K-10 included. Overall prices do not change significantly, which is to be expected with the small additions. However, subtracting the results of the PHEV case from the no-PHEV case shows the marginal impact. Total generation increased by 4.63 TWh, or 1.8%. CO2 production increased by 1,900 tons, or a 2.3% increase. This is larger than the generation increase due to the large amount of carbon-free production in the base production, while the increased production is 94% gas, 6% coal, and 1% municipal solid waste. Figure K-21 shows the capacity and generation for base case and the added generation from PHEVs. Although there is a wide mix of generation within California, the added amount for PHEVs comes almost exclusively from gas-fired combined cycle plants. This means that PHEVs operating in California are largely being fueled by clean, efficient power plants.
Figure K - 21: California generating capacity, initial generation amounts, and added generation from PHEVs using the charging profile in Figure K-10.
Capacity Base Generation Added Generation
REFERENCES
Alexander, Marcus. ―Effects of transportation electrification on the electricity grid.‖ Electric Power Research Institute.
Presented at California Public Utilities Commission Workshop – Plug-in Electric Vehicle Integration Issues. July 2009.
American Recovery and Reinvestment Act of 2009 (ARRA). Pub. L. 111-5. § 1141. Carney, Dan. ―Electric vehicle range: What, me worry?‖ 4 Mar. 2010.
<http://www.msnbc.msn.com/id/35352973/ns/business-autos/>
Committee on Assessment of Resource Needs for Fuel Cell and Hydrogen Technologies. ―Transitions to Alternative Transportation Technologies—Plug-in Hybrid Electric Vehicles.‖ National Research Council. December 2009.
Cready, E., et al. ―Technical and Economic Feasibility of Applying Used EV Batteries in Stationary Applications –
Final Report.‖ Sandia National Laboratories: SAND2002-4084. March 2003. ―Electrification Roadmap: Revolutionizing Transportation and Achieving Energy Security.‖ Electrification Coalition.
Nov. 2009. Energy Independence and Security Act of 2007 (EISA). Pub. L. 110-140. § 131. Energy Independence and Security Act of 2007 (EISA). Pub. L. 110-140. § 135. Energy Policy Act of 2005 (EPAct). Pub. L. 109-58, § 1341.
Genung, K., Markel, M., Hadley, S., Hinds, S., and DeVault, R. ―Plug-In Hybrid Electric Vehicle Value Proposition Study: Interim Report: Phase 1 Scenario Evaluation. Oak Ridge National Laboratory: ORNL/TM-2008/076. Jan 2009. < http://info.ornl.gov/sites/publications/Files/Pub11390.pdf>
Genung, K., Hadley, S., DeVault, R., King Jr., T., Hinds, S., and Scheer, R., ―Plug-In Hybrid Electric Vehicle Value
Proposition Study: Summary Report for Dec 07 Workshop.‖ Oak Ridge National Laboratory: ORNL/TM-2008/002. Jan. 2008.
Government Performance and Results Act of 1993 (GPRA). Pub. L. 103-62. Graham, R. et al. ―Comparing the Benefits and Impacts of Hybrid Electric Vehicle Options.‖ Electric Power
Research Institute: Report Number 1000349. July 2001. Hadley, S. ―The Oak Ridge Competitive Electricity Dispatch (ORCED) Model.‖ Oak Ridge National Laboratory:
ORNL/TM-2007/230. June 2008. <http://info.ornl.gov/sites/publications/Files/Pub9472.pdf>
Hadley, S., and Tsvetkova, A. ―Potential Impacts of Plug-in Hybrid Vehicles on Regional Power Generation.‖ Oak
Ridge National Laboratory: ORNL/TM-2007/150. Jan. 2008.
<http://www.ornl.gov/info/ornlreview/v41_1_08/regional_phev_analysis.pdf>
Iannucci, J., et al. ―Innovative Applications of Energy Storage in a Restructured Electricity Marketplace Phase III
Final Report.‖ Sandia National Laboratories: SAND2003-2546. Mar. 2005.
Itron, Inc. ―California Commercial End-Use Survey.‖ California Energy Commission: CEC-400-2006-005. Mar 2006.
Kalhammer, F. R., et al. ―Plug-in Hybrid Electric Vehicles: Promises, Issues and Prospects.‖ 24th Electric Vehicle Symposium. Stavanger, Norway: May 2009.
Kromer, M., Rhodes, T., and Guernsey, M., ―Update on Platinum Availability and Assessment of Platinum Leasing
Strategies for Fuel Cell Vehicles. DOE Merit Review. 13 June 2008. Los Angeles Department of Water & Power. Electric Rates: Schedule A-3. 30 June 2009.
<http://www.ladwp.com/ladwp/cms/ladwp001753.jsp>
Metz, B., O. Davidson, H.C. de Coninck, M. Loos, and L.A. Meyer (eds.). ―IPCC special report on Carbon Dioxide
Capture and Storage.‖ Prepared by working group III of the Intergovernmental Panel on Climate Change. Cambridge, United Kingdom and New York, NY, USA, 442 pp. Available in full at www.ipcc.ch.
Patterson, P. ―Survey Information for Vehicle Technologies.‖ Opinion Research Corporation International for National
Renewable Energy Laboratory. 10 Aug. 2007. Perlack, R., L. Wright, A. Turhollow, R. Graham, B. Stokes, D. Erbach. ―Biomass as Feedstock for a Bioenergy and
Bioproducts Industry: The Technical Feasibility of a Billion-Ton Annual Supply,‖ Oak Ridge, TN, Oak Ridge National Laboratory, Forest Service, and Agricultural Research Service. April 2005.
Sikes, K., Cleary, T., Lin, Dr. Z., Sullivan, J., Ward, J., Gross, T. ―Plug-In Hybrid Electric Vehicle Market Introduction
Study: Final Report. Oak Ridge National Laboratory: ORNL/TM-2009/019. Jan 2010.
Southern California Edison. Rate Schedule TOU-8. 23 Apr. 2010. <http://www.sce.com/NR/sc3/tm2/pdf/ce54-12.pdf>
Ungar, E., et al. ―Benefits and Challenges of Achieving a Mainstream Market for Electric Vehicles.‖ Taratec
Corporation and Center for Automotive Research. ORNL/TM-2008/002. May 2010. United States. Dept. of Energy. Energy Information Administration. ―Energy Market and Economic Impacts of H.R.
2454, the American Clean Energy and Security Act of 2009.‖ SR/OIAF/2009-05. Washington: GPO, 2009. ---. ---. Office of Energy Efficiency and Renewable Energy. ―FreedomCAR and Vehicle Technologies Multi-Year Program Plan.‖ Washington, D.C.: GPO, January 2007. ---. ---. ---. ―FCVT Plug-In Hybrid Electric Vehicle R&D Plan, Working Draft.‖ May 2007. ---. Environmental Protection Agency. Office of Transportation and Air Quality. ―EPA Finalizes Regulations for the
National Renewable Fuel Standard Program for 2010 and Beyond.‖ EPA-420-F-10-007. Washington: GPO, 2010.
---. ---. ―Fuel Economy Labeling of Motor Vehicles: Revisions to Improve Calculations of Fuel Economy Estimates:
Final Rule.‖ Federal Register 71 (11 Mar. 2008): 77876. ---. ---. ―Light-Duty Vehicle Greenhouse Gas Emission Standards and Corporate Average Fuel Economy Standards;
Final Rule.‖ Federal Register 75 (7 May 2010): 25323-25728. University of Michigan. "Costs Of Plug-in Cars Key To Broad Consumer Acceptance." ScienceDaily 10 Nov. 2009. 12
May 2010 <http://www.sciencedaily.com /releases/2009/10/091021115145.htm>.

This page intentionally left blank.