Middlesbrough - Public Health...
32
Local Alcohol Profile 2017 Middlesbrough Produced by Public Health England. For enquiries please contact [email protected] or call us on 0151 231 4535. This profile was produced on 3 May 2017 Introduction Alcohol use has health and social consequences borne by individuals, their families, and the wider community. The aim of these profiles is to provide information for local government, health organisations, commissioners and other agencies to monitor the impact of alcohol on local communities, and to monitor the services and initiatives that have been put in place to prevent and reduce the harmful impact of alcohol. Reducing harmful drinking is one of seven priority areas that Public Health England is focusing efforts on securing improvement. The indicators contained within the web-tool were selected following consultation with stakeholders and a review of the availability of routine data. The Local Alcohol Profiles for England (LAPE) are part of a series of products by Public Health England that provide local data alongside national comparisons to support local health improvement. For further information about each indicator please view the definitions tab within the tool at http://fingertips.phe.org.uk/profile/local-alcohol-profiles . For further information on alcohol and health please visit http://www.lape.org.uk . Spine Charts Key Indicators Page 2 Mortality Page 2 Hospital Admissions Page 3 Hospital Admissions By Age-Group Page 3 Alcohol-Related Conditions Page 4 Other Impacts Page 4 Consumption and Availability Page 5 Tartan Rugs Key Indicators Page 6 Mortality Page 6 Hospital Admissions Page 7 Hospital Admissions By Age-Group Page 7 Alcohol-Related Conditions Page 8 Other Impacts Page 10 Consumption and Availability Page 10 Bar Charts Key Indicators Page 12 Mortality Page 13 Hospital Admissions Page 15 Hospital Admissions By Age-Group Page 16 Alcohol-Related Conditions Page 18 Other Impacts Page 21 Consumption and Availability Page 22 Trends Key Indicators Page 23 Mortality Page 24 Hospital Admissions Page 26 Hospital Admissions By Age-Group Page 27 Alcohol-Related Conditions Page 29 Consumption and Availability Page 32 3 May 2017 1 © Crown Copyright 2017
Transcript of Middlesbrough - Public Health...
Local Alcohol Profile 2017
Middlesbrough
Produced by Public Health England.
For enquiries please contact [email protected] or call us on 0151 231 4535.
This profile was produced on 3 May 2017
Introduction
Alcohol use has health and social consequences borne by individuals, their families, and the wider community. The aim ofthese profiles is to provide information for local government, health organisations, commissioners and other agencies tomonitor the impact of alcohol on local communities, and to monitor the services and initiatives that have been put in placeto prevent and reduce the harmful impact of alcohol.
Reducing harmful drinking is one of seven priority areas that Public Health England is focusing efforts on securingimprovement. The indicators contained within the web-tool were selected following consultation with stakeholders and areview of the availability of routine data. The Local Alcohol Profiles for England (LAPE) are part of a series of products byPublic Health England that provide local data alongside national comparisons to support local health improvement.
For further information about each indicator please view the definitions tab within the tool at http://fingertips.phe.org.uk/profile/local-alcohol-profiles. For further information on alcohol and health please visit http://www.lape.org.uk.
Spine ChartsKey Indicators Page 2Mortality Page 2Hospital Admissions Page 3Hospital Admissions By Age-Group Page 3Alcohol-Related Conditions Page 4Other Impacts Page 4Consumption and Availability Page 5
Tartan RugsKey Indicators Page 6Mortality Page 6Hospital Admissions Page 7Hospital Admissions By Age-Group Page 7Alcohol-Related Conditions Page 8Other Impacts Page 10Consumption and Availability Page 10
Bar ChartsKey Indicators Page 12Mortality Page 13Hospital Admissions Page 15Hospital Admissions By Age-Group Page 16Alcohol-Related Conditions Page 18Other Impacts Page 21Consumption and Availability Page 22
TrendsKey Indicators Page 23Mortality Page 24Hospital Admissions Page 26Hospital Admissions By Age-Group Page 27Alcohol-Related Conditions Page 29Consumption and Availability Page 32
3 May 20171© Crown Copyright 2017
Local Alcohol Profiles
Middlesbrough
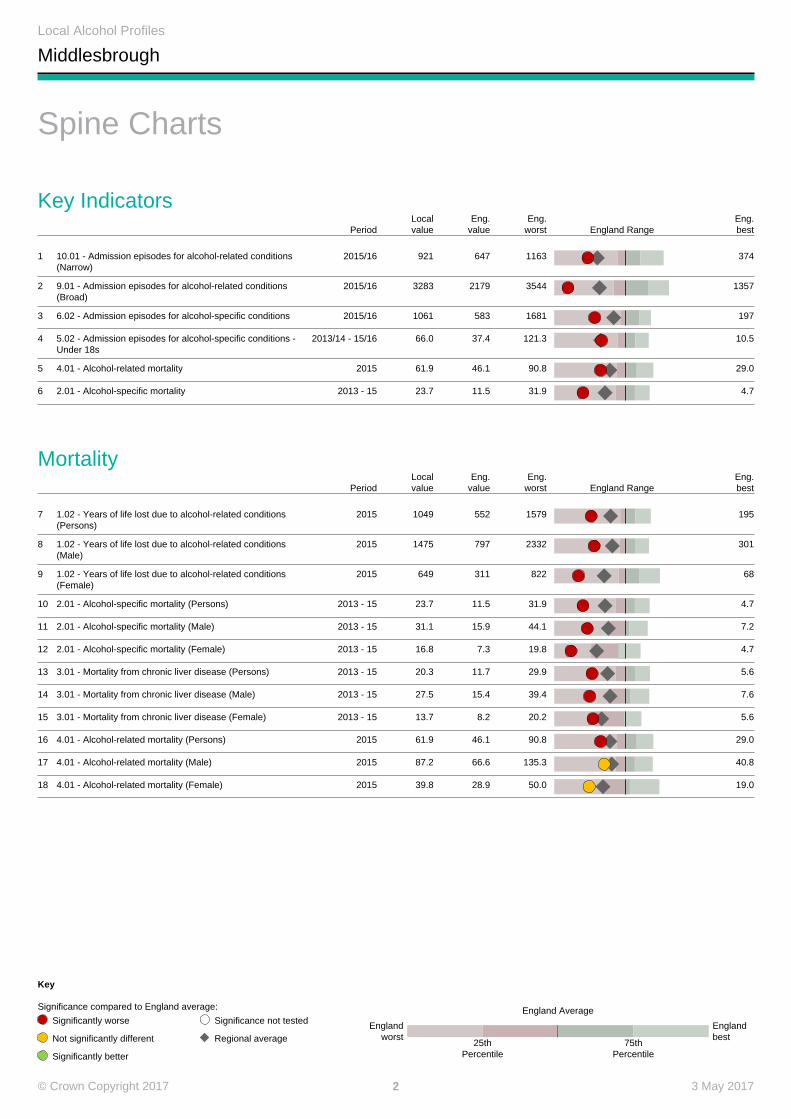
Key
Significance compared to England average:
Significantly worse
Not significantly different
Significantly better
Significance not tested
Regional average
England Average
Englandworst
Englandbest
25thPercentile
75thPercentile
Spine Charts
Key IndicatorsPeriod
Localvalue
Eng.value
Eng.worst England Range
Eng.best
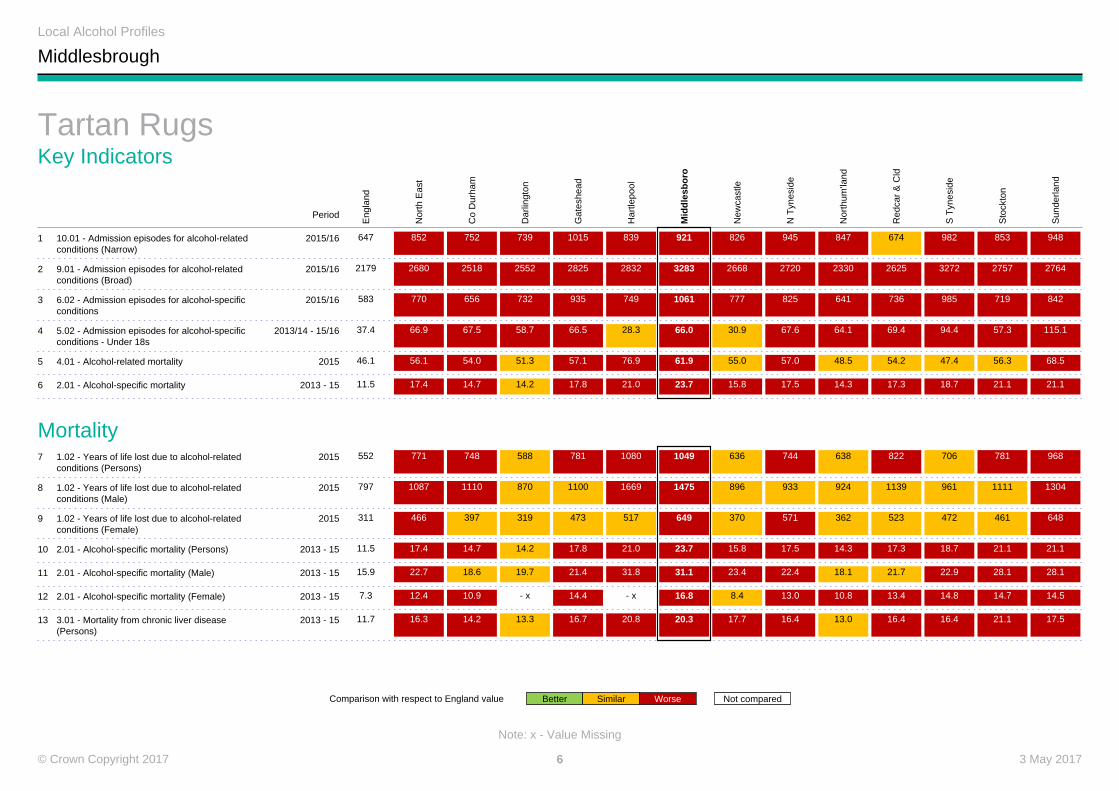
1 10.01 - Admission episodes for alcohol-related conditions(Narrow)
2015/16 921 647 1163 374
2 9.01 - Admission episodes for alcohol-related conditions(Broad)
2015/16 3283 2179 3544 1357
3 6.02 - Admission episodes for alcohol-specific conditions 2015/16 1061 583 1681 197
4 5.02 - Admission episodes for alcohol-specific conditions -Under 18s
2013/14 - 15/16 66.0 37.4 121.3 10.5
5 4.01 - Alcohol-related mortality 2015 61.9 46.1 90.8 29.0
6 2.01 - Alcohol-specific mortality 2013 - 15 23.7 11.5 31.9 4.7
MortalityPeriod
Localvalue
Eng.value
Eng.worst England Range
Eng.best
7 1.02 - Years of life lost due to alcohol-related conditions(Persons)
2015 1049 552 1579 195
8 1.02 - Years of life lost due to alcohol-related conditions(Male)
2015 1475 797 2332 301
9 1.02 - Years of life lost due to alcohol-related conditions(Female)
2015 649 311 822 68
10 2.01 - Alcohol-specific mortality (Persons) 2013 - 15 23.7 11.5 31.9 4.7
11 2.01 - Alcohol-specific mortality (Male) 2013 - 15 31.1 15.9 44.1 7.2
12 2.01 - Alcohol-specific mortality (Female) 2013 - 15 16.8 7.3 19.8 4.7
13 3.01 - Mortality from chronic liver disease (Persons) 2013 - 15 20.3 11.7 29.9 5.6
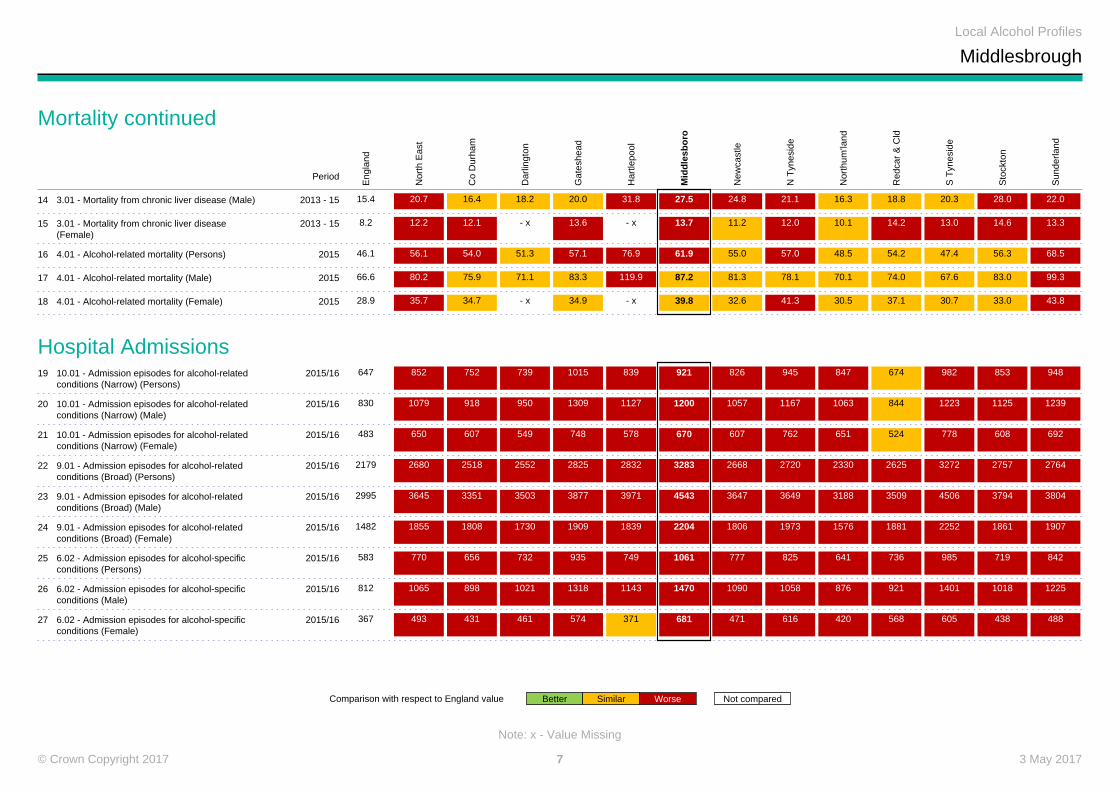
14 3.01 - Mortality from chronic liver disease (Male) 2013 - 15 27.5 15.4 39.4 7.6
15 3.01 - Mortality from chronic liver disease (Female) 2013 - 15 13.7 8.2 20.2 5.6
16 4.01 - Alcohol-related mortality (Persons) 2015 61.9 46.1 90.8 29.0
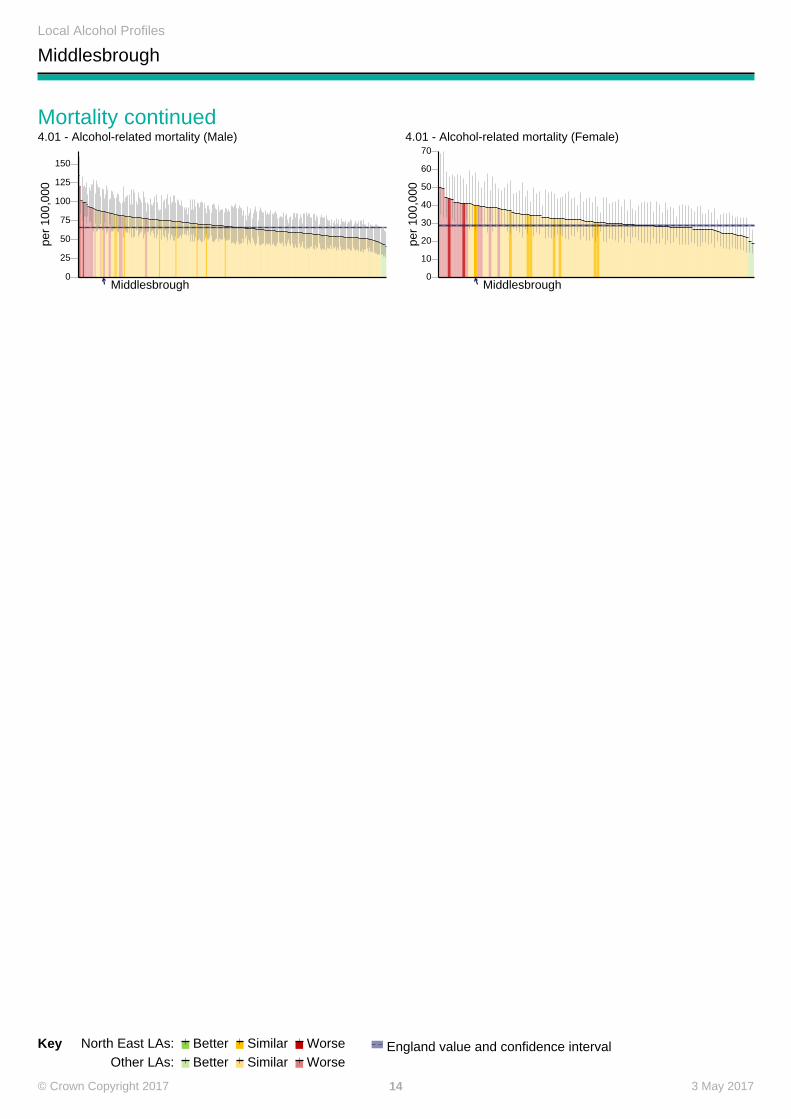
17 4.01 - Alcohol-related mortality (Male) 2015 87.2 66.6 135.3 40.8
18 4.01 - Alcohol-related mortality (Female) 2015 39.8 28.9 50.0 19.0
3 May 20172© Crown Copyright 2017
Local Alcohol Profiles
Middlesbrough
Hospital AdmissionsPeriod
Localvalue
Eng.value
Eng.worst England Range
Eng.best
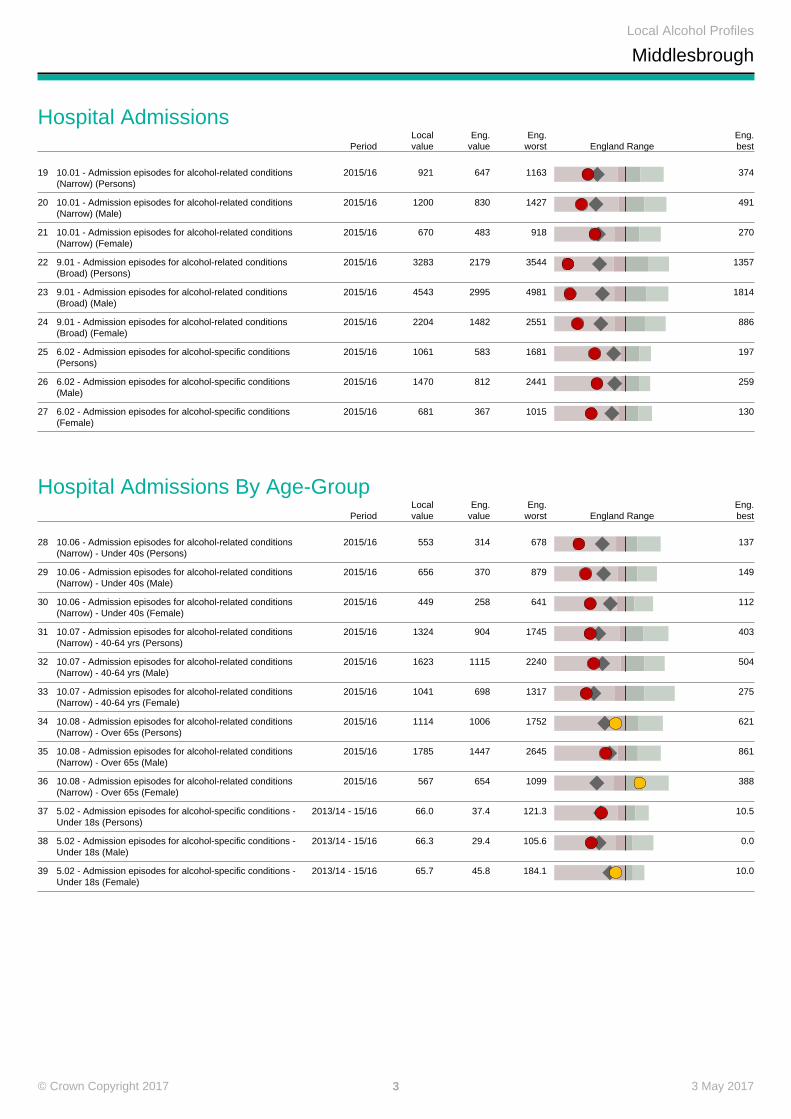
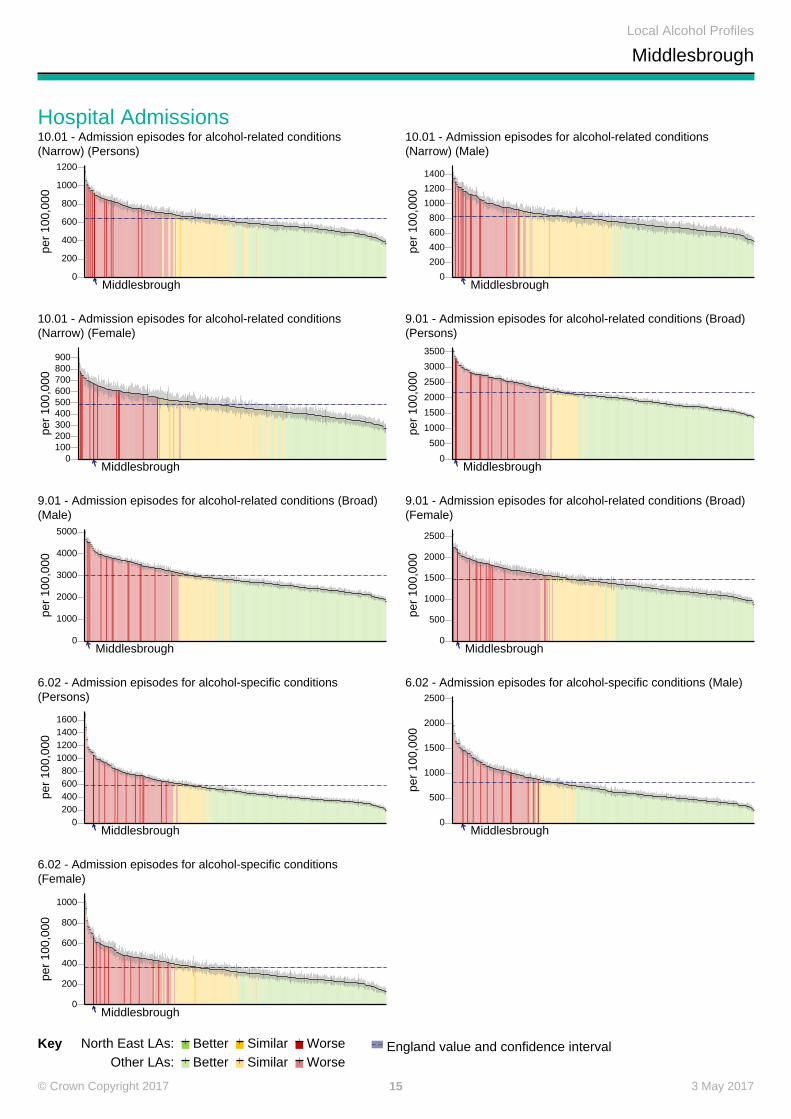
19 10.01 - Admission episodes for alcohol-related conditions(Narrow) (Persons)
2015/16 921 647 1163 374
20 10.01 - Admission episodes for alcohol-related conditions(Narrow) (Male)
2015/16 1200 830 1427 491
21 10.01 - Admission episodes for alcohol-related conditions(Narrow) (Female)
2015/16 670 483 918 270
22 9.01 - Admission episodes for alcohol-related conditions(Broad) (Persons)
2015/16 3283 2179 3544 1357
23 9.01 - Admission episodes for alcohol-related conditions(Broad) (Male)
2015/16 4543 2995 4981 1814
24 9.01 - Admission episodes for alcohol-related conditions(Broad) (Female)
2015/16 2204 1482 2551 886
25 6.02 - Admission episodes for alcohol-specific conditions(Persons)
2015/16 1061 583 1681 197
26 6.02 - Admission episodes for alcohol-specific conditions(Male)
2015/16 1470 812 2441 259
27 6.02 - Admission episodes for alcohol-specific conditions(Female)
2015/16 681 367 1015 130
Hospital Admissions By Age-GroupPeriod
Localvalue
Eng.value
Eng.worst England Range
Eng.best
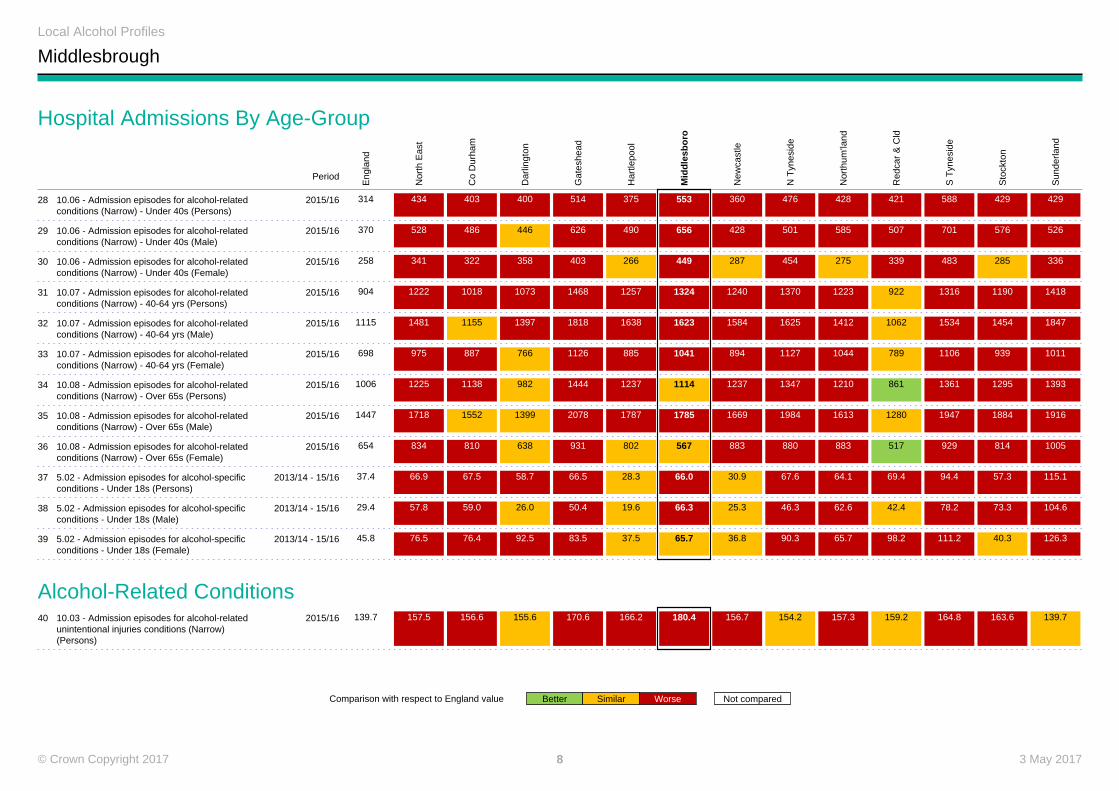
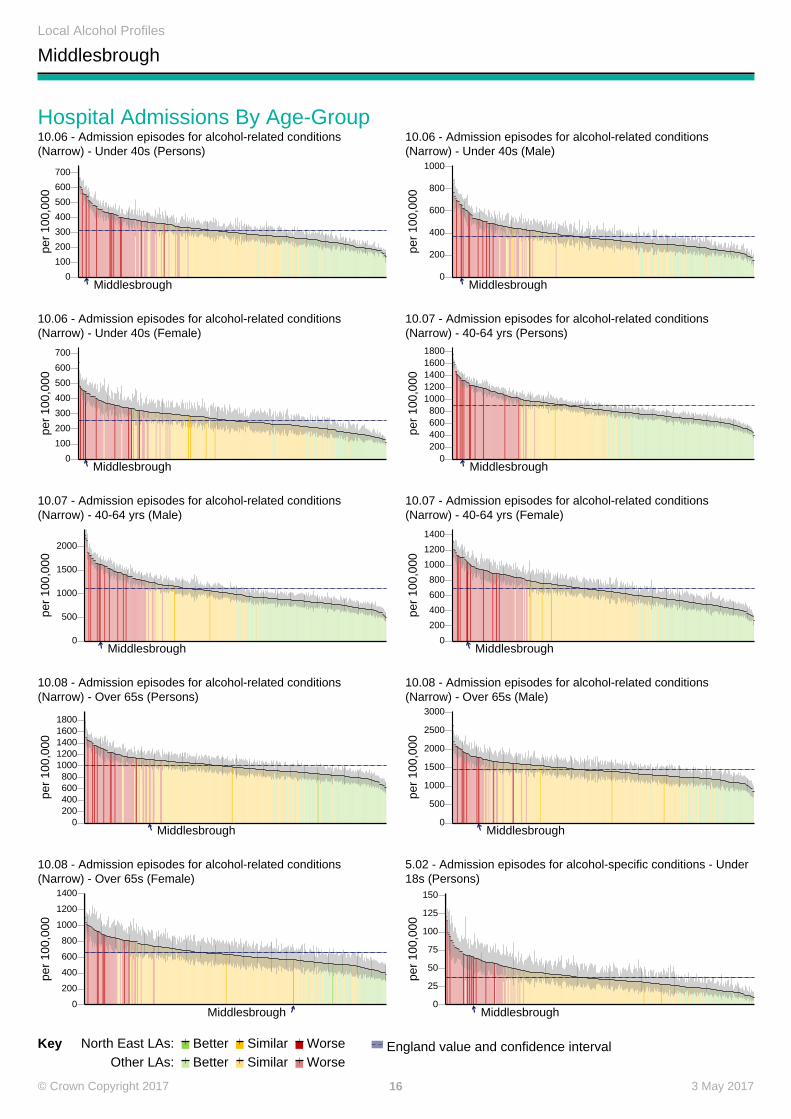
28 10.06 - Admission episodes for alcohol-related conditions(Narrow) - Under 40s (Persons)
2015/16 553 314 678 137
29 10.06 - Admission episodes for alcohol-related conditions(Narrow) - Under 40s (Male)
2015/16 656 370 879 149
30 10.06 - Admission episodes for alcohol-related conditions(Narrow) - Under 40s (Female)
2015/16 449 258 641 112
31 10.07 - Admission episodes for alcohol-related conditions(Narrow) - 40-64 yrs (Persons)
2015/16 1324 904 1745 403
32 10.07 - Admission episodes for alcohol-related conditions(Narrow) - 40-64 yrs (Male)
2015/16 1623 1115 2240 504
33 10.07 - Admission episodes for alcohol-related conditions(Narrow) - 40-64 yrs (Female)
2015/16 1041 698 1317 275
34 10.08 - Admission episodes for alcohol-related conditions(Narrow) - Over 65s (Persons)
2015/16 1114 1006 1752 621
35 10.08 - Admission episodes for alcohol-related conditions(Narrow) - Over 65s (Male)
2015/16 1785 1447 2645 861
36 10.08 - Admission episodes for alcohol-related conditions(Narrow) - Over 65s (Female)
2015/16 567 654 1099 388
37 5.02 - Admission episodes for alcohol-specific conditions -Under 18s (Persons)
2013/14 - 15/16 66.0 37.4 121.3 10.5
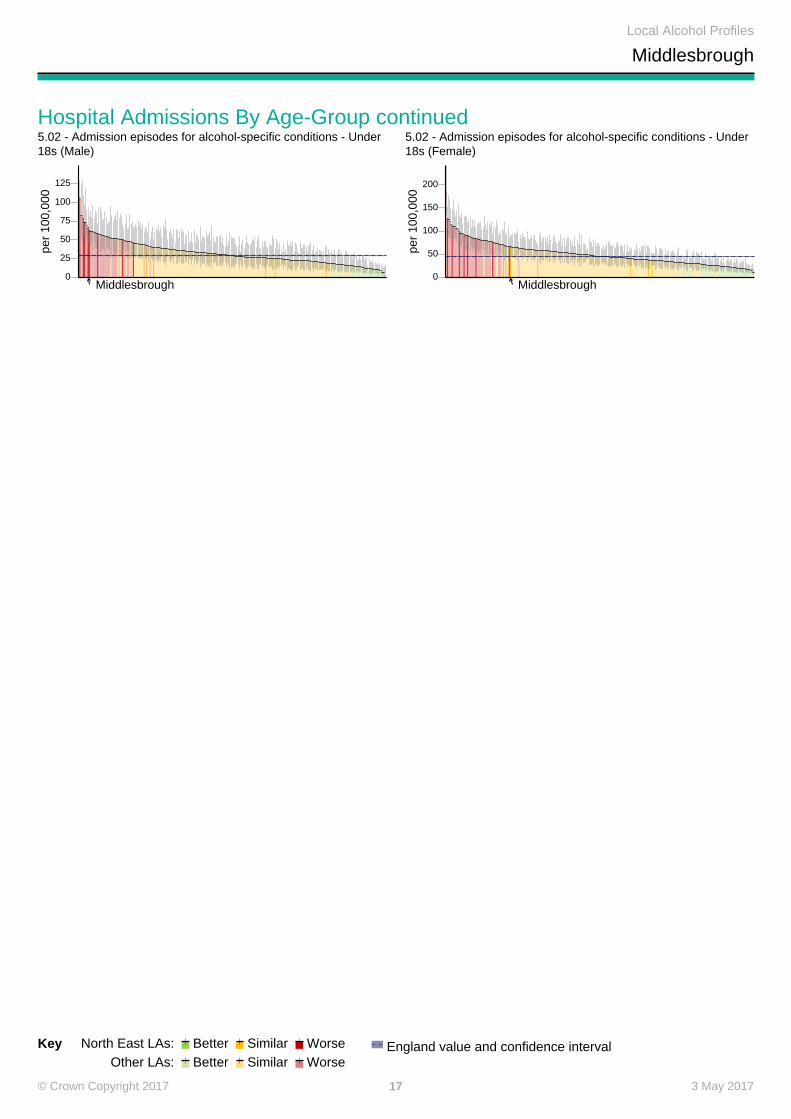
38 5.02 - Admission episodes for alcohol-specific conditions -Under 18s (Male)
2013/14 - 15/16 66.3 29.4 105.6 0.0
39 5.02 - Admission episodes for alcohol-specific conditions -Under 18s (Female)
2013/14 - 15/16 65.7 45.8 184.1 10.0
3 May 20173© Crown Copyright 2017
Local Alcohol Profiles
Middlesbrough
Alcohol-Related ConditionsPeriod
Localvalue
Eng.value
Eng.worst England Range
Eng.best
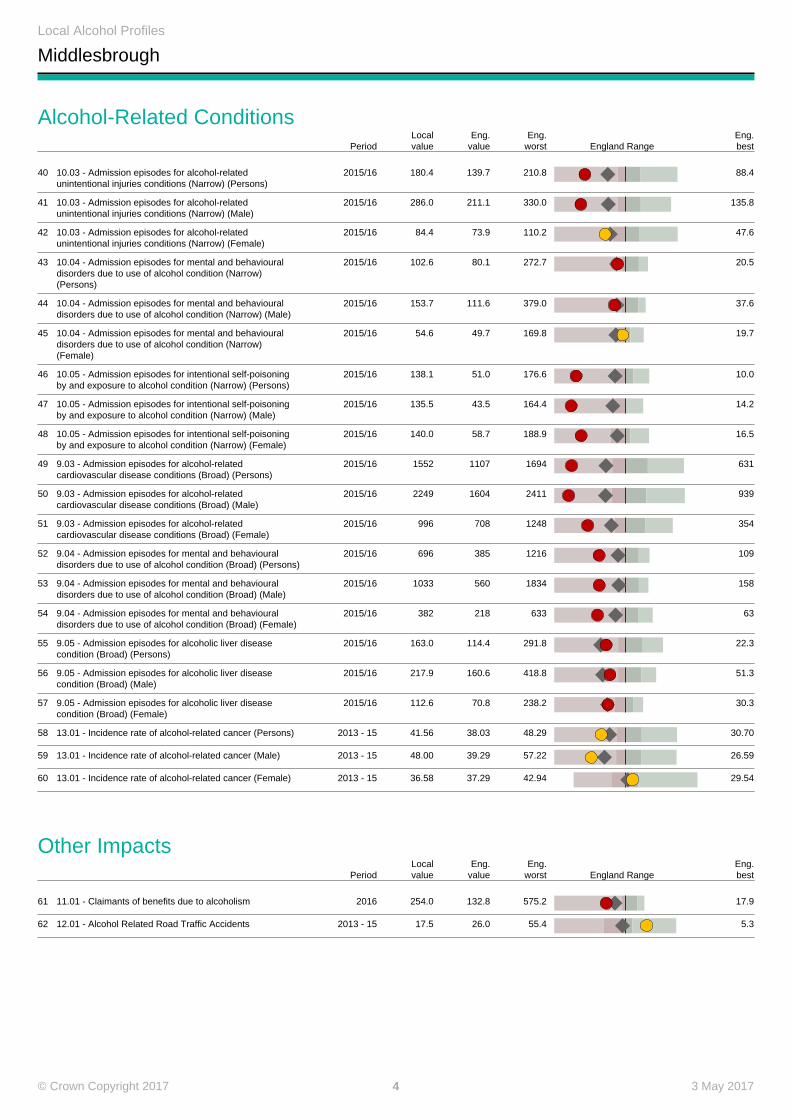
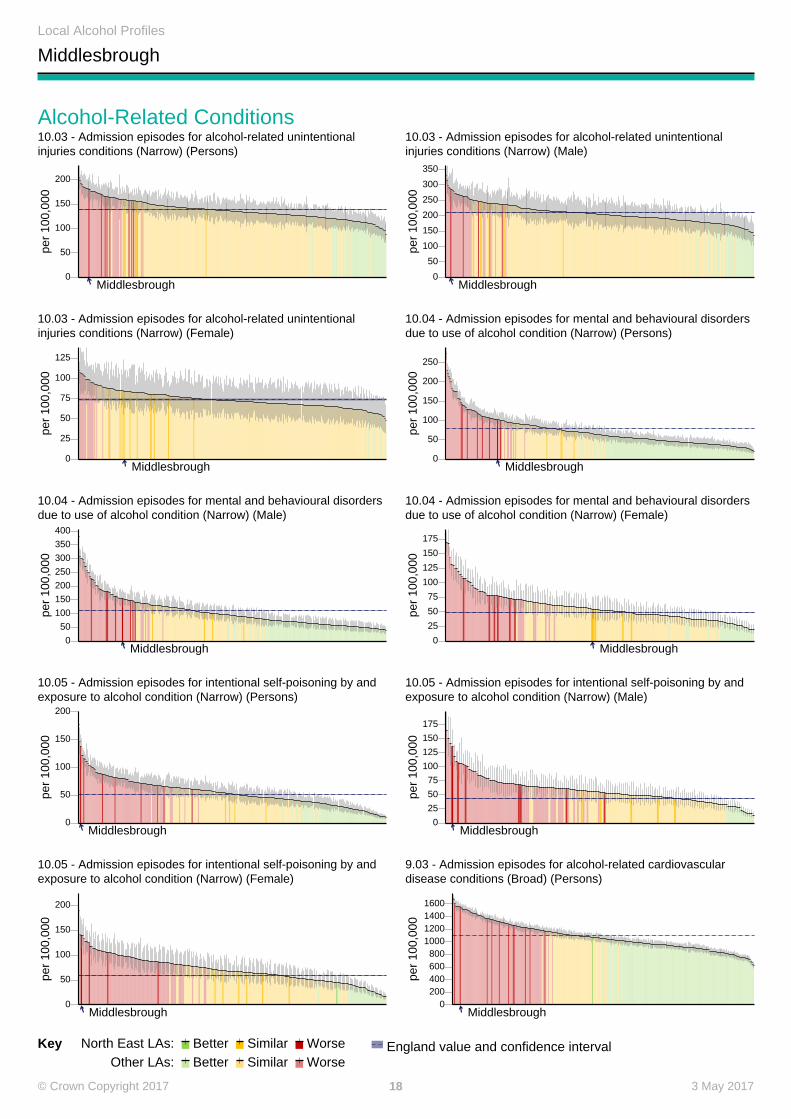
40 10.03 - Admission episodes for alcohol-relatedunintentional injuries conditions (Narrow) (Persons)
2015/16 180.4 139.7 210.8 88.4
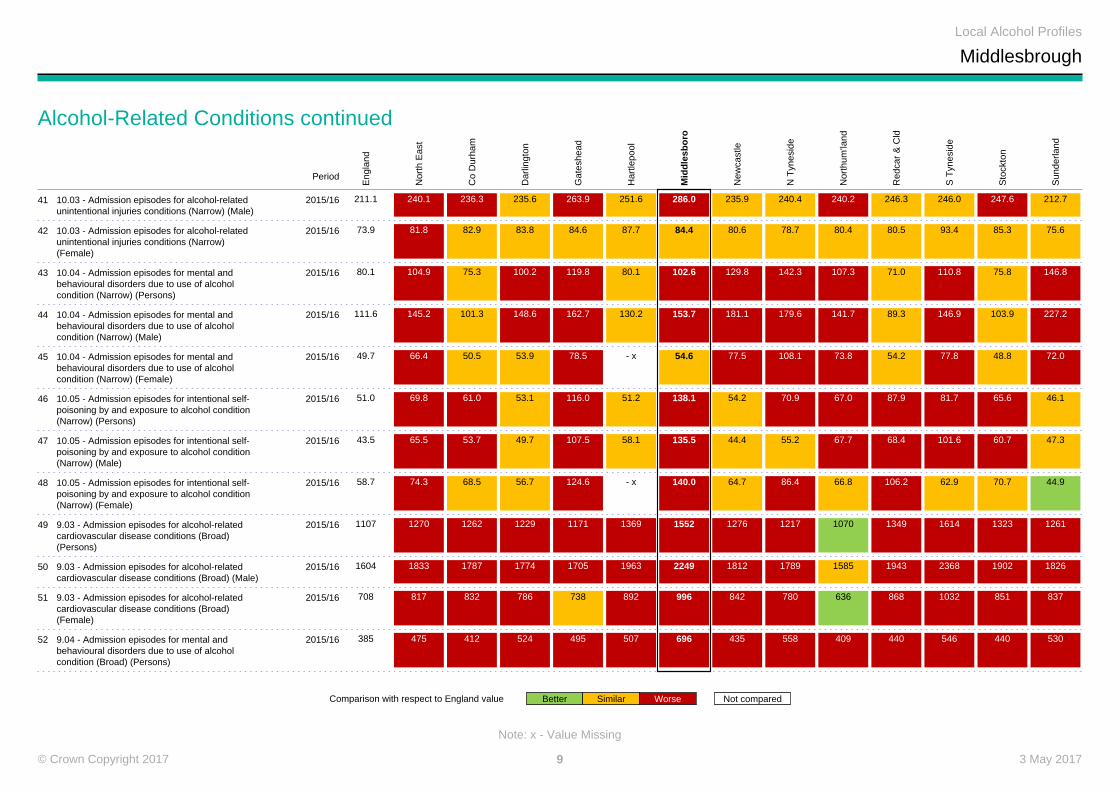
41 10.03 - Admission episodes for alcohol-relatedunintentional injuries conditions (Narrow) (Male)
2015/16 286.0 211.1 330.0 135.8
42 10.03 - Admission episodes for alcohol-relatedunintentional injuries conditions (Narrow) (Female)
2015/16 84.4 73.9 110.2 47.6
43 10.04 - Admission episodes for mental and behaviouraldisorders due to use of alcohol condition (Narrow)(Persons)
2015/16 102.6 80.1 272.7 20.5
44 10.04 - Admission episodes for mental and behaviouraldisorders due to use of alcohol condition (Narrow) (Male)
2015/16 153.7 111.6 379.0 37.6
45 10.04 - Admission episodes for mental and behaviouraldisorders due to use of alcohol condition (Narrow)(Female)
2015/16 54.6 49.7 169.8 19.7
46 10.05 - Admission episodes for intentional self-poisoningby and exposure to alcohol condition (Narrow) (Persons)
2015/16 138.1 51.0 176.6 10.0
47 10.05 - Admission episodes for intentional self-poisoningby and exposure to alcohol condition (Narrow) (Male)
2015/16 135.5 43.5 164.4 14.2
48 10.05 - Admission episodes for intentional self-poisoningby and exposure to alcohol condition (Narrow) (Female)
2015/16 140.0 58.7 188.9 16.5
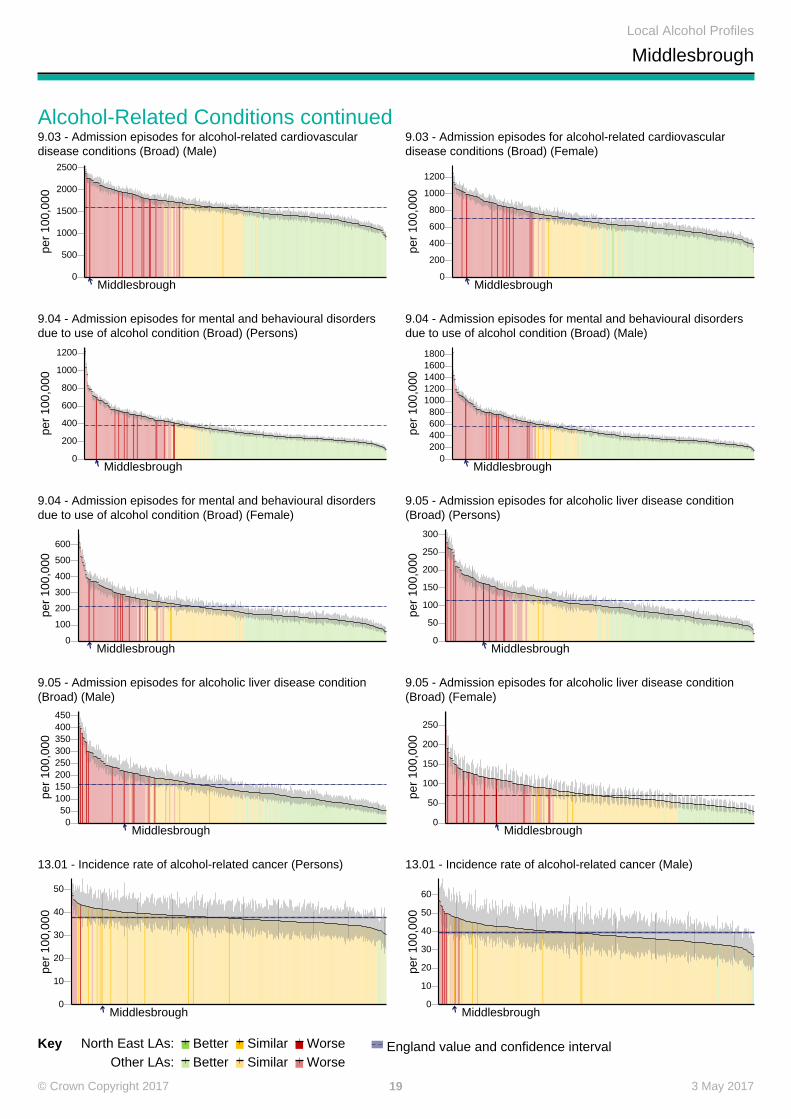
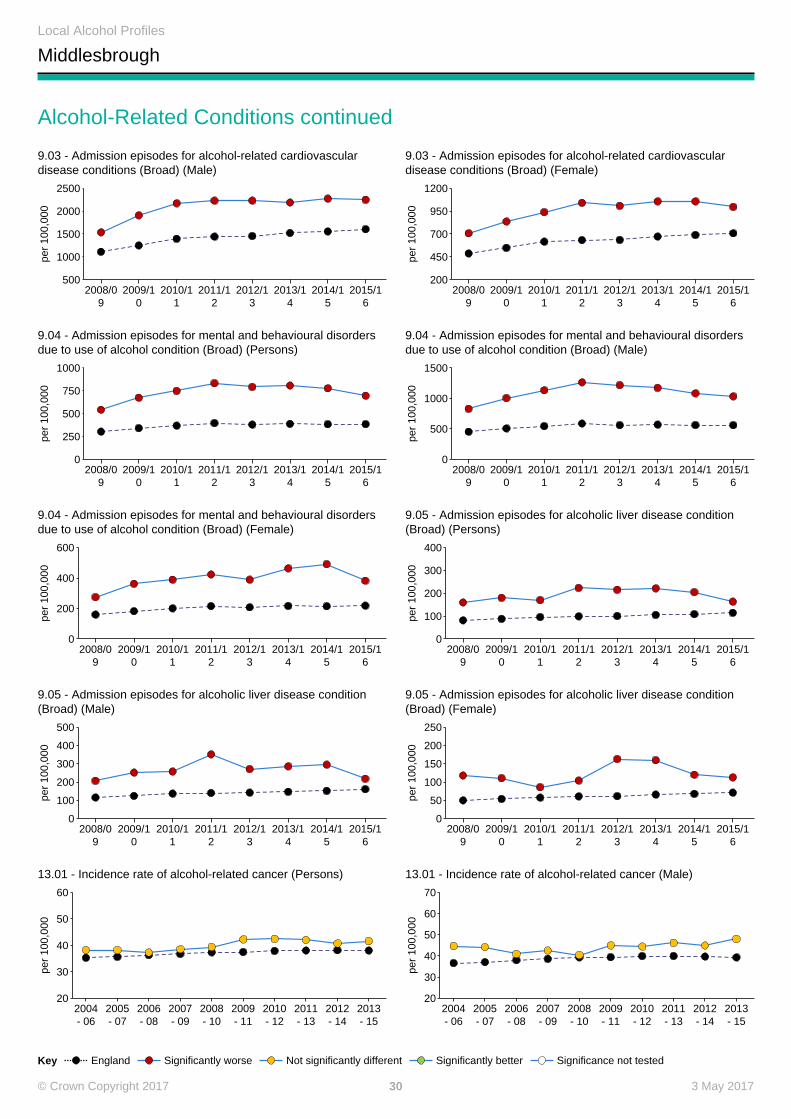
49 9.03 - Admission episodes for alcohol-relatedcardiovascular disease conditions (Broad) (Persons)
2015/16 1552 1107 1694 631
50 9.03 - Admission episodes for alcohol-relatedcardiovascular disease conditions (Broad) (Male)
2015/16 2249 1604 2411 939
51 9.03 - Admission episodes for alcohol-relatedcardiovascular disease conditions (Broad) (Female)
2015/16 996 708 1248 354
52 9.04 - Admission episodes for mental and behaviouraldisorders due to use of alcohol condition (Broad) (Persons)
2015/16 696 385 1216 109
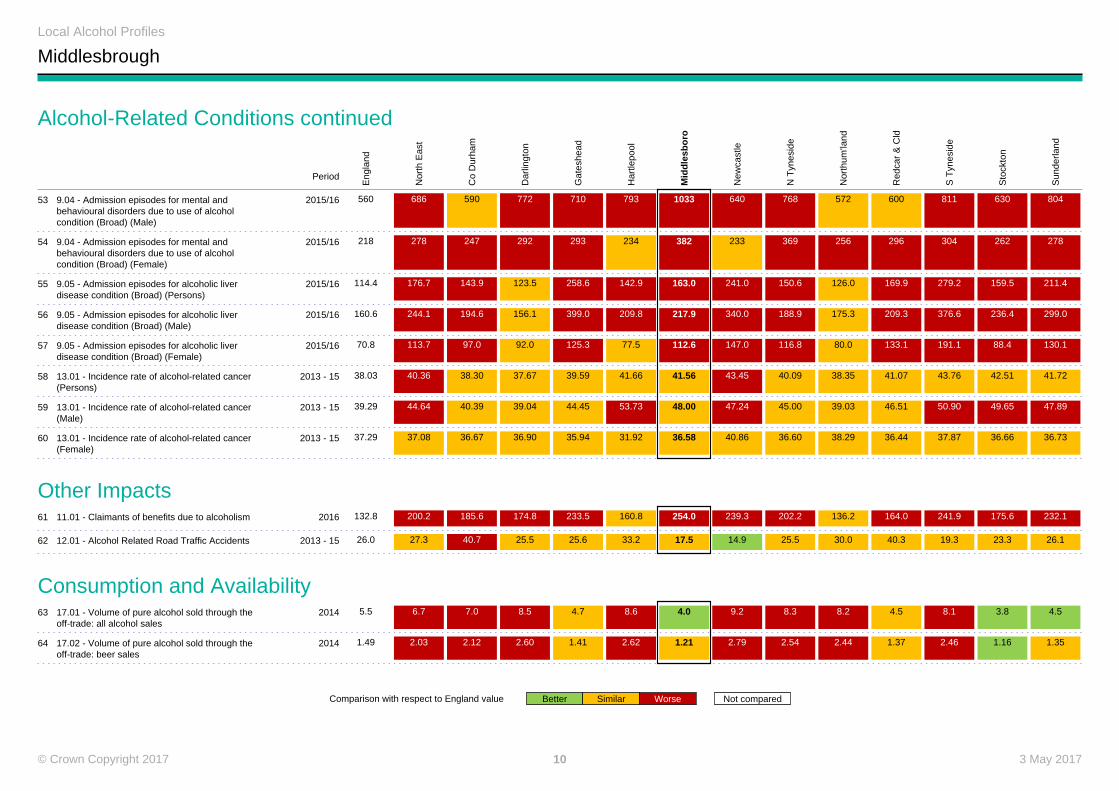
53 9.04 - Admission episodes for mental and behaviouraldisorders due to use of alcohol condition (Broad) (Male)
2015/16 1033 560 1834 158
54 9.04 - Admission episodes for mental and behaviouraldisorders due to use of alcohol condition (Broad) (Female)
2015/16 382 218 633 63
55 9.05 - Admission episodes for alcoholic liver diseasecondition (Broad) (Persons)
2015/16 163.0 114.4 291.8 22.3
56 9.05 - Admission episodes for alcoholic liver diseasecondition (Broad) (Male)
2015/16 217.9 160.6 418.8 51.3
57 9.05 - Admission episodes for alcoholic liver diseasecondition (Broad) (Female)
2015/16 112.6 70.8 238.2 30.3
58 13.01 - Incidence rate of alcohol-related cancer (Persons) 2013 - 15 41.56 38.03 48.29 30.70
59 13.01 - Incidence rate of alcohol-related cancer (Male) 2013 - 15 48.00 39.29 57.22 26.59
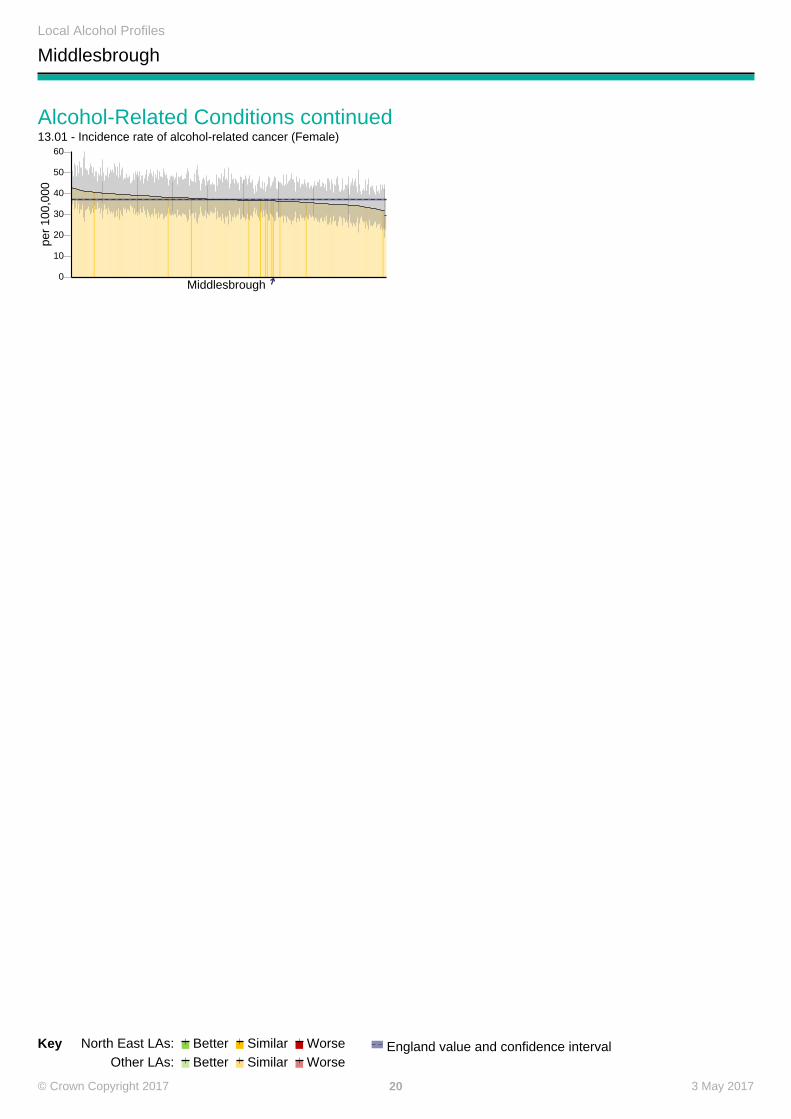
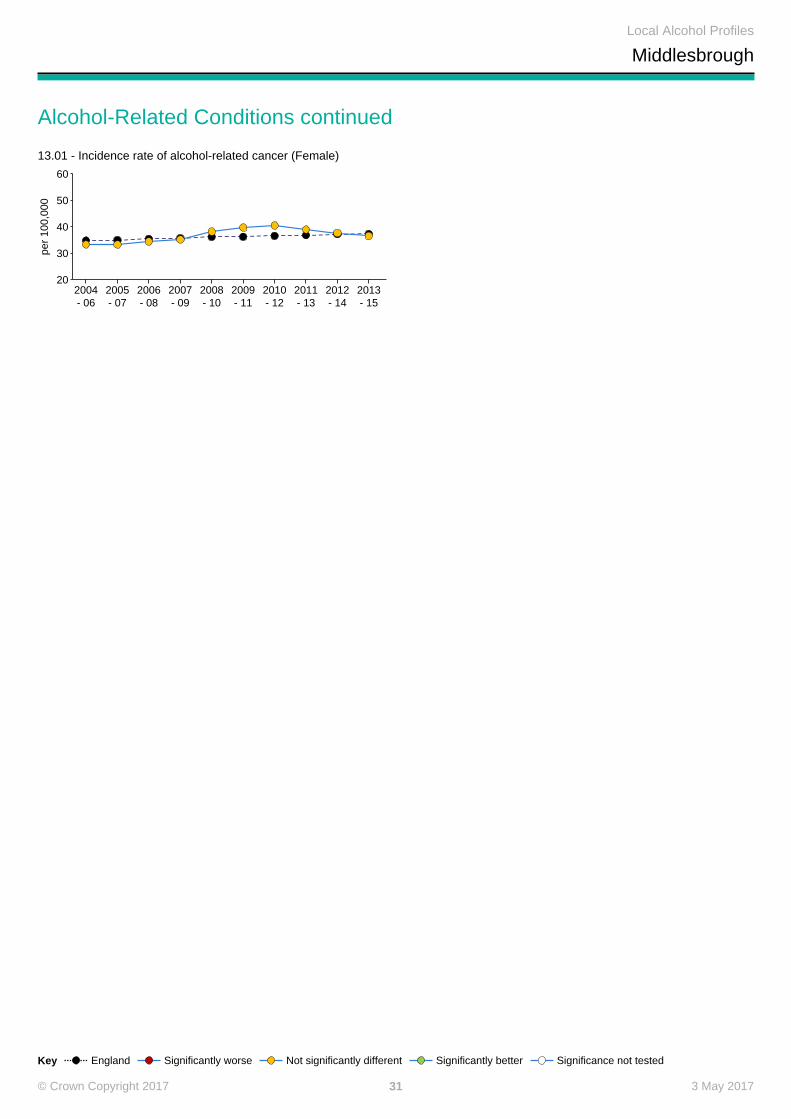
60 13.01 - Incidence rate of alcohol-related cancer (Female) 2013 - 15 36.58 37.29 42.94 29.54
Other ImpactsPeriod
Localvalue
Eng.value
Eng.worst England Range
Eng.best
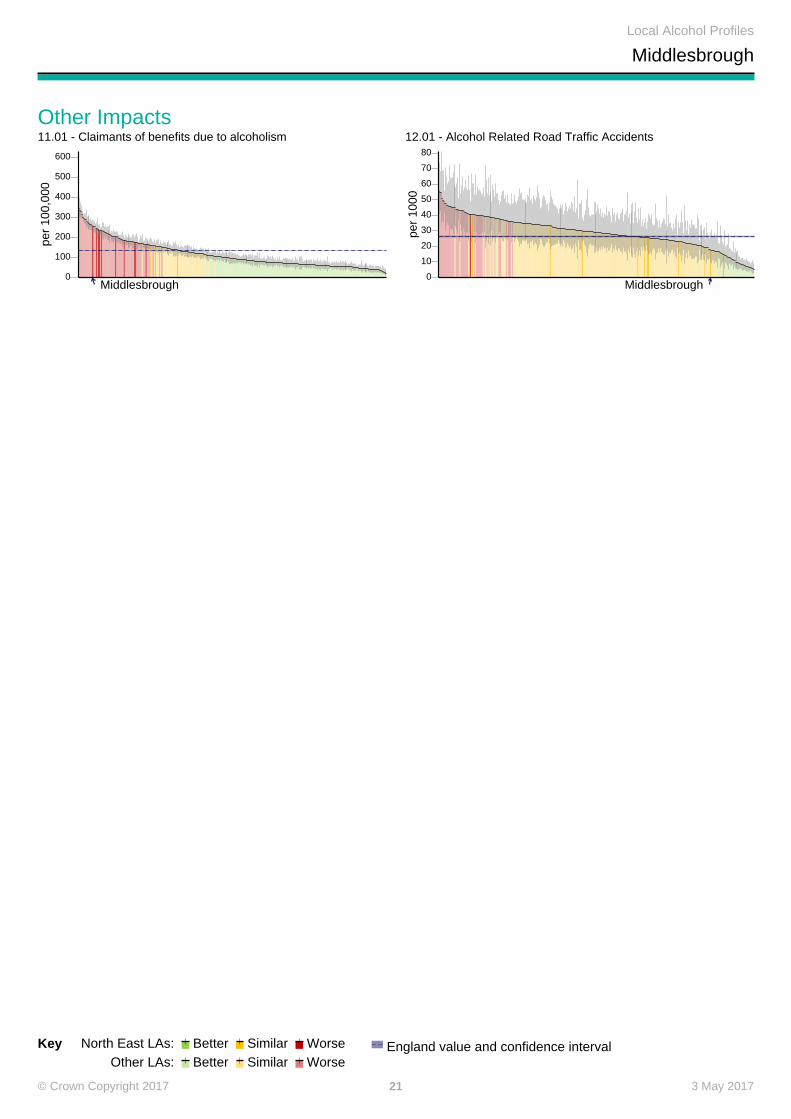
61 11.01 - Claimants of benefits due to alcoholism 2016 254.0 132.8 575.2 17.9
62 12.01 - Alcohol Related Road Traffic Accidents 2013 - 15 17.5 26.0 55.4 5.3
3 May 20174© Crown Copyright 2017
Local Alcohol Profiles
Middlesbrough
Consumption and AvailabilityPeriod
Localvalue
Eng.value
Eng.worst England Range
Eng.best
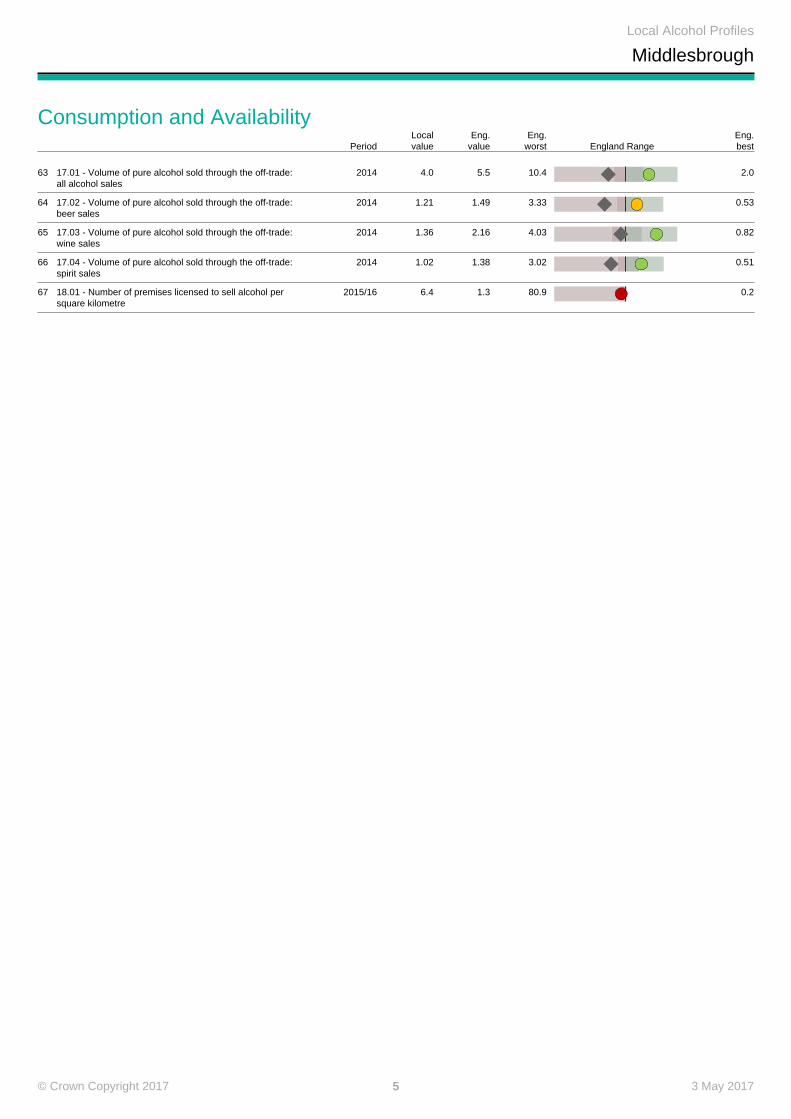
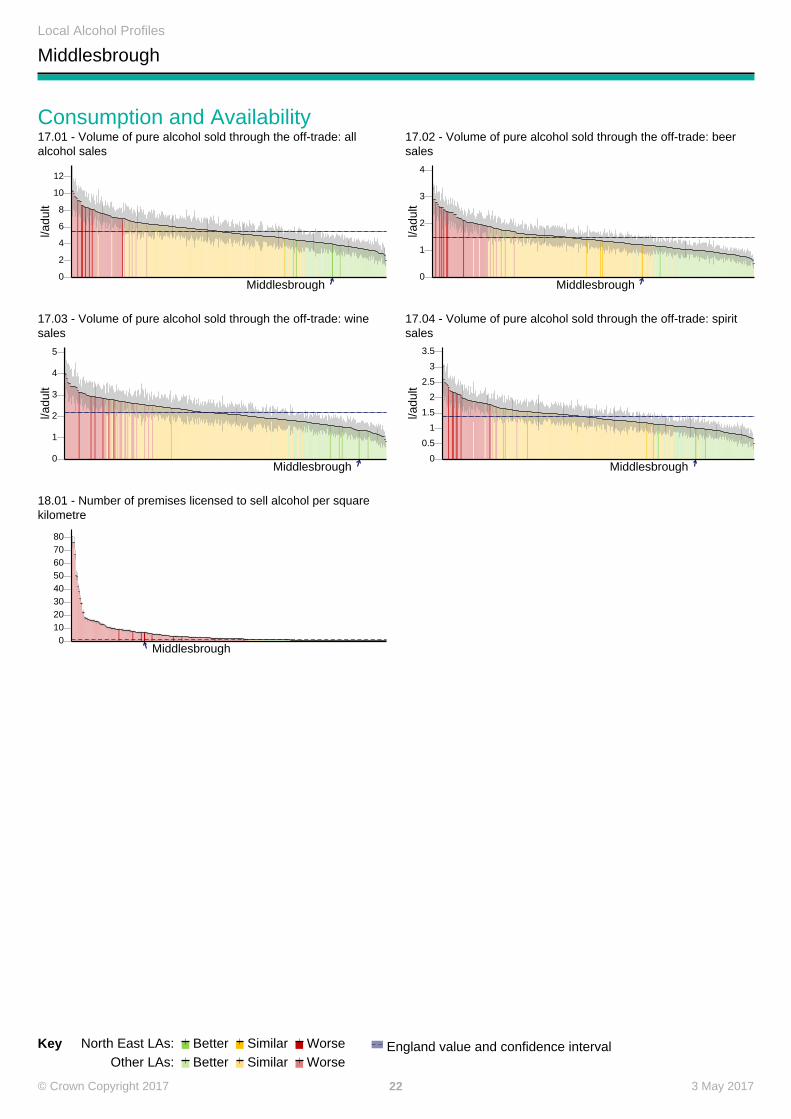
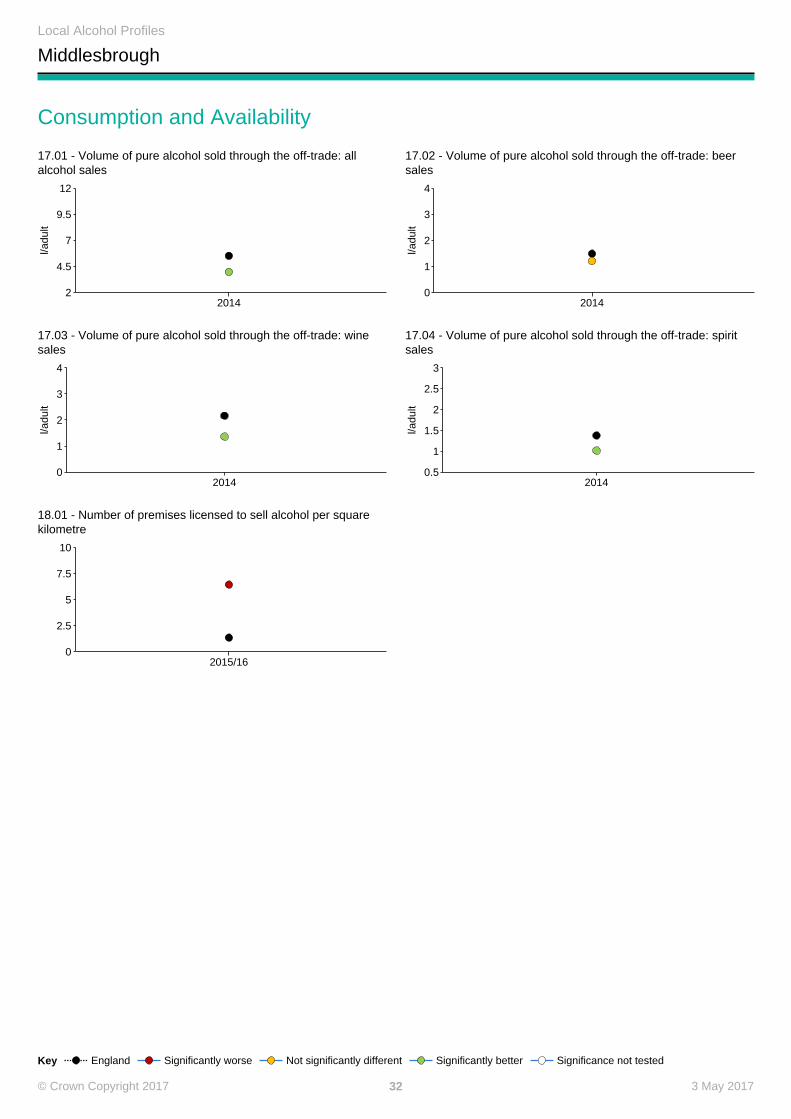
63 17.01 - Volume of pure alcohol sold through the off-trade:all alcohol sales
2014 4.0 5.5 10.4 2.0
64 17.02 - Volume of pure alcohol sold through the off-trade:beer sales
2014 1.21 1.49 3.33 0.53
65 17.03 - Volume of pure alcohol sold through the off-trade:wine sales
2014 1.36 2.16 4.03 0.82
66 17.04 - Volume of pure alcohol sold through the off-trade:spirit sales
2014 1.02 1.38 3.02 0.51
67 18.01 - Number of premises licensed to sell alcohol persquare kilometre
2015/16 6.4 1.3 80.9 0.2
3 May 20175© Crown Copyright 2017
Local Alcohol Profiles
Middlesbrough
Tartan RugsKey Indicators
Period
Eng
land
Nor
th E
ast
Co
Dur
ham
Dar
lingt
on
Gat
eshe
ad
Har
tlepo
ol
Mid
dle
sbo
ro
New
cast
le
N T
ynes
ide
Nor
thum
'land
Red
car
& C
ld
S T
ynes
ide
Sto
ckto
n
Sun
derla
nd
1 10.01 - Admission episodes for alcohol-relatedconditions (Narrow)
2015/16 647 852 752 739 1015 839 921 826 945 847 674 982 853 948
2 9.01 - Admission episodes for alcohol-relatedconditions (Broad)
2015/16 2179 2680 2518 2552 2825 2832 3283 2668 2720 2330 2625 3272 2757 2764
3 6.02 - Admission episodes for alcohol-specificconditions
2015/16 583 770 656 732 935 749 1061 777 825 641 736 985 719 842
4 5.02 - Admission episodes for alcohol-specificconditions - Under 18s
2013/14 - 15/16 37.4 66.9 67.5 58.7 66.5 28.3 66.0 30.9 67.6 64.1 69.4 94.4 57.3 115.1
5 4.01 - Alcohol-related mortality 2015 46.1 56.1 54.0 51.3 57.1 76.9 61.9 55.0 57.0 48.5 54.2 47.4 56.3 68.5
6 2.01 - Alcohol-specific mortality 2013 - 15 11.5 17.4 14.7 14.2 17.8 21.0 23.7 15.8 17.5 14.3 17.3 18.7 21.1 21.1
Mortality7 1.02 - Years of life lost due to alcohol-related
conditions (Persons)2015 552 771 748 588 781 1080 1049 636 744 638 822 706 781 968
8 1.02 - Years of life lost due to alcohol-relatedconditions (Male)
2015 797 1087 1110 870 1100 1669 1475 896 933 924 1139 961 1111 1304
9 1.02 - Years of life lost due to alcohol-relatedconditions (Female)
2015 311 466 397 319 473 517 649 370 571 362 523 472 461 648
10 2.01 - Alcohol-specific mortality (Persons) 2013 - 15 11.5 17.4 14.7 14.2 17.8 21.0 23.7 15.8 17.5 14.3 17.3 18.7 21.1 21.1
11 2.01 - Alcohol-specific mortality (Male) 2013 - 15 15.9 22.7 18.6 19.7 21.4 31.8 31.1 23.4 22.4 18.1 21.7 22.9 28.1 28.1
12 2.01 - Alcohol-specific mortality (Female) 2013 - 15 7.3 12.4 10.9 - x 14.4 - x 16.8 8.4 13.0 10.8 13.4 14.8 14.7 14.5
13 3.01 - Mortality from chronic liver disease(Persons)
2013 - 15 11.7 16.3 14.2 13.3 16.7 20.8 20.3 17.7 16.4 13.0 16.4 16.4 21.1 17.5
Comparison with respect to England value Better Similar Worse Not compared
Note: x - Value Missing
3 May 20176© Crown Copyright 2017
Local Alcohol Profiles
Middlesbrough
Mortality continued
Period
Eng
land
Nor
th E
ast
Co
Dur
ham
Dar
lingt
on
Gat
eshe
ad
Har
tlepo
ol
Mid
dle
sbo
ro
New
cast
le
N T
ynes
ide
Nor
thum
'land
Red
car
& C
ld
S T
ynes
ide
Sto
ckto
n
Sun
derla
nd
14 3.01 - Mortality from chronic liver disease (Male) 2013 - 15 15.4 20.7 16.4 18.2 20.0 31.8 27.5 24.8 21.1 16.3 18.8 20.3 28.0 22.0
15 3.01 - Mortality from chronic liver disease(Female)
2013 - 15 8.2 12.2 12.1 - x 13.6 - x 13.7 11.2 12.0 10.1 14.2 13.0 14.6 13.3
16 4.01 - Alcohol-related mortality (Persons) 2015 46.1 56.1 54.0 51.3 57.1 76.9 61.9 55.0 57.0 48.5 54.2 47.4 56.3 68.5
17 4.01 - Alcohol-related mortality (Male) 2015 66.6 80.2 75.9 71.1 83.3 119.9 87.2 81.3 78.1 70.1 74.0 67.6 83.0 99.3
18 4.01 - Alcohol-related mortality (Female) 2015 28.9 35.7 34.7 - x 34.9 - x 39.8 32.6 41.3 30.5 37.1 30.7 33.0 43.8
Hospital Admissions19 10.01 - Admission episodes for alcohol-related
conditions (Narrow) (Persons)2015/16 647 852 752 739 1015 839 921 826 945 847 674 982 853 948
20 10.01 - Admission episodes for alcohol-relatedconditions (Narrow) (Male)
2015/16 830 1079 918 950 1309 1127 1200 1057 1167 1063 844 1223 1125 1239
21 10.01 - Admission episodes for alcohol-relatedconditions (Narrow) (Female)
2015/16 483 650 607 549 748 578 670 607 762 651 524 778 608 692
22 9.01 - Admission episodes for alcohol-relatedconditions (Broad) (Persons)
2015/16 2179 2680 2518 2552 2825 2832 3283 2668 2720 2330 2625 3272 2757 2764
23 9.01 - Admission episodes for alcohol-relatedconditions (Broad) (Male)
2015/16 2995 3645 3351 3503 3877 3971 4543 3647 3649 3188 3509 4506 3794 3804
24 9.01 - Admission episodes for alcohol-relatedconditions (Broad) (Female)
2015/16 1482 1855 1808 1730 1909 1839 2204 1806 1973 1576 1881 2252 1861 1907
25 6.02 - Admission episodes for alcohol-specificconditions (Persons)
2015/16 583 770 656 732 935 749 1061 777 825 641 736 985 719 842
26 6.02 - Admission episodes for alcohol-specificconditions (Male)
2015/16 812 1065 898 1021 1318 1143 1470 1090 1058 876 921 1401 1018 1225
27 6.02 - Admission episodes for alcohol-specificconditions (Female)
2015/16 367 493 431 461 574 371 681 471 616 420 568 605 438 488
Comparison with respect to England value Better Similar Worse Not compared
Note: x - Value Missing
3 May 20177© Crown Copyright 2017
Local Alcohol Profiles
Middlesbrough
Hospital Admissions By Age-Group
Period
Eng
land
Nor
th E
ast
Co
Dur
ham
Dar
lingt
on
Gat
eshe
ad
Har
tlepo
ol
Mid
dle
sbo
ro
New
cast
le
N T
ynes
ide
Nor
thum
'land
Red
car
& C
ld
S T
ynes
ide
Sto
ckto
n
Sun
derla
nd
28 10.06 - Admission episodes for alcohol-relatedconditions (Narrow) - Under 40s (Persons)
2015/16 314 434 403 400 514 375 553 360 476 428 421 588 429 429
29 10.06 - Admission episodes for alcohol-relatedconditions (Narrow) - Under 40s (Male)
2015/16 370 528 486 446 626 490 656 428 501 585 507 701 576 526
30 10.06 - Admission episodes for alcohol-relatedconditions (Narrow) - Under 40s (Female)
2015/16 258 341 322 358 403 266 449 287 454 275 339 483 285 336
31 10.07 - Admission episodes for alcohol-relatedconditions (Narrow) - 40-64 yrs (Persons)
2015/16 904 1222 1018 1073 1468 1257 1324 1240 1370 1223 922 1316 1190 1418
32 10.07 - Admission episodes for alcohol-relatedconditions (Narrow) - 40-64 yrs (Male)
2015/16 1115 1481 1155 1397 1818 1638 1623 1584 1625 1412 1062 1534 1454 1847
33 10.07 - Admission episodes for alcohol-relatedconditions (Narrow) - 40-64 yrs (Female)
2015/16 698 975 887 766 1126 885 1041 894 1127 1044 789 1106 939 1011
34 10.08 - Admission episodes for alcohol-relatedconditions (Narrow) - Over 65s (Persons)
2015/16 1006 1225 1138 982 1444 1237 1114 1237 1347 1210 861 1361 1295 1393
35 10.08 - Admission episodes for alcohol-relatedconditions (Narrow) - Over 65s (Male)
2015/16 1447 1718 1552 1399 2078 1787 1785 1669 1984 1613 1280 1947 1884 1916
36 10.08 - Admission episodes for alcohol-relatedconditions (Narrow) - Over 65s (Female)
2015/16 654 834 810 638 931 802 567 883 880 883 517 929 814 1005
37 5.02 - Admission episodes for alcohol-specificconditions - Under 18s (Persons)
2013/14 - 15/16 37.4 66.9 67.5 58.7 66.5 28.3 66.0 30.9 67.6 64.1 69.4 94.4 57.3 115.1
38 5.02 - Admission episodes for alcohol-specificconditions - Under 18s (Male)
2013/14 - 15/16 29.4 57.8 59.0 26.0 50.4 19.6 66.3 25.3 46.3 62.6 42.4 78.2 73.3 104.6
39 5.02 - Admission episodes for alcohol-specificconditions - Under 18s (Female)
2013/14 - 15/16 45.8 76.5 76.4 92.5 83.5 37.5 65.7 36.8 90.3 65.7 98.2 111.2 40.3 126.3
Alcohol-Related Conditions40 10.03 - Admission episodes for alcohol-related
unintentional injuries conditions (Narrow)(Persons)
2015/16 139.7 157.5 156.6 155.6 170.6 166.2 180.4 156.7 154.2 157.3 159.2 164.8 163.6 139.7
Comparison with respect to England value Better Similar Worse Not compared
3 May 20178© Crown Copyright 2017
Local Alcohol Profiles
Middlesbrough
Alcohol-Related Conditions continued
Period
Eng
land
Nor
th E
ast
Co
Dur
ham
Dar
lingt
on
Gat
eshe
ad
Har
tlepo
ol
Mid
dle
sbo
ro
New
cast
le
N T
ynes
ide
Nor
thum
'land
Red
car
& C
ld
S T
ynes
ide
Sto
ckto
n
Sun
derla
nd
41 10.03 - Admission episodes for alcohol-relatedunintentional injuries conditions (Narrow) (Male)
2015/16 211.1 240.1 236.3 235.6 263.9 251.6 286.0 235.9 240.4 240.2 246.3 246.0 247.6 212.7
42 10.03 - Admission episodes for alcohol-relatedunintentional injuries conditions (Narrow)(Female)
2015/16 73.9 81.8 82.9 83.8 84.6 87.7 84.4 80.6 78.7 80.4 80.5 93.4 85.3 75.6
43 10.04 - Admission episodes for mental andbehavioural disorders due to use of alcoholcondition (Narrow) (Persons)
2015/16 80.1 104.9 75.3 100.2 119.8 80.1 102.6 129.8 142.3 107.3 71.0 110.8 75.8 146.8
44 10.04 - Admission episodes for mental andbehavioural disorders due to use of alcoholcondition (Narrow) (Male)
2015/16 111.6 145.2 101.3 148.6 162.7 130.2 153.7 181.1 179.6 141.7 89.3 146.9 103.9 227.2
45 10.04 - Admission episodes for mental andbehavioural disorders due to use of alcoholcondition (Narrow) (Female)
2015/16 49.7 66.4 50.5 53.9 78.5 - x 54.6 77.5 108.1 73.8 54.2 77.8 48.8 72.0
46 10.05 - Admission episodes for intentional self-poisoning by and exposure to alcohol condition(Narrow) (Persons)
2015/16 51.0 69.8 61.0 53.1 116.0 51.2 138.1 54.2 70.9 67.0 87.9 81.7 65.6 46.1
47 10.05 - Admission episodes for intentional self-poisoning by and exposure to alcohol condition(Narrow) (Male)
2015/16 43.5 65.5 53.7 49.7 107.5 58.1 135.5 44.4 55.2 67.7 68.4 101.6 60.7 47.3
48 10.05 - Admission episodes for intentional self-poisoning by and exposure to alcohol condition(Narrow) (Female)
2015/16 58.7 74.3 68.5 56.7 124.6 - x 140.0 64.7 86.4 66.8 106.2 62.9 70.7 44.9
49 9.03 - Admission episodes for alcohol-relatedcardiovascular disease conditions (Broad)(Persons)
2015/16 1107 1270 1262 1229 1171 1369 1552 1276 1217 1070 1349 1614 1323 1261
50 9.03 - Admission episodes for alcohol-relatedcardiovascular disease conditions (Broad) (Male)
2015/16 1604 1833 1787 1774 1705 1963 2249 1812 1789 1585 1943 2368 1902 1826
51 9.03 - Admission episodes for alcohol-relatedcardiovascular disease conditions (Broad)(Female)
2015/16 708 817 832 786 738 892 996 842 780 636 868 1032 851 837
52 9.04 - Admission episodes for mental andbehavioural disorders due to use of alcoholcondition (Broad) (Persons)
2015/16 385 475 412 524 495 507 696 435 558 409 440 546 440 530
Comparison with respect to England value Better Similar Worse Not compared
Note: x - Value Missing
3 May 20179© Crown Copyright 2017
Local Alcohol Profiles
Middlesbrough
Alcohol-Related Conditions continued
Period
Eng
land
Nor
th E
ast
Co
Dur
ham
Dar
lingt
on
Gat
eshe
ad
Har
tlepo
ol
Mid
dle
sbo
ro
New
cast
le
N T
ynes
ide
Nor
thum
'land
Red
car
& C
ld
S T
ynes
ide
Sto
ckto
n
Sun
derla
nd
53 9.04 - Admission episodes for mental andbehavioural disorders due to use of alcoholcondition (Broad) (Male)
2015/16 560 686 590 772 710 793 1033 640 768 572 600 811 630 804
54 9.04 - Admission episodes for mental andbehavioural disorders due to use of alcoholcondition (Broad) (Female)
2015/16 218 278 247 292 293 234 382 233 369 256 296 304 262 278
55 9.05 - Admission episodes for alcoholic liverdisease condition (Broad) (Persons)
2015/16 114.4 176.7 143.9 123.5 258.6 142.9 163.0 241.0 150.6 126.0 169.9 279.2 159.5 211.4
56 9.05 - Admission episodes for alcoholic liverdisease condition (Broad) (Male)
2015/16 160.6 244.1 194.6 156.1 399.0 209.8 217.9 340.0 188.9 175.3 209.3 376.6 236.4 299.0
57 9.05 - Admission episodes for alcoholic liverdisease condition (Broad) (Female)
2015/16 70.8 113.7 97.0 92.0 125.3 77.5 112.6 147.0 116.8 80.0 133.1 191.1 88.4 130.1
58 13.01 - Incidence rate of alcohol-related cancer(Persons)
2013 - 15 38.03 40.36 38.30 37.67 39.59 41.66 41.56 43.45 40.09 38.35 41.07 43.76 42.51 41.72
59 13.01 - Incidence rate of alcohol-related cancer(Male)
2013 - 15 39.29 44.64 40.39 39.04 44.45 53.73 48.00 47.24 45.00 39.03 46.51 50.90 49.65 47.89
60 13.01 - Incidence rate of alcohol-related cancer(Female)
2013 - 15 37.29 37.08 36.67 36.90 35.94 31.92 36.58 40.86 36.60 38.29 36.44 37.87 36.66 36.73
Other Impacts61 11.01 - Claimants of benefits due to alcoholism 2016 132.8 200.2 185.6 174.8 233.5 160.8 254.0 239.3 202.2 136.2 164.0 241.9 175.6 232.1
62 12.01 - Alcohol Related Road Traffic Accidents 2013 - 15 26.0 27.3 40.7 25.5 25.6 33.2 17.5 14.9 25.5 30.0 40.3 19.3 23.3 26.1
Consumption and Availability63 17.01 - Volume of pure alcohol sold through the
off-trade: all alcohol sales2014 5.5 6.7 7.0 8.5 4.7 8.6 4.0 9.2 8.3 8.2 4.5 8.1 3.8 4.5
64 17.02 - Volume of pure alcohol sold through theoff-trade: beer sales
2014 1.49 2.03 2.12 2.60 1.41 2.62 1.21 2.79 2.54 2.44 1.37 2.46 1.16 1.35
Comparison with respect to England value Better Similar Worse Not compared
3 May 201710© Crown Copyright 2017
Local Alcohol Profiles
Middlesbrough
Consumption and Availability continued
Period
Eng
land
Nor
th E
ast
Co
Dur
ham
Dar
lingt
on
Gat
eshe
ad
Har
tlepo
ol
Mid
dle
sbo
ro
New
cast
le
N T
ynes
ide
Nor
thum
'land
Red
car
& C
ld
S T
ynes
ide
Sto
ckto
n
Sun
derla
nd
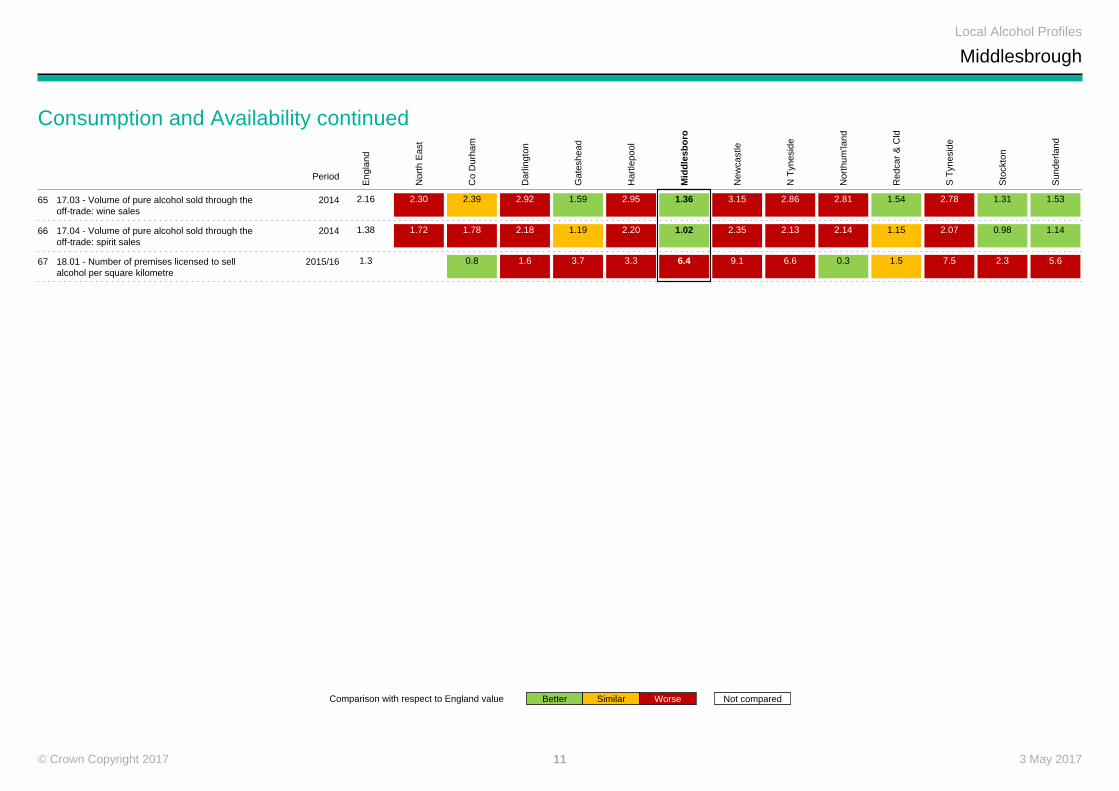
65 17.03 - Volume of pure alcohol sold through theoff-trade: wine sales
2014 2.16 2.30 2.39 2.92 1.59 2.95 1.36 3.15 2.86 2.81 1.54 2.78 1.31 1.53
66 17.04 - Volume of pure alcohol sold through theoff-trade: spirit sales
2014 1.38 1.72 1.78 2.18 1.19 2.20 1.02 2.35 2.13 2.14 1.15 2.07 0.98 1.14
67 18.01 - Number of premises licensed to sellalcohol per square kilometre
2015/16 1.3 0.8 1.6 3.7 3.3 6.4 9.1 6.6 0.3 1.5 7.5 2.3 5.6
Comparison with respect to England value Better Similar Worse Not compared
3 May 201711© Crown Copyright 2017
Local Alcohol Profiles
Middlesbrough
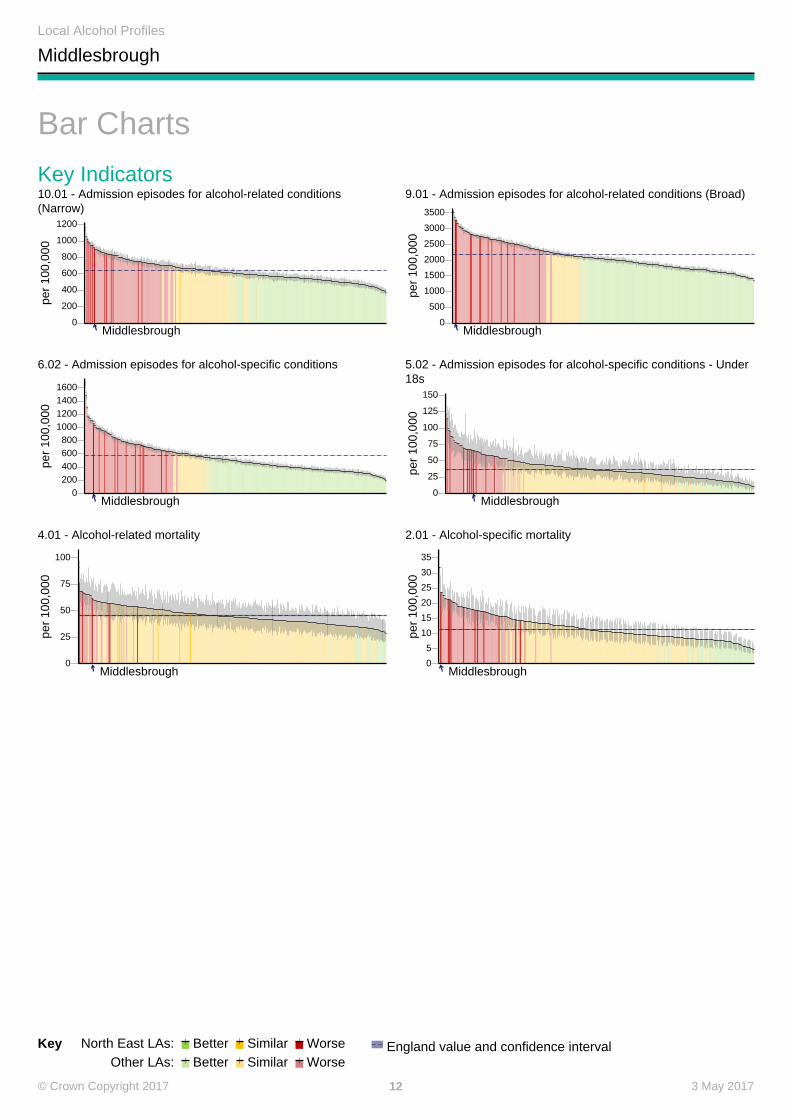
Bar Charts
Key Indicators
Key North East LAs: Better Similar WorseOther LAs: Better Similar Worse
England value and confidence interval
10.01 - Admission episodes for alcohol-related conditions(Narrow)
per
100,
000
0
200
400
600
800
1000
1200
Middlesbrough
9.01 - Admission episodes for alcohol-related conditions (Broad)
per
100,
000
0
500
1000
1500
2000
2500
3000
3500
Middlesbrough
6.02 - Admission episodes for alcohol-specific conditions
per
100,
000
0200400600800
1000120014001600
Middlesbrough
5.02 - Admission episodes for alcohol-specific conditions - Under18s
per
100,
000
0
25
50
75
100
125
150
Middlesbrough
4.01 - Alcohol-related mortality
per
100,
000
0
25
50
75
100
Middlesbrough
2.01 - Alcohol-specific mortality
per
100,
000
0
5
10
15
20
25
30
35
Middlesbrough
3 May 201712© Crown Copyright 2017
Local Alcohol Profiles
Middlesbrough
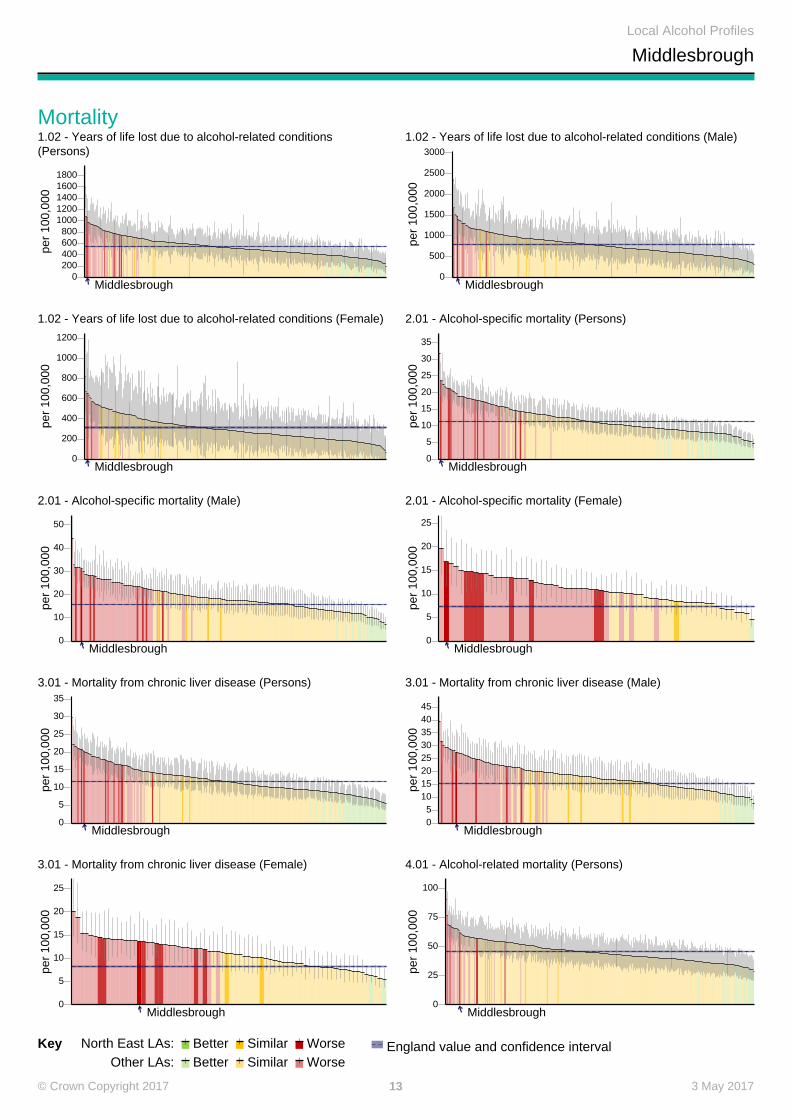
Mortality
Key North East LAs: Better Similar WorseOther LAs: Better Similar Worse
England value and confidence interval
1.02 - Years of life lost due to alcohol-related conditions(Persons)
per
100,
000
0200400600800
10001200140016001800
Middlesbrough
1.02 - Years of life lost due to alcohol-related conditions (Male)
per
100,
000
0
500
1000
1500
2000
2500
3000
Middlesbrough
1.02 - Years of life lost due to alcohol-related conditions (Female)
per
100,
000
0
200
400
600
800
1000
1200
Middlesbrough
2.01 - Alcohol-specific mortality (Persons)
per
100,
000
0
5
10
15
20
25
30
35
Middlesbrough
2.01 - Alcohol-specific mortality (Male)
per
100,
000
0
10
20
30
40
50
Middlesbrough
2.01 - Alcohol-specific mortality (Female)
per
100,
000
0
5
10
15
20
25
Middlesbrough
3.01 - Mortality from chronic liver disease (Persons)
per
100,
000
0
5
10
15
20
25
30
35
Middlesbrough
3.01 - Mortality from chronic liver disease (Male)
per
100,
000
05
1015202530354045
Middlesbrough
3.01 - Mortality from chronic liver disease (Female)
per
100,
000
0
5
10
15
20
25
Middlesbrough
4.01 - Alcohol-related mortality (Persons)
per
100,
000
0
25
50
75
100
Middlesbrough
3 May 201713© Crown Copyright 2017
Local Alcohol Profiles
Middlesbrough
Mortality continued
Key North East LAs: Better Similar WorseOther LAs: Better Similar Worse
England value and confidence interval
4.01 - Alcohol-related mortality (Male)
per
100,
000
0
25
50
75
100
125
150
Middlesbrough
4.01 - Alcohol-related mortality (Female)
per
100,
000
0
10
20
30
40
50
60
70
Middlesbrough
3 May 201714© Crown Copyright 2017
Local Alcohol Profiles
Middlesbrough
Hospital Admissions
Key North East LAs: Better Similar WorseOther LAs: Better Similar Worse
England value and confidence interval
10.01 - Admission episodes for alcohol-related conditions(Narrow) (Persons)
per
100,
000
0
200
400
600
800
1000
1200
Middlesbrough
10.01 - Admission episodes for alcohol-related conditions(Narrow) (Male)
per
100,
000
0
200
400
600
800
1000
1200
1400
Middlesbrough
10.01 - Admission episodes for alcohol-related conditions(Narrow) (Female)
per
100,
000
0100200300400500600700800900
Middlesbrough
9.01 - Admission episodes for alcohol-related conditions (Broad)(Persons)
per
100,
000
0
500
1000
1500
2000
2500
3000
3500
Middlesbrough
9.01 - Admission episodes for alcohol-related conditions (Broad)(Male)
per
100,
000
0
1000
2000
3000
4000
5000
Middlesbrough
9.01 - Admission episodes for alcohol-related conditions (Broad)(Female)
per
100,
000
0
500
1000
1500
2000
2500
Middlesbrough
6.02 - Admission episodes for alcohol-specific conditions(Persons)
per
100,
000
0200400600800
1000120014001600
Middlesbrough
6.02 - Admission episodes for alcohol-specific conditions (Male)
per
100,
000
0
500
1000
1500
2000
2500
Middlesbrough
6.02 - Admission episodes for alcohol-specific conditions(Female)
per
100,
000
0
200
400
600
800
1000
Middlesbrough
3 May 201715© Crown Copyright 2017
Local Alcohol Profiles
Middlesbrough
Hospital Admissions By Age-Group
Key North East LAs: Better Similar WorseOther LAs: Better Similar Worse
England value and confidence interval
10.06 - Admission episodes for alcohol-related conditions(Narrow) - Under 40s (Persons)
per
100,
000
0
100
200
300
400
500
600
700
Middlesbrough
10.06 - Admission episodes for alcohol-related conditions(Narrow) - Under 40s (Male)
per
100,
000
0
200
400
600
800
1000
Middlesbrough
10.06 - Admission episodes for alcohol-related conditions(Narrow) - Under 40s (Female)
per
100,
000
0
100
200
300
400
500
600
700
Middlesbrough
10.07 - Admission episodes for alcohol-related conditions(Narrow) - 40-64 yrs (Persons)
per
100,
000
0200400600800
10001200140016001800
Middlesbrough
10.07 - Admission episodes for alcohol-related conditions(Narrow) - 40-64 yrs (Male)
per
100,
000
0
500
1000
1500
2000
Middlesbrough
10.07 - Admission episodes for alcohol-related conditions(Narrow) - 40-64 yrs (Female)
per
100,
000
0
200
400
600
800
1000
1200
1400
Middlesbrough
10.08 - Admission episodes for alcohol-related conditions(Narrow) - Over 65s (Persons)
per
100,
000
0200400600800
10001200140016001800
Middlesbrough
10.08 - Admission episodes for alcohol-related conditions(Narrow) - Over 65s (Male)
per
100,
000
0
500
1000
1500
2000
2500
3000
Middlesbrough
10.08 - Admission episodes for alcohol-related conditions(Narrow) - Over 65s (Female)
per
100,
000
0
200
400
600
800
1000
1200
1400
Middlesbrough
5.02 - Admission episodes for alcohol-specific conditions - Under18s (Persons)
per
100,
000
0
25
50
75
100
125
150
Middlesbrough
3 May 201716© Crown Copyright 2017
Local Alcohol Profiles
Middlesbrough
Hospital Admissions By Age-Group continued
Key North East LAs: Better Similar WorseOther LAs: Better Similar Worse
England value and confidence interval
5.02 - Admission episodes for alcohol-specific conditions - Under18s (Male)
per
100,
000
0
25
50
75
100
125
Middlesbrough
5.02 - Admission episodes for alcohol-specific conditions - Under18s (Female)
per
100,
000
0
50
100
150
200
Middlesbrough
3 May 201717© Crown Copyright 2017
Local Alcohol Profiles
Middlesbrough
Alcohol-Related Conditions
Key North East LAs: Better Similar WorseOther LAs: Better Similar Worse
England value and confidence interval
10.03 - Admission episodes for alcohol-related unintentionalinjuries conditions (Narrow) (Persons)
per
100,
000
0
50
100
150
200
Middlesbrough
10.03 - Admission episodes for alcohol-related unintentionalinjuries conditions (Narrow) (Male)
per
100,
000
0
50
100
150
200
250
300
350
Middlesbrough
10.03 - Admission episodes for alcohol-related unintentionalinjuries conditions (Narrow) (Female)
per
100,
000
0
25
50
75
100
125
Middlesbrough
10.04 - Admission episodes for mental and behavioural disordersdue to use of alcohol condition (Narrow) (Persons)
per
100,
000
0
50
100
150
200
250
Middlesbrough
10.04 - Admission episodes for mental and behavioural disordersdue to use of alcohol condition (Narrow) (Male)
per
100,
000
0
50
100
150
200
250
300
350
400
Middlesbrough
10.04 - Admission episodes for mental and behavioural disordersdue to use of alcohol condition (Narrow) (Female)
per
100,
000
0
25
50
75
100
125
150
175
Middlesbrough
10.05 - Admission episodes for intentional self-poisoning by andexposure to alcohol condition (Narrow) (Persons)
per
100,
000
0
50
100
150
200
Middlesbrough
10.05 - Admission episodes for intentional self-poisoning by andexposure to alcohol condition (Narrow) (Male)
per
100,
000
0
25
50
75
100
125
150
175
Middlesbrough
10.05 - Admission episodes for intentional self-poisoning by andexposure to alcohol condition (Narrow) (Female)
per
100,
000
0
50
100
150
200
Middlesbrough
9.03 - Admission episodes for alcohol-related cardiovasculardisease conditions (Broad) (Persons)
per
100,
000
0200400600800
1000120014001600
Middlesbrough
3 May 201718© Crown Copyright 2017
Local Alcohol Profiles
Middlesbrough
Alcohol-Related Conditions continued
Key North East LAs: Better Similar WorseOther LAs: Better Similar Worse
England value and confidence interval
9.03 - Admission episodes for alcohol-related cardiovasculardisease conditions (Broad) (Male)
per
100,
000
0
500
1000
1500
2000
2500
Middlesbrough
9.03 - Admission episodes for alcohol-related cardiovasculardisease conditions (Broad) (Female)
per
100,
000
0
200
400
600
800
1000
1200
Middlesbrough
9.04 - Admission episodes for mental and behavioural disordersdue to use of alcohol condition (Broad) (Persons)
per
100,
000
0
200
400
600
800
1000
1200
Middlesbrough
9.04 - Admission episodes for mental and behavioural disordersdue to use of alcohol condition (Broad) (Male)
per
100,
000
0200400600800
10001200140016001800
Middlesbrough
9.04 - Admission episodes for mental and behavioural disordersdue to use of alcohol condition (Broad) (Female)
per
100,
000
0
100
200
300
400
500
600
Middlesbrough
9.05 - Admission episodes for alcoholic liver disease condition(Broad) (Persons)
per
100,
000
0
50
100
150
200
250
300
Middlesbrough
9.05 - Admission episodes for alcoholic liver disease condition(Broad) (Male)
per
100,
000
050
100150200250300350400450
Middlesbrough
9.05 - Admission episodes for alcoholic liver disease condition(Broad) (Female)
per
100,
000
0
50
100
150
200
250
Middlesbrough
13.01 - Incidence rate of alcohol-related cancer (Persons)
per
100,
000
0
10
20
30
40
50
Middlesbrough
13.01 - Incidence rate of alcohol-related cancer (Male)
per
100,
000
0
10
20
30
40
50
60
Middlesbrough
3 May 201719© Crown Copyright 2017
Local Alcohol Profiles
Middlesbrough
Alcohol-Related Conditions continued
Key North East LAs: Better Similar WorseOther LAs: Better Similar Worse
England value and confidence interval
13.01 - Incidence rate of alcohol-related cancer (Female)
per
100,
000
0
10
20
30
40
50
60
Middlesbrough
3 May 201720© Crown Copyright 2017
Local Alcohol Profiles
Middlesbrough
Other Impacts
Key North East LAs: Better Similar WorseOther LAs: Better Similar Worse
England value and confidence interval
11.01 - Claimants of benefits due to alcoholism
per
100,
000
0
100
200
300
400
500
600
Middlesbrough
12.01 - Alcohol Related Road Traffic Accidents
per
1000
0
10
20
30
40
50
60
70
80
Middlesbrough
3 May 201721© Crown Copyright 2017
Local Alcohol Profiles
Middlesbrough
Consumption and Availability
Key North East LAs: Better Similar WorseOther LAs: Better Similar Worse
England value and confidence interval
17.01 - Volume of pure alcohol sold through the off-trade: allalcohol sales
l/adu
lt
0
2
4
6
8
10
12
Middlesbrough
17.02 - Volume of pure alcohol sold through the off-trade: beersales
l/adu
lt
0
1
2
3
4
Middlesbrough
17.03 - Volume of pure alcohol sold through the off-trade: winesales
l/adu
lt
0
1
2
3
4
5
Middlesbrough
17.04 - Volume of pure alcohol sold through the off-trade: spiritsales
l/adu
lt
0
0.5
1
1.5
2
2.5
3
3.5
Middlesbrough
18.01 - Number of premises licensed to sell alcohol per squarekilometre
01020304050607080
Middlesbrough
3 May 201722© Crown Copyright 2017
Local Alcohol Profiles
Middlesbrough
Trends
Key Indicators
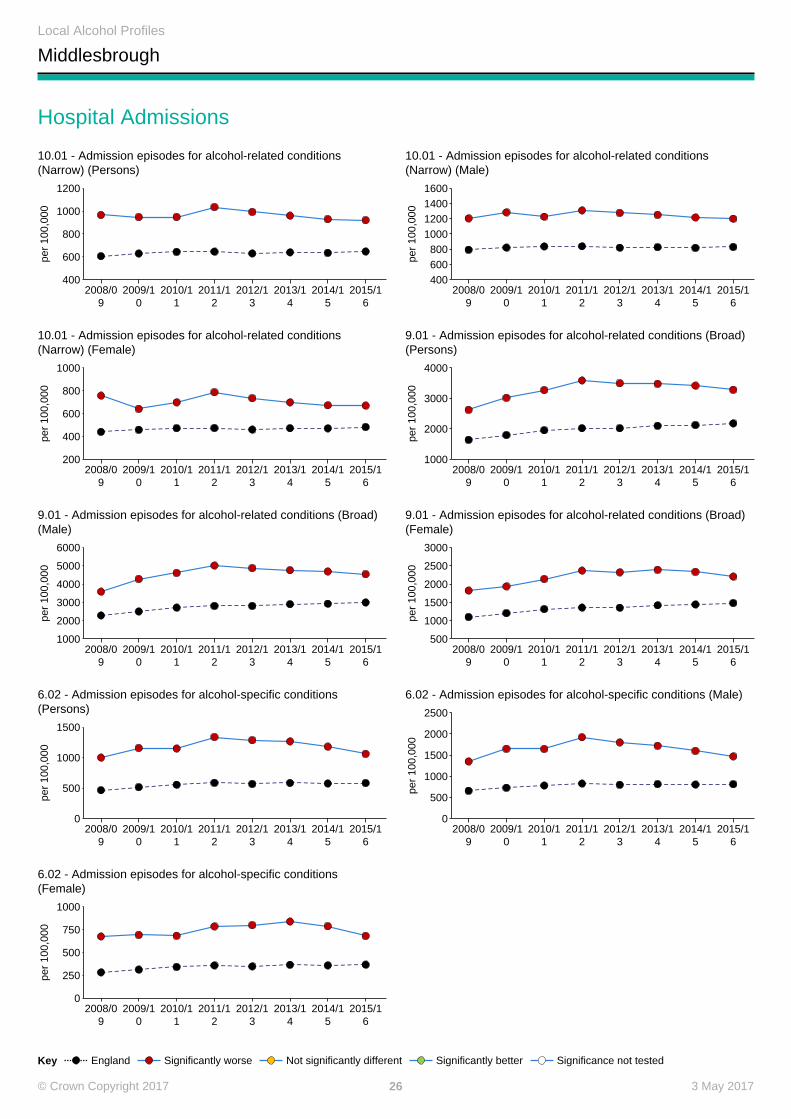
Key England Significantly worse Not significantly different Significantly better Significance not tested
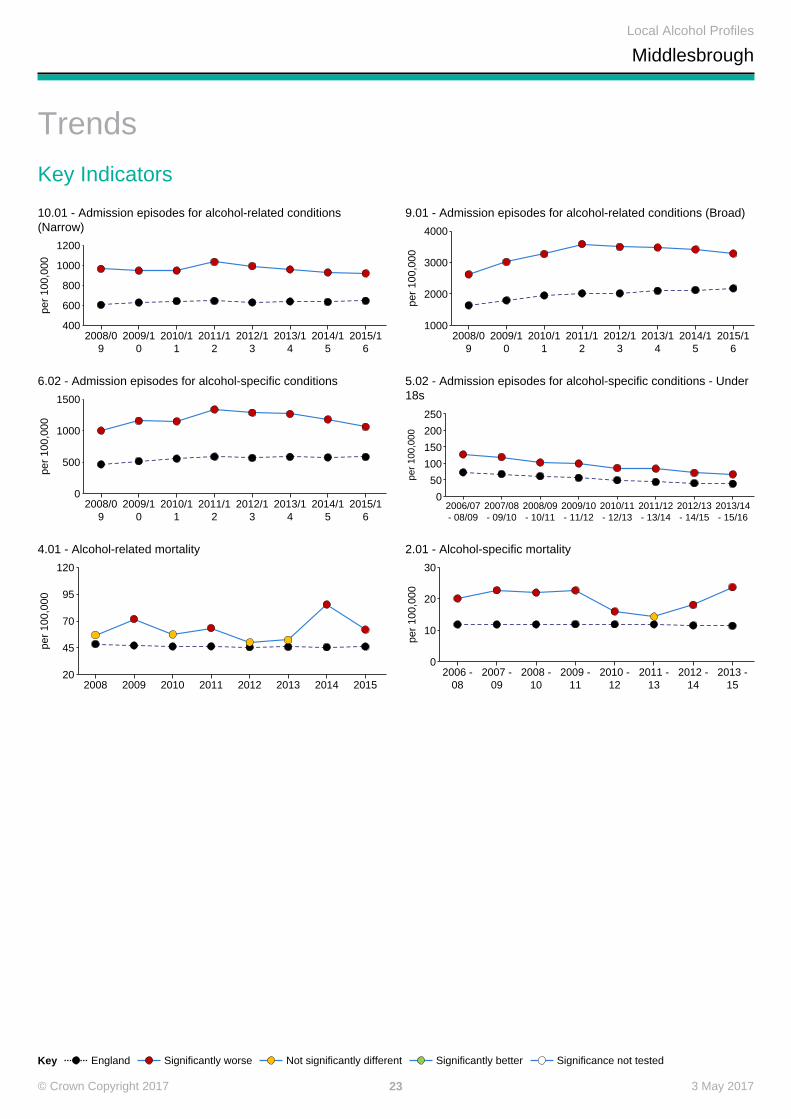
10.01 - Admission episodes for alcohol-related conditions(Narrow)
2008/09
2009/10
2010/11
2011/12
2012/13
2013/14
2014/15
2015/16
per
100,
000
400
600
800
1000
1200
9.01 - Admission episodes for alcohol-related conditions (Broad)
2008/09
2009/10
2010/11
2011/12
2012/13
2013/14
2014/15
2015/16
per
100,
000
1000
2000
3000
4000
6.02 - Admission episodes for alcohol-specific conditions
2008/09
2009/10
2010/11
2011/12
2012/13
2013/14
2014/15
2015/16
per
100,
000
0
500
1000
1500
5.02 - Admission episodes for alcohol-specific conditions - Under18s
2006/07- 08/09
2007/08- 09/10
2008/09- 10/11
2009/10- 11/12
2010/11- 12/13
2011/12- 13/14
2012/13- 14/15
2013/14- 15/16
per
100,
000
0
50
100
150
200
250
4.01 - Alcohol-related mortality
2008 2009 2010 2011 2012 2013 2014 2015
per
100,
000
20
45
70
95
120
2.01 - Alcohol-specific mortality
2006 -08
2007 -09
2008 -10
2009 -11
2010 -12
2011 -13
2012 -14
2013 -15
per
100,
000
0
10
20
30
3 May 201723© Crown Copyright 2017
Local Alcohol Profiles
Middlesbrough
Mortality
Key England Significantly worse Not significantly different Significantly better Significance not tested
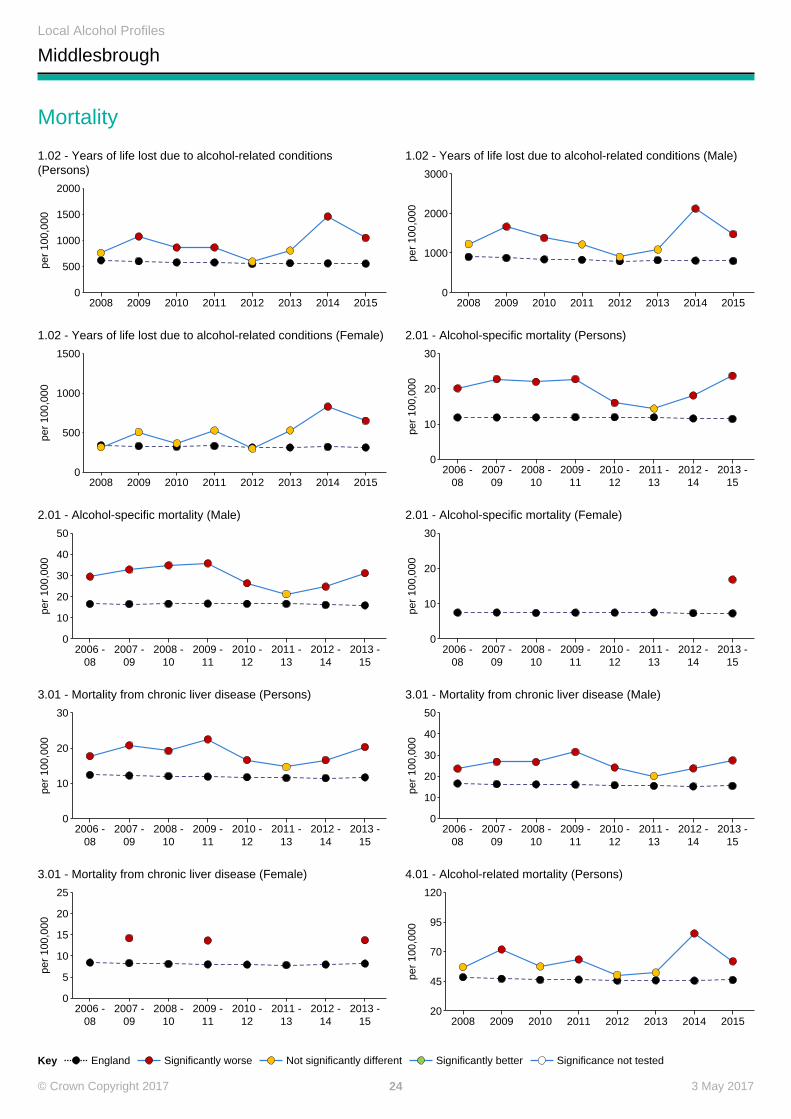
1.02 - Years of life lost due to alcohol-related conditions(Persons)
2008 2009 2010 2011 2012 2013 2014 2015
per
100,
000
0
500
1000
1500
2000
1.02 - Years of life lost due to alcohol-related conditions (Male)
2008 2009 2010 2011 2012 2013 2014 2015
per
100,
000
0
1000
2000
3000
1.02 - Years of life lost due to alcohol-related conditions (Female)
2008 2009 2010 2011 2012 2013 2014 2015
per
100,
000
0
500
1000
1500
2.01 - Alcohol-specific mortality (Persons)
2006 -08
2007 -09
2008 -10
2009 -11
2010 -12
2011 -13
2012 -14
2013 -15
per
100,
000
0
10
20
30
2.01 - Alcohol-specific mortality (Male)
2006 -08
2007 -09
2008 -10
2009 -11
2010 -12
2011 -13
2012 -14
2013 -15
per
100,
000
0
10
20
30
40
50
2.01 - Alcohol-specific mortality (Female)
2006 -08
2007 -09
2008 -10
2009 -11
2010 -12
2011 -13
2012 -14
2013 -15
per
100,
000
0
10
20
30
3.01 - Mortality from chronic liver disease (Persons)
2006 -08
2007 -09
2008 -10
2009 -11
2010 -12
2011 -13
2012 -14
2013 -15
per
100,
000
0
10
20
30
3.01 - Mortality from chronic liver disease (Male)
2006 -08
2007 -09
2008 -10
2009 -11
2010 -12
2011 -13
2012 -14
2013 -15
per
100,
000
0
10
20
30
40
50
3.01 - Mortality from chronic liver disease (Female)
2006 -08
2007 -09
2008 -10
2009 -11
2010 -12
2011 -13
2012 -14
2013 -15
per
100,
000
0
5
10
15
20
25
4.01 - Alcohol-related mortality (Persons)
2008 2009 2010 2011 2012 2013 2014 2015
per
100,
000
20
45
70
95
120
3 May 201724© Crown Copyright 2017
Local Alcohol Profiles
Middlesbrough
Mortality continued
Key England Significantly worse Not significantly different Significantly better Significance not tested
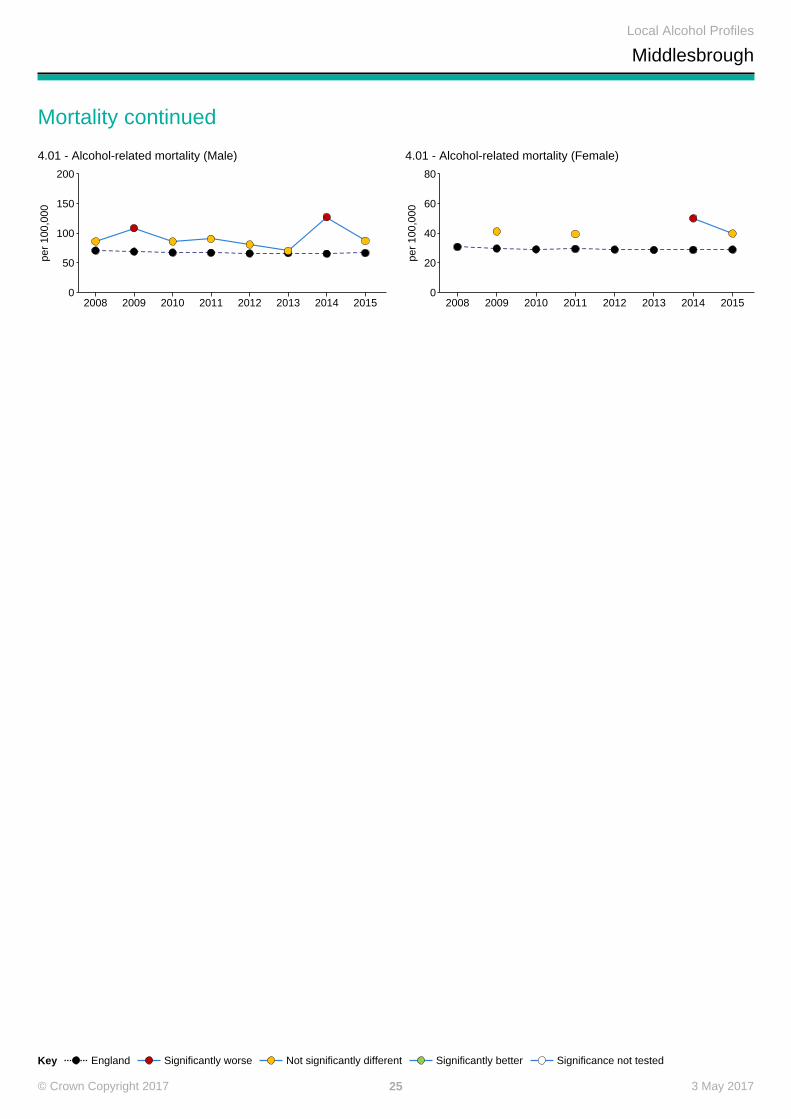
4.01 - Alcohol-related mortality (Male)
2008 2009 2010 2011 2012 2013 2014 2015
per
100,
000
0
50
100
150
200
4.01 - Alcohol-related mortality (Female)
2008 2009 2010 2011 2012 2013 2014 2015
per
100,
000
0
20
40
60
80
3 May 201725© Crown Copyright 2017
Local Alcohol Profiles
Middlesbrough
Hospital Admissions
Key England Significantly worse Not significantly different Significantly better Significance not tested
10.01 - Admission episodes for alcohol-related conditions(Narrow) (Persons)
2008/09
2009/10
2010/11
2011/12
2012/13
2013/14
2014/15
2015/16
per
100,
000
400
600
800
1000
1200
10.01 - Admission episodes for alcohol-related conditions(Narrow) (Male)
2008/09
2009/10
2010/11
2011/12
2012/13
2013/14
2014/15
2015/16
per
100,
000
400600800
1000120014001600
10.01 - Admission episodes for alcohol-related conditions(Narrow) (Female)
2008/09
2009/10
2010/11
2011/12
2012/13
2013/14
2014/15
2015/16
per
100,
000
200
400
600
800
1000
9.01 - Admission episodes for alcohol-related conditions (Broad)(Persons)
2008/09
2009/10
2010/11
2011/12
2012/13
2013/14
2014/15
2015/16
per
100,
000
1000
2000
3000
4000
9.01 - Admission episodes for alcohol-related conditions (Broad)(Male)
2008/09
2009/10
2010/11
2011/12
2012/13
2013/14
2014/15
2015/16
per
100,
000
1000
2000
3000
4000
5000
6000
9.01 - Admission episodes for alcohol-related conditions (Broad)(Female)
2008/09
2009/10
2010/11
2011/12
2012/13
2013/14
2014/15
2015/16
per
100,
000
500
1000
1500
2000
2500
3000
6.02 - Admission episodes for alcohol-specific conditions(Persons)
2008/09
2009/10
2010/11
2011/12
2012/13
2013/14
2014/15
2015/16
per
100,
000
0
500
1000
1500
6.02 - Admission episodes for alcohol-specific conditions (Male)
2008/09
2009/10
2010/11
2011/12
2012/13
2013/14
2014/15
2015/16
per
100,
000
0
500
1000
1500
2000
2500
6.02 - Admission episodes for alcohol-specific conditions(Female)
2008/09
2009/10
2010/11
2011/12
2012/13
2013/14
2014/15
2015/16
per
100,
000
0
250
500
750
1000
3 May 201726© Crown Copyright 2017
Local Alcohol Profiles
Middlesbrough
Hospital Admissions By Age-Group
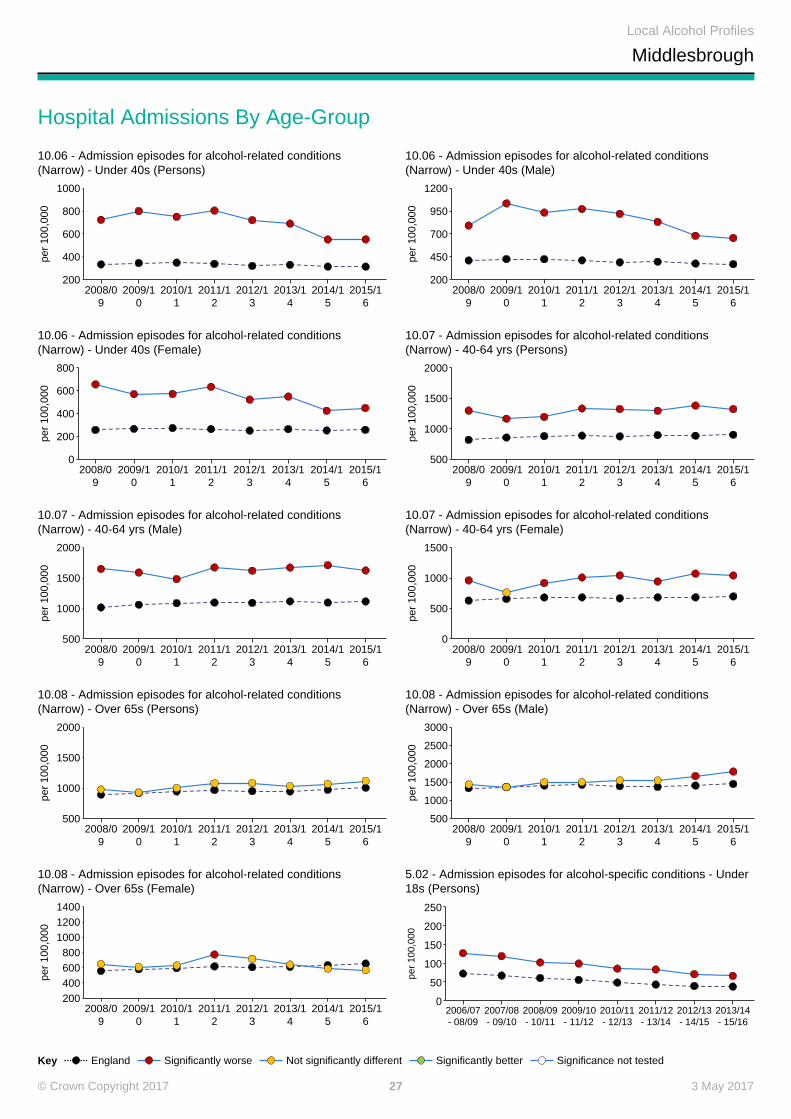
Key England Significantly worse Not significantly different Significantly better Significance not tested
10.06 - Admission episodes for alcohol-related conditions(Narrow) - Under 40s (Persons)
2008/09
2009/10
2010/11
2011/12
2012/13
2013/14
2014/15
2015/16
per
100,
000
200
400
600
800
1000
10.06 - Admission episodes for alcohol-related conditions(Narrow) - Under 40s (Male)
2008/09
2009/10
2010/11
2011/12
2012/13
2013/14
2014/15
2015/16
per
100,
000
200
450
700
950
1200
10.06 - Admission episodes for alcohol-related conditions(Narrow) - Under 40s (Female)
2008/09
2009/10
2010/11
2011/12
2012/13
2013/14
2014/15
2015/16
per
100,
000
0
200
400
600
800
10.07 - Admission episodes for alcohol-related conditions(Narrow) - 40-64 yrs (Persons)
2008/09
2009/10
2010/11
2011/12
2012/13
2013/14
2014/15
2015/16
per
100,
000
500
1000
1500
2000
10.07 - Admission episodes for alcohol-related conditions(Narrow) - 40-64 yrs (Male)
2008/09
2009/10
2010/11
2011/12
2012/13
2013/14
2014/15
2015/16
per
100,
000
500
1000
1500
2000
10.07 - Admission episodes for alcohol-related conditions(Narrow) - 40-64 yrs (Female)
2008/09
2009/10
2010/11
2011/12
2012/13
2013/14
2014/15
2015/16
per
100,
000
0
500
1000
1500
10.08 - Admission episodes for alcohol-related conditions(Narrow) - Over 65s (Persons)
2008/09
2009/10
2010/11
2011/12
2012/13
2013/14
2014/15
2015/16
per
100,
000
500
1000
1500
2000
10.08 - Admission episodes for alcohol-related conditions(Narrow) - Over 65s (Male)
2008/09
2009/10
2010/11
2011/12
2012/13
2013/14
2014/15
2015/16
per
100,
000
500
1000
1500
2000
2500
3000
10.08 - Admission episodes for alcohol-related conditions(Narrow) - Over 65s (Female)
2008/09
2009/10
2010/11
2011/12
2012/13
2013/14
2014/15
2015/16
per
100,
000
200400600800
100012001400
5.02 - Admission episodes for alcohol-specific conditions - Under18s (Persons)
2006/07- 08/09
2007/08- 09/10
2008/09- 10/11
2009/10- 11/12
2010/11- 12/13
2011/12- 13/14
2012/13- 14/15
2013/14- 15/16
per
100,
000
0
50
100
150
200
250
3 May 201727© Crown Copyright 2017
Local Alcohol Profiles
Middlesbrough
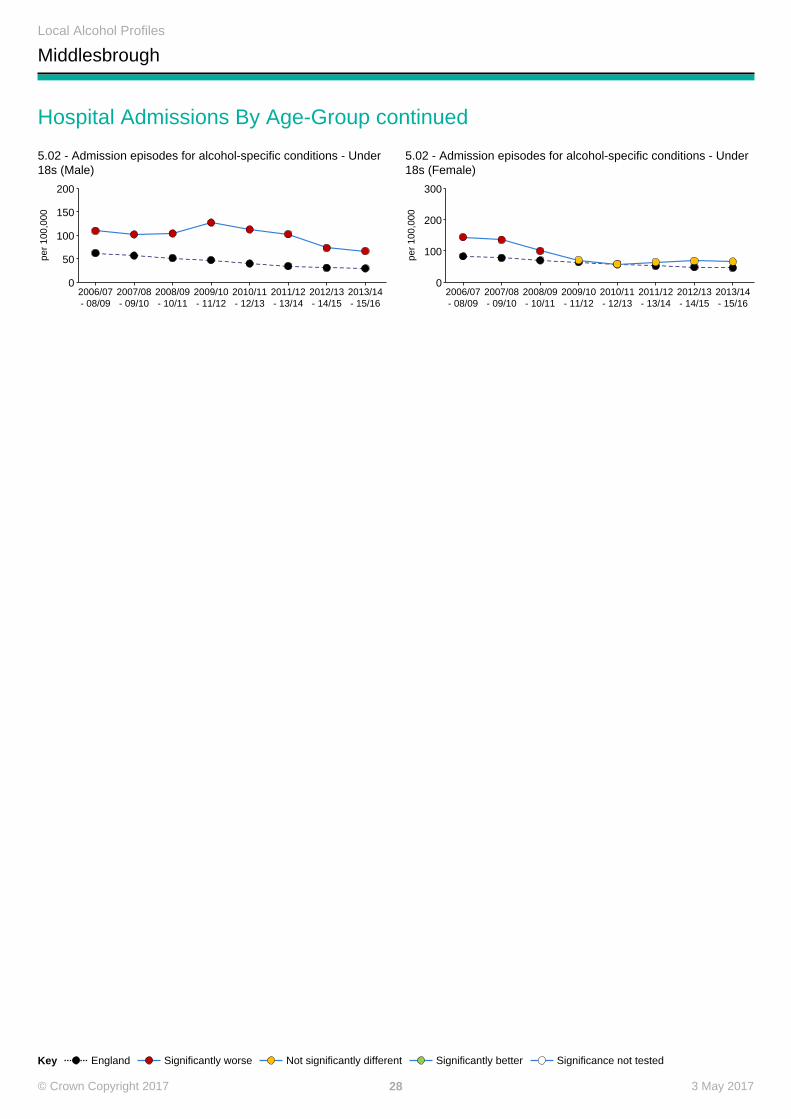
Hospital Admissions By Age-Group continued
Key England Significantly worse Not significantly different Significantly better Significance not tested
5.02 - Admission episodes for alcohol-specific conditions - Under18s (Male)
2006/07- 08/09
2007/08- 09/10
2008/09- 10/11
2009/10- 11/12
2010/11- 12/13
2011/12- 13/14
2012/13- 14/15
2013/14- 15/16
per
100,
000
0
50
100
150
200
5.02 - Admission episodes for alcohol-specific conditions - Under18s (Female)
2006/07- 08/09
2007/08- 09/10
2008/09- 10/11
2009/10- 11/12
2010/11- 12/13
2011/12- 13/14
2012/13- 14/15
2013/14- 15/16
per
100,
000
0
100
200
300
3 May 201728© Crown Copyright 2017
Local Alcohol Profiles
Middlesbrough
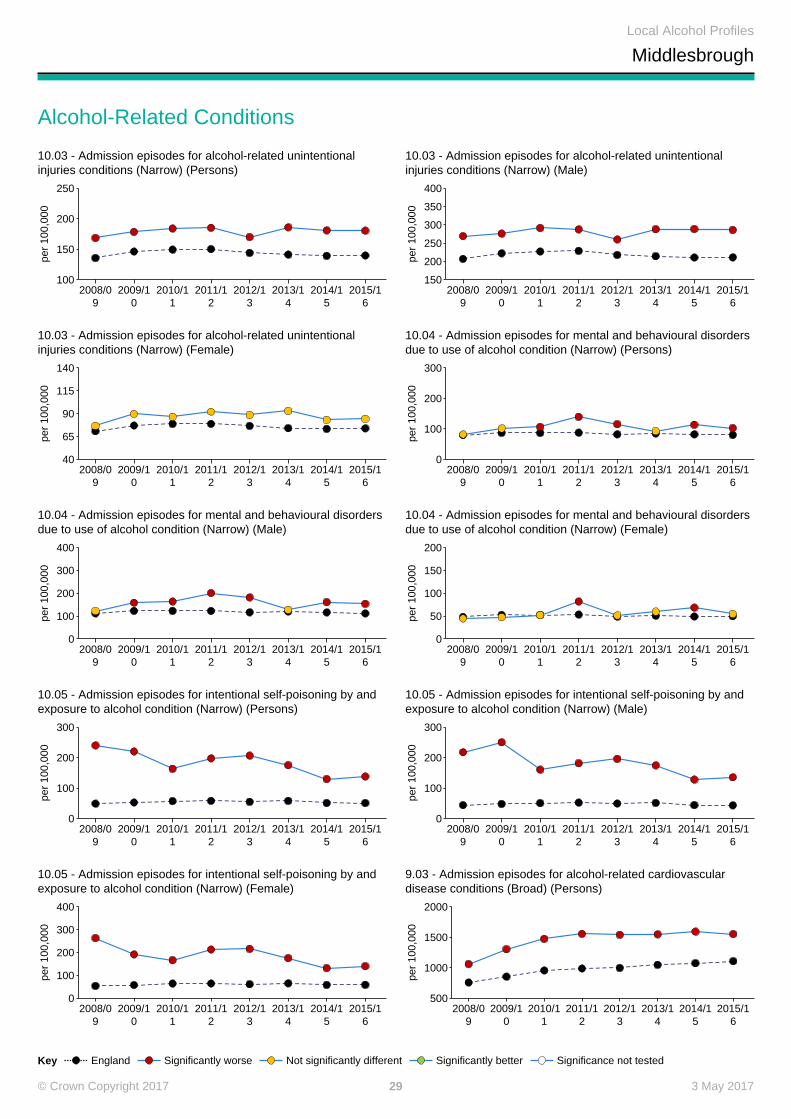
Alcohol-Related Conditions
Key England Significantly worse Not significantly different Significantly better Significance not tested
10.03 - Admission episodes for alcohol-related unintentionalinjuries conditions (Narrow) (Persons)
2008/09
2009/10
2010/11
2011/12
2012/13
2013/14
2014/15
2015/16
per
100,
000
100
150
200
250
10.03 - Admission episodes for alcohol-related unintentionalinjuries conditions (Narrow) (Male)
2008/09
2009/10
2010/11
2011/12
2012/13
2013/14
2014/15
2015/16
per
100,
000
150
200
250
300
350
400
10.03 - Admission episodes for alcohol-related unintentionalinjuries conditions (Narrow) (Female)
2008/09
2009/10
2010/11
2011/12
2012/13
2013/14
2014/15
2015/16
per
100,
000
40
65
90
115
140
10.04 - Admission episodes for mental and behavioural disordersdue to use of alcohol condition (Narrow) (Persons)
2008/09
2009/10
2010/11
2011/12
2012/13
2013/14
2014/15
2015/16
per
100,
000
0
100
200
300
10.04 - Admission episodes for mental and behavioural disordersdue to use of alcohol condition (Narrow) (Male)
2008/09
2009/10
2010/11
2011/12
2012/13
2013/14
2014/15
2015/16
per
100,
000
0
100
200
300
400
10.04 - Admission episodes for mental and behavioural disordersdue to use of alcohol condition (Narrow) (Female)
2008/09
2009/10
2010/11
2011/12
2012/13
2013/14
2014/15
2015/16
per
100,
000
0
50
100
150
200
10.05 - Admission episodes for intentional self-poisoning by andexposure to alcohol condition (Narrow) (Persons)
2008/09
2009/10
2010/11
2011/12
2012/13
2013/14
2014/15
2015/16
per
100,
000
0
100
200
300
10.05 - Admission episodes for intentional self-poisoning by andexposure to alcohol condition (Narrow) (Male)
2008/09
2009/10
2010/11
2011/12
2012/13
2013/14
2014/15
2015/16
per
100,
000
0
100
200
300
10.05 - Admission episodes for intentional self-poisoning by andexposure to alcohol condition (Narrow) (Female)
2008/09
2009/10
2010/11
2011/12
2012/13
2013/14
2014/15
2015/16
per
100,
000
0
100
200
300
400
9.03 - Admission episodes for alcohol-related cardiovasculardisease conditions (Broad) (Persons)
2008/09
2009/10
2010/11
2011/12
2012/13
2013/14
2014/15
2015/16
per
100,
000
500
1000
1500
2000
3 May 201729© Crown Copyright 2017
Local Alcohol Profiles
Middlesbrough
Alcohol-Related Conditions continued
Key England Significantly worse Not significantly different Significantly better Significance not tested
9.03 - Admission episodes for alcohol-related cardiovasculardisease conditions (Broad) (Male)
2008/09
2009/10
2010/11
2011/12
2012/13
2013/14
2014/15
2015/16
per
100,
000
500
1000
1500
2000
2500
9.03 - Admission episodes for alcohol-related cardiovasculardisease conditions (Broad) (Female)
2008/09
2009/10
2010/11
2011/12
2012/13
2013/14
2014/15
2015/16
per
100,
000
200
450
700
950
1200
9.04 - Admission episodes for mental and behavioural disordersdue to use of alcohol condition (Broad) (Persons)
2008/09
2009/10
2010/11
2011/12
2012/13
2013/14
2014/15
2015/16
per
100,
000
0
250
500
750
1000
9.04 - Admission episodes for mental and behavioural disordersdue to use of alcohol condition (Broad) (Male)
2008/09
2009/10
2010/11
2011/12
2012/13
2013/14
2014/15
2015/16
per
100,
000
0
500
1000
1500
9.04 - Admission episodes for mental and behavioural disordersdue to use of alcohol condition (Broad) (Female)
2008/09
2009/10
2010/11
2011/12
2012/13
2013/14
2014/15
2015/16
per
100,
000
0
200
400
600
9.05 - Admission episodes for alcoholic liver disease condition(Broad) (Persons)
2008/09
2009/10
2010/11
2011/12
2012/13
2013/14
2014/15
2015/16
per
100,
000
0
100
200
300
400
9.05 - Admission episodes for alcoholic liver disease condition(Broad) (Male)
2008/09
2009/10
2010/11
2011/12
2012/13
2013/14
2014/15
2015/16
per
100,
000
0
100
200
300
400
500
9.05 - Admission episodes for alcoholic liver disease condition(Broad) (Female)
2008/09
2009/10
2010/11
2011/12
2012/13
2013/14
2014/15
2015/16
per
100,
000
0
50
100
150
200
250
13.01 - Incidence rate of alcohol-related cancer (Persons)
2004- 06
2005- 07
2006- 08
2007- 09
2008- 10
2009- 11
2010- 12
2011- 13
2012- 14
2013- 15
per
100,
000
20
30
40
50
60
13.01 - Incidence rate of alcohol-related cancer (Male)
2004- 06
2005- 07
2006- 08
2007- 09
2008- 10
2009- 11
2010- 12
2011- 13
2012- 14
2013- 15
per
100,
000
20
30
40
50
60
70
3 May 201730© Crown Copyright 2017
Local Alcohol Profiles
Middlesbrough
Alcohol-Related Conditions continued
Key England Significantly worse Not significantly different Significantly better Significance not tested
13.01 - Incidence rate of alcohol-related cancer (Female)
2004- 06
2005- 07
2006- 08
2007- 09
2008- 10
2009- 11
2010- 12
2011- 13
2012- 14
2013- 15
per
100,
000
20
30
40
50
60
3 May 201731© Crown Copyright 2017
Local Alcohol Profiles
Middlesbrough
Consumption and Availability
Key England Significantly worse Not significantly different Significantly better Significance not tested
17.01 - Volume of pure alcohol sold through the off-trade: allalcohol sales
2014
l/adu
lt
2
4.5
7
9.5
12
17.02 - Volume of pure alcohol sold through the off-trade: beersales
2014
l/adu
lt
0
1
2
3
4
17.03 - Volume of pure alcohol sold through the off-trade: winesales
2014
l/adu
lt
0
1
2
3
4
17.04 - Volume of pure alcohol sold through the off-trade: spiritsales
2014
l/adu
lt
0.5
1
1.5
2
2.5
3
18.01 - Number of premises licensed to sell alcohol per squarekilometre
2015/160
2.5
5
7.5
10
3 May 201732© Crown Copyright 2017