Guidance on quantifying greenhouse gas emission reductions ...

METHOD FOR ESTIMATING GREENHOUSE GAS EMISSION REDUCTIONS FROM COMPOST FROM COMMERCIAL ORGANIC WASTE
November 14, 2011
Planning and Technical Support Division
California Air Resources Board
California Environmental Protection Agency
2
TABLE OF CONTENTS
EXECUTIVE SUMMARY 3 1. BACKGROUND 4 2. METHODS 5 2.1 Composting Emissions 5 2.1.1 Transportation Emissions (Te) 5 2.1.2 Process Emissions (Pe) 6 2.1.3 Fugitive Emissions (Fe) 6 2.2 Compost Emission Reductions 6
2.2.1 Increased Soil Carbon Storage (CSb) 7 2.2.2 Decreased Water Use (Wb) 7 2.2.3 Decreased Soil Erosion (Eb) 8 2.2.4 Reduced Fertilizer Use (Fb) 8 2.2.5 Reduced Herbicide Use (Hb) 9 2.2.6 Conversion Factor (Cuse) 9
2.3 Compost Emission Reduction Factor (CERF) 9 3. RESULTS AND DISCUSSION 9 3.1 Composting Emissions 10
3.1.1 Transportation Emissions (Te) 10 3.1.2 Process Emissions (Pe) 10 3.1.3 Fugitive Emissions (Fe) 11 3.1.4 Summary of Emissions 13 3.2 Compost Emission Reductions 13
3.2.1 Increased Soil Carbon Storage (CSb) 13 3.2.2 Decreased Water Use (Wb) 14 3.2.3 Decreased Soil Erosion (Eb) 15 3.2.4 Reduced Fertilizer Use (Fb) 16 3.2.5 Reduced Herbicide Use (Hb) 16 3.2.6 Conversion Factor (Cuse) 16 3.2.7 Summary of Emission Reductions 17
3.3 Compost Emission Reduction Factor 17 3.4 Variability Analysis 17 4. SUMMARY 19 5. NOTES AND REFERENCES 20

3
Method for Estimating Greenhouse Gas Emission Reductions from Compost from Commercial Organic Waste
EXECUTIVE SUMMARY This document explains a life-cycle method to quantify the California-specific greenhouse gas emission reductions from using compost and the greenhouse gas emissions associated with compost management. Compost application to agricultural fields increases soil health while providing multiple co-benefits. Compost application reduces the amount of synthetic fertilizer needed, reduces the amount of water used, decreases soil erosion, increases soil carbon storage and reduces the use of herbicides. Composting material also causes greenhouse gas emissions during the collection of the initial feedstock and delivery of the compost, the use of energy and water to manage the compost pile, and as microorganisms convert the initial feedstock to compost. The following equation is used to calculate the compost emission reduction factor (CERF): CERF = (CSb + ((Wb + Eb + Fb+ Hb) * Cuse)) – Etotal where, CERF = Compost emission reduction factor (MTCO2E/ton of feedstock) CSb = Emission reductions associated with the increased carbon storage
in soil (MTCO2E/ton of feedstock) Wb = Emission reductions due to decreased water use (MTCO2E/ton of compost) Eb = Emission reduction associated with decreased soil erosion
(MTCO2E/ton of compost) Fb = Factor to account for the reduced fertilizer use (MTCO2E/ton of compost) Hb = Factor to account for the reduced herbicide use
(MTCO2E/ton of compost) Cuse = Conversion factor used to convert from tons of compost to tons of feedstock Etotal = Emissions due to the composting process (MTCO2E/ton of feedstock) The above equation uses an approach similar to one established by the United Environmental Protection Agency (USEPA). This method modified USEPA’s approach by quantifying the greenhouse gas composting benefits due to decreased fertilizer use, decreased water use, decreased soil erosion, and decreased herbicide use and by applying California-specific data where feasible. The CERF generated for this method is 0.42 MTCO2E/ton of feedstock (wet weight) and applies to food scraps, yard trimmings, grass, leaves, branches, and organic municipal solid waste (MSW).

4
1. BACKGROUND In the past 17 years, the amount of organic waste composted in the United States has increased over 400 percent from about 4 to 20 million tons.1 Composting is a decomposition process that converts an initial feedstock of organic waste (i.e. food scraps, yard trimmings, branches, leaves, grass, and organic municipal solid waste) into an organic-rich soil mixture called compost. Compost application to soil systems has many benefits, which include, but are not limited to, increased soil carbon concentrations, decreased density, increased porosity, increased resistance to erosion and pests, and decreasing the use of synthetic fertilizers.2-7 In recent years, efforts have begun to quantify the above compost benefits in terms of greenhouse gas reductions.8-12 The quantification of greenhouse gas (GHG) emission reductions from compost application requires a life-cycle approach. A life-cycle approach accounts for emissions or emission reductions at the manufacturing, use or end-of-life stages for a single product.13 Composting is unique because using its end-product reduces energy requirements in other products’ life cycle stages. For example, applying compost can reduce the amount of water needed to irrigate a crop and thus the energy required to move the water to a particular field. It can also decrease the amount of industrially produced fertilizer. In the proposed method, the greenhouse gas (GHG) emission reductions are quantified with respect to the addition of compost as an amendment to an agricultural soil system. Additionally, emissions associated with the composting process, such as transportation, machinery use, and water use will be quantified. This life-cycle method is consistent with other recent compost analyses in the literature. The United States Environmental Protection Agency (USEPA) Waste Reduction Model (WARM) quantifies the compost GHG benefit by accounting for the net emissions from the composting process and summing them with the benefit of soil carbon storage.14 Studies by Martinez-Blanco et al (2009) and Blengini (2008) assess similar parameters as the WARM model, but also include fertilizer benefits.15-16 However, these studies do not attempt to quantify the GHG benefits associated with a decline in water use, soil erosion and pesticide use, which may lead to a more conservative view of the benefits of compost. This method evaluates the emission reduction benefits and emissions associated with the composting process and the agricultural use of its end-products. The emissions considered will be transportation (feedstock collection and delivery of finished product), process emissions (feedstock manipulation during the production of compost, including water use), and fugitive emissions (CH4 and N2O emissions from the composting material). The greenhouse gas emission benefits will include increased soil carbon storage, reduced soil erosion, reduced water use, and a decrease in fertilizer and herbicide use. Whenever feasible, studies from California composting operations and compost application will be used. The quantification of each of these variables will lead to a compost emission reduction factor (CERF) that will be applicable to food scraps, yard trimmings, grass, leaves, branches, and organic municipal solid waste (MSW).
5
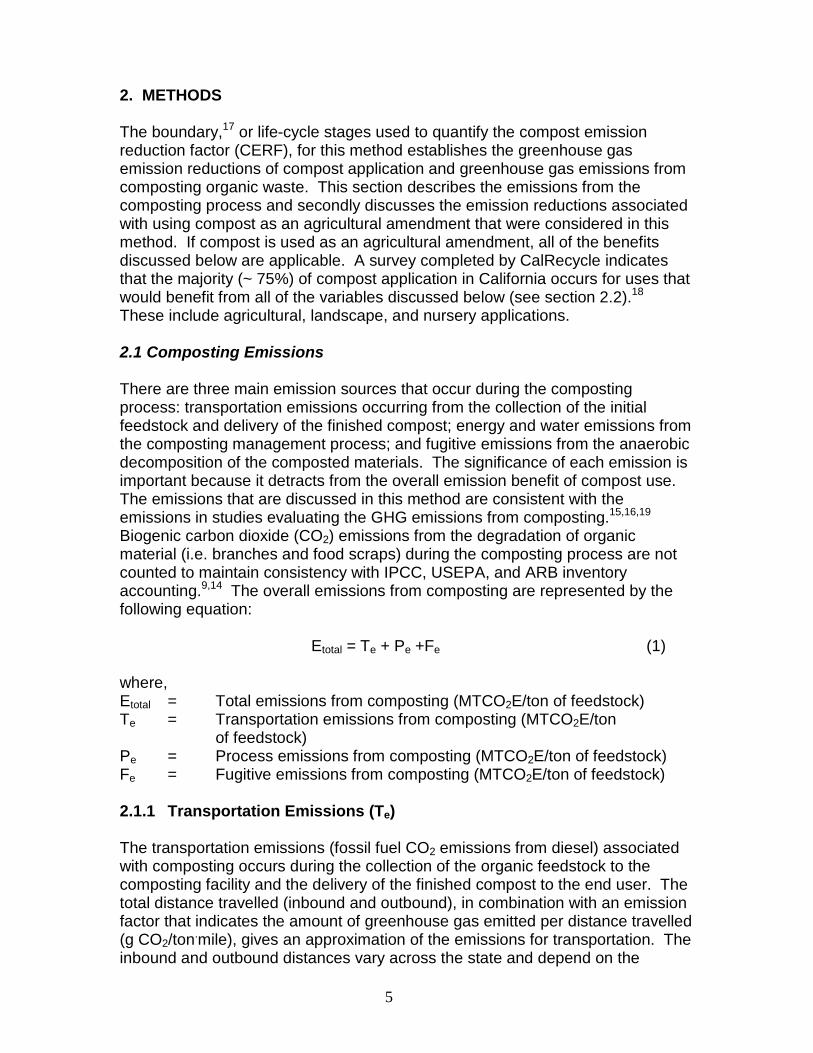
2. METHODS The boundary,17 or life-cycle stages used to quantify the compost emission reduction factor (CERF), for this method establishes the greenhouse gas emission reductions of compost application and greenhouse gas emissions from composting organic waste. This section describes the emissions from the composting process and secondly discusses the emission reductions associated with using compost as an agricultural amendment that were considered in this method. If compost is used as an agricultural amendment, all of the benefits discussed below are applicable. A survey completed by CalRecycle indicates that the majority (~ 75%) of compost application in California occurs for uses that would benefit from all of the variables discussed below (see section 2.2).18 These include agricultural, landscape, and nursery applications. 2.1 Composting Emissions There are three main emission sources that occur during the composting process: transportation emissions occurring from the collection of the initial feedstock and delivery of the finished compost; energy and water emissions from the composting management process; and fugitive emissions from the anaerobic decomposition of the composted materials. The significance of each emission is important because it detracts from the overall emission benefit of compost use. The emissions that are discussed in this method are consistent with the emissions in studies evaluating the GHG emissions from composting.15,16,19 Biogenic carbon dioxide (CO2) emissions from the degradation of organic material (i.e. branches and food scraps) during the composting process are not counted to maintain consistency with IPCC, USEPA, and ARB inventory accounting.9,14 The overall emissions from composting are represented by the following equation: Etotal = Te + Pe +Fe (1) where, Etotal = Total emissions from composting (MTCO2E/ton of feedstock) Te = Transportation emissions from composting (MTCO2E/ton of feedstock) Pe = Process emissions from composting (MTCO2E/ton of feedstock) Fe = Fugitive emissions from composting (MTCO2E/ton of feedstock) 2.1.1 Transportation Emissions (Te) The transportation emissions (fossil fuel CO2 emissions from diesel) associated with composting occurs during the collection of the organic feedstock to the composting facility and the delivery of the finished compost to the end user. The total distance travelled (inbound and outbound), in combination with an emission factor that indicates the amount of greenhouse gas emitted per distance travelled (g CO2/ton.mile), gives an approximation of the emissions for transportation. The inbound and outbound distances vary across the state and depend on the

6
collection method and customer proximity to the composting facility. Discussions with CalRecycle staff led to the identification of six geographically representative compost facilities across the state.20 Average transportations distances were obtained from a survey of Northern, Central and Southern California composters. The emission factor used was generated from Appendix G of the ARB’s Statewide Truck and Bus Regulation (101 g CO2/ton.mile).21 2.1.2 Process Emissions (Pe) Process emissions from the composting process were from the energy required to grind material (electricity), turn and manage the compost pile (diesel) and the emissions associated with water use on the compost pile. California-specific data sources for this parameter were obtained from a personal communication with CalRecycle staff.20 2.1.3 Fugitive Emissions (Fe) Fugitive emissions arise from methane (CH4) and nitrous oxide (N2O) releases during the composting process. Methane is produced in anaerobic pockets of a compost pile, while nitrous oxide is a product of nitrification or denitrification.22 Even though the overall emissions of these two GHGs is low relative to carbon dioxide, their emissions are significant because their global warming potential (GWP) is 21 and 310 times greater than CO2 for CH4 and N2O, respectively.23 Numerous research articles discuss the release of CH4 and N2O emissions from composting. The list of studies include both manure24-26 and organic waste27-29 composting piles. However, manure is not normally contained in a commercial organic waste stream, so data from these studies were not used for this analysis. The values from the remaining papers that discussed CH4 (n=7) and N2O (n=4) emissions were averaged together. 2.2 Compost Emission Reductions The greenhouse gas emission reduction benefits come from the agronomic use of compost and are calculated based on the finished compost product. The final reduction benefit is reported by converting the compost application benefit to units of initial organic feedstock. The addition of compost to soils produces many benefits that contribute to soil and plant health. While this analysis evaluates five benefits from a GHG perspective,3 more benefits may occur from composting (such as increased crop yield), but existing data does not allow for their GHG quantification. The composting application benefits described in this method are listed in the equation below: Btotal = CSb + ((Wb + Eb + Fb+ Hb) * Cuse) (2) where Btotal = Total emission reduction benefit due to compost use (MTCO2E/ton of feedstock) CSb = Emission reductions associated with the increased carbon storage

7
in soil (MTCO2E/ton of feedstock) Wb = Emission reductions due to decreased water use (MTCO2E/ton of compost) Eb = Emission reduction associated with decreased soil erosion
(MTCO2E/ton of compost) Fb = Factor to account for the reduced fertilizer use (MTCO2E/ton of compost) Hb = Factor to account for the reduced herbicide use
(MTCO2E/ton of compost) Cuse = Conversion factor used to convert from tons of compost to tons of feedstock. 2.2.1 Increased Soil Carbon Storage (CSb) Compost increases the soil carbon content when it is applied to a soil with low concentrations of organic matter.9,10,14 Over time, the reactive carbon content of the applied compost decreases due to plant and bacteria metabolism. The unreactive portion of carbon compounds, known as humic substances, remain in soil systems for long periods of time.14 The carbon that remains in the soil system is considered stored because it is not degrading and releasing CO2 into the atmosphere. Few studies have been completed that evaluate the impact of compost on soil carbon storage.6,30,31 For this reason, a study from USEPA that evaluated soil carbon storage due to compost application was used to quantify the emission benefit in this method.14 The USEPA study evaluated the soil carbon storage benefit from year 1 through year 30.14 2.2.2 Decreased Water Use (Wb) Compost application decreases the density of soil due to an increase in soil porosity.32-34 Increases in porosity and surface area creates more binding spots for water, leading to higher water retention rates when compared to an unamended soil.33,34 The physical characteristics that allow for the increased water retention are directly due to the carbon content of the compost.4 A decay pattern similar to carbon loss in compost was therefore used for modeling the water use benefits.14 A study conducted by the University of California – Riverside addresses the water retention benefits from compost application.35 The data collected from this paper was converted into gallons saved/ton of compost and averaged. The average value was inputted into year 1 of the compost decay graph and plotted out to 30 years after compost application for consistency with carbon storage. The sum of water benefits was considered for this emission factor because every year a water benefit would be realized. The compost application benefit in this case is the reduced energy needed to transport water to the compost-amended soil. The emission factor for water use was 1.5 MTCO2E per acre-foot (AF).36 This value is based on a statewide embedded energy in water value of 3.2 MWh/AF.37

8
2.2.3 Decreased Soil Erosion (Eb) When mixed into soil, compost has the ability to decrease erosion and is widely used as an erosion control device at construction sites, along highways and in agricultural applications.4,32,38 Compost decreases erosion because of its ability to absorb and retain water in its pore holes. This method evaluated the erosion control benefits from agricultural applications. This benefit was quantified by accounting for the emissions associated with replacing eroded soil with compost. Erosion control is also related to carbon content, density and water retention so a decay pattern similar to carbon loss in compost was used for erosion control. A study completed by the University of California-Riverside was used to evaluate the soil erosion.35 This study evaluated two sites: a site damaged by a fire and a construction site. The construction site used seeded compost, but the researchers noted that there was no seed growth during the sampling events so the seeded compost mimicked unseeded compost.35 An average erosion between the construction site and fire affected site was used in the calculation. The difference in soil retention between the control and compost-amended site was considered the soil benefit. The experimental plot values were extrapolated to represent a hectare of application and converted to a unit representative of soil saved per ton of compost. The emission factor for replacing one ton of eroded soil was 0.114 MTCO2E/ton of feedstock (Section 3.1). The emission factor represents the emissions associated with producing compost to replace the soil lost to erosion. 2.2.4 Reduced Fertilizer Use (Fb) The nitrogen content of compost, along with phosphorous and potassium contributions, provide an opportunity to reduce the amount of fertilizer applied to agricultural systems.39-42 Other studies have shown that the use of compost does not entirely alleviate the need to apply fertilizers to agricultural soils.43 The greenhouse gas benefit for this variable was quantified as the avoided synthetic nitrogen, potassium, and phosphorous production from compost use. The nitrogen, potassium and phosphorous contents of fertilizer degrade more rapidly than carbon.10 A study by Favoino and Hogg (2008) indicated that nitrogen from compost is used over a 10-year time period.10 The study also assumed that nitrogen was “conserved” in the soil over time so the available nitrogen over a 10-year time period was actually greater than the initial nitrogen content.10 Instead of assuming a 30% decay rate as Favoino and Hogg (2008),10 this method used a value to 38% over a period of 10 years to ensure the nitrogen availability did not include the “conserved” nitrogen content. It was assumed that the decay of potassium and phosphorous were similar to nitrogen. Data was obtained from an independent compost lab that tested nutrient and trace metal concentrations from compost in California.44 The 10-year decay curve was applied to this data set. The emission factor used for each type fertilizer (N, P, or K) was based on the avoided life cycle emissions from fertilizer

9
production that would have occurred in the absence of compost use. The emission factors for N, P, and K are 8.9, 1.8 and 0.96 kg CO2E/kg, respectively.9,45 2.2.5 Reduced Herbicide Use (Hb) Herbicide use in agricultural fields prevents weeds from growing in unwanted areas. Studies indicate that compost replaces the use of herbicide by forming a crust over the top of the soil, making it difficult for weeds to penetrate the surface.46 These benefits are limited and may last only one year, but allow for the reduced use or alleviation of herbicide use.47 Reduced herbicide use was determined from a study from Roe et al (1993).46 The herbicide benefit quantified by this study was multiplied by an emission factor for a pesticide (A life-cycle analysis was not available for a herbicide, so a pesticide was used as a proxy).48 Other studies were found that dealt with reduced herbicide use and composting, but were not applicable because the data was not sufficiently quantitative.49,50 2.2.6 Conversion Factor (Cuse) The composting benefits were quantified in terms of MTCO2E reduced per ton of applied compost. The conversion factor was used to convert from compost applied to original feedstock composted. This conversion factor is based on numerous studies that report the initial amount of feedstock composted and final amount of composted material.9,16,28 2.3 Compost Emission Reduction Factor (CERF) The compost emission reduction factor (CERF) is the sum of compost process emissions (Etotal) and compost application emission benefits (Btotal): CERF = Btotal - Etotal (3) where, CERF = Compost emission reduction factor (MTCO2E/ton of feedstock) Etotal = Total emissions from the composting process (MTCO2E/ton of feedstock) Btotal = Total emission benefits due to the application of compost (MTCO2E/ton of feedstock) 3. RESULTS AND DISCUSSION This section presents the emissions from the composting process and the emission reduction benefits from applying compost to a non-amended soil. Included in this section will be an analysis of the sensitivity of these values in the context of determining an accurate CERF for use in California.

10
3.1 Composting Emissions Composting emissions are calculated in three different categories: emissions from transportation (inbound (collection) and outbound (delivery)), process emissions (turning, etc.) and fugitives (pile management). The calculated values are reported below. 3.1.1 Transportation Emissions (Te) Transportation emissions occur when the compost is collected (inbound) and when the finished product is distributed (outbound). Table 1 shows the location of composting facility and inbound and outbound transportation averages obtained from six representative compost distributors across the California.20 Table 1. Feedstock collection (inbound) and compost delivery (outbound) transportation distances. Location Inbound (miles) Outbound (miles) Oxnard 5 15 Rancho Cucamonga 30 30 San Jose 37 26 Northern California (various locations)
50 50
San Diego 108 N/A Southern San Joaquin 55 20
Average 47.5 28.2 Sum 75.7
Emissions 0.008 MTCO2/ton The sum of the inbound and outbound travel miles was multiplied by an emission factor of 101 g CO2/ton-mile.21 The resulting average transportation emissions for the collection of feedstock and delivery of compost to the end user are 0.008 MTCO2E/ton of feedstock. Two European studies reported inbound distances of nine15 and sixteen16 miles. These values are slightly lower than the values used in this method and represent a 0.003 MTCO2E/ton of feedstock deviation (on the lower side). 3.1.2 Process Emissions (Pe) Composting is completed under varying conditions with specific physical parameters. Data from a Central Valley compost facility indicates that there is about 0.29 gallons of diesel and 250 gallons of water used per ton of initial feedstock for an outdoor windrow (Table 2).20 The data reported in Table 2 represents the overall fuel and water use per ton of feedstock (activity column of Table 2). Each activity was multiplied by the corresponding emission factor. The water use emission factor is due to the embedded energy required to

11
transport water in the California.36 The overall emission contributions were summed and averaged to obtain the final emission value (Table 2, last column). Table 2. Process emissions from compost production. Facility Activity Emission Factor Emissions
(MTCO2E/ton of feedstock)a
Outdoor windrow #1 0.29 gal diesel/ton 10.2 kg CO2E/galb 0.003 0.0008 AF/ton 1.5 MTCO2E/AFc,d 0.001
Outdoor windrow #2 0.24 gal diesel/ton 10.2 kg CO2E/galb 0.002 Outdoor windrow #3 0.56 gal diesel/ton 10.2 kg CO2E/galb 0.006 7.2 kWh/ton 0.419
kgCO2E/kWhe 0.003
0.0006 AF/ton 1.5 MTCO2E/AFc,d 0.001 Average 0.008 a In order to obtain the total value, an average for each process emission type was taken, when applicable. For example, the average diesel fuel use was taken between outdoor windrow samples 1-3 while, the electricity value from outdoor windrow 3 was only used. bReference 51 c Reference 36; d AF=acre-foot. e Reference 51. Uses the 2007 California grid average electricity emission factor. The values used for the process emissions in this method were compared to multiple studies completed in Europe.9,15,16 These studies indicate that direct diesel emissions from shredders, front loaders, and turning equipment is generally in the range of 0.03 -1.4 gallon/ton of feedstock.9 This range is consistent with the above diesel emissions shown in Table 2. The water emissions during the composting process ranged from 0.0002-0.00007 AF/ton of feedstock.15,16 These values are low when compared to this method, but it should be noted that both of these studies evaluated indoor composting processes.15,16 3.1.3 Fugitive Emissions (Fe) Fugitive CH4 and N2O emissions were compiled from various studies and averaged together for this method.15,19,22,27-29,52 The majority of the studies were taken from a study completed by the Intergovernmental Panel on Climate Change (IPCC), but additional studies were added to take into account more recent data from green waste composting studies from Mediterranean climates (which are similar to California weather conditions).15,29,53 Table 3 shows each study used generate the average for methane and nitrous oxide emissions from a compost pile.

12
Table 3. Fugitive CH4 and N2O emissions from composting. CH4
Reference Feedstock Emission factor (gCH4/kg)
Beck-Friis et al (2003)a Household organics 3.6 Beck-Friis et al (2000)b Household organic
mixed with coarsely chipped branches and bushes
11.9
Hellmann et al (1997)c Organic MSW with bush, leaves and grass clippings
0.172
Hellebrand (1998)d Green waste and grass
5.1
Martinez-Blanco et al (2009)e
Organic MSW and pruning waste
0.38
Amlinger et al (2008)f Green waste, sewage sludge and biowaste
0.21
Manios et al (2007)g Mixture of olive branches, leaves, and mill sludge
7
Average 4.1 0.078
MTCO2E/ton
N2O (gN2O/kg) Beck-Friis et al (2000)b Household organic
mixed with coarsely chipped branches and bushes
0.1
Hellmann et al (1997)c Organic MSW with bush, leaves and grass clippings
0.022
Hellebrand (1998)d Green waste and grass
0.1
Amlinger et al (2008)f Green waste, sewage sludge and biowaste
0.13
Average 0.09 0.025
MTCO2E/ton a Reference 52; b Reference 22; c Reference 28; d Reference 27; e Reference 15; f Reference 19; g Reference 29 The values used in this method for fugitive methane and nitrous oxide emissions are consistent with other literature values. For example, the IPCC reports that
13
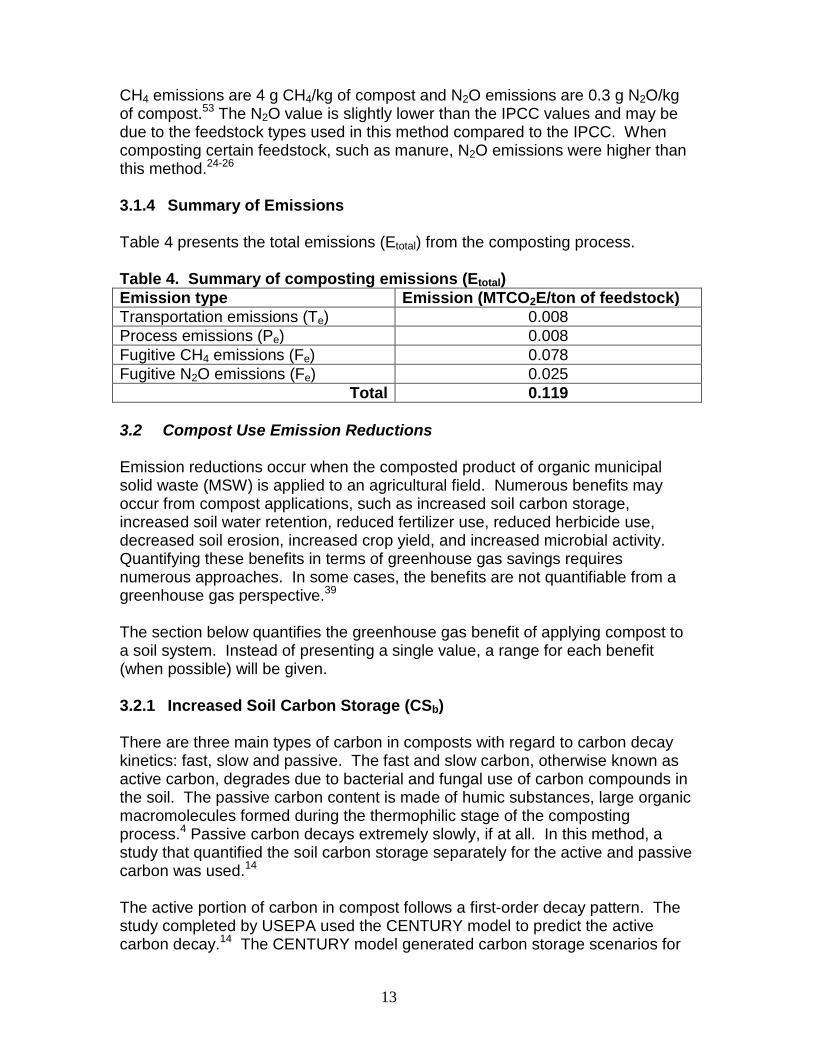
CH4 emissions are 4 g CH4/kg of compost and N2O emissions are 0.3 g N2O/kg of compost.53 The N2O value is slightly lower than the IPCC values and may be due to the feedstock types used in this method compared to the IPCC. When composting certain feedstock, such as manure, N2O emissions were higher than this method.24-26 3.1.4 Summary of Emissions Table 4 presents the total emissions (Etotal) from the composting process. Table 4. Summary of composting emissions (Etotal) Emission type Emission (MTCO2E/ton of feedstock) Transportation emissions (Te) 0.008 Process emissions (Pe) 0.008 Fugitive CH4 emissions (Fe) 0.078 Fugitive N2O emissions (Fe) 0.025
Total 0.119 3.2 Compost Use Emission Reductions Emission reductions occur when the composted product of organic municipal solid waste (MSW) is applied to an agricultural field. Numerous benefits may occur from compost applications, such as increased soil carbon storage, increased soil water retention, reduced fertilizer use, reduced herbicide use, decreased soil erosion, increased crop yield, and increased microbial activity. Quantifying these benefits in terms of greenhouse gas savings requires numerous approaches. In some cases, the benefits are not quantifiable from a greenhouse gas perspective.39 The section below quantifies the greenhouse gas benefit of applying compost to a soil system. Instead of presenting a single value, a range for each benefit (when possible) will be given. 3.2.1 Increased Soil Carbon Storage (CSb) There are three main types of carbon in composts with regard to carbon decay kinetics: fast, slow and passive. The fast and slow carbon, otherwise known as active carbon, degrades due to bacterial and fungal use of carbon compounds in the soil. The passive carbon content is made of humic substances, large organic macromolecules formed during the thermophilic stage of the composting process.4 Passive carbon decays extremely slowly, if at all. In this method, a study that quantified the soil carbon storage separately for the active and passive carbon was used.14 The active portion of carbon in compost follows a first-order decay pattern. The study completed by USEPA used the CENTURY model to predict the active carbon decay.14 The CENTURY model generated carbon storage scenarios for

14
various applications of compost to an unamended soil. The carbon content was forecasted to 30 years beyond the compost application to evaluate the decay pattern of carbon in compost. The results indicated that the carbon storage of the active carbon phase due to compost application was 0.073 MTCO2E/ton of feedstock.14 The passive carbon phase was completed out to a 30-year time series. The upper and lower bounds of carbon storage were determined by evaluating the amount of carbon that decayed slowly or was passive. The carbon storage value obtained for the passive carbon phase was 0.183 MTCO2E/ton of feedstock. Combined together the overall carbon storage value was 0.256 MTCO2E/ton of feedstock.14 The fast carbon decay from the active soil phase was summed with relatively constant passive carbon phase to generate a 30-year decay graph for compost (see Figure 1). This curve was utilized for the water retention (Wb) and soil erosion (Eb) benefits described below. A study completed by ICF International (2005) used the same numbers as described above to determine the soil carbon storage component of a composting emissions reduction factor for Canada.54 Other studies have shown that the soil carbon storage is slightly lower. A study by Boldrin et al (2009)9 estimates soil carbon storage in a range of 0.002-0.072 MTCO2E/ton, while Blengini (2008) uses a range of 0.133-0.213 MTCO2E/ton.16 Other studies have qualitatively evaluated the soil carbon storage rates and concluded that it is occurring, even though quantification did not occur.8,12 3.2.2 Decreased Water Use (Wb) Water benefits from applying compost to a soil system are due to the increased porosity and permeability of the soil. The California-specific study by Crohn (2010) indicates that compost applied to increase water retention on a fire affected site is 185 gallons/ton of compost and 678 gallons/ton of compost for the construction site for a one year time period.35 The 30-year decay curve is presented in Figure 1. Studies have indicated that humic substances are a major contributor to increased surface water absorption, which allows the soil carbon decay curve to have applicability towards water retention.4 Over 30 years, this equates to a benefit of 3550 and 13000 gallons/ton of compost for the fire affected and construction sites, respectively.35 Converting gallons per ton of compost to acre feet (AF) and multiplying by the water use emission factor (1.5 MTCO2E/AF) leads to a range of 0.015-0.065 MTCO2E/ton of compost and an average of 0.04 MTCO2E/ton of compost. A series of other studies report a range of 118-810 gallons/ton of compost,32-34 which is consistent with the numbers reported for this method. In addition to the above studies, it is important to note that other manuscripts report an increase in water retention and available water to plants due to compost application.55-57 However, these studies did not report the variables necessary for inclusion into the above calculations.

15
0.0006
0.0008
0.001
0.0012
0.0014
0.0016
0.0018
0.002
0 5 10 15 20 25 30
time (years)
emis
sion
ben
efit
(arb
itrar
y un
its)
Figure 1. Decay curve used for the water retention (Wb) and decreased erosion benefits (Eb) of composting. 3.2.3 Decreased Soil Erosion (Eb) Decreased erosion from addition of compost to soils is directly related to carbon content and water retention rates.31 The curve in Figure 1 was used to determine the erosion capacity of compost. For initial inputs to the decay curve, the California-specific study by Crohn (2010) was used.35 Compost applied to the fire affected site and construction site reduced soil erosion by 91 and 328 lbs/ton of compost on a 1-year timescale, respectively. This corresponds to a 30-year soil retention benefit of 1750 and 6300 lbs of soil/ton of compost for the fire affected and construction sites. The emission factor used for this production was generated from the emissions associated with the composting process (Table 4). The emission factor is 0.119 MTCO2E/ton of soil, which equates to an average savings of 0.25 MTCO2E/ton of compost and a range of 0.1-0.39 MTCO2E/ton of compost (after being multiplied by the pounds of soil saved) over a 30-year time period. The values used in this method are slightly higher than two other studies.32,38 The values in the existing studies range from 33-64 lbs/ton of compost on the 1-year timescale.32,38 However, these studies simulated single rain events, while the study by Crohn (2010), looked at multiple rain events over a longer time period.
16
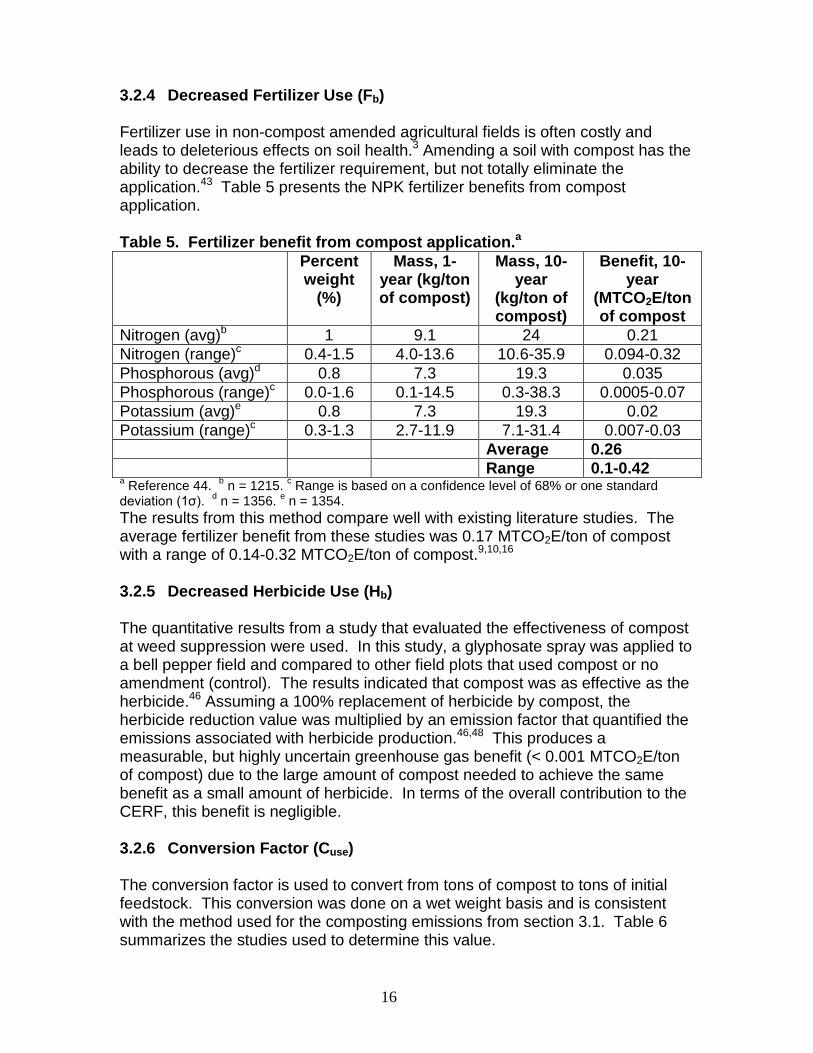
3.2.4 Decreased Fertilizer Use (Fb) Fertilizer use in non-compost amended agricultural fields is often costly and leads to deleterious effects on soil health.3 Amending a soil with compost has the ability to decrease the fertilizer requirement, but not totally eliminate the application.43 Table 5 presents the NPK fertilizer benefits from compost application. Table 5. Fertilizer benefit from compost application.a Percent
weight (%)
Mass, 1-year (kg/ton of compost)
Mass, 10-year
(kg/ton of compost)
Benefit, 10-year
(MTCO2E/ton of compost
Nitrogen (avg)b 1 9.1 24 0.21 Nitrogen (range)c 0.4-1.5 4.0-13.6 10.6-35.9 0.094-0.32 Phosphorous (avg)d 0.8 7.3 19.3 0.035 Phosphorous (range)c 0.0-1.6 0.1-14.5 0.3-38.3 0.0005-0.07 Potassium (avg)e 0.8 7.3 19.3 0.02 Potassium (range)c 0.3-1.3 2.7-11.9 7.1-31.4 0.007-0.03 Average 0.26 Range 0.1-0.42 a Reference 44. b n = 1215. c Range is based on a confidence level of 68% or one standard deviation (1σ). d n = 1356. e n = 1354. The results from this method compare well with existing literature studies. The average fertilizer benefit from these studies was 0.17 MTCO2E/ton of compost with a range of 0.14-0.32 MTCO2E/ton of compost.9,10,16 3.2.5 Decreased Herbicide Use (Hb) The quantitative results from a study that evaluated the effectiveness of compost at weed suppression were used. In this study, a glyphosate spray was applied to a bell pepper field and compared to other field plots that used compost or no amendment (control). The results indicated that compost was as effective as the herbicide.46 Assuming a 100% replacement of herbicide by compost, the herbicide reduction value was multiplied by an emission factor that quantified the emissions associated with herbicide production.46,48 This produces a measurable, but highly uncertain greenhouse gas benefit (< 0.001 MTCO2E/ton of compost) due to the large amount of compost needed to achieve the same benefit as a small amount of herbicide. In terms of the overall contribution to the CERF, this benefit is negligible. 3.2.6 Conversion Factor (Cuse) The conversion factor is used to convert from tons of compost to tons of initial feedstock. This conversion was done on a wet weight basis and is consistent with the method used for the composting emissions from section 3.1. Table 6 summarizes the studies used to determine this value.

17
Table 6. Conversion factor inputs. Reference Feedstock Initial mass
(kg) Final mass
(kg) Conversion
factor Hellmann et al (1997)a
Organic MSW, yard waste
31,520 20,890 0.66
Blengini et al (2008)b
Organic MSW 16,000,000 4,500,000 0.28
Boldrin et al (2009)c
Food waste, green waste
1,000 550 0.55
Average 0.50 Range 0.28-0.66 a Reference 28; b Reference 16; c Reference 9. 3.2.7 Summary of Emission Reductions Table 7 presents the overall emission benefits from using compost. Table 7. Summary of composting benefits (Btotal). Emission reduction type Emission
reduction (MTCO2E/ton of compost)
Conversion factor
Final Emisson reduction
(MTCO2E/ton of feedstock)
Increased Soil Carbon Storage
N/A N/A 0.26
Decreased Water Use 0.04 0.5 0.02 Decreased Soil Erosion 0.25 0.5 0.13 Decreased Fertilizer Use 0.26 0.5 0.13 Decreased Herbicide Use 0.0 0.5 0.0 Total 0.54 3.3 Compost Emission Reduction Factor The CERF is determined by subtracting the composting emissions (0.119 MTCO2E/ton of feedstock) from the composting emission reductions (0.54 MTCO2E/ton of feedstock). This leads to a CERF of 0.42 MTCO2E/ton of feedstock. 3.4 Variability Analysis The studies used to calculate each variable that contributed to the CERF were spread over a wide range of values. For instance, the fugitive CH4 emissions ranged from 0.172 to 11.9 gCH4/kg (Table 3) and the fertilizer benefits ranged from 0.08-0.30 MTCO2E/ton of compost (Table 5). This wide range illustrates the uncertainty associated with each of these factors due to variability in the compost processing and in the physical properties of the soil to which the compost is

18
added. In order to assess the possible range of CERF values, the following equation was used: CERFrange = CERFL to CERFH (4) CERFL = ((Σ BtotL) x CuseL) - EtotH (5) CERFH = ((Σ BtotH) x CuseH) – EtotL (6) where, CERFrange = Possible range of the CERF based on evaluation of the lowest and highest compost emissions and benefits (MTCO2E/ton of feedstock) CERFL = Lowest possible CERF (MTCO2E/ton of feedstock) CERFH = Highest possible CERF (MTCO2E/ton of feedstock) BtotL = Sum of compost benefits based on the lowest values from this method (MTCO2E/ton of compost) = 0.22 MTCO2E/ton of compost CuseL = 0.28 ton of feedstock/ton of compost EtotH = Sum of compost emissions based on the highest values from this method (MTCO2E/ton of feedstock) = 0.28 MTCO2E/ton of feedstock BtotH = Sum of compost benefits based on the highest values from this method (MTCO2E/ton of compost) = 1.39 MTCO2E/ton of compost CuseH = 0.66 ton of feedstock/ton of compost EtotL = Sum of compost emissions based on the lowest values from this method (MTCO2E/ton of feedstock) = 0.017 MTCO2E/ton of feedstock Applying the values for each variable, the CERFrange is -0.22 to 0.90 MTCO2E/ton of feedstock. In order to use the correct units for the soil carbon storage variable, the 0.26 MTCO2E/ton of feedstock value reported in Section 3.2.1 was multiplied by two to account for the feedstock to compost conversion for BtotH and the 0.002 MTCO2E/ton of feedstock (from Reference 16) was multiplied by two for BtotL. The average between CERFL and CERFH is 0.34 MTCO2E/ton of feedstock. This value is slightly lower than the CERF (0.42 MTCO2E/ton of feedstock). The CERF obtained from this method has uncertainties due to the lack of general scientific understanding of some physical processes of compost application, absence of literature articles, and reliance on non-California specific study locations. The application of compost to a non-amended soil provides soil benefits (benefits were discussed in this method). Uncertainties occur when researchers attempt to link a specific compost benefit to a modification of soil properties. For example, soil type plays a large role in the magnitude of a compost benefit. It is unclear what factors (type, size, pH, etc) of the mineral composition of the parent soil impact the compost benefit.

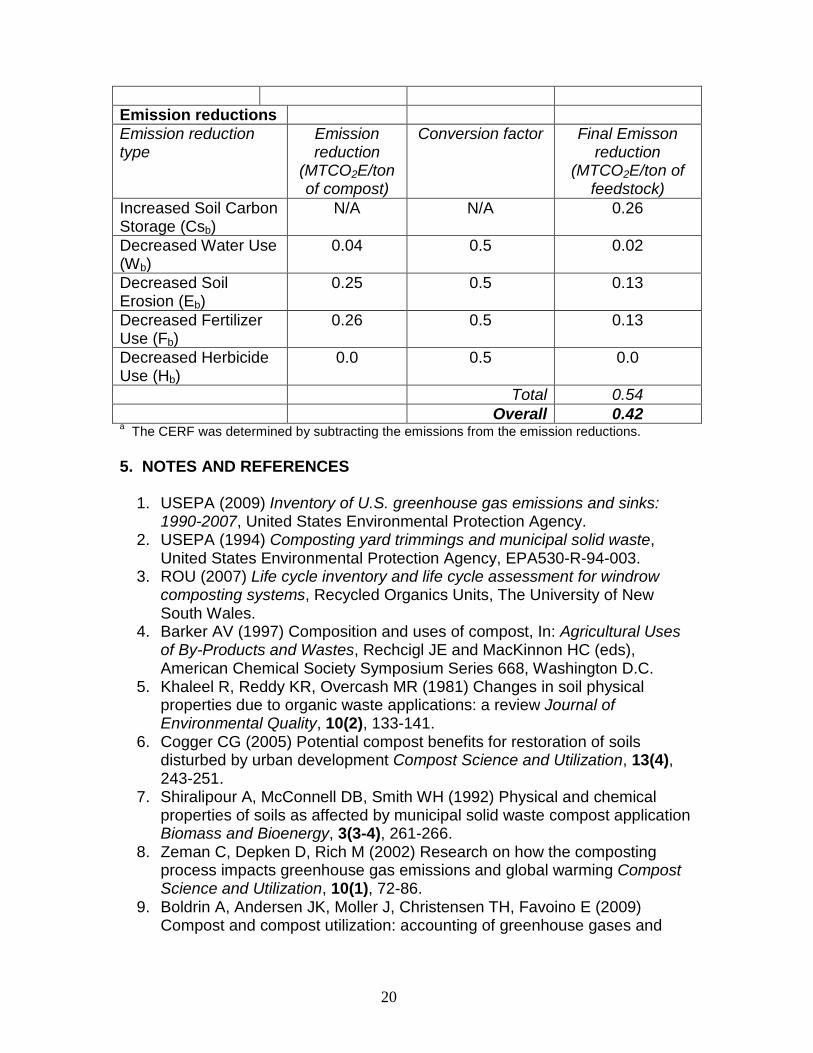
19
Current compost literature focuses mainly on the fugitive emissions15,19,20,27-29 that occur during the composting process. Few studies evaluate the process emissions or the benefits from the end uses of compost. The most prevalent composting benefits discussed in the literature was increased soil carbon storage9,14,16 and decreased fertilizer use9,10,16,44. Additionally, the erosion and water use results were extrapolated from laboratory-scale experiments as opposed to macroscale field methods. Extrapolating the data may skew the results, depending on the physical properties of the compost. The herbicide results are based on only one study.46 It was difficult to obtain reliable results from a single experiment, plus life-cycle information on herbicides was difficult to obtain and a pesticide life-cycle was used as a proxy.48 This method was able find some California-specific compost studies to use for quantification (process emissions, transportation emissions, reduced water use, reduced soil erosion, and reduced fertilizer use). The other studies came from the United States (soil carbon storage and reduced herbicide use) or well-reputed international sources (fugitive emissions were modified from IPCC data). As additional research is completed, the uncertainties will diminish. In the interim, it is important to understand the shortcomings of this quantification method and apply them in a judicious manner. 4. SUMMARY This method presents a compost emission reduction factor (CERF) for composting in California. This method accounts for the emissions (transportation, process, and fugitive) from the composting process and the benefits of applying (increased carbon storage, reduced water use, reduced soil erosion, decreased fertilizer use, and decreased herbicide use) compost as a soil amendment. A summary of the emissions and emission reductions are shown in Table 8. Table 8. Summary of compost emission reduction factory (CERF).a Emissions Emission type Emission
(MTCO2E/ton of feedstock)
Transportation emissions (Te)
0.008
Process emissions (Pe)
0.008
Fugitive CH4 emissions (Fe)
0.078
Fugitive N2O emissions (Fe)
0.025
Total 0.119
20
Emission reductions Emission reduction type
Emission reduction
(MTCO2E/ton of compost)
Conversion factor Final Emisson reduction
(MTCO2E/ton of feedstock)
Increased Soil Carbon Storage (Csb)
N/A N/A 0.26
Decreased Water Use (Wb)
0.04 0.5 0.02
Decreased Soil Erosion (Eb)
0.25 0.5 0.13
Decreased Fertilizer Use (Fb)
0.26 0.5 0.13
Decreased Herbicide Use (Hb)
0.0 0.5 0.0
Total 0.54 Overall 0.42 a The CERF was determined by subtracting the emissions from the emission reductions. 5. NOTES AND REFERENCES
1. USEPA (2009) Inventory of U.S. greenhouse gas emissions and sinks: 1990-2007, United States Environmental Protection Agency.
2. USEPA (1994) Composting yard trimmings and municipal solid waste, United States Environmental Protection Agency, EPA530-R-94-003.
3. ROU (2007) Life cycle inventory and life cycle assessment for windrow composting systems, Recycled Organics Units, The University of New South Wales.
4. Barker AV (1997) Composition and uses of compost, In: Agricultural Uses of By-Products and Wastes, Rechcigl JE and MacKinnon HC (eds), American Chemical Society Symposium Series 668, Washington D.C.
5. Khaleel R, Reddy KR, Overcash MR (1981) Changes in soil physical properties due to organic waste applications: a review Journal of Environmental Quality, 10(2), 133-141.
6. Cogger CG (2005) Potential compost benefits for restoration of soils disturbed by urban development Compost Science and Utilization, 13(4), 243-251.
7. Shiralipour A, McConnell DB, Smith WH (1992) Physical and chemical properties of soils as affected by municipal solid waste compost application Biomass and Bioenergy, 3(3-4), 261-266.
8. Zeman C, Depken D, Rich M (2002) Research on how the composting process impacts greenhouse gas emissions and global warming Compost Science and Utilization, 10(1), 72-86.
9. Boldrin A, Andersen JK, Moller J, Christensen TH, Favoino E (2009) Compost and compost utilization: accounting of greenhouse gases and

21
global warming contributions Waste Management and Research, 27, 800-812.
10. Favoino E and Hogg D (2008) The potential role of compost in reducing greenhouse gases Waste Management and Research, 26, 61-69.
11. Mondini C, Cayuela ML, Sinicco T, Cordaro F, Roig A, Sanchez-Monedero MA (2007) Greenhouse gas emissions and carbon sink capacity of amended soils evaluated under laboratory conditions Soil Biology and Biochemistry, 39, 1366-1374.
12. Lou XF and Nair J (2009) The impact of landfilling and composting on greenhouse gas emissions – a review Bioresource Technology, 100, 3792-3798.
13. Please see Method for estimating greenhouse gas emission reductions from recycling, for more discussion on the boundaries of the life cycle.
14. USEPA (2006) Solid waste management and greenhouse gases: A life-cycle assessment of emissions and sinks, 3rd edition, EPA 530-R-06-004.
15. Martinez-Blanco J, Munoz P, Anton A, Rieradevall J (2009) Life cycle assessment of the use of compost from municipal organic waste for fertilization of tomato crops Resources, Conservation and Recycling, 53, 340-351.
16. Blengini GA (2008) Using LCA to evaluate impacts and resources conservation potential of composting: a case study of the Asti District in Italy Resources, Conservation and Recycling, 52, 1373-1381.
17. In the context of this analysis, ‘boundary’ refers to the life cycle stages quantified to determine each CERF. The boundaries in this analysis are consistent with other emission reduction factor determinations.
18. CIWMB (2004) Second Assessment of California’s Compost- and Mulch-Producing Infrastructure, California Integrated Waste Management Board.
19. Amlinger F, Peyr S, Cuhls C (2008) Green house gas emissions from composting and mechanical biological treatment Waste Management and Research, 26, 47-60.
20. Personal Communction, Robert Horowitz, CalRecycle staff. 21. CARB (2008) Appendix G: Emissions Inventory ~ Methodology and
Results, Material to support the Statewide Truck and Bus Regulations, California Air Resources Board.
22. Beck-Friis B, Pell M, Sonesson U, Jonsson H, Kirchmann H (2000) Formation and emission of N2O and CH4 from compost heaps of organic household waste Environmental Monitoring and Assessment, 62, 317-331.
23. IPCC (2007) Climate Change 2007: The Physical Science Basis. Contribution of Working Group I to the Fourth Assessment Report of the Intergovernmental Panel on Climate Change, Solomon, S., D. Qin, M. Manning, Z. Chen, M. Marquis, K.B. Averyt, M. Tignor and H.L. Miller (eds.). Cambridge University Press, Cambridge, United Kingdom and New York, NY, USA. Chapter 2, Table 2.14.
24. Pattey E, Tzcinski MK, Desjardins RL (2005) Quantifying the reduction of greenhouse gas emissions as a result of composting dairy and beef cattle manure Nutrient Cycling in Agroecosystems, 72, 173-187.

22
25. Hao X, Chang C, Larney FJ, Travis GR (2001) Greenhouse gas emissions during feedlot manure composting Journal of Environmental Quality, 30, 376-386.
26. Czepiel P, Douglas E, Harriss R, Crill P (1996) Measurements of N2O from composted organic wastes Environmental Science and Technology, 30, 2519-2525.
27. Hellebrand HJ (1998) Emission of nitrous oxide and other trace gases during composting of grass and green waste Journal of Agriculture and Engineering Research, 69, 365-375.
28. Hellmann B, Zelles L, Palojarvi A, Bai Q (1997) Emission of climate-relevant trace gases and succession of microbial communities during open-windrow composting Applied and Environmental Microbiology, 63(3), 1011-1018.
29. Manios T, Maniadakis K, Boutzakis P, Nazirdis Y, Lasaridi K, Markakis G, Stentiford EI (2007) Methane and carbon dioxide emission in a two-phase olive oil mill sludge windrow pile during composting Waste Management, 27, 1092-1098.
30. McConnell DB, Shiralipour A, Smith WH (1993) Compost application improves soil properties Biocycle, April, 61-63.
31. Bruun S, Hansen TL, Christensen TH, Magid J, Jensen LS (2006) Application of processed organic municipal solid waste on agricultural land – a scenario analysis Environmental Modeling and Assessment, 11, 251-265.
32. Bresson LM, Koch C, Le Bissonnais Y, Barriuso E, Lecomte V (2001) Soil surface structure stabilization by municipal waste compost application Soil Science Society of America Journal, 65, 1804-1811.
33. Giusquiani PL, Pagliai M, Gigliotti G, Businelli D, Benetti A (1995) Urban waste compost: effects on physical, chemical and biochemical soil properties Journal of Environmental Quality, 24, 175-182.
34. Serra-Wittling C, Houot S, Barriuso E (1996) Modification of soil water retention and biological properties by municipal solid waste compost Compost Science and Utilization, 4(1), 44-52.
35. Crohn DM (2010) Compost Best Management Practices and Benefits, Prepared for CalRecycle. Draft.
36. CARB (2008) Recommended approaches for setting interim significance thresholds for greenhouse gases under the California Environmental Quality Act, Preliminary Draft Staff Proposal, California Air Resources Board.
37. CARB (2008) Climate change scoping plan: a framework for change, California Air Resources Board.
38. Faucette LB, Risse LM, Nearing MA, Gaskin JW, West LT (2004) Runoff, erosion, and nutrient losses from compost and mulch blankets under simulated rainfall Soil and Water Conservation, 59(4), 154-160.
39. Mays DA, Terman GL, Duggan JC (1973) Municipal compost: effects of crop yields and soil properties Journal of Environmental Quality, 2(1), 89-92.
40. Duggan JC and Wiles CC (1976) Effects of municipal compost and nitrogen fertilizer on selected soils and plants Compost Science, 17(5), 24-31.

23
41. Movahedi Naeini SAR and Cook HF (2000) Influence of municipal compost on temperature, water, nutrient status and the yield of maize in a temperate soil Soil Use and Management, 16, 215-221.
42. Smiciklas KD, Walker PM, Kelley TR (2008) Evaluation of compost for use as a soil amendment in corn and soybean production Compost Science and Utilization, 16(2), 183-191.
43. Montemurro F, Malorana M, Convertini G, Ferri D (2006) Compost organic amendments in fodder crops: effects on yield, nitrogen utilization and soil characteristics Compost Science and Utilization, 14(2), 114-123.
44. Personal Communication, Control Laboratory, Watsonville, California. Due to confidentiality concerns, the nutrient data was sent as a compilation of samples from the Southwest region (California, Hawaii, Arizona, New Mexico, Nevada, Utah, and Colorado). Of the ~1200 samples averaged, 80% of the samples were taken from within California.
45. Wood S and Cowie A (2004) A review of greenhouse gas emission factors for fertilizer production, for IEA Bioenergy Task 38.
46. Roe NE, Stoffella PJ, Bryan HH (1993) Municipal solid waste compost suppresses weeds in vegetable crop alleys Hortscience, 28(12), 1171-1172.
47. Brown MW and Tworkoski T (2004) Pest management benefits of compost mulch in apple orchards Agriculture, Ecosystems, and Environment, 103, 465-472.
48. Geisler G, Hellweg S, Hofstetter TB, Hunderbuehler K (2005) Life-cycle assessment in pesticide product development: methods and case study on two plant-growth regulators from different product generations Environmental Science and Technology, 39, 2406-2413.
49. Niggli U, Weibel FP, Gut W (1990) Weed control with organic mulch materials in orchards. Results from 8 year field experiments Acta Horticulturae, 285, 97-102.
50. Ozores-Hampton M, Obreza TA, Stofella PJ (2001) Mulching with composted MSW for biological control of weeds in vegetable crops Compost Science and Utilization, 9(4), 352-361.
51. CARB (2010) Local government operations protocol: for the quantification and reporting of greenhouse gas emissions inventories, California Air Resources Board.
52. Beck-Friis B, Smars S, Jonasson H, Eklind Y, Kirchmann H (2003) Composting of source-separated household organics at different oxygen levels: gaining an understanding of the emission dynamics Compost Science and Utilization, 11(1), 41-50.
53. IPCC (2006) 2006 IPCC guidelines for national greenhouse gas inventories, Intergovernmental Panel on Climate Change, Volume 5, Chapter 4: Biological treatment of solid waste.
54. ICF Consulting (2005) Determination of the impact of waste management activities on greenhouse gas emissions: 2005 update, Submitted to Environment Canada and Natural Resources Canada, Final Report, Contract No. K2216-04-0006.
24
55. Singer JW, Malone RW, Tomer MD, Meade TG, Welch J (2006) Compost effect on water retention and native plant establishment on a construction embankment Journal of Soil and Water Conservation, 61(5), 268-273.
56. Konomi K, Savabi MR, Shinde D, Jayachandran K, Nkedi-Kizza P, Reed ST (2005) Water and atrazine movement in a calcareous compost applied soil during simulated multiple storm events Water, Air and Soil Pollution, 165, 365-377.
57. Celik I, Ortas I, Kilic S (2004) Effects of compost, mycorrhiza, manure and fertilizer on some physical properties of a Chromoxerert soil Soil & Tillage Research, 78, 59-67.