Mercantil Servicios Financieros, C.A. Financial Report ......52,000 million income from the use of...
37
1 Contact: Investor Relations. Phone: 58-212-503.1335. e-mail: [email protected]. website: www.msf.com. Mercantil Servicios Financieros (Mercantil). 2017 Financial Report Third Quarter Caracas Stock Exchange (MVZ.A & MVZ.B); Level 1 ADR: MSFZY & MSFJY Caracas, October 31, 2017. Mercantil reports its earnings for the quarter ended September 30, 2017. Summary Net Income: Mercantil posted Bs 34,346 million in 3Q 20107, 1,121.9% up from Bs 2,811 million in 3Q 2016. In accumulated terms, net income in 2017 totaled Bs 54,491 million, up 469.2% from the nine months cumulative result of September 2016. Net earnings per share in 3Q 2017 were Bs 336.4 (Bs 27.5 in 3Q 2016). In accumulated terms, net earnings per share was Bs 533.7 (Bs 94.8 at September 30, 2016). ROE and ROA in 3Q 2017 reached 94.7% and 5.3% respectively (19.1% and 1.4% in 3Q 2016). For the nine months ended September 30, 2017, these ratios were 61.2% and 3.4%, respectively (21.1% and 1.6% at September 30, 2016). Class “A” and “B” share price closed at Bs 185,000 each, compared to Bs 49,100 per Class “A” share and Bs 49,500 per Class “B” in June 30, 2017. In September 30, 2016 Class “A” and “B” share prices were Bs 5,200 and Bs 5,150 each, respectively. The main variations in net quarterly income are: Net Interest Income reached Bs 136,588 million, Bs 112,203 million (460.1%) up from Bs 24,385 million in 3Q 2016, mainly due to the increase of financial assets and liabilities. The financial intermediation ratio (loans to deposits) was 54.0% at the close of 3Q 2017 (68.6% at September 30, 2016). Commissions and other income totaled Bs 62,206 million, Bs 53,857 million (645.1%) up from Bs 8,349 million in 3Q 2016, mainly due to Bs 52,000 million income from the use of credit and debit cards, among others, as well as from income from financing insurance policies. Personnel and Operating Expenses reached Bs 120,053 million, Bs 93,814 million (357.5%) compared to Bs 26,239 million in 3Q 2016, due to Bs 23,347 million (322.7%) increase in personnel expenses, Bs 7,858 million (252.6%) in expenses from contributions to regulatory entities and Bs 62,609 million (394.0%) in operating expenses. Personnel and Operating Expenses have been affected by the high level of inflation in the Venezuelan economy. Corporate Tax Expenses reached Bs 29,959 million, Bs 26,741 million (831.0%) up from Bs 3,218 million in 3Q 2016. Summary of Financial Statements and Ratios (In millions of Bolivars, except percentages) September 2017 June 2017 September 2016 ∆ Sep. 17 vs. Jun. 17 ∆ Sep. 17 vs. Sep. 16 QUARTERLY RESULTS % % Net Interest Income 136,588 66,811 24,385 104.4 460.1 Allowance for losses on loan portfolio and commissions receivable 22,075 14,628 4,349 50.7 407.0 Commissions and other income 62,206 27,264 8,349 128.3 645.1 Insurance premiums, net of claims 7,661 7,485 3,885 2.4 97.2 Salaries and Operating Expenses 120,053 64,545 26,239 86.0 357.5 Net Income – Quarter 34,346 15,176 2,811 126.3 1,121.9 Net Income – 9 Months 54,491 9,573 469.2 KEY FINANCIAL INDICATORS Income per share – Quarter Bs / share 336 149 28 126.3 1.121.9 Income per share – 9 Months Bs / share 534 95 463.1 Market price A share 185,000 49,100 5,200 276.78 3,457.7 Market price B share 185,000 49,500 5,150 273.7 3,492.2 Book value per share 2,516 2,194 652 14.7 285.9 Net Income (quarter) / Average Assets (ROA) 5.3% 3.2% 1.4% 65.6 278.6 Net Income (quarter) / Average Equity (ROE) 94.7% 60.1% 19.1% 57.6 395.8 Net Income (9 Months) / Average Assets (ROA) 3.4% 1.6% 112.5 Net Income (9 Months) / Average Equity (ROE) 61.2% 21.1% 190.0 Mercantil Servicios Financieros, C.A. Financial Report Third Quarter 2017
Transcript of Mercantil Servicios Financieros, C.A. Financial Report ......52,000 million income from the use of...

1
Contact: Investor Relations. Phone: 58-212-503.1335. e-mail: [email protected]. website: www.msf.com.
Mercantil Servicios Financieros (Mercantil). 2017 Financial Report Third Quarter Caracas Stock Exchange (MVZ.A & MVZ.B); Level 1 ADR: MSFZY & MSFJY
Caracas, October 31, 2017. Mercantil reports its earnings for the quarter ended September 30, 2017.
Summary
Net Income: Mercantil posted Bs 34,346 million in 3Q 20107, 1,121.9% up from Bs 2,811 million in 3Q 2016. In accumulated terms, net income in 2017 totaled Bs 54,491 million, up 469.2% from the nine months cumulative result of September 2016.
Net earnings per share in 3Q 2017 were Bs 336.4 (Bs 27.5 in 3Q 2016). In accumulated terms, net earnings per share was Bs 533.7 (Bs 94.8 at September 30, 2016).
ROE and ROA in 3Q 2017 reached 94.7% and 5.3% respectively (19.1% and 1.4% in 3Q 2016). For the nine months ended September 30, 2017, these ratios were 61.2% and 3.4%, respectively (21.1% and 1.6% at September 30, 2016).
Class “A” and “B” share price closed at Bs 185,000 each, compared to Bs 49,100 per Class “A” share and Bs 49,500 per Class “B” in June 30, 2017. In September 30, 2016 Class “A” and “B” share prices were Bs 5,200 and Bs 5,150 each, respectively.
The main variations in net quarterly income are:
Net Interest Income reached Bs 136,588 million, Bs 112,203 million (460.1%) up from Bs 24,385 million in 3Q 2016, mainly due to the increase of financial assets and liabilities. The financial intermediation ratio (loans to deposits) was 54.0% at the close of 3Q 2017 (68.6% at September 30, 2016).
Commissions and other income totaled Bs 62,206 million, Bs 53,857 million (645.1%) up from Bs 8,349 million in 3Q 2016, mainly due to Bs 52,000 million income from the use of credit and debit cards, among others, as well as from income from financing insurance policies.
Personnel and Operating Expenses reached Bs 120,053 million, Bs 93,814 million (357.5%) compared to Bs 26,239 million in 3Q 2016, due to Bs 23,347 million (322.7%) increase in personnel expenses, Bs 7,858 million (252.6%) in expenses from contributions to regulatory entities and Bs 62,609 million (394.0%) in operating expenses. Personnel and Operating Expenses have been affected by the high level of inflation in the Venezuelan economy.
Corporate Tax Expenses reached Bs 29,959 million, Bs 26,741 million (831.0%) up from Bs 3,218 million in 3Q 2016.
Summary of Financial Statements and Ratios
(In millions of Bolivars, except percentages)
September
2017 June 2017
September 2016
∆ Sep. 17 vs. Jun. 17
∆ Sep. 17 vs. Sep. 16
QUARTERLY RESULTS % %
Net Interest Income 136,588 66,811 24,385 104.4 460.1 Allowance for losses on loan portfolio and commissions receivable 22,075 14,628 4,349 50.7 407.0 Commissions and other income 62,206 27,264 8,349 128.3 645.1 Insurance premiums, net of claims 7,661 7,485 3,885 2.4 97.2 Salaries and Operating Expenses 120,053 64,545 26,239 86.0 357.5 Net Income – Quarter 34,346 15,176 2,811 126.3 1,121.9 Net Income – 9 Months 54,491 9,573 469.2
KEY FINANCIAL INDICATORS
Income per share – Quarter Bs / share 336 149 28 126.3 1.121.9
Income per share – 9 Months Bs / share 534 95 463.1 Market price A share 185,000 49,100 5,200 276.78 3,457.7 Market price B share 185,000 49,500 5,150 273.7 3,492.2 Book value per share 2,516 2,194 652 14.7 285.9 Net Income (quarter) / Average Assets (ROA) 5.3% 3.2% 1.4% 65.6 278.6 Net Income (quarter) / Average Equity (ROE) 94.7% 60.1% 19.1% 57.6 395.8 Net Income (9 Months) / Average Assets (ROA) 3.4% 1.6% 112.5 Net Income (9 Months) / Average Equity (ROE) 61.2% 21.1% 190.0
Mercantil Servicios Financieros, C.A.
Financial Report Third Quarter 2017

2
Contact: Investor Relations. Phone: 58-212-503.1335. e-mail: [email protected]. website: www.msf.com.
Assets: During 3Q 2017, total assets registered Bs 1,992,739 million (68.7%) quarter-over-quarter growth to Bs 4,894,697 million and Bs 3,891,378 million (387.9%) year-on-year growth. The variations for this item, taken individually by subsidiary, are as follows:
Mercantil Banco Universal registered Bs 2,493,320 million (95.2%) quarter-over-quarter growth and Bs 4,235,598 million (483.1%) year-on-year growth.
Mercantil Bank, N.A. registered US$ 58 million (0.7%) decrease in 3Q 2016 and US$ 20 million (0.2%) increase compared to September 2015.
Mercantil Seguros registered Bs 75,685 million (79.9%) quarter-over-quarter growth and Bs 121,679 million (249.9%) year-on-year growth.
Net Loan Portfolio: During 3Q 2017, total loans registered Bs 847,642 million (65.8%) quarter-over-quarter growth to Bs 2,136,082 million, and Bs 1,574,862 million (280.6%) year-on-year growth.
The variations of this item, taken individually by subsidiary, are as follows:
Mercantil Banco Universal registered Bs 846,628 million (69.1%) increase in 3Q 2017 and Bs 1,570,500 million (313.3%) compared to
September 2016.
Mercantil Bank, N.A. registered US$ 37 (0.6%) increase in 3Q 2017, and US$ 316 (6.4%) compared to September 2016.
Deposits: During 3Q 2017 deposits registered Bs 1,720,697 million (73.3%) quarter-over-quarter growth to Bs 4,067,331 million, and Bs 3,223,356 million (381.9%) year-on-year growth.
The variations of this item, taken individually by subsidiary, are as follows:
Mercantil Banco Universal registered Bs 1,728,515 million (75.8%) quarter-over-quarter growth and Bs 3,232,441 million (416.3%) year-on-year growth.
Mercantil Bank, N.A. registered US$ 104 million (1.6%) quarter-over-quarter decrease and US$ 57 million (0.9%) year-on-year drop.
Shareholders’ Equity totaled Bs 263,546 million, reflecting Bs 33,736 million (14.7%) increase from Bs 229,810 million in the previous quarter, and Bs 195,255 million (285.9%) year-on-year growth. The quarterly variation of the equity is primarily attributable to Bs 34,346 million in net income, among others.
Capital Ratios: Mercantil equity-to-risk weighted assets is 10.5%, according to the standards of the National Securities Superintendency (SUNAVAL – Superintendencia Nacional de Valores), (10.7% at September 30, 2016).
Mercantil Banco Universal, in accordance to the requirements of the Venezuelan Superintendency of the Banking Sector Institutions (SUDEBAN – Superintendencia de las Instituciones del Sector Bancario), at September 30, 2017 has an equity-to-assets ratio of 10.9% and an equity to risk-weighted assets ratio of 12.2% (11.2% and 13.7% at September 30, 2016).
Mercantil Bank, N.A., based on the standards of the U.S. Office of the Comptroller of the Currency (OCC), at September 30, 2017, registered an equity-to-assets ratio of 9.5%, and an equity to risk-weighted assets ratio of 12.3% (9.2% and 12.4% at September 30, 2016).
The equity ratios of Mercantil and its subsidiaries exceed the regulatory minimums.
Summary of Financial Statements (In millions of Bolivars, except percentages)
September
2017 June 2017
September 2016
∆ Sep. 17 vs. Jun. 17
∆ Sep. 17 vs. Sep. 16
% %
Cash and due from banks 2,013,008 1,068,445 239,343 88.4 741.1
Investment Portfolio 332,385 183,147 138,127 81.5 140.6
Loan Portfolio, Net 2,136,082 1,288,440 561,220 65.8 280.6
Other assets 413,222 361,926 64,629 14.2 539.4
TOTAL ASSETS 4,894,697 2,901,958 1,003,319 68.7 387.9
Deposits 4,067,331 2,346,634 843,975 73.3 381.9
Financial Liabilities 47,949 27,369 13,616 75.2 252.2
Other Liabilities 515,871 298,145 77,437 73.0 566.2
Shareholders’ Equity 263,546 229,810 68,291 14.7 285.9
TOTAL LIABILITIES AND SHAREHOLDERS´ EQUITY 4,894,697 2,901,958 1,003,319 68.7 387.9
ASSETS UNDER MANAGEMENT 2,136,597 629,461 138,476 239.4 1,442.9

3
Contact: Investor Relations. Phone: 58-212-503.1335. e-mail: [email protected]. website: www.msf.com.
Table of contents Page
Contribution of subsidiaries 4
Market share 5
Credit Ratings 5
Analysis of Consolidated Financial Statements 6
Operating Income
Net Interest Income 6
Allowance for losses on loan portfolio and commissions receivable 7
Total Commissions and Other Income 8
Total Operating Expenses 9
Efficiency Ratios Balance Sheet
10
Liquidity 10
Investment Portfolio 11
Financial Intermediation Activity
Loan Portfolio 12
Deposits 13
Total Assets 14
Financial Obligations 15
Shareholders’ Equity 15
Capital Ratios 15
Wealth Management 16
Performance of Subsidiaries in accordance to its Local Accounting Standards 17
Corporate Events 20
New Measures announced for the Venezuelan Financial Environment 20
Awards and Acknowledgements 21
New Measures announced for the Venezuelan Financial Environment 22
Appendix I: Summary of the accounting principles used to prepare the financial statements 23
Appendix II: Financial statements of Mercantil Servicios Financieros 28
Appendix III: Consolidated Loan Portfolio by Classification 29
Appendix IV: Statutory percentage of loan portfolio in Venezuela by Sector of the Economy and Interest Rates 30
Appendix V: Stock Performance Summary and Financial Indicators of Mercantil Servicios Financieros 32
Appendix VI: Financial statements of Mercantil Banco Universal 34
Appendix VII: Financial statements of Mercantil Bank Holding Corporation 36

4
Contact: Investor Relations. Phone: 58-212-503.1335. e-mail: [email protected]. website: www.msf.com.
Contribution of Subsidiaries
Shareholders’ Equity
In millions of Bs(1) Total Total Assets 4,656,245 84,344 9,726 133,323 2,531 8,528 4,894,697 % Assets 95.1 1.7 0.2 2.7 0.1 0.2 100.0
Investments 281,944 20,177 4,174 23,643 2,358 89 332,385 Loans (Net) 2,071,727 60,119 4,236 0 0 0 2,136,082
Deposits 3,997,365 64,044 5,922 0 0 0 4,067,331
Contribution
Income net: Quarter 38,951 163 12 (2,400) 710 (3,090) 34,346 9 Months 59,096 328 (43) (1,530) 675 (4,035) 54,491 Assets under Management 111,761 18,526 6,377 88 1,999,845 0 2,136,597
Number of Employees 5,527 946 128 895 36 32 7,564
1 Financial data presented in accordance with SUNAVAL standards (see Appendix I). Includes the effect of inter-company transactions eliminations typical of the consolidation process. Foreign currency transactions and balances are translated at the purchase official exchange rate, see Appendix V.
2 See Summary of Subsidiaries’ performance according to their Regulatory Accounting Standards (page 17).
Market Share
Mercantil Banco Universal
Bs 206,418
Mercantil
Bank Bs 7,111
Other Banks Overseas Bs 3,116
Others Bs 7,269
Mercantil Merinvest Bs 5,657
Mercantil Seguros
Bs 50,666
Venezuelan Universal Bank
Insurance in Venezuela and Abroad
Other Minor Investment
Shareholders’ Equity: Bs 263,546 millions
MERCANTIL SERVICIOS FINANCIEROS (1)
(In millions of Bolivars, except percentages)
U.S. Domestic Bank & Brokerage
International Banking
Investment banking, mutual funds, trading
& brokerage
Main Activity
Mercantil Bank
(Schweiz) AG.
Mercantil Bank (Panamá) S.A.
Mercantil Bank and Trust Limited Cayman (Islas Caiman)
Mercantil Bank (Curacao) NV
Mercantil Investment Services (MIS)
Mercantil Trust Company (MTC)
Principales Subsidiarias
September 30, 2017
Mercantil Merinvest, Casa de Bolsa, C.A.
Mercantil Capital Markets (Panamá)
Mercantil Seguros Panamá S.A.
Mercantil Seguros, C.A.
(2) (2) (2)
Mercantil Servicios de Inversión, C.A.
Mercantil Sociedad Administradora de Entidades de Inversión Colectiva, C.A.

5
Contact: Investor Relations. Phone: 58-212-503.1335. e-mail: [email protected]. website: www.msf.com.
Fitch Ratings Clave (*)
Largo Plazo A+(Ven)
Corto Plazo F1+(Ven)A2 A2
A1 A1
Largo Plazo AA-(Ven)
Corto Plazo F1+(Ven)
Largo Plazo (moneda extranjera y local) CCC
Corto Plazo (moneda extranjera y local) C
Viabilidad ccc
Largo Plazo (depositos) (Mercantil Commercebank N.A.) BB+
Largo Plazo BB
Corto Plazo BViabilidad bb
Mercantil Servicios Financieros
Calificación Nacional
Mercantil Commercebank Florida Bancorp y
Mercantil Commercebank N.A.
Obligaciones Quirografarias (largo plazo)
Papeles Comerciales (corto plazo)
Mercantil Banco Universal
Calificación Nacional
Calificación Internacional
Commercial
and Universal
Bank's
Private Total Private
Tourism Loans 3 2 8.1% 21.9%
Manufacturing Loans 7 4 4.2% 8.1%
Agricultural Loans 5 3 10.2% 15.8%
Morgtgage Loans under the mortgage Debtor Law (Ley Especial del
Deudor Hipotecario)6 3 7.0% 15.2%
Microcredits Loans 5 4 5.6% 6.5%
Gross Loans 4 3 9.5% 13.5%
Savings Deposits 1 1 17.0% 21.8%
Total Deposits 4 3 9.3% 13.7%
Total Deposits + Other Demand Liabilities 4 3 9.2% 13.5%
Total Assets 4 3 9.1% 13.7%
Trust 5 3 7.1% 16.2%
Insurance
Market
Net Premiums 4 8.1%
U.S. (3)
Florida (4)
Total Deposits 136 16
Positioning Market Share
Mercantil Seguros (2)
Venezuela
USA
Mercantil Bank, N.A. (3)
Mercantil Banco (1)
Fitch Ratings Clave (*)
Long-term A+(Ven)
Short-term F1+(Ven)A2 A2
A1 A1
Long-term A+(Ven)Short-term F1(Ven)
Long-term (Foreign and local currency) CC
Short-term (Foreign and local currency) C
Viability CC
Long-term Deposit (Mercantil Bank, N.A. only) BB+
Long-term BB
Short-term BViability bb
National Ratings
Mercantil Servicios Financieros
Mercantil Commercebank Florida Bancorp y
Mercantil Bank, N.A.
Rating for Unsecured Bonds ( Long-term in local currency)
Rating for Commercial Paper (Short-term in local currency)
Mercantil Banco Universal
National Ratings
International Ratings
(1) Source: Summary of Unconsolidated Financial Statements Published in National newspapers at September 30, 2017. (2) Source: Venezuelan Superintendency of Insurance at 08/31/2017 (3) Source: American Bankers based on 200 Bank Holdings, Commercial Banks and Saving Institutions with more Deposits in U.S. at 03/31/2017 (4) Source: Federal Deposit Insurance Corporation (FDIC), to the Florida Stated U.S. at 06/30/2017, Total number of institutions in Florida: 227 in Florida.
(*) A credit rating agency in Venezuela
Credit Ratings

6
Contact: Investor Relations. Phone: 58-212-503.1335. e-mail: [email protected]. website: www.msf.com.
24,385 31,024 34,596 66,811 136,588
15.0% 14.5%15.3%
19.2%
27.1%
8%
13%
18%
23%
28%
-
20,000
40,000
60,000
80,000
100,000
120,000
140,000
160,000
3Q 2016 4Q 2016 1Q 2017 2Q 2017 3Q 2017
(Mill
ion
of
Bs)
Evolution of Net Interest Income
Net Interest Income Net Interest Income / Average Financial Assets
Analysis of Consolidated Financial Statements
Operating Income Quarter 9 Months
Ended on ∆ Ended on
(In millions of Bolivars, except percentages)
Sep. Sep. Sep. Sep.
2017 2016 Bolivars % 2017 2016 Bolivars %
Net Interest Income 136,588 24,385 112,203 460.1 237,995 58,332 179,663 308.0 Allowance for losses on loan portfolio and commissions receivable 22,075 4,349 17,726 407.6 40,267 8,149 32,118 394.1
Net Financial Margin 114,513 20,036 94,477 471.5 197,728 50,183 147,545 294.0
Commissions and Other Income 62,206 8,349 53,857 645.1 108,802 23,237 85,564 368.2
Insurance Premiums, Net of Claims 7,661 3,885 3,776 97.2 20,804 7,853 12,951 164.9
Operating Income 184,380 32,270 152,110 471.4 327,334 81,273 246,060 302.8
Net Interest Income In 3Q 2017, net interest income was Bs 114,513 million, 471.5% higher than Bs 24,385 million registered in 3Q 2016, mainly due to the increase in financial assets and liabilities. Interest income was Bs 156,423 million, which reflects a 391.6% year-on-year increase. This increase is reflected in the performance of income from the loan portfolio, which grew 415.6%. Interest expenses totaled Bs 19,835 million, up 166.9% from 3Q 2016. The financial intermediation ratio (loans-to-deposits) was 54.0% at the close of 3Q 2017 (68.6% at the close of September 2016).
Mercantil Banco Universal reached Bs 136,374 million, 486.3% up from Bs 23,260 million in 3Q 2016, mainly due to the higher volume of financial assets and liabilities. The financial intermediation ratio was 52.6% in September 2017 and 66.2% in September 2016.
Mercantil Bank, N.A. reached US$ 56 millio n, 13.1% up from US$ 49 million in 3Q 2016. The Bank continues to hold a significant portion of its assets, US$ 1,971 million, more than 23%, in short-term investments and securities issued by the U.S. Government or U.S. Government-backed agencies.
Mercantil's net interest margin (income-to-average financial assets) at September 30, 2017 was 27.1% compared to 15.0% in the same period of the previous year.

7
Contact: Investor Relations. Phone: 58-212-503.1335. e-mail: [email protected]. website: www.msf.com.
0
500,000
1,000,000
1,500,000
2,000,000
2,500,000
Gross Loans Past Due and Non-Performing Loans
3.0% 3.0% 3.0%2.8%
2.7%
0.0%
0.4%
0.8%
1.2%
1.6%
2.0%
2.4%
2.8%
3.2%
Allowance for Losses on Loan Portfolio / Gross Loans
0.4% 0.4% 0.4%0.2% 0.2%
0.0%
0.4%
0.8%
1.2%
1.6%
2.0%
2.4%
2.8%
3.2%
Sep.2016 Dic. 2016 Mar. 2017 Jun. 2017 Sep. 2017
Past Due and Non-Performing Loans / Gross Loans
Loan Portfolio Provision and Commissions Receivable In 3Q 2017, expenses totaled Bs 22,075 million, up Bs 17,726 million (407.6%) from Bs 4,349 million in 3Q 2016.
Mercantil Banco Universal registered Bs 22,034 million in loan portfolio provisions in 3Q 2017 (Bs 4,316 million in 3Q 2016), aimed mainly at provisions for the portfolio growth in the quarter.
Mercantil Bank, N.A. registered US$ 4 million in loan portfolio provisions (US$ 3 million in 3Q 2016), mainly aimed at the commercial sector. The accumulated allowance, therefore, totaled Bs 58,605 million at September 30, 2017, representing 2.7% of gross loans (2.8% at June 30, 2017). This provision covers 1,273.5% of past-due and non-performing loans (1,149.9% at June 30, 2017).
(Bs Millones)
Evolution Loan Portfolio

8
Contact: Investor Relations. Phone: 58-212-503.1335. e-mail: [email protected]. website: www.msf.com.
Total Commissions and Other Income
In 3Q 2017, commissions and other income totaled Bs 62,206 million, up Bs 53,857 million (645.1%) from Bs 8,349 million in 3Q 2016, mainly due to:
Bs 52,001 million (629.8%) increase in earnings from commissions on the use of debit and credit cards, income from insurance policy financing, and other commissions on client transactions, among others, mainly for the high volume of transactions.
Bs 1,827 million (1,676.1%) increase in earnings from securities trading activities.
Insurance Premiums, net of Claims
In 3Q 2017, Insurance Premiums, net of commissions, reinsurance and claims totaled Bs 7,661 million, 97.2% up from Bs 3,885 million in 3Q 2016. This improvement is attributed to the Automobile business. Collected premiums in 3Q 2017 amounted to Bs 67,852 million, reflecting Bs 46,980 million, 225.1% year-on-year growth. This increase is mainly due to the Health (259.4%) and Automobile (188.9%) businesses. At August 31, 2017, Mercantil Seguros was the country’s fourth largest insurance Company in terms of net collected premiums, with 8.1% of the insurance market.
Claims and administrative expenses during 3Q 2017 totaled Bs 40,432 million, up Bs 27,322 million (208.4%) from Bs 13,110 million in 3Q 2016 mainly due to the Health business. The claims ratio was 62.4% in 3Q 2017 (59.5% in 3Q 2016). The negative technical result was Bs 66 million, compared to Bs 482 million in 3Q 2016, the variation mainly due to increases in incurred claims, commissions, acquisition expenses, and contributions to regulatory agencies.
Composition of Total Income
Bs 36,619 million September 2016
Bs 206,455 million September 2017
67% 66%
29%27%
4%6%
0%
1%
3Q 2016 3Q 2017
Net Interest Income
Commissions on Transactions, Insurance Premiums net and Other
Other Income
Income on Sales Investment Securities

9
Contact: Investor Relations. Phone: 58-212-503.1335. e-mail: [email protected]. website: www.msf.com.
3,795 8,847 14,264 3,111 6,175
10,969 12,097
32,668
64,237
7,236
16,855
30,583
3Q 2016 2Q 2017 3Q 2017
Total Personal and Operating Expenses Quarter(In millions of Bolivars)
Salaries and employee benefitsOther operating expensesFees paid to regulatory agenciesDepreciation, Property and equipment, Amortization of intangibles and others expenses
26,239
Δ +357.5%
Δ +86.0%
64,545
120,053
Total Operating Expenses
Quarter 9 months
Ended on ∆ Ended on ∆
(In millions of Bolivars, except percentages)
Sep. Sep. Sep. Sep.
2017 2016 Bolivars % 2017 2016 Bolivars %
Operating Income 184,380 32,270 152,110 471.4 327,334 81,273 246,060 302.8
Operating Expenses
Personal and Employee Benefits 30,583 7,236 23,347 322.7 61,095 17,342 43,753 252.3
Other Operating expenses 89,470 19,004 70,466 370.8 173,158 46,574 126,584 271.8
Taxes Current and Deferred 29,959 3,218 26,741 831.0 38,557 7,776 30,781 (395.8)
Minority Interests (22) (2) (20) (1,000.0) (34) (7) (27) (385.7)
Net Income 34,346 2,811 31,535 1,121.9 54,491 9,573 44,918 469.2
In 3Q 2017, personnel and operating expenses totaled Bs 120,053 million, 357.5% up from Bs 26,240 million in 3Q 2016. This increase is mainly due to:
Bs 23,347 million in personnel expenses, 322.7% year-on-year rise. This increase is due to the application of compensation policies and benefits according to market values. At Mercantil Banco Universal, assets per employee rose from Bs 135.5 million in 2016 to Bs 819.3 million in 2017. At Mercantil Seguros, net collected premiums per employee increased from Bs 19.5 million in 2016 to Bs 76.5 million in 2017. In the case of overseas businesses, assets per employee rose from US$ 8.8 million in 2016 to US$ 8.9 million in 2017.
Bs 7,858 million (252.6%) increase in expenses from contributions to regulatory agencies.
Bs 4,388 million (258.0%) increase in expenses for taxes and contributions.
Bs 47,752 million (459.3%) increase in operating expenses.

10
Contact: Investor Relations. Phone: 58-212-503.1335. e-mail: [email protected]. website: www.msf.com.
62.6% 61.2%
73.4%
63.4%58.7%
10.0%
9.4%
10.9%10.7%
12.4%
6.0%
7.0%
8.0%
9.0%
10.0%
11.0%
12.0%
13.0%
0.0%
20.0%
40.0%
60.0%
80.0%
3Q 2016 4Q 2016 1Q 2017 2Q 2017 3Q 2017
Operating Expenses / Total Income Operating Expenses / Average Assets
22,616 35,040 33,732 177,343
565,507
1,082,184
62,000
502,938
930,824
Sep. 2016 Jun. 2017 Sep. 2017
Liquidity (In millions of Bolivars)
Cash and Due from Banks - Legal Reserves
Legal Reserves
Investments in Time Deposits and Placements
Δ +681.3%
2,046,740
1,103,485
261,959Δ +85.5%
Efficiency Ratios The efficiency ratio measured by operating expenses to average assets was 12.4% in September 2017, versus 10.0% in September 2016. The ratio of operating expenses to total income was 58.7% in September 2017 (62.6% in September 2016). Personnel and Operating expenses have been affected by the inflationary environment of the Venezuelan economy. The company has made significant efforts to adapt its managing and operating structure to the current environment in the geographical areas where it operates. In the case of Venezuela, these efforts have significantly reduced the impact of inflation.
Balance Sheet The principal balance sheet variations during 3Q 2017 are reviewed below, and commented on with respect to the prior quarter. The main year-on-year variations are also included for comparison purposes.
Summary of Balance Sheet and Assets under Management (In millions of Bolivars, except percentages)
∆ ∆ September June September Sep. 17 vs. Jun. 17 Sep. 17 vs. Sep. 16
2017 2017 2016 Bolivars % Bolivars %
Cash and due from banks 2,013,008 1,068,445 239,343 944,563 88.4 1,773,665 741.1 Investment Portfolio 332,385 183,147 138,127 149,238 81.5 194,258 140.6 Loan Portfolio, Net 2,136,082 1,288,440 561,220 847,642 65.8 1,574,862 280.6 Total Assets 4,894,697 2,901,958 1,003,319 1,992,739 68.7 3,891,378 387.9 Deposits 4,067,331 2,346,634 843,975 1,720,697 73.3 3,223,356 381.9 Shareholders´ Equity 263,546 229,810 68,291 33,736 14.7 195,255 285.9 Asset Management 2,136,597 629,461 138,476 1,507,136 239.4 1,998,121 1,442.9
Liquidity
At the close of 3Q 2017, cash and due from Banks (cash and required legal reserves in Venezuela) plus investments in time deposits and placements included in the investment portfolio increased 85.5% to Bs 2,046,740 million, up Bs 943,255 million from Bs 1,103,485 million registered in the previous quarter. This growth is observed mainly in the accounts held at the Venezuelan Central Bank. Non-Interest Bearing Demand deposits are related to the recent high levels of liquidity levels of the Venezuelan financial system and to the internal risk limits. Compared to September 30, 2016, cash and due from banks plus investments in time deposits and placements grew Bs 1,784,781 million (681.3%), from Bs 261,959 million to Bs 2,046,740 million. The liquidity ratio calculated by dividing total cash and due from banks by deposits was 49.5%, and the ratio calculated by dividing total cash and due from banks plus investments by deposits was 57.7%, compared to 45.5% and 53.3%, respectively for June 2017, and to 28.4% and 44.7% respectively at the close of 3Q 2016.

11
Contact: Investor Relations. Phone: 58-212-503.1335. e-mail: [email protected]. website: www.msf.com.
Investment Portfolio
At the close of 3Q 2017, the investment portfolio totaled Bs 332,385 million, up Bs 149,238 million (81.5%) from Bs 183,147 million.
Compared to September 30, 2016, the investment portfolio grew Bs 194,258 million (140.6%) from Bs 138,127 million to Bs 332,385 million.
The main variations for this item, taken individually by subsidiary, are as follows:
(In millions, except percentages) September June ∆
2017 2017 Abs. %
Mercantil Banco Universal Bs 737,758 254,280 483,478 190.1 Mercantil Seguros Bs 54,007 32,543 21,464 66.0 Mercantil Bank, N.A. US$ 1,999 2,157 (158) (7.3)
Investments by maturity and yield at the close of 3Q 2017 are broken down as follows:
Investments by Maturity and Yield
(In millions of Bolivars, except percentages)
Trading Available for Sale
Held to Maturity Shares
Time Deposits and Placements
Trust Fund and Restricted
Investments
Years Bs 1 Bs
1 %
3 Bs
2 %
3 Bs
1 Bs
1 % Bs
1 %
3 TOTAL
Less Than 1 213 34,170 4.5% 1,456 5.8% 0 22,257 7.4% 3,530 24.6% 61,626
From 1 to 5 21 11,030 14.0% 163,362 9.4% 0 0 24 17.9% 174,437
Over 5 175 30,636 8.2% 50,120 6.8% 3,808 11,475 3.9% 110 15.3% 96,324
409 75,836 214,937 3,808 33,732 3,663 332,385
Public debt bonds issued by the Venezuelan State account for 0.14 time Mercantil’s equity and 0.8% its assets (0.14 and 1.1% in June 2017, respectively). These securities also represent 0.12 times Mercantil Banco Universal’s equity and 0.93% its assets (0.09 and 0.73% in June 2017, respectively). At September 30, 2017, the Mercantil, C.A. Banco Universal subsidiary, in line with regulations issued by the executive branch, purchased Bs 234,278 million in Mortgage Bonds, CDs, Agriculture Bonds, and Stocks, accounting for 83.1% of the investment portfolio and 1.13 times its equity (Bs 90,238 million representing 68.0% of its investment portfolio and 1.6 times its equity at June 30, 2017). 1 Market Value 2 Amortized cost 3 The yield of securities is based on amortized cost at the end of the period. Yield is calculated by dividing income investments (including premium amortization or discounts) by the amortized cost or market value.
138,127
183,147
332,385
Sep.2016 Jun. 2017 Sep. 2017
Investments Portfolio(In millions of Bolivars)
Δ +140.6%
Δ+81.5%
0%5%
10%15%20%25%30%35%40%45%50%55%60%65%70%75%80%85%
Venezuelan Central Bank US Government & US Gov.Guaranteed Agencies
Private Venezuelan Governmentand Public Entities
Breakdown of Investments by IssuerSeptember 2016
June 2017
September 2017

12
Contact: Investor Relations. Phone: 58-212-503.1335. e-mail: [email protected]. website: www.msf.com.
47% 45% 42%43%
46%
15% 15% 16%
17%
15%
38%40%
42%
40%
39%
0
300,000
600,000
900,000
1,200,000
1,500,000
1,800,000
2,100,000
2,400,000
Sep. 2016 Dec. 2016 Mar. 2017 Jun. 2017 Sep. 2017
Loan Portfolioby Business Segment(In millions of bolivars)
Individuals
Large Corporation
SME's
Financial Intermediation Activity
Loan Portfolio
At the close of 3Q 2017, the net loan portfolio amounted to Bs 2,136,082 million, representing 65.8% quarter-over-quarter growth from Bs 1,288,440 million.
Compared to September 30, 2016, the loan portfolio increased Bs 1,574,862 million (280.6%), from Bs 561,220 million to Bs 2,136,082 million.
The variations for this item, taken individually by subsidiary, are as follows:
(In millions, except percentages) September June ∆
2017 2017 Abs. %
Mercantil Banco Universal Bs 2,071,726 1,225,098 846,628 69.1 Mercantil Bank, N.A. US$ 6,027 5,990 37 0.6
The ratio of past-due and non-performing loans to gross loans is 0.2%, similar to the one registered at the close of June 2017. The ratio by subsidiary is as follows: • Mercantil Banco Universal 0.2% compared to 0.1% to the Venezuelan financial system. • Mercantil Bank, N.A. reached 0.2% compared to 0.5% at the close of the previous quarter. Non-accrual loans reached 0.6% of the total loan portfolio (0.9% at the close of the previous quarter). At September 30, 2017, 99.8% of Mercantil’s loan portfolio is outstanding. The allowance for losses on the loan portfolio covers 1,273.5% of past-due and non-performing loans (1,149.9% at June 30, 2017). This ratio is 1,375.2% at Mercantil Banco Universal (1,346.25% at June 30, 2017) and 672.5% at Mercantil Bank, N.A. (257.0% at June 30, 2017). The analysis of Mercantil’s main subsidiaries and their positioning in the market are shown on pages 5 and 17. Annex III shows the distribution of the loan portfolio, broken down by economic activity, maturity, country, and type of risk.
561,220
1,288,440
2,136,082
Sep. 2016 Jun. 2017 Sep. 2017
Loan Portfolio(In millions of Bolivars)
Δ + 280.6%
Δ+65.8%

13
Contact: Investor Relations. Phone: 58-212-503.1335. e-mail: [email protected]. website: www.msf.com.
33% 31% 32%33%
34%23%
21% 23%
22%
22%
44%48%
45%
45%
44%
0
600,000
1,200,000
1,800,000
2,400,000
3,000,000
3,600,000
4,200,000
4,800,000
Sep. 2016 Dec. 2016 Mar. 2017 Jun. 2017 Sep. 2017
Breakdown Depositsby Business Segment(In millions of bolivars)
Individuals
Large Corporation
SME's
Deposits
At the close of 3Q 2017, deposits amounted to Bs 4,067,331 million, representing Bs 1,720,697 million (73.3%) quarter-over-quarter growth from Bs 2,346,634 million.
Compared to September 30, 2016, deposits grew Bs 3,223,356 million (381.9%) from Bs 843,975 million to Bs 4,067,331 million.
Demand deposits were the main component of total deposits, which reached Bs 3,279,916 million, 74.2% up from the previous quarter, reflecting 80.6% of total deposits. Savings and term deposits increased Bs 322,413 million (73.2%) and Bs 1,020 million (4.3%), respectively, in the same period.
Variations for this item, taken individually by subsidiary, are as follows:
(In millions, except percentages) September June ∆
2017 2017 Abs. %
Mercantil Banco Universal Bs 4,008,848 2,280,333 1,728,515 75.8 Mercantil Bank, N.A. US$ 6,481 6,586 (104) (1.6)
The analysis of Mercantil’s main subsidiaries and their positioning in the market are shown on pages 5 y 17.
843,975
2,346,634
4,067,331
Sep. 2016 Jun. 2017 Sep. 2017
Deposits(In millions of Bolivars)
Δ + 381.9%
Δ +73.3%

14
Contact: Investor Relations. Phone: 58-212-503.1335. e-mail: [email protected]. website: www.msf.com.
Cash and Due from Banks 41.1%
Loan Portfolio, Net 43.6%
Venezuelan Central Bank 0.5%
Venezuelan Govermment 5.5%
US Govermment. 0.1%
Private Sector 0.5%
US Govermment Guaranteed Agencies 0.2%
Other Assets 8.5%
Total Assets
At the close of 3Q 2017 total assets registered 68.7% increase to Bs 4,894,697 million, up Bs 1,992,739 million from Bs 2,901,958 million the previous quarter. This growth is the result of the combined performance of total cash and due from banks and the loan portfolio, which grew Bs 944,563 million and Bs 847,642 million, respectively. The ratio of performing assets to total assets was 56.4%, up Bs 1,015,395 million (58.2%) from the previous quarter. Compared to September 30, 2016, assets grew Bs 3,891,378 million (387.9%), from Bs 1,003,319 million to Bs 4,894,697 million. Variations of this item, taken individually by subsidiary, are as follows:
(In millions, except percentages) September June ∆
2017 2017 Abs. %
Mercantil Banco Universal Bs 5,112,416 2,619,096 2,493,320 95.2 Mercantil Seguros Bs 170,361 94,676 75,685 79.9 Mercantil Bank, N.A. US$ 8,456 8,513 (57) (0.7)
The analysis of Mercantil’s main subsidiaries and their positioning in the market are shown on pages 5 y 17. The loan portfolio remained the main component (43.6%) of total assets, with cash and due from banks accounting for 41.1%, while the investment portfolio accounted for 6.8% at the close of the quarter.
Assets Distribution Total Bs 4,894,697 million
September 2017
1,003,319
2,901,958
4,894,697
Sep. 2016 Jun. 2017 Sep. 2017
Consolidated Total Assets(In millions of Bolivars)
Δ +387.9%
Δ+68.7%

15
Contact: Investor Relations. Phone: 58-212-503.1335. e-mail: [email protected]. website: www.msf.com.
Financial Obligations At the close of 3Q 2017, financial obligations reached Bs 61,928 million, up 97.1% from Bs 31,419 million the previous quarter; compared to September 30, 2016, obligations rose by 305.4%.
September
2017 June 2017
September 2016
(In millions, except percentages) Bs Bs Bs
Publicly Traded Debt Securities Issued by Mercantil 12,873 2,874 533 Subordinated debt 1,106 1,106 1,127
13,979 3,980 1,660 Other Financial Liabilities 47,949 27,369 13,616
61,928 31,349 15,276
Shareholders’ Equity At the close of 3Q 2017, shareholders’ equity totaled Bs 263,546 million, representing Bs 33,736 million (14.7%) quarter-over-quarter increase from Bs 229,810 million; compared to 3Q 2016 equity grew 285.9% from Bs 68,291 million. The 3Q 2017 variation is mainly due to Bs 34,346 million in net income for the period, among others.
Capital Ratios
Mercantil’s equity-to-assets ratio at September 30, 2017 is 5.4%, and its equity to risk-weighted assets ratio is 10.5%, based on the standards of the SUNAVAL (6.7% and 10.7% at September 30, 2016).
Mercantil Banco Universal, in accordance with the requirements of SUDEBAN, has an equity-to-assets ratio of 10.9% and an equity to risk-weighted assets ratio of 12.2% at September 30, 2017 (11.2% and 13.7% at September 30, 2016).
Mercantil Bank, N.A., based on the standards of the OCC, has an equity-to-assets ratio of 9.5% and an equity to risk-weighted assets of 12.3% at September 30, 2017 (9.2% and 12.4% at September 30, 2016).
The equity ratios of Mercantil and its subsidiaries exceed the regulatory minimums.
68,291
229,810
263,546
Sep. 2016 Jun. 2017 Sep. 2017
Evolution of Shareholders´Equity(In millions of Bolivars)
Δ +285.9%
Δ+14.7%
Capital StructureSeptember 2017
Capital stock 5%Capital reserve 1%Share premium 1%Traslation adjustments of net assets of subsidiaries abroad 2%Retained earnings 41%Unrealized gain fron adjustments of investments to market value 9%51%Remedición por plan de pensiones -1%
16
Contact: Investor Relations. Phone: 58-212-503.1335. e-mail: [email protected]. website: www.msf.com.
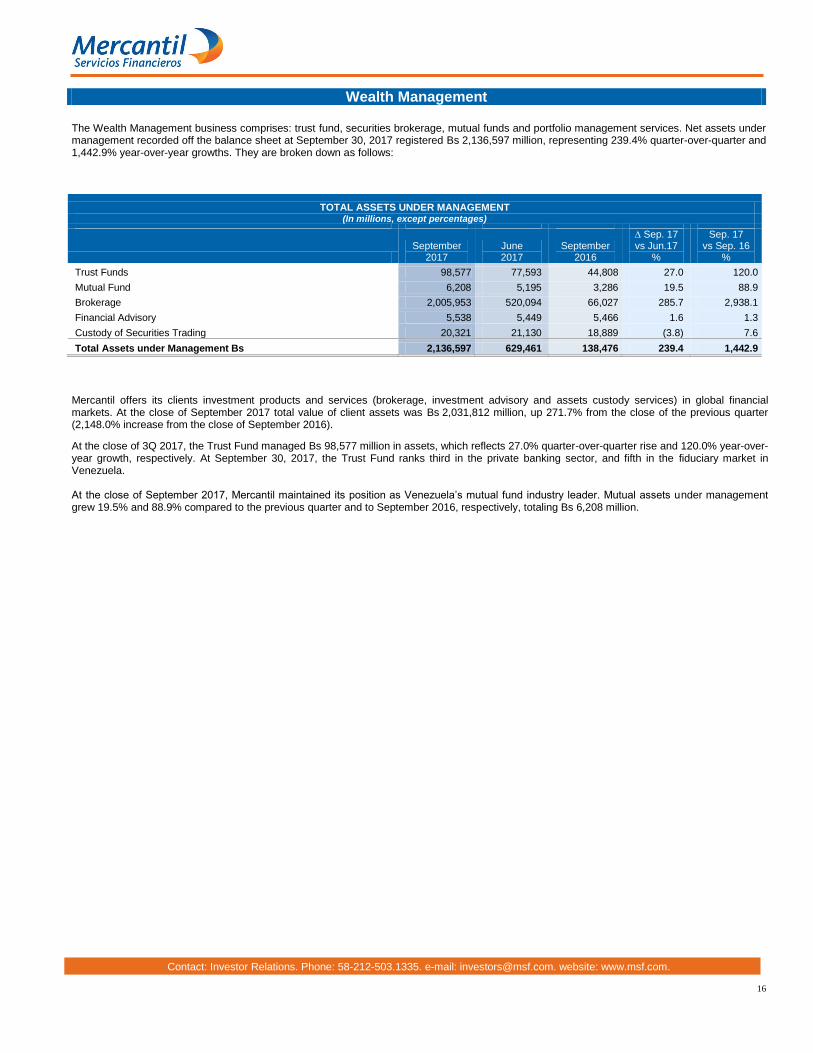
Wealth Management The Wealth Management business comprises: trust fund, securities brokerage, mutual funds and portfolio management services. Net assets under management recorded off the balance sheet at September 30, 2017 registered Bs 2,136,597 million, representing 239.4% quarter-over-quarter and 1,442.9% year-over-year growths. They are broken down as follows:
Mercantil offers its clients investment products and services (brokerage, investment advisory and assets custody services) in global financial markets. At the close of September 2017 total value of client assets was Bs 2,031,812 million, up 271.7% from the close of the previous quarter (2,148.0% increase from the close of September 2016).
At the close of 3Q 2017, the Trust Fund managed Bs 98,577 million in assets, which reflects 27.0% quarter-over-quarter rise and 120.0% year-over-year growth, respectively. At September 30, 2017, the Trust Fund ranks third in the private banking sector, and fifth in the fiduciary market in Venezuela. At the close of September 2017, Mercantil maintained its position as Venezuela’s mutual fund industry leader. Mutual assets under management grew 19.5% and 88.9% compared to the previous quarter and to September 2016, respectively, totaling Bs 6,208 million.
TOTAL ASSETS UNDER MANAGEMENT (In millions, except percentages)
September
2017 June 2017
September 2016
∆ Sep. 17 vs Jun.17
%
Sep. 17 vs Sep. 16
%
Trust Funds 98,577 77,593 44,808 27.0 120.0
Mutual Fund 6,208 5,195 3,286 19.5 88.9
Brokerage 2,005,953 520,094 66,027 285.7 2,938.1
Financial Advisory 5,538 5,449 5,466 1.6 1.3
Custody of Securities Trading 20,321 21,130 18,889 (3.8) 7.6
Total Assets under Management Bs 2,136,597 629,461 138,476 239.4 1,442.9

17
Contact: Investor Relations. Phone: 58-212-503.1335. e-mail: [email protected]. website: www.msf.com.
23,156 29,582 34,008 67,309 137,219
11.7%10.9%
9.4%
11.6%
16.6%
1.0%
3.0%
5.0%
7.0%
9.0%
11.0%
13.0%
15.0%
17.0%
0
20,000
40,000
60,000
80,000
100,000
120,000
140,000
160,000
3Q 2016 4Q 2016 1Q 2017 2Q 2017 3Q 2017
Net Interest Income
Net Interest Margin
8.3% 7.9%8.6% 8.3%
9.6%
Evolution of Net Interest Income
Operating Expenses / Average Total Assets
Summary of Subsidiaries’ performance according to their local Accounting Standards Mercantil Banco Universal Mercantil Banco Universal’s total assets grew Bs 1,968,251 million (76.9%) compared to June 2017. During 3Q 2017 the net loan portfolio grew Bs 833,678 million (67.1%) and total deposits increased by Bs 1,739,964 million (75.1%) to Bs 2,076,837 million and Bs 4,057,099 million, respectively. Loan portfolio quality remains favorable, with a ratio of past-due and non-performing loans to gross loans at 0.2%, compared to 0.1% of the Venezuelan financial system. Loan portfolio provision covers 1,375.2% of past-due and non-performing loans (1,346.2% at June 30, 2017). At September 30, 2017 the Mercantil Banco Universal subsidiary ranks fourth in the Venezuelan financial system in terms of total assets, with 9.1% of the market, the first institution holding 20.9% of the market, and the four main banks of the country 60.6% participation of the total financial system. Mercantil ranks second among Venezuelan private banks in terms of loans for the tourism sector with 8.1% of the market; it also ranks third in terms of loans for the agriculture and mortgage sectors, with 10.2% and 7.0% of the market, respectively. It is ranks fourth in loans for the manufacturing and microcredit sectors, with 4.0% and 5.6% market shares, respectively. Mercantil is the leading Venezuelan bank in terms of savings deposits with 17.0% of the market. Shareholders’ Equity grew Bs 57,566 million (38.2%) to Bs 208,133 million, compared to the previous quarter. This increase is mainly due to Bs 38,800 million in net quarterly income; Bs 19,001 million in non-capitalized equity contributions and Bs 235 million reduction from adjusting available-for-sale investments to their market value, among other. At September 30, 2017, the equity-to-assets ratio is 10.9% (minimum required 9%) and the equity to risk-weighted assets ratio is 12.2% (minimum required 12%), according to the standards of SUDEBAN. In 3Q 2017, net earnings totaled Bs 38,800 million representing Bs 35,337 million (1,020.4%) year-on-year increase, mainly due to Bs 114,063 million increase in net interest income resulting from the growth of financial assets and liabilities, Bs 48,852 million in net income from commissions on the use of credit and debit cards, as well as from other commissions from client operations; Bs 17,713 million in loan portfolio provision expenses; Bs 75,616 million rise in personnel and operating expenses; Bs 6,664 million in contributions to regulatory agencies and Bs 27,585 million increase in corporate tax expenses. Mercantil Banco Universal has made significant efforts to adapt its management and operational structure to the current environment. These have reduced the significant effects of inflation.
Mercantil C.A., Banco Universal Consolidated (In millions of Bolivars)
Sep. 2017
Jun. 2017
Sep. 2016
Total Assets 4,528,505 2,560,254 864,472 Investments Portfolio 281,930 132,782 91,394 Loan Portfolio 2,076,837 1,243,159 501,219 Deposits 4,057,099 2,317,135 781,720 Shareholders´ Equity 208,133 150,567 54,293 Net Income Quarter 38,800 14,644 3,463 Net Income 9 Months 58,969 11,559 Historic figures in accordance with the standards of SUDEBAN.

18
Contact: Investor Relations. Phone: 58-212-503.1335. e-mail: [email protected]. website: www.msf.com.
1.3% 1.2%1.0%
0.9%
0.6%
1.6%
2.2%
1.2% 1.2%
1.0%
12.8%
14.9%
8.8%9.7%
7.1%
0%
2%
4%
6%
8%
10%
12%
14%
16%
0%
1%
2%
3%
Sep. 2016 Dec. 2016 Mar. 2017 Jun. 2017 Sep. 2017
Assets Quality Ratios
NA(w/o Commitments) /Total Lns.
Total Class Lns /Total Lns.
Total Class+OREO /Tier 1+ALLL
Mercantil Bank, N.A. Total assets reached US$ 8,491 million, compared to US$ 8,543 million in June 2017 and US$ 8,457 million in September 2016. The net loan portfolio was US$ 6,032 million, US$ 37 million quarter-over-quarter rise and 6.5% year-on-year growth, respectively. At September 30, 2017 the Bank holds US$ 1,971 million (23.2% of total assets) mainly in short-term investments and securities issued by the U.S. Government or U.S. Government-backed agencies. The Bank’s deposits reached US$ 6,539 million at the close of September 2017, US$ 103 million (1.5%) quarter-over-quarter decrease and US$ 49 million (0.7%) year-on-year reduction. Non-performing assets (non-interest accruing loans and assets received in lieu of payment) declined US$ 16 million compared to June 2017. Non-performing assets accounted for 0.5% of total assets, compared to 0.6% in June 2017. The ratio of non-performing loans to total loans was 0.6% in September 2017, compared to 1.3% in 3Q 2016. The Bank’s equity at September 30, 2017 rose to US$ 815 million, up US$ 20 million from the previous quarter, which includes the quarter’s result of US$ 19 million, US$ 3 million increase from adjusting available-for-sale investments to their market value, and US$ 1.5 million from paid dividends. At September 30, 2017 the ratios of equity-to-assets, and equity to risk-weighted assets were 9.5% and 12.3%, respectively, based on the standards of the Office of the Comptroller of the Currency (OCC) (9.2% and 12.4%, respectively at September 30, 2016). Net earnings in 3Q 2017 totaled US$ 19 million, US$ 10 million (122.5%) up from 3Q 2016, mainly attributable to US$ 7 million increase in net interest income, US$ 16 million rise in commissions and other income, US$ 5 million increase in corporate tax expenses, and US$ 4 million reduction of the required loan portfolio provision, among others.
Mercantil Bank, N.A. Consolidated (In millions of US$)
Sep. 2017
Jun. 2017
Sep. 2016
Total Assets 8,491 8,543 8,457 Investments Portfolio 1,971 2,106 2,347 Loan Portfolio 6,032 5,995 5,665 Deposits 6,539 6,642 6,588 Shareholders´ Equity 815 795 785 Net Income Quarter 19 12 9 Net Income 9 Months 39 23 Figures presented according to accounting principles generally accepted in the United States (USGAAP)

19
Contact: Investor Relations. Phone: 58-212-503.1335. e-mail: [email protected]. website: www.msf.com.
20,872 28,863 37,412 47,098 67,852
3Q 2016 4Q 2016 1Q 2017 2Q 2017 3Q 2017
Evolution of Net Collected Premiums and Combined Ratio1
Net Collected Premiums
97.1%96.5%
95,6%
98,8%100.1%
80%
82%
84%
86%
88%
90%
92%
94%
96%
98%
100%
102%
104%
Combined Ratio
Mercantil Seguros Net collected premiums in 3Q 2017 totaled Bs 67,852 million, 225.1% up from Bs 20,872 million at the close of 3Q 2016. At the close of August 31, 2016, Mercantil ranked fourth in terms of net collected premiums in the country, with 8.1% of the market. Total assets reached to Bs 222,546 million at September 30, 2017, representing 12.2% quarter-over-quarter increase. The company’s shareholders’ equity amounted to Bs 94,572 million, meeting the statutory solvency requirements in place. The figures presented include all mandatory and voluntary reserves required to guarantee the company’s operations, including outstanding claims reserves and end-of-period payments. The Investment Portfolio at the close of September 30, 2017, totaled Bs 181,887 million, 4.6% up from the previous quarter. Total investments representing technical reserves reached Bs 81,416 million (14.9% quarter-over-quarter rise and 95.3% year-on-year increase), while liquidity levels amply meet all statutory requirements on commitments towards policyholders, insurance brokers and reinsurers. In 3Q 2017, the technical result closed at a negative Bs 66 million, with a combined operating ratio
1 of 100.1%. Net income for 3Q 2017
amounted to Bs 16,813 million (3,002.1% up from 3Q 2016). The claims ratio was 62.4% (62.6% in 2016).
1 Combined ratio = (incurred claims + commissions + operating expenses)/ earned premiums
Mercantil Seguros C.A. (In millions of Bolivars)
Sep. 2017
Jun. 2017
Sep. 2016
Total Assets 222,546 198,369 76,065 Investments suitable for representing 81,416 70,885 41,693 Investments not-suitable for representing Technical Reserves 100,471 102,958 18,884 Shareholders´ Equity 94,572 67,669 32,786 Net Income Quarter 16,813 11,078 542 Income net 9 Months 29,447 4,197 Premiums Received Quarter 67,852 47,098 20,872 Premiums Received 9 months 152,362 55,896 Historic figures in accordance with the standards of the Venezuelan Superintendency of Insurance Activity (Sudeseg)

20
Contact: Investor Relations. Phone: 58-212-503.1335. e-mail: [email protected]. website: www.msf.com.
Corporate Events Mercantil, C.A. Banco Universal’s Extraordinary General Shareholders’ Meeting In September 2017, Mercantil, C.A. Banco Universal’s Extraordinary General Shareholders’ Meeting approved the enhance of the company’s social capital up to a maximum of Bs 260,000,000 through the issuance of the corresponding non-bearer Class A and B shares, which nominal value is determined according to the Superintendency of Banking Sector Institutions’ authorization at the effective date on which the respective capital enhance is made. This issuance of shares will be a private offer, and will be executed within a maximum period of six (6) months from the date of this Meeting, in order to carry out the necessary capital increases efficiently, according to the real needs over time, arising from prevailing macroeconomic and accelerating growth conditions. Mercantil Banco made available the Tpago mobile network The Tpago app is a mobile service of the Venezuelan banks that allows individuals to make secure and trustworthy payments to other individuals in other banks, by simply registering the beneficiary’s personal ID and mobile telephone number, without the need to affiliate with third parties. The Tpago mobile network follows the new international trends of payments without the need for cash or checks, with high levels of security. Among its main advantages are: There is no need to know the account number of the beneficiary, funds are available immediately, the issuer of the payment receives a notification of the transaction that may be shared with the beneficiary, individuals can pay up to Bs 800,000 per day. To join, the client must log into Mercantil Personal Online Banking and access to the Additional Services section, selects Banca Móvil (Mobile Banking) option and enter Configurar Tpago (Tpago Setup). Once this process is performed, the client must download the Tpago app to a smartphone or tablet from the app store. Diners Club presents a new image and benefits in Venezuela The Diners Club credit card issued by Mercantil Banco presents a new image in Venezuela. The subsidiary incorporated, at the end of September, new benefits for the Diners Club credit card, such as the 60-month revolving credit, access to the parallel line Préstame (instant loan) according to the credit assessment, and the possibility to use it at more than 52,000 establishments nationwide affiliated to the Platco network. More than 1,800 businesses, clients of Mercantil Bank, benefit from the Mercantil Treasury Connect platform More than 1,800 U.S. businesses, that are clients of Mercantil Bank, enjoy the benefits of the new Mercantil Treasury Connect online platform of the financial institution. Mercantil Treasury Connect offers a range of features which translate into benefits such as: easy access to online banking with the one-time password authentication system, which eliminates the need for a physical Token; self-service capability to manage users, maintain contact points, set alerts, customize account names and reset password; optimization of the payment procedures; monitoring of transactions and customizable reports; configuration of multiple security levels for various transactions, establishment of alert centers to create and manage reporting, payments, fraud protection and administration.
New Measures Announced in the Venezuelan Finance Sector
The Venezuelan Central Bank announced the application of Article 1 of Exchange Agreement N° 34 to private sector individuals and businesses providing health services, and to non-resident individuals who export medical services The BCV, therefore, announced the following: i) payments received in foreign currency must be credited to foreign currency accounts in the national financial system, through transfers received from abroad, or when using credit or debit cards from foreign currency accounts or lines of credit; ii) these individuals and businesses may freely retain and manage up to 80% of the income received in foreign currency, to meet expenses, payments and other outlays required by their activities, including payment of taxes. The rest will be sold to the BCV at the DICOM exchange rate for the date of the operation, minus 0.25%. This sale must take place within the 5 business days following the end of the established term in the payment conditions agreed in the commercial or contractual relationship in question, which in no case may exceed 180 days; iii) in the case of a sale, it will take place at the bank receiving the foreign currency; iv) They must fill a declaration of the exporting activity and issue invoices in accordance with the provisions of the SENIAT (Servicio Integrado de Administración Aduanera y Tributaria –Tax and Customs Administration Service). The Office of the President exonerates from the payment of the ISLR the enrichments of businesses originating from Bonds issued by Bandes The Office of the President issued a Decree exonerating the ISLR payment from the enrichment obtained by businesses from Bonds issued by Bandes, maturing in the year 2022. The term for this benefit was established at five years, to be applied to the current fiscal year. SUDEBAN establishes guidelines for the calculation of the Total Capital Adequacy Ratio SUDEBAN indicated that, to calculate the Total Capital Adequacy Ratio, the Supplementary Capital (Level II) must include the amount corresponding to the adjustment from applying regulations on the revaluation of assets of banking institutions.

21
Contact: Investor Relations. Phone: 58-212-503.1335. e-mail: [email protected]. website: www.msf.com.
The BCV communicated the fees for the Interbank Mobile Payment service and reimbursement of operating costs of the Point-of-Sale network The BCV informed the maximum limits of the fees that banking institutions may charge for the Interbank Mobile Payment services, as well as for the reimbursement agreed upon with the affiliated businesses regarding costs generated for the technological infrastructure and inputs needed for the service of acquisition of payment transactions received through the point-of-sale network, as well as for repairs needed on those terminals. Interbank Mobile Payment fees are: a) for approved transactions up to 0.3% of the payment amount with a minimum commission of Bs 50, and b) for rejected or reversed transactions Bs 50 each. Similarly, for the reimbursement of operating costs a maximum of Bs 20,000 per month per installed point-of-sale terminal. SUDEBAN differs compliance of Risk Liquidity Ratio SUDEBAN differs compliance of Articles 24 to 31 of Resolution 136.15 "Rules relating to the adequate integral management of liquidity risk of Banks", specifically with regard to the Liquidity Risk Ratio (RRL). This deferral will apply from January 2 of the current year until January 2, 2018. SUDEBAN issues the “Rules relating to the Application of the Second Phase of Revaluation of Assets in Banking Institutions" SUDEBAN issued a Resolution with the guidelines that Banking Institutions must consider for the application of the second phase of the revaluation of assets. Among other aspects, it indicates that: i) the request must include a plan explaining the reasons of the second phase execution, the fixed assets to be revalued, amounts and accounting items affected, and amount of the revaluation, among others; ii) fixed assets recorded as Group 170 “Fixed Assets” (land, works in execution, and other assets); iii) the value must be determined by duly accredited appraisal experts; iv) the amount of the revaluation cannot exceed the Level I primary capital; and v) the revaluation will be made based on the financial statements of June 30, 2017. The Office of the President reduces the General Tax Rate of the Value Added Tax (VAT) applicable to Transactions paid through Electronic Channels The Office of the President issued a Decree in which it establishes a reduction of 3 percentage point of VAT to sales of movable assets and services to individuals and businesses up to Bs 2,000,000 if they are paid using electronic channels exclusively, and 5 percentage point reduction to operations for more than Bs 2,000,000. Reductions will not apply when payments using electronic channels are combined with other payment methods. The BCV established the legal reserves to be deposited by banking institutions that have acquired “2018 BANDES Agriculture Certificates of Participation” The BCV issued a Resolution establishing that Banks will deduct from the corresponding legal reserves an amount equivalent to that settled by each banking institution on the occasion of the acquisition of the 2018 BANDES Agriculture Certificates of Participation in the primary market and up to the business day before their maturity.
Awards and Acknowledgements Mercantil Servicios Financieros among the Top 1000 World's Financial Institutions The Banker magazine included Mercantil Servicios Financieros in its Top 1000 World's Financial Institutions. Mercantil Servicios Financieros ranked 177
th, one level up from the previous year.
Mercantil Banco Universal received the 2017 Best Venezuelan Bank award The renowned financial publication Euromoney recognized Mercantil Banco Universal as the “Best Bank in Venezuela” in 2017. The financial institution earned this distinction mainly by its current outlook, centered in the long-term opportunities that the country might represents and its ability to control costs through its focus on digital operations. The award was received in the annual meeting of the Board of Governors of the International Monetary Fund and of the World Bank Group, with took place in Washington, DC, U.S., from October 9
th to October 15
th.

22
Contact: Investor Relations. Phone: 58-212-503.1335. e-mail: [email protected]. website: www.msf.com.
APPENDIX I
Summary of the Accounting Principles used to prepare the Financial Statements
Financial statements are presented in accordance with the accounting standards of the SUNAVAL, in bolivars. A summary of some of the main accounting principles applied is given below:
Investment Portfolio Securities Held for Trading - Unrealized gains or losses resulting from differences in market value due to market fluctuations are included in the results for the period. Available-for-Sale Securities – Recorded at their market value. Unrealized gains or losses resulting from differences in market value and exchange rate fluctuations are included in shareholders’ equity. Held-to-Maturity Securities – Recorded at their acquisition cost, adjusted for amortization of premiums or discounts. For all portfolio investments, permanent losses in market value are recorded as a charge to income in the period in which they occur. Permanent investments – are investments that represent 20% to 50% stock ownership. Those greater than 50% are recorded as an equity interest and consolidated, except when control is likely to be temporary.
Loan Portfolio Loans are classified as overdue 30 days after their maturity. Allowances for loan portfolio losses are determined through a collectability assessment that quantifies the amount that must be set aside for each loan. These assessments take into account such aspects as economic conditions, credit risk by customer, credit history and the collateral received. When assessing loans for small amounts of the same nature, these are grouped together to determine the provisions required. Recognition of income and expenditure Income, costs and expenses are recorded as they are earned or incurred. Interest earned on past-due loan portfolios is recorded as income when collected. Fluctuations in the market value of derivatives are recognized as income in the period in which they occur. Insurance premiums are recorded as income when earned. Consolidation The consolidated financial statements include the accounts of Mercantil and its more than 50%-owned subsidiaries and other institutions in which Mercantil has a controlling interest. See the principal subsidiaries on page 4 and the conciliation of its accounting standards with SUNAVAL regulations on pages 4. Inflation Adjustment According to SUNAVAL standards, Mercantil’s financial statements, as of December 31, 1999 must be presented in historic figures. Since then Mercantil has ceased to adjust for inflation in its primary financial statements. As a result, fixed and other assets are shown at their inflation-adjusted value up to December 31, 1999. The market value determined by independent assessments is higher than the inflation cost adjusted for inflation indicated above. New additions are being recorded at their acquisition value. Assets and liability in foreign currency Transactions and balances in foreign currency are translated according to the best estimate of the expectations of the future flows of bolivars obtained, making use of mechanisms legally established, see Appendix V. Main differences between the accounting standards of SUNAVAL and the accounting standards of other subsidiaries
The main accounting differences for the reconciliation of items under SUNAVAL and SUDEBAN for Mercantil Servicios Financieros are:
Amortization of premiums or discounts of securities carried out on a straight-line basis under SUDEBAN standards and in accordance with the constant amortization rate under SUNAVAL standards.
Foreign exchange rate fluctuations are recorded in the results, with the exception of those that SUDEBAN indicates to be included in equity and are subsequently recorded in the results when SUDEBAN authorized.
The main accounting differences for Mercantil Servicios Financieros between the SUNAVAL standards and the USGAAP are:
Deferred Income Tax: USGAAP allows deferred tax to be recognized for the total amount of loan portfolio loss allowances, while SUNAVAL standards only allow recognition of allowances for loans classified as high risk and unrecoverable.
Provision for assets received in lieu of payment: SUNAVAL standards stipulate that 100% allowance for real estate property received in lieu of payment after one year from the date of incorporation; under IFRS no amortization deadlines are established (See reconciliation SUNAVAL to USGAAP, p. 34).

23
Contact: Investor Relations. Phone: 58-212-503.1335. e-mail: [email protected]. website: www.msf.com.
APPENDIX II
MERCANTIL SERVICIOS FINANCIEROS, C.A. CONSOLIDATED BALANCE SHEET
UNAUDITED FIGURES
(In millions of Bolivars, except percentages)
∆ ∆
September June September Sep. 17 vs Jun. 17 Sep. 17 vs Sep. 16
2017 2017 2016 Bolivars % Bolivars %
CASH AND DUE FROM BANKS
Cash 14,242 33,131 6,980 (18,889) (57.0) 7,262 104.0
Venezuelan Central Bank 1,910,228 972,680 209,871 937,548 96.4 1,700,357 810.2
Venezuelan Banks and Other Financial Institutions 12,255 10,991 212 1,264 11.5 12,043 5,680.7
Foreign Banks and Other Financial Institutions 2,880 2,155 2,415 725 33.6 465 19.3
Pending Cash Items 73,403 49,488 19,865 23,915 48.3 53,538 269.5
2,013,008 1,068,445 239,343 944,563 88.4 1,773,665 741.1
INVESTMENT PORTFOLIO
Investments in Trading Securities 409 729 658 (320) (43.9) (249) (37.8)
Investments in Securities Available for Sale 75,836 72,802 48,500 3,034 4.2 27,336 56.4
Investments in Securities Held to Maturity 214,937 69,553 62,484 145,384 209.0 152,453 244.0
Share Trading Portfolio 3,808 1,691 763 2,117 125.2 3,045 399.1
Investments in Time Deposits and Placements 33,732 35,040 22,616 (1,308) (3.7) 11,116 49.2
Restricted Investments 3,663 3,332 3,106 331 9.9 557 17.9
332,385 183,147 138,127 149,238 81.5 194,258 140.6
DIRECT PRODUCTIVE ASSETS 5,199 18,123 0 (12,924) (71.3) 5,199 100.0
LOAN PORTFOLIO
Current 2,189,262 1,321,415 575,724 867,847 65.7 1,613,538 280.3
Rescheduled 823 1,121 763 (298) (26.6) 60 7.9
Past Due 4,029 3,112 1,938 917 29.5 2,091 107.9
Litigation 573 136 120 437 321.3 453 377.5
2,194,687 1,325,784 578,545 868,903 65.5 1,616,142 279.3
Allowance for Losses on Loan Portfolio (58,605) (37,344) (17,325) (21,261) 56.9 (41,280) 238.3
2,136,082 1,288,440 561,220 847,642 65.8 1,574,862 280.6
INTEREST AND COMMISSIONS RECEIVABLE 20,459 12,664 6,878 7,795 61.6 13,581 197.5
LONG-TERM INVESTMENTS 5,018 4,966 4,301 52 1.0 717 16.7
ASSETS AVAILABLE FOR SALE 5,848 2,142 1,536 3,706 173.0 4,312 280.7
PROPERTY AND EQUIPMENT 233,232 234,676 6,683 (1,444) (0.6) 226,549 3,389.9
OTHER ASSETS 143,466 89,355 45,231 54,111 60.6 98,235 217.2
TOTAL ASSETS 4,894,697 2,901,958 1,003,319 1,992,739 68.7 3,891,378 387.9

24
Contact: Investor Relations. Phone: 58-212-503.1335. e-mail: [email protected]. website: www.msf.com.
APPENDIX II
MERCANTIL SERVICIOS FINANCIEROS, C.A.
CONSOLIDATED BALANCE SHEET UNAUDITED FIGURES
(In millions of Bolivars, except percentages)
∆ ∆
September June September Jun. 17 vs Mar. 17 Jun. 17 vs Jun. 16
2017 2017 2016 Bolivars % Bolivars %
DEPOSITS
Non-interest Bearing 2,728,642 1,538,667 346,177 1,189,975 77.3 2,382,465 688.2
Interest-Bearing 551,274 343,985 286,723 207,289 60.3 264,551 92.3
Savings Deposits 762,792 440,379 189,901 322,413 73.2 572,891 301.7
Time Deposits 24,623 23,603 21,174 1,020 4.3 3,449 16.3
4,067,331 2,346,634 843,975 1,720,697 73.3 3,223,356 381.9
DEPOSITS AUTHORIZED BY THE VENEZUELAN SECURITIES AND EXCHANGE COMMISSION
12,873 2,874 533 9,999 347.9 12,340 2,315.2 Publicly Traded Debt Securities Issued
FINANCIAL LIABILITIES 47,949 27,369 13,616 20,580 75.2 34,333 252.2 INTEREST AND COMMISSION PAYABLE 272 132 203 140 106.1 69 34.0
OTHER LIABILITIES 501,472 293,984 75,540 207,488 70.6 425,932 563.8
SUBORDINATED DEBT 1,106 1,106 1,127 0 0 (21) (1.9)
TOTAL LIABILITIES 4,631,003 2,672,099 934,994 1,958,904 73.3 3,696,009 395.3
MINORITY INTEREST IN CONSOLIDATED SUBSIDIARIES 148 49 34 99 202 114 335.3
SHAREHOLDERS’ EQUITY
Paid in Capital 13,095 13,095 681 0 0 12,414 1,822.9
Capital Inflation Adjustment 192 192 192 0 0 0 0
Share Premium 299 299 12,713 0 0 (12,414) (97.6)
Capital Reserves 1,174 1,174 167 0 0 1,007 603.0 Translation Adjustments of net Assets of Subsidiaries Abroad 6,396 6,403 6,399 (7) (0.1) (3) 0
Retained Earnings 107,913 72,723 47,568 35,190 48.4 60,345 126.9
Shares repurchased and held by Subsidiary (1,428) (659) (601) (769) 116.7 (827) 137.6
Pension Plan Remeasurement (1,878) (1,878) (505) 0 0 (1,373) 271.9
Surplus on Revaluation of Fixed Assets 134,631 135,475 0 (844) (0.6) 134,631 100.0
Unrealized Gain (Loss) from Adjustment on Investments Available for Sale to Market Value 3,152 2,986 1,677 166 5.6 1,475 88.0
TOTAL SHAREHOLDERS´ EQUITY 263,546 229,810 68,291 33,736 14.7 195,255 285.9
TOTAL LIABILITIES AND SHAREHOLDERS´ EQUITY 4,894,697 2,901,958 1,003,319 1,992,739 68.7 3,891,378 387.9

25
Contact: Investor Relations. Phone: 58-212-503.1335. e-mail: [email protected]. website: www.msf.com.
APPENDIX II
MERCANTIL SERVICIOS FINANCIEROS. C.A. CONSOLIDATED INCOME STATEMENT
UNAUDITED FIGURES (In millions of Bolivars, except percentages)
Quarters ∆
9 Months
∆ Ended on Ended on
Sep. Sep. Sep. Sep. 2017 2016 Bolivars % 2017 2016 Bolivars %
Income from Cash and Due from Banks 116 297 (181) (60.9) 242 972 (730) (75.1)
Income from Investment Securities 4,141 2,105 2,036 96.7 9,313 5,740 3,573 62.2
Income from Loan Portfolio 151,667 29,416 122,251 415.6 268,768 72,398 196,370 271.2
Income from Direct Productive Assets 499 0 499 100.0 977 0 977 100.0
INTEREST INCOME 156,423 31,818 124,605 391.6 279,300 79,110 200,190 253.1
Interest for Demand and Savings Deposits 17,866 7,083 10,783 152.2 37,909 19,613 18,296 93.3
Interest for Time Deposits 86 70 16 22.9 239 189 50 26.5
Interest for Securities Issued by the Bank 336 28 308 1,100.0 432 92 340 369.6
Interest on Financial Liabilities 1,547 252 1,295 513.9 2,724 885 1,839 207.8
INTEREST EXPENSE 19,835 7,433 12,403 166.9 41,303 20,779 20,525 98.8
NET INTEREST INCOME 136,588 24,385 112,203 460.1 237,995 58,332 179,663 308.0
Allowance for losses on loan portfolio and commissions receivable 22,075 4,349 17,726 407.6 40,267 8,149 32,118 394.1
NET FINANCIAL MARGIN 114,513 20,036 94,477 471.5 197,728 50,183 147,545 294.0
Trust Fund Operations 364 140 224 160.0 878 338 540 159.8
Foreign Currency Transactions 7 19 (12) (63.2) 117 33 84 254.5
Commissions on Transactions 20,180 2,684 17,496 651.9 35,748 5,780 29,968 518.5 Commissions on Letters of Credit and Guarantees Granted 5 6 (1) (16.7) 12 19 (7) (36.8)
Equity in Long-Term Investments 69 174 (105) (60.3) 628 203 425 209.4
Exchange Gains and Losses 163 28 135 482.1 32 888 (856) (96.4)
Income (Loss) on Sale of Investment Securities 1,718 (109) 1,827 1,676.1 2,187 596 1,591 266.9
Other Income 39,700 5,407 34,293 634.2 69,199 15,380 53,819 349.9
TOTAL COMMISSIONS AND OTHER INCOME 62,206 8,349 53,857 645.1 108,802 23,237 85,564 368.2
Total insures premiums, net of claims 7,661 3,885 3,776 97.2 20,804 7,853 12,951 164.9
OPERATING INCOME 184,380 32,270 152,110 471.4 327,334 81,273 246,060 302.8
Salaries and employee benefits 30,583 7,236 23,347 322.7 61,095 17,342 43,753 252.3 Depreciation, Property and Equipment Expenses, Amortization of Intangibles and Others 14,264 3,795 10,469 275.9 29,130 8,562 20,568 240.2
Fees paid to regulatory agencies 10,969 3,111 7,858 252.6 23,042 8,104 14,938 184.3
Other operating expenses 64,237 12,097 52,140 431.0 120,985 29,908 91,077 304.5
TOTAL OPERATING EXPENSES 120,053 26,239 93,814 357.5 234,252 63,916 170,336 266.5
INCOME BEFORE TAXES AND MINORITY INTEREST 64,327 6,031 58,296 966.6 93,082 17,356 75,724 436.3
Total Taxes 29,959 3,218 26,741 831.0 38,557 7,776 30,781 (395.8)
Minority Interests (22) (2) (20) (1,000.0) (34) (7) (27) (386.0)
NET INCOME 34,346 2,811 31,535 1,121.9 54,491 9,573 44,918 469.2

26
Contact: Investor Relations. Phone: 58-212-503.1335. e-mail: [email protected]. website: www.msf.com.
1 Includes: Cash and Cash Equivalents, Cash and Due from banks, Investments in time deposits and placements within 90 days maturity.
APPENDIX II
MERCANTIL SERVICIOS FINANCIEROS. C.A. CONSOLIDATED STATEMENT OF CASH FLOWS
UNAUDITED FIGURES (In Millions of Bolivars)
Quarter ended on 9 Months ended on
September
2017 September
2016 September
2017 September
2016
CASH FLOWS FROM OPERATING ACTIVITIES
Net income 34,346 2,811 54,491 9,573
Adjustments to reconcile net income to net cash provided
Operating activities -
Allowance for losses on the loan portfolio 22,049 4,349 40,241 8,149
Net foreign exchange gain - 0 - 860 Depreciation and amortization 2,412 694 4,480 1,864 Amortization of assets available for sale 13 (1,297) 41 (1,297) Pension Plan Remeasurement - - - -
Provision for interest receivable and other assets 70 88 407 615
Gain on equity in long-term investment (69) (174) (628) (203)
Minority interest expense 22 2 34 7
Deferred Income Tax 1,292 258 (59) 230
Accrual for employee termination benefits 4,728 1,200 9,335 2,974 Payment of employee termination benefits (3,993) (1,267) (7,584) (2,615) Net change in operating assets and liabilities -
Interest and commissions receivables (7,795) (525) (11,994) (1,710)
Interest and commissions payables 140 (13) 157 31
Available for sale and other assets (41,650) (7,528) (99,451) (20,048)
Other liabilities 206,898 11,584 387,133 29,499
Net cash provided by operating activities 218,464 10,181 376,603 26,200
CASH FLOWS FROM INVESTING ACTIVITIES
Net change in investments securities (159,885) (9,458) (141,271) (17,222) Net change in Long-Term Investments 30 0 470 (2,325) Loans granted (1,440,008) (282,470) (2,729,232) (495,332) Loans collected 565,207 164,320 1,203,161 291,704
Additions to fixed assets, net of depreciation and write-offs (1,319) (99) (92,959) (1,731)
Net cash flows from investing activities (1,035,978) (127,707) (1,759,832) (224,905)
CASH FLOWS FROM FINANCING ACTIVITIES
Net change in
Deposits 1,720,698 157,786 2,785,684 283,702
Short-term financial liabilities 20,191 1,448 32,492 1,326 Publicly Traded Debt Securities Issued 10,000 (345) 12,172 (355) Debt securities by Mercantil 0 0 (21) 0 Long-term financial liabilities received 150 (1) 299 944
Long-term financial liabilities paid (150) 1 599 3
Cash dividends 0 0 (1,250) (1,596)
Capital Increase 0 0 0 17
Repurchased shares (769) 0 (22,563) (366)
Net cash flows from financing activities 1,750,119 158,888 2,807,412 296,389
CASH AND CASH EQUIVALENTS1
Net increase for the period 932,606 41,362 1,424,183 97,684 At the beginning of the period 1,093,575 220,593 601,998 163,057
At the end of the period 2,026,181 261,954 2,026,181 261,954

27
Contact: Investor Relations. Phone: 58-212-503.1335. e-mail: [email protected]. website: www.msf.com.
APPENDIX II
MERCANTIL SERVICIOS FINANCIEROS. C.A. Statement of Shareholders’ Equity
UNAUDITED FIGURES
(In millions of Bolivars)
Shares repurchased
held by subsidiary
Pension Plans
Remeasure-ment
Unrealized Gain
(loss) from adjustments
on investments Available for
sale to market value
Total Capital stock
Capital inflation
adjustment Share
Premium Capital
Reserves
Translation adjustment
of the assets in
subsidiaries Abroad
Retained earnings
Surplus on Revaluation
of Fixed Assets
Balance as of September 30, 2016 681 192 12,713 167 6,398 47,568 (601) (505) 1,679 - 68,292
Net income 8,462 8,462
Pension Plans Remeasurement (1,373) (1,373)
Share repurchased (15) (15) Unrealized income on Investments available for sale 50
50
Cash dividends 10 10 Translation effect of net assets in subsidiaries abroad (22)
(22)
Balance as of December 31, 2016 681 192 12,713 167 6,376 56,040 (616) (1,878) 1,729 - 75,404
Net income 4,968 4,968
Capital Increase 12,414 (12,414) -
Share repurchased (1) (1) Unrealized income on Investments available for sale 304
304
Cash dividends (2,516) (2,516) Translation effect of net assets in subsidiaries abroad 9
9
Balance as of March 31, 2017 13,095 192 299 167 6,385 58,492 (617) (1,878) 2,033 - 78,168
Net income 15,176 15,176
Capital reserves 1,007 (1,007) -
Share repurchased (42) (42) Unrealized income on Investments available for sale 953 953
Cash dividends 62 62
Surplus on Revaluation of Fixed Assets 135,475 135,475 Translation effect of net assets in subsidiaries abroad 18 18
Balance as of June 30, 2017 13,095 192 299 1,174 6,403 72,723 (659) (1,878) 2,986 135,475 229,810
Net income 34,346 34,346
Share repurchased (22,520) (22,520) Unrealized income on Investments available for sale 21,917 21,917 Amortization of the surplus of fixed assets revaluation 844 (844) - Translation effect of net assets in subsidiaries abroad (7) (7)
Balance as of September 30, 2017 13,095 192 299 1,174 6,396 107,913 (23,179) (1,878) 24,903 134,631 263,546

28
Contact: Investor Relations. Phone: 58-212-503.1335. e-mail: [email protected]. website: www.msf.com.
APPENDIX III
MERCANTIL SERVICIOS FINANCIEROS. C.A.
Consolidated Loan Portfolio by Classification
(In millions of Bolivars, except percentages)
By Economic Activity September
2017 % June 2017 %
September 2016 %
Commercial 1,158,875 52.7 662,694 49.9 254,152 43.9
Credit Cards 458,553 20.9 244,554 18.4 96,255 16.6
Agricultural 303,823 13.8 218,601 16.5 96,458 16.7
Industrial 61,283 2.8 50,555 3.8 38,005 5.6
Services 123,076 5.6 68,693 5.2 32,547 6.6
Residential mortgage 20,109 0.9 16,882 1.3 12,343 0.4
Foreign trade 2,429 0.1 2,738 0.2 2,141 2.1
Construction 9,350 0.4 8,183 0.6 7,156 1.2
Car loans 18,655 0.8 16,933 1.3 10,755 1.9
Other 38,535 2.0 35,951 2.8 28,731 5.0
2,194,687 100.0 1,325,784 100.0 578,545 100.0
By Maturity September
2017 % June 2017 %
September 2016 %
Up to six months 1,329,591 60.6 525,226 39.6 197,095 29.4
Six months to one year 538,812 24.6 489,237 36.9 145,096 27.6
One to two years 86,224 3.9 97,446 7.4 69,086 11.2
Two to three years 80,437 3.7 65,221 4.9 42,093 9.1
Three to four years 33,999 1.5 36,465 2.8 28,431 4.4
Four to five years 30,470 1.4 21,688 1.6 17,559 3.6
Over five years 95,154 4.3 90,501 6.8 79,185 14.7
2,194,687 100.0 1,325,784 100.0 578,545 100.0
By Geographical Location of the Debtor September
2017 % June 2017 %
September 2016 %
Venezuela 2,131,854 97.0 1,263,969 95.2 520,376 89.8
United States of America 52,674 2.4 52,444 4.0 47,675 8.2
Mexico 172 0.0 445 0.0 785 0.1
Colombia 1,270 0.1 1,034 0.1 806 0.1
Brazil 1,040 0.0 1,120 0.1 897 0.2
Switzerland 1,025 0.0 1,000 0.1 1,276 0.2
Peru 353 0.0 304 0.0 1,020 0.2
Other countries 6,300 0.5 5,468 0.5 5,710 1.1
2,194,687 100.0 1,325,784 100.0 578,545 100.0
By Type of Risk September
2017 % June 2017 %
September 2016 %
Normal 2,185,928 99.7% 1,317,217 99.4 570,083 98.5
Potential 3,244 0.1% 2,989 0.2 3,269 0.6
Real 3,214 0.1% 3,483 0.3 3,360 0.6
High 1,875 0.1% 1,784 0.1 1,596 0.3
Unrecoverable 426 0.0% 311 0.0 238 0.0 2,194,687 100.0 1,325,784 100.0 578,545 100.0

29
Contact: Investor Relations. Phone: 58-212-503.1335. e-mail: [email protected]. website: www.msf.com.
APPENDIX IV
Statutory percentage of loan portfolio in Venezuela by Sector of the Economy and Interest Rates
September
2017
September
2017
Sector Percentages of compliance
% of Compliance
Reached
% of Compliance
required
Interest Rates
Agriculture
Calculated on the gross loan portfolio as of June 30, 2017. Monthly Compliance. The portfolio must be quarterly classified among areas: Vegetable (short-term) 63%, Vegetable (medium and long-term) 5%, Ruminants 7%, Poultry and Pork 8%, Fisheries and Aquaculture 5%, Mechanization 10% and Rural Box Programs 2%. A maximum of 24% should be earmarked for medium and long-term loans.
23.74% 17.0%
Set by the Venezuelan Central Bank. The maximum is 13%.
Mortgage
Calculated on the gross loan portfolio at 12/31/2016, distributed as follows: 6% for home purchase, 1% for self-construction, improvements and expansion, and 13% for self-construction. Annual Compliance.
2.67%
Set by the Housing and Habitat Ministry. Set in accordance with family income of debtors, ranging between 4.66% and 10.66%.
Microcredits
3% calculated on the gross loan portfolio at 06/30/2017. Monthly Compliance
3.55% 3.0%
Within minimum and maximum rates established by the Venezuelan Central Bank. At 09/30/2017 the rate cannot be higher than 24%.
Tourism
Calculated on the average gross loans at 12/31/2016 and 12/31/2015. The Tourism Ministry set in 5.25% the percentage that full service banks have to earmark to the tourism sector in 2017. Compliance must be achieved at 12/31/2017.
5.89%1
The Venezuelan Central Bank establishes a preferential rate for the sector on a monthly basis. As of 09/30/2017, the maximum rate is 11.54% and, in some cases, could be decreased in 3 bps (minimum 8.54%) in accordance with the Law for Tourism Loans.
Manufacturing
10% calculated on the gross loan portfolio at 12/31/2016. The percentage of compliance must be earmarked to strategic development sectors in 60% and to the financing of SME, joint ventures, community and state-owned companies in 40%. Annual compliance. On December 2017, 10% must be maintain.
9.97%
Set by the Venezuelan Central Bank at 18%. For SME, state-owned industries, community industries and joint ventures, the applicable interest rate may not exceed 90% of the rate set by the Venezuelan Central Bank. At 09/30/2017 this is equivalent to 16.2%.
1 Includes Bs 207 million in Class "B" shares of the company guaranteeing the loans of tourism SMEs "Sociedad de Garantías Recíprocas para la Pequeña y Mediana empresa " applicable for
compliance with the tourism portfolio.

30
Contact: Investor Relations. Phone: 58-212-503.1335. e-mail: [email protected]. website: www.msf.com.
0
10,000
20,000
30,000
40,000
50,000
60,000
70,000
80,000
90,000
100,000
110,000
120,000
130,000
140,000
150,000
160,000
170,000
180,000
190,000
200,000
Sep-16 Dec-16 Mar-17 Jun-17 Sep-17
Market Quote Mercantil Class A and Class B Shares vs. Caracas Stock Exchange (CSE) Index
Price MVZ/A Adjusted CSE Price MVZ/B
APPENDIX V
Stock Performance
Quarter Ended on
9 Months Ended on
September 2017
September 2016
September 2017
September 2016
Net income in millions of Bolivars 34,346 2,811 54,491 9,573
Mercantil’s stock indicators
Class A share:
Number of outstanding shares (Issued shares minus repurchased shares) 60,880,929 60,880,929 60,880,929
Market Price Bs 185,000.00 5,200.00 5,200.00
Average daily volume (# of shares) 3,986 1,818 5,046 1,818
Market Price / Book value per share 73.5 8.0 8.0
Market Price / Period Net Earnings per share 550.0 188.9 346.7 188.9
Class B share:
Number of outstanding shares (Issued shares minus repurchased shares) 43,880,032 43,880,032 43,880,032
Market Price Bs 185,000,00 5,150,00 5,150,00
Average daily volume (# of shares) 6,736 1,349 4,851 1,349
Market Price / Book value per share 73.5 7.9 7.9
Market Price / Period Net Earnings per share 550.0 187.1 346.7 187.1
Book value per share in Bs (Equity / # of outstanding shares)1 2,515.70 651.88 651.88
Total weighted outstanding shares 102,105,393 102,111,320 102,106,682 101,011,543
Earnings per share (Net Result / weighted outstanding shares) 336.38 27.53 533.66 27.53
1 Issued shares minus repurchased shares

31
Contact: Investor Relations. Phone: 58-212-503.1335. e-mail: [email protected]. website: www.msf.com.
APPENDIX V
Quarter Ended on
9 Months Ended on
September 2017
September 2016
September 2017
September 2016
Balance Structure indicators
Gross Loans/Deposits 54.0% 68.6%
Profitability Ratios (%):
Net Interest Income / Average Financial Assets (NIM) 39.6% 17.6% 27.1% 15.0%
Commissions and other income / Total income 33.8% 33.4% 31.3% 34.4%
Return on average assets (ROA) 5.3% 1.4% 3.4% 1.6%
Return on average equity (ROE) 94.7% 19.1% 61.2% 21.1%
Efficiency Ratios (%):
Operating expenses / Average total assets 16.9% 11.7% 12.4% 10.0%
Operating expenses / Total income 52.8% 63.2% 58.7% 62.6%
Liquidity Ratios (%):
Cash and due from banks / Deposits 49.5% 28.4%
Cash and due from banks and Investments Portfolio / Deposits 57.7% 44.7%
Asset Quality Ratios (%):
Non-performing loans/ Gross loans 0.2% 0.4%
Allowance for loan losses / Non-performing loans 1,273.5% 842.1%
Allowance for loan losses / Gross loans 2.7% 3.0%
Capital Adequacy Ratios (%):
Shareholders equity / Assets 5.4% 6.8%
SUNAVAL-Risk based capital (minimum required 8%) 10.5% 10.7%
Number of employees
Employees in Venezuela 6,472 7,510
Employees Abroad 1,092 1,101
Distribution network
Branches in Venezuela 264 293
Bank branches 240 264
Insurance branches 24 29
Branches Abroad 33 36
Representative Offices 4 5
Number of ATMs 1,094 1,218
Number of points of sale (POS) 50,793 52,619
Mercantil Aliado Network:
Correspondent Desk - 72
Correspondent Trading Points 216 103
Exchange and inflation rates
Exchange rate Bs/US$1 (Controlled since February 2003) 9.975 9.975
Average Exchange Rate for the quarter (Bs/US$1) 9.975 9.975 9.975 9.1548
Summary of Financial Ratios

32
Contact: Investor Relations. Phone: 58-212-503.1335. e-mail: [email protected]. website: www.msf.com.
APPENDIX VI
MERCANTIL C.A. BANCO UNIVERSAL
According to rules issued by SUNAVAL 1 UNAUDITED CONSOLIDATED FIGURES
(In millions of Bolivars, except percentages)
∆ ∆
September June September Sep. 17 vs. Jun. 17 Sep. 17 vs. Sep. 16
2017 2017 2016 Bolivars % Bolivars %
SUMMARY OF BALANCE SHEET ASSETS Cash and Cash Equivalents 1,998,338 1,055,591 236,928 942,747 89.3 1,761,410 743.4 Investments Portfolio 737,758 254,280 104,328 483,478 190.1 633,430 607.2 Loan Portfolio 2,071,726 1,225,098 501,226 846,628 69.1 1,570,500 313.3 Properties and Equipment and Other Assets 304,594 84,127 34,335 220,467 262.1 270,258 787.1
TOTAL ASSETS 5,112,416 2,619,096 876,818 2,493,320 95.2 4,235,598 483.1
LIABILITIES AND SHAREHOLDERS'EQUITY Deposits 4,008,848 2,280,333 776,407 1,728,515 75.8 3,232,441 416.3 Financial Liabilities and Other Liabilities 387,774 129,914 33,935 257,860 198.5 353,839 1042.7
TOTAL LIABILITIES 4,396,622 2,410,247 810,342 1,986,375 82.4 3,586,280 442.6
SHAREHOLDERS´ EQUITY 715,794 208,849 66,476 506,945 242.7 649,318 976.8
TOTAL LIABILITIES AND SHAREHOLDERS' EQUITY 5,112,416 2,619,096 876,818 2,493,320 95.2 4,235,598 483.1
Quarter
9 Months
Ended on ∆ Ended on ∆
Sep. 2017
Sep. 2016 Bolivars %
Sep. 2017
Sep. 2016 Bolivars %
SUMMARY OF INCOME STATEMENT 154,640 30,501 124,139 407.0 274,867 75,469 199,398 264.2 Interest Income
Interest Expense 18,266 7,242 11,024 152.2 38,424 19,876 18,548 93.3
Net Interest Income 136,374 23,260 113,115 486.3 236,443 55,593 180,850 325.3 Provision for Losses on Loan Portfolio 22,034 4,316 17,718 410.5 40,153 7,990 32,163 402.5
Net Financial Margin 114,340 18,943 95,397 503.6 196,290 47,603 148,687 312.3 Commissions and Other Income 58,047 7,353 50,694 689.4 100,307 20,023 80,284 401.0
Operating Income 172,387 26,297 146,091 555.6 296,597 67,626 228,971 338.6 Operating Expenses 104,316 20,855 83,461 400.2 199,046 49,797 149,249 299.7
Income before taxes 68,071 5,442 62,630 1,151.1 97,551 17,829 79,722 447.2 Taxes 29,120 2,816 26,304 934.1 38,386 6,413 31,973 498.6
NET INCOME 38,951 2,625 36,326 1,383.8 59,165 11,416 47,749 418.3
1 These financial statements are presented in accordance with SUNAVAL standards and adjusted for inflation up to December 31, 1999 (See accounting principles used). They reflect Mercantil Banco Universal’s contribution to Mercantil´s results. These Standards of the SUNAVAL are described in Appendix I.
2 Historic figures in accordance with the standards of the Superintendency of Banking SUDEBAN in Venezuela.
Conciliation of Net Income SUNAVAL and SUDEBAN (In millions of Bolivars)
Quarter 9 Months
Ended on Ended on
Sep. Sep. Sep. Sep. 2017 2016 2017 2016
Net income2 38,800 3,463 58,969 11,559
Deferred Income Tax 151 (838) 196 (143)
Long term interest bearing loans, investments in securities adjusted for amortization, and other consolidation effects 38,951 2,625 59,165 11,416
Net income SUNAVAL 0 0 (69) (48)
Inter-company eliminations 38,951 2,625 59,096 11,368

33
Contact: Investor Relations. Phone: 58-212-503.1335. e-mail: [email protected]. website: www.msf.com.
APPENDIX VI
MERCANTIL C.A. BANCO UNIVERSAL
According to rules issued by SUDEBAN 1
UNAUDITED CONSOLIDATED FIGURES (In millions of Bolivars, except percentages)
∆ ∆
September June September Sep. 17 vs. Jun. 17 Sep. 17 vs. Sep. 16
2017 2017 2016 Bolivars % Bolivars %
SUMMARY OF BALANCE SHEET ASSETS Cash and Cash Equivalents 1,998,337 1,055,591 236,905 942,746 89.3 1,761,432 743.5 Investments Portfolio 281,930 132,782 91,394 149,148 112.3 190,536 208.5 Loan Portfolio 2,076,837 1,243,159 501,219 833,678 67.1 1,575,618 314.4 Properties and Equipment and Other Assets 171,401 128,722 34,954 42,679 33.2 136,447 390.4
TOTAL ASSETS 4,528,505 2,560,254 864,472 1,968,251 76.9 3,664,033 423.8
LIABILITIES AND SHAREHOLDERS'EQUITY Deposits 4,057,099 2,317,135 781,720 1,739,964 75.1 3,275,379 419.0 Financial Liabilities and Other Liabilities 263,273 92,552 28,459 170,721 184.5 234,814 825.1
TOTAL LIABILITIES 4,320,372 2,409,687 810,179 1,910,685 79.3 3,510,193 433.3
SHAREHOLDERS´ EQUITY 208,133 150,567 54,293 57,566 38.2 153,840 283.4
TOTAL LIABILITIES AND SHAREHOLDERS' EQUITY 4,528,505 2,560,254 864,472 1,968,251 76.9 3,664,033 423.8
Quarter 9 Months
Ended on ∆ Ended on ∆
Sep. Sep. Sep. Sep.
2017 2016 Bolivars % 2017 2016 Bolivars %
SUMMARY OF INCOME STATEMENT Interest Income 155,792 30,523 125,269 410.4 278,306 75,630 202,676 268.0 Interest Expense 18,573 7,367 11,206 152.1 39,770 20,018 19,752 98.7
Net Interest Income 137,219 23,156 114,063 492.6 238,536 55,612 182,924 328.9 Provision for Losses on Loan Portfolio 22,052 4,339 17,713 408.2 40,216 8,066 32,150 398.6
Net Financial Margin 115,167 18,817 96,350 512.0 198,320 47,546 150,774 317.1 Commissions and Other Income 57,454 8,602 48,852 567.9 98,907 20,958 77,949 371.9
Operating Income 172,621 27,419 145,202 529.6 297,227 68,504 228,724 333.9 Operating Expenses 103,420 21,140 82,280 389.2 198,698 50,990 147,708 289.7
Income before taxes 69,201 6,279 62,922 1,002.1 98,529 17,514 81,015 462.6 Taxes 30,401 2,816 27,585 979.6 39,560 5,955 33,605 564.3
NET INCOME 38,800 3,463 35,337 1,020.4 58,969 11,559 47,410 410.2
Mercantil Banco Universal
Indicators1 from Consolidated Financial Statements
System Sep. Sep.
Average2 2017 2016
Net Interest Income / Average assets 13.3% 16.0% 11.7%
Return on average assets (ROA) 2 4.7% 4.2% 2.2%
Return on average equity (ROE) 2 83.6% 79.6% 34.4%
Non-performing loans / Gross loans 0.1% 0.2% 0.3%
Allowance for loan losses / Past-Due and Non-performing loans 2,149.9% 1,375.2% 957.9%
Allowance for loan losses / Gross loans 2.3% 2.7% 3.2%
Operating expenses / average total assets 7.9% 9.6% 8.3%
Equity / Assets 5.2% 4.6% 6.3%
Equity / Assets minus Venezuelan Government Investments N.A. 10.9% 11.2%
Equity / Risk-weighted Assets N.A. 12.2% 13.7%
1 Consolidated. 2 Based on annualized figures. N.A: Not Available

34
Contact: Investor Relations. Phone: 58-212-503.1335. e-mail: [email protected]. website: www.msf.com.
APPENDIX VII
MERCANTIL BANK HOLDING CORPORATION According to rules issued by SUNAVAL 1 UNAUDITED CONSOLIDATED FIGURES (In millions of US$, except percentages)
∆ ∆
September June September Sep. 17 vs. Jun. 17 Sep. 17 vs. Sep. 16
2017 2017 2016 US$ % US$ %
SUMMARY OF BALANCE SHEET ASSETS Cash and Cash Equivalents 193 125 116 68 54.3 77 66.4 Investments Securities 1,999 2,157 2,393 (158) (7.3) (394) (16.5) Loan Portfolio 6,027 5,990 5,666 37 0.6 361 6.4 Properties and Equipment and Other Assets 237 241 261 (4) (1.8) (24) (9.3)
TOTAL ASSETS 8,456 8,513 8,436 (57) (0.7) 20 0.2
LIABILITIES AND SHAREHOLDERS’ EQUITY Deposits 6,481 6,586 6,538 (104) (1.6) (57) (0.9) Financial Liabilities, Other Liabilities and Subordinated Debt 1.261 1,232 1,212 29 2.4 49 4.0
TOTAL LIABILITIES 7,742 7,818 7,750 (76) (1.0) (8) (0.1) SHAREHOLDERS´ EQUITY 714 695 686 19 2.8 28 4.1
TOTAL LIABILITIES AND SHAREHOLDERS´ EQUITY 8,456 8,513 8,436 (57) (0.7) 20 0.2
Quarter 9 Months
Ended on ∆ Ended on ∆
Sep. Sep. Sep. Sep.
2017 2016 US$ % 2017 2016 US$ %
SUMMARY OF INCOME STATEMENT Interest Income 72 61 11 17.6 202 178 24 13.4 Interest Expense 16 12 4 35.8 46 34 12 35.5
Net Interest Income 56 49 7 13.1 156 144 12 8.2 Allowance for Losses on Loan Portfolio 4 3 1 27.0 12 18 (6) (35.8)
Net Financial Margin 52 46 6 12.2 144 126 18 14.5 Commissions and Other Income 26 18 8 46.6 58 47 11 23.0
Operating Income 78 64 14 21.9 202 173 29 16.8 Operating Expenses 53 52 1 1.0 153 150 3 2.0
Income before taxes 25 12 13 112.3 49 23 26 113.4 Taxes 9 3 6 129.3 16 11 5 47.6
NET INCOME US$ 16 9 7 81.0 33 12 21 173.7
1 These financial statements are presented in accordance with rules of the SUNAVAL (see accounting principles used) to reflect the contribution of Mercantil Florida Bancorp to the results of
Mercantil. These Standards of the SUNAVAL are described in Appendix I.
Conciliation of Net Income SUNAVAL and USGAAP
(In millions of US$) Quarter 9 Months
Ended on Ended on
Sep. Sep. Sep. Sep. 2017 2016 2017 2016
Mercantil Bank N.A. Consolidated - Net Income 19 9 39 23
Results for the Holding and other Affiliates (3) (1) (6) (6)
Mercantil Bank Holding Corporation - Net Income 16 8 33 17
Deferred Income Tax (1) (0) (1) (4)
Others 1 1 1 (1)
Contribution to Mercantil's Results1 16 9 33 12

35
Contact: Investor Relations. Phone: 58-212-503.1335. e-mail: [email protected]. website: www.msf.com.
ANEXO VII
MERCANTIL BANK. N.A. According to USGAAP
UNAUDITED CONSOLIDATED FIGURES (In millions of US$, except percentages)
∆ ∆
September June September Sep. 17 vs. Jun. 17 Sep. 17 vs. Sep. 16
2017 2017 2016 US$ % US$ %
SUMMARY OF BALANCE SHEET
ASSETS Cash and Cash Equivalents 42 26 20 16 57.5 22 108.7 Investments Securities 1,971 2,106 2,347 (135) (6.4) (376) (16.0) Loan Portfolio 6,032 5,995 5,665 37 0.6 367 6.5 Properties and Equipment and Other Assets 446 416 425 30 7.3 21 5.0
TOTAL ASSETS 8,491 8,543 8,457 (52) (0.6) 34 0.4
LIABILITIES AND SHAREHOLDERS’ EQUITY Deposits 6,539 6,642 6,588 (103) (1.5) (49) (0.7) Financial Liabilities, Other Liabilities and Subordinated Debt 1.137 1,106 1,084 31 2.7 53 4.9
TOTAL LIABILITIES 7,676 7,748 7,672 (72) (0.9) 4 0.1
SHAREHOLDERS´ EQUITY 815 795 785 20 2.6 30 3.9
TOTAL LIABILITIES AND SHAREHOLDERS´ EQUITY 8,491 8,543 8,457 (52) (0.6) 34 0.4
Quarter 9 Months
Ended on ∆ Ended on ∆
Sep. Sep. Sep. Sep.
2017 2016 US$ % 2017 2016 US$ %
SUMMARY OF INCOME STATEMENT Interest Income 71 60 11 19.0 201 177 24 13.6 Interest Expense 14 10 4 45.1 41 29 12 40.5
Net Interest Income 57 50 7 13.8 160 148 12 8.3 Allowance for Losses on Loan Portfolio 1 5 (4) (76.9) 9 16 (7) (38.9)
Net Financial Margin 56 45 11 23.9 151 132 19 14.1 Commissions and Other Income 24 18 6 33.7 56 47 9 19.2
Operating Income 80 63 17 26.7 207 179 28 15.4 Operating Expenses 52 50 2 1.0 150 147 3 1.7
Income before taxes 28 13 15 125.6 57 32 25 78.3 Taxes 9 4 5 132.4 18 9 9 99.7
NET INCOME 19 9 10 122.5 39 23 16 70.0
Mercantil Bank. N.A. Indicators1
Similar Sep. Sep.
Group1 2017 2016
Net Interest Income / Average Financial Assets 3.5% 2.7% 2.6%
Return on average assets (ROA) 2 1.1% 0.6% 0.4%
Return on average equity (ROE) 2 9.6% 6.6% 4.0%
Non-Accrual / Gross loans 0.6% 0.6% 1.3%
Allowance for loan losses / Gross loans 1.0% 1.4% 1.4%
Operating expenses / average total assets 2.4% 2.4% 2.4%
Equity / Assets 10.0% 9.5% 9.3%
Equity / Risk-weighted Assets N.A. 12.3% 12.4%
1 Based on June, 2017. 2 Annualized N.A.: Not Available

36
Contact: Investor Relations. Phone: 58-212-503.1335. e-mail: [email protected]. website: www.msf.com.
APPENDIX VIII
MERCANTIL SEGUROS
According to rules issued by SUNAVAL 1 Unaudited Consolidated Figures
(In millions of Bolivars, except percentages)
∆ ∆
September June September Sep. 17 vs. Jun. 17 Sep. 17 vs. Sep. 16
2017 2017 2016 Bolivars % Bolivars %
SUMMARY OF BALANCE SHEET ASSETS Cash and Cash Equivalents 16,077 11,539 725 4,538 39.3 15,352 2,117.5 Investments Portfolio 54,007 32,543 20,555 21,464 66.0 33,452 162.7 Premiums receivable 31,701 23,261 12,238 8,440 36.3 19,463 159.0 Property and equipment 29,565 1,560 1,485 28,005 1,795.9 28,080 1,890.9 Other assets 39,011 25,773 13,679 13,238 51.4 25,332 185.2
TOTAL ASSETS 170,361 94,676 48,682 75,685 79.9 121,679 249.9
LIABILITIES AND SHAREHOLDERS’ ÉQUITY Uncollected Premium 56,686 44,220 22,964 12,466 28.2 33,722 146.8 Reserves 20,468 14,441 7,653 6,027 41.7 12,815 167.5 Financial Liabilities 7,094 4,163 2,770 2,931 70.4 4,324 156.1 Accounts Payable Reinsures 964 0 1,084 964 100.0 (120) (11.1) Other provisions and other liabilities 34,461 15,008 6,648 19,453 129.6 27,813 418.4
TOTAL LIABILITIES 119,673 77,832 41,120 41,841 53.8 78,554 191.0
SHAREHOLDERS’ ÉQUITY 50,688 16,844 7,563 33,844 200.9 43,125 570.2
TOTAL LIABILITIES AND SHAREHOLDERS’ ÉQUITY 170,361 94,676
48,682 75,685 79.9 121,679 249.9
Quarter 9 Months
Ended on ∆ Ended on ∆
Sep. Sep. Sep. Sep.
2017 2016 Bolivars % 2017 2016 Bolivars %
SUMMARY OF INCOME STATEMENT Earned Premiums Received 51,722 16,784 34,938 208.2 115,964 41,898 74,066 176.8 Claims Incurred (32,284) (9,991) (22,293) 223.1 (72,611) (26,308) (46,303) 176.0 Commissions and Acquisition Expenses (6,472) (2,607) (3,865) 148.3 (16,017) (6,429) (9,588) 149.1 Management Expenses (7,068) (2,393) (4,675) 195.3 (15,069) (4,638) (10,431) 224.9 Taxes and Contributions (4,395) (1,292) (3,103) 240.4 (9,931) (3,245) (6,685) 206.0
Technical Result 1,503 501 1,002 200.1 2,336 1,278 1,058 82.9 Income from Investments 19,935 507 19,428 3,832.0 20,837 1,365 19,472 1,426.5 Foreign exchange gains (0) (134) 134 (99.8) 8 1,337 (1,329) (99.4) Taxes (521) (456) (65) 14.2 (1,119) (2,461) 1,342 (54.5) Contracts of excess of lost (2,935) (112) (2,823) 2,521.0 (3,291) (340) (2,951) 868.1
NET INCOME 17,982 306 17,676 5,776.5 18,771 1,179 17,592 1,492.1
1 These financial statements are presented in accordance with SUNAVAL standards and adjusted for inflation up to December 31, 1999 (See accounting principles used, Appendix I). They reflect Mercantil Seguros contribution to Mercantil’s results. These Standards of the SUNAVAL are described in Appendix I.
Conciliation of Net Income SUNAVAL and SUDEASEG (In millions of Bolivars)
Quarter 9 Months
Ended on Ended on
Sep. Sep. Sep. Sep.
2017 2016 2017 2016
Mercantil Seguros (Consolidated) - Net Income 16,813 542 29,447 4,197
Earned premiums 8 3 36 11
Exchange Gains and Losses (401) (241) (12,281) (3,450)
Valuation of Investments and Others 1,562 2 1,569 422
Net income SUNAVAL 17,982 306 18,771 1,179
Inter-company eliminations (20,382) 13 (20,301) 31
Contribution to Mercantil's Results (2,400) 319 (1,530) 1,211

37
Contact: Investor Relations. Phone: 58-212-503.1335. e-mail: [email protected]. website: www.msf.com.
APPENDIX VIII
MERCANTIL SEGUROS
According to rules issued by SUDEASEG Unaudited Consolidated Figures
(In millions of Bolivars, except percentages)
∆ ∆
September June September Sep. 17 vs. Mar. 17 Sep. 17 vs. Sep. 16
2017 2017 2016 Bolivars % Bolivars %
SUMMARY OF BALANCE SHEET ASSETS Investments suitable for representing Technical Reserves 81,416 70,885 41,693 10,531 14.9 39,723 95.3 Investments no-suitable for representing Technical Reserves 100,471 102,958 18,884 (2,487) (2.4) 81,587 432.0 Other assets 40,659 24,526 15,488 16,133 65.8 25,171 162.5
TOTAL ASSETS 222,546 198,369 76,065 24,177 12.2 146,481 192.6
LIABILITIES AND SHAREHOLDERS’ EQUITY Technical Reserves 77,338 58,789 30,616 18,549 31.6 46,722 152.6 Other provisions and other liabilities 50,636 71,911 12,663 (21,275) (29.6) 37,973 299.9
TOTAL LIABILITIES 127,974 130,700 43,279 (2,726) (2.1) 84,696 195.7
SHAREHOLDERS’ ÉQUITY 94,572 67,669 32,786 26,903 39.8 61,786 188.5
TOTAL LIABILITIES AND SHAREHOLDERS’ EQUITY 222,546 198,369 76,065 24,177 12.2 146,481 192.6
Quarter 9 Months
Ended on ∆ Ended on ∆
Sep. Sep. Sep. Sep.
2017 2016 Bolivars % 2017 2016 Bolivars %
SUMMARY OF INCOME STATEMENT Earned Premiums Received 51,714 16,781 34,933 208.2 115,928 41,888 74,040 176.8 Claims Incurred (32,284) (9,991) (22,293) 223.1 (72,611) (26,308) (46,303) 176.0 Commissions and Acquisition Expenses (8,034) (2,625) (5,409) 206.0 (17,693) (6,827) (10,866) 159.2 Management Expenses (7,068) (2,393) (4,675) 195.3 (15,069) (4,638) (10,431) 224.9 Taxes and Contributions (4,394) (1,290) (3,104) 240.4 (9,930) (3,245) (6,685) 206.0
Technical Result (66) 482 (548) (113.7) 625 870 (245) (28.2) Income from Investments 19,935 522 19,413 3,719.0 20,943 1,341 19,602 1,461.8 Foreign exchange gains 400 106 294 277.7 12,289 4,787 7,502 156.7 Taxes (521) (456) (65) 14.2 (1,119) (2,461) 1,342 (54.5) Contracts of excess of lost (2,935) (112) (2,823) 2,521.0 (3,291) (340) (2,951) 868.1
NET INCOME 16,813 542 16,271 3,002.1 29,447 4,197 25,250 601.6
1 Combined ratio = (incurred claims + commissions + operating expenses) / earned premiums
2 In numbers
3 Market Share at 08/31/2017
Mercantil Seguros Indicators
(In millions of Bolivars, except percentages and insured persons) Quarter 9 Months
Ended on Ended on
Sep. Sep. Sep. Sep.
2017 2016 2017 2016
Premiums Received Net 67,852 20,872 152,362 55,896
Market Share 8.1%3 10.1%
Equity / Total Assets 42.5% 43.1%
Incurred Claims / Earned Premiums (%) 62.4% 59.5% 62.6% 62.8%
Commissions and Acq. Expenses / Earned Premiums (%) 15.5% 15.6% 15.3% 16.3%
Administrative Expenses / Earned Premiums (%) 13.7% 14.3% 13.0% 11.1%
Combined Ratio (%) 1 100.1% 97.1% 99.5% 97.9%
Insured Persons 2 2,146,478 1,892,275


![INCOME FROM HOUSE PROPERTY - Income Tax …. Income-from-House... · [As amended by Finance Act, 2018] INCOME FROM HOUSE PROPERTY Income chargeable to tax under the head “house](https://static.fdocuments.in/doc/165x107/5b67e9b87f8b9af77c8bf7bd/income-from-house-property-income-tax-income-from-house-as-amended-by.jpg)