Patterns and determinants of effective coverage of routine ...

Menstrual Cycle Patterns and Their Determinants during the
Menopausal Transition among a Multiethnic Cohort of Women
by
Pangaja Paramsothy
A dissertation submitted in partial fulfillment
of the requirements for the degree of
Doctor of Philosophy
(Epidemiological Science)
in The University of Michigan
2012
Doctoral Committee:
Professor Siobán D. Harlow, Chair
Professor John F. Randolph Jr.
Associate Professor Michael R. Elliott
Associate Professor Lynda D. Lisabeth

© Pangaja Paramsothy
2012

ii
ACKNOWLEDGEMENTS
I first like to thank my academic advisor and dissertation committee chair, Dr.
Harlow for her mentorship, encouragement, and support during my time here at the
University of Michigan. I would also like to thank my dissertation committee: Dr.
Randolph, Dr. Elliott, and Dr. Lisabeth for their support, guidance, and feedback. Their
involvement strengthened this work.
I would like to thank Matheos Yosef for sharing his statistical expertise with
quantile regression. His patience and kindness is very much appreciated.
I would also like to thank Nancy Vander Kuyl for her administrative support and most
importantly her moral support and her cheerleading throughout my time here.
I would like to thank my SWAN site coauthors: Dr. Crawford, Dr. Gold, and Dr.
Greendale for their timely feedback and suggestions.
I am indebted to the SWAN staff at all study sites for their years of hard work. I
would also like to express my gratitude to the SWAN participants. Their steadfast
dedication in filling out the SWAN Menstrual Calendar made this research possible.
I gratefully acknowledge funding support from the Rackham Graduate School of
University of Michigan as well as the Department of Epidemiology, University of
Michigan School of Public Health. Their financial support made it possible for me to
achieve my degree.

iii
On a personal note, I would like to thank my fellow doctoral students for their
friendship and support. I would especially like to acknowledge Sandra Albrecht, Kristin
King Sznajder, and Mariana Rosenthal for sharing their wisdom and helping me navigate
through the doctoral program.
Finally, I would like to thank my family for their love and support, especially my
mother for her many sacrifices. I would not have achieved my dreams without her
support.

iv
TABLE OF CONTENTS
ACKNOWLEDGEMENTS ................................................................................................ ii
LIST OF FIGURES .......................................................................................................... vii
LIST OF TABLES ........................................................................................................... viii
LIST of APPENDICIES .................................................................................................... ix
ABSTRACT ........................................................................................................................ x
CHAPTER I ........................................................................................................................ 1
Introduction ............................................................................................................. 1
Dissertation Aims.................................................................................................... 5
Background ............................................................................................................. 6
Questionnaires vs. Menstrual Diaries ................................................................... 15
Factors that Influence Menstrual Cycle Characteristics ....................................... 17
Summary and Chapter Overview .......................................................................... 24
References ............................................................................................................. 26
CHAPTER II ..................................................................................................................... 37
Poor Agreement Found Between Staging the Menopausal Transition Using
Annual Interview Questions or Annual Follicle-Stimulating Hormone Measures
and Menstrual Calendars....................................................................................... 37
Introduction ........................................................................................................... 37
Methods................................................................................................................. 38
Results ................................................................................................................... 44
v
Discussion ............................................................................................................. 50
References ............................................................................................................. 61
CHAPTER III ................................................................................................................... 63
Quantile Regression Models of Factors Associated with Menstrual Cycle Length
During the Menopausal Transition ....................................................................... 63
Introduction ........................................................................................................... 63
Methods................................................................................................................. 64
Results ................................................................................................................... 70
Discussion ............................................................................................................. 73
References ............................................................................................................. 85
CHAPTER IV ................................................................................................................... 89
Abnormal Uterine Bleeding Common during the Menopausal Transition ........... 89
Introduction ........................................................................................................... 89
Methods................................................................................................................. 91
Results ................................................................................................................... 97
Discussion ........................................................................................................... 101
References ........................................................................................................... 113
CHAPTER V .................................................................................................................. 117
Summary of Findings .......................................................................................... 117
Strength and Limitations ..................................................................................... 121
Future Research .................................................................................................. 123

vi
Clinical Implications ........................................................................................... 126
Conclusions ......................................................................................................... 127
References ........................................................................................................... 129
APPENDICIES ............................................................................................................... 133
Appendix A ......................................................................................................... 133
Appendix B ......................................................................................................... 135
vii
LIST OF FIGURES
2.1 An Example of the Comparison Between the Annual Interviews (Baseline and
Visits) to the Menstrual Calendar. ..............................................................................55
2.2 The 2 by 2 Table for Calculation of Cohen’s Kappa Statistic ....................................56
3.1 Kernel Density Plot of Menstrual Cycle Length.........................................................77
3.2 Estimated Cycle Length by Time since the Start of Transition from Multivariate
Quantile Regressions for Four Percentiles: 25th, 50th, 75th and 90th. .................................. 78
3.3 Estimated Cycle Length by Time until FMP from Multivariable Quantile Regressions
for Four Percentiles: 25th, 50th, 75th and 90th. ..................................................................... 79
4.1 Venn Diagram of Potential Abnormal Bleeding Events ........................................................ 106

viii
LIST OF TABLES
2.1a Baseline Demographics of Women Participating in the SWAN Menstrual Calendar
Study .................................................................................................................................... 57
2.1b Baseline Demographics of Women Participating in the SWAN Menstrual Calendar
Study with at least 10 Consecutive Untreated Non-Missing Cycles Observed by
FMP Status .......................................................................................................................... 58
2.2 Menopausal Transition (MT) Stage by Menstrual Calendar Compared to MT Stage
by Annual Interview among Those with Observed FMP in the Menstrual Calendar .......... 59
2.3 MT Stage by Menstrual Calendar Compared to MT Stage by FSH Level among
Those with Observed FMP in the Menstrual Calendar ....................................................... 60
3.1 Number of Cycles for the Start of the Menopausal Transition Models and the FMP
Models by Exclusion Criteria. ............................................................................................. 80
3.2 Baseline Demographics of Women in SWAN by Eligibility............................................... 81
3.3 Adjusted Menstrual Cycle Length Differences in Days among Women Since Start of
the Menopausal Transition, by Percentile ........................................................................... 83
3.4 Adjusted Menstrual Cycle Length Differences in Days among Women until the FMP
by Percentile ........................................................................................................................ 84
4.1 Baseline Demographics of Women in SWAN by Participation in
Menstrual Calendar Substudy ............................................................................................. 107
4.2 Number of Menstrual Cycles (51,606) by Bleeding Characteristic .................................... 108
4.3 Cumulative Percent of Women with at least 1, 2, or 3 Episodes of Bleeding Event
Observed ............................................................................................................................ 109
4.4 Logistic Regression Models for Menses Duration of 10 or More Days ............................. 110
4.5 Logistic Regression Models for Menses with Spotting of 6 or More days ......................... 111
4.6 Logistic Regression Models for Menses with Heavy bleeding of 3 or More Days ............ 112

ix
LIST of APPENDICIES
Appendix A .................................................................................................................................. 133
Appendix B .................................................................................................................................. 135

x
ABSTRACT
Examining menstrual cycle patterns among early and mid-reproductive aged
women suggests that ethnicity, body mass index (BMI), and medical conditions influence
menstrual characteristics. Little data is available on bleeding patterns and dysfunction
during the menopausal transition. The few studies conducted among perimenopausal
women include predominately Caucasian populations and did not examine factors that
may alter bleeding patterns during the menopausal transition. The aim of this dissertation
was to examine patterns of change in menstrual cycle characteristics during the
menopausal transition using menstrual calendar data from a multiethnic multisite cohort
study, the Study of Women’s Health Across the Nation (SWAN). Monthly menstrual
calendars were recorded between 1996 -2006.
This dissertation found that staging the menopausal transition by menstrual
calendars identified the start of each menopausal stage than with estimates from annual
interviews. Increase in menstrual cycle length occurred predominately in the right tail of
the distribution, with greater variability in extreme lengths occurring during the 2 years
prior to the final menstrual period (FMP). Menses of 10 or more days, menses with at
least 6 days of spotting, and menses with at least 3 days of heavy bleeding occurred at
least once during the menopausal transition in the majority of women. Menses of 15 or
more days were less common. Obese women had longer menstrual cycle lengths and
were more likely to report menses with at least 3 days of heavy bleeding. After adjusting

xi
for body size, Chinese and Japanese women had longer menstrual cycle lengths and
Japanese women were less likely to report menses with at least 3 days of heavy bleeding.
African-American women were less likely to report menses of 10 or more days or menses
with at least 6 days of spotting. Menstrual characteristics were not associated with
diabetes, thyroid conditions, or uterine fibroids after adjustment.
The normative patterns of menstrual cycle characteristics as women progress
through the menopausal transition include increased propensity for longer menstrual
cycles, longer-lighter menses, and episodes of heavy menstrual bleeding. The results of
this work will help define abnormal uterine bleeding in perimenopausal women.
1
CHAPTER I
Introduction
The menopause transition (MT) is critical time for women and has been linked to
future health consequences. In the United States, the median age of menopause has been
reported to be 51-52 years.[1, 2] Yet women who reach the age of 50 in the US are
expected to live on average another 32.5 years.[3] Prior research has linked the age at
final menstrual period (FMP) to future disease risk. Younger age at menopause has been
linked to a greater risk of mortality in several countries.[4-7] Younger age at menopause
has also been linked to cardiovascular disease risk and risk of osteoporosis.[8] Older age
at menopause has been linked to an increased risk of breast cancer.[9]
While factors associated with the timing of FMP have been investigated, gaps of
knowledge regarding the MT still exist. Prior studies have shown that menstrual cycle
length and menstrual cycle variability increase prior to the FMP. Clarity is needed on
how the overall distribution of menstrual length and menstrual variability changes during
the MT. It has been suggested that menses duration and flow change during the MT,
however a study has yet to evaluate changes in menstrual duration and flow throughout
the whole MT. It is unknown which demographic, lifestyle, or medical conditions
influence menstrual cycle length, menses duration, or menstrual flow during the MT.
One aspect of the MT which has been recently defined is the stages of the MT. In
2001, the Stages of Reproductive Aging Workshop (STRAW) defined the MT as having
two distinct stages, early and late.[10] The starts of these two stages were defined by

2
changes in menstrual cycle length. Among women over 40 years old, the start of the MT
occurs when a persistent difference in consecutive menstrual cycles of at least 7 days is
observed. The start of the late MT occurs when a menstrual cycle of at least 60 days is
observed. These definitions proposed by the first STRAW workshop were recently
validated by the ReSTAGE collaboration [11-13] and adopted by the STRAW +10
guidelines [14-17].
While the stages of the MT have now been defined, little is known about the
patterns of menstrual cycle characteristics during the MT. Most studies have examined
time to the final menstrual period, and only a few have had the ability to examine
menstrual cycle characteristics. Prospectively collected menstrual calendars are the
preferred method of examining menstrual cycle characteristics and few studies have had
the resources to collect this information, since they are more labor intensive and therefore
more costly than studies that only use questionnaires. Several cohort studies of midlife
women have used annual interviews to classify women’s menopausal status, yet few
studies have assessed the agreement between information obtained from annual
interviews and menstrual calendars in midlife women. The Melbourne Women’s Midlife
Health Project (MWMHP) found that the interview questions used in their study had low
sensitivity for picking up menstrual cycle variability and menses flow variability.[18]
The Seattle Midlife Women’s Health Study (SMWHS) compared interview questions
inquiring about menstrual cycle irregularity to menstrual calendars and reported weak
agreement.[19] Neither of these two studies examined factors that influence agreement.
In the 20th century, four cohort studies utilized menstrual diaries to describe
menstrual cycle length during the reproductive life span. In 1955, Vollman published his

3
analysis of menstrual diaries from 592 Swiss women, who were followed for 20 years. In
1967, Treloar published 30 years of menstrual cycle data from the TREMIN Research
Program on Women’s Health Study.[20] This study enrolled a cohort of female students
from the University of Minnesota from 1934-1939. A second cohort was also enrolled
from 1961-1963. The women were followed until they reached their final menstrual
period. During the study, daughters of the women were also enrolled, so that for some
women their whole reproductive life-span was documented. The TREMIN study is
probably the best known cohort, and analysis using data from this study continues today.
While the Vollman study and the TREMIN study followed women for long periods of
time, two other studies followed women across a large age-span for two years.
Matsumoto published data collected from the diaries of 701 Japanese women.[21]
Chiazze collected diary data from 2,316 American and Canadian women.[22] These four
classic studies demonstrated that menstrual cycle length had the highest variability right
after menarche and then again before menopause. Cycle lengths for 20 to 40 year olds
were shown to be less variable. Except for the Japanese study, the studies were conducted
in Caucasian populations.
In the last few decades, menstrual calendar studies have been conducted in late
reproductive and perimenopausal women. The Massachusetts Women’s Health Study
(MWHS), collected diary data for 352 women, aged 50-60, for three years in the late
1980’s.[23] MWHS found that short cycle lengths and short bleeding/spotting episodes
are most frequent during early to middle perimenopause and long cycle lengths were less
frequent and occurred later during the transition. MWMHP, which began in 1991,
published results from 121 women aged 45-53 years who had diary information for at
4
least 10 consecutive menstrual cycles.[24] MWMHP examined their data in groups, the
first 10 cycles of the study and at least 10 cycles prior to the FMP. Cycle length varied
little in the first 10 cycles of the study, but increased variability was seen in the menstrual
cycles prior to the FMP. SMWHS published results from 184 women aged 35-54 years
who had at least four years of menstrual calendar data.[25] SMWHS characterized the
MT as having three stages. The first stage was characterized by menstrual flow changes,
the second stage was characterized by menstrual irregularity, and the last stage was
skipped periods. A Danish cohort study, using data from the first year of their menstrual
calendars, published results from 592 women aged 45-54 years. This study examined
menstrual cycle length, menses duration, and heaviness of flow. The study found that
women who were consider perimenopausal had longer median menstrual cycle length
and longer median menses duration than women who were considered premenopausal.
They also reported that women who were perimenopausal had less heavy bleeding
episodes than premenopausal women.
While these recent studies have given some insight into patterns of menstrual
cycle characteristics, they have major limitations. The small sample size of most of these
cohorts prohibited these studies from examining patterns fully. Except for the Danish
cohort, these studies did not examine which demographic, lifestyle, or medical
characteristics influence menstrual cycle characteristics. The Danish cohort examined
age, body mass index (BMI), smoking, and health status, but only presented unadjusted
associations. Another major limitation of these studies was the short duration of follow-
up, which did not allow for characterization of the full MT in the study subjects. Another
drawback of these studies was the study participants were predominately Caucasian.

5
Studies from the World Health Organization have suggested that ethnic and
regional differences exist in menstrual cycle characteristics.[26-29] These reports
compared women in different world regions without adjusting for other health, lifestyle
or medical history characteristics. US based menstrual calendars studies have reported
ethnic differences in menstrual characteristics in both postmenarcheal [30, 31] and
reproductive age women [32, 33]. These differences may be due to differences in body
size, medical conditions, or other demographic and lifestyle factors. Prior work in
postmenarcheal and reproductive age women have shown BMI to be associated with
menstrual cycle length [33-39], menstrual bleeding duration [30, 34, 40, 41, , 42, 43], and
heaviness of flow [30]. Some studies have also found that diabetes [38, 44], thyroid
disorders [45, 46], and uterine fibroids [47-49] influence menstrual cycle characteristics.
Dissertation Aims
The goal of this dissertation was to describe the patterns of change in menstrual
cycle characteristics as women progress through the MT and to identify biological,
demographical, and behavioral characteristics that influence these patterns. To achieve
this goal menstrual calendar data collected from 1996 through 2006 from 1320
participants of the Study of Women’s Health Across the Nation (SWAN) were utilized.
Aim 1: To assess the agreement between MT stages as defined by the annual
interview or annual follicle-stimulating hormone (FSH) levels and MT stages defined by
the menstrual calendar, and to examine demographic and lifestyle factors that influence
agreement.
Aim 2: To examine the pattern of menstrual cycle length during the MT, and to
assess the association between menstrual cycle length and ethnicity, BMI, diabetes,

6
thyroid conditions, and uterine fibroids after adjustment for other demographic and
lifestyle characteristics.
Aim 3: To describe the distribution of menses duration and heaviness of flow, and
to assess the association between these menstrual characteristics and ethnicity, BMI,
diabetes, thyroid conditions and uterine fibroids after adjustment for other demographic
and lifestyle characteristics.
Background
Physiology of the Menstrual Cycle
The normal menstrual cycle can be grouped into two components: the ovarian and
the endometrial. The ovarian component is characterized by changes in the ovarian
follicle, with ovulation as the major event. The endometrial component describes
changes in the uterine lining. Both the ovarian and endometrial components are driven by
changes in the endocrine system.
Ovaries and Follicle Development
In the human female, the ovaries are paired organs that are responsible for storing
ova, which are female germ cells, and producing female sex hormones. A normal adult
ovary is usually 3 to 5 cm in length, 1.5 to 3 cm in width and up to 1.5 cm thick.[50] The
size of the ovary is dependent on menstrual cycle phase, as well as the age of the female.
The ovary consists of two areas, the cortex and the medulla. The cortex is the outer area
and is covered by the surface epithelium. The surface epithelium is made up of the tunica
albuginea, a strip of connective tissue, and follicles.[51] A follicle is composed of an
outer layer of theca cells, separated by a basement membrane from an inner layer of
granulosa cells which surround an ooycte.[39] Follicles are present in the adult ovary in
various stages of development. Resting follicles are located in a nonvascular layer of the

7
cortex beneath the tunica albuginea. The cortical medullary border, a highly vascular
area of the cortex, contains growing follicles, follicles which are undergoing atresia, and
corpora lutea.[51] The cortex also consists of stromal cells, vasculature, and elements of
the autonomic nervous system. Stromal cells are cells that lend structural support to the
ovary and are made up of undifferentiated mesenchymal cells.[52] Stromal cells are
thought to differentiate into theca and luteal cells.[52] The medulla section of the ovary
contains connective tissue, stromal cells, blood vessels, and lymphatics.[51]
In human females, ooycte production occurs before birth. A human female is born
with all the oocytes she will have in her lifetime. Starting at approximately the 4th week
of embryonic development, primordial germ cells begin the process of becoming
oogonia.[51] The peak number of oogonia is around 7 million and occurs around the 20th
week of gestation.[53] Oogonia that enter meiotic prophase I are called oocytes. The
oogonia that do not enter meiosis are lost through atresia, by apoptosis or programmed
cell death. Primary oocytes are arrested in the diplotene stage of meiotic. A layer of
epithelial pregranulosa cells surround the oocytes to form primordial follicles.[51]
Primordial follicles stay in the arrested diplotene stage until development, or they
undergo atresia.
Folliculogenesis is the process of follicular development and has two important
pathways, initial recruitment and cyclic recruitment.[39] Initial recruitment is the process
where primordial follicles are activated and begin to grow. This process starts occurring
from the 20th week of gestation and continues through menopause. The factors that
stimulate initial recruitment are unknown.[39] Primordial follicles that are selected to
grow are recruited into the primary follicular pool. Primary follicles develop by

8
proliferating their granulosa cell layers and by increasing the size of the ooycte.[51] Once
there are 2 or more complete layers of granulosa cells, the follicle is considered a
secondary follicle. In the secondary follicle stage, the theca layer of the follicle develops.
The theca layer stratifies into the theca externa and the theca interna. In the theca interna,
epitheloid cells begin to develop; these cells become the steroid-secreting cells. Once the
epitheloid cells develop the secondary follicle is defined as a preantral follicle.[51] Once
the follicle begins to form a small fluid-filled cavity, called the antrum, it is called an
antral follicle. Before puberty, these antral follicles undergo atresia.
After the onset of menarche, the first menstrual period, some antral follicles enter
cyclic recruitment. In this process, a group of 6 to 10 antral follicles are selected to
become preovulatory follicles. These selected follicles are referred to as Graafian
follicles.[39] Among the Graafian follicles, one follicle becomes dominant during the late
follicular phase of the menstrual cycle and the others undergo atresia. As the dominant
follicle grows, it increases the number of granulosa cells and the theca becomes highly
vascular.[50] Once the follicle reaches maturation, the ooycte is released from the follicle
into the fallopian tube; this process is ovulation. After the follicle has extruded the
ooycte, it collapses and becomes the corpus luteum, which starts the luteal phase of the
menstrual cycle. If fertilization of the ooycte occurs, the corpus luteum remains for about
3 months and provides hormonal support for the pregnancy. However, if fertilization does
not occur, the corpus luteum atrophies and becomes the corpus albicans, which is white
scar tissue.[50]

9
Hormonal Control
The ovarian component is regulated both by hormones that are secreted by the
ovaries as well as by hormones that are secreted in other organs. Hormonal control of the
menstrual cycle is determined by the interaction between the central nervous system,
primarily the hypothalamus and pituitary, and the ovaries, referred to as the
hypothalamic-pituitary-ovarian axis. The hypothalamus secretes gonadotrophin-releasing
hormone (GnRH). GnRH is secreted in a pulsating fashion and has a short half-life of less
than three minutes, which makes peripheral serum measurements unreliable as they do
not reflect central levels.[54] GnRH triggers the pituitary to synthesize, store, and secrete
the gonadotrophins, FSH and luteinizing hormone (LH). FSH and LH stimulate the
growth and development of Graafian follicles.[50] FSH triggers granulosa cell growth
within the follicle. LH stimulates theca cells to produce androgens. The androgens are
transferred to the granulosa cells where FSH triggers their aromatization into estradiol.
[53] In the follicular phase of the menstrual cycle, as follicles grow the granulosa cells
produce estradiol. FSH and LH act on cells in the ovaries to produce several other
hormones, some of which have positive and negative feedback on gonadotrophin
secretion. FSH and LH levels peak in the follicular phase, just prior to ovulation.
Estrogen reaches its highest level during the follicular phase as well. Once levels of
estrogen reach a high level, estrogen exerts a negative feedback on FSH, inhibiting the
growth of multiple follicles and causing LH to surge. The surge of LH stimulates
ovulation.[50] During the luteal phase of the menstrual cycle, the corpus luteum secretes
progesterone. Progesterone inhibits follicular growth during the luteal phase.[55]

10
Recently research has established the role of additional hormones that are
involved in the control of the menstrual cycle. Inhibin B is produced in the granulosa
cells of antral follicles.[56] Inhibin B participates in the negative feedback loop of the
hypothalamic-pituitary-ovarian axis by down-regulating the secretion of FSH. Inhibin B
levels peak at two times during the follicular phase, once during the early to mid
follicular phase and again at ovulation.[56] Anti-Müllerian hormone (AMH), which is
produced by primary, secondary, and early antral follicles [57], inhibits the initiation of
primordial follicle growth.[53] During the luteal phase of the menstrual cycle, the corpus
luteum also secretes inhibin A [56], which also helps suppress FSH [55].
Endometrial Component
The endometrium is the tissue that lines the uterus. It is composed of two zones.
The decidua functionalis is the outermost zone and comprises two thirds of the
endometrium.[53] It is made up of two layers, the stratum spongiousum and the stratum
compactum. The decidua functionalis is the layer of the endometrium that undergoes
changes during the menstrual cycle and is shed during menses. The decidua basalis is the
innermost zone that comprises one third of the endometrium, and does not undergo
significant change during the menstrual cycle.[53]
The endometrial component consists of three phases, the proliferative, the
secretory, and menstrual. The purpose of the endometrial component is to provide a
hospitable environment for embryo implantation. The increased estrogen production that
occurs during the follicular phase causes mitotic growth of the decidua functionalis.[53]
Estrogen stimulates the rapid growth of the glands and the stromal of the functional
layers of the endometrium during the proliferative phase of the endometrial component

11
Progesterone, produced during the luteal phase of the ovarian component, causes the
endometrium to become increasingly vascular and causes the secretion of glycogen and
lipids, which defines the secretory phase.[50] When the corpus luteum atrophies, estrogen
and progesterone levels plummet and the superficial layers of the endometrium that were
built during the proliferative phase are sloughed off. This begins the menstrual phase of
the endometrial component.
Menstrual Cycle Length
Menstruation is the most easily observed event of the menstrual cycle. By
convention, the first day of menstruation is considered the first day of a menstrual cycle.
Duration of menstruation typically lasts 2-6 days.[53] In most descriptions of the human
menstrual cycle, the cycle length is characterized as 28 days. However, the range of
normal menstrual cycle length is somewhat variable. Treloar and colleagues found that
during the ages 20 to 40, there was less variability in menstrual cycle length as compared
to the years following menarche and the years preceding menopause.[20] For example,
for women age 27 the median menstrual cycle length was 27.5 years and the 25-75%
range was 25.7-29.9.[20] Several studies have found similar results. A study of 2316
American and Canadian women aged 15-44 years found mean cycle length of 28.1 ±3.95
days.[22] A study of New York women age 34-45 years, reported the mean menstrual
cycle length to be 27.8.[37] A recent study of 161 US women age 21-41 found the mean
menstrual cycle length to be 28.9 days.[58] A recent study of New Mexican women age
18-36 reported a mean menstrual cycle length of 27.7± 2.7 days.[59]
Follicular phase length and luteal phase length have also been studied. Studies by
Lenton and colleagues in the early 1980’s observed follicular phase length to range from

12
8.2 to 20.5 days [60] and luteal phase length to range from 9-20 days [61]. The New
Mexican study found a follicular phase length range of 10-20 days and luteal phase
length of 9-17 days.[59] Both studies observed that the phase with the most between-
women variation is the follicular phase.[59]
Changes Due to Aging
Ovarian Aging
A human female is born with the total number of follicles she will have in her
lifetime. The total number of primordial follicles are called the ovarian reserve.[62] At
birth, the total number of follicles in the ovarian reserve is about one million.[53] Since
primordial follicles are constantly being recruited to initiate either growth or apoptosis,
the ovarian reserve diminishes as a woman ages. Approximately 75% of the ovarian
reserve is lost from birth until puberty.[54] The rate of loss from the ovarian reserve is
not constant.[62] It was once believed that once the number of follicles in the ovarian
reserve reach approximately 25,000, the rate of loss begins to accelerate [62],
approximately around age 37.5 years [54]. However, recent work by Hansen and
colleagues has demonstrated that the rate of loss does not abruptly accelerate, but is
constantly accelerating.[63] The number of follicles left in the ovarian reserve when a
woman reaches menopause (end of menstrual cycles) ranges from 100 to 1000, and
occurs at the mean age of 51 years old.[51] Although mean ages are given above, the
number of follicles at each chronological age differs among women, therefore
chronologic age and ovarian age are not the same across women. Another important
characteristic of ovarian aging is the increased number of anovulatory cycles (menstrual
cycles where ovulation fails to occur), presumably due to functional aging of the

13
remaining oocytes. Women who are in the menopausal transition, have more anovulatory
cycles than when they were premenopausal.[64]
Hormone Levels and Aging
As the follicle pool diminishes changes in hormone levels are seen. The drop in
the number of antral follicles cause the secretion of inhibin B to decrease.[65] The
decline in inhibin B reaches an undetectable level approximately 4 years before the
FMP.[66] Since inhibin B is a major regulator of FSH secretion, the drop in inhibin B
levels allow FSH levels to rise.[66] The rate of FSH increase is not constant as a woman
ages. Data from the Michigan Bone Health and Metabolism Study (MBHMS), found that
FSH levels rise slightly at a constant rate from 10 to 7 years before the FMP. From 7 to 2
years before the FMP, the rate of change increases more rapidly. From 2 years to the
FMP to 1 year after the FMP the rate of change dramatically increases. One year after the
FMP, FSH levels begin to plateau.[67] Increases in LH levels are also seen in women as
they age. LH levels begin to increase approximately 5 years before the FMP and the
levels plateau approximately 6 months to a year after the FMP.[68]
AMH, like inhibin B, is a hormone that is thought to be a biomarker of ovarian
reserve. AMH levels are an indicator of the number follicles in the follicular pool with
declining levels suggesting advancing ovarian age.[69] One reason AMH is thought to be
an attractive candidate for a biomarker for the MT is that its measurement, unlike inhibin
B, is not dependent on menstrual cycle phase.[70] Two studies have examined AMH
during the MT and have found that AMH levels decline to undetectable levels
approximately 4 to 5 years before the FMP.[57, 66]

14
As ovarian aging advances, estradiol (E2) levels are the last hormone to change
with relation to the FMP.[71] E2 levels do not gradually decrease during the MT. Three
studies have shown that approximately 2 years before the FMP, the level of E2 drops
dramatically. In a 1999 study by Burger et al., mean E2 were approximately 250 pmol/L
at 1 ½ years before the FMP and dropped to about 50 pmol/L at 1 year after the FMP.[72]
Both the MBHMS and SWAN have demonstrated increased rates of change of E2 levels
during 2 years before and after the FMP.[73, 74] The rapid changes in E2 levels may be
the reason for some perimenopausal symptoms, like hot flashes.[75]
Other hormones change during the MT. Testosterone levels have been shown to
be decreased in menopausal women.[55] However, in a longitudinal study that measured
testosterone levels starting from 10 years prior to the FMP to 10 years after the FMP,
testosterone levels increased gradually.[76] The same study found that sex hormone
binding globulin (SHBG) levels gradually decreased.[76] Dehydroepiandrosterone sulfate
(DHEA) has been shown to rise at the beginning of the MT before declining
afterwards.[77, 78]
Menstrual Cycle Characteristics and Aging
As stated above, limited information on menstrual characteristics during the MT
exists and the purpose of this dissertation is to examine menstrual characteristics as they
change during the MT. However, some studies have documented increased variability of
menstrual cycle length the closer a woman is to her final menstrual period. The Treloar
analysis found increased menstrual cycle variability approximately 7 years before the
FMP.[20] However, his initial analysis had some bias due to misidentified menopause
dates and exclusion of menstrual cycles that overlapped calendar years.[79] A reanalysis

15
of the Treloar data found that in the 4 years before the FMP, menstrual cycle length
variability was increased, especially during the last year before the FMP.[79] The
MWMHP found that menstrual cycle length increased in the last 20 menstrual cycles
before the FMP as compared to earlier menstrual cycles.[24] In SWAN, reporting longer
menstrual cycle lengths as well as more variable menstrual cycles was associated with a
shorter time to the FMP.[80] Increased duration of menstruation as well as heaviness of
bleeding episodes have also been demonstrated by the Danish cohort during the
menopause transition.[81]
Questionnaires vs. Menstrual Diaries
Prospectively collecting data on menstrual cycles characteristics using menstrual
calendar data is considered to be the preferred data collection method because it is not
subject to recall bias.[82] However, data collection using menstrual calendars is more
costly and more labor intensive than questionnaires. Other benefits associated with using
questionnaires to assess menstrual cycle characteristics include the ease of administration
to a large group of women, the decreased likelihood that they reflect non response bias,
and the ready incorporation into studies where reproductive stage is of interest but not a
primary aim. Several studies including SWAN have used annual interviews to classify
women’s menopausal status, yet few studies have assessed the agreement between
information obtained from an annual interview and menstrual calendars in
perimenopausal women, and even fewer have assessed the factors impact that agreement.
Staging women based on their menstrual characteristics also provides an opportunity to
assess how recent recommendations regarding bleeding criteria for staging reproductive
aging [10, 12, 13] might classify women differently than the classification upon which

16
SWAN staging is based (e.g. 60 versus 90 days of amenorrhea, respectively, for defining
the late transition). The information gained can also be used to refine questionnaires for
future studies.
Studies have examined reliability of self-reported menstrual cycle lengths among
reproductive age women. A WHO study demonstrated that most women were able to
accurately recall the duration of their last menses and predict the duration of their next
menses, but women were less able to predict the length of their next bleed-free episode or
when their next menses would start.[27] One US study found only 43% of women were
able to accurately predict their next cycle length within 2 days [83], while another study
demonstrated that women had longer menstrual cycle lengths than what was
retrospectively reported[84]. The agreement between reported and observed menstrual
cycle length has been shown to be poor to moderate. [85, 86]
Two of the cohort studies of midlife women have compared annual interview
questions to menstrual calendar diaries. The Melbourne Women’s Midlife Health Project
compared questions of menstrual cycle variability and menses flow variability reported
on a questionnaire to definitions derived from menstrual calendars. The researchers found
that the interview questions had low sensitivity in picking up menstrual cycle variability
and menses flow variability.[18] The Seattle Midlife Women’s Health Project compared
interview questions on cycle irregularity and skipped cycles to information obtained from
menstrual calendar diaries. They found agreement for cycle irregularity to be weak
(kappa=.19). Agreement on skipped cycles was good (kappa=.60) before a definition of
skipped cycles was given to participants, and improved (kappa=.77) after a definition was

17
provided. [19] Neither the Melbourne Women’s Midlife Health Project nor the Seattle
Midlife Women’s Health Project examined factors that affected agreement.
Factors that Influence Menstrual Cycle Characteristics
Ethnicity
Regional differences have been reported in age at menarche, with adolescent girls
from industrialized countries reaching menarche sooner than adolescent girls from
developing countries. In studies from WHO, earlier age at menarche was recorded in girls
from Switzerland and Hong Kong, while later age at menarche was observed in girls
from Nigeria and Sri Lanka.[28, 29] A 1968 study comparing Dutch school girls to
Bantu (South African) school girls found that the Dutch girls reached menarche sooner
and had more ovulatory cycles.[87] However, within country differences suggest
minority adolescents have early age at menarche. In the US, African-American girls
reached menarche sooner than Caucasian girls.[88] A similar result was shown among
black South-Africans as compared to white South-Africans.[89]
In the US, ethnic differences have been seen in age at menopause. African-
Americans have been reported to enter the menopause transition earlier than Caucasians.
In the Harvard Study of Moods and Cycles, women of color had an earlier entry into
perimenopause than white women [90]. The Penn Ovarian Aging Studies found African-
American women started the menopause transition earlier than Caucasian women
(OR=1.32), but no difference in ethnicity was seen in transition to later stages.[91]
Among participants in the Multiethnic Cohort Study, Native Hawaiians , Latinas US
born, and Latinas non-US born had an shorter time to menopause as compared to
Caucasian women while Japanese-American women had a longer time to menopause.[92]
The SWAN cross-sectional study also found Japanese women had a later age at

18
menopause.[2] A 2007 SWAN analysis, utilizing annual interview data, found the effect
of older age on the time to menopause was greater in all other ethnic groups as compared
to Caucasian women.[80]
Ethnic differences have also been reported in menstrual cycle length, menses
duration and heaviness of flow. When compared to African-Americans or to non-
Caucasians, Caucasian females have been reported to have longer menstrual cycle length
and longer bleeding durations. A North Carolina study of postmenarcheal girls found
Caucasian girls had slightly longer menstrual cycle lengths, longer menstrual bleeding,
and had higher between-women cycle variance, but were less likely to report heavy
bleeding than African-American girls.[30, 31] In The Collaborative Perinatal Project and
The New York University Women’s Health Study, both of which utilized questionnaires,
Caucasian women had mean cycle lengths that were a half day longer than non-
Caucasian women.[37, 41] Two US based studies of reproductive aged women, The
Semiconductor Health Study and the Women’s Reproductive Health Study, found Asian
women had adjusted menstrual cycle lengths that were approximately two days longer
than cycles for Caucasian women.[32, 33].
Previous SWAN analyses have found some differences by ethnicity in hormone
patterns. In 2004, similar patterns of decreases in FSH and increases in estradiol were
observed in each ethnic group, however serum hormone levels differed. As compared to
Caucasian women, Chinese and Japanese women had lower estradiol levels. African-
American women had higher FSH levels than Caucasian women.[93] In 2004, the SWAN
Daily Hormone Study (DHS) reported Chinese and Japanese women had the lowest level
of estrone conjugate (E1c ) secretion.[94] In 2008, the DHS noted that African-American

19
women had greater odds of having an anovulatory non bleeding cycle than Caucasian
women.[95] A recent DHS paper did not find an independent association between
characteristics of menstrual bleeding episodes and ethnicity. [96]
Body Size
Ethnic differences in menstrual characteristics may be due to differences in body
size. Studies that have examined the relationship between BMI and time to menopause
have shown conflicting results. Higher BMI has been associated with older age at
menopause in studies of women in China[97], Mexico[98], and the US [92, 99].
However, other studies have found that higher BMI was associated with younger age at
menopause,[100] and some studies did not find an association [101-105]. In two
population-based studies of menopausal status in the United States, one study found
higher BMI to be slightly associated with being post menopausal [106] while the other
study found no association between BMI and the odds of being post menopausal [107].
The Harvard Study of Moods and Cycles found the age-adjusted incidence rate of
perimenopause to be 1.58 times higher among obese women as compared to normal
weight women.[90] However, the Penn Ovarian Aging Study did not find an association
between BMI and entry into any stage of menopause.[91] Both a 2001 report using
SWAN cross-sectional survey data as well as a 2007 longitudinal SWAN analysis did
not find an association between BMI and age at FMP.[2, 80]
Both low BMI and high BMI have been associated with longer menstrual cycle
length. Low BMI has been associated with longer menstrual cycle length in
postmenarcheal girls[31], and young adult women [34, 35]. Higher BMI has also been
associated with longer menstrual cycle length.[33, 35-38] In the Michigan Bone Health

20
and Metabolism study, the lowest body fat mass deciles and the highest body fat mass
deciles were associated with longer menstrual cycle length.[35] A few studies have
found no association between cycle length and BMI.[32, 43, 108]
BMI has been associated with bleeding duration and heaviness of flow. Low BMI
has been associated with longer bleeding duration [30, 40, 41] and high BMI has been
associated with shorter bleeding duration [30, 34, 42, 43]. MBHS did not find an
association with bleeding duration and BMI.[109] In a Danish study of premenopausal
and perimenopausal women, obesity was associated with higher frequency of
flooding.[81] A recent SWAN DHS paper did not show an association between BMI
and menstrual cycle length, but did report that obesity was associated with increased
number of heavy bleeding days.[96]
Medical Conditions
Although less frequently examined, evidence suggests medical conditions also
impact menstrual function. Endocrine disorders have been linked to menstrual
dysfunction. Girls with Type 1 diabetes have been reported to have later ages of
menarche as compared to girls without diabetes.[110-112] Type 1 diabetes has also been
reported to be associated with an earlier age at menopause.[113] Diabetes was associated
with premature ovarian failure among women in the SWAN cross-sectional study [114]
and women who were diabetic were more likely to be postmenopausal than women who
were not diabetic [2]. One study among Puerto-Rican women did not find an association
between history of diabetes and age at menopause.[115]
Diabetes has been associated with longer menstrual cycle lengths, longer bleeding
duration, and heavier bleeding episodes. Women with diabetes have been shown to have

21
longer menstrual cycles than non-diabetic women [38, 44], including women in the
SWAN DHS/menstrual calendar study [96]. An Italian study found high triglyceride
levels, which is commonly seen in women with hyperinsulinemia, were associated with
longer menstrual cycle lengths.[116] One study found women with diabetes had longer
and heavier menstrual bleeding than non-diabetic women [44], but this association was
not found in the SWAN DHS/menstrual calendar study [96]. Menstrual cycle irregularity
and longer cycle lengths have been reported to increase the risk of diabetes.[117-119]
However, the TREMIN study did not find an association between menstrual cycle length
at age 25-29 and the subsequent risk of diabetes.[120]
Abnormal thyroid function has been linked with menstrual dysfunction.
Abnormal menstruation has been linked to both hypothyroidism and hyperthyroidism in
small studies of women in Greece [45, 46] and India[121]. An early descriptive study of
women with hyperthyroidism found that more severe the disease was associated with
less menstrual blood flow; the same study found that women with hypothyroidism had
higher frequencies of menorrhagia.[122] One US based study of young adult women
found that women with Grave’s disease were more likely to report long cycle lengths.[38]
In the SWAN study of baseline thyroid stimulating hormone (TSH) levels, increasing
TSH levels were associated with increasing menstrual bleeding duration.[123] In the
SWAN DHS/menstrual calendar study, thyroid conditions were not associated with
menstrual cycle length, duration of menstrual bleeding, or heavier bleeding episodes.[96]
Some evidence suggests that uterine leiomyomas, commonly referred to as
fibroids, impact menstrual function. Studies that examined the association between
uterine leiomyomas and menstrual bleeding characteristics have been mixed. Several

22
studies that used ultrasound to detect fibroids have reported an association with abnormal
bleeding.[47-49] However, other studies that also used ultrasound to detect fibroids have
not reported an association.[124, 125 ] One study reported that women with uterine
fibroids were more likely to have longer cycle lengths.[49] However, two other studies
did not report an association between cycle length and the presence of fibroids.[33, 125]
In the SWAN DHS/menstrual calendar study, fibroids were associated with shorter
menstrual cycle length, but also associated with longer bleeding duration and heavier
bleeding episodes.[96]
Cigarette Smoking
An important factor which contributes to medical conditions and which also
influences menstrual cycle characteristics is smoking. Ethnic differences in menstrual
characteristics may be due to differences in smoking prevalence. Among countries with a
higher female smoking prevalence, including the US, cigarette smoking has been linked
to an earlier age at menopause [97, 99-101, 103, 126-128] and shortened duration of the
transition [91, 129]. In countries where there is a lower female smoking prevalence,
cigarette smoking has not been associated with age at menopause[130, 131]. One study
of Mexican women did not report cigarette smoking to be associated with age at
menopause [132], but in another study conducted 10 years later cigarette smoking was
associated with younger age at menopause [98]. The SWAN cross-sectional study found
a higher percentage of current smokers were post menopausal, with a dose-response seen
with increasing number of cigarettes.[2] The SWAN longitudinal study found that
cigarette smoking was associated with a shorter time to menopause.[80]

23
A few US studies have reported shorter menstrual cycle lengths among women
who smoke, [37, 38, 133] but several other studies have not found an association between
cigarette smoking and menstrual cycle length.[32, 34, 109, 134] Two studies have found
that cigarette smoking shortens the duration of menstrual bleeding,[133, 134] while one
study found that cigarette smoking increases bleeding duration[109]. Another study
found that cigarette smoking increases the daily amount of bleeding.[134] In the SWAN
DHS/ menstrual calendar study, smoking history was not independently associated with
cycle length, bleeding duration, or heavy bleeding.[96]
Physical Activity
Ethnic differences or differences seen in BMI and menstrual characteristics may
be due to different rates of physical activity. In some studies, physical activity has been
found to been associated with older age at menopause.[97, 100, 107] Other studies did
not find an association between physical activity and age at menopause.[99, 103] The
SWAN longitudinal study found that physical activity was associated with a longer time
until menopause.[80]
Physical activity has been associated with menstrual cycle frequency and
menstrual cycle length. Among athletes, less frequent menstrual cycles have been
reported [135, 136]. Among post menarcheal girls and young adult women, physical
activity was associated with longer cycle lengths.[31, 34, 36, 109 ] One study did not
find an association between physical activity and menstrual cycle length.[32] Physical
activity has been associated with both longer bleeding duration [109] and shorter
bleeding duration.[34, 40]
24
Socio-economic Status
Ethnic difference in menstrual characteristics may be partially explained by
differences in socio-economic status. Indicators of socio-economic status (SES) have
been linked to age at menopause. Low education attainment has been associated with an
earlier age at menopause in some studies [97, 98, 132], but not in several other
studies[99, 126, 129, 131]. In the US, less than a high school education was associated
with postmenopausal status in one population based study [106], but not in another
population based study [107]. Both the SWAN cross-sectional survey and the SWAN
longitudinal study found that women with less than a high school education had a shorter
time to menopausal.[2, 80] Low family income and economic distresses have been
associated with early entry into the menopause transition [90] as well as younger age at
menopause[97]. The SWAN longitudinal study found that women who had a harder time
paying for basics had a shorter time to menopause.[80]
Only a couple of studies have reported an association between socio-economic
status (SES) and menstrual cycle length. A Danish study found that women with a lower
social class had a higher frequency of cycle variability.[137] One US based study found
that women who had not attained a high school education or who did graduate from high
school had mean cycle lengths that were approximately a day shorter than women who
had some post high school education.[33]
Summary and Chapter Overview
Very few menstrual calendar studies have focused on menstrual cycle
characteristics among perimenopausal women. Studies among postmenarcheal and young
reproductive aged women have demonstrated that demographic, lifestyle, and medical
factors influence menstrual cycle characteristics. The purpose of this dissertation is to

25
provide a deeper understanding of how menstrual cycle characteristics change during the
MT and how ethnicity, BMI, diabetes, thyroid conditions, and uterine fibroids affect
menstrual cycle patterns. In Chapter 2 of this dissertation, the agreement between MT
staging using annual interviews or FSH levels and MT staging using menstrual calendars
is evaluated. Factors that influence this agreement are also explored. The overall change
in menstrual cycle length during the MT is assessed and the association between
menstrual cycle length and ethnicity, BMI, diabetes, thyroid conditions and uterine
fibroids is evaluated in Chapter 3. Chapter 4 examines the distribution of menstrual
bleeding characteristics, potential abnormal bleeding events, and examines the
association with ethnicity, BMI, diabetes, thyroid conditions, and uterine fibroids. A
summary of results is given in Chapter 5, along with clinical and public health
implications and future directions.

26
References
1. Bromberger JT, Matthews KA, Kuller LH, Wing RR, Meilahn EN, Plantinga P.
Prospective study of the determinants of age at menopause. Am J Epidemiol. Jan
15 1997;145(2):124-133.
2. Gold EB, Bromberger J, Crawford S, et al. Factors associated with age at natural
menopause in a multiethnic sample of midlife women. Am J Epidemiol. May 1
2001;153(9):865-874.
3. Heron M, Hoyert D, Murphy S, Xu J, Kochanek K, Tejada-Vera B. Deaths: Final
Data for 2006. National Vital Statistics Report. April 17, 2009. 2009;57(14).
4. Mondul AM, Rodriguez C, Jacobs EJ, Calle EE. Age at natural menopause and
cause-specific mortality. Am J Epidemiol. Dec 1 2005;162(11):1089-1097.
5. Jacobsen BK, Heuch I, Kvale G. Age at natural menopause and all-cause
mortality: a 37-year follow-up of 19,731 Norwegian women. Am J Epidemiol.
May 15 2003;157(10):923-929.
6. Hong JS, Yi SW, Kang HC, et al. Age at menopause and cause-specific mortality
in South Korean women: Kangwha Cohort Study. Maturitas. Apr 20
2007;56(4):411-419.
7. Amagai Y, Ishikawa S, Gotoh T, Kayaba K, Nakamura Y, Kajii E. Age at
menopause and mortality in Japan: the Jichi Medical School Cohort Study. J
Epidemiol. Jul 2006;16(4):161-166.
8. Shuster LT, Rhodes DJ, Gostout BS, Grossardt BR, Rocca WA. Premature
menopause or early menopause: long-term health consequences. Maturitas.
Feb;65(2):161-166.
9. La Vecchia C, Negri E, Bruzzi P, et al. The role of age at menarche and at
menopause on breast cancer risk: combined evidence from four case-control
studies. Ann Oncol. Sep 1992;3(8):625-629.
10. Soules MR, Sherman S, Parrott E, et al. Executive summary: Stages of
Reproductive Aging Workshop (STRAW). Fertil Steril. Nov 2001;76(5):874-878.
11. Harlow SD, Cain K, Crawford S, et al. Evaluation of four proposed bleeding
criteria for the onset of late menopausal transition. J Clin Endocrinol Metab. Sep
2006;91(9):3432-3438.
12. Harlow SD, Crawford S, Dennerstein L, Burger HG, Mitchell ES, Sowers MF.
Recommendations from a multi-study evaluation of proposed criteria for staging
reproductive aging. Climacteric. Apr 2007;10(2):112-119.

27
13. Harlow SD, Mitchell ES, Crawford S, Nan B, Little R, Taffe J. The ReSTAGE
Collaboration: defining optimal bleeding criteria for onset of early menopausal
transition. Fertil Steril. Jan 2008;89(1):129-140.
14. Harlow SD, Gass M, Hall JE, et al. Executive Summary of the Stages of
Reproductive Aging Workshop + 10: Addressing the Unfinished Agenda of
Staging Reproductive Aging. J Clin Endocrinol Metab. Feb 16 2012.
15. Harlow SD, Gass M, Hall JE, et al. Executive summary of the Stages of
Reproductive Aging Workshop + 10: addressing the unfinished agenda of staging
reproductive aging. Menopause. Feb 15 2012.
16. Harlow SD, Gass M, Hall JE, et al. Executive summary of the Stages of
Reproductive Aging Workshop + 10: addressing the unfinished agenda of staging
reproductive aging. Fertil Steril. Feb 14 2012.
17. Harlow SD, Gass M, Hall JE, et al. Executive summary of the Stages of
Reproductive Aging Workshop +10: addressing the unfinished agenda of staging
reproductive aging. Climacteric. Feb 16 2012.
18. Taffe J, Dennerstein L. Retrospective self-report compared with menstrual diary
data prospectively kept during the menopausal transition. Climacteric. Sep
2000;3(3):183-191.
19. Smith-DiJulio K, Mitchell ES, Woods NF. Concordance of retrospective and
prospective reporting of menstrual irregularity by women in the menopausal
transition. Climacteric. Dec 2005;8(4):390-397.
20. Treloar AE, Boynton RE, Behn BG, Brown BW. Variation of the human
menstrual cycle through reproductive life. Int J Fertil. Jan-Mar 1967;12(1 Pt
2):77-126.
21. Matsumoto S, Mogami Y, Ohkuri S. Statistical studies on menstruation; a crticism
on the definition of normal menstruation. Gunma J med Sci. 1962;11:294-318.
22. Chiazze L, Jr., Brayer FT, Macisco JJ, Jr., Parker MP, Duffy BJ. The length and
variability of the human menstrual cycle. JAMA. Feb 5 1968;203(6):377-380.
23. Johannes CB, Crawford SL, Longcope C, McKinlay SM. Bleeding patterns and
changes in the perimenopause: a longitudinal characterization of menstrual cycles.
Clinical Consultations in Obstetrics and Gyncecology. 1996;8:9-20.
24. Taffe JR, Dennerstein L. Menstrual patterns leading to the final menstrual period.
Menopause. Jan-Feb 2002;9(1):32-40.
25. Mitchell ES, Woods NF, Mariella A. Three stages of the menopausal transition
from the Seattle Midlife Women's Health Study: toward a more precise definition.
Menopause. Sep-Oct 2000;7(5):334-349.

28
26. Belsey EM, Peregoudov S. Determinants of menstrual bleeding patterns among
women using natural and hormonal methods of contraception. I. Regional
variations. Contraception. Aug 1988;38(2):227-242.
27. World Health Organization. Women's bleeding patterns: ability to recall and
predict menstrual events. World Health Organization Task Force on Psychosocial
Research in Family, Planning, Special Programme of Research, Development and
Research Training in Human Reproduction. Stud Fam Plann. Jan 1981;12(1):17-
27.
28. World Health Organization. World Health Organization multicenter study on
menstrual and ovulatory patterns in adolescent girls. II. Longitudinal study of
menstrual patterns in the early postmenarcheal period, duration of bleeding
episodes and menstrual cycles. World Health Organization Task Force on
Adolescent Reproductive Health. J Adolesc Health Care. Jul 1986;7(4):236-244.
29. World Health Organization. World Health Organization multicenter study on
menstrual and ovulatory patterns in adolescent girls. I. A multicenter cross-
sectional study of menarche. World Health Organization Task Force on
Adolescent Reproductive Health. J Adolesc Health Care. Jul 1986;7(4):229-235.
30. Harlow SD, Campbell B. Ethnic differences in the duration and amount of
menstrual bleeding during the postmenarcheal period. Am J Epidemiol. Nov 15
1996;144(10):980-988.
31. Harlow SD, Campbell B, Lin X, Raz J. Ethnic differences in the length of the
menstrual cycle during the postmenarcheal period. Am J Epidemiol. Oct 1
1997;146(7):572-580.
32. Liu Y, Gold EB, Lasley BL, Johnson WO. Factors affecting menstrual cycle
characteristics. Am J Epidemiol. Jul 15 2004;160(2):131-140.
33. Waller K, Swan SH, Windham GC, Fenster L, Elkin EP, Lasley BL. Use of urine
biomarkers to evaluate menstrual function in healthy premenopausal women. Am
J Epidemiol. Jun 1 1998;147(11):1071-1080.
34. Cooper GS, Sandler DP, Whelan EA, Smith KR. Association of physical and
behavioral characteristics with menstrual cycle patterns in women age 29-31
years. Epidemiology. Nov 1996;7(6):624-628.
35. Symons JP, Sowers MF, Harlow SD. Relationship of body composition measures
and menstrual cycle length. Ann Hum Biol. Mar-Apr 1997;24(2):107-116.
36. Harlow SD, Matanoski GM. The association between weight, physical activity,
and stress and variation in the length of the menstrual cycle. Am J Epidemiol. Jan
1991;133(1):38-49.
29
37. Kato I, Toniolo P, Koenig KL, et al. Epidemiologic correlates with menstrual
cycle length in middle aged women. Eur J Epidemiol. Oct 1999;15(9):809-814.
38. Rowland AS, Baird DD, Long S, et al. Influence of medical conditions and
lifestyle factors on the menstrual cycle. Epidemiology. Nov 2002;13(6):668-674.
39. McGee EA, Hsueh AJ. Initial and cyclic recruitment of ovarian follicles. Endocr
Rev. Apr 2000;21(2):200-214.
40. Harlow SD, Campbell BC. Host factors that influence the duration of menstrual
bleeding. Epidemiology. May 1994;5(3):352-355.
41. Cooper GS, Klebanoff MA, Promislow J, Brock JW, Longnecker MP.
Polychlorinated biphenyls and menstrual cycle characteristics. Epidemiology. Mar
2005;16(2):191-200.
42. Belsey EM, d'Arcangues C, Carlson N. Determinants of menstrual bleeding
patterns among women using natural and hormonal methods of contraception. II.
The influence of individual characteristics. Contraception. Aug 1988;38(2):243-
257.
43. Lin HT, Lin LC, Shiao JS. The impact of self-perceived job stress on menstrual
patterns among Taiwanese nurses. Ind Health. Oct 2007;45(5):709-714.
44. Strotmeyer ES, Steenkiste AR, Foley TP, Jr., Berga SL, Dorman JS. Menstrual
cycle differences between women with type 1 diabetes and women without
diabetes. Diabetes Care. Apr 2003;26(4):1016-1021.
45. Krassas GE, Pontikides N, Kaltsas T, Papadopoulou P, Batrinos M. Menstrual
disturbances in thyrotoxicosis. Clin Endocrinol (Oxf). May 1994;40(5):641-644.
46. Krassas GE, Pontikides N, Kaltsas T, et al. Disturbances of menstruation in
hypothyroidism. Clin Endocrinol (Oxf). May 1999;50(5):655-659.
47. Clevenger-Hoeft M, Syrop CH, Stovall DW, Van Voorhis BJ. Sonohysterography
in premenopausal women with and without abnormal bleeding. Obstet Gynecol.
Oct 1999;94(4):516-520.
48. Wegienka G, Baird DD, Hertz-Picciotto I, et al. Self-reported heavy bleeding
associated with uterine leiomyomata. Obstet Gynecol. Mar 2003;101(3):431-437.
49. Chen CR, Buck GM, Courey NG, Perez KM, Wactawski-Wende J. Risk factors
for uterine fibroids among women undergoing tubal sterilization. Am J Epidemiol.
Jan 1 2001;153(1):20-26.
50. Mehring PM. The Female Reproductive System. In: Porth CM, ed.
Pathophysiology: Concepts of Altered Health States. 7th ed. Philadelphia:
Lippincott Williams & Willikns; 2005:1051-1064.

30
51. Gougeon A. Dynamics of Human Follicular Growth: Morphologic, Dynamic, and
Functinal Aspects. In: Leung PCK, Adashi EY, eds. The Ovary. 2nd ed: Elsevier
Academic Press; 2004:25-43.
52. Suter D. Ovarian Physiology. In: Hoyer PB, ed. Ovarian Toxicology: CRC Press;
2004:1-16.
53. Berek JS, ed Berek and Novak's Gynecology. 14th ed: Lippincott Williams &
Wilkins; 2007.
54. Balen A, ed Reproductive Endocrinology for the MRCOG and Beyond. 2nd ed.
London: RCOG Press; 2007. Higham J, ed.
55. Strauss JF, Barbieri RL, eds. Yen and Jaffe's Reproductive Endocrinology:
Physiology, Pathophysiology, and Clinical Management. 5th ed: Elsevier
Saunders; 2004.
56. Burger HG, Hale GE, Dennerstein L, Robertson DM. Cycle and hormone changes
during perimenopause: the key role of ovarian function. Menopause. Jul-Aug
2008;15(4 Pt 1):603-612.
57. van Rooij IA, Tonkelaar I, Broekmans FJ, et al. Anti-mullerian hormone is a
promising predictor for the occurrence of the menopausal transition. Menopause.
Nov-Dec 2004;11(6 Pt 1):601-606.
58. Fehring RJ, Schneider M, Raviele K. Variability in the phases of the menstrual
cycle. J Obstet Gynecol Neonatal Nurs. May-Jun 2006;35(3):376-384.
59. Cole LA, Ladner DG, Byrn FW. The normal variabilities of the menstrual cycle.
Fertil Steril. Feb 2009;91(2):522-527.
60. Lenton EA, Landgren BM, Sexton L, Harper R. Normal variation in the length of
the follicular phase of the menstrual cycle: effect of chronological age. Br J
Obstet Gynaecol. Jul 1984;91(7):681-684.
61. Lenton EA, Landgren BM, Sexton L. Normal variation in the length of the luteal
phase of the menstrual cycle: identification of the short luteal phase. Br J Obstet
Gynaecol. Jul 1984;91(7):685-689.
62. Erickson GF. Ovarian Anatomy and Physiology. In: Lobo RA, Kelsey J, Marcus
R, eds. Menopause Biology and Pathobiology. . San Diego: Academic Press;
2000:147-155.
63. Hansen KR, Knowlton NS, Thyer AC, Charleston JS, Soules MR, Klein NA. A
new model of reproductive aging: the decline in ovarian non-growing follicle
number from birth to menopause. Hum Reprod. Mar 2008;23(3):699-708.

31
64. Burger H. The menopausal transition--endocrinology. J Sex Med. Oct
2008;5(10):2266-2273.
65. Burger HG. Perimenopausal Changes in FSH, the Inhibins, and the Circulating
Steroid Hormone Milieu. In: Lobo RA, Kelsey J, Marcus R, eds. Menopause
Biology and Pathobiology. . San Diego: Academic Press; 2000:147-155.
66. Sowers MR, Eyvazzadeh AD, McConnell D, et al. Anti-mullerian hormone and
inhibin B in the definition of ovarian aging and the menopause transition. J Clin
Endocrinol Metab. Sep 2008;93(9):3478-3483.
67. Sowers MR, Zheng H, McConnell D, Nan B, Harlow S, Randolph JF, Jr. Follicle
stimulating hormone and its rate of change in defining menopause transition
stages. J Clin Endocrinol Metab. Oct 2008;93(10):3958-3964.
68. Rannevik G, Jeppsson S, Johnell O, Bjerre B, Laurell-Borulf Y, Svanberg L. A
longitudinal study of the perimenopausal transition: altered profiles of steroid and
pituitary hormones, SHBG and bone mineral density. Maturitas. Feb
1995;21(2):103-113.
69. te Velde ER, Pearson PL. The variability of female reproductive ageing. Hum
Reprod Update. Mar-Apr 2002;8(2):141-154.
70. Seifer DB, Golub ET, Lambert-Messerlian G, et al. Biologic markers of ovarian
reserve and reproductive aging: application in a cohort study of HIV infection in
women. Fertil Steril. Dec 2007;88(6):1645-1652.
71. Landgren BM, Collins A, Csemiczky G, Burger HG, Baksheev L, Robertson DM.
Menopause transition: Annual changes in serum hormonal patterns over the
menstrual cycle in women during a nine-year period prior to menopause. J Clin
Endocrinol Metab. Jun 2004;89(6):2763-2769.
72. Burger HG, Dudley EC, Hopper JL, et al. Prospectively measured levels of serum
follicle-stimulating hormone, estradiol, and the dimeric inhibins during the
menopausal transition in a population-based cohort of women. J Clin Endocrinol
Metab. Nov 1999;84(11):4025-4030.
73. Sowers MR, Zheng H, McConnell D, Nan B, Harlow SD, Randolph JF, Jr.
Estradiol rates of change in relation to the final menstrual period in a population-
based cohort of women. J Clin Endocrinol Metab. Oct 2008;93(10):3847-3852.
74. Randolph JF, Jr., Zheng H, Sowers MR, et al. Change in follicle-stimulating
hormone and estradiol across the menopausal transition: effect of age at the final
menstrual period. J Clin Endocrinol Metab. Mar 2011;96(3):746-754.
75. Freedman RR. Menopausal Hot Flashes. In: Lobo RA, Kelsey J, Marcus R, eds.
Menopause Biology and Pathobiology San Diego: Academic Press; 2000:215-
227.

32
76. Sowers MF, Zheng H, McConnell D, Nan B, Karvonen-Gutierrez CA, Randolph
JF, Jr. Testosterone, sex hormone-binding globulin and free androgen index
among adult women: chronological and ovarian aging. Hum Reprod. Jun 11 2009.
77. Lasley BL, Santoro N, Randolf JF, et al. The relationship of circulating
dehydroepiandrosterone, testosterone, and estradiol to stages of the menopausal
transition and ethnicity. J Clin Endocrinol Metab. Aug 2002;87(8):3760-3767.
78. Crawford S, Santoro N, Laughlin GA, et al. Circulating dehydroepiandrosterone
sulfate concentrations during the menopausal transition. J Clin Endocrinol Metab.
Aug 2009;94(8):2945-2951.
79. Ferrell RJ, Simon JA, Pincus SM, et al. The length of perimenopausal menstrual
cycles increases later and to a greater degree than previously reported. Fertil
Steril. Sep 2006;86(3):619-624.
80. Santoro N, Brockwell S, Johnston J, et al. Helping midlife women predict the
onset of the final menses: SWAN, the Study of Women's Health Across the
Nation. Menopause. May-Jun 2007;14(3 Pt 1):415-424.
81. Astrup K, Olivarius Nde F, Moller S, Gottschau A, Karlslund W. Menstrual
bleeding patterns in pre- and perimenopausal women: a population-based
prospective diary study. Acta Obstet Gynecol Scand. Feb 2004;83(2):197-202.
82. Rodriguez G, Faundes-Latham A, Atkinson LE. An approach to the analysis of
menstrual patterns in the critical evaluation of contraceptives. Stud Fam Plann.
Feb 1976;7(2):42-51.
83. Small CM, Manatunga AK, Marcus M. Validity of self-reported menstrual cycle
length. Ann Epidemiol. Mar 2007;17(3):163-170.
84. Steiner MJ, Hertz-Picciotto I, Taylor D, Schoenbach V, Wheeless A.
Retrospective vs. prospective coital frequency and menstrual cycle length in a
contraceptive effectiveness trial. Ann Epidemiol. Aug 2001;11(6):428-433.
85. Jukic AM, Weinberg CR, Wilcox AJ, McConnaughey DR, Hornsby P, Baird DD.
Accuracy of reporting of menstrual cycle length. Am J Epidemiol. Jan 1
2008;167(1):25-33.
86. Bachand AM, Cragin LA, Reif JS. Reliability of retrospectively assessed
categorical menstrual cycle length data. Ann Epidemiol. Jul 2009;19(7):501-503.
87. Baandes EA, de Waard F. Menstrual cycles shortly after menarche in European
and Bantu girls. I. Epidemiological aspects. Hum Biol. Sep 1968;40(3):314-322.
88. Anderson SE, Dallal GE, Must A. Relative weight and race influence average age
at menarche: results from two nationally representative surveys of US girls
studied 25 years apart. Pediatrics. Apr 2003;111(4 Pt 1):844-850.

33
89. Jones LL, Griffiths PL, Norris SA, Pettifor JM, Cameron N. Age at menarche and
the evidence for a positive secular trend in urban South Africa. Am J Hum Biol.
Jan-Feb 2009;21(1):130-132.
90. Wise LA, Krieger N, Zierler S, Harlow BL. Lifetime socioeconomic position in
relation to onset of perimenopause. J Epidemiol Community Health. Nov
2002;56(11):851-860.
91. Sammel MD, Freeman EW, Liu Z, Lin H, Guo W. Factors that influence entry
into stages of the menopausal transition. Menopause. Nov-Dec 2009;16(6):1218-
1227.
92. Henderson KD, Bernstein L, Henderson B, Kolonel L, Pike MC. Predictors of the
timing of natural menopause in the Multiethnic Cohort Study. Am J Epidemiol.
Jun 1 2008;167(11):1287-1294.
93. Randolph JF, Jr., Sowers M, Bondarenko IV, Harlow SD, Luborsky JL, Little RJ.
Change in estradiol and follicle-stimulating hormone across the early menopausal
transition: effects of ethnicity and age. J Clin Endocrinol Metab. Apr
2004;89(4):1555-1561.
94. Santoro N, Lasley B, McConnell D, et al. Body size and ethnicity are associated
with menstrual cycle alterations in women in the early menopausal transition: The
Study of Women's Health across the Nation (SWAN) Daily Hormone Study. J
Clin Endocrinol Metab. Jun 2004;89(6):2622-2631.
95. Santoro N, Crawford SL, Lasley WL, et al. Factors related to declining luteal
function in women during the menopausal transition. J Clin Endocrinol Metab.
May 2008;93(5):1711-1721.
96. Van Voorhis BJ, Santoro N, Harlow S, Crawford SL, Randolph J. The
relationship of bleeding patterns to daily reproductive hormones in women
approaching menopause. Obstet Gynecol. Jul 2008;112(1):101-108.
97. Dorjgochoo T, Kallianpur A, Gao YT, et al. Dietary and lifestyle predictors of age
at natural menopause and reproductive span in the Shanghai Women's Health
Study. Menopause. Sep-Oct 2008;15(5):924-933.
98. Ortega-Ceballos PA, Moran C, Blanco-Munoz J, Yunes-Diaz E, Castaneda-
Iniguez MS, Salmeron J. Reproductive and lifestyle factors associated with early
menopause in Mexican women. Salud Publica Mex. Jul-Aug 2006;48(4):300-307.
99. Palmer JR, Rosenberg L, Wise LA, Horton NJ, Adams-Campbell LL. Onset of
natural menopause in African American women. Am J Public Health. Feb
2003;93(2):299-306.

34
100. Dratva J, Gomez Real F, Schindler C, et al. Is age at menopause increasing across
Europe? Results on age at menopause and determinants from two population-
based studies. Menopause. Mar-Apr 2009;16(2):385-394.
101. Cassou B, Mandereau L, Aegerter P, Touranchet A, Derriennic F. Work-related
factors associated with age at natural menopause in a generation of French
gainfully employed women. Am J Epidemiol. Aug 15 2007;166(4):429-438.
102. Hardy R, Mishra GD, Kuh D. Body mass index trajectories and age at menopause
in a British birth cohort. Maturitas. Apr 20 2008;59(4):304-314.
103. Kaczmarek M. The timing of natural menopause in Poland and associated factors.
Maturitas. Jun 20 2007;57(2):139-153.
104. Kapur P, Sinha B, Pereira BM. Measuring climacteric symptoms and age at
natural menopause in an Indian population using the Greene Climacteric Scale.
Menopause. Mar-Apr 2009;16(2):378-384.
105. Do KA, Treloar SA, Pandeya N, et al. Predictive factors of age at menopause in a
large Australian twin study. Hum Biol. Dec 1998;70(6):1073-1091.
106. Brett KM, Cooper GS. Associations with menopause and menopausal transition in
a nationally representative US sample. Maturitas. Jun 30 2003;45(2):89-97.
107. Cooper GS, Baird DD, Darden FR. Measures of menopausal status in relation to
demographic, reproductive, and behavioral characteristics in a population-based
study of women aged 35-49 years. Am J Epidemiol. Jun 15 2001;153(12):1159-
1165.
108. Messing K, Saurel-Cubizolles MJ, Bourgine M, Kaminski M. Menstrual-cycle
characteristics and work conditions of workers in poultry slaughterhouses and
canneries. Scand J Work Environ Health. Oct 1992;18(5):302-309.
109. Sternfeld B, Jacobs MK, Quesenberry CP, Jr., Gold EB, Sowers M. Physical
activity and menstrual cycle characteristics in two prospective cohorts. Am J
Epidemiol. Sep 1 2002;156(5):402-409.
110. Picardi A, Cipponeri E, Bizzarri C, Fallucca S, Guglielmi C, Pozzilli P. Menarche
in type 1 diabetes is still delayed despite good metabolic control. Fertil Steril.
Nov 2008;90(5):1875-1877.
111. Lombardo F, Salzano G, Crisafulli G, et al. Menarcheal timing in intensively
treated girls with type 1 diabetes mellitus. Nutr Metab Cardiovasc Dis. Jan
2009;19(1):35-38.
112. Yeshaya A, Orvieto R, Dicker D, Karp M, Ben-Rafael Z. Menstrual
characteristics of women suffering from insulin-dependent diabetes mellitus. Int J
Fertil Menopausal Stud. Sep-Oct 1995;40(5):269-273.

35
113. Dorman JS, Steenkiste AR, Foley TP, et al. Menopause in type 1 diabetic women:
is it premature? Diabetes. Aug 2001;50(8):1857-1862.
114. Luborsky JL, Meyer P, Sowers MF, Gold EB, Santoro N. Premature menopause
in a multi-ethnic population study of the menopause transition. Hum Reprod. Jan
2003;18(1):199-206.
115. Ortiz AP, Harlow SD, Sowers M, Nan B, Romaguera J. Age at natural menopause
and factors associated with menopause state among Puerto Rican women aged 40-
59 years, living in Puerto Rico. Menopause. Jan-Feb 2006;13(1):116-124.
116. Rubba F, Mattiello A, Chiodini P, et al. Menstrual cycle length, serum lipids and
lipoproteins in a cohort of Italian Mediterranean women: findings from Progetto
ATENA. Nutr Metab Cardiovasc Dis. Dec 2008;18(10):659-663.
117. Roumain J, Charles MA, de Courten MP, et al. The relationship of menstrual
irregularity to type 2 diabetes in Pima Indian women. Diabetes Care. Mar
1998;21(3):346-349.
118. Weiss DJ, Charles MA, Dunaif A, et al. Hyperinsulinemia is associated with
menstrual irregularity and altered serum androgens in Pima Indian women.
Metabolism. Jul 1994;43(7):803-807.
119. Solomon CG, Hu FB, Dunaif A, et al. Long or highly irregular menstrual cycles
as a marker for risk of type 2 diabetes mellitus. JAMA. Nov 21
2001;286(19):2421-2426.
120. Cooper GS, Ephross SA, Sandler DP. Menstrual patterns and risk of adult-onset
diabetes mellitus. J Clin Epidemiol. Nov 2000;53(11):1170-1173.
121. Joshi JV, Bhandarkar SD, Chadha M, Balaiah D, Shah R. Menstrual irregularities
and lactation failure may precede thyroid dysfunction or goitre. J Postgrad Med.
Jul-Sep 1993;39(3):137-141.
122. Benson RC, Dailey ME. The menstrual pattern in hyperthyroidism and
subsequent posttherapy hypothyroidism. Surg Gynecol Obstet. Jan
1955;100(1):19-26.
123. Sowers M, Luborsky J, Perdue C, Araujo KL, Goldman MB, Harlow SD. Thyroid
stimulating hormone (TSH) concentrations and menopausal status in women at
the mid-life: SWAN. Clin Endocrinol (Oxf). Mar 2003;58(3):340-347.
124. DeWaay DJ, Syrop CH, Nygaard IE, Davis WA, Van Voorhis BJ. Natural history
of uterine polyps and leiomyomata. Obstet Gynecol. Jul 2002;100(1):3-7.
125. Marino JL, Eskenazi B, Warner M, et al. Uterine leiomyoma and menstrual cycle
characteristics in a population-based cohort study. Hum Reprod. Oct
2004;19(10):2350-2355.

36
126. Hardy R, Kuh D, Wadsworth M. Smoking, body mass index, socioeconomic
status and the menopausal transition in a British national cohort. Int J Epidemiol.
Oct 2000;29(5):845-851.
127. Cooper GS, Sandler DP, Bohlig M. Active and passive smoking and the
occurrence of natural menopause. Epidemiology. Nov 1999;10(6):771-773.
128. Kinney A, Kline J, Levin B. Alcohol, caffeine and smoking in relation to age at
menopause. Maturitas. Apr 20 2006;54(1):27-38.
129. McKinlay SM, Brambilla DJ, Posner JG. The normal menopause transition.
American Journal of Human Biology. 1992;4:37-46.
130. Ashrafi M, Ashtiani SK, Malekzadeh F, Amirchaghmaghi E, Kashfi F, Eshrati B.
Factors associated with age at natural menopause in Iranian women living in
Tehran. Int J Gynaecol Obstet. Aug 2008;102(2):175-176.
131. Chompootweep S, Tankeyoon M, Yamarat K, Poomsuwan P, Dusitsin N. The
menopausal age and climacteric complaints in Thai women in Bangkok.
Maturitas. Jul 1993;17(1):63-71.
132. Garrido-Latorre F, Lazcano-Ponce EC, Lopez-Carrillo L, Hernandez-Avila M.
Age of natural menopause among women in Mexico City. Int J Gynaecol Obstet.
May 1996;53(2):159-166.
133. Windham GC, Elkin EP, Swan SH, Waller KO, Fenster L. Cigarette smoking and
effects on menstrual function. Obstet Gynecol. Jan 1999;93(1):59-65.
134. Hornsby PP, Wilcox AJ, Weinberg CR. Cigarette smoking and disturbance of
menstrual function. Epidemiology. Mar 1998;9(2):193-198.
135. Dale E, Gerlach DH, Wilhite AL. Menstrual dysfunction in distance runners.
Obstet Gynecol. Jul 1979;54(1):47-53.
136. Torstveit MK, Sundgot-Borgen J. Participation in leanness sports but not training
volume is associated with menstrual dysfunction: a national survey of 1276 elite
athletes and controls. Br J Sports Med. Mar 2005;39(3):141-147.
137. Munster K, Schmidt L, Helm P. Length and variation in the menstrual cycle--a
cross-sectional study from a Danish county. Br J Obstet Gynaecol. May
1992;99(5):422-429.

37
CHAPTER II
Poor Agreement Found Between Staging the Menopausal Transition Using Annual
Interview Questions or Annual Follicle-Stimulating Hormone Measures and
Menstrual Calendars
Introduction
In the past decade, the stages of women’s reproductive life have become more
clearly defined. The 2001 Stages of Reproductive Aging Workshop (STRAW) defined
the menopausal transition (MT) as having two distinct perimenopausal stages, early and
late. The start of the early MT was defined by increased variability in menstrual cycle
length, defined as a change in consecutive cycle lengths of at least 7 days, while the start
of the late MT was defined by amenorrhea of at least 60 days[1]. These definitions have
since been validated by the ReSTAGE collaboration.[2-4] STRAW also noted that serum
follicle-stimulating hormone (FSH) increases during the MT. Since STRAW, studies
have demonstrated that the mean levels of FSH differ between the different stages of the
MT[5] and the rates of change in FSH level also differ.[6, 7]
The data that were used to validate the menstrual bleeding markers for early and
late MT stages came from prospectively collected menstrual calendars, the preferred
method of data collection[8]. However, data collection using menstrual calendars is more
labor intensive and therefore more costly than studies that use questionnaires. Several
cohort studies of midlife women have used annual interviews to classify women’s

38
menopausal status, yet few studies have assessed the agreement between information
obtained from an annual interview and menstrual calendars in midlife women. The
Melbourne Women’s Midlife Health Project (MWMHP) found that the interview
questions used in their study had low sensitivity for picking up menstrual cycle
variability and menses flow variability.[9] The Seattle Midlife Women’s Health Study
(SMWHS) compared interview questions inquiring about menstrual cycle irregularity to
menstrual calendars and reported weak agreement.[10] Neither of these two studies
examined factors that influence agreement. The purpose of this paper was to assess the
agreement between MT stages as defined by the annual interview or annual FSH level
and MT stages defined by the monthly menstrual calendar in the Study of Women’s
Health Across the Nation (SWAN) and to examine demographic and lifestyle factors that
may influence this agreement.
Methods
SWAN is a multiethnic, multi-site cohort study of middle-aged women. The
design of the study has been previously described.[11] Briefly, a cross-sectional
screening survey was administered to 16,065 women at seven sites between 1995 and
1997 to assess eligibility for enrollment into the cohort study. Eligibility criteria for the
survey included women, age 40-55 years old, self-designation as a member of the
targeted racial/ethnic group and residence in the geographic area of one of the seven
clinic sites, the ability to speak English, Cantonese, Japanese, or Spanish, and the ability
to give verbal consent. Each site recruited Caucasian women and women from one
specified minority group (African Americans in Pittsburgh, Boston, southeastern
Michigan, and Chicago; Japanese in Los Angeles; Chinese in Oakland; and Hispanic
women in Newark). A total of 3302 women were enrolled into the cohort study.

39
Eligibility for the cohort study included age 42-52 years, an intact uterus, at least one
menstrual period and no use of reproductive hormones in the previous 3 months.
Institutional Review Boards at each study site approved the protocol.
The cohort study began in 1996 and annual follow-up visits have been conducted
since that time. This paper includes data through annual visit 10. Each visit consisted of
both interviewer-administered and self-administered questionnaires that inquired into a
broad range of topics including information on menstrual experience as well as socio-
demographic experience, lifestyle, and medical history. The participants also underwent
physical assessments that included a blood draw.
A self-administered monthly menstrual calendar component began in 1996 and
continued through 2006. Participants filled out the monthly menstrual calendars daily to
capture days where any spotting or bleeding occurred. Heaviness of flow was recorded as
spotting, light to moderate bleeding, or heavy bleeding. On the last day of the month
women indicated whether no bleeding occurred that month by checking the appropriate
box and answered questions about oral contraceptive or hormone therapy use as well as
gynecological procedures which could affect bleeding. Women were asked to continuing
filling out and returning the monthly calendar for 2 years after their last menstrual bleed.
Women’s menstrual experience was assessed by examining their sequence of
menstrual cycle lengths. A menstrual cycle consists of a bleeding episode and a
subsequent bleed free interval of at least 3 days. Menstrual cycle length was calculated
using bleeding definitions originally developed by the World Health Organization[8] and
previously utilized in ReSTAGE analyses [2, 4].

40
A serum sample was obtained at each annual interview, in the morning following
an overnight fast, on days 2-5 (days 2-7 from January 1996 through May 1996) of a
spontaneous menstrual cycle. Two attempts were made to obtain a day 2-5 sample. If a
timed sample could not be obtained, a random fasting sample was taken within 90 days of
the anniversary of the baseline visit. FSH assays were conducted using an ACS-180
automated analyzer (Bayer Diagnostics Corp., Norwood, MA). FSH concentrations were
measured with a two-site chemiluminometric immunoassay. The interassay coefficient of
variation was 12.0%, the intraassay coefficient of variation was 6.0%, and the lower limit
of detection was 1.1 IU/liter.
Classification of Reproductive Stage
Menstrual calendar
Bleeding criteria for the onset of early and late MT stages were defined from the
calendar data using definitions developed by STRAW/ReSTAGE[1-4]. We defined the
bleeding marker of the early MT as a persistent difference of ≥7 days in the menstrual
cycle length of consecutive cycles. Persistence is defined as recurrence within 10 cycles
of the first variable length cycle. The start date of early MT was then defined as the first
day of the first variable length cycle. We defined two bleeding markers for late MT. The
first definition, consistent with the SWAN annual interview algorithm, was the first day
of the first occurrence of a cycle length of 90 days or greater. The second definition,
consistent with the STRAW/ReSTAGE definition, used the first occurrence of a cycle
length of 60 days or greater. The final menstrual period (FMP) was defined as the first
day of a bleeding segment which was followed by at least 12 months of amenorrhea. For
women who had missing calendars during the 12 months of amenorrhea, we accepted the

41
potential FMP in the menstrual calendar if the date was less than 31 days different from
the FMP date identified in the annual interview. We also accepted the potential FMP
calendar date if there were only 2 missing calendars during the 12 months of amenorrhea.
Annual Interview
The annual interview ascertained information on menstrual bleeding since the last
study visit which was used to define a women’s menopause status. The questions, based
on the Massachusetts Women’s Health Study (MWHS),[12] included the following four
questions: “Did you have any menstrual bleeding since your last study visit? Did you
have any menstrual bleeding in the last 3 months? What was the date that you started
your most recent menstrual bleeding? Which of the following best describes your
menstrual periods since your last study visit: have they become farther apart, become
closer together, occurred at more variable intervals, stayed the same, become more
regular, or don’t know?” Early MT stage was defined as the first visit where a woman
who had had a menstrual period within the last 3 months reported that the variability of
her menstrual periods had increased (either became farther apart, closer together, or with
more variable intervals). Late MT stage was defined as the first visit where a woman
reported that she had a menstrual period in the last year but had not had a menstrual
period in the last three months at the time of the interview. Final Menstrual Period (FMP)
was defined retrospectively as the self-reported date of the last menstrual period after at
least 12 months of amenorrhea, not due to pregnancy or lactation.
FSH Based on previous analyses of FSH trajectories using the SWAN
population [6], we defined the early MT by FSH level as the first annual visit with a

42
serum FSH concentration between 15 and 29.9 IU/liter. We defined late MT by FSH
level as the first annual visit with a serum FSH concentration of 30.0 IU/liter or greater.
Covariates
Ethnicity was self-defined and categorized as African American, Chinese,
Japanese, or Caucasian. Highest education (high school graduate /GED or less than high
school versus at least some college) and marital status (single, married, or separated,
widowed, or divorced) were assessed at baseline. Economic strain was assessed during
the initial screening survey with the question “how hard is it to pay for basics?” and was
categorized as very hard, somewhat hard, or not hard. Prior use of female hormone
therapy (not oral contraceptives) was assessed during the initial screening survey as well.
Height was measured without shoes using either a metric folding wooden ruler or
measuring tape (home and some clinic visits), or a fixed stadiometer (clinic visits).
Weight was measured without shoes, and in light indoor clothing, using a portable digital
scale (home and some clinic visits) or either a digital or balance beam scale in the clinic.
Body mass index (BMI), calculated as weight in kilograms divided by height in meters
squared, was categorized as underweight (<18.5 kg/m2), normal weight (18.5-24.9
kg/m2)
, overweight (25.0-29.9 kg/m2), or obese (≥30.0 kg/m
2).
Statistical analyses
For this analysis cleaned calendar data were available from four study sites
(Boston, southern Michigan, Oakland, and Los Angeles). Analyses were restricted to
women who had at least 10 consecutive untreated (i.e. not using hormones) menstrual
cycles recorded in the menstrual calendar. We assessed agreement between MT stage
based on menstrual calendar and MT stage based on the annual interview and on MT

43
stage based on annual FSH level in all eligible women and in women who had a
documented FMP in the menstrual calendar. Since failure to observe transition stages
was common among women not observed through the FMP, and the analyses were
consistent (see Appendix A), we present results only for analyses among women with a
documented FMP. Women were censored at the time of hysterectomy or bilateral
oophorectomy. Women who started hormone therapy were excluded. Women who were
already in early MT at the baseline interview were excluded from the assessment of early
MT as it was not possible to assess the time of onset of early MT in these women.
Similarly, women who had serum FSH concentrations of 15.0 IU/liter or greater at
baseline were excluded from assessment of early MT in the comparison with FSH, and
women who had serum FSH concentration of 30.0 IU/liter or greater at baseline were
excluded from comparisons of early and late MT in analyses comparing FSH defined MT
with MT stage by menstrual calendar.
Data were analyzed using SAS v. 9.2 (SAS Institute Inc., Carey, NC.). To
compare baseline characteristics of eligible women and other participants, Pearson’s chi-
square or Fisher's exact tests were used to compare proportions, and Student's t tests were
used to compare means.
To examine agreement between the MT stage by annual interview and MT stage
by menstrual calendar, the date of entry into each MT stage was determined in the
calendar and compared to the MT stage at the next annual interview. If the annual
interview MT stage indicated a change in stage from the prior visit, then the annual
interview MT stage and the calendar MT stage were determined to have occurred at the
same time. If the annual interview MT stage changed at an earlier visit, then the annual
44
interview MT stage was determined to have occurred before the menstrual calendar MT
stage. If the annual interview MT stage changed at a later visit then it was determined to
have occurred after the menstrual calendar MT stage. If an annual interview MT stage,
menstrual calendar MT stage, or both were not observed this was also characterized. The
percent in each of these agreement categories was calculated. An example is shown in
Figure 2.1. In this example, the early MT bleeding marker was observed in the menstrual
calendar between annual visit 2 and visit 3. If the annual interview at visit 3 observed a
change in MT stage from pre MT stage to early MT stage, then the two methods occurred
at same time (0). If the annual interview observed a change at visit 4, then the early MT
stage by menstrual calendar is defined as having occurred 1 visit before the annual
interview (-1). If the annual interview observed the change at visit 2, then the early MT
stage by menstrual calendar is defined as having occurred 1 visit after the annual
interview (+1).
Agreement was defined as concordant when either the annual interview MT stage
and the menstrual calendar MT stage occurred at the same time or both the annual
interview MT stage and the menstrual calendar MT stage were not observed. Discordance
was defined when the timing of the annual interview MT stage and timing of the
menstrual calendar MT stage did not match, or if either the annual interview MT stage or
the menstrual calendar MT stage were not observed. Cohen’s Kappa statistics were
calculated for 2 by 2 tables (Figure 2.2). Muliple logistic regression was used to examine
factors that influenced discordance. The same approach was used to compare the annual
FSH MT stage with the menstrual calendar MT stage.
Results

45
Among the 1950 participants from the four study sites, 1852 (95.0%) enrolled in
the SWAN calendar study. Participation rates were as follows: Boston 94.0%, south-
eastern Michigan 90.8%, Oakland 98.0%, and Los Angeles 97.6%. Of these women,
1339 (72.3%) recorded at least 10 consecutive untreated non-missing cycles and were
eligible for this analysis. At baseline, eligible women were more likely to be from the
Oakland and Los Angeles study sites and thus more likely to be Chinese or Japanese than
non-eligible participants. Women included in this analysis were younger, more educated,
and more likely to be married than other study women. Eligible women were also less
likely to report economic strain and less likely to be overweight or obese than other study
women, but did not differ in history of having used female hormones at baseline. (Table
2.1a)
Of the 1339 eligible women, 379 (28.3%) had their FMP recorded in the calendar
study, 23 (1.7%) had a hysterectomy, 381 (28.5%) started taking female hormones, 435
(32.5%) women did not complete the calendar study through FMP or hysterectomy, and
121 (9.0%) were still recording menstrual bleeding at the end of the study. Women who
had their FMP recorded were older at study enrollment, and were more likely to be from
the Oakland and Los Angeles study sites, thus Chinese or Japanese, than other eligible
women. Education, marital status, economic strain, BMI, and history of female hormone
use did not differ at baseline between women whose FMP was and was not recorded.
(Table 2.1b)
Comparison of MT stage by menstrual calendar to MT stage by annual interview.
For 42.8% of women, the early MT stage by menstrual calendar occurred at the
same time as the early MT stage by annual interview.(Table 2.2) However, a large

46
percentage of women had their early MT stage by menstrual calendar occur more than a
year before the onset of early MT stage by the annual interview, with 12% having had
their early MT stage by menstrual calendar occur at one visit before and 17.2% having
had their early MT stage by menstrual calendar occur two or more visits before the early
MT stage was assigned by the annual interview. A smaller percentage had onset of early
MT stage reported in the annual interview before the occurrence of the early MT stage by
annual interview. The early MT stage by menstrual calendar occurred one visit after the
early MT stage by annual interview in 6.8% and two or more visits later in 4.4% of
women. An early MT stage by annual interview, early MT stage by menstrual calendar,
or both was not observed in 16.8% of women. Thus, agreement was poor between the
early MT stage by menstrual calendar and the early MT stage by annual interview (Kappa
= -0.13, 95% confidence interval= - 0.25, -0.02).
Women from the Boston study site were more likely to be discordant (OR=2.17,
95%CI= 1.03, 4.53) than women from Los Angeles. Race/ethnicity, education, age,
marital status, economic strain, BMI, and history of female hormone use were not
associated with discordance.
In order to compare similar definitions of late MT stage, the late MT stage
by menstrual calendar, defined as first cycle length of at least 90 days , was compared to
the late MT stage by annual interview. (Table 2.2) The two classifications were
concurrent in 13.5% of women. The late MT stage by menstrual calendar tended to occur
earlier with 29.0% occurring one visit prior and 12.2% occurring at least two visits prior
to the late MT stage by annual interview. Only 1.9% of late MT stage by menstrual
calendar occurred after the late MT stage by annual interview. A large percentage of

47
women (21.4%) did not have the late MT stage identified by annual interview but had a
late MT stage identified in the calendar, while 12.1% of women did not have their late
MT stage identified by either method. Similar to the analysis of agreement of early
transition, poor agreement was found between the late MT stage by menstrual calendar
and the late MT stage by annual interview (Kappa= -0.18, 95%CI= -0.26, -0.11).
We next examined agreement between the STRAW/ReSTAGE preferred
definition for the late MT stage by menstrual calendar (cycle length of at least 60 days)
and the late MT stage by the annual interview. The two classifications were concurrent
in 6.1% of the women. Similar to analysis of the 90 day definition, most women had
their late MT stage by menstrual calendar occur before the late MT stage by annual
interview, with 21.9% occurring one visit prior and 34.3% occurring at least two visits
prior. A very small number of women (0.6%) had their late MT stage by menstrual
calendar occur after being classified as in late MT stage by the annual interview. The
percent of women who did not have late MT stage by annual interview but had a late MT
stage by menstrual calendar was 26.6%, while 3.7% had late MT stage by annual
interview but no late MT stage observed in the calendar. A small number of women
(6.9%) did not have the late MT stage identified by either classification method. Similar
to the results for the 90 day definition, poor agreement was found between the 60 day
late MT stage by menstrual calendar and the late MT stage by the annual interview
(Kappa =-0.08, 95%CI= -0.12, -0.03).
When we examined factors that influence discordance in classification between
late MT stage by menstrual calendar and late MT stage by annual interview for the 90
day definition, women from Oakland were more likely to be discordant than women from

48
Los Angeles (OR=2.15, 95%CI= 1.18, 3.93), and a similar relationship was seen in the
discordant analysis for the late MT stage by menstrual calendar 60 day definition
(OR=2.33, 95%CI= 1.04, 5.26). In both discordant analyses, Chinese women were more
likely to be discordant as compared to Caucasian women (late MT definition of 90 days:
OR=2.09, 95%CI= 1.04, 4.23; late MT definition of 60 days: OR=2.71, 95%CI= 1.00,
7.36). African-American women were more likely to be discordant as compared to
Caucasian women for the 90 day definition (OR=2.39, 95%CI= 1.00, 5.71), but not for
the 60 day definition (OR=1.70, 95%CI=0.62, 4.69). Women with a high school
education or less were more likely to be discordant in both analyses (the late MT stage of
90 days: OR=2.16, 95%CI= 1.08, 4.30; late MT stage of 60 days: OR=2.92,
95%CI=1.02, 8.40). Age, marital status, economic strain, BMI, and history of female
hormone were not associated with discordance in either analyses of discordance.
Comparison of MT stage by menstrual calendar to MT stage by FSH
A comparison of the early MT stage by menstrual calendar with the early MT
stage as defined by the FSH level at the annual visit is shown in Table 2.3. For 20.8% of
the women, the classification of early MT stage by FSH level occurred at the same time
as the classification of early MT stage by menstrual calendar. A similar percentage of
women (16.1%) had their early MT stage by menstrual calendar occur either before their
classification of early MT stage by FSH level or after (15.4%). A large percentage of
women (32.2%) had an early MT stage observed in the menstrual calendar but no early
MT stage by FSH level, while 10.1% of women had early MT stage by FSH level but no
early MT stage by menstrual calendar. A small percentage of women (5.4%) women did
not have their early MT stage classified by either method. Poor agreement was found

49
between the early MT stage by menstrual calendar and the early MT stage by FSH level
(Kappa= -0.44, 95% CI= -0.57,-0.30). None of the factors examined (study site,
race/ethnicity, age, education, marital status, economic strain, BMI, and history of female
hormone use) were associated with discordance.
When we compared onset of the late MT based on the menstrual calendar (90 day
definition) to onset of the late MT stage by FSH level (Table 2.3), we observed that many
(43.1%) women had their late MT stage by menstrual calendar occur after their
classification of late MT stage by FSH level. Only 12.7% of women had their late MT
stage by menstrual calendar before their classification of late MT stage by FSH level.
Unlike the early MT stage by FSH level comparison, a small proportion of women
(3.3%) had a late MT stage observed in the menstrual calendar but no late MT stage by
FSH level, while 20.3% of women had a late MT stage by FSH level but no late MT
stage by annual interview. For a very small percentage of women (2.0%), their late MT
stage was not identified by either method. Poor agreement was found between the late
MT stage (90 day definition) in the menstrual calendar and the late MT stage by FSH
level (Kappa= -0.32, 95%CI= -0.42,-0.23). In this analysis, obese women were less
likely to be discordant as compared to women with normal BMI (OR=0.39 95%CI= 0.20,
0.77). Study site, race/ethnicity, age, education, marital status, economic strain, and
history of female hormone use were not associated with discordance.
In contrast, when we compared the late MT stage by menstrual calendar (60 days
definition) to the late MT stage by FSH level (Table 2.3), for 21.0% of women the late
MT stage occurred at the same time by both measures. A similar percentage had their
late MT stage by menstrual calendar occur either before (32.0%) or after (36.1%) their

50
late MT stage by FSH level. A small proportion of women (4.2%) had a late MT stage
by menstrual calendar observed but no late MT stage by FSH level, while only 5.6% of
women had a late MT stage by FSH level but no late MT stage by menstrual calendar
observed. Again a very small percentage of women (1.3%) did not have their late MT
stage identified by either method. Poor agreement was seen in the comparison of the late
MT stage (60 days definition) with the late MT stage by FSH level (Kappa= -0.63,
95%CI= -0.70,-0.56). Unlike the comparison for the 90 days definition, BMI was not
associated with discordance nor were any of the other factors.
Discussion
This study assessed agreement between MT stage as defined by a menstrual
calendar compared to status defined by annual interview and by annual FSH level in
SWAN. Poor agreement was found between the menstrual calendars and the annual
interviews. Menstrual calendars identified the start of early and late MT earlier than the
annual interviews. For the early MT, 29.2 % of women had their status change in the
menstrual calendar occur before it was reported in the annual interview. The late MT
stage by menstrual calendar 90 days definition occurred earlier in 41.2% of the women
and the late MT stage by menstrual calendar 60 days definition occurred earlier in 56.2%
of women. Poor agreement was also found between the menstrual calendar and the
annual FSH level.
Increasing variability in menstrual cycle frequency has been a hallmark
description of the onset of the MT.[4, 13] Using this definition to mark the start of the
early MT, our study found poor agreement between the menstrual calendar and the
annual interview as the annual interview frequently identified early MT 1-3 years later
than the menstrual calendar. Other studies of midlife women have found poor agreement

51
between menstrual calendars and interviews when defining menstrual cycle variability.
The MWMHP reported that annual interviews had low sensitivity in detecting menstrual
cycle irregularity, defined as change in menstrual cycle frequency.[9] The SMWHS
reported poor agreement between annual interviews and menstrual calendars in detecting
menstrual cycle irregularity (Cohen’s kappa= .19).[10]
The reasons for poor agreement for the early MT may be due to differences in
women’s versus researchers’ interpretation of menstrual cycle variability. The annual
interview question used to define the start of the early MT in SWAN asked a woman to
decide if her menstrual periods were farther apart, closer together, or more variable since
her last visit. No definition of what farther apart, closer together, or more variable was
provided. Therefore, women might not all use the same definition nor use the same
definition as researchers. They might only note increased cycle variability when the
difference in cycle length is greater than seven days or when differences start to occur
more frequently. Our data suggests this may be true given that for approximately one-
third of the women the menstrual calendars identified the start of the early MT stage
earlier than the annual interviews.
In this study we also found poor agreement between menstrual calendars and
annual interviews regarding onset of the late MT stage. We used two definitions for the
start of the late MT in the menstrual calendars, a cycle length of at least 90 days and a
cycle length of at least 60 days. The 90 days definition gained prominence in the
1990’s[14] and was easily applied in the clinical setting. Recently, the 60 days definition
has been found to be a better marker for the late MT stage, since 9.0% to 21.4% of
women have passed their FMP before experiencing 90 days of amenorrhea. [2] In this

52
analysis, women were more likely to have experienced the late MT bleeding marker of at
least 60 days (89.4%) than the late MT bleeding marker of at least 90 days (77.8%).
As with the early MT, the menstrual calendars place the start of the late MT
earlier than the annual interview. This finding is not surprising given the structure of the
annual interview questions used to identify late MT. The questions were based on the
MWHS[15] which were designed to capture women who were currently experiencing 3
to 11 months of amenorrhea and were thus likely to be classified as post-menopausal at
their subsequent visit[14]. The annual interview failed to detect a late MT stage in 33.5%
of the women. All of these women were classified as having changed from early MT
directly to being post-menopausal. The annual interview questions ascertained only
whether a woman currently had not bleed for three months, not whether she had
experienced an episode of amenorrhea lasting 90 days or longer in the past year. If in the
past year, a woman had had a menstrual cycle that was 90 days or greater but also had a
menstrual cycle in the three months preceding the annual interview, she would be
classified as being in the early MT by the annual interview definition. However, she
would be staged as late MT by the menstrual calendar. A better interview approach to
identify the start of the late MT would be to ask about the occurrence of any cycle that
was 60 days or greater since the last study visit. This approach was used in the SMWHS,
which found good agreement (Cohen’s kappa =.71) between their interview and their
menstrual calendar status classification, especially once a definition of skipped period
was given to study participants. [10]
We found the agreement for staging the late MT was influenced by study site,
ethnicity, and educational attainment. Chinese women were most likely to have their

53
menstrual calendars and annual interview be discordant. One US study found that Asian
women were less likely to accurately recall their last menstrual cycle length; however, the
association disappeared once other factors were taken into account including education
and income[16]. Our study found women with a high school education or less were more
likely to be discordant. Two studies have found that women with a lower educational
attainment were less likely to recall their last menstrual cycle length, however the
associations were not statistically significant.[16, 17] Both of these studies also reported
that women with lower incomes were less likely to accurately recall their last menstrual
cycle.
This study also found poor agreement between menstrual calendars and MT
classification by annual FSH levels. Although definitive FSH staging criteria have not
been established[18], recent publications give guidance on appropriate values in the
SWAN population[6]. However, for the early MT, one-third of the women did not have
an early MT identified by annual FSH levels suggesting that single annual measurements
of FSH levels frequently miss the rise of FSH, and more frequent measurements may be
necessary. For the late MT stage of 90 days, we found obese women were less likely to
be discordant, consistent with the evidence that obesity affects FSH levels.[6]
This study has some limitations. Since women were enrolled into the study
between the ages of 42-52 years, left censoring likely occurred such that women may
have started the MT before entry into the study. It is possible that the women we
determined to be pre-menopausal at baseline interview were already in early MT at the
time the study began. Selection bias could also have been a factor. Women who were
eligible for this analysis were more likely to be younger, Chinese or Japanese, and to be

54
married as compared to other SWAN participants. Eligible participants were also less
likely to be overweight or obese and were less likely to experience economic strain,
which could reduce power to detect associations.
In conclusion, we found poor agreement between menstrual calendars and annual
interviews when staging women during the MT. Accurately identifying MT stage has
implications for interventions and healthcare. Bone loss is accelerated in the last couple
of years prior to the FMP [19], as well as adverse changes in lipid profiles [20].
Treatment and lifestyle intervention should optimally begin before this time period.
Since menstrual calendars are considered the gold standard when measuring menstrual
cycle characteristics, these results suggest the need to improve questionnaire based
approaches to classification of MT stage. Currently available instruments do not
adequately capture the start of the early MT. For the late MT stage, questions that are
similar to the skipped periods question used in SMWHS are suggested and need to be
validated in a multiethnic population. Increasing the frequency of interviews and blood
draws may also be warranted. These results also suggest that misclassification of stage
may be an important concern in studies that assess change in health status by MT stage
based on annual interview classification. Re-analysis of major findings using menstrual
calendar based classifications is likely warranted.
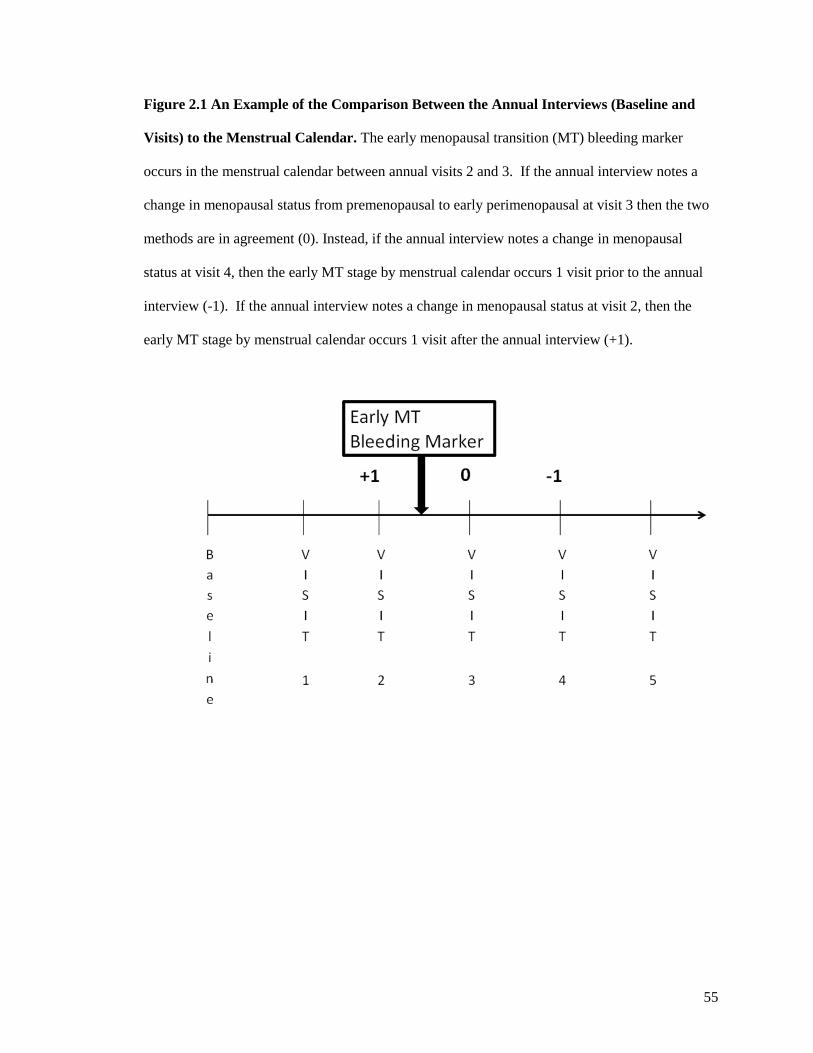
55
Figure 2.1 An Example of the Comparison Between the Annual Interviews (Baseline and
Visits) to the Menstrual Calendar. The early menopausal transition (MT) bleeding marker
occurs in the menstrual calendar between annual visits 2 and 3. If the annual interview notes a
change in menopausal status from premenopausal to early perimenopausal at visit 3 then the two
methods are in agreement (0). Instead, if the annual interview notes a change in menopausal
status at visit 4, then the early MT stage by menstrual calendar occurs 1 visit prior to the annual
interview (-1). If the annual interview notes a change in menopausal status at visit 2, then the
early MT stage by menstrual calendar occurs 1 visit after the annual interview (+1).

56
Figure 2.2 The 2 by 2 Table for Calculation of Cohen’s Kappa Statistic
Menstrual Calendar
Yes No
Annual
Interview
Yes
Same time
Interview stage before calendar stage
+
Interview stage but no calendar stage
No
Calendar stage before
interview stage
+
Calendar stage but no
interview stage
Neither interview stage nor calendar
stage observed

57
Table 2.1a Baseline Demographics of Women Participating in the SWAN Menstrual
Calendar Study
Eligible
Participants1
n=1339
All Others
n=611
P-value2
Age at Screener in years, Mean (SD) 45.5 (±2.6) 46.5 (±2.9) <.01
n (%) n (%)
Study Site
Michigan 301 (22.5) 242 (39.6) <.01
Boston 290 (21.7) 162 (26.5)
Oakland 350 (26.1) 109 (17.8)
Los Angeles 398 (29.7) 98 (16.0)
Race/Ethnicity
African-American 263 (19.6) 261 (42.7) <.01
Chinese 202 (15.1) 48 (7.9)
Japanese 226 (16.9) 55 (9.0)
Caucasian 648 (48.4) 247 (40.4)
Language of Baseline Interview
English 1168 (87.2) 561 (91.8) .01
Cantonese 86 (6.4) 23 (3.8)
Japanese 85 (6.4) 27 (4.4)
Education
Less than High School 51 (3.8) 40 (6.7) <.01
High School Grad 202 (15.2) 120 (20.0)
Some College/Vocation 421 (31.6) 220 (36.6)
College Graduate 319 (24.0) 114 (19.0)
Post College 339 (25.5) 107 (17.8)
Missing 7 10
Marital Status
Single 204 (15.4) 96 (15.9) <.01
Married 902 (68.0) 349 (57.8)
Separated 40 (3.0) 37 (6.1)
Widowed 17 (1.3) 21 (3.5)
Divorced 163 101 (16.7)
Missing 13
How Hard Is It To Pay For Basics
Very Hard 89 (6.7%) 68 (11.3) <.01
Somewhat Hard 341 (25.8) 199 (22.1)
Not Hard 891 (67.5) 335 (55.7)
Missing 18 9
Body Mass Index, kg/m2
Underweight (<18.5) 33 (2.5) 16 (2.7) <.01
Normal (18.5-24.9) 727 (55.1) 238 (39.8)
Overweight (25.0 -29.9) 275 (20.9) 153 (25.6)
Obese(≥ 30.0) 284 (21.5) 191 (31.9)
Missing 20 13
Ever taken hormones at screener 150 (11.3) 73 (12.1) .61
Missing 17 10 1At least 10 consecutive untreated non-missing cycles observed in calendar
2Missing not included in P-
2value calculation.

58
Table 2.1b Baseline Demographics of Women Participating in the SWAN Menstrual
Calendar Study with at least 10 Consecutive Untreated Non-Missing Cycles Observed by
FMP Status
FMP
observed
N=379
NO FMP observed
N=960
P-value1
Age at Screener in years , Mean (SD) 46.3 (±2.5) 45.2 (±2.5) <.01
n (%) n (%)
Study Site
Michigan 60 (15.8) 241 (25.1) . <.01
Boston 76 (20.1) 214 (22.3)
Oakland 107 (28.2) 243 (25.3)
Los Angeles 136 (35.9) 262 (27.3)
Race/Ethnicity
African-American 47 (12.4) 216 (22.5) <.01
Chinese 72 (19.0) 130 (13.5)
Japanese 94 (24.8) 132 (13.8)
Caucasian 166 (43.8) 482 (50.2)
Language of Baseline Interview
English 305 (80.5) 863 (89.9) <.01
Cantonese 32 (8.4) 54 (5.6)
Japanese 42 (11.1) 43 (4.5)
Education
Less than High School 15 (4.0) 36 (3.8) .99
High School Grad 57 (15.0) 145 (15.2)
Some College/Vocation 119 (31.4) 302 (31.7)
College Graduate 91 (24.0) 228 (23.9)
Post College 97 (25.6) 242 (25.4)
Missing 0 7
Marital Status
Single 62 (16.5) 142 (15.0) .16
Married 267 (71.0) 635 (66.8)
Separated 8 (2.1) 32 (3.4)
Widowed 3 (0.8) 14 (1.5)
Divorced 36 (9.6) 127 (13.4)
Missing 3 10
How Hard Is It To Pay For Basics
Very Hard 16 (4.3) 73 (7.7) .08
Somewhat Hard 98 (26.3) 243 (25.6)
Not Hard 259 (69.4) 632 (66.7)
Missing 6 12
Body Mass Index, kg/m2
Underweight (<18.5) 13 (3.5) 20 (2.1) .12
Normal (18.5 -24.9) 219 (58.7 ) 508 (53.7 )
Overweight (25.0 -29.9) 69 (18.5) 206 (21.8)
Obese(≥ 30.0) 72 (19.3) 212 (22.4)
Missing 6 14
Ever taken hormones at screener 35 (9.4) 115 (12.1) .16 1Missing not included in P-value calculation

59
Table 2.2 Menopausal Transition (MT) Stage by Menstrual Calendar Compared to MT Stage by Annual Interview among
Those with Observed FMP in the Menstrual Calendar
Early MT Stage1
n=250
Late MT Stage
(≥ 90 days)
n=379
Late MT Stage of
(≥ 60days)
n=379
n % n % n %
No Interview MT stage 7 2.8 81 21.4 101 26.6
3+ visits before Interview (-3) 18 7.2 18 4.8 52 13.7
2 visits before Interview (-2) 25 10.0 28 7.4 78 20.6
1 Visit before Interview (-1) 30 12.0 110 29.0 83 21.9
Markers at Same Time (0) 107 42.8 51 13.5 23 6.1
1 visit after Interview (+1) 17 6.8 6 1.6 1 0.3
2 visits after Interview (+2) 9 3.6 0 0.0 0 0.0
3+ visits after Interview (+3) 2 0.8 1 0.3 1 0.3
No Calendar Marker 18 7.2 38 10.0 14 3.7
Neither Marker nor Interview 17 6.8 46 12.1 26 6.9
% Agreement 124 49.6 97 25.6 49 12.9
Kappa (95% Confidence
Interval)
-0.13 (-0.25, -0.02) -0.18 (-0.26, -0.11) -0.08 (-0.12,-0.03)
1Note for comparison of early MT stage by menstrual calendar to early MT stage by annual interview, women who determined to be
in early MT stage by baseline interview were excluded. If early MT stage by menstrual calendar occurred at same time or after the late
MT stage by menstrual calendar than then early MT stage by menstrual calendar was set to missing.
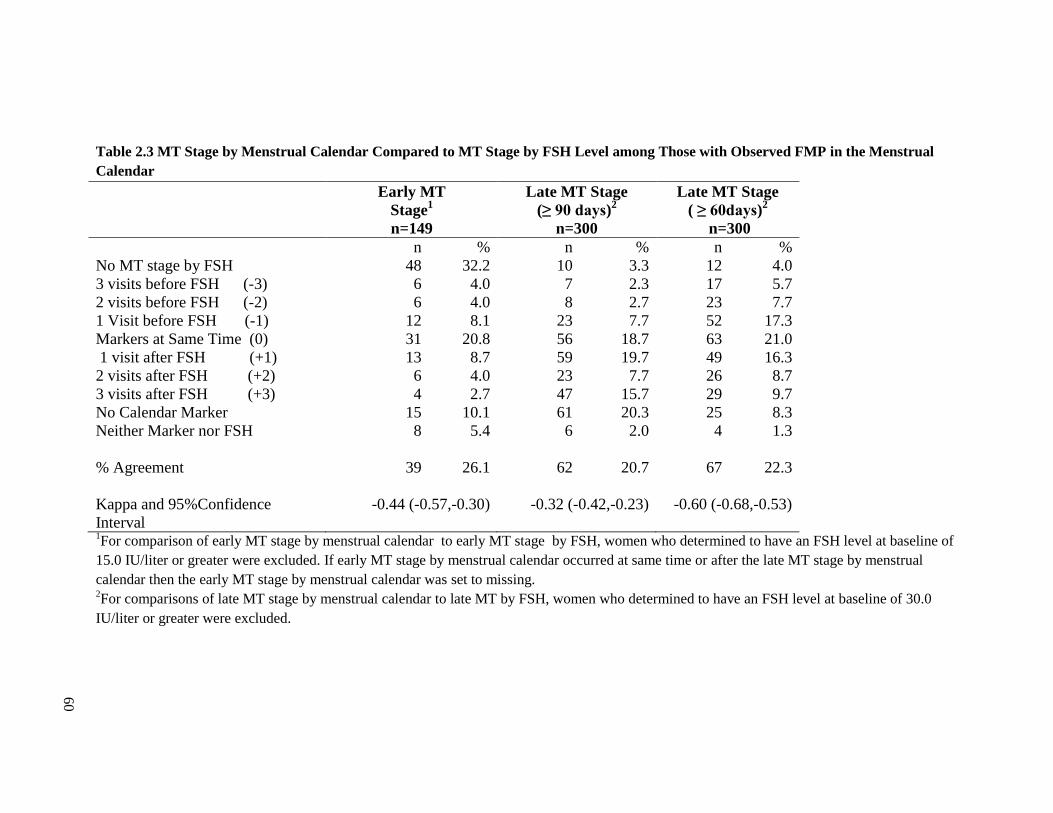
60
Table 2.3 MT Stage by Menstrual Calendar Compared to MT Stage by FSH Level among Those with Observed FMP in the Menstrual
Calendar
Early MT
Stage1
n=149
Late MT Stage
(≥ 90 days)2
n=300
Late MT Stage
( ≥ 60days)2
n=300
n % n % n %
No MT stage by FSH 48 32.2 10 3.3 12 4.0
3 visits before FSH (-3) 6 4.0 7 2.3 17 5.7
2 visits before FSH (-2) 6 4.0 8 2.7 23 7.7
1 Visit before FSH (-1) 12 8.1 23 7.7 52 17.3
Markers at Same Time (0) 31 20.8 56 18.7 63 21.0
1 visit after FSH (+1) 13 8.7 59 19.7 49 16.3
2 visits after FSH (+2) 6 4.0 23 7.7 26 8.7
3 visits after FSH (+3) 4 2.7 47 15.7 29 9.7
No Calendar Marker 15 10.1 61 20.3 25 8.3
Neither Marker nor FSH 8 5.4 6 2.0 4 1.3
% Agreement 39 26.1 62 20.7 67 22.3
Kappa and 95%Confidence
Interval
-0.44 (-0.57,-0.30) -0.32 (-0.42,-0.23) -0.60 (-0.68,-0.53)
1For comparison of early MT stage by menstrual calendar to early MT stage by FSH, women who determined to have an FSH level at baseline of
15.0 IU/liter or greater were excluded. If early MT stage by menstrual calendar occurred at same time or after the late MT stage by menstrual
calendar then the early MT stage by menstrual calendar was set to missing. 2For comparisons of late MT stage by menstrual calendar to late MT by FSH, women who determined to have an FSH level at baseline of 30.0
IU/liter or greater were excluded.

61
References
1. Soules MR, Sherman S, Parrott E, et al. Executive summary: Stages of
Reproductive Aging Workshop (STRAW). Fertil Steril. Nov 2001;76(5):874-878.
2. Harlow SD, Cain K, Crawford S, et al. Evaluation of four proposed bleeding
criteria for the onset of late menopausal transition. J Clin Endocrinol Metab. Sep
2006;91(9):3432-3438.
3. Harlow SD, Crawford S, Dennerstein L, Burger HG, Mitchell ES, Sowers MF.
Recommendations from a multi-study evaluation of proposed criteria for staging
reproductive aging. Climacteric. Apr 2007;10(2):112-119.
4. Harlow SD, Mitchell ES, Crawford S, Nan B, Little R, Taffe J. The ReSTAGE
Collaboration: defining optimal bleeding criteria for onset of early menopausal
transition. Fertil Steril. Jan 2008;89(1):129-140.
5. Gracia CR, Sammel MD, Freeman EW, et al. Defining menopause status: creation
of a new definition to identify the early changes of the menopausal transition.
Menopause. Mar 2005;12(2):128-135.
6. Randolph JF, Jr., Zheng H, Sowers MR, et al. Change in follicle-stimulating
hormone and estradiol across the menopausal transition: effect of age at the final
menstrual period. J Clin Endocrinol Metab. Mar 2011;96(3):746-754.
7. Sowers MR, Zheng H, McConnell D, Nan B, Harlow S, Randolph JF, Jr. Follicle
stimulating hormone and its rate of change in defining menopause transition
stages. J Clin Endocrinol Metab. Oct 2008;93(10):3958-3964.
8. Rodriguez G, Faundes-Latham A, Atkinson LE. An approach to the analysis of
menstrual patterns in the critical evaluation of contraceptives. Stud Fam Plann.
Feb 1976;7(2):42-51.
9. Taffe J, Dennerstein L. Retrospective self-report compared with menstrual diary
data prospectively kept during the menopausal transition. Climacteric. Sep
2000;3(3):183-191.
10. Smith-DiJulio K, Mitchell ES, Woods NF. Concordance of retrospective and
prospective reporting of menstrual irregularity by women in the menopausal
transition. Climacteric. Dec 2005;8(4):390-397.
11. Sowers M, Crawford S, Sternfeld B, et al. SWAN: A Multicenter, Multiethnic,
Community-Based Cohort Study of Women and the Menopausal Transition. In: RA L, J
K, R M, eds. Menopause: Biology and Pathobiology. San Diego: Academic Press;
2000:175-188.

62
12. Johannes CB, Crawford SL, Longcope C, McKinlay SM. Bleeding patterns and
changes in the perimenopause: a longitudinal characterization of menstrual cycles.
Clinical Consultations in Obstetrics and Gyncecology. 1996;8:9-20.
13. Treloar AE. Menstrual cyclicity and the pre-menopause. Maturitas. Dec
1981;3(3-4):249-264.
14. Brambilla DJ, McKinlay SM, Johannes CB. Defining the perimenopause for
application in epidemiologic investigations. Am J Epidemiol. Dec 15
1994;140(12):1091-1095.
15. McKinlay SM, Brambilla DJ, Posner JG. The normal menopause transition.
American Journal of Human Biology. 1992;4:37-46.
16. Small CM, Manatunga AK, Marcus M. Validity of self-reported menstrual cycle
length. Ann Epidemiol. Mar 2007;17(3):163-170.
17. Jukic AM, Weinberg CR, Wilcox AJ, McConnaughey DR, Hornsby P, Baird DD.
Accuracy of reporting of menstrual cycle length. Am J Epidemiol. Jan 1
2008;167(1):25-33.
18. Harlow SD, Gass M, Hall J, et al. EXECUTIVE SUMMARY of STRAW+10:
Addressing the Unfinished Agenda of Staging Reproductive Aging
2012.
19. Lo JC, Burnett-Bowie SA, Finkelstein JS. Bone and the perimenopause. Obstet
Gynecol Clin North Am. Sep 2011;38(3):503-517.
20. Matthews KA, Crawford SL, Chae CU, et al. Are changes in cardiovascular
disease risk factors in midlife women due to chronological aging or to the
menopausal transition? J Am Coll Cardiol. Dec 15 2009;54(25):2366-2373.

63
CHAPTER III
Quantile Regression Models of Factors Associated with Menstrual Cycle Length
During the Menopausal Transition
Introduction
The Stages of Reproductive Aging Workshop (STRAW) criteria for staging
reproductive age in women were recently updated (STRAW+10) to clarify the stages of
late reproductive life and the post menopause as well as the menstrual bleeding criteria
for the early and late menopausal transition (MT) [1-4]. While the menstrual criteria for
defining the onset of each stage of the MT have been identified, little is still known about
population differences in menstrual cycle characteristics during the MT. Of interest is
not only how menstrual cycle length changes during the MT, but which factors influence
menstrual cycle length and their pattern of change as women move through the transition.
Prior studies of younger women have found ethnic differences in menstrual cycle length
[5-7] as well as differences in menstrual cycle length by body mass index (BMI) [7-11].
BMI has also been shown to influence the levels and trajectories of change of the
reproductive hormones follicle-stimulating hormone (FSH) and estradiol.[12] The few
studies in the age group of women [13-16] that are based on prospectively collected
menstrual diaries, the preferred method in evaluating menstrual cycle length [17], were
conducted in Caucasian populations.
Studies that have examined factors that influence menstrual cycle length have
mostly focused on factors that influence the mean. The distribution of menstrual cycle

64
length in perimenopausal women is often skewed [18], so that the median is much more
informative about central tendency than the mean. Quantile regression allows for
examining factors that influence the median as well as factors that influence different
parts of the distribution.[19] The purpose of the present study was to utilize quantile
regression to examine the pattern of menstrual cycle length during the MT and to assess
the association of ethnicity, BMI, and medical conditions with menstrual cycle length
among a multiethnic cohort of midlife women in the Study of Women’s Health Across
the Nation (SWAN).
Methods
Study design and population
This analysis includes women from three SWAN sites: southeastern Michigan,
Los Angeles, and Oakland which participated in the menstrual calendar substudy. The
design of the main cohort study has been previously described.[20] Briefly, a cross-
sectional screening survey was administered to 6,345 women at the three of study sites
between 1995 and 1997 to assess eligibility for enrollment into the cohort study.
Eligibility for the cohort study included age 43-52 years, self-designation as a member of
the targeted racial/ethnic group, residence in the geographic area of one of the three clinic
sites, the ability to speak English, Cantonese, Japanese, the ability to give verbal
consents, an intact uterus, at least one menstrual period and no use of reproductive
hormones in the previous 3 months. Each site recruited Caucasian women and women
from one specified minority group (African Americans in southeastern Michigan,
Japanese in Los Angeles, and Chinese in Oakland). A total of 1498 women were
enrolled into the cohort study from the three study sites. Institutional Review Boards at
each study site approved the protocol.

65
The SWAN cohort study began in 1996 and annual follow-up visits have been
conducted since that time. Each visit consisted of both interviewer administered and self
administered questionnaires that inquired into a broad range of topics including
information on menstrual experience as well as socio-demographic characteristics,
lifestyle, and medical history. The participants also underwent physical assessments
which included a blood draw.
A self-administered menstrual calendar component began in 1996 and continued
through 2006, corresponding to the tenth annual follow-up visit. Participants filled out the
menstrual calendars daily to capture days where any spotting or bleeding occurred. On
the last day of the month women indicated whether no bleeding occurred that month by
checking the appropriate box and answered questions about oral contraceptive or
hormone therapy use as well as gynecological procedures which could affect bleeding.
Women were asked to continuing filling out and returning the monthly calendar for two
years after their last menstrual bleed. The menstrual calendar substudy included
additional end of the month questions which included information on cigarette use and
physical exercise.
Women’s menstrual experience was assessed by examining their sequence of
menstrual cycle lengths. Menstrual cycle length was calculated using bleeding
definitions originally developed by the World Health Organization[17] and previously
utilized in ReSTAGE analyses[21-23]. A menstrual cycle consists of a bleeding episode
and a subsequent bleed free interval of at least 3 days. Onset of the early MT was
defined from the calendar data using definitions developed by the STRAW[24] and
refined by the ReSTAGE collaboration[21-23] and adapted by STRAW+10[1-4]. The

66
start of the early transition is defined by the persistent difference of at least 7 days in the
length of consecutive menstrual cycles. Persistence is defined as recurrence within 10
cycles of the first variable length cycle. The start date of the early transition is the date of
the first variable length cycle.
The final menstrual period (FMP) was defined as the first day of a bleeding
segment which was followed by at least 12 months of amenorrhea. For women who had
missing calendars during the 12 months of amenorrhea, we accepted the potential FMP in
the menstrual calendar if no more than 2 calendars were missing or if the date was less
than 31 days different from the FMP date identified by the annual interviews.
Hormone therapy use, which included hormone replacement therapy, oral
contraceptives, or chemotherapy, was assessed monthly. For months with missing
hormone information, menstrual cycles were coded as untreated if a woman never
reported hormone therapy use in the study, if the menstrual cycle occurred before the first
report of hormone therapy use, or if the menstrual cycle occurred in a year where no
hormone therapy use was reported in the monthly calendars or annual interview.
Height was measured without shoes using either a metric folding wooden ruler or
measuring tape (home and some clinic visits), or a fixed stadiometer (clinic visits).
Weight was measured at each annual visit without shoes, and in light indoor clothing,
using a portable digital scale or either a digital or balance beam. For each menstrual
cycle, weight was linearly interpolated between the last annual visit and the next annual
visit. BMI, calculated as weight in kilograms divided by height in meters squared, was
categorized as underweight (<18.5 kg/m2), normal weight (18.5-24.9 kg/m
2) overweight
(25.0-29.9 kg/m2), or obese (≥30.0 kg/m
2).

67
At each annual interview women were asked whether they were diagnosed with
diabetes since the last visit or were taking any medications for diabetes (high blood
sugar). Serum glucose levels were also measured at each of the first seven annual visits.
A woman was considered diabetic if she indicated she was diagnosed with diabetes, was
taking diabetes medication, or had a serum glucose level of ≥126 mg/dl. Women were
also asked if they were diagnosed with a thyroid condition or were taking medication for
a thyroid condition, and if they had been diagnosed with uterine fibroids. For each of the
three medical conditions above, six months was subtracted from the annual visit date a
woman first indicated she had the condition and all menstrual cycles on or after this date
were considered to have the condition.
Women were asked to indicate whether they smoked at least one cigarette a day
or a total of 30 cigarettes in the last month and positive responses were considered
current cigarette use for that month. If a woman never indicated she was a smoker, all her
menstrual cycles were considered non-smoking. Women were asked if they participated
in moderate to vigorous physical activity, the average times a week they participated and
the average minutes they participated each time. Average total hours of physical activity
per week were calculated for each month. For menstrual cycles that covered more than
one month, the highest average total hours of physical activity per week was used.
Ethnicity was self-defined and categorized as African American, Chinese or
Chinese American, Japanese or Japanese, or Caucasian. Highest education (high school
graduate /GED or less than high school versus at least some college) and marital status
(single, married, or separated, widowed, or divorced) were assessed at baseline.
Economic strain was assessed at baseline with the question “how hard is it to pay for

68
basics?” and was categorized as very hard, somewhat hard, or not hard. Prior use of
female hormones (yes/no), which did not include oral contraceptives, was also assessed at
baseline.
Data Analysis
Of the 1498 women who were enrolled, 1320 (88.2%) were eligible for this
analysis. An eligible woman had a least one untreated menstrual cycle recorded in the
menstrual calendars with menstrual cycle-level covariate information available.
Menstrual cycles were excluded if women were on hormones or hormone use could not
be ruled out. Menstrual cycles observed after periods of hormone use were included and
identified by an indicator variable. Women were censored at time of hysterectomy,
bilateral oophorectomy, or chemotherapy. Pregnancy and post pregnancy cycles were
excluded as were cycles which had missing covariate information. The number of
menstrual cycles for each set of models by exclusion criteria is given in Table 3.1.
Baseline demographics were compared for eligible women and non-eligible
women. Pearson’s chi-square or Fisher's exact tests were used to compare proportions,
and Student's t tests were used to compare means between groups. The distribution of
menstrual cycle length is not normal; it is right-skewed (Figure 3.1). Therefore, the
median is more informative than the mean. Quantile regression permits evaluation of
factors affecting cycle length at the center of the distribution as wells as the tails. In
order to examine central tendency and variance, quantile regression was used to model
menstrual cycle length at the 25th, 50th, 75th, and 90th percentiles. The regression
coefficients of a quantile regression are interpreted similarly to regression coefficients of
a linear regression. For example, the regression coefficients of a categorical predictor

69
represent the difference in menstrual cycle length for the relevant percentile between one
category and the reference group, adjusted for all other covariates in the model. To better
reflect the standard error in our data which included repeated measures, bootstrap
sampling with 500 repetitions was conducted to construct 95% confidence intervals (CI).
The bootstrap sampling was based on samples of women and not menstrual cycles. If a
woman was selected then all of her eligible menstrual cycles were included.
Two sets of quantile regression models were evaluated. First we included women
who were identified as having started the MT during the calendar substudy (n=963) and
examined correlates of cycle length occurring after the onset of the transition, including
time since the start of the transition. Only menstrual cycles after the start of the MT were
included. For univariate analysis, the potential list of correlates was chosen as factors that
have been shown to be associated with menstrual cycle length in younger reproductive
aged women (results shown in Appendix B). Covariates were included in the adjusted
model if there was evidence of an adjusted association with the right-tail. The same
adjusted model was used for each of the four percentiles of interest. Time since the start
of the MT was added to the multivariate model using a natural cubic spline. Initially,
knots were placed at years 1-9. The figure was inspected visually, and knots that did not
contribute to the fit were deleted. The final natural cubic spline contained knots at 2, 3, 4,
5, and 6 years. Statistical interaction between time since the start of the MT and the other
covariates was examined graphically.
Our second set of models included women who had a defined final menstrual
period (FMP) in the menstrual calendar data (n=431). All cycles prior to FMP were
included and time until FMP was included as a covariate. In order to compare the FMP
70
adjusted models with the start of the MT adjusted models, the same covariates were
included in the models, except for above median age at the start of transition. No
association was seen with the variable above median age at the FMP. Time until the FMP
was added to the models using a natural cubic spline, with knots at -5, -4,-3,-2, and -1
years until the FMP.
Data programming and analysis of baseline demographics was done using SAS
9.2 (Cary, NC). Quantile regression was conducted using the quantreg package in R
2.13.1, developed by Roger Koenker[19].
Results
Of the 1320 eligible women, 963 (73.0%) had the onset of the early MT observed
in the menstrual calendar while 431 (32.7%) had their FMP identified. Additionally 19
(1.4%) had a hysterectomy, 233 (17.7%) began using hormones and had no further
untreated menstrual cycles observed, and 637(48.3%) withdrew from the study before
their FMP was identified. Baseline demographics of women who participated in the
SWAN by eligibility for each set of analyses are shown in Table 3.2. Women who had
eligible calendar data for this analysis were younger, had higher educational attainment,
were more likely to be married, had less economic strain, and had smaller BMI. Eligible
women were less likely to be from Michigan, African-American, or current smokers.
Women eligible for the analysis since the onset of early MT were also were also less
likely to ever be diagnosed with diabetes or fibroids. In contrast women who had their
FMP observed were older, but were more likely to ever be diagnosed with diabetes, have
diabetes during substudy participation, ever diagnosed with fibroids, and have fibroids
during substudy participation.

71
The relationship between menstrual cycle length and time since the start of the
MT is displayed in Figure 3.2 and is for women in the reference categories based in the
models shown in Table 3.3. That is, estimated cycle lengths are for women who were
Caucasian, normal or underweight, had an age at the start of the transition <46.25 years,
did not smoke, had at least some post high school education, and did not have any
moderate or physical activity during the average week. At approximately 2 years after
the start of the MT, the menstrual cycle length distribution begins to widen. as seen by
increases in the 75th
and 90th
percentiles. From 2 to 8 years, menstrual cycle lengths at the
90th
percentile increased sharply. At approximately 7.5 years after the start of the MT, the
variance of estimated menstrual cycle length increased for each of the four percentiles,
suggesting greater variability of menstrual cycle length as the FMP approaches.
The quantile regression models for the 25th
, 50th
, 75th
, and 90th
percentile of
menstrual cycle lengths among women since the start of the MT are given in Table 3.3.
Associations were adjusted for all factors listed in the table as well as time since the start
of the MT. The intercepts are the estimated menstrual cycle length for women in the
reference category at the start of the MT. Women whose age at the start of the MT was
above 46.25 years had longer cycle lengths at the 50th
, 75th
, and 90th
percentiles as
compared to women with a younger age at the start of the MT. Chinese and Japanese
women had longer menstrual cycle lengths than Caucasian women at each of the four
percentiles. Obese women had longer menstrual cycle lengths than normal/underweight
women at each of the four percentiles. Overweight women had longer menstrual cycle
lengths than normal/underweight women at the 25th
and 50th
percentiles. Current smoking
and high school education or less was associated with longer menstrual cycle lengths at

72
the 75th
and 90th
percentiles. Hours of moderate or vigorous physical activity per week
was associated with longer menstrual cycle lengths at the 90th
percentile. Diabetes was
associated with longer menstrual cycle length at the 50th
percentile (0.70 days, 95% CI:
0.03, 1.36). Uterine fibroids, thyroid disorders, or previous hormone use during the study
were not associated with menstrual cycle length. We found no evidence of statistical
interaction between time since the start of the MT and the other covariates.
The relationship between menstrual cycle length and time until the FMP is shown
in Figure 3.3, for women in the reference categories of the models displayed in Table 3.4.
Estimated cycle lengths are for women who were Caucasian, normal or underweight, did
not smoke, had at least some post high school education, and did not have any moderate
or physical activity during the average week. At approximately 7.5 years prior to the
FMP, the distribution of menstrual cycle lengths begins to increase as shown by the
increase in the 90th
percentile. The steepest increase in menstrual cycle length is seen
between 4 and 1.5 years prior to the FMP. In the last 2 years prior to the FMP, the
variance of estimated menstrual cycle length increased for each of the four percentiles.
African-American women had longer menstrual cycle lengths than Caucasian
women at the 50th
and 75th
percentile in the time until the FMP models (Table 3.4).
Chinese women had longer menstrual cycle lengths than Caucasian women at each of the
four percentiles. Japanese women had longer menstrual cycle lengths than Caucasian
women at the 25th
, 50th
, 75th
percentile. The relationship between BMI and menstrual
cycle length in the time until the FMP models were similar to those observed in the time
since the start of the MT models. Obese women had longer menstrual cycle lengths at
each of the four percentiles while overweight women had longer menstrual cycle lengths

73
at the 25th
and 50th
percentiles. Hours of moderate or vigorous physical activity per week
was associated with longer menstrual cycle lengths at the 75th
and the 90th
percentile. . In
the time until the FMP models, above the median age at FMP, current smoking,
education, medications, and hormone use were not associated with menstrual cycle
lengths. No evidence to suggest statistical interaction was observed between time until
the FMP and the other covariates.
Discussion
This paper is one of the first to assess whether factors that have been identified as
influencing menstrual characteristics in adolescent and young adult women also influence
menstrual cycle length as women transition through the menopause. Quantile regression
facilitated understanding of how factors influence the median and the tails of the
distribution. Chinese and Japanese women had longer menstrual cycle lengths throughout
the distribution as compared to Caucasian women, as did obese women compared to
normal weight women. Increased moderate to vigorous physical activity lengthened the
menstrual cycle only at the right tail of the distribution. There was some evidence to
suggest that current cigarette smoking also increased menstrual cycle length at the right
tail.
The relationship between time since the onset of the MT or time until the FMP
and menstrual cycle length is not uniform. Increases in menstrual cycle length, as women
progress through the transition, are mostly limited to the upper percentiles of the
distribution, with the median unaffected until 3 years prior to the FMP, when a small
increase is seen. In our population, menstrual cycle length in the right tail began to
increase approximately 2 years after the start of the MT or 7 years prior to the FMP. In a
prior analysis from the same cohort [12], FSH levels were observed to rise in a similar

74
timeframe indexed to the FMP. In an analysis of the TREMIN Trust data, the average
menstrual cycle length began to rapidly increase starting at four years prior to the
FMP.[25] Two years prior to the FMP, menstrual cycles become highly variable as seen
by the increase in the 95% CI for all four percentiles. The Melbourne Midlife Women’s
Health Project found a similar result; menstrual cycle length variability was the highest
during the last 17 menstrual cycles prior to the FMP [15] , as was the rate of FSH
increase in SWAN.[12]
Prior studies have suggested that menstrual cycle characteristics differ by
ethnicity. The Semiconductor Health Study in California and Utah found that Asian
women had menstrual cycle lengths that were approximately two days longer than
Caucasian women.[6] A similar result was reported by the Women’s Reproductive
Health Study.[7] In the present study, Chinese and Japanese women had longer
menstrual cycle lengths than Caucasian women, suggesting that Asian women have
longer menstrual cycle lengths throughout the reproductive lifespan. One North Carolina
study among adolescents found African-American adolescents had shorter menstrual
cycles than Caucasians.[5] In the current study, African-American women had longer
menstrual cycle length as compared to Caucasians at both the 50th
and 75th
percentiles,
when indexed to the FMP.
We found obese women had longer menstrual cycle length than normal weight
women across the distribution of menstrual cycle length. Prior studies have found a
similar association. Higher BMI has been shown to be associated with longer menstrual
cycle lengths in women aged 17-19 [8] and women aged 20-40 [7, 9-11]. However, not
all studies have found an association between menstrual cycle length and BMI.[6, 26, 27]
75
Obesity is associated with circulating levels of the hormones FSH and estradiol in
SWAN and other studies of the MT.[12, 28-30]
Several studies have demonstrated an association between physical activity and
longer menstrual cycle length. In athletes, less frequent menstrual cycles have been
reported. [31, 32] Among adolescent girls [5] and young adult women [8, 33, 34],
physical activity increased mean menstrual cycle length. In the present study, physical
activity was associated with longer menstrual cycle length at the right tail of the
distribution, but not at the median.
In this study, current cigarette smoking was associated with longer menstrual
cycle length in the upper percentiles for women indexed to the start of the transition. A
similar association was not seen in the models indexed to the FMP. Prior studies
examining cigarette use have not found an association [6, 33-35], or have found that
smoking is associated with shorter menstrual cycle lengths[9, 10, 36]. Smokers have
been shown to have an earlier age at menopause than non-smokers in the population from
which the SWAN cohort was selected [37] as well as other populations [38-43]. Smokers
have also been shown to have a shorter duration of perimenopause [44, 45], thus the
longer cycles exhibited by smokers, when indexed to the start of the MT, may reflect the
shorter duration of perimenopause in these women.
This study has some important limitations. The mean age of women eligible for
this study was 45.7 years. It is possible that the start of the MT occurred earlier than
enrollment into the study. Age-eligible women who were in the late stage of the MT or
who had already experienced their FMP were excluded. Women with younger ages at
FMP may have different patterns of menstrual cycle characteristics [46]. The ethnic

76
differences we observed could reflect study site differences. In the cross-sectional study,
from which the SWAN cohort study was selected, African-American women were more
likely to have had a hysterectomy than other women and thus less likely to be enrolled
into the cohort study [37]. In the current analysis, African-American women were less
likely to have either the start of the MT observed or their FMP observed. Women with
diabetes and women with fibroids were also less likely to be included in this analysis,
which may have affected our ability to detect an association for either of these diseases.
In conclusion, we found increases in menstrual cycle length during the MT to
occur mostly in the right tail, reflecting a greater propensity for longer menstrual cycles.
Greater variability in extreme menstrual cycle length was seen during the 2 years prior to
the FMP. Chinese, Japanese, and obese women had longer menstrual cycle lengths during
the MT. An important next step would be to examine how patterns of menstrual cycle
length influence the duration of the MT. Women with longer mean menstrual cycles
during their reproductive years have been shown to have a later age at menopause [18,
47], and those women with shorter mean menstrual cycle lengths have demonstrated an
earlier age at menopause [41, 48]. If certain patterns of menstrual cycle length are
associated with age at menopause, physicians could then use this information to help
women predict when their final menses is likely to occur.

77
Figure 3.1 Kernel Density Plot of Menstrual Cycle Length

78
Figure 3.2 Estimated Cycle Length by Time since the Start of Transition from
Multivariate Quantile Regressions for Four Percentiles: 25th
, 50th
, 75th
and 90th
.
Natural cubic spline of time since the start of transition contained 5 knots at 2, 3, 4, 5, and
6 years. Estimated cycle lengths are for women who were Caucasian, normal or
underweight, had an age at the start of the transition <46.25 years, did not smoke, had at
least some post high school education, and did not have any moderate or physical activity
during the average week.
0 2 4 6 8
20
30
40
50
60
70
Time Since Start of Transition (Years)
Estim
ate
d C
ycle
Le
ng
th(D
ays)
25th Percentile
50th Percentile
75th Percentile
90th Percentile
25th Percentile
50th Percentile
75th Percentile
90th Percentile
25th Percentile
50th Percentile
75th Percentile
90th Percentile
25th Percentile
50th Percentile
75th Percentile
90th Percentile
Number of women at each year
[0,1] (1, 2] (2, 3] (3, 4] (4, 5] (5, 6] (6, 7] (7, 8] (8, 9.5]
Total Women 963 849 710 539 383 251 173 120 69
Ethnicity
African-American 129 (13.4%) 103 (12.1%) 75 (10.6%) 59 (11.0%) 47 (12.3%) 32 (12.8%) 25 (14.5%) 11 (9.2%) 6 (8.7%)
Chinese 184 (19.1%) 173 (20.4%) 154 (21.7%) 119 (22.1%) 82 (21.4%) 54 (21.5%) 34 (19.6%) 20 (16.7%) 8 (11.6%)
Japanese 212 (22.0%) 198 (23.3%) 172 (24.2%) 132 (24.5%) 95 (24.8%) 61 (24.3%) 42 (24.3%) 34 (28.3%) 18 (26.1%)
Caucasian 438 (45.5%) 375 (44.2%) 309 (43.5%) 229 (42.5%) 159 (41.5%) 104 (41.4%) 72 (41.6%) 55 (45.8%) 37 (53.6%)
BMI
Underweight/
Normal 515 (53.5%) 442 (52.1%) 383 (53.9%) 287 (53.3%) 200 (52.2%) 129 (51.4%) 80 (46.2%) 61 (50.8%) 34 (49.3%)
Overweight 213 (22.1%) 199 (23.4%) 150 (21.1%) 120 (22.3%) 86 (22.5%) 65 (25.9%) 43 (24.8%) 31 (25.8%) 19 (27.5%)
Obese 235 (24.4%) 208 (24.5%) 177 (24.9%) 132 (24.4%) 97 (25.3%) 57 (22.7%) 50 (28.9%) 28 (23.3%) 16 (23.2%)
Time in Years Since Start of Transition

79
Figure 3.3 Estimated Cycle Length by Time until FMP from Multivariable Quantile
Regressions for Four Percentiles: 25th
, 50th
, 75th
and 90th
.
Natural cubic spline of time until FMP contained 5 knots at -5, -4,-3,-2, and -1 years.
FMP is at time 0. Estimated cycle lengths are for women who were Caucasian, normal or
underweight, did not smoke, had at least some post high school education, and did not
have any moderate or physical activity during the average week.
-8 -6 -4 -2 0
20
40
60
80
10
01
20
14
0
Time Until FMP (Years)
Estim
ate
d C
ycle
Le
ng
th(D
ays)
25th Percentile
50th Percentile
75th Percentile
90th Percentile
25th Percentile
50th Percentile
75th Percentile
90th Percentile
25th Percentile
50th Percentile
75th Percentile
90th Percentile
25th Percentile
50th Percentile
75th Percentile
90th Percentile
Number of women at each year
[-9.5, -8) [-8,-7) [-7,-6) [-6,-5) [-5,-4) [-4,-3) [-3,-2) [-2,-1) [-1,0)
Total Women 61 96 137 190 242 306 361 379 431
Ethnicity
African-American 2 (3.3%) 8 (8.3%) 8 (5.8%) 16 (8.4%) 18 (7.4%) 25 (8.2%) 28 (7.8%) 32 (8.4%) 40 (9.3%)
Chinese 14 (23.0%) 20 (20.8%) 27 (19.7%) 43 (22.6%) 58 (24.0%) 70 (22.9%) 79 (21.9%) 83 (21.9%) 94 (21.8%)
Japanese 14 (23.0%) 29 (30.2%) 44 (32.1%) 61 (32.1%) 72 (29.8%) 89 (29.1%) 109 (30.2%) 115 (30.3%) 123 (28.5%)
Caucasian 31 (50.8%) 39 (40.6%) 58 (42.3%) 70 (36.8%) 94 (38.8%) 122 (39.9%) 145 (40.2%) 149 (39.3%) 173 (40.4%)
BMI
Underweight/
Normal 42 (68.9%) 59 (61.5%) 86 (62.8%) 115 (60.5%) 149 (61.6%) 174 (56.9%) 204 (56.5%) 210 (55.4%) 234 (54.3%)
Overweight 7 (11.5%) 15 (15.6%) 22 (16.1%) 33 (17.4%) 38 (15.7%) 59 (19.3%) 73 (20.2%) 81 (21.4%) 89 (20.7%)
Obese 12 (19.7%) 22 (22.9%) 29 (21.2%) 42 (22.1%) 55 (22.7%) 73 (23.9%) 84 (23.3%) 88 (23.2%) 108 (25.1%)
Time Until FMP

80
Table 3.1 Number of Cycles for the Start of the Menopausal Transition Models and the FMP Models by Exclusion Criteria.
Start of the Menopausal
Transition Models
963 women
FMP Models
431 women
n (%) n (%)
Pregnancy/post pregnancy 29 0.1% 13 0.1%
Hormone use 2,709 6.4% 1,143 5.5%
Missing covariates 2,026 4.8% 1,302 6.3%
In Analysis 37,288 88.7% 18,305 88.1%
Total 42,052 20,763

81
Table 3.2 Baseline Demographics of Women in SWAN by Eligibility
Eligible
Women
n=1320
Not
Eligible
Women
n=178 P value
Start of
Transition
Observed
n=963
NO Start
Observed
n=357 P value
FMP
Observed
n=431
NO FMP
Observed
n=889 P value
Age at Screener years , Mean
(STD)
45.7 (2.7) 46.3 (3.0) 0.02 45.6 (2.6) 46.0 (2.9) 0.01 46.4 (2.6) 45.4 (2.7) <0.01
n (%) n(%) n (%) n(%) n (%) n(%)
Study Site
Michigan 430 (32.6) 113 (63.5) <0.01 256 (26.6) 174 (48.7) <0.01 89 (20.7) 341 (38.4) <0.01
Oakland 432 (32.7) 27 (15.2) 331 (34.4) 101 (28.3) 153 (35.5) 279 (31.4)
Los Angeles 458 (34.7) 38 (21.3) 376 (39.0) 82 (23.0) 189 (43.9) 269 (20.2)
Race/Ethnicity
African-American 236 (17.9) 89 (50.0) <0.01 129 (13.4) 107 (30.0) <0.01 40 (9.3) 196 (22.1) <0.01
Chinese 232 (17.6) 18 (10.1) 184 (19.1) 48 (13.4) 94 (21.8) 138 (15.5)
Japanese 262 (19.8) 19 (10.7) 212 (22.0) 50 (14.0) 123 (28.5) 139 (15.6)
Caucasian 590 (44.7) 52 (29.2) 438 (45.5) 152 (42.6) 173 (40.4) 416 (46.8)
Education
Less than High School 66 (5.0) 14 (8.6) 0.01 39 (4.1) 27 (7.6) <0.01 23 (5.3) 43 (4.8) 0.37
High School Grad 219 (16.6) 35 (21.6) 151 (15.7) 68 (19.0) 74 (17.2) 145 (16.3)
Some College/Vocation 455 (34.5) 60 (37.1) 319 (33.1) 136 (38.1) 132 (30.6) 323 (36.3)
College Graduate 296 (22.4) 35 (21.6) 240 (24.9) 56 (15.7) 104 (24.1) 192 (21.6)
Post College 284 (21.5) 18 (11.1) 214 (22.2) 70 (19.6) 98 (22.7) 186 (20.9)
Marital Status
Single 172 (13.0) 22 (12.6) 0.02 125 (13.0) 47 (13.2) <0.01 58 (13.5) 114 (12.8) 0.06
Married 911 (69.1) 103 (58.9) 690 (71.7) 221 (62.1) 314 (72.9) 597 (67.2)
Separated 44 (3.3) 10 (5.7) 27 (2.8) 17 (4.8) 9 (2.1) 35 (3.9)
Widowed 24 (1.8) 6 (3.4) 15 (1.6) 9(2.5) 8 (1.9) 16 (1.8)
Divorced 168 (12.7) 34 (19.4) 106 (11.0) 62 (17.4) 42 (9.7) 126 (14.2) 1 Does not include oral contraceptive pills.
2 Diagnosed during the first 10 annual visits.
3 Diagnosed while still in menstrual calendar substudy.

82
Table3.2 Cont’ Baseline Demographics of Women in SWAN by Eligibility
Eligible
Women
n=1320
Not
Eligible
Women
n=178
Started
Transition
n=963
NO Start
Identified
n=357
FMP
Observed
n=431
NO FMP
Observed
n=889
n (%) n(%) P value n (%) n(%) P value n (%) n(%) P value
How Hard Is It To Pay For
Basics
Very Hard 91 (6.9) 15 (8.8) 0.01 55 (5.7) 36 (10.1) <0.01 15 (3.5) 76 (8.6) <0.01
Somewhat Hard 349 (26.4) 63 (36.8) 243 (25.2) 106 (29.7) 110 (25.5) 239 (26.9)
Not Hard 880 (66.7) 93 (54.4) 665 (69.1) 215 (60.2) 306 (71.0) 574 (64.6)
Body Mass Index, kg/m2
Underweight (<18.5) 42 (3.2) 5 (2.9) 0.01 32 (3.4) 10 (2.9) <0.01 18 (4.3) 24 (2.7) 0.01
Normal (18.5 -24.9) 717 (55.2) 62 (35.4) 554 (58.3) 163 (46.7) 254 (60.2) 463 (52.7)
Overweight (25.0 -29.9) 251 (19.3) 54 (30.9) 184 (19.4) 67 (19.2) 72 (17.1) 179 (20.4)
Obese(≥ 30.0) 290 (22.3) 54 (30.9) 181 (19.0) 109 (31.2) 78 (18.5) 212 (24.2)
Baseline Smoking Status
Never 836 (64.1) 104 (59.8) 0.03 639 (67.2) 197 (55.8) <.01 281 (67.1) 555 (62.7) 0.05
Past 277 (21.2) 31 (17.8) 194 (20.4) 83 (23.5) 91 (21.7) 186 (21.0)
Current 191 (14.7) 39 (22.4) 118 (12.4) 73 (20.7) 47 (11.2) 144 (16.3)
Ever Taken Hormones Prior to
Study1
154 (11.7) 17 (9.7) 0.43 118 (12.3) 36 (10.1) 0.28 42 (9.8) 112 (12.6) 0.14
Ever Diabetes During Study2 211 (16.0) 33 (18.5) 0.39 139 (14.4) 72 (20.2) 0.01 57 (13.2) 154 (17.3) 0.06
Ever Diabetes Cycle3 n/a n/a 97 (10.1) 39 (10.9) 0.65 34 (7.9) 102 (11.5) 0.04
Ever Fibroids During Study2 417 (31.6) 47 (26.4) 0.17 285 (29.6) 132 (37.0) 0.01 106 (24.6) 311 (35.0) <0.01
Ever Fibroids Cycle3 n/a n/a 246 (25.6) 90 (25.2) 0.90 93 (21.6) 243 (27.3) 0.02
Ever Thyroid Disorder During
Study2
252 (19.1) 33 (18.5) 0.86 173 (18.0) 79 (22.1) 0.09 94 (21.8) 0.08
Ever Thyroid Disorder Cycle3 n/a n/a 138 (14.3) 58 (16.3) 0.38 75 (17.4) 121 (13.6) 0.07
1 Does not include oral contraceptive pills .
2 Diagnosed during the first 10 annual visits.
3 Diagnosed while still in menstrual calendar substudy.
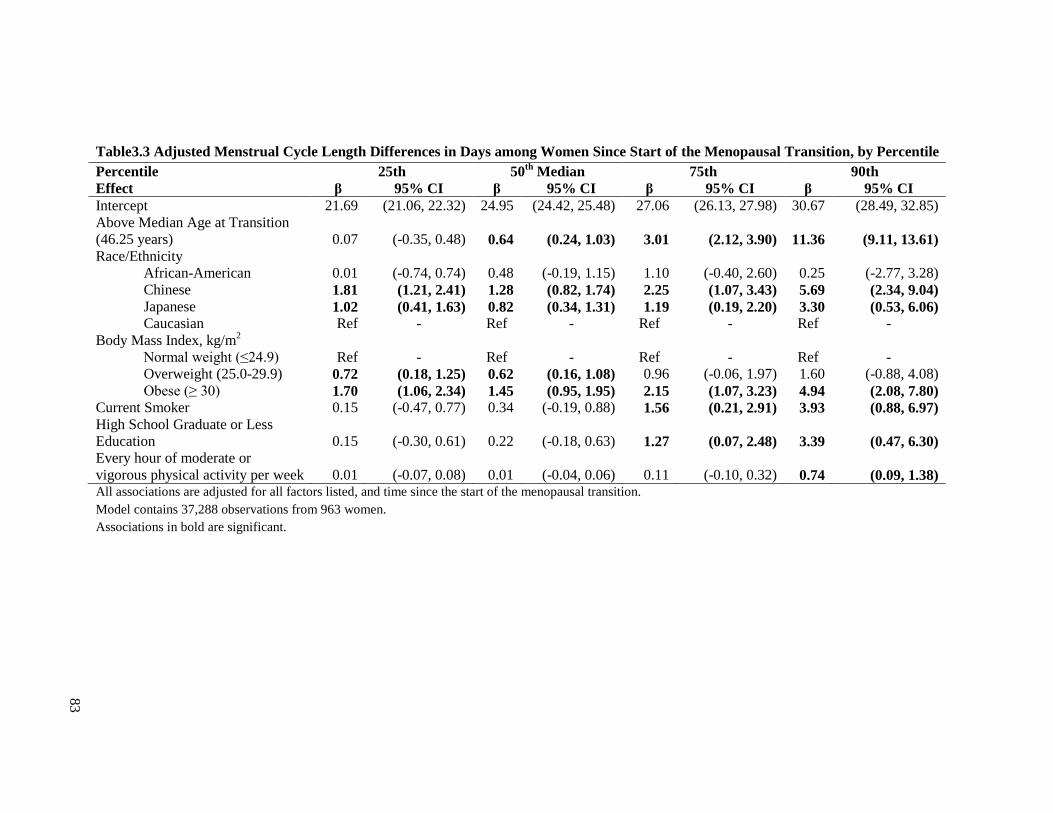
83
Table3.3 Adjusted Menstrual Cycle Length Differences in Days among Women Since Start of the Menopausal Transition, by Percentile
Percentile 25th 50th
Median 75th 90th
Effect β 95% CI β 95% CI β 95% CI β 95% CI
Intercept 21.69 (21.06, 22.32) 24.95 (24.42, 25.48) 27.06 (26.13, 27.98) 30.67 (28.49, 32.85)
Above Median Age at Transition
(46.25 years) 0.07 (-0.35, 0.48) 0.64 (0.24, 1.03) 3.01 (2.12, 3.90) 11.36 (9.11, 13.61)
Race/Ethnicity
African-American 0.01 (-0.74, 0.74) 0.48 (-0.19, 1.15) 1.10 (-0.40, 2.60) 0.25 (-2.77, 3.28)
Chinese 1.81 (1.21, 2.41) 1.28 (0.82, 1.74) 2.25 (1.07, 3.43) 5.69 (2.34, 9.04)
Japanese 1.02 (0.41, 1.63) 0.82 (0.34, 1.31) 1.19 (0.19, 2.20) 3.30 (0.53, 6.06)
Caucasian Ref - Ref - Ref - Ref -
Body Mass Index, kg/m2
Normal weight (≤24.9) Ref - Ref - Ref - Ref -
Overweight (25.0-29.9) 0.72 (0.18, 1.25) 0.62 (0.16, 1.08) 0.96 (-0.06, 1.97) 1.60 (-0.88, 4.08)
Obese (≥ 30) 1.70 (1.06, 2.34) 1.45 (0.95, 1.95) 2.15 (1.07, 3.23) 4.94 (2.08, 7.80)
Current Smoker 0.15 (-0.47, 0.77) 0.34 (-0.19, 0.88) 1.56 (0.21, 2.91) 3.93 (0.88, 6.97)
High School Graduate or Less
Education 0.15 (-0.30, 0.61) 0.22 (-0.18, 0.63) 1.27 (0.07, 2.48) 3.39 (0.47, 6.30)
Every hour of moderate or
vigorous physical activity per week 0.01 (-0.07, 0.08) 0.01 (-0.04, 0.06) 0.11 (-0.10, 0.32) 0.74 (0.09, 1.38) All associations are adjusted for all factors listed, and time since the start of the menopausal transition.
Model contains 37,288 observations from 963 women.
Associations in bold are significant.

84
Table 3.4 Adjusted Menstrual Cycle Length Differences in Days among Women until the FMP by Percentile
Percentile 25th 50th
(Median) 75th 90th
Effect β 95% CI β 95% CI β 95% CI β 95% CI
Intercept 24.47 (23.31, 25.62) 26.09 (25.12, 27.06) 26.96 (25.97, 27.95) 27.43 (25.57, 29.29)
Race/Ethnicity
African-American 0.18 (-1.32, 1.67) 1.58 (0.18, 2.97) 2.32 (0.39, 4.24) 3.21 (-0.72, 7.15)
Chinese 1.14 (0.42, 1.87) 1.18 (0.49, 1.86) 1.52 (0.44, 2.60) 3.32 (0.65, 6.00)
Japanese 1.00 (0.38, 1.62) 1.02 (0.46, 1.58) 1.29 (0.29, 2.28) 2.15 (-0.25, 4.55)
Caucasian Ref - Ref - Ref - Ref -
Body Mass Index, kg/m2
Normal weight (≤24.9) Ref - Ref - Ref - Ref -
Overweight (25.0-29.9) 1.00 (0.40, 1.60) 0.95 (0.40, 1.50) 1.14 (-0.01, 2.28) 1.68 (-0.74, 4.10)
Obese (≥ 30) 1.01 (0.35, 1.66) 1.13 (0.42, 1.85) 1.93 (0.85, 3.01) 3.77 (1.12, 6.43)
Current Smoker 0.02 (-0.94, 0.98) 0.25 (-0.63, 1.13) 0.45 (-0.77, 1.68) 0.84 (-2.02, 3.70)
High School Graduate or Less
Education 0.01 (-0.49, 0.52) -0.08 (-0.60, 0.45) -0.25 (-1.14, 0.63) -0.19 (-2.20, 1.81)
Every hour of moderate or
vigorous physical activity per week 0.00 (-0.08, 0.08) 0.05 (-0.04, 0.15) 0.22 (0.02, 0.42) 0.97 (0.29, 1.66) All associations are adjusted for all factors listed and time until FMP.
Model contains 18,305 observations from 431 women.
Associations in bold are significant

85
References
1. Harlow SD, Gass M, Hall JE, et al. Executive Summary of the Stages of
Reproductive Aging Workshop + 10: Addressing the Unfinished Agenda of
Staging Reproductive Aging. J Clin Endocrinol Metab. Feb 16 2012.
2. Harlow SD, Gass M, Hall JE, et al. Executive summary of the Stages of
Reproductive Aging Workshop + 10: addressing the unfinished agenda of staging
reproductive aging. Menopause. Feb 15 2012.
3. Harlow SD, Gass M, Hall JE, et al. Executive summary of the Stages of
Reproductive Aging Workshop + 10: addressing the unfinished agenda of staging
reproductive aging. Fertil Steril. Feb 14 2012.
4. Harlow SD, Gass M, Hall JE, et al. Executive summary of the Stages of
Reproductive Aging Workshop +10: addressing the unfinished agenda of staging
reproductive aging. Climacteric. Feb 16 2012.
5. Harlow SD, Campbell B, Lin X, Raz J. Ethnic differences in the length of the
menstrual cycle during the postmenarcheal period. Am J Epidemiol. Oct 1
1997;146(7):572-580.
6. Liu Y, Gold EB, Lasley BL, Johnson WO. Factors affecting menstrual cycle
characteristics. Am J Epidemiol. Jul 15 2004;160(2):131-140.
7. Waller K, Swan SH, Windham GC, Fenster L, Elkin EP, Lasley BL. Use of urine
biomarkers to evaluate menstrual function in healthy premenopausal women. Am
J Epidemiol. Jun 1 1998;147(11):1071-1080.
8. Harlow SD, Matanoski GM. The association between weight, physical activity,
and stress and variation in the length of the menstrual cycle. Am J Epidemiol. Jan
1991;133(1):38-49.
9. Kato I, Toniolo P, Koenig KL, et al. Epidemiologic correlates with menstrual
cycle length in middle aged women. Eur J Epidemiol. Oct 1999;15(9):809-814.
10. Rowland AS, Baird DD, Long S, et al. Influence of medical conditions and
lifestyle factors on the menstrual cycle. Epidemiology. Nov 2002;13(6):668-674.
11. Symons JP, Sowers MF, Harlow SD. Relationship of body composition measures
and menstrual cycle length. Ann Hum Biol. Mar-Apr 1997;24(2):107-116.
12. Randolph JF, Jr., Zheng H, Sowers MR, et al. Change in follicle-stimulating
hormone and estradiol across the menopausal transition: effect of age at the final
menstrual period. J Clin Endocrinol Metab. Mar 2011;96(3):746-754.

86
13. Johannes CB, Crawford SL, Longcope C, McKinlay SM. Bleeding patterns and
changes in the perimenopause: a longitudinal characterization of menstrual cycles.
Clinical Consultations in Obstetrics and Gyncecology. 1996;8:9-20.
14. Mitchell ES, Woods NF, Mariella A. Three stages of the menopausal transition
from the Seattle Midlife Women's Health Study: toward a more precise definition.
Menopause. Sep-Oct 2000;7(5):334-349.
15. Taffe JR, Dennerstein L. Menstrual patterns leading to the final menstrual period.
Menopause. Jan-Feb 2002;9(1):32-40.
16. Treloar AE. Menstrual cyclicity and the pre-menopause. Maturitas. Dec
1981;3(3-4):249-264.
17. Rodriguez G, Faundes-Latham A, Atkinson LE. An approach to the analysis of
menstrual patterns in the critical evaluation of contraceptives. Stud Fam Plann.
Feb 1976;7(2):42-51.
18. Lisabeth L, Harlow S, Qaqish B. A new statistical approach demonstrated
menstrual patterns during the menopausal transition did not vary by age at
menopause. J Clin Epidemiol. May 2004;57(5):484-496.
19. Koenker R. Quantile Regression: Cambridge University Press; 2005.
20. Sowers M, Crawford S, Sternfeld B, et al. SWAN: A Multicenter, Multiethnic,
Community-Based Cohort Study of Women and the Menopausal Transition. In: RA L, J
K, R M, eds. Menopause: Biology and Pathobiology. San Diego: Academic Press;
2000:175-188.
21. Harlow SD, Cain K, Crawford S, et al. Evaluation of four proposed bleeding
criteria for the onset of late menopausal transition. J Clin Endocrinol Metab. Sep
2006;91(9):3432-3438.
22. Harlow SD, Crawford S, Dennerstein L, Burger HG, Mitchell ES, Sowers MF.
Recommendations from a multi-study evaluation of proposed criteria for staging
reproductive aging. Climacteric. Apr 2007;10(2):112-119.
23. Harlow SD, Mitchell ES, Crawford S, Nan B, Little R, Taffe J. The ReSTAGE
Collaboration: defining optimal bleeding criteria for onset of early menopausal
transition. Fertil Steril. Jan 2008;89(1):129-140.
24. Soules MR, Sherman S, Parrott E, et al. Executive summary: Stages of
Reproductive Aging Workshop (STRAW). Fertil Steril. Nov 2001;76(5):874-878.
25. Ferrell RJ, Simon JA, Pincus SM, et al. The length of perimenopausal menstrual
cycles increases later and to a greater degree than previously reported. Fertil
Steril. Sep 2006;86(3):619-624.

87
26. Lin HT, Lin LC, Shiao JS. The impact of self-perceived job stress on menstrual
patterns among Taiwanese nurses. Ind Health. Oct 2007;45(5):709-714.
27. Messing K, Saurel-Cubizolles MJ, Bourgine M, Kaminski M. Menstrual-cycle
characteristics and work conditions of workers in poultry slaughterhouses and
canneries. Scand J Work Environ Health. Oct 1992;18(5):302-309.
28. Randolph JF, Jr., Sowers M, Bondarenko IV, Harlow SD, Luborsky JL, Little RJ.
Change in estradiol and follicle-stimulating hormone across the early menopausal
transition: effects of ethnicity and age. J Clin Endocrinol Metab. Apr
2004;89(4):1555-1561.
29. Randolph JF, Jr., Sowers M, Gold EB, et al. Reproductive hormones in the early
menopausal transition: relationship to ethnicity, body size, and menopausal status.
J Clin Endocrinol Metab. Apr 2003;88(4):1516-1522.
30. Freeman EW, Sammel MD, Lin H, Gracia CR. Obesity and reproductive hormone
levels in the transition to menopause. Menopause. Jul 2010;17(4):718-726.
31. Dale E, Gerlach DH, Wilhite AL. Menstrual dysfunction in distance runners.
Obstet Gynecol. Jul 1979;54(1):47-53.
32. Torstveit MK, Sundgot-Borgen J. Participation in leanness sports but not training
volume is associated with menstrual dysfunction: a national survey of 1276 elite
athletes and controls. Br J Sports Med. Mar 2005;39(3):141-147.
33. Cooper GS, Sandler DP, Whelan EA, Smith KR. Association of physical and
behavioral characteristics with menstrual cycle patterns in women age 29-31
years. Epidemiology. Nov 1996;7(6):624-628.
34. Sternfeld B, Jacobs MK, Quesenberry CP, Jr., Gold EB, Sowers M. Physical
activity and menstrual cycle characteristics in two prospective cohorts. Am J
Epidemiol. Sep 1 2002;156(5):402-409.
35. Hornsby PP, Wilcox AJ, Weinberg CR. Cigarette smoking and disturbance of
menstrual function. Epidemiology. Mar 1998;9(2):193-198.
36. Windham GC, Elkin EP, Swan SH, Waller KO, Fenster L. Cigarette smoking and
effects on menstrual function. Obstet Gynecol. Jan 1999;93(1):59-65.
37. Gold EB, Bromberger J, Crawford S, et al. Factors associated with age at natural
menopause in a multiethnic sample of midlife women. Am J Epidemiol. May 1
2001;153(9):865-874.
38. Cooper GS, Sandler DP, Bohlig M. Active and passive smoking and the
occurrence of natural menopause. Epidemiology. Nov 1999;10(6):771-773.

88
39. Dorjgochoo T, Kallianpur A, Gao YT, et al. Dietary and lifestyle predictors of age
at natural menopause and reproductive span in the Shanghai Women's Health
Study. Menopause. Sep-Oct 2008;15(5):924-933.
40. Hardy R, Kuh D, Wadsworth M. Smoking, body mass index, socioeconomic
status and the menopausal transition in a British national cohort. Int J Epidemiol.
Oct 2000;29(5):845-851.
41. Kaczmarek M. The timing of natural menopause in Poland and associated factors.
Maturitas. Jun 20 2007;57(2):139-153.
42. Kinney A, Kline J, Levin B. Alcohol, caffeine and smoking in relation to age at
menopause. Maturitas. Apr 20 2006;54(1):27-38.
43. Palmer JR, Rosenberg L, Wise LA, Horton NJ, Adams-Campbell LL. Onset of
natural menopause in African American women. Am J Public Health. Feb
2003;93(2):299-306.
44. McKinlay SM, Brambilla DJ, Posner JG. The normal menopause transition.
American Journal of Human Biology. 1992;4:37-46.
45. Sammel MD, Freeman EW, Liu Z, Lin H, Guo W. Factors that influence entry
into stages of the menopausal transition. Menopause. Nov-Dec 2009;16(6):1218-
1227.
46. Huang X, Harlow SD, Elliott MR. Distinguishing 6 population subgroups by
timing and characteristics of the menopausal transition. Am J Epidemiol. Jan 1
2012;175(1):74-83.
47. den Tonkelaar I, te Velde ER, Looman CW. Menstrual cycle length preceding
menopause in relation to age at menopause. Maturitas. Jun 3 1998;29(2):115-123.
48. Whelan EA, Sandler DP, McConnaughey DR, Weinberg CR. Menstrual and
reproductive characteristics and age at natural menopause. Am J Epidemiol. Apr
1990;131(4):625-632.

89
CHAPTER IV
Abnormal Uterine Bleeding Common during the Menopausal Transition
Introduction
Gynecological disorders are a major cause of inpatient hospitalization in the
United States, accounting for 14% of all hospitalizations among women aged 45-54 years
old from 1998 through 2005.[1] In this age group, the rate of hospitalization for
menstrual disorders increased from a rate of 11.1 per 10,000 women in 1998 to 15.8 per
10,000 women in 2005.[1] Behind uterine fibroids, menstrual disorders are the second
most common diagnosis associated with hysterectomy.[2] The estimated cost of treating
abnormal uterine bleeding is about $1 billion annually.[3]
While the burden of abnormal uterine bleeding is significant, only recently a
consensus has been reached on proper terminology and definitions. Recommendations
recently put forward by the International Federation of Gynecology and Obstetrics
(FIGO) Menstrual Disorders Working Group [4, 5] defined normal duration of menstrual
flow to be between 4.5 and 8 days, with prolonged menstrual bleeding defined to be
exceeding 8 days for mid-reproductive aged women. Previous recommendations based on
data from the TREMIN Trust defined prolonged menstrual bleeding as 10 or more
days,[6] while the World Health Organization (WHO) recommends a definition of
prolonged menstrual bleeding to be menses exceeding 14 days.[7]
90
One of the classic studies on menstrual blood loss demonstrated women age 50
displayed a higher variability of menstrual blood loss then women age 23-45.[8]
Although it has been reported that the first change in menstrual function noticed by
women when they begin the menopausal transition (MT) is changes in menstrual
bleeding [9], only a few perimenopausal cohorts have used menstrual calendar studies to
examine menses duration and flow.[10-12] The Melbourne Women’s Midlife Health
Project did not find a change in mean heaviness of flow from the first to second year of
their menstrual calendar study.[12]
The Massachusetts Women’s Health Study reported a higher percentage of
prolonged bleeding in perimenopausal women than premenopausal women[11], while a
Danish study found the 1 year prevalence of prolonged menstrual bleeding to be 36%-
49%. Drawbacks to these studies include short duration, predominately Caucasian
populations.
Regional differences have been reported in studies conducted by the WHO.
Women in India and Mexico had the shortest duration of menses (mean 4.0 days) while
women in the United Kingdom had the longest duration of menses (mean 5.3).[13]
Another study found similar results with Latin America women reporting an average
duration of menses of 4.0 days while European women had an average duration of
menses of 5.9 days.[14] The ethnic difference may have been due to difference in other
demographical, biological, and lifestyle factors including body mass index (BMI).
Studies of early and mid reproductive aged women provided evidence that BMI may also
influence menses duration and flow.[15-20] Diabetes [21], thyroid disorders [22-25], and
uterine fibroids [26-28] have also been associated with menses duration and flow.

91
The purpose of the present study was to describe the distribution of menses
duration and heaviness of flow (number of heavy days, number of spotting days) and to
assess the association of ethnicity, BMI, and medical conditions on these menstrual
bleeding characteristics during the MT. In order to achieve this goal, we utilized data
from The Study of Women’s health Across the Nation (SWAN), a multiethnic cohort of
midlife women.
Methods
This study includes 1498 women who participated from three sites of the SWAN
menstrual calendar substudy: southeastern Michigan, Los Angeles, and Oakland. The
design of the main cohort study has been previously described.[29] Briefly, a cross-
sectional screening survey was administered to 6,345 women at the three of study sites
between 1995 and 1997 to assess eligibility for enrollment into the cohort study.
Eligibility for the cohort study included age 43-52 years, self-designation as a member of
the targeted racial/ethnic group, residence in the geographic area of one of the three clinic
sites, the ability to speak English, Cantonese, Japanese, the ability to give verbal
consents, an intact uterus, at least one menstrual period and no use of reproductive
hormones in the previous 3 months. Each site recruited Caucasian women and women
from one specified minority group (African Americans in southeastern Michigan,
Japanese in Los Angeles, and Chinese in Oakland). A total of 1498 women were
enrolled into the cohort study from the three study sites. Institutional Review Boards at
each study site approved the protocol.
The SWAN cohort study began in 1996 and annual follow-up visits have been
conducted since that time. Each visit consisted of both interviewer administered and self
92
administered questionnaires that inquired into a broad range of topics including
information on menstrual experience as well as socio-demographic characteristics,
lifestyle, and medical history. The participants also underwent physical assessments
which included a blood draw.
A self-administered menstrual calendar component began in 1996 and continued
through 2006, corresponding to the tenth annual follow-up visit. Participants filled out the
menstrual calendars daily to capture days where any spotting or bleeding occurred.
Heaviness of flow for the day was recorded as spotting (bleeding not requiring the use of a
sanitary product or not filling a regular-sized sanitary product), light to moderate bleeding, or
very heavy bleeding (needing to change sanitary product every 1-2 hours for more than 4 hours
during the day). On the last day of the month women answered questions about oral
contraceptive or hormone therapy use as well as gynecological procedures which could
affect bleeding, cigarette use, and physical exercise. Women were asked to continue to
fill out and return the monthly calendar for 2 years after their last menstrual bleed.
Women’s menstrual experience was assessed by examining their sequence of
menstrual cycle lengths. Menstrual cycle length was calculated using bleeding
definitions originally developed by the WHO [30] and previously utilized in ReSTAGE
analyses [31-33]. A menstrual cycle consists of a bleeding episode and a subsequent
bleed free interval of at least 3 days. A bleeding episode (menses) was defined as at least
one day of bleeding or spotting. The duration of bleeding, total number of spotting days
recorded, and total number of heavy days recorded were determined for each bleeding
episode. Potential abnormal menstrual events were defined for both menses duration and
heaviness of flow. Two definitions of prolonged menses were used, menses duration of
10 or more days and menses duration of 15 or more days. After examining the

93
distribution for the total number of spotting days and the total number heavy days, we
used the cutoff of the highest 5 to 6% of values to determine the define potential
abnormal events.
Onset of the early menopausal and the late MT was defined from the calendar
data using definitions developed by the STRAW [34], refined by the ReSTAGE
collaboration [31-33] and adopted by STRAW+10 [35-38]. The start of the early
transition is defined by the persistent difference of at least 7 days in the length of
consecutive menstrual cycles, with persistence defined as recurrence within 10 cycles of
the first variable length cycle. The start date of the early transition is the date of the first
variable length cycle. The start of the late transition is defined as the first occurrence of a
menstrual cycle length of at least 60 days. Menstrual cycles before the onset of the early
transition were defined as pre-transitional. Menstrual cycles after the onset of early MT
but before the onset of late MT were defined as early transition and menstrual cycles after
the onset of the late MT were defined as late transition. If neither the onset of the early
MT nor the onset of the late MT was observed for a woman, then all her menstrual cycles
were defined as undetermined.
The final menstrual period (FMP) was defined as the first day of a bleeding
segment followed by at least 12 months of amenorrhea. For women who had missing
calendars during the 12 months of amenorrhea, we accepted the potential FMP in the
menstrual calendar if no more than 2 calendars were missing or if the date was less than
31 days different from the FMP date identified by the annual interviews.
Hormone therapy use, which included hormone replacement therapy, oral
contraceptives, or chemotherapy, was assessed monthly. For months with missing
94
hormone information, menstrual cycles were coded as untreated if a woman never
reported hormone therapy use in the study, if the menstrual cycle occurred before the first
report of hormone therapy use, or if the menstrual cycle occurred in a year where no
hormone therapy use was reported in the monthly calendars or annual interview. Women
who ever reported hormone use during the study were identified and an indicator variable
was created.
Height was measured without shoes using either a metric folding wooden ruler or
measuring tape (home and some clinic visits), or a fixed stadiometer (clinic visits).
Weight was measured at each annual visit without shoes, and in light indoor clothing,
using a portable digital scale or either a digital or balance beam. For each menstrual
cycle, weight was linearly interpolated between data recorded at the prior and subsequent
annual visits. BMI, calculated as weight in kilograms divided by height in meters
squared, was categorized as underweight (<18.5 kg/m2), normal weight (18.5-24.9 kg/m
2)
overweight (25.0-29.9 kg/m2), or obese (≥30.0 kg/m
2).
At each annual interview women were asked whether they were diagnosed with
diabetes since the last visit or were taking any medications for diabetes (high blood
sugar). Serum glucose levels were also measured at each of the first seven annual visits.
A woman was considered diabetic if she indicated she was diagnosed with diabetes, was
taking diabetes medication, or had a serum glucose level of ≥126 mg/dl. Women were
also asked if they had been diagnosed with a thyroid condition or were taking medication
for a thyroid condition, and if they had been diagnosed with uterine fibroids. For each of
the three medical conditions above, six months was subtracted from the annual visit date

95
a woman first indicated she had the condition and all menstrual cycles on or after this
date were considered to have the condition.
Women were asked to indicate whether they smoked at least one cigarette a day
or a total of 30 cigarettes in the last month and positive responses were considered
current cigarette use for that month. Women were asked if they participated in moderate
to vigorous physical activity, the average times a week they participated and the average
minutes they participated each time. Average total hours of physical activity per week
were calculated for each month. For menstrual cycles that covered more than one month,
the highest average total hours of physical activity per week was used.
Ethnicity was self-defined and categorized as African American, Chinese or
Chinese American, Japanese or Japanese, or Caucasian. Highest education (high school
graduate /GED or less than high school versus at least some college) and marital status
(single, married, or separated, widowed, or divorced) were assessed at baseline.
Economic strain was assessed at baseline with the question “how hard is it to pay for
basics?” and was categorized as very hard, somewhat hard, or not hard.
Of the 1498 women, 1320 (88.2%) were eligible for this analysis. An eligible
woman, had a least one untreated menstrual cycle recorded in the menstrual calendars
with menstrual cycle-level covariate information available. Menstrual cycles where
hormone use occurred or during a wash-out period were excluded from the analyses, as
were menstrual cycles with missing covariate information.
Statistical analyses performed using SAS 9.2 (SAS Institute Inc., Cary, NC).
Baseline demographics were compared for women eligible and no eligible women.
Pearson’s chi-square or Fisher's exact tests were used to compare proportions, and Student's t
tests were used to compare means between groups.

96
To determine the frequency of abnormal menstrual events, cumulative percents
were calculated using Kaplan-Meier methods for survival probabilities, which adjusted
for right-censoring. Time to bleeding event was calculated as time from the start of the
study until the start of the first abnormal bleeding event, second abnormal bleeding event,
or the third abnormal bleeding event. For women who did not have an abnormal bleeding
event, time was calculated as time from the start of the study until the start of the last
menses observed. Cumulative percents of abnormal menstrual events for women during
the early MT (n=963) and the late MT (n=815) were also calculated.
To examine the relationship between factors and menstrual bleeding, we first
examined factors associated with median menses duration. Quantile regression was used
to model the factors associated with median menses duration. To better reflect the
standard error in our data which included repeated measures, bootstrap sampling with
500 repetitions was conducted to construct 95% confidence intervals (CI) for the quantile
regression coefficients. The bootstrap sampling was based on samples of women and not
menstrual cycles. If a woman was selected then all of her eligible menstrual cycles were
included. MT stage, ethnicity, and BMI were placed into the multivariate model as well
as any other covariate that showed a crude association with the median duration of
menses.
We then examined factors that were associated with abnormal menstrual events.
Generalized estimating equation (GEE) methods with an AR1 working correlation
structure were used to model the association between menses of at least 10 days, menses
with at least 3 days of heavy bleeding, or menses with at least 6 days of spotting and
variables of interest. The number of events with menses exceeding 15 days was too small

97
to perform multivariate analysis. The working correlation structure was selected by using
the quasi-likelihood information criterion (QIC). Bivariate models included only the
variable of interest and were adjusted for repeated measures. Multivariable models
included the major factors of interest: MT stage, ethnicity, and BMI. Additional variables
were added to the multivariable model in a stepwise fashion if they exhibited a moderate
association with the outcome (P<.2).
Results
Baseline demographic, social, and behavior factors for the SWAN women
included in this analysis are displayed in Table 4.1. Women who did not participate in the
menstrual calendar substudy were more likely to be from Michigan, African-American,
report economic strain, overweight or obese, and to be a current smoker than menstrual
calendar substudy participants. Women who did not participate were also less likely to be
married, had lower educational attainment, and were older than menstrual calendar
substudy participants.
In this analysis, 1320 women contributed 51,606 menstrual cycles. The
distributions of menses duration, the total number of heavy days during menses, and the
total number of spotting days during menses are reported in Table 4.2. The range for
menses duration was 1 through 132 days with a mean of 5.9 days and a median of 6 days.
Menses duration of 10 or more days was present in 3,401 (6.6%) menstrual cycles.
Menses duration of 15 or more days was present in 838 (1.6%) menstrual cycles. The
range of spotting days during menses was 0 through 82 days, with a mean of 2.6 days and
a median of 2 days. Six or more days of spotting occurred in 3,181 (6.2%) menstrual
cycles. The range of heavy days during menses was 0 through 19 days, with a mean of

98
0.7 days and a median of 0 days. Three or more days of heavy bleeding occurred in 2,746
(5.3%) menstrual cycles. Spotting of six or more days occurred in 1991 (58.5%) of the
menstrual cycles with menses of 10 or more days. Among menstrual cycles with menses
of 10 or more days, three or more heavy bleeding days also occurred in 561 (16.5%)
menstrual cycles. Three or more heavy days of bleeding occurred in 218 (6.9%) of the
menstrual cycles with spotting of six or more days, the majority of which (215) also
occurred with menses of 10 or more days (Figure 4.1).
Table 4.3 presents the estimated cumulative percents of women who experienced
menses of 10 or more days, menses of 15 or more days, menses with 3 or more heavy
days, and menses with 6 or more spotting days during the study period. In the 10.5 years
of observation, the cumulative percent of women with at least 1, 2, or 3 events of menses
of 10 or more days was 91.0%, 87.5%, and 77.7% respectively and for menses of 15 or
more days was 58.5%, 40.3%, and 29.8%. During the early MT, with up to 9.8 years in
duration, the cumulative percent of women with at least 3 events of menses of 10 or more
days was 51.6% and was 23.5% for menses of 15 or more days. During the late MT, with
up to 8.4 years in duration, the cumulative percent of women with at least 3 events of
menses of 10 or more days was 54.6% and was 22.8% for menses of 15 or more days.
During the study, 90.4%, 87.0%, and 66.8% of women had at least 1, 2, or 3
events of menses with 6 or more days of spotting. During the early MT, 51.2% of women
have had at least 3 such events. During the late MT, 75.2% of women have had at least 3
such events.
During the study, the cumulative percent of women with at least 1, 2, or 3 events
of menses with three or more days of heavy bleeding was 70.6%, 44.6%, and 34.5%.

99
During the early MT, 30.7% of women have had at least 3 such events. During the late
MT, 34.7% of women have had at least 3 such events
The multivariable regression, modeling factors associated with median menses
duration, included MT stage, ethnicity, BMI, and diagnosis of uterine fibroids. Women
who were diagnosed with uterine fibroids had a 1.00 (95%CI: 0.17, 1.83) day longer
median menses duration than women who were not diagnosed with uterine fibroids.
Median menses duration was not associated with MT stage, ethnicity, education,
economic strain, diabetes, thyroid condition, BMI, physical activity, current smoking, or
ever hormone use during the study.
Adjusted and unadjusted odds ratios for factors associated with menses duration
of 10 or more days are shown in Table 4.4. As compared to the pre-MT stage, women
were more likely to report menses of 10 or more days in the early MT (OR= 3.15,
95%CI: 2.47, 4.02) and the late MT (OR= 4.30, 95%CI: 3.26, 5.68). African-American
women were less likely to report menses of 10 or more days as compared to Caucasian
women (OR = 0.64, 95%CI: 0.46, 0.89). Women with a diagnosis of uterine fibroids
were 1.52 (95%CI: 1.22, 1.88) times more likely to record menses of 10 or more days
than were women without a diagnosis of uterine fibroids. Women who ever used
hormones during the study were more likely (OR= 1.59, 95%CI: 1.27, 2.00) to record
menses of 10 or more days than were women who never used hormones during the study.
Factors associated with menses with 6 or more spotting days are shown in Table
4.5. As compared to women in the pre-MT stage, women in the early MT (OR=2.66,
95%CI: 1.98, 3.57) and women in the late MT (OR=3.95, 95%CI: 2.83, 5.52) were more
likely to record 6 or more days of spotting. African-American women were less likely

100
(OR=0.52, 95%CI: 0.37, 0.73) to record 6 or more days of spotting than Caucasian
women. Women who were diagnosed with uterine fibroids were more likely to record 6
or more days of spotting than women who were not diagnosed with uterine fibroids
(OR=1.28, 95%CI: 1.04, 1.58). Women who ever used hormones during the study were
more likely to record 6 or more days of spotting than women who never used hormones
during the study (OR=1.32, 95%CI: 1.06, 1.64).
Factors associated with menses with 3 or more days of heavy bleeding are shown
in Table 4.6. Women in the early MT (OR=1.38, 95%CI: 1.10, 1.73) and in the late MT
(OR=1.75, 95%CI: 1.31, 2.34) were more likely to have had 3 or more days of heavy
bleeding than women in the pre-MT stage. Japanese women were less likely (OR=0.59,
95%CI: 0.39, 0.88) to record 3 or more days of heavy bleeding than Caucasian women.
Women who reported that it was very or somewhat hard to pay for basics were 1.57
(95%CI: 1.17, 2.11) times more likely to record 3 or more days of heavy bleeding than
Caucasian women. Overweight women (OR=1.40, 95%CI: 1.02, 1.91) and obese women
(OR=1.40, 95%CI: 1.02, 1.91) were more likely to experience 3 or more days of heavy
bleeding than normal weight women. Current smokers were 1.63 (95%CI: 1.16, 2.28)
times more likely to record 3 or more days of heavy bleeding than non-smokers. Women
who ever used hormones during the study were more likely (OR=1.62, 95%CI: 1.21,
2.16) to record 3 or more days of heavy bleeding than women who never used hormones
during the study. There was a non-significant association between uterine fibroids and
menses with 3 or more days of heavy bleeding (OR=1.34, 95%CI: 0.97, 1.85). In the
crude analysis, both diabetes and thyroid conditions were associated with 3 or more days
of heavy bleeding, but the relationships did not persist after adjustment.

101
Education, economic strain, diabetes, thyroid condition, BMI, physical activity, or
current smoking were not found to be associated with menses of 10 or more days or
menses with 6 days of spotting. Education and physical activity were not associated with
menses with 3 or more days of heavy bleeding.
Discussion
This study is one of the first to examine the frequency of bleeding events which
are considered abnormal in mid-reproductive life but may not be for the MT, as well as
factors associated with these potential abnormal events. A small percentage of menstrual
cycles had menses of 10 or more days, yet 3 out of 4 women experienced 3 or more
episodes of this bleeding event during the MT. One in 4 women experienced 3 or more
episodes of menses exceeding 2 weeks. Menses with spotting of 6 or more days occurred
in over half the episodes of menses of 10 or more days, suggesting a pattern of long, light
bleeding. Menses with heavy bleeding of 3 or more days were less common, yet one in
three women experienced 3 or more episodes. Menses of 10 or more days, menses with
spotting of 6 or more days, and menses with heavy bleeding of 3 or more days were more
likely to occur in the early and late MT transition. We also found that the likelihood of
experiencing these menstrual events differed by ethnicity. African-American women
were less likely to report menses of 10 or more days and less likely to report menses with
6 or more days of spotting, while Japanese women were less likely to report menses with
heavy bleeding of 3 or more days as compared to Caucasian women. BMI was associated
with prolonged heavy bleeding. Women with a diagnosis of uterine fibroids and those

102
who ever used hormones during the study were more likely to experience all three
bleeding events.
In this study, the median duration of menses was 6 days. Other studies of
perimenopausal women have found similar results with a median of 5 or 6 days.[6, 10,
11] However, one of the classic studies of menstruation conducted in Japanese women
found the median duration of menses in women over 40 was 4.12 days.[39] In our study,
menses of 10 or more days, menses with 6 or more days of spotting, and menses with 3 or
more days of heavy bleeding were noted to occur more frequently in the early and late
MT. The median duration of menses was not associated with MT stage, suggesting that it
is not the median but rater the likelihood of abnormal events that changes during the MT.
The Massachusetts Women’s Health Study defined prolonged bleeding as menses
exceeding 8 days, and found a higher percentage of prolonged bleeding in
perimenopausal women than premenopausal women.[11] The Melbourne Women’s
Midlife Health Project did not find a change in mean heaviness of flow from the first to
second year of their menstrual calendar study.[12]
We observed menses of 10 or more days to be a common event, with three-
quarters of our women reporting at least three episodes during the MT. A Danish
calendar-based study examined this prolonged bleeding event and found the 1 year period
prevalence to be 36.4-48.7%.[10], while an English study utilizing questionnaires
observed a smaller 12 month cumulative incidence of 14.7% [40]. Three or more
episodes of prolonged heavy bleeding were reported by one in three women in our study.
The Danish examined menstrual flooding and calculated the 1 year period prevalence to

103
be 10.3% to 31.0%[10], while the English cohort study observed a 1 year cumulative
incidence of heavy periods to be 53.0%.[40]
The ethnic differences in menstrual bleeding observed in this study are consistent
with findings in younger aged women. Besides the studies by the WHO [13, 14], only
one other study, which was among postmenarcheal girls, has examined ethnic differences
in menstrual bleeding. The study found the mean duration of bleeding to be a half-day
less among African-American girls as compared to Caucasian girls, but African-
American girls were more likely to report heavy bleeding than Caucasian girls.[18] We
observed menses of 10 or more days to be less likely in African-American women as
compared to Caucasian women; African-American women were more likely to report
menses with 3 or more heavy days but, after adjustment, this association was attenuated.
Japanese women were less likely to report menses with 3 or more heavy days.
BMI was associated with heaviness of flow but not menses duration in this study.
Our results are consistent with the perimenopausal Danish study which reported that
obese women were more likely to report menstrual flooding but not prolonged menstrual
bleeding[10]. In the SWAN Daily Hormone Study, obesity was associated with menses
with 3 or more days of heavy bleeding.[41] The Michigan Bone Health and Metabolism
Study did not find an association with mean menses duration and BMI among
reproductive aged women.[42] However, several studies on early and mid-reproductive
aged woman have found an association between low BMI and longer menses duration
[16, 18, 19] and high BMI and short menses duration [15, 17, 18, 20].
Ever being on hormones during the study was positively associated with all three
bleeding events. This result is consistent with the fact that hormones are used to treat

104
abnormal uterine bleeding.[43] Uterine fibroids were also positively associated with all
three bleeding events. This association may not be due to uterine fibroids in general, but
only to uterine fibroids that cause more symptoms. In our study, women self-reported a
physician diagnosis of uterine fibroids. Typically, women are only diagnosed with uterine
fibroids when they present with a specific complaint and then receive an ultrasound.
However, it is estimated that 50% of women with uterine fibroids are asymptomatic.[44]
This study has some limitations. Left-censoring may have biased our study
results. The mean age of women eligible for this was 45.7 years, and it is possible that the
start of the MT occurred prior to enrollment into the study. In an analysis using data from
women 35 years and older participating in the TREMIN study, the median age of the
early MT was 41.0 years.[33] Women who did not have a menstrual cycle in the last 3
months were ineligible to enroll into the SWAN cohort study, therefore women who were
near the end of the MT, who experience surgical amenorrhea, or who already experienced
their FMP were excluded from enrollment. In the population from which our cohort study
was enrolled, African-American women were more likely to have had a
hysterectomy.[45] Women who were African-American, who were less educated, were
more likely to have economic strain, were overweight or obese, or were current smokers
were less likely to have participated in the SWAN Menstrual Calendar Substudy.
Despite these limitations, our study has several important strengths. This is the
only multiethnic cohort study to use menstrual calendar studies to examine menstrual
characteristics through the MT. This study had a larger sample size and observed women
for longer than many of the perimenopausal cohort studies that have utilized menstrual

105
calendars Our large sample size allowed us to examine adjusted associations and our long
follow-up made it possible to observe the full MT in many participants.
In conclusion, we found a large majority of women experience menses duration of
10 or more days, menses with spotting of 6 or more days, and to a lesser degree menses
with 3 or more days of heavy bleeding during the MT. The likelihood of experiencing
these menstrual bleeding events varies by ethnicity, BMI, and uterine fibroids. This data
suggest that two types of bleeding events, longer menses with more days of spotting and
heavier menses, occur frequently during the MT. While these events are considered
abnormal for younger aged women, the high frequencies for which these occur in
perimenopausal women suggests the current FIGO definition of prolonged menstrual
bleeding (menses exceeding 8 days) needs to be qualified for perimenopausal women.
We recommend that prolonged menstrual bleeding for women in the MT should be
defined as two or more occurrences of menses exceeding 2 weeks. Common causes for
abnormal menstrual bleeding include polyps, fibroids, malignancies, coagulopathies, and
ovulatory dysfunction.[5] Clinical management of abnormal menstrual bleeding includes
nonsteroidal anti-inflammatory drugs, hormone therapy, and hysterectomy.[43] If a cause
for abnormal bleeding is not found, and it is determined a woman is close to her FMP,
then our data suggest a wait-and see approach may be warranted.
A prior study on how women perceive their changes in menstrual bleeding during
the MT observed that, as a woman’s menstrual pattern changed, “her focus shifted from
what was normal for her to what was normal for women going through menopause.”[46]
While our study gives some greater understanding of the common changes in menstrual
bleeding that occurs during the transition, future studies are need to replicate our results.

106
Figure 4.1. Venn Diagram of Potential Abnormal Bleeding Events. Shown is the
number of occurances of menses of duration of 10 or more days, spotting of six or more
days, and very heavy bleeding of 3 or more days, and their overlap.
Spotting 6+ Days
3181
Menses 10+ Days
3401
Heavy Bleeding
3+ Days
2746

107
Table 4.1 Baseline Demographics of Women in SWAN by Participation in
Menstrual Calendar Substudy
Participated
n=1320
n(%)
Did Not
Participate
n=178
n (%) P value
Study Site
Michigan 430 (32.6) 113 (63.5) <0.01
Oakland 432 (32.7) 27 (15.2)
Los Angeles 458 (34.7) 38 (21.3)
Ethnicity
African-American 236 (17.9) 89 (50.0) <0.01
Chinese 232 (17.6) 18 (10.1)
Japanese 262 (19.8) 19 (10.7)
Caucasian 590 (44.7) 52 (29.2)
Education
Less than High School 66 (5.0) 14 (8.6) 0.01
High School Grad 219 (16.6) 35 (21.6)
Some College/Vocation 455 (34.5) 60 (37.1)
College Graduate 296 (22.4) 35 (21.6)
Post College 284 (21.5) 18 (11.1)
Marital Status
Single 172 (13.0) 22 (12.6) 0.02
Married 911 (69.1) 103 (58.9)
Separated 44 (3.3) 10 (5.7)
Widowed 24 (1.8) 6 (3.4)
Divorced 168 (12.7) 34 (19.4)
How Hard Is It To Pay For Basics
Very Hard 91 (6.9) 15 (8.8) 0.01
Somewhat Hard 349 (26.4) 63 (36.8)
Not Hard 880 (66.7) 93 (54.4)
Body Mass Index, kg/m2
Underweight (<18.5) 42 (3.2) 5 (2.9) 0.01
Normal (18.5 -24.9) 717 (55.2) 62 (35.4)
Overweight (25.0 -29.9) 251 (19.3) 54 (30.9)
Obese(≥ 30.0) 290 (22.3) 54 (30.9)
Baseline Smoking Status
Never 836 (64.1) 104 (59.8) 0.03
Past 277 (21.2) 31 (17.8)
Current 191 (14.7) 39 (22.4)
Ever Taken Hormones Prior to Study1 154 (11.7) 17 (9.7) 0.43
Ever Diabetes During Study2 211 (16.0) 33 (18.5) 0.39
Ever Fibroids During Study2 417 (31.6) 47 (26.4) 0.17
Ever Thyroid Disorder During Study2 252 (19.1) 33 (18.5) 0.86
Age at Screener years , Mean (STD) 45.7 (2.7) 46.3 (3.0) 0.02 1 Does not include oral contraceptive pills.
2 Diagnosed during the first 10 annual visits.

108
Table 4.2 Number of Menstrual Cycles (51,606) by Bleeding Characteristic
Bleeding Characteristic Frequency Percent
Menses Duration, Days
1 1,992 3.9
2 1,247 2.4
3 3,320 6.4
4 6,972 13.5
5 11,780 22.8
6 10,358 20.1
7 7,005 13.6
8 3,645 7.1
9 1,886 3.6
10+ 3,401 6.6
Number of Spotting Days
0 4,990 9.7
1 10,674 20.7
2 14,177 27.4
3 10,649 20.6
4-5 7,935 15.4
6+ 3,181 6.2
Number of Heavy Days
0 32,207 62.4
1 8,352 16.2
2 8,301 16.1
3+ 2,746 5.3

109
Table 4.3 Cumulative Percent of Women with at least 1, 2, or 3 Episodes of Bleeding Event Observed
Bleeding characteristics Number Of Women With
At Least 1 At Least 2 At Least 3
n %1 n %
1 n %
1
Menses Duration ≥10 days
All Stages2 634 91.0 467 87.5 335 77.7
During Early Transition3 443 84.4 282 69.8 185 51.6
During Late Transition4 368 92.3 207 73.1 128 54.6
Menses Duration ≥15 days
All Stages2 333 58.5 164 40.3 99 29.8
During Early Transition3 184 57.9 88 35.7 49 23.5
During Late Transition4 171 50.2 73 41.6 35 22.8
Menses includes ≥ 6 days of spotting
All Stages2 670 90.4 458 87.0 331 66.8
During Early Transition3 427 87.3 272 69.0 186 51.2
During Late Transition4 386 90.5 215 89.0 130 75.2
Menses includes ≥3 heavy days of bleeding
All Stages2 532 70.6 341 44.6 264 34.5
During Early Transition3 327 60.1 200 53.7 147 30.7
During Late Transition4 235 54.5 134 50.7 90 34.7
1 Cumulative percent calculated by Kaplan-Meir Product Limit to adjust for right-censoring
2 1320 women were observed during the study
3 963 had the start of the early transition stage observed
4 815 women had the start of the late transition observed.

110
Table 4.4 Logistic Regression Models for Menses Duration of 10 or More Days
Unadjusted1 Adjusted
2
OR
95%
Confidence
Interval
OR
95%
Confidence
Interval
Menopausal Transition Stage
Pre-transition - Referent - Referent
Early transition 3.12 2.46, 3.96 3.15 2.47, 4.02
Late transition 4.20 3.19, 5.55 4.30 3.26, 5.68
Unknown 1.39 0.78, 2.46 1.46 0.82, 2.59
Ethnicity
African-American 0.63 0.45, 0.88 0.64 0.46, 0.89
Chinese 0.92 0.68, 1.23 0.97 0.72, 1.32
Japanese 0.83 0.63, 1.09 0.80 0.60, 1.07
Caucasian - Referent - Referent
High School Grad or Less 1.01 0.75, 1.36
Very or Somewhat Hard to Pay for Basics 1.26 0.97, 1.63
Diabetes 0.97 0.66, 1.42
Thyroid Condition 1.21 0.89, 1.64
Fibroids 1.60 1.28, 2.01 1.52 1.22, 1.88
Body Mass Index, kg/m2
Normal weight (≤24.9) - Referent - Referent
Overweight (25.0-29.9) 0.92 0.71, 1.18 0.94 0.73, 1.20
Obese (≥ 30) 0.93 0.72, 1.21 0.91 0.69, 1.19
Every 1 Hour of Moderate or Vigorous
Exercise per Week 1.01 0.99, 1.03
Current Smoker 1.00 0.74, 1.36
Ever Hormone Use During Study 1.71 1.37, 2.14 1.59 1.27, 2.00 1Each univariate model contained variable listed and adjusted for repeated measures
2Multivariate model contains menopausal transition stage, race/ethnicity, fibroids, BMI, ever hormone use,
and adjusted for repeated measures

111
Table 4.5 Logistic Regression Models for Menses with Spotting of 6 or More days.
Unadjusted1 Adjusted
2
OR
95%
Confidence
Interval
OR
95%
Confidence
Interval
Menopausal Transition Stage
Pre-transition - Referent - Referent
Early transition 2.60 1.93, 3.50 2.66 1.98, 3.57
Late transition 3.92 2.81, 5.46 3.95 2.83, 5.52
Unknown 0.84 0.45, 1.59 0.94 0.50, 1.77
Ethnicity
African-American 0.52 0.37, 0.72 0.52 0.37, 0.73
Chinese 1.27 0.95, 1.71 1.23 0.90, 1.69
Japanese 1.09 0.84, 1.42 1.01 0.76, 1.34
Caucasian - Referent - Referent
High School Grad or Less 1.12 0.85, 1.48
Very or Somewhat Hard to Pay for Basics 1.18 0.92, 1.51 1.24 0.96, 1.60
Diabetes 1.06 0.70, 1.58
Thyroid Condition 1.00 0.72, 1.38
Fibroids 1.29 1.03, 1.60 1.28 1.04, 1.58
Body Mass Index, kg/m2
Normal weight (18.5-24.9) - Referent - Referent
Overweight (25.0-29.9) 0.81 0.64, 1.01 0.88 0.70, 1.11
Obese (≥ 30) 0.72 0.54, 0.96 0.80 0.58, 1.10
Every 1 Hour of Moderate or Vigorous
Exercise per Week
1.01 0.99, 1.04
Current Smoker 0.79 0.56, 1.10
Ever Hormone Use During Study 1.33 1.07, 1.66 1.32 1.06, 1.64 1Each univariate model contained variable listed and adjusted for repeated measures
2Multivariate model contained menopausal transition stage, race/ethnicity, hard to pay for basics, fibroids,
BMI, ever hormone use, and adjusted for repeated measures

112
Table 4.6 Logistic Regression Models for Menses with Heavy bleeding of 3 or More Days
Unadjusted1 Adjusted
2
OR
95%
Confidence
Interval
OR
95%
Confidence
Interval
Menopausal Transition Stage
Pre-transition - Referent - Referent
Early transition 1.48 1.17, 1.87 1.38 1.10, 1.73
Late transition 1.90 1.43, 2.53 1.75 1.31, 2.34
Unknown 1.92 1.21, 3.04 1.41 0.90, 2.22
Ethnicity
African-American 1.68 1.21, 2.35 1.26 0.87, 1.84
Chinese 0.65 0.45, 0.95 1.04 0.71, 1.51
Japanese 0.44 0.30, 0.65 0.59 0.39, 0.88
Caucasian - Referent - Referent
High School Grad or Less 1.35 0.99, 1.84
Very or Somewhat Hard to Pay for Basics 1.86 1.41, 2.46 1.57 1.17, 2.11
Diabetes 1.80 1.23, 2.62
Thyroid Condition 1.48 1.00, 2.19
Fibroids 1.48 1.11, 1.99 1.34 0.97, 1.85
Body Mass Index, kg/m2
Normal weight (<=24.9) - Referent - Referent
Overweight (25.0-29.9) 1.52 1.12, 2.08 1.40 1.02, 1.91
Obese (≥ 30) 2.92 2.19, 3.91 2.24 1.63, 3.08
Every 1 Hour of Moderate or Vigorous
Exercise per Week
0.97 0.92, 1.02
Current Smoker 2.09 1.54, 2.84 1.63 1.16, 2.28
Ever Hormone Use During Study 1.64 1.25, 2.16 1.62 1.21, 2.16 1Each univariate model contained variable listed and adjusted for repeated measures
2Mulitvariate model contains menopausal transition stage, race/ethnicity, hard to pay for basics, fibroids,
BMI, current smoker, ever hormone use, and adjusted for repeated measures

113
References
1. Whiteman MK, Kuklina E, Jamieson DJ, Hillis SD, Marchbanks PA. Inpatient
hospitalization for gynecologic disorders in the United States. Am J Obstet
Gynecol. Jun 2010;202(6):541 e541-546.
2. Merrill RM. Hysterectomy surveillance in the United States, 1997 through 2005.
Med Sci Monit. Jan 2008;14(1):CR24-31.
3. Liu Z, Doan QV, Blumenthal P, Dubois RW. A systematic review evaluating
health-related quality of life, work impairment, and health-care costs and
utilization in abnormal uterine bleeding. Value Health. May-Jun 2007;10(3):183-
194.
4. Fraser IS, Critchley HO, Broder M, Munro MG. The FIGO recommendations on
terminologies and definitions for normal and abnormal uterine bleeding. Semin
Reprod Med. Sep 2011;29(5):383-390.
5. Munro MG, Critchley HO, Fraser IS. The FIGO systems for nomenclature and
classification of causes of abnormal uterine bleeding in the reproductive years:
who needs them? Am J Obstet Gynecol. Feb 8 2012.
6. Belsey EM, Pinol AP. Menstrual bleeding patterns in untreated women. Task
Force on Long-Acting Systemic Agents for Fertility Regulation. Contraception.
Feb 1997;55(2):57-65.
7. Belsey EM, Machin D, d'Arcangues C. The analysis of vaginal bleeding patterns
induced by fertility regulating methods. World Health Organization Special
Programme of Research, Development and Research Training in Human
Reproduction. Contraception. Sep 1986;34(3):253-260.
8. Hallberg L, Hogdahl AM, Nilsson L, Rybo G. Menstrual blood loss--a population
study. Variation at different ages and attempts to define normality. Acta Obstet
Gynecol Scand. 1966;45(3):320-351.
9. Mitchell ES, Woods NF, Mariella A. Three stages of the menopausal transition
from the Seattle Midlife Women's Health Study: toward a more precise definition.
Menopause. Sep-Oct 2000;7(5):334-349.
10. Astrup K, Olivarius Nde F, Moller S, Gottschau A, Karlslund W. Menstrual
bleeding patterns in pre- and perimenopausal women: a population-based
prospective diary study. Acta Obstet Gynecol Scand. Feb 2004;83(2):197-202.
11. Johannes CB, Crawford SL, Longcope C, McKinlay SM. Bleeding patterns and
changes in the perimenopause: a longitudinal characterization of menstrual cycles.
Clinical Consultations in Obstetrics and Gyncecology. 1996;8:9-20.
114
12. Taffe J, Dennerstein L. Retrospective self-report compared with menstrual diary
data prospectively kept during the menopausal transition. Climacteric. Sep
2000;3(3):183-191.
13. World Health Organization. Women's bleeding patterns: ability to recall and
predict menstrual events. World Health Organization Task Force on Psychosocial
Research in Family, Planning, Special Programme of Research, Development and
Research Training in Human Reproduction. Stud Fam Plann. Jan 1981;12(1):17-
27.
14. Belsey EM, Peregoudov S. Determinants of menstrual bleeding patterns among
women using natural and hormonal methods of contraception. I. Regional
variations. Contraception. Aug 1988;38(2):227-242.
15. Belsey EM, d'Arcangues C, Carlson N. Determinants of menstrual bleeding
patterns among women using natural and hormonal methods of contraception. II.
The influence of individual characteristics. Contraception. Aug 1988;38(2):243-
257.
16. Cooper GS, Klebanoff MA, Promislow J, Brock JW, Longnecker MP.
Polychlorinated biphenyls and menstrual cycle characteristics. Epidemiology. Mar
2005;16(2):191-200.
17. Cooper GS, Sandler DP, Whelan EA, Smith KR. Association of physical and
behavioral characteristics with menstrual cycle patterns in women age 29-31
years. Epidemiology. Nov 1996;7(6):624-628.
18. Harlow SD, Campbell B. Ethnic differences in the duration and amount of
menstrual bleeding during the postmenarcheal period. Am J Epidemiol. Nov 15
1996;144(10):980-988.
19. Harlow SD, Campbell BC. Host factors that influence the duration of menstrual
bleeding. Epidemiology. May 1994;5(3):352-355.
20. Lin HT, Lin LC, Shiao JS. The impact of self-perceived job stress on menstrual
patterns among Taiwanese nurses. Ind Health. Oct 2007;45(5):709-714.
21. Strotmeyer ES, Steenkiste AR, Foley TP, Jr., Berga SL, Dorman JS. Menstrual
cycle differences between women with type 1 diabetes and women without
diabetes. Diabetes Care. Apr 2003;26(4):1016-1021.
22. Krassas GE, Pontikides N, Kaltsas T, Papadopoulou P, Batrinos M. Menstrual
disturbances in thyrotoxicosis. Clin Endocrinol (Oxf). May 1994;40(5):641-644.
23. Krassas GE, Pontikides N, Kaltsas T, et al. Disturbances of menstruation in
hypothyroidism. Clin Endocrinol (Oxf). May 1999;50(5):655-659.

115
24. Joshi JV, Bhandarkar SD, Chadha M, Balaiah D, Shah R. Menstrual irregularities
and lactation failure may precede thyroid dysfunction or goitre. J Postgrad Med.
Jul-Sep 1993;39(3):137-141.
25. Benson RC, Dailey ME. The menstrual pattern in hyperthyroidism and
subsequent posttherapy hypothyroidism. Surg Gynecol Obstet. Jan
1955;100(1):19-26.
26. Clevenger-Hoeft M, Syrop CH, Stovall DW, Van Voorhis BJ. Sonohysterography
in premenopausal women with and without abnormal bleeding. Obstet Gynecol.
Oct 1999;94(4):516-520.
27. Wegienka G, Baird DD, Hertz-Picciotto I, et al. Self-reported heavy bleeding
associated with uterine leiomyomata. Obstet Gynecol. Mar 2003;101(3):431-437.
28. Chen CR, Buck GM, Courey NG, Perez KM, Wactawski-Wende J. Risk factors
for uterine fibroids among women undergoing tubal sterilization. Am J Epidemiol.
Jan 1 2001;153(1):20-26.
29. Sowers M, Crawford S, Sternfeld B, et al. SWAN: A Multicenter, Multiethnic,
Community-Based Cohort Study of Women and the Menopausal Transition. In: RA L, J
K, R M, eds. Menopause: Biology and Pathobiology. San Diego: Academic Press;
2000:175-188.
30. Rodriguez G, Faundes-Latham A, Atkinson LE. An approach to the analysis of
menstrual patterns in the critical evaluation of contraceptives. Stud Fam Plann.
Feb 1976;7(2):42-51.
31. Harlow SD, Cain K, Crawford S, et al. Evaluation of four proposed bleeding
criteria for the onset of late menopausal transition. J Clin Endocrinol Metab. Sep
2006;91(9):3432-3438.
32. Harlow SD, Crawford S, Dennerstein L, Burger HG, Mitchell ES, Sowers MF.
Recommendations from a multi-study evaluation of proposed criteria for staging
reproductive aging. Climacteric. Apr 2007;10(2):112-119.
33. Harlow SD, Mitchell ES, Crawford S, Nan B, Little R, Taffe J. The ReSTAGE
Collaboration: defining optimal bleeding criteria for onset of early menopausal
transition. Fertil Steril. Jan 2008;89(1):129-140.
34. Soules MR, Sherman S, Parrott E, et al. Executive summary: Stages of
Reproductive Aging Workshop (STRAW). Fertil Steril. Nov 2001;76(5):874-878.
35. Harlow SD, Gass M, Hall JE, et al. Executive Summary of the Stages of
Reproductive Aging Workshop + 10: Addressing the Unfinished Agenda of
Staging Reproductive Aging. J Clin Endocrinol Metab. Feb 16 2012.
116
36. Harlow SD, Gass M, Hall JE, et al. Executive summary of the Stages of
Reproductive Aging Workshop + 10: addressing the unfinished agenda of staging
reproductive aging. Menopause. Feb 15 2012.
37. Harlow SD, Gass M, Hall JE, et al. Executive summary of the Stages of
Reproductive Aging Workshop + 10: addressing the unfinished agenda of staging
reproductive aging. Fertil Steril. Feb 14 2012.
38. Harlow SD, Gass M, Hall JE, et al. Executive summary of the Stages of
Reproductive Aging Workshop +10: addressing the unfinished agenda of staging
reproductive aging. Climacteric. Feb 16 2012.
39. Matsumoto S, Mogami Y, Ohkuri S. Statistical studies on menstruation; a crticism
on the definition of normal menstruation. Gunma J med Sci. 1962;11:294-318.
40. Shapley M, Jordan K, Croft PR. An epidemiological survey of symptoms of
menstrual loss in the community. Br J Gen Pract. May 2004;54(502):359-363.
41. Van Voorhis BJ, Santoro N, Harlow S, Crawford SL, Randolph J. The
relationship of bleeding patterns to daily reproductive hormones in women
approaching menopause. Obstet Gynecol. Jul 2008;112(1):101-108.
42. Sternfeld B, Jacobs MK, Quesenberry CP, Jr., Gold EB, Sowers M. Physical
activity and menstrual cycle characteristics in two prospective cohorts. Am J
Epidemiol. Sep 1 2002;156(5):402-409.
43. Jain A, Santoro N. Endocrine mechanisms and management for abnormal
bleeding due to perimenopausal changes. Clin Obstet Gynecol. Jun
2005;48(2):295-311.
44. Gupta S, Jose J, Manyonda I. Clinical presentation of fibroids. Best Pract Res
Clin Obstet Gynaecol. Aug 2008;22(4):615-626.
45. Gold EB, Bromberger J, Crawford S, et al. Factors associated with age at natural
menopause in a multiethnic sample of midlife women. Am J Epidemiol. May 1
2001;153(9):865-874.
46. Kittell LA, Mansfield PK, Morse JM, Voda AM. Experiencing changes in
menstrual bleeding during the menopausal transition. Menopause-J. N. Am.
Menopause Soc. Fal 1997;4(3):173-183.

117
CHAPTER V
Summary of Findings
This dissertation adds to scientific understanding of the natural history of change
in menstrual function during the menopausal transition (MT) and how patterns of change
differ by ethnicity and body size, providing a basis for distinguishing normal from
abnormal change during the transition from active reproductive life to the post
menopause. A greater propensity for longer menstrual cycles, more variable menstrual
cycles, longer-lighter menses, and episodes of heavy menstrual bleeding occur as women
progress through the MT. This propensity differs by ethnicity and body size. Japanese
women are more likely to report longer menstrual cycles and less likely to report heavy
menstrual bleeding, while African-American women were less likely to report longer-
lighter menses. Obese women were more likely to report longer menstrual cycles and
heavy menstrual bleeding.
Prior menstrual calendar studies of the MT have been conducted in predominately
Caucasian populations, while this dissertation focuses on a multiethnic cohort of
women.[1-5] The goal was to describe the normative pattern of change for each of the
specified menstrual cycle characteristics as women progress through the MT and to
identify biological, demographical, and behavioral characteristics that influence these
patterns. First we assessed the validity of commonly used approaches to identifying the
onset of the MT by assessing the level of agreement between staging the MT by

118
menstrual bleeding markers identified in menstrual calendar data, the recognized gold
standard, and by annual interviews or annual follicle-stimulating hormone (FSH)
measures. We then examined the overall pattern of menstrual cycle length through the
MT and examined how these patterns differed by ethnicity, BMI, and medical conditions.
Finally, we focused on menses duration and flow, estimating the frequency of occurrence
of bleeds with extreme durations or excessive flows and assessing the association
between these menstrual characteristics and ethnicity, BMI, and medical conditions.
In chapter 2 we found poor agreement between MT stages as defined by
the menstrual calendars compared to the MT stage as defined by the annual interviews.
The annual interview question that defined the onset of the early MT stage identified
when a woman first reported that her menstrual cycles had become more variable. Prior
studies of midlife women have found interview questions on menstrual cycle irregularity
and variability to have low sensitivity and poor agreement.[3, 6] In our study, most
women did not report this change in menstrual cycles until 1 to 3 years after it was
observed in the menstrual calendars, suggesting that the questions commonly used to
define the onset of early MT are inadequate. Late MT stage was also detected earlier in
the menstrual calendar than by annual interview, regardless of whether the late transition
was defined in the calendar as a menstrual cycle of at least 60 days, as recommended by
STRAW, or as a menstrual cycle of at least 90 days to be consistent with the interview
question. The annual interview question asked women if they had a menstrual cycle in
the last 90 days but not whether they had experienced an episode of amenorrhea of this
length within the past year or since their last interview. This question failed to capture the
late MT stage in a third of the woman.
119
We also found poor agreement between MT staging by menstrual calendars and
MT staging by annual FSH levels. Annual FSH measures frequently failed to detect the
rise in FSH levels during the early MT, as almost a third of woman did not have their
early MT stage identified by FSH levels. In order to capture the initial rise in FSH, more
frequent testing is warranted. The late MT stage by annual FSH levels identified women
earlier than the late MT stage (90 days) by menstrual calendar. However, the late MT
stage by annual FSH levels did not identify women earlier than the late MT stage (60
days) by menstrual calendar.
Quantile regression was utilized in Chapter 3 to facilitate our understanding of the
changes that occur in menstrual cycle length during the MT. Quantile regression allows
us to examine how different portions of the menstrual cycle length distribution are
influenced by women’s body size, health and lifestyle characteristics. We found that, as
time in the MT progresses, the largest increases in menstrual cycle length occurred in the
right tail of the distribution. The initial increase in menstrual cycle length began 2 years
after the start of the MT or 7 years prior to the FMP. During the 2 years prior to FMP,
menstrual cycle length becomes highly variable as shown by the wider 95% confidence
bands.
Factors that were associated with increased menstrual cycle length included
ethnicity, BMI, and physical activity. Chinese and Japanese women were found to have
menstrual cycle lengths that were longer than Caucasian women throughout the
menstrual cycle distribution. Along with evidence presented in previous studies on mid-
reproductive aged women [7, 8], this suggests these women have longer menstrual cycle
lengths throughout the reproductive lifespan. Overweight women had menstrual cycle

120
lengths that were longer than normal weight women at the lower and middle part of the
distribution, but not at the upper end of the distribution. In contrast, obese women had
menstrual cycle lengths that were longer than normal weight women throughout the
distribution. Several studies conducted on early and mid-reproductive aged women have
demonstrated longer menstrual cycle lengths in heavier women [8-12], thus heavier
women appear to have longer menstrual cycle lengths throughout their reproductive life.
Increased moderate to vigorous physical activity was associated with longer menstrual
cycle lengths at the right-tail of the distribution.
Chapter 4 demonstrated that menses of 10 or more days, menses with at least 6
days of spotting, and menses with at least 3 days of heavy bleeding are common events
during the MT, occurring at least once in a large majority of women. Current guidelines
define prolonged menstrual bleeding as menses exceeding 8 days.[13, 14] However,
previous research suggested menses duration of at least 10 days should be the
definition.[15] Studies which included perimenopausal women with only 1 year of
follow-up have also suggested that menses of 10 or more days during this period of
reproductive life was somewhat common.[1, 16] We found that menses of 15 or more
days to be less common, suggesting a more appropriate definition of prolonged menses in
perimenopausal women. More than half of the menstrual cycles with menses of 10 or
more days also included six or more days of spotting, suggesting that one pattern of
menstrual bleeding that increases during the MT is longer, lighter menses. Another
pattern of menstrual bleeding that occurs with a high frequency during the MT is menses
with at least 3 days of heavy bleeding.

121
We observed ethnic differences in menstrual bleeding patterns during the MT.
Japanese women were less likely to have menses with 3 or more days of heavy bleeding.
African-American women were less likely to have menses of 10 or more days or to report
menses with spotting of 6 or more days. A prior study of post-menarcheal girls found
the mean duration of menses was a half-day less among African-American girls as
compared to Caucasian girls.[17] In contrast to findings for menstrual cycle length, BMI
was not associated with menses of 10 or more days or with menses with 6 or more days
of spotting. Other studies of late-reproductive or early perimenopausal women have also
not found an association with menses duration and BMI.[1, 18] Studies of younger aged
women have found lower BMI to be associated with longer menses and higher BMI was
associated with shorter menses.[17, 19-23] Women who were overweight or obese were
more likely to report menses with 3 or more heavy days; similar results have been shown
in other studies of heavy menses or flooding.[1, 24] Of the three medical conditions of
interest, only uterine fibroids were found to be associated with menses outcomes.
Symptomatic fibroids tend to cause menses problems such as heavy menstrual bleeding
and prolonged menses.[25]
Strength and Limitations
The SWAN study is the only multiethnic cohort study with menstrual calendar
data permitting examination of menstrual characteristics during the MT. Prior cohorts
who utilized menstrual calendars have had predominately Caucasian populations. [1-5]
The Penn Ovarian Study of Women and Aging [26], included both African-American and
Caucasian participants but did not use menstrual calendar diaries. Our study had a larger
sample participating in the menstrual calendar substudy than any of the other recent
cohort studies of midlife women. This larger sample size allowed us to examine adjusted

122
associations. The follow-up time for our menstrual diaries was up to 10.5 years thus
allowing us to observe the full MT in many women and to characterize change in
menstrual cycle characteristics during the MT. Other cohorts have only reported data
from a few years of observation. We also conducted annual measurements of BMI and
FSH levels.
There are some limitations to SWAN that need to be addressed. One major
limitation is that of left-censoring. We did not observe the start of the MT in some
women. The mean age of women eligible for these analyses was 45.7 years. In an
analysis using data from women 35 years and older participating in the TREMIN study,
the median age of onset of the early MT was 41.0 years.[27] Women who did not have
a menstrual cycle in the last 3 months were ineligible to enroll into the cohort study,
therefore women who were near the end of the MT, who experienced surgical
amenorrhea, or who already experienced their FMP were excluded from enrollment. In
the cross-sectional survey, the average age at menopause was 51 years.[28] Since
women were enrolled from age 42-52 years, the likelihood of exclusion increases with
increasing age. Women at older ages who experienced the MT transition at an earlier age
may have had menstrual cycle patterns that differ from the patterns we observed.
Important racial differences with respect to participation were seen. In the population
from which our cohort study was enrolled, African-American women were more likely to
have had a hysterectomy.[28] African-American women were also less likely to have the
start of the MT observed or their FMP observed in this study, while Chinese and Japanese
women were more likely. Since each site recruited one specific ethnic group, we are
unable to fully account for site differences.

123
Another limitation of this research is the use of self-report for the medical
conditions. Therefore, we may have underreporting of diseases. The problem of self-
report is greatest for uterine fibroids. Women are usually diagnosed with fibroids by
ultrasound, and are not diagnosed unless they have a specific complaint. It is estimated
that 50% of women with fibroids are asymptomatic.[29] African-American women are
also more likely to be diagnosed with fibroids than Caucasian women.[30] In our study,
women with diabetes, thyroid condition, or uterine fibroids were less likely to have their
FMP identified. Furthermore, our power to detect associations with diabetes and thyroid
conditions was limited.
Nonetheless, our study strengths outweigh our potential limitations. Although
left-censoring may be a problem, most of our multiethnic participants were followed
throughout the whole MT. Our large sample size has allowed us to identify important
demographic, biological, and lifestyle characteristics that influence menstrual
characteristics during the MT, which has never been done before. This research is the
first to describe the normative patterns of menstrual cycle length, menstrual cycle
variability, menses duration, and heaviness of flow as women progress through the MT.
Future Research
This dissertation provided important insights into the natural histories of change
in the pattern of menstrual cycle characteristics during the MT. While this work has
started to fill the gap in our knowledge about menstrual function during the MT,
important questions remain. We presented data on the average population change in
menstrual cycle length that occurs during the MT. There may be several specific patterns
that make up this overall pattern of change, with different patterns most relevant to
specific population subgroups. A recent article by Gorrindo et al, used menstrual histories

124
of women from the TREMIN Trust to show that five distinct patterns of menstrual cycle
lengths occur throughout the reproductive lifespan.[31] Another recent article using
TREMIN demonstrated six different patterns of menstrual cycle characteristics during
the MT.[32] It would be of interest to see if these patterns occur within the SWAN
population, and if these patterns are associated with certain demographic, behavioral, or
biological characteristic.
A question yet to be addressed is whether menstrual cycle length or patterns of
change in menstrual cycle length are associated with the duration of the MT. Results
from TREMIN suggested that women who have longer menstrual cycle lengths
throughout their reproductive lifespan have a later age at menopause.[33-36] If certain
patterns of menstrual cycle length are associated with later age at menopause, physicians
could use this information to help a woman predict when her final menses is likely to
occur.
Gaps of knowledge still exist with respect to expected patterns of menses duration
and heaviness of flow during the MT. In the Seattle Midlife Women’s Health Study, the
most common menstrual cycle changes first reported were changes in menstrual flow.[3]
Our data suggested that two patterns increased during the early and late MT, longer
lighter menses and heavier menses. Exploring whether specific changes in menstrual flow
are associated with the start of each stage of the transition would add new information to
the STRAW guidelines.
This dissertation did not detect an association of menstrual cycle characteristics
with diabetes. We believe this was due to the limited number of women with this
condition at the start of the MT. In the cross-sectional study, diabetic women were more

125
likely to be post-menopausal or surgically amenorrheic and were excluded from the
study.[28] Women who have diabetes may have a younger age at menopause.[37] A
medical condition which is related to diabetes is polycystic ovarian syndrome (PCOS).
Women with PCOS frequently experience oligomenorrhea and cannot be staged by the
STRAW guidelines.[38-41] There is some evidence to suggest PCOS women have an
older age at menopause [42, 43] and may experience more regular menstrual cycles
during the MT.[44, 45] Menstrual calendar studies need to be conducted in these
populations to elucidate their patterns of menstrual cycle characteristics during the MT.
We found that the questions frequently used to assess MT status by interview do
not adequately discern whether a woman is in the early MT stage or the late MT stage.
Questions in current use were in fact designed to identify women who were close to their
FMP, not to define the timing of onset of these reproductive life stages.[46] New
questions need to be developed to accurately identify the start of the MT.
Given the continued gaps in knowledge, it is necessary to conduct additional
menstrual calendar studies among midlife women. In order to capture women who start
the menopause at an earlier age, we propose enrolling women who are in their late 30’s.
Future studies should be conducted in a multiethnic cohort, with oversampling of women
with diabetes and PCOS. It is also suggested that researchers take advantage of recent
developments with electronic data collection. Currently there are some free electronic
applications for smart phones that keep track of menstrual cycle information. Creating a
similar program for study participants that would allow them to electronically send
information, which may help with study retention and missing data.

126
Clinical Implications
Recent results from the ReSTAGE collaboration have demonstrated the median
duration of the MT after age 40 to be approximately 5 to 8 years.[47] This dissertation
work demonstrated that using currently accepted annual interview questions or annual
FSH levels should not be used to distinguish between early and late MT. To stage the late
MT, asking a woman if she has had a menstrual cycle of at least 60 days or using a
question on skipped periods, similar to the Seattle Women’s Health Study, is suggested.
If it is determined that a woman’s menstrual cycles have increased in variability, this
suggests she has on average 1-3 years before her FMP. Accurately identifying MT stage
has implications for interventions and healthcare. Bone loss is accelerated in the last
couple of years prior to the FMP [48] , as is adverse change in lipid profiles.[49]
Treatment and lifestyle intervention should optimally begin before this time period.
Longer menstrual cycles, more variable menstrual cycles, prolonged menses, and
heavier menses are conditions that define abnormal menstrual bleeding. We demonstrated
that these conditions occur frequently during the MT. Current FIGO guidelines suggest
menses exceeding 8 days to be considered prolonged.[13, 14] Our research found that
menses of 10 or more days occurs frequently during the MT and, therefore, the current
definition does not apply to perimenopausal women. Menses of 15 or more days,
occurring more than once, is a better indicator of prolonged menstrual bleeding among
women undergoing the MT. While less common, menses with at least 3 days of heavy
bleeding occurs more often during the MT. Obese women have longer menstrual cycles,
and are more likely to report heavy bleeding. Common causes for abnormal menstrual
bleeding include polyps, fibroids, malignancies, coagulopathies, and ovulatory
dysfunction.[14] Clinical management of abnormal menstrual bleeding includes

127
nonsteroidal anti-inflammatory drugs, hormone therapy, and hysterectomy.[50] If a cause
for abnormal bleeding is not found, and it is determined a woman is close to her FMP,
then a wait-and see approach may be warranted.
Conclusions
In conclusion, this research was the first to examine patterns of menstrual cycle
characteristics during the MT in a multiethnic cohort using menstrual calendars. We
demonstrated that current SWAN annual interviews or annual FSH levels should not be
used to distinguish between the early and the late MT.
Population increases in menstrual cycle length occur at the upper tail of the
distribution, reflecting a greater propensity for longer menstrual cycles. The greatest
variability in menstrual cycle length is seen in the couple of years prior to FMP. Two
patterns of menses characteristics are seen frequently during the MT, longer-lighter
bleeding or more days of heavy bleeding, implying that the current definitions of
abnormal bleeding may not be relevant to perimenopausal women. Menses of 15 or more
days, occurring more than once, should be used as the definition for prolonged menstrual
bleeding in perimenopausal women.
BMI is associated with menstrual cycle length and heaviness of flow but not
menses duration. Taking body size into account, we found evidence to suggest that ethnic
differences in menstrual cycle characteristics do exist. Chinese and Japanese women have
longer menstrual cycle lengths throughout their reproductive lifespan. During the MT,
Japanese women are more likely to have longer-lighter menses and less likely to
experience heavy bleeding, while African-American women are less likely to report
longer-lighter menses.

128
These results fill in some of the gaps of knowledge with regards to menstruation
during the MT. Continuing research in this area will give clinicians more guidance on
how to accurately stage a woman’s experience of the MT, help her predict her final
menses, and determine whether or not clinical intervention is needed.
129
References
1. Astrup K, Olivarius Nde F, Moller S, Gottschau A, Karlslund W. Menstrual
bleeding patterns in pre- and perimenopausal women: a population-based
prospective diary study. Acta Obstet Gynecol Scand. Feb 2004;83(2):197-202.
2. Johannes CB, Crawford SL, Longcope C, McKinlay SM. Bleeding patterns and
changes in the perimenopause: a longitudinal characterization of menstrual cycles.
Clinical Consultations in Obstetrics and Gyncecology. 1996;8:9-20.
3. Mitchell ES, Woods NF, Mariella A. Three stages of the menopausal transition
from the Seattle Midlife Women's Health Study: toward a more precise definition.
Menopause. Sep-Oct 2000;7(5):334-349.
4. Taffe JR, Dennerstein L. Menstrual patterns leading to the final menstrual period.
Menopause. Jan-Feb 2002;9(1):32-40.
5. Treloar AE. Menstrual cyclicity and the pre-menopause. Maturitas. Dec
1981;3(3-4):249-264.
6. Taffe J, Dennerstein L. Retrospective self-report compared with menstrual diary
data prospectively kept during the menopausal transition. Climacteric. Sep
2000;3(3):183-191.
7. Liu Y, Gold EB, Lasley BL, Johnson WO. Factors affecting menstrual cycle
characteristics. Am J Epidemiol. Jul 15 2004;160(2):131-140.
8. Waller K, Swan SH, Windham GC, Fenster L, Elkin EP, Lasley BL. Use of urine
biomarkers to evaluate menstrual function in healthy premenopausal women. Am
J Epidemiol. Jun 1 1998;147(11):1071-1080.
9. Harlow SD, Matanoski GM. The association between weight, physical activity,
and stress and variation in the length of the menstrual cycle. Am J Epidemiol. Jan
1991;133(1):38-49.
10. Kato I, Toniolo P, Koenig KL, et al. Epidemiologic correlates with menstrual
cycle length in middle aged women. Eur J Epidemiol. Oct 1999;15(9):809-814.
11. Rowland AS, Baird DD, Long S, et al. Influence of medical conditions and
lifestyle factors on the menstrual cycle. Epidemiology. Nov 2002;13(6):668-674.
12. Symons JP, Sowers MF, Harlow SD. Relationship of body composition measures
and menstrual cycle length. Ann Hum Biol. Mar-Apr 1997;24(2):107-116.
13. Fraser IS, Critchley HO, Broder M, Munro MG. The FIGO recommendations on
terminologies and definitions for normal and abnormal uterine bleeding. Semin
Reprod Med. Sep 2011;29(5):383-390.

130
14. Munro MG, Critchley HO, Fraser IS. The FIGO systems for nomenclature and
classification of causes of abnormal uterine bleeding in the reproductive years:
who needs them? Am J Obstet Gynecol. Feb 8 2012.
15. Belsey EM, Pinol AP. Menstrual bleeding patterns in untreated women. Task
Force on Long-Acting Systemic Agents for Fertility Regulation. Contraception.
Feb 1997;55(2):57-65.
16. Shapley M, Jordan K, Croft PR. An epidemiological survey of symptoms of
menstrual loss in the community. Br J Gen Pract. May 2004;54(502):359-363.
17. Harlow SD, Campbell B. Ethnic differences in the duration and amount of
menstrual bleeding during the postmenarcheal period. Am J Epidemiol. Nov 15
1996;144(10):980-988.
18. Sternfeld B, Jacobs MK, Quesenberry CP, Jr., Gold EB, Sowers M. Physical
activity and menstrual cycle characteristics in two prospective cohorts. Am J
Epidemiol. Sep 1 2002;156(5):402-409.
19. Belsey EM, d'Arcangues C, Carlson N. Determinants of menstrual bleeding
patterns among women using natural and hormonal methods of contraception. II.
The influence of individual characteristics. Contraception. Aug 1988;38(2):243-
257.
20. Cooper GS, Klebanoff MA, Promislow J, Brock JW, Longnecker MP.
Polychlorinated biphenyls and menstrual cycle characteristics. Epidemiology. Mar
2005;16(2):191-200.
21. Cooper GS, Sandler DP, Whelan EA, Smith KR. Association of physical and
behavioral characteristics with menstrual cycle patterns in women age 29-31
years. Epidemiology. Nov 1996;7(6):624-628.
22. Harlow SD, Campbell BC. Host factors that influence the duration of menstrual
bleeding. Epidemiology. May 1994;5(3):352-355.
23. Lin HT, Lin LC, Shiao JS. The impact of self-perceived job stress on menstrual
patterns among Taiwanese nurses. Ind Health. Oct 2007;45(5):709-714.
24. Van Voorhis BJ, Santoro N, Harlow S, Crawford SL, Randolph J. The
relationship of bleeding patterns to daily reproductive hormones in women
approaching menopause. Obstet Gynecol. Jul 2008;112(1):101-108.
25. Stewart EA. Uterine fibroids. Lancet. Jan 27 2001;357(9252):293-298.
26. Sammel MD, Freeman EW, Liu Z, Lin H, Guo W. Factors that influence entry
into stages of the menopausal transition. Menopause. Nov-Dec 2009;16(6):1218-
1227.

131
27. Harlow SD, Mitchell ES, Crawford S, Nan B, Little R, Taffe J. The ReSTAGE
Collaboration: defining optimal bleeding criteria for onset of early menopausal
transition. Fertil Steril. Jan 2008;89(1):129-140.
28. Gold EB, Bromberger J, Crawford S, et al. Factors associated with age at natural
menopause in a multiethnic sample of midlife women. Am J Epidemiol. May 1
2001;153(9):865-874.
29. Gupta S, Jose J, Manyonda I. Clinical presentation of fibroids. Best Pract Res
Clin Obstet Gynaecol. Aug 2008;22(4):615-626.
30. Ryan GL, Syrop CH, Van Voorhis BJ. Role, epidemiology, and natural history of
benign uterine mass lesions. Clin Obstet Gynecol. Jun 2005;48(2):312-324.
31. Gorrindo T, Lu Y, Pincus S, et al. Lifelong menstrual histories are typically
erratic and trending: a taxonomy. Menopause. Jan-Feb 2007;14(1):74-88.
32. Huang X, Harlow SD, Elliott MR. Distinguishing 6 population subgroups by
timing and characteristics of the menopausal transition. Am J Epidemiol. Jan 1
2012;175(1):74-83.
33. Kaczmarek M. The timing of natural menopause in Poland and associated factors.
Maturitas. Jun 20 2007;57(2):139-153.
34. Lisabeth L, Harlow S, Qaqish B. A new statistical approach demonstrated
menstrual patterns during the menopausal transition did not vary by age at
menopause. J Clin Epidemiol. May 2004;57(5):484-496.
35. Whelan EA, Sandler DP, McConnaughey DR, Weinberg CR. Menstrual and
reproductive characteristics and age at natural menopause. Am J Epidemiol. Apr
1990;131(4):625-632.
36. den Tonkelaar I, te Velde ER, Looman CW. Menstrual cycle length preceding
menopause in relation to age at menopause. Maturitas. Jun 3 1998;29(2):115-123.
37. Dorman JS, Steenkiste AR, Foley TP, et al. Menopause in type 1 diabetic women:
is it premature? Diabetes. Aug 2001;50(8):1857-1862.
38. Harlow SD, Gass M, Hall JE, et al. Executive Summary of the Stages of
Reproductive Aging Workshop + 10: Addressing the Unfinished Agenda of
Staging Reproductive Aging. J Clin Endocrinol Metab. Feb 16 2012.
39. Harlow SD, Gass M, Hall JE, et al. Executive summary of the Stages of
Reproductive Aging Workshop + 10: addressing the unfinished agenda of staging
reproductive aging. Menopause. Feb 15 2012.
132
40. Harlow SD, Gass M, Hall JE, et al. Executive summary of the Stages of
Reproductive Aging Workshop + 10: addressing the unfinished agenda of staging
reproductive aging. Fertil Steril. Feb 14 2012.
41. Harlow SD, Gass M, Hall JE, et al. Executive summary of the Stages of
Reproductive Aging Workshop +10: addressing the unfinished agenda of staging
reproductive aging. Climacteric. Feb 16 2012.
42. Dahlgren E, Johansson S, Lindstedt G, et al. Women with polycystic ovary
syndrome wedge resected in 1956 to 1965: a long-term follow-up focusing on
natural history and circulating hormones. Fertil Steril. Mar 1992;57(3):505-513.
43. Mulders AG, Laven JS, Eijkemans MJ, de Jong FH, Themmen AP, Fauser BC.
Changes in anti-Mullerian hormone serum concentrations over time suggest
delayed ovarian ageing in normogonadotrophic anovulatory infertility. Hum
Reprod. Sep 2004;19(9):2036-2042.
44. Elting MW, Korsen TJ, Rekers-Mombarg LT, Schoemaker J. Women with
polycystic ovary syndrome gain regular menstrual cycles when ageing. Hum
Reprod. Jan 2000;15(1):24-28.
45. Elting MW, Kwee J, Korsen TJ, Rekers-Mombarg LT, Schoemaker J. Aging
women with polycystic ovary syndrome who achieve regular menstrual cycles
have a smaller follicle cohort than those who continue to have irregular cycles.
Fertil Steril. May 2003;79(5):1154-1160.
46. Brambilla DJ, McKinlay SM, Johannes CB. Defining the perimenopause for
application in epidemiologic investigations. Am J Epidemiol. Dec 15
1994;140(12):1091-1095.
47. Harlow SD, Paramsothy P. Menstruation and the menopausal transition. Obstet
Gynecol Clin North Am. Sep 2011;38(3):595-607.
48. Lo JC, Burnett-Bowie SA, Finkelstein JS. Bone and the perimenopause. Obstet
Gynecol Clin North Am. Sep 2011;38(3):503-517.
49. Matthews KA, Crawford SL, Chae CU, et al. Are changes in cardiovascular
disease risk factors in midlife women due to chronological aging or to the
menopausal transition? J Am Coll Cardiol. Dec 15 2009;54(25):2366-2373.
50. Jain A, Santoro N. Endocrine mechanisms and management for abnormal
bleeding due to perimenopausal changes. Clin Obstet Gynecol. Jun
2005;48(2):295-311.

133
APPENDICIES
Appendix A
Table A1. Menopausal Transition (MT) Stage by Menstrual Calendar Compared to
MT Stage by Annual Interview among all eligible women
Early MT Stage1
n=844
Late MT Stage
≥ 90 days
n=1339
Late MT Stage
≥ 60days
n=1339
n % n % n %
No Interview status 78 9.2 204 15.2 376 28.1
3+ visits before Interview (-3) 67 7.9 25 1.9 88 6.6
2 visits before Interview (-2) 65 7.7 43 3.2 116 8.7
1 Visit before Interview (-1) 69 8.2 149 11.1 131 9.8
Markers at Same Time (0) 296 35.1 96 7.2 45 3.4
1 visit after Interview (+1) 54 6.4 11 0.8 4 0.3
2 visits after Interview (+2) 26 3.1 0 0.0 0 0.0
3+ visits after Interview (+3) 24 2.8 1 0.1 2 0.2
No Calendar Marker 86 10.2 99 7.4 38 2.8
Neither Marker nor Status 79 9.4 711 53.1 539 40.3
Kappa (95% Confidence
Interval)
-0.18 (-0.24, -0.11) 0.06 (0.01, 0.10) -0.01 (-0.03, 0.01)
1Note for comparison of early bleeding marker to early menopause status, women who determined to be in
early menopause by baseline interview were excluded.
If early transition bleeding marker occurred at same time or after the late transition bleeding marker than
then early transition bleeding marker set to missing.

134
Table A2. Transition Bleeding Markers from Menstrual Calendars Compared to
Menopausal Status by Annual Interview among Eligible Women
.
Early MT Stage1
n=672
Late MT Stage of
≥ 90 days2
n=1138
Late MT Stage of
≥ 60days2
n=1138
n % n % n %
No FSH Level 193 28.7 40 3.5 91 8.0
3 visits before FSH (-3) 45 6.7 9 0.8 28 2.5
2 visits before FSH (-2) 19 2.8 12 1.1 36 3.2
1 Visit before FSH (-1) 71 10.6 40 3.5 101 8.9
Markers at Same Time (0) 123 18.3 101 8.9 131 11.5
1 visit after FSH (+1) 42 6.3 84 7.4 97 8.5
2 visits after FSH (+2) 22 3.3 47 4.1 60 5.3
3 visits after FSH (+3) 23 3.4 86 7.6 67 5.9
No Calendar Marker 52 7.7 316 27.8 175 15.4
Neither Marker nor FSH Level 82 12.2 403 35.4 352 30.9
Kappa and 95%Confidence
Interval
-0.29 (-0.36,-0.23) -0.04 (-0.08, 0.01) -0.18 (-0.23,-0.12)
1For comparison of early bleeding marker to early FSH status, women who determined to have an FSH
level at baseline of 15.0 IU/liter or greater were excluded.
If early transition bleeding marker occurred at same time or after the late transition bleeding marker then
early transition bleeding marker set to missing. 2 For comparisons of late bleeding markers to late FSH status, women who determined to have an FSH
level at baseline of 30.0 IU/liter or greater were excluded.

135
Appendix B
Figure B1. Estimated Cycle Length By Time Since the Start of Transition from Univariate Quantile Regressions for Four Percentiles:
25th
, 50th
, 75th
and 90th
. Natural spline of time since the start of transition contained 5 knots at 2, 3, 4, 5, and 6 years. Figure not adjusted for any
other covariates.
0 2 4 6 8
20
30
40
50
60
70
Time Since Start of Transition (Years)
Estim
ate
d C
ycle
Le
ng
th(D
ays)
25th Percentile
50th Percentile
75th Percentile
90th Percentile
25th Percentile
50th Percentile
75th Percentile
90th Percentile
25th Percentile
50th Percentile
75th Percentile
90th Percentile
25th Percentile
50th Percentile
75th Percentile
90th Percentile

136
Table B1. Unadjusted Menstrual Cycle Length Differences in Days Among Women Since Start of the Menopausal Transition, by
Percentile
Percentile 25th 50th
Median 75th 90th
Effect β 95% CI β 95% CI β 95% CI β 95% CI
Above Median Age at Transition
(46.25 years) 0.00 (-0.92,0.92) 0.00 (-0.69,0.69) 2.00 (0.70, 3.30) 10.00 (7.60, 12.40)
Race/Ethnicity
African-American 1.00 (-0.11, 2.11) 0.00 (-1.19, 1.19) 2.00 (0.14, 3.86) 2.00 (-1.02, 5.02)
Chinese 1.00 (-0.12, 2.12) 0.00 (-1.20, 1.20) 2.00 (0.56, 3.44) 6.00 (3.12, 8.88)
Japanese 1.00 (0.28, 1.72) 0.00 (-0.87, 0.87) 1.00 (-0.33, 2.33) 4.00 (0.39, 7.61)
Caucasian Ref - Ref - Ref - Ref -
Body Mass Index, kg/m2
Normal weight (≤24.9) Ref - Ref - Ref - Ref -
Overweight (25.0-29.9) 1.00 (-0.25, 2.25) 0.00 (-0.74, 74) 1.00 (-0.23, 2.23) 2.00 (-0.97, 4.97)
Obese (≥ 30) 1.00 (-0.27, 2.28) 1.00 (-0.22, 2.22) 2.00 (0.66, 3.34) 2.00 (-1.29, 5.29)
Current Smoker 0.00 (-1.00, 1.00) 0.00 (-0.29, 0.29) 1.00 (-1.05, 3.05) 0.00 (-3.22, 3.22)
High School Graduate or Less
Education 0.00 (-0.90, 90) 0.00 (-0.59,0.59) 3.00 (1.25, 4.75) 3.00 (0.22, 5.77)
Every hour of moderate or
vigorous physical activity per week 0.00 (-0.10, 0.10) 0.00 (-0.01, 0.01) 0.00 (-0.20, 0.20) 0.67 (0.02, 1.31)
Diabetes 1.00 (-0.01, 2.01) 1.00 (0.24, 1.76) 2.00 (0.04, 4.00) 3.00 (-1.27, 7.27)
Fibroids -1.00 (-1.80, -0.20) 0.00 (-0.69,0.69) -1.00 (-2.25, 0.26) -1.00 (-3.83, 1.83)
Thyroid Condition -1.00 (-1.95, -0.05) 0.00 (-0.70, 0.70) -1.00 (-2.52, 0.52) 1.00 (-3.31, 5.31)
Past Hormone Use -1.00 (-2.11, 0.11) 0 (-0.59, 0.59) 2.00 (-0.13, 4.13) 8.00 (3.06, 12.94)
All associations are not adjusted for any other factors listed or time since the start of the transition.
Each model contains 37,288 observations from 963 women.
Numbers in bold are significant

137
Figure B2. Estimated cycle length by time until FMP from univariate quantile regressions for four percentiles: 25th
, 50th
, 75th
and 90th
.
Natural spline of time until FMP contained 5 knots at -5, -4,-3,-2, and -1 years. FMP is at time 0. Figure not adjusted for any other
covariates.
-8 -6 -4 -2 0
20
40
60
80
10
01
20
14
0
Time Until FMP (Years)
Estim
ate
d C
urv
e (
Da
ys)
25th Percentile
50th Percentile
75th Percentile
90th Percentile
25th Percentile
50th Percentile
75th Percentile
90th Percentile
25th Percentile
50th Percentile
75th Percentile
90th Percentile
25th Percentile
50th Percentile
75th Percentile
90th Percentile

138
Table B2. Unadjusted Menstrual Cycle Length Differences in Days Among Women until the FMP, by Percentile
Percentile 25th 50th
Median 75th 90th
Effect β 95% CI β 95% CI β 95% CI β 95% CI
Above Median Age at FMP
(46.25 years)
Race/Ethnicity
African-American 0.00 (-1.76, 1.76) 3.00 (1.19, 4.81) 5.00 (2.54, 7.46) 5.00 (-1.27, 22.27)
Chinese 1.00 (-0.27, 2.27) 1.00 (-0.04, 2.04) 2.00 (-0.77, 4.77) 7.00 (1.34, 12.66)
Japanese 0.00 (-1.76, 1.76) 1.00 (-0.02, 2.02) 2.00 (-0.02, 4.02) 6.00 (0.15, 11.85)
Caucasian Ref - Ref - Ref - Ref -
Body Mass Index, kg/m2
Normal weight (≤24.9) Ref - Ref - Ref - Ref -
Overweight (25.0-29.9) 0.00 (-1.00, 1.00) 0.00 (-1.02, 1.02) 2.00 (-0.41, 4.41) 5.00 (-0.60, 10.60)
Obese (≥ 30) 0.00 (-1.03, 1.03) 0.00 (-1.20, 1.20) 2.00 (-0.22, 4.22) 3.00 (-2.75, 8.75)
Current Smoker 0.00 (-0.99, 0.99) 0.00 (-0.64, 0.64) 0.00 (-2.59, 2.59) -3.00 (-9.70, 3.70)
High School Graduate or Less
Education 0.00 (-0.95,0. 95) 0.00 (-0.23, 0.23) 0.00 (-2.00, 2.00) 0.00 (-5.54, 5.54)
Every hour of moderate or
vigorous physical activity per week 0.00 (-0.04, 0.04) 0.00 (-0.01, 0.01) 0.86 (0.42, 1.29) 3.33 (1.96, 4.71)
Diabetes 1.00 (-0.23, 2.23) 1.00 (-0.14, 2.14) 4.00 (-1.34, 9.34) 9.00 (-4.89, 22.89)
Fibroids 0.00 (-1.04, 1.04) 0.00 (-0.46, 0.46) 1.00 (-1.32, 3.32) 3.00 (-2.82, 8.83)
Thyroid Condition 0.00 (-0.88, 0.88) 0.00 (-0.74, 0.74) 0.00 (-2.38, 2.38) 5.00 (-2.65, 12.65)
Past Hormone Use -1.00 (-2.55, 0.55) 0.00 (-1.15, 1.15) 4.00 (0.71, 7.29) 8.00 (1.97, 14.03)
All associations are not adjusted for any other factors listed or time until the FMP.
Each model contains 18,305 observations from 431 women.
Numbers in bold are significant