Patterns and determinants of effective coverage of routine ...
30
Patterns and determinants of effective coverage of routine maternal and newborn health visits in Nepal: Analysis of the 2016 Demographic and Health Survey Resham Khatri ( [email protected] ) Health Social Science and Development Research Institute Jo Durham Queensland University of Technology Rajendra Karkee BP Koirala Institute of Health Sciences Yibeltal Assefa University of Queensland Research Article Keywords: Effective coverage, health facility, maternal and newborn health, determinants, Nepal Posted Date: June 4th, 2021 DOI: https://doi.org/10.21203/rs.3.rs-347305/v1 License: This work is licensed under a Creative Commons Attribution 4.0 International License. Read Full License
Transcript of Patterns and determinants of effective coverage of routine ...
Patterns and determinants of effective coverage ofroutine maternal and newborn health visits in Nepal:Analysis of the 2016 Demographic and HealthSurveyResham Khatri ( [email protected] )
Health Social Science and Development Research InstituteJo Durham
Queensland University of TechnologyRajendra Karkee
BP Koirala Institute of Health SciencesYibeltal Assefa
University of Queensland
Research Article
Keywords: Effective coverage, health facility, maternal and newborn health, determinants, Nepal
Posted Date: June 4th, 2021
DOI: https://doi.org/10.21203/rs.3.rs-347305/v1
License: This work is licensed under a Creative Commons Attribution 4.0 International License. Read Full License

1
Patterns and determinants of effective coverage of routine maternal and 1
newborn health visits in Nepal: Analysis of the 2016 Demographic and Health 2
Survey 3
4
Resham B Khatri1, 2*, Jo Durham1, 3, Rajendra Karkee4, Yibeltal Assefa1 5
6
1 School of Public Health, Faculty of Medicine, University of Queensland, Brisbane, 7
Australia. 8
2 Health Social Science and Development Research Institute, Kathmandu, Nepal. 9
3 School of Public Health and Social Work, Queensland University of Technology, 10
Brisbane, Australia. 11
4 School of Public Health and Community Medicine, BP Koirala Institute of Health 12
Sciences, Dharan, Nepal. 13
14
*Corresponding author (E-mail): [email protected] 15
16
Word Count: (excluding title page, abstract, end materials, figure legends, 17
references) 18
DISCLAIMER: Views presented in this article are solely those of the authors, and do 19
not represent the views, interests, or funded work of the organisations where authors 20
affiliated. 21
22
23
24
25
26
27
28
29
30
31
32
2
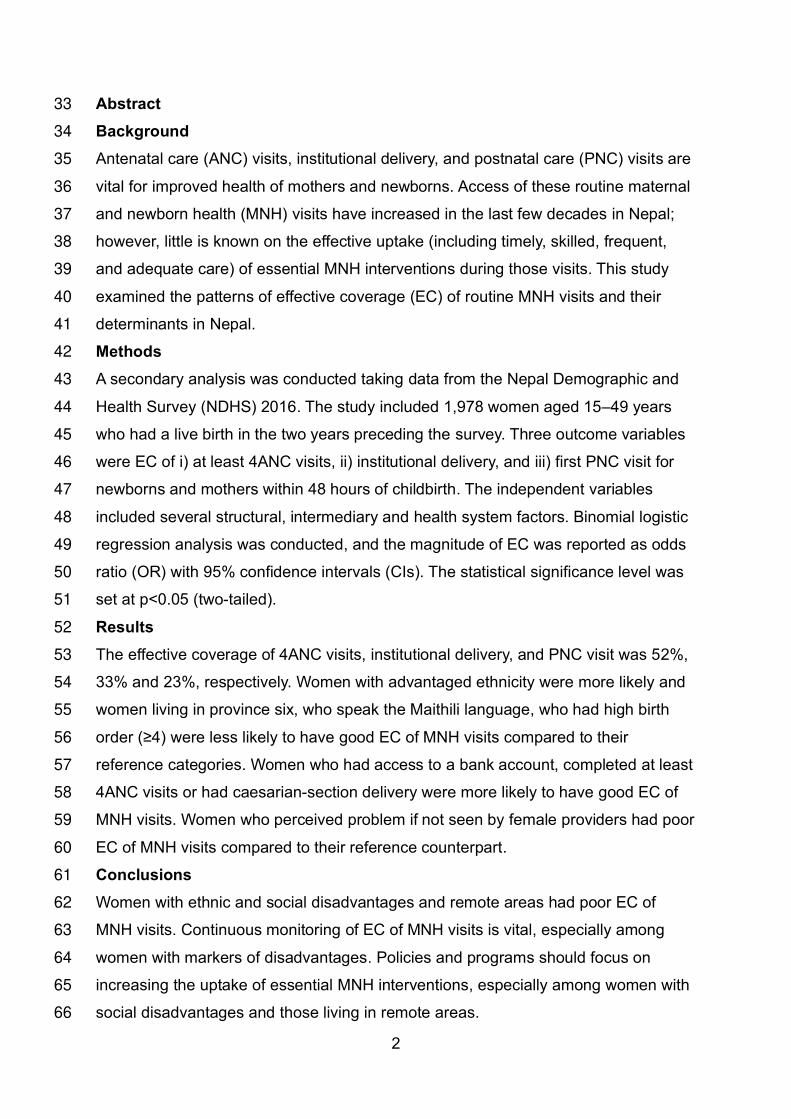
Abstract 33
Background 34
Antenatal care (ANC) visits, institutional delivery, and postnatal care (PNC) visits are 35
vital for improved health of mothers and newborns. Access of these routine maternal 36
and newborn health (MNH) visits have increased in the last few decades in Nepal; 37
however, little is known on the effective uptake (including timely, skilled, frequent, 38
and adequate care) of essential MNH interventions during those visits. This study 39
examined the patterns of effective coverage (EC) of routine MNH visits and their 40
determinants in Nepal. 41
Methods 42
A secondary analysis was conducted taking data from the Nepal Demographic and 43
Health Survey (NDHS) 2016. The study included 1,978 women aged 15–49 years 44
who had a live birth in the two years preceding the survey. Three outcome variables 45
were EC of i) at least 4ANC visits, ii) institutional delivery, and iii) first PNC visit for 46
newborns and mothers within 48 hours of childbirth. The independent variables 47
included several structural, intermediary and health system factors. Binomial logistic 48
regression analysis was conducted, and the magnitude of EC was reported as odds 49
ratio (OR) with 95% confidence intervals (CIs). The statistical significance level was 50
set at p<0.05 (two-tailed). 51
Results 52
The effective coverage of 4ANC visits, institutional delivery, and PNC visit was 52%, 53
33% and 23%, respectively. Women with advantaged ethnicity were more likely and 54
women living in province six, who speak the Maithili language, who had high birth 55
order (≥4) were less likely to have good EC of MNH visits compared to their 56
reference categories. Women who had access to a bank account, completed at least 57
4ANC visits or had caesarian-section delivery were more likely to have good EC of 58
MNH visits. Women who perceived problem if not seen by female providers had poor 59
EC of MNH visits compared to their reference counterpart. 60
Conclusions 61
Women with ethnic and social disadvantages and remote areas had poor EC of 62
MNH visits. Continuous monitoring of EC of MNH visits is vital, especially among 63
women with markers of disadvantages. Policies and programs should focus on 64
increasing the uptake of essential MNH interventions, especially among women with 65
social disadvantages and those living in remote areas. 66

3
67
Keywords: Effective coverage, health facility, maternal and newborn health, 68
determinants, Nepal 69
Introduction 70
Globally, maternal and neonatal mortality have declined over the last few decades; 71
however, most of these deaths are concentrated in the low- and lower-middle-72
income (LMICs) countries within Sub-Saharan Africa and South and South-East Asia 73
[1]. Most maternal and newborn deaths can be prevented by improved access to and 74
quality of essential antenatal, intrapartum, and postnatal interventions. According to 75
the World Health Organization (WHO), every pregnant woman (and newborn) should 76
receive these essential interventions [2, 3]. During pregnancy, women should receive 77
at least four antenatal care (ANC) visits encompassing antenatal interventions (e.g., 78
iron supplementation, tetanus toxoid immunisation) and be screened for high-risk 79
pregnancy [4]. Intrapartum interventions include childbirth assisted by skilled birth 80
attendants; women and newborn should receive intrapartum and immediate newborn 81
care interventions [5]. Postnatal interventions cover the examination of mother and 82
their babies for any infections, advice for hygiene and sanitation, advice for nutrition 83
and family planning during the first week of childbirth [6]. Every woman (and 84
newborns) should complete at least three postnatal care (PNC) visits within the first 85
week of childbirth [7]. The composite coverage of those technical interventions and 86
procedures can be described as the effective coverage (EC) of health services [8]. 87
The EC of health services account for multiple dimensions of quality of health care, 88
including frequency and adequacy of services provided by skilled health workers [9], 89
and service uptakes (of essential interventions) at HFs [3, 10]. 90
Despite increased access to routine maternal and newborn (MNH) visits in many 91
LMICs [11, 12], the reduction of the Maternal Mortality Ratio (MMR) and the 92
Neonatal Mortality Rate (NMR) is slow [13]. Poor uptake of essential interventions 93
during routine MNH visits have contributed to the stagnant or slow rate of reduction 94
of NMR and MMR [3]. Only reaching at HFs, however, does not guarantee that 95
women receive all the recommended interventions [14]. Programs and research 96
need to also examine the actual receipt of essential MNH interventions and patterns 97
and determinants of EC of health services including MNH services [15, 16]. 98
4
Measuring EC requires information about what happens at HF after visits, and can 99
provide insights into the quality of health services [17, 18]. Estimation of EC 100
incorporates the population in need of health services, the proportion of HFs contact 101
for services, and the composite coverage of uptake of essential MNH interventions at 102
the HFs and reflects the performance of health systems [2, 19]. The EC of health 103
services, therefore, provides a proxy measure of the quality of health services [20, 104
21] and is being given a high priority in policies and programs, especially in 105
reproductive, maternal and child health programs [8, 22, 23]. 106
Nepal has a high MMR (259 per 100,000 live births) and NMR (21 per 1000 live 107
births) within South Asia [24]. Further, while significant progress has been made, the 108
rate of reduction has slowed substantially compared to the rates of increases in MNH 109
visits over the past two decades in Nepal. For instance, from 2006 to 2016, 110
institutional delivery increased from 18% to 59%, while MMR decreased from 281 to 111
259 in the same period [25]. Evidence suggests that high death rates among 112
disadvantaged groups who usually have low coverage of routine MNH visits [25]. 113
The slow progress in women and newborns' survival can be explained by either 114
disadvantaged women having poor access to recommended MNH interventions or 115
the health system is inefficient in providing essential MNH interventions. 116
In the current health policy document, Nepal has prioritised quality of care as the 117
health system's overarching principle, within the Nepal health sector strategy (NHSS) 118
(2015-2020) [26], the national health policy 2019 [27] and the Nepal Safe 119
Motherhood and Newborn Health Roadmap 2030 [28] emphasizing the universal 120
quality of health services for achieving Sustainable Development Goal 3(SDG3), 121
including MNH services [29]. The current system, however, lacks a healthcare quality 122
monitoring mechanism. Neither the routine health information system such as health 123
management information system (HMIS) [30] nor do any strategic documents 124
describe the measurement of EC of health services, including for MNH [31, 32]. 125
While studies have examined contact coverage of routine MNH visits [33, 34] and 126
perceived quality of care [35, 36], little is known evidence is published in the EC of 127
routine MNH visits [37]. This study examined about the patterns and determinants of 128
EC of routine MNH visits. This study begins to address this gap findings and may 129
inform programs and policies to target women groups with a high burden of maternal 130
5
and newborn mortalities but with poor access to quality MNH services in Nepal and 131
similar settings. 132
Methods 133
Data sources and sampling design 134
The NDHS 2016 data were used for this study, extracted data of individual women 135
record from the NDHS. The NDHS 2016 is a nationally representative cross-136
sectional survey conducted to assess the health services performance, especially 137
health status of reproductive, newborn, child health and nutrition [25]. 138
A more detailed sampling method is described in the NDHS 2016 report [25]. In brief, 139
the NDHS 2016 identified rural and urban sampling strata from seven provinces 140
producing 14 strata. The survey adopted a two-stage sampling design. The first 141
stage involved a systematic selection of 383 clusters with probability proportional to 142
size from urban and rural strata. The second stage consisted of selecting 30 143
households per cluster through a systematic sampling from a selected household. Of 144
selected 11,203 households but 11,040 responded to the survey. From those 145
households, of 13,089 women age 15-49 years identified for interviews, 12,862 146
responded (response rate of 98%). Among them, 3,998 women had a live birth five 147
years preceding the survey. This study included 1,978 women aged 15–49 years 148
who had a live birth in the two years preceding the survey as this sample included 149
information on pregnancy, childbirth, and postnatal care interventions. 150
Conceptual framework of the study 151
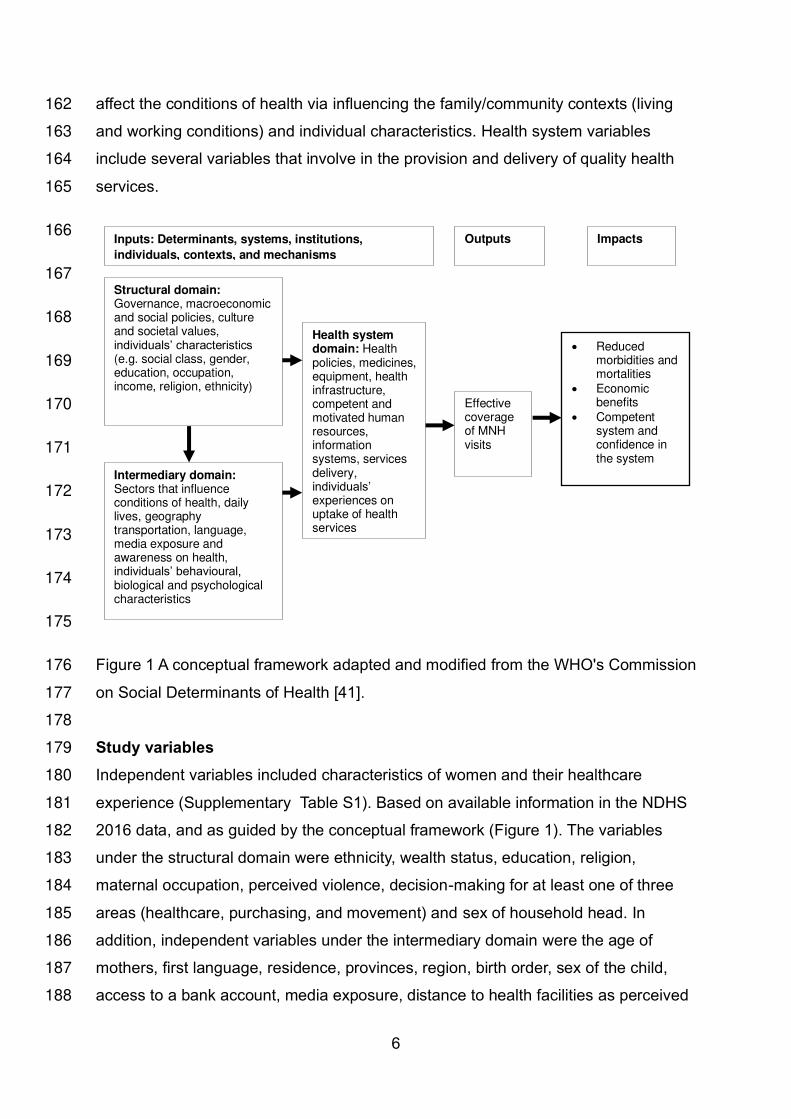
Based on the review of previous conceptual frameworks [38-40], a conceptual 152
framework was developed for this study (Figure 1). This conceptual framework 153
comprises inputs that include several determinants, their contexts and mechanisms 154
at system, institutional and individual level. These contexts and mechanisms can 155
produce the output of effective uptake of MNH interventions. Improved output as EC 156
of MNH visits may lead to the survival of mothers and newborns, economic benefit, 157
and confidence in the system. Inputs are broadly categorised into three domains: 158
structural, intermediary, and health system. Structural factors cover all basic factors 159
(e.g., wealth status, ethnicity, gender) that can influence the intermediary and health 160
system factors. Intermediary factors are non-health sector factors, which generally 161
6
affect the conditions of health via influencing the family/community contexts (living 162
and working conditions) and individual characteristics. Health system variables 163
include several variables that involve in the provision and delivery of quality health 164
services. 165
166
167
168
169
170
171
172
173
174
175
Figure 1 A conceptual framework adapted and modified from the WHO's Commission 176
on Social Determinants of Health [41]. 177
178
Study variables 179
Independent variables included characteristics of women and their healthcare 180
experience (Supplementary Table S1). Based on available information in the NDHS 181
2016 data, and as guided by the conceptual framework (Figure 1). The variables 182
under the structural domain were ethnicity, wealth status, education, religion, 183
maternal occupation, perceived violence, decision-making for at least one of three 184
areas (healthcare, purchasing, and movement) and sex of household head. In 185
addition, independent variables under the intermediary domain were the age of 186
mothers, first language, residence, provinces, region, birth order, sex of the child, 187
access to a bank account, media exposure, distance to health facilities as perceived 188
Effective coverage of MNH visits
Impacts Outputs Inputs: Determinants, systems, institutions,
individuals, contexts, and mechanisms
• Reduced morbidities and mortalities
• Economic benefits
• Competent system and confidence in the system
Structural domain: Governance, macroeconomic and social policies, culture and societal values, individuals’ characteristics (e.g. social class, gender, education, occupation, income, religion, ethnicity)
Intermediary domain: Sectors that influence conditions of health, daily lives, geography transportation, language, media exposure and awareness on health, individuals’ behavioural, biological and psychological characteristics
Health system domain: Health policies, medicines, equipment, health infrastructure, competent and motivated human resources, information systems, services delivery, individuals’ experiences on uptake of health services

7
problem, and intended birth of the last child. Health system factors included the 189
(perceived) problem of not having female healthcare providers, awareness of health 190
mothers' groups, mode of delivery, and EC of 4ANC visits, and EC of institutional 191
delivery. 192
Taking reference from past studies [33, 34, 42, 43], ethnicity, education, wealth 193
status were further defined for this study. The Government of Nepal has categorised 194
123 ethnicities into six broader categories: i) Dalits (untouchable), ii) disadvantaged 195
indigenous, iii) disadvantaged non-Dalit Terai caste groups, iv) religious minorities 196
(Muslims), v) relatively advantaged indigenous, and vi) upper-caste groups. These 197
broader ethnic groups were merged into two groups according to their comparative 198
privileges: disadvantaged ethnicities (includes Dalit, Muslims, and non-Dalit Terai 199
caste, disadvantaged Janajatis) and advantaged ethnicities (includes Brahmin or 200
Chhetri, advantaged Janajatis). Maternal education was categorised as illiterate 201
(who cannot read and write), and primary (who can read and write and up to grate 202
8), and secondary and higher (who have grade 8 and higher-level education). In the 203
NDHS 2016, wealth quintiles were constructed using principal component analysis 204
(PCA) based on more than 40-asset items being owned by households. The lowest 205
two quintiles were merged as lower wealth status (lower 40%), and the upper three 206
quintiles were combined as upper wealth status (upper 60%) (Table 1). 207
Three outcome variables with binary categories, collectively called routine MNH 208
visits included in this study, were i) EC of 4ANC visit; ii) EC of institutional delivery; 209
iii) EC of PNC visit. For each MNH visit if score >0 and ≤0.8=0 (poor coverage); and 210
if score >0.8=1 (good coverage). The binary outcomes of each variable were coded 211
as: 4ANC visits: 1= good coverage; 0=poor coverage; Institutional delivery: 1=good 212
coverage; 0=poor coverage; PNC visit: 1= good coverage; 0=poor coverage. 213
214
Measurement of EC of routine MNH visits 215
Based on the information available in NDHS 2016, EC scores were calculated for 216
those women who attended the health facilities for routine MNH visits. For EC of any 217
MNH visit, women should receive sets of interventions by skilled providers, timely, 218
adequate and appropriate content of care at the pregnancy [5], childbirth [44] and the 219
postnatal period [45]. We identified selected MNH interventions (4ANC:16 items; 220
8
institutional delivery: 8 items; and PNC visits for mothers and newborns: 11 items) 221
(Supplementary Table S2). Then we calculated the EC score of 4ANC visits, 222
institutional delivery, and PNC visits. Scores (>0 to 1) were calculated for each MNH 223
visit; if women received ten interventions in ANC visits, then the coverage score 224
would be 0.625 (=10/16) [23]. For women who completed 4ANC visits, delivered at a 225
health institution, or made a PNC visit, the coverage score would be >0 to 1 of each 226
MNH visit [2]. Based on these woman-specific coverage scores of each MNH visit, 227
population-level EC was calculated using formula EC=Q×U|N [46]. In this formula, 228
EC refers to effective coverage of MNH visit at the national level, Q relates to the 229
average quality score of all interventions of particular MNH visit (e.g.4ANC visits), 230
and U refers to the utilisation of MNH visit (the contact coverage of the MNH visit), 231
and N is the number of population of need [2, 23]. 232
233
For the regression analysis to identify determinants of EC of MNH visits, coverage 234
scores were dichotomised, taking woman-specific score (of respective MNH visit). 235
Although there are no gold standards of cut-off points for categorisation of poor or 236
good effective coverage, this study took reference cut-off point of 0.80 to a previous 237
study undertaken in Kenya [47] and Nepal [48]. Then scores were dichotomised into 238
poor EC (if scores >0 and ≤0.8) and good EC (if scores >0.8) to identify the 239
determinants of good EC of MNH visits. For each MNH visit, EC scores were 240
dichotomised into poor EC (if score >0 and ≤0.8) and good EC (if score >0.8), that is 241
i) EC of 4ANC visits, ii) EC of institutional delivery, and iii) EC of at least one PNC 242
visit for mothers and newborns within 48 hours of childbirth. 243
244
Statistical analyses 245
All the analyses are adjusted for sampling weights available in the dataset to account 246
for two-stage cluster sampling used in the NDHS 2016 survey (primary sampling 247
unit=383; stratification (seven provinces with rural/urban dichotomy; strata=14); 248
survey weights (probability weight =sample weight/1,000,000) [25]. Thus, results are 249
representative at the national as well as strata levels. Statistical significance level 250
was set p<0.05 (two-tailed) to identify the determinants associated with the outcome 251
variable. All reported estimates were weighted (unless otherwise indicated). 252
Binomial logistic regression analyses were conducted to identify determinants of EC 253

9
of MNH visits. Three independent multivariable logistic regression analyses were 254
conducted for each outcome variable, for example, Model I for EC of 4ANC visits; 255
Model II for EC of institutional delivery; Model III for EC of the first PNC visit for 256
mothers and newborns within 48 hours of childbirth. The extent of inequities was 257
reported in terms of odds ratios (OR) with 95% confidence intervals (CIs). Before 258
running final regression model, multicollinearity was checked: excluded independent 259
variables having variation inflation factors (VIF) ≥3 in the multivariable regression 260
analyses [49]. Backward elimination multivariable logistic regression analyses were 261
conducted [50]. For which, firstly, a full multivariable regression model was run, and 262
then estimated p-values for each independent variable and the insignificant variable 263
were identified. This procedure was repeated until no insignificant independent 264
variable was left at p<0.2 [51]. The adjusted odds ratios (aOR) with 95% CIs for all 265
independent variables retaining p<0.05 were reported. The goodness of fit tests was 266
conducted using the Hosmer Lemeshow test (non-significant results (p>0.05) 267
indicated an adequate fit) [52]. All analyses were conducted using the survey 268
command function and considering the clustering effect in Stata 14.0 (Stata Corp, 269
2015). 270
Results 271
Descriptive characteristics of women 272
Table 1 shows the background characteristics of the women included in the analysis. 273
Among 1,978 women, 42% were from households in the lowest two wealth quintiles. 274
More than two-thirds (69%) of women were from disadvantaged ethnic groups, 275
mostly Madhesi, Janajatis and Dalits. Nearly two in five women (42%) were native 276
Nepali speakers (the national language). Male household head characterised more 277
than two-thirds (73%) of the households. More than half (55%) of women were from 278
the Terai (Plain) Region. One in four women (26%) were from province two, whereas 279
one in twenty women (6%) were from province six. About half (46%) of women were 280
from urban areas. Two-thirds (67%) of women had no decision-making authority (or 281
empowerment) in relation to access in health-seeking, buying something (financial 282
empowerment) or meeting with relatives (movement authority). Nearly one-third 283
(29%) of women reported any kind of perceived violence (e.g., beating when food 284
burnt or beating if women went out without asking husband). In total, four in five 285
(79.7%) women were aged 20–34 years, and approximately 69% of women did not 286
10
have a bank account. Three in five women perceived distance to a health facility was 287
a challenge when accessing health services. Further, nearly 72% of women 288
perceived it as challenging to access care when there was no available female 289
healthcare worker. In addition, over two-thirds (68%) of women had no awareness of 290
the availability of a health mothers' group in their community. One in ten mothers 291
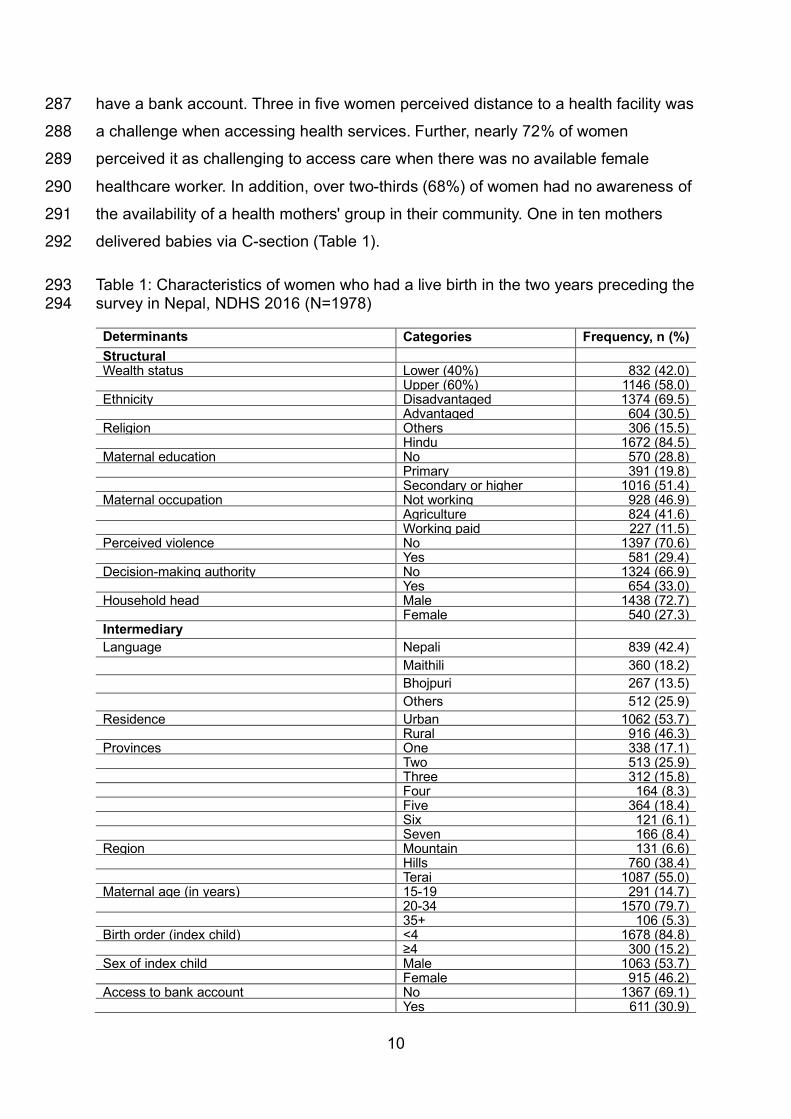
delivered babies via C-section (Table 1). 292
Table 1: Characteristics of women who had a live birth in the two years preceding the 293 survey in Nepal, NDHS 2016 (N=1978) 294
Determinants Categories Frequency, n (%) Structural Wealth status Lower (40%) 832 (42.0) Upper (60%) 1146 (58.0) Ethnicity Disadvantaged 1374 (69.5) Advantaged 604 (30.5) Religion Others 306 (15.5) Hindu 1672 (84.5) Maternal education No 570 (28.8) Primary 391 (19.8) Secondary or higher 1016 (51.4) Maternal occupation Not working 928 (46.9) Agriculture 824 (41.6) Working paid 227 (11.5) Perceived violence No 1397 (70.6) Yes 581 (29.4) Decision-making authority No 1324 (66.9) Yes 654 (33.0) Household head Male 1438 (72.7) Female 540 (27.3) Intermediary
Language Nepali 839 (42.4) Maithili 360 (18.2) Bhojpuri 267 (13.5) Others 512 (25.9) Residence Urban 1062 (53.7) Rural 916 (46.3) Provinces One 338 (17.1) Two 513 (25.9) Three 312 (15.8) Four 164 (8.3) Five 364 (18.4) Six 121 (6.1) Seven 166 (8.4) Region Mountain 131 (6.6) Hills 760 (38.4) Terai 1087 (55.0) Maternal age (in years) 15-19 291 (14.7) 20-34 1570 (79.7) 35+ 106 (5.3) Birth order (index child) <4 1678 (84.8) ≥4 300 (15.2) Sex of index child Male 1063 (53.7) Female 915 (46.2) Access to bank account No 1367 (69.1) Yes 611 (30.9)
11
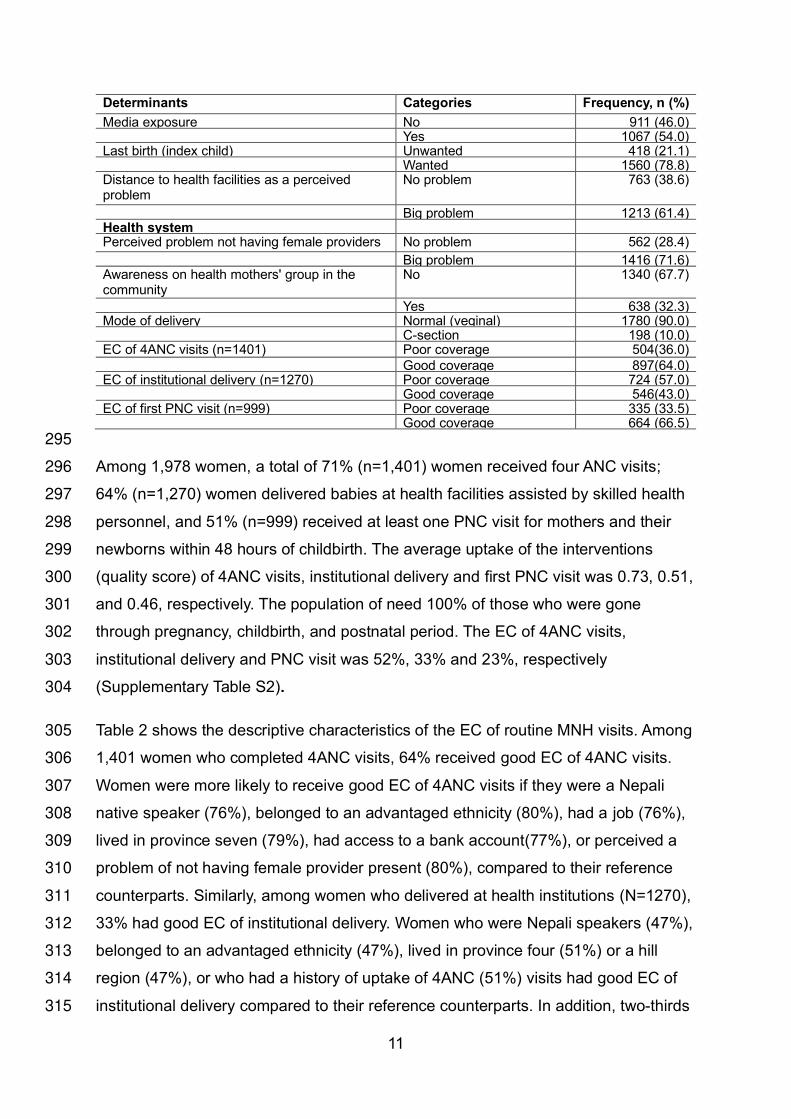
Determinants Categories Frequency, n (%) Media exposure No 911 (46.0) Yes 1067 (54.0) Last birth (index child) Unwanted 418 (21.1) Wanted 1560 (78.8) Distance to health facilities as a perceived problem
No problem 763 (38.6)
Big problem 1213 (61.4) Health system Perceived problem not having female providers No problem 562 (28.4) Big problem 1416 (71.6) Awareness on health mothers' group in the community
No 1340 (67.7)
Yes 638 (32.3) Mode of delivery Normal (veginal) 1780 (90.0) C-section 198 (10.0) EC of 4ANC visits (n=1401) Poor coverage 504(36.0) Good coverage 897(64.0) EC of institutional delivery (n=1270) Poor coverage 724 (57.0) Good coverage 546(43.0) EC of first PNC visit (n=999) Poor coverage 335 (33.5) Good coverage 664 (66.5)
295
Among 1,978 women, a total of 71% (n=1,401) women received four ANC visits; 296
64% (n=1,270) women delivered babies at health facilities assisted by skilled health 297
personnel, and 51% (n=999) received at least one PNC visit for mothers and their 298
newborns within 48 hours of childbirth. The average uptake of the interventions 299
(quality score) of 4ANC visits, institutional delivery and first PNC visit was 0.73, 0.51, 300
and 0.46, respectively. The population of need 100% of those who were gone 301
through pregnancy, childbirth, and postnatal period. The EC of 4ANC visits, 302
institutional delivery and PNC visit was 52%, 33% and 23%, respectively 303
(Supplementary Table S2). 304
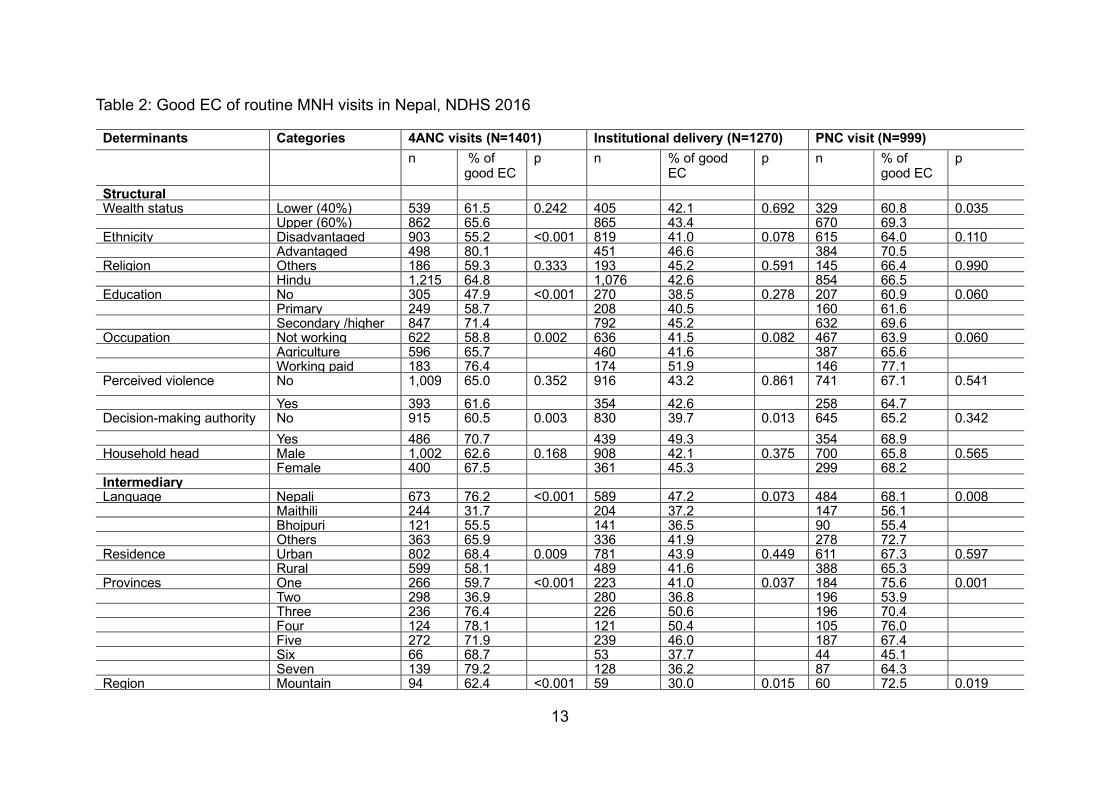
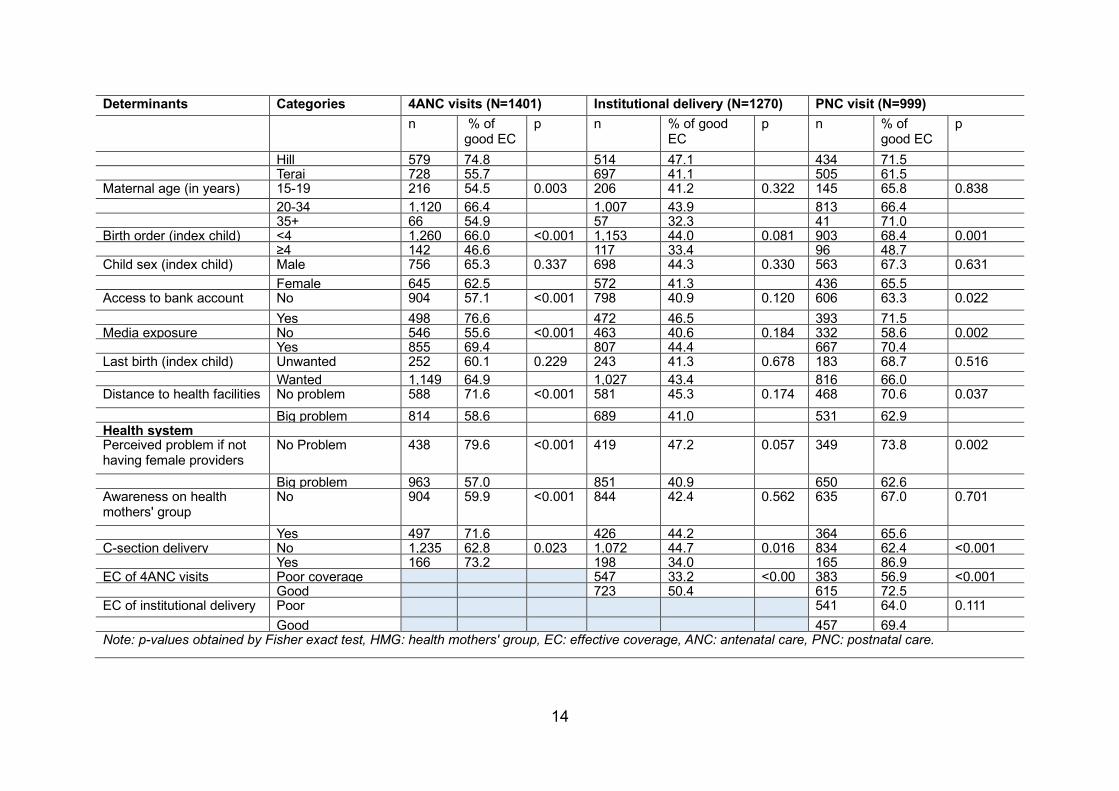
Table 2 shows the descriptive characteristics of the EC of routine MNH visits. Among 305
1,401 women who completed 4ANC visits, 64% received good EC of 4ANC visits. 306
Women were more likely to receive good EC of 4ANC visits if they were a Nepali 307
native speaker (76%), belonged to an advantaged ethnicity (80%), had a job (76%), 308
lived in province seven (79%), had access to a bank account(77%), or perceived a 309
problem of not having female provider present (80%), compared to their reference 310
counterparts. Similarly, among women who delivered at health institutions (N=1270), 311
33% had good EC of institutional delivery. Women who were Nepali speakers (47%), 312
belonged to an advantaged ethnicity (47%), lived in province four (51%) or a hill 313
region (47%), or who had a history of uptake of 4ANC (51%) visits had good EC of 314
institutional delivery compared to their reference counterparts. In addition, two-thirds 315
12
(66.5%, N=999) of women who accessed PNC services received good EC of PNC 316
visit. Women received good EC of their PNC visit if they had higher wealth status 317
(69%), higher (high school and above) maternal education (70%) or a job (77%), or 318
lived in province four (76%), had access to a bank account (72%), or delivered via 319
caesarean-section (87%) compared to their reference counterparts. 320
13
Table 2: Good EC of routine MNH visits in Nepal, NDHS 2016
Determinants Categories 4ANC visits (N=1401) Institutional delivery (N=1270) PNC visit (N=999) n % of
good EC p n % of good
EC p n % of
good EC p
Structural Wealth status Lower (40%) 539 61.5 0.242 405 42.1 0.692 329 60.8 0.035 Upper (60%) 862 65.6 865 43.4 670 69.3 Ethnicity Disadvantaged 903 55.2 <0.001 819 41.0 0.078 615 64.0 0.110 Advantaged 498 80.1 451 46.6 384 70.5 Religion Others 186 59.3 0.333 193 45.2 0.591 145 66.4 0.990 Hindu 1,215 64.8 1,076 42.6 854 66.5 Education No 305 47.9 <0.001 270 38.5 0.278 207 60.9 0.060 Primary 249 58.7 208 40.5 160 61.6 Secondary /higher 847 71.4 792 45.2 632 69.6 Occupation Not working 622 58.8 0.002 636 41.5 0.082 467 63.9 0.060 Agriculture 596 65.7 460 41.6 387 65.6 Working paid 183 76.4 174 51.9 146 77.1 Perceived violence No 1,009 65.0 0.352 916 43.2 0.861 741 67.1 0.541
Yes 393 61.6 354 42.6 258 64.7 Decision-making authority No 915 60.5 0.003 830 39.7 0.013 645 65.2 0.342
Yes 486 70.7 439 49.3 354 68.9 Household head Male 1,002 62.6 0.168 908 42.1 0.375 700 65.8 0.565 Female 400 67.5 361 45.3 299 68.2 Intermediary Language Nepali 673 76.2 <0.001 589 47.2 0.073 484 68.1 0.008 Maithili 244 31.7 204 37.2 147 56.1 Bhojpuri 121 55.5 141 36.5 90 55.4 Others 363 65.9 336 41.9 278 72.7 Residence Urban 802 68.4 0.009 781 43.9 0.449 611 67.3 0.597 Rural 599 58.1 489 41.6 388 65.3 Provinces One 266 59.7 <0.001 223 41.0 0.037 184 75.6 0.001 Two 298 36.9 280 36.8 196 53.9 Three 236 76.4 226 50.6 196 70.4 Four 124 78.1 121 50.4 105 76.0 Five 272 71.9 239 46.0 187 67.4 Six 66 68.7 53 37.7 44 45.1 Seven 139 79.2 128 36.2 87 64.3 Region Mountain 94 62.4 <0.001 59 30.0 0.015 60 72.5 0.019
14
Determinants Categories 4ANC visits (N=1401) Institutional delivery (N=1270) PNC visit (N=999) n % of
good EC p n % of good
EC p n % of
good EC p
Hill 579 74.8 514 47.1 434 71.5 Terai 728 55.7 697 41.1 505 61.5 Maternal age (in years) 15-19 216 54.5 0.003 206 41.2 0.322 145 65.8 0.838
20-34 1,120 66.4 1,007 43.9 813 66.4 35+ 66 54.9 57 32.3 41 71.0 Birth order (index child) <4 1,260 66.0 <0.001 1,153 44.0 0.081 903 68.4 0.001 ≥4 142 46.6 117 33.4 96 48.7 Child sex (index child) Male 756 65.3 0.337 698 44.3 0.330 563 67.3 0.631
Female 645 62.5 572 41.3 436 65.5 Access to bank account No 904 57.1 <0.001 798 40.9 0.120 606 63.3 0.022
Yes 498 76.6 472 46.5 393 71.5 Media exposure No 546 55.6 <0.001 463 40.6 0.184 332 58.6 0.002 Yes 855 69.4 807 44.4 667 70.4 Last birth (index child) Unwanted 252 60.1 0.229 243 41.3 0.678 183 68.7 0.516
Wanted 1,149 64.9 1,027 43.4 816 66.0 Distance to health facilities No problem 588 71.6 <0.001 581 45.3 0.174 468 70.6 0.037
Big problem 814 58.6 689 41.0 531 62.9 Health system Perceived problem if not having female providers
No Problem 438 79.6 <0.001 419 47.2 0.057 349 73.8 0.002
Big problem 963 57.0 851 40.9 650 62.6 Awareness on health mothers' group
No 904 59.9 <0.001 844 42.4 0.562 635 67.0 0.701
Yes 497 71.6 426 44.2 364 65.6 C-section delivery No 1,235 62.8 0.023 1,072 44.7 0.016 834 62.4 <0.001 Yes 166 73.2 198 34.0 165 86.9 EC of 4ANC visits Poor coverage 547 33.2 <0.00
1 383 56.9 <0.001
Good 723 50.4 615 72.5 EC of institutional delivery Poor 541 64.0 0.111
Good 457 69.4 Note: p-values obtained by Fisher exact test, HMG: health mothers' group, EC: effective coverage, ANC: antenatal care, PNC: postnatal care.
15
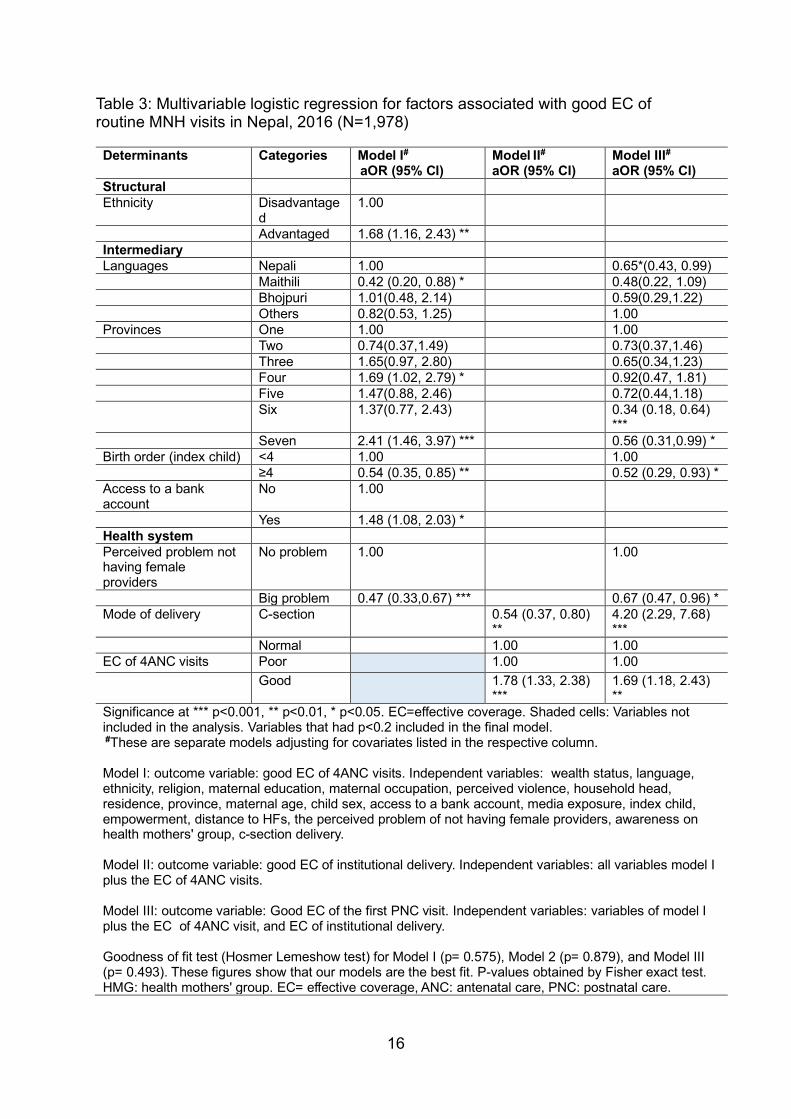
Determinants of good EC of routine MNH visits
In the bivariable logistic analysis, 16 (of 19) variables were significantly associated
with EC of 4ANC visits. Similarly, six (of 23) variables were significantly associated
with good EC of institutional delivery. Total 12 (of 20) variables were significantly
associated with good EC of PNC visit (Supplementary Table S3).
In the multivariate logistic regression analysis (Model I) for determinants of EC of
4ANC visits, six variables were significantly associated with good EC of 4ANC visits.
Maithili speakers had lower odds (aOR=0.42; 95% CI: 0.20, 0.88) of good EC of
4ANC visits. There was good EC of 4ANC visits if women resided in province four
(aOR=1.69; 95% CI: 1.02, 2.79) or seven (aOR=2.41; 95% CI: 1.46, 3.97), belonged
to an advantaged ethnicity (aOR=1.68; 95% CI: 1.16, 2.43), and had a bank account
(aOR=1.48; 95% CI: 1.08, 2.03) compared to their reference counterparts. Women
with higher birth order (≥4) (aOR=0.54; 95% CI: 0.35, 0.85), and the perceived
problem of not having female providers (aOR=0.47; 95% CI: 0.33, 0.67) were found
to have a significant negative association with the uptake of good EC of 4ANC visits
(Table 3).
In the multivariable analysis (Model II for determinants of EC of institutional delivery),
two variables (mode of delivery and continuity of 4ANC visits) were significantly
associated with EC of institutional delivery. Women who had delivery via caesarean-
section had lower odds (aOR=0.54; 95% CI: 0.37, 0.80) of EC of institutional delivery
services compared to women who had a normal delivery. Women with at least 4ANC
visits during their pregnancy had higher odds (aOR=1.78; 95% CI: 1.33, 2.38) of
good EC of institutional delivery compared to women who did not (Table 3).
In the multivariable analysis (Model III for determinants of EC of PNC visit), six
variables were significantly associated with EC of PNC visit. Nepali speaker women
(aOR=0.65; 95% CI: 0.43, 0.99), women from province six (aOR=0.34; 95% CI: 0.18,
0.64) and province seven (aOR=0.56; 95% CI: 0.31, 0.99), the perceived problem if
not having female providers (aOR=0.67; 95% CI:0.47, 0.96), or higher birth order (≥
4) (aOR=0.52; 95% CI: 0.29, 0.93), had a significant negative association with EC of
PNC visit. C-section (aOR=4.20; 95% CI: 2.29, 7.68), and EC of 4ANC visits
(aOR=1.69; 95% CI: 1.18, 2.43) had a significant positive association with good EC
of PNC visit (Table 3).
16
Table 3: Multivariable logistic regression for factors associated with good EC of routine MNH visits in Nepal, 2016 (N=1,978)
Determinants Categories Model I#
aOR (95% CI) Model II#
aOR (95% CI) Model III# aOR (95% CI)
Structural Ethnicity Disadvantage
d 1.00
Advantaged 1.68 (1.16, 2.43) ** Intermediary Languages Nepali 1.00 0.65*(0.43, 0.99) Maithili 0.42 (0.20, 0.88) * 0.48(0.22, 1.09) Bhojpuri 1.01(0.48, 2.14) 0.59(0.29,1.22) Others 0.82(0.53, 1.25) 1.00 Provinces One 1.00 1.00 Two 0.74(0.37,1.49) 0.73(0.37,1.46) Three 1.65(0.97, 2.80) 0.65(0.34,1.23) Four 1.69 (1.02, 2.79) * 0.92(0.47, 1.81) Five 1.47(0.88, 2.46) 0.72(0.44,1.18) Six 1.37(0.77, 2.43) 0.34 (0.18, 0.64)
*** Seven 2.41 (1.46, 3.97) *** 0.56 (0.31,0.99) * Birth order (index child) <4 1.00 1.00 ≥4 0.54 (0.35, 0.85) ** 0.52 (0.29, 0.93) * Access to a bank account
No 1.00
Yes 1.48 (1.08, 2.03) * Health system Perceived problem not having female providers
No problem 1.00 1.00
Big problem 0.47 (0.33,0.67) *** 0.67 (0.47, 0.96) * Mode of delivery C-section 0.54 (0.37, 0.80)
** 4.20 (2.29, 7.68) ***
Normal 1.00 1.00 EC of 4ANC visits Poor 1.00 1.00
Good 1.78 (1.33, 2.38) ***
1.69 (1.18, 2.43) **
Significance at *** p<0.001, ** p<0.01, * p<0.05. EC=effective coverage. Shaded cells: Variables not included in the analysis. Variables that had p<0.2 included in the final model. #These are separate models adjusting for covariates listed in the respective column. Model I: outcome variable: good EC of 4ANC visits. Independent variables: wealth status, language, ethnicity, religion, maternal education, maternal occupation, perceived violence, household head, residence, province, maternal age, child sex, access to a bank account, media exposure, index child, empowerment, distance to HFs, the perceived problem of not having female providers, awareness on health mothers' group, c-section delivery. Model II: outcome variable: good EC of institutional delivery. Independent variables: all variables model I plus the EC of 4ANC visits. Model III: outcome variable: Good EC of the first PNC visit. Independent variables: variables of model I plus the EC of 4ANC visit, and EC of institutional delivery. Goodness of fit test (Hosmer Lemeshow test) for Model I (p= 0.575), Model 2 (p= 0.879), and Model III (p= 0.493). These figures show that our models are the best fit. P-values obtained by Fisher exact test. HMG: health mothers' group. EC= effective coverage, ANC: antenatal care, PNC: postnatal care.

17
Discussion Summary of the findings
The effective coverage of 4ANC visits, institutional delivery, and PNC visit was 52%,
33% and 23%, respectively. These findings provide a baseline for the future
estimation of the quality of MNH services in Nepal. Women with disadvantaged
ethnicity or those from province six, speaking Maithili as the first language, and those
who had high birth order (≥4) had lower odds of EC of MNH visits. Women who had
access to a bank account, or women who had C-section delivery had higher odds of
good EC of MNH visits. Women who perceived problem if not seen by female
providers had poor EC of MNH visits compared to who did not care about the gender
of health care providers.
EC of routine MNH visits and determinants
This study found low EC of all forms of MNH visits (4ANC visits, institutional delivery,
and PNC visit) compared to contact coverage of respective coverage of MNH visit.
For example, in Nepal, contact coverage of 4ANC visits, institutional delivery and
first PNC visits was 71%, 64% and 51% respectively [53], but EC was lower than
these figures. These suggest that women are reaching to HFs but not receiving all
essential interventions. Yet, while contact coverage of routine MNH visits is essential
on its own it is inadequate to avert MMR and NMR.
Poor EC of MNH visits identified in the current study are consistent with the studies
conducted in Bangladesh [54], Cambodia [55], and other LMICs of South Asia and
Sub Saharan Africa [18, 46]. Studies conducted in Nepal reported poor quality of
ANC [48] and had low uptake of recommended antenatal interventions (e.g., ANC
counselling or iron or tetanus toxoid injections) [56]. An analysis of multi-country data
revealed low EC of facility delivery [57] and 4ANC visits and PNC visit [58] despite
high contact coverage of respective MNH visits. Few studies also reported poor EC
of other health services such as treatment of sick children (e.g., treatment of
diarrhoea, pneumonia) [46] and family planning services [23, 46]. In addition to
challenges in reaching to HFs, poor EC coverage may have contributed by the
health system’s weakness, such as poor readiness, including a lack of trained health
workers, or shortages of medicine for MNH services.
18
The current study identified several determinants associated with EC of routine MNH
services including ethnic and geographic disadvantage, Maithili speaking women,
birth order, and gender of health care providers. First, in Nepal, ethnicity and
socioeconomic status are associated with power and position in the society [59, 60].
Women with upper-caste groups usually have higher wealth status, usually are
Nepali native speaker, they get a good opportunity for education and employment
and are likely to have better awareness of health matters and the availability of
health services. Disadvantaged ethnicities belong to the lower strata of the
hierarchical caste system of Nepal [61]. Women with economic and ethic
disadvantages have poor access to health services in Nepal [62]. Health programs
should focus on disadvantaged ethnicities and design context-specific strategies to
provide effective health services to those groups.
Secondly, women of province six had poor EC that could be contributed by
scattered settlements, poor transportation facilities with limited access to reach HFs
[63]. Reaching HFs is problematic due to limited road networks and poor
transportation facilities [64, 65]. Women’s access to HFs can be improved via local
development approaches such as constructing HFs in strategic locations and
connecting community and health facilities by constructing bridges and road
networks. However, these are non-health sector interventions that require
multisectoral actions. Third, non-native Nepali speaker women, for instance, Maithili
speaking women, usually have poor access to information. Poor access to health
information might have contributed due to their low literacy rate [66]. Health
education and information programs are not available in the local language, which
affects health literacy among disadvantaged groups. In some cases, women cannot
express their health care needs to health services providers if they could not
understand Nepali or if health providers are unable to speak local languages.
Recruitment of local health workforce and health education interventions conducted
in local language can increase the uptake of MNH interventions.
Fourthly, women with high birth order (four or more) had poor EC of MNH visits in
their recent pregnancy and childbirth. If women have more children, they may not
prioritise the latest pregnancy and might not take the recommended MNH
interventions in their pregnancy and childbirth [67]. Effective family planning services
19
could reduce the number of birth order [67, 68]. Women with wanted pregnancy visit
health facility and take recommended MNH interventions for a healthy pregnancy
and healthy childbirth. Fifth, some women prefer female providers for the uptake of
MNH services in Nepal. Female health care providers can understand the need for
health service users, and evidence indicates the provision of female providers can
improve access to health services [69]. Similarly, if women receive good quality ANC,
they are more likely to receive good quality institutional delivery services or PNC visit
[37]. Improved quality of care is also likely to increase subsequent utilisation of MNH
visits [56]. In nutshell, both access and health system response approaches care
likely to improve EC of routine MNH visits. These approaches include equipping HFs
with adequate supplies, trained health workers (e.g., local health workers who can
understand local language and culture) and respectful maternity care and improved
awareness on uptake of quality pregnancy, childbirth, and postnatal care from HFs.
This study demonstrated the measurement of the EC of routine MNH visits using
NDHS data. The quality of care is emphasised in global health policies and universal
access to quality MNH services SDG3 [9]; evaluating EC however, requires a
population level measurement of quality of care. The EC of MNH visits can provide a
proxy indicator of quality of care and go beyond simply contact coverage. This is
important as evidence suggests access to health services alone cannot result in the
intended MNH outcomes [13, 70]. Measurement of quality of care requires multiple
sources of data, such as users, providers, facility inventory, and observation of
interaction between providers and users [9, 71]. This study also demonstrates,
however, a single source of data can be used to assess the health care quality. This
study assessed the EC of routine MNH visits taking information on services users’
engagement with the health system and using data of household survey and
information on adequate care, timely care, and frequent and skilled care while
women visit health facilities.
Policy and programmatic implications of the study
This study has implications for policies and programs. Firstly, the EC has been an
important concept for its applicability in health system performance and could be
instrumental in tracking the progress towards universal health coverage of MNH
services [17]. Secondly, in Nepal, monitoring systems have given limited attention to

20
measuring the EC of health services including MNH services [72]. The methods used
to estimate to assess the EC could provide ideas for the measurement of quality of
health services. Thirdly, the universal coverage of quality MNH services are essential
and need to focus on the quality of care for the reduction of NMR and MMR. To
achieve SDG3 targets, the programmatic and policy focus should be beyond the
contact coverage of MNH visits as only improving access to health services or
contact coverage could not result in intended better MNH outcomes. Finally, this
study identified disadvantaged women who were getting poor EC of MNH visits and
identified the need for targeted approaches for effective uptake of MNH interventions
among those groups. Programs and policies should focus on women with poor
wealth status and ethnic disadvantages, and women speaking Maithili as the first
language. Context-specific program approaches require to receive essential MNH
interventions and ultimately improve the EC of MNH visits.
Limitations of the study
This study has some limitations. Firstly, data were self-reported, and thus, recall bias
may occur. However, this study restricted to analysis among women who had a live
birth in the two years prior to the survey (2014–2016), which is a relatively shorter
recall period than other studies published using NDHS datasets in the past.
Secondly, outcome variables were self-reported by women during face-to-face
interviews, which may lead to recall bias and social desirability bias. Thirdly,
assessment of EC was limited by the information of MNH interventions available in
the NDHS 2016. The NDHS did not collect information on all the WHO-
recommended essential MNH interventions [4, 5, 45]. This study emphasises the
importance of collecting information on MNH interventions in NDHS or routine HMIS
system.
Conclusions The uptake of recommended MNH interventions was low in all routine MNH visits (4
ANC visits, institutional delivery, and the first PNC visit) in Nepal. Poor EC of MNH
visits was observed among women with social disadvantages, including those with
ethnic disadvantage and living in remote areas. Both supply and demand-side
multisectoral actions are needed to address several social determinants of health
affecting poor EC of MNH visits in Nepal. Supply-side strategies such as recruiting
female health providers and providing health commodities in HFs could improve the

21
health system responses for delivery of better quality MNH services. Improving the
status of social determinant of health, community engagement, and health
awareness through mass media on the antenatal, childbirth, and postnatal period
could increase the demand of services for EC of routine MNH visits. Non- health
sector interventions could improve the EC of routine MNH visits, including arranging
transportation facilities or constructing local bridge and roads to reach HFs. Health
policies and programs should focus on women with socioeconomic disadvantages
and living in remote areas.
Supplementary file 1
Supplementary Table S1: Description of variables included in the analysis of effective
coverage of routine MNH visits in Nepal, 2016
Supplementary Table S2: Uptake of interventions during MNH visits in Nepal, 2016
Supplementary Table S3: Bivariable binomial logistic regression analysis for good
EC of MNH visits in Nepal
Abbreviations ANC: Antenatal Care; CoC: Continuum of care; EC: Effective Coverage; LMICs: Low
and lower-middle-income countries; MNH: Maternal and newborn health; NDHS:
Nepal Demographic and Health Survey; PNC: Postnatal Care; SDIP: Safe Delivery
Incentive Program
Declaration Ethics approval and consent to participate
We used secondary data from the 2016 NDHS. This survey was approved by an
ethical review board of Nepal Health Research Council, Nepal, and ICF Marco
International, Maryland, USA. The Ministry of Health and Population (MOHP) (Nepal)
oversaw the overall research process of the NDHS 2016. The NDHS data are
publicly available for further analysis, and data were deidentified of the research
participants. This study did not require ethical approval from respective institutions.
However, the first author took approval for the download and use of the dataset for
his doctoral thesis and this publication.
Consent for publication
22
Not applicable
Availability of data and materials
Data used in this study are publicly available secondary data obtained from the DHS
(https://dhsprogram.com/data/available-datasets.cfm) program.
Competing interests
The authors declared that they have no competing interests.
Funding
No funding received for the development of this manuscript.
Acknowledgements
This manuscript is a part of the first author's doctoral thesis at the School of Public
Health, the University of Queensland, supported by the University of Queensland
International Scholarship and Career Development Extension Scholarship, and
Research and Training Program Scholarship. The author would like to acknowledge
the University of Queensland for providing the scholarship for the doctoral program. I
would like to acknowledge Melinda Protani and Elisabeth Winkler for data analysis.
Authors' contributions
Design of the research, statistical analysis, interpretation: RBK. Writing first draft of
manuscript: RBK and JD. Supervision of the study: RK, JD and YA. RBK, RK, JD
and YA contributed significantly during the revision and finalised the manuscript. All
authors read and agreed on the final version of the manuscript.
23
References 1. WHO: Trends in maternal mortality 2000 to 2017: estimates by WHO,
UNICEF, UNFPA, World Bank Group and the United Nations Population Division. In. WHO Geneva,; 2019.
2. Ng M, Fullman N, Dieleman JL, Flaxman AD, Murray CJ, Lim SS: Effective coverage: a metric for monitoring universal health coverage. PLoS Med 2014, 11(9):e1001730.
3. Amouzou A, Leslie HH, Ram M, Fox M, Jiwani SS, Requejo J, Marchant T, Munos MK, Vaz LME, Weiss W et al: Advances in the measurement of coverage for RMNCH and nutrition: from contact to effective coverage. BMJ Glob Health 2019, 4(Suppl 4):e001297.
4. WHO: WHO recommendations on antenatal care for a positive pregnancy experience: World Health Organization; 2016.
5. WHO: Compilation of WHO recommendations on maternal, newborn, child and adolescent health. In. Geneva; 2013.
6. World Health Organization: WHO recommendations on postnatal care of the mother and newborn: World Health Organization; 2014.
7. WHO & UNICEF: Pregnancy, childbirth, postpartum and newborn care: A guide for essential practice. In. Geneva; 2015.
8. Marsh AD, Muzigaba M, Diaz T, Requejo J, Jackson D, Chou D, Cresswell JA, Guthold R, Moran AC, Strong KL et al: Effective coverage measurement in maternal, newborn, child, and adolescent health and nutrition: progress, future prospects, and implications for quality health systems. Lancet Glob Health 2020, 8(5):e730-e736.
9. Kruk ME, Gage AD, Arsenault C, Jordan K, Leslie HH, Roder-DeWan S, Adeyi O, Barker P, Daelmans B, Doubova SV et al: High-quality health systems in the Sustainable Development Goals era: time for a revolution. Lancet Glob Health 2018, 6(11):e1196-e1252.
10. Koulidiati JL, Nesbitt RC, Ouedraogo N, Hien H, Robyn PJ, Compaore P, Souares A, Brenner S: Measuring effective coverage of curative child health services in rural Burkina Faso: a cross-sectional study. BMJ Open 2018, 8(5):e020423.
11. Darmstadt GL: Global perinatal health: accelerating progress through innovations, interactions, and interconnections. Semin Perinatol 2010, 34(6):367-370.
12. Darmstadt GL, Walker N, Lawn JE, Bhutta ZA, Haws RA, Cousens S: Saving newborn lives in Asia and Africa: cost and impact of phased scale-up of interventions within the continuum of care. Health Policy Plan 2008, 23(2):101-117.
13. Blanc AK, Diaz C, McCarthy KJ, Berdichevsky K: Measuring progress in maternal and newborn health care in Mexico: validating indicators of health system contact and quality of care. BMC Pregnancy Childbirth 2016, 16(1):255.
14. Barros AJ, Ronsmans C, Axelson H, Loaiza E, Bertoldi AD, Franca GV, Bryce J, Boerma JT, Victora CG: Equity in maternal, newborn, and child health interventions in Countdown to 2015: a retrospective review of survey data from 54 countries. Lancet 2012, 379(9822):1225-1233.
15. Huda TM, Hayes A, Dibley MJ: Examining horizontal inequity and social determinants of inequality in facility delivery services in three South Asian countries. J Glob Health 2018, 8(1):010416.
24
16. Kim H, Novakovic U, Muntaner C, Hawkes MT: A critical assessment of the ideological underpinnings of current practice in global health and their historical origins. Glob Health Action 2019, 12(1):1651017.
17. Jannati A, Sadeghi V, Imani A, Saadati M: Effective coverage as a new approach to health system performance assessment: a scoping review. BMC Health Serv Res 2018, 18(1):886.
18. Hodgins S, D'Agostino A: The quality-coverage gap in antenatal care: toward better measurement of effective coverage. Glob Health Sci Pract 2014, 2(2):173-181.
19. Martinez S, Carrasquilla G, Guerrero R, Gomez-Dantes H, Castro V, Arreola-Ornelas H, Bedregal P: Effective coverage of health interventions in Latin America and the Caribbean: metrics for the assessment of health systems performance. Salud Publica Mex 2011, 53 Suppl 2:s78-84.
20. Heredia-Pi I, Servan-Mori E, Darney BG, Reyes-Morales H, Lozano R: Measuring the adequacy of antenatal health care: a national cross-sectional study in Mexico. Bull World Health Organ 2016, 94(6):452-461.
21. McCollum R, Taegtmeyer M, Otiso L, Mireku M, Muturi N, Martineau T, Theobald S: Healthcare equity analysis: applying the Tanahashi model of health service coverage to community health systems following devolution in Kenya. Int J Equity Health 2019, 18(1):65.
22. Shibanuma A, Yeji F, Okawa S, Mahama E, Kikuchi K, Narh C, Enuameh Y, Nanishi K, Oduro A, Owusu-Agyei S et al: The coverage of continuum of care in maternal, newborn and child health: a cross-sectional study of woman-child pairs in Ghana. BMJ Glob Health 2018, 3(4):e000786.
23. Nguhiu PK, Barasa EW, Chuma J: Determining the effective coverage of maternal and child health services in Kenya, using demographic and health survey data sets: tracking progress towards universal health coverage. Trop Med Int Health 2017, 22(4):442-453.
24. Akseer N, Kamali M, Arifeen SE, Malik A, Bhatti Z, Thacker N, Maksey M, D’Silva H, da Silva IC, Bhutta ZA: Progress in maternal and child health: how has South Asia fared? BMJ 2017, 357:j1608.
25. MOHP [Nepal]: Nepal demographic and health survey 2016. In. Kathmandu; 2017.
26. MOHP [Nepal]: Nepal health sector strategy 2015–2020. In. Kathmandu,; 2015.
27. MOHP [Nepal] National health policy 2019. In. Kathmandu; 2019. 28. FWD: Nepal Safe Motherhood and Newborn Health Road Map 2030. In.
Kathmandu Ministry of Health and Population, Government of Nepal,; 2019 29. National Planning Commission, 2015: Sustainable Development Goals,
2016-2030, National Report. Government of Nepal, National Planning Commission, Kathmandu, Nepal
30. MOHP [Nepal]: Annual Report, Department of Health Services 2075/2076 (2018/2019). In.: Ministry of Health and Population. Kathmandu, Nepal. Ministry of Health and Population, Department of Health Services.; 2020.
31. NHSSP M: Report on Stocktaking the Health Policies of Nepal. In.: Nepal Health Sector Support Programme III; 2018.
32. Paudel M, Javanparast S, Dasvarma G, Newman L: A critical account of the policy context shaping perinatal survival in Nepal: policy tension of socio-cultural versus a medical approach. BMC Health Serv Res 2019, 19(1):166.
25
33. Karkee R, Lee AH, Khanal V: Need factors for utilisation of institutional delivery services in Nepal: an analysis from Nepal Demographic and Health Survey, 2011. BMJ Open 2014, 4(3):e004372.
34. Khanal V, Adhikari M, Karkee R, Gavidia T: Factors associated with the utilisation of postnatal care services among the mothers of Nepal: analysis of Nepal demographic and health survey 2011. BMC Womens Health 2014, 14(1):19.
35. Mehata S, Paudel YR, Dariang M, Aryal KK, Paudel S, Mehta R, King S, Barnett S: Factors determining satisfaction among facility-based maternity clients in Nepal. BMC Pregnancy Childbirth 2017, 17(1):319.
36. Panth A, Kafle P: Maternal satisfaction on delivery service among postnatal mothers in a government hospital, mid-western Nepal. Obstet Gynecol Int 2018, 2018:4530161.
37. Khatri RB, Karkee R: Social determinants of health affecting utilisation of routine maternity services in Nepal: a narrative review of the evidence. Reprod Health Matters 2018, 26(54):32-46.
38. Conway K, Akseer N, Subedi RK, Brar S, Bhattarai B, Dhungana RR, Islam M, Mainali A, Pradhan N, Tasic H et al: Drivers of stunting reduction in Nepal: a country case study. Am J Clin Nutr 2020.
39. Mahato PK, Waithaka E, van Teijlingen E, Pant PR, Biswas A: Social autopsy: a potential health-promotion tool for preventing maternal mortality in low-income countries. WHO South East Asia J Public Health 2018, 7(1):24-28.
40. WHO: A conceptual framework for action on the social determinants of health. In. Geneva: World Health Organization; 2010.
41. World Health Organization: A conceptual framework for action on the social determinants of health. 2010.
42. Adewuyi EO, Auta A, Khanal V, Bamidele OD, Akuoko CP, Adefemi K, Tapshak SJ, Zhao Y: Prevalence and factors associated with underutilization of antenatal care services in Nigeria: A comparative study of rural and urban residences based on the 2013 Nigeria demographic and health survey. PLoS One 2018, 13(5):e0197324.
43. Khatri RB, Poudel S, Ghimire PR: Factors associated with unsafe abortion practices in Nepal: Pooled analysis of the 2011 and 2016 Nepal Demographic and Health Surveys. PLoS One 2019, 14(10):e0223385.
44. WHO: Definition of skilled health personnel providing care during childbirth. In.: World Health Organization; 2018.
45. WHO: WHO recommendations on postnatal care of the mother and newborn. In. Geneva; 2014.
46. Leslie HH, Malata A, Ndiaye Y, Kruk ME: Effective coverage of primary care services in eight high-mortality countries. BMJ Glob Health 2017, 2(3):e000424.
47. Sharma J, Leslie HH, Kundu F, Kruk ME: Poor quality for poor women? Inequities in the quality of antenatal and delivery care in Kenya. PLoS One 2017, 12(1):e0171236.
48. Adhikari M, Chalise B, Bista B, Pandey AR, Upadhyaya DP: Sociodemographic correlates of antenatal care visits in Nepal: results from Nepal Demographic and Health Survey 2016. BMC Pregnancy Childbirth 2020, 20(1):513.
26
49. Akinwande MO, Dikko HG, Samson A: Variance Inflation Factor: As a Condition for the Inclusion of Suppressor Variable(s) in Regression Analysis. Open Journal of Statistics 2015, 05(07):754-767.
50. Heinze G, Wallisch C, Dunkler D: Variable selection - A review and recommendations for the practicing statistician. Biom J 2018, 60(3):431-449.
51. Bursac Z, Gauss CH, Williams DK, Hosmer DW: Purposeful selection of variables in logistic regression. Source Code Biol Med 2008, 3:17.
52. Lemes IR, Sui X, Fernandes RA, Blair SN, Turi-Lynch BC, Codogno JS, Monteiro HL: Association of sedentary behavior and metabolic syndrome. Public Health 2019, 167:96-102.
53. Khatri RB: Towards equity of maternal and newborn health services in Nepal. PhD Thesis. The University of Queensland, Australia; 2021.
54. Nguyen PH, Khương LQ, Pramanik P, Billah SM, Menon P, Piwoz E, Leslie HH: Effective coverage of nutrition interventions across the continuum of care in Bangladesh: insights from nationwide cross-sectional household and health facility surveys. BMJ Open 2021, 11(1):e040109.
55. Benova L, Tunçalp Ö, Moran AC, Campbell OMR: Not just a number: examining coverage and content of antenatal care in low-income and middle-income countries. BMJ Global Health 2018, 3(2):e000779.
56. Joshi C, Torvaldsen S, Hodgson R, Hayen A: Factors associated with the use and quality of antenatal care in Nepal: a population-based study using the demographic and health survey data. BMC Pregnancy Childbirth 2014, 14:94.
57. Wang W, Mallick L, Allen C, Pullum T: Effective coverage of facility delivery in Bangladesh, Haiti, Malawi, Nepal, Senegal, and Tanzania. PLoS One 2019, 14(6):e0217853.
58. Carvajal-Aguirre L, Amouzou A, Mehra V, Ziqi M, Zaka N, Newby H: Gap between contact and content in maternal and newborn care: An analysis of data from 20 countries in sub-Saharan Africa. J Glob Health 2017, 7(2):020501.
59. Yadav UK, Ghimire P, Amatya A, Lamichhane A: Factors Associated with Anemia among Pregnant Women of Underprivileged Ethnic Groups Attending Antenatal Care at Provincial Level Hospital of Province 2, Nepal. Anemia 2021, 2021.
60. Paudel YR, Jha T, Mehata S: Timing of first antenatal care (ANC) and inequalities in early initiation of ANC in Nepal. Front Public Health 2017, 5:242.
61. Subedi M: Caste system: Theories and practices in Nepal. Himalayan Journal of Sociology and Anthropology 2010, 4:134-159.
62. Gellner DN: Caste, ethnicity and inequality in Nepal. Economic and Political Weekly 2007:1823-1828.
63. Kathmandu N: Maternal and Child Health in Nepal: The Effects of Caste, Ethnicity, and Regional Identity. 2013.
64. Pandey JP: Maternal and child health in Nepal: the effects of caste, ethnicity, and regional identity: further analysis of the 2011 Nepal demographic and health survey; 2013.
65. Byrne A, Hodge A, Jimenez-Soto E, Morgan A: Looking beyond supply: a systematic literature review of demand-side barriers to health service
27
utilization in the mountains of Nepal. Asia Pac J Public Health 2013, 25(6):438-451.
66. CBS [Nepal]: National population and housing census 2011. In.; 2012. 67. Thapa NR: Factors influencing the use of reproductive health services
among young women in Nepal: analysis of the 2016 Nepal demographic and health survey. Reproductive Health 2020, 17(1):102.
68. Bhandari R, Pokhrel KN, Gabrielle N, Amatya A: Long acting reversible contraception use and associated factors among married women of reproductive age in Nepal. PLoS One 2019, 14(3):e0214590.
69. Napit K, Shrestha KB, Magar SA, Paudel R, Thapa B, Dhakal BR, Amatya A: Factors associated with utilization of adolescent-friendly services in Bhaktapur district, Nepal. J Health Popul Nutr 2020, 39(1):2.
70. Randive B, Diwan V, De Costa A: India’s conditional cash transfer programme (the JSY) to promote institutional birth: is there an association between institutional birth proportion and maternal mortality? PLoS One 2013, 8(6):e67452.
71. Donabedian A: The quality of care. How can it be assessed? JAMA 1988, 260(12):1743-1748.
72. MOHP [Nepal]: Annual health report. In.; 2019.

28

Supplementary Files
This is a list of supplementary �les associated with this preprint. Click to download.
supplimentary�le.doc