memo. - Houston
392
memo. Capital Projects | Customer Account Services | Houston Permitting Center | Houston Water | Transportation & Drainage Operations Date: March 22, 2021 To: Mayor Sylvester Turner City Council Members From: Carol Ellinger Haddock, P.E., Director, Houston Public Works Subject: Executive Summary 2021 Water and Wastewater Cost of Service Rate Study Houston Public Works (HPW) is pleased to present the attached Executive Summary of the March 2021 Water and Wastewater Cost of Service Rate Study (Study) for your review and consideration. On March 24, 2021, City Council will be asked to call a public hearing on April 28, 2021 regarding proposed amendments to the City of Houston’s water and wastewater rates. These rates, for water and sewer (wastewater) utility service, have not been amended since 2010, and are no longer sufficient to meet the financial, regulatory, legal, and service goals of the Combined Utility System (“System”). To determine appropriate rates to address the System’s requirements, the City retained Carollo Engineers, Inc. in 2019 to do a cost of service study for both water and wastewater rates and impact fees. Carollo has supported the City’s efforts in determining annual revenue requirements, allocating costs among customer types, and designing just and reasonable rates which are affordable, equitable and not unreasonably discriminatory. Houston Public Works would like to present the results of the Study to the City Council and to the public, to explain the System’s needs, to review the rate setting process, and to present recommended water and wastewater rates to the public in advance of receiving input at the public hearing. To that end, HPW will provide the Executive Summary of the Report to the City Council and the public through this Executive Summary today, and to present the full Study on April 9, 2021. Rates and impact fees are the sources of revenue for the System. While impact fees are charged to new development only, water and sewer rates are charged to every water and sewer customer. Also unlike impact fees, no specific public participation is prescribed by Texas law. But, where increased rates will be recommended based on the Study, increasing transparency and public participation promotes trust between the City and its utility customers that rate increases are necessary and appropriate. For example, information regarding the revenue requirement will improve understanding of the System’s annual needs for capital expenditures, operations and maintenance, debt payments and reserves, and will show that the annual revenue requirements are not padded or excessive. Additionally, the grouping of customers in customer types with common usage patterns, such as single family residential, multi-family, and industrial and commercial, allows the allocation of costs to meet those shared needs. Finally, everyone can be confident that the proposed rate design is affordable, equitable, and supports the judicious use of resources. HPW looks forward to working with Council and the public to set water and wastewater rates which will serve the utility for years to come. Questions may be forwarded to Houston Public Works through Deputy Director Samir Solanki, CPA, MBA, CFO.
Transcript of memo. - Houston

memo. Capital Projects | Customer Account Services | Houston Permitting Center | Houston Water | Transportation & Drainage Operations
Date: March 22, 2021
To: Mayor Sylvester Turner City Council Members
From: Carol Ellinger Haddock, P.E., Director, Houston Public Works
Subject: Executive Summary 2021 Water and Wastewater Cost of Service Rate Study
Houston Public Works (HPW) is pleased to present the attached Executive Summary of the March 2021 Water and Wastewater Cost of Service Rate Study (Study) for your review and consideration. On March 24, 2021, City Council will be asked to call a public hearing on April 28, 2021 regarding proposed amendments to the City of Houston’s water and wastewater rates. These rates, for water and sewer (wastewater) utility service, have not been amended since 2010, and are no longer sufficient to meet the financial, regulatory, legal, and service goals of the Combined Utility System (“System”). To determine appropriate rates to address the System’s requirements, the City retained Carollo Engineers, Inc. in 2019 to do a cost of service study for both water and wastewater rates and impact fees. Carollo has supported the City’s efforts in determining annual revenue requirements, allocating costs among customer types, and designing just and reasonable rates which are affordable, equitable and not unreasonably discriminatory. Houston Public Works would like to present the results of the Study to the City Council and to the public, to explain the System’s needs, to review the rate setting process, and to present recommended water and wastewater rates to the public in advance of receiving input at the public hearing. To that end, HPW will provide the Executive Summary of the Report to the City Council and the public through this Executive Summary today, and to present the full Study on April 9, 2021. Rates and impact fees are the sources of revenue for the System. While impact fees are charged to new development only, water and sewer rates are charged to every water and sewer customer. Also unlike impact fees, no specific public participation is prescribed by Texas law. But, where increased rates will be recommended based on the Study, increasing transparency and public participation promotes trust between the City and its utility customers that rate increases are necessary and appropriate. For example, information regarding the revenue requirement will improve understanding of the System’s annual needs for capital expenditures, operations and maintenance, debt payments and reserves, and will show that the annual revenue requirements are not padded or excessive. Additionally, the grouping of customers in customer types with common usage patterns, such as single family residential, multi-family, and industrial and commercial, allows the allocation of costs to meet those shared needs. Finally, everyone can be confident that the proposed rate design is affordable, equitable, and supports the judicious use of resources. HPW looks forward to working with Council and the public to set water and wastewater rates which will serve the utility for years to come. Questions may be forwarded to Houston Public Works through Deputy Director Samir Solanki, CPA, MBA, CFO.

TBPE No. F‐
City of Houston
WATER AND WASTEWATER COST OF SERVICE RATE STUDY
UPDATED DRAFT | April
DRAFT
WATER AND WASTEWATER COST OF SERVICE RATE STUDY | CITY OF HOUSTON
DRAFT | APRIL | i
Contents
EXECUTIVE SUMMARY 1
ES. Introduction
ES. Resilient Houston
ES. Background and System Overview
ES. Cost of Service Approach
ES. . Assumptions
ES. . Customer Demand Analyses
ES. Revenue Requirements Analysis
ES. . Water System
ES . Wastewater System
ES . Combined Utility System
ES Cost of Service Analysis
ES . Water System
ES . Wastewater System
ES Rate Design
ES . Water System
ES . Wastewater System
ES . Customer Bill Impacts
ES Recommendations

DRAFT
WATER AND WASTEWATER COST OF SERVICE RATE STUDY | CITY OF HOUSTON
DRAFT | APRIL | viii
Abbreviations
AWWA American Water Works Association
BOD biochemical oxygen demand
Carollo Carollo Engineers, Inc.
CAS Customer Account Services
CIP Capital Improvement Plan
City City of Houston
CUS Combined Utility System
DSCR debt service coverage ratio
DWO Drinking Water Operations
EBS emergency backup service
FYE fiscal year ending
G&A General & Administrative
GRP Groundwater Production Plan
HPC Houston Permitting Center
MEU meter equivalent unit
MFR multifamily residential
O&M operations and maintenance
PAYGO Pay As You Go
PPI Producer Price Index
SFR single A residential
TCEQ Texas Commission on Environmental Quality
TSS total suspended solids
WEF Water Environment Federation
WPP water production plant
WWO Wastewater Operations

DRAFT
WATER AND WASTEWATER COST OF SERVICE RATE STUDY | CITY OF HOUSTON
DRAFT | APRIL |
EXECUTIVE SUMMARY
ES.1 Introduction
The City of Houston, Texas (City), provides water and wastewater service to nearly , customer
accounts through its water and wastewater utility, the Combined Utility System (CUS) or “Houston Water,”
as it is called throughout this report. Houston Water is financially self‐sufficient, with funding for operating
and capital requirements derived primarily from user charge revenues, impact fees, and other miscellaneous
charges. This executive summary documents the results of the cost of service rate study and recommends
water and wastewater rates that are appropriate to meet Houston Water’s funding needs and achieve pricing
objectives.
Following a competitive proposal process, the City hired Carollo Engineers (Carollo) to complete a
comprehensive study to update water and wastewater rates and impact fees, as well as miscellaneous fees
charged by Customer Account Services (CAS) and the Houston Permitting Center (HPC), to support the utility.
The findings and recommendations of the impact fee update and the miscellaneous fees update are
summarized in separate reports.
The objectives of the cost of service rate study were to:
Fund water and wastewater revenue requirements through fiscal year ending (FYE) ,
Determine cost of service by customer type, and
Develop fair and equitable water and wastewater rates.
ES.2 Resilient Houston
Resilient Houston provides a framework for action that works to protect Houston against future disasters and
to build a more resilient City. Part of this strategy is to protect the integrity of the City’s Water and Wastewater
system through unforeseen disasters. Hurricane Harvey and Winter Storm Uri are examples that tested the
limits of the System’s capabilities. Through these events we have learned that disasters come in all shapes
and forms and that the System needs to be ready in various circumstances. In order to align with the strategy
and goals of Resilient Houston, Houston Water has taken into consideration what it would take to get us there.
This means proactively responding to the needs of the aging water and wastewater infrastructure, increasing
backups that support drinking water and wastewater plants, and identifying the vulnerabilities in the entire
system and strengthening them. In order to respond to these needs Houston Water has built into this Rate
Study the costs that are required to take steps towards a more Resilient Houston Water
ES.3 Background and System Overview
Houston Water’s mission is to protect public health, protect the environment, and provide superior customer
service. The utility serves approximately . million customers across a service area of more than square
miles and an additional . million contract and wholesale customers outside the city limits. Houston Water
must generate sufficient revenues to fully fund revenue requirements, maintain appropriate cash balances,
and meet all requirements of the Master Ordinance, including adequate debt service coverage. Ordinance No.
‐ , Houston Water’s “Master Ordinance,” provides for the issuance of Houston Water revenue
obligations and contains restrictions and covenants regarding the issuance of Houston Water debt, to be
issued pursuant to supplemental ordinances. The City completes a cost of service rate study at least every five
years to update water and wastewater rates to continue to meet its financial goals.
DRAFT
WATER AND WASTEWATER COST OF SERVICE RATE STUDY | CITY OF HOUSTON
DRAFT | APRIL |
Houston Water’s Drinking Water Operations (DWO) Branch operates and maintains three water purification
plants and groundwater plants, in addition to an extensive transmission and distribution system. The
Wastewater Operations (WWO) Branch operates and maintains wastewater treatment plants and the
collection system, including lift stations and , miles of sewer lines.
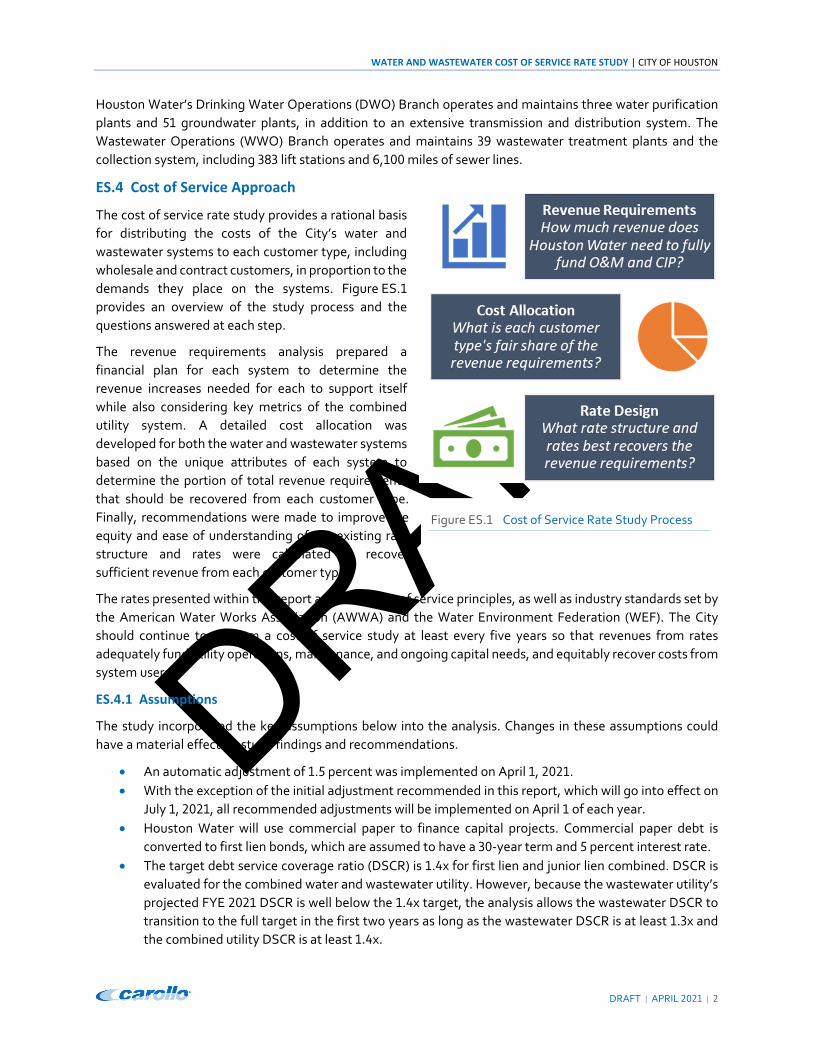
ES.4 Cost of Service Approach
The cost of service rate study provides a rational basis
for distributing the costs of the City’s water and
wastewater systems to each customer type, including
wholesale and contract customers, in proportion to the
demands they place on the systems. Figure ES.
provides an overview of the study process and the
questions answered at each step.
The revenue requirements analysis prepared a
financial plan for each system to determine the
revenue increases needed for each to support itself
while also considering key metrics of the combined
utility system. A detailed cost allocation was
developed for both the water and wastewater systems
based on the unique attributes of each system to
determine the portion of total revenue requirements
that should be recovered from each customer type.
Finally, recommendations were made to improve the
equity and ease of understanding of the existing rate
structure and rates were calculated to recover
sufficient revenue from each customer type.
The rates presented within this report adhere to cost of service principles, as well as industry standards set by
the American Water Works Association (AWWA) and the Water Environment Federation (WEF). The City
should continue to perform a cost of service study at least every five years so that revenues from rates
adequately fund utility operations, maintenance, and ongoing capital needs, and equitably recover costs from
system users.
ES.4.1 Assumptions
The study incorporated the key assumptions below into the analysis. Changes in these assumptions could
have a material effect on study findings and recommendations.
An automatic adjustment of . percent was implemented on April , .
With the exception of the initial adjustment recommended in this report, which will go into effect on
July , , all recommended adjustments will be implemented on April of each year.
Houston Water will use commercial paper to finance capital projects. Commercial paper debt is
converted to first lien bonds, which are assumed to have a ‐year term and percent interest rate.
The target debt service coverage ratio (DSCR) is . x for first lien and junior lien combined. DSCR is
evaluated for the combined water and wastewater utility. However, because the wastewater utility’s
projected FYE DSCR is well below the . x target, the analysis allows the wastewater DSCR to
transition to the full target in the first two years as long as the wastewater DSCR is at least . x and
the combined utility DSCR is at least . x.
Figure ES. Cost of Service Rate Study Process

DRAFT
WATER AND WASTEWATER COST OF SERVICE RATE STUDY | CITY OF HOUSTON
DRAFT | APRIL |
The target for Pay‐As‐You‐Go (PAYGO) or cash funding of capital projects is . percent of the
annual Capital Improvement Plan (CIP) up to a maximum of million for the combined utility.
Annual interest earnings on cash balances is . percent.
The number of accounts increases by . percent per year.
The minimum cash balance is days of operating and maintenance (O&M) expense. This is
calculated by dividing the ending cash balance by the annual O&M expenses.
Costs are projected to increase at the general annual inflation rate of . percent.
The analysis includes a bad debt allowance of . percent.
Water and wastewater impact fees will increase to . percent and . percent, respectively, of the
fees as calculated in the impact fee update, effective on July , . Subsequent increases equal
to the regional Producer Price Index (PPI) will take effect on July of each year. An additional
. percent will be added to the PPI increase for the water impact fee in and so that the
ratio of the adopted fee to the calculated fee is the same for water and wastewater.
ES.4.2 Customer Demand Analyses
Carollo analyzed FYE customer billing data to understand how different types of customers use the
water and wastewater systems. This analysis drives the allocation of costs to improve equity among
customers. Figure ES. illustrates the findings of this analysis for single family residential, multifamily
residential, and commercial customers, although the full analysis included all retail and wholesale
customers.
Figure ES. Bill Frequency and Usage Analysis

DRAFT
WATER AND WASTEWATER COST OF SERVICE RATE STUDY | CITY OF HOUSTON
DRAFT | APRIL |
ES.5 Revenue Requirements Analysis
The purpose of the Revenue Requirements Analysis is to determine the adequate and appropriate funding for
the Utility. Revenue requirements are the summation of expenses or costs for providing safe drinking water
and handling wastewater to return clean water to the environment. They are determined on an annual basis,
and they include:
Operations & Maintenance – salaries and benefits, chemicals, power, vehicles, equipment, supplies,
etc. Some costs vary by the volume of treatment such as chemicals and power, but other costs are
fixed and independent of volume such as salaries and vehicles.
Capital Improvements – design and construction of new and replacement infrastructure, including
labor for Houston Water employees and fees for consultants and contractors that perform this work.
Financing – debt service payments, bond issuance costs, commercial paper fees, etc.
In addition to expenses, most debt instruments (bonds and loans) require the utility to keep a certain amount
of cash in reserve dependent upon the amount of the debt. This cash reserve is restricted and cannot be used
to pay for the Utility’s expenses.
ES.5.1 Water System
The study analyzed the revenue requirements to test the fiscal health of the water system, evaluate the
adequacy of current rates and charges, and set the basis for the five‐year rate plan. The revenue requirement
analysis covers the study period FYE through FYE with the primary focus for rate setting given to
the five years, FYE through FYE , of the study period as Houston Water has approved an automatic
rate increase of . percent planned for FYE . Carollo recommends Houston Water increase water rate
revenue according to the following schedule:
July , . percent April , . percent
April , . percent April , . percent
April , . percent April , . percent
ES.5.2 Wastewater System
The study analyzed the revenue requirements to test the fiscal health of the wastewater system, evaluate the
adequacy of current rates and charges, and set the basis for the five‐year rate plan. Like for water, the
wastewater revenue requirement analysis covers the study period FYE through FYE with the
primary focus for rate setting given to the five years, FYE through FYE , of the study period as
Houston Water approved an automatic rate increase of . percent planned for FYE . Carollo
recommends Houston Water increase wastewater rate revenue according to the following schedule:
July , . percent April , . percent
April , . percent April , . percent
April , . percent April , . percent
These recommended increases for both water and wastewater are necessary to fund operational and capital
needs, as well as to meet debt service obligations associated with the CIP.

DRAFT
WATER AND WASTEWATER COST OF SERVICE RATE STUDY | CITY OF HOUSTON
DRAFT | APRIL |
Table ES. summarizes key elements of the revenue requirements for the water and wastewater systems,
including recommended revenue increases.
Table ES. Revenue Requirements for Water and Wastewater Systems ( millions) ( )
Description FYE FYE FYE FYE FYE FYE
Month of Increase April July April April April April April
Water System:
Recommended Revenue Increase
. % . % . % . % . % . % . %
Water Sales with Increase ( )
. . . . . . .
Impact Fee Revenue . . . . . .
O&M Expenses . . . . . .
Capital Improvements . . . . . .
Annualized Revenue Requirement ( )
. . . . . . .
Wastewater System:
Recommended Revenue Increase
. % . % . % . % . % . % . %
Wastewater Sales with Increase ( )
. . . . . . .
Impact Fee Revenue . . . . .
O&M Expenses . . . . .
Capital Improvements . . . . .
Annualized Revenue Requirement ( )
. . . . . . .
Notes: ( ) Values are in million dollars, unless otherwise noted, and are rounded. ( ) Projected annual rate revenue, including recommended revenue increase and all previous recommended revenue increases. ( ) Annualized revenue requirement represents the projected revenue if the recommended increase, as well as all previous recommended
increases, is in effect for the full ‐month period.
ES.5.3 Combined Utility System
Although the study analyzed the water and wastewater systems separately, Houston Water’s financial
performance is measured as a combined utility. The two primary indicators of the utility’s financial health are
the DSCR and the number of days of O&M expenses that can be supported by the cash balance.
Many water and wastewater utilities use revenue bonds to fund a portion of their capital expenses. The DSCR
test measures the ability of a utility to meet both legal and target revenue obligations associated with debt.
To ensure that Houston Water retains financial flexibility for contingencies, it targets higher standards than
the Master Ordinance minimum DSCR requirements of . x for first lien debt and . x for total debt. The
utility’s target DSCR for first lien and junior lien combined is . x, and the target DSCR for total debt is . x.
Carollo recommends Houston Water continue to target . x DSCR for first lien and junior lien but not drop
below . x.

DRAFT
WATER AND WASTEWATER COST OF SERVICE RATE STUDY | CITY OF HOUSTON
DRAFT | APRIL |
The utility’s cash balance indicates its ability to financially sustain operations during unforeseen circumstances
that may restrict its revenues. This is especially important for a utility like Houston Water that is prone to
extreme weather events. Houston Water’s minimum cash balance is equal to days of O&M expenses.
Table ES. summarizes the revenue requirements for the combined system, including cash and DSCR.
Table ES. Combined Utility System Revenue Requirements ( millions) ( )
Description FYE ( ) FYE ( ) FYE FYE FYE FYE
Expenses:
O&M Expenses . . . . . .
Jr./ st Debt Service . . . . . .
Other Debt Service . . . . . .
Cash‐funded CIP . . . . . .
Total Expenses , . , . , . , . , . , .
Plus: Required Debt Coverage ( )
. . . . . .
Plus: Required Cash ( ) . . . . . .
Required Revenue + Cash , . , . , . , . , . , .
Less: Cash Balance ( . ) ( . ) ( . ) ( . ) ( . ) ( . )
Less: Impact Fee Revenue ( . ) ( . ) ( . ) ( . ) ( . ) ( . )
Less: Other Non‐Rate Revenue
( . ) ( . ) ( . ) ( . ) ( . ) ( . )
Less: Rate Revenue (pre‐increase)
( , . ) ( , . ) ( , . ) ( , . ) ( , . ) ( , . )
Rate Revenue (Surplus)/Deficit
( . ) . ( . ) ( . ) . .
Recommended Increase ( ) ‐‐‐ . % . % . % . % . %
Additional Revenue . . . . . .
First/Junior Lien DSCR . x . x . x . x . x . x
Cash (Days O&M)
Annualized Revenue Requirement ( )
, . , . , . , . , . , .
Notes: ( ) Values are in million dollars, unless otherwise indicated, and are rounded. ( ) FYE values are based on FYE budget. ( ) FYE through FYE values are projected based on FYE budget. ( ) Debt service coverage is a revenue requirement, but not a cash expense. This revenue may be used to pay for cash‐funded CIP or debt
service payments (not junior or first lien since the coverage shown is to cover these bonds). As such, the required debt coverage shown may be reduced from the full % of the junior/first debt service payment to avoid double‐counting revenue requirements.
( ) Required cash is equal to days of O&M expenses. ( ) Recommended increase shown for FYE includes the July , , and the April , , increases, as shown in Table ES. . ( ) Annualized revenue requirement represents the projected revenue if the recommended increase, as well as all previous recommended
increases, is in effect for the full ‐month period.

DRAFT
WATER AND WASTEWATER COST OF SERVICE RATE STUDY | CITY OF HOUSTON
DRAFT | APRIL |
Figure ES. shows the year‐end cash balance from FYE . Year‐end balances for FYE through FYE
are projected with and without the recommended revenue increases.
Figure ES. Projected Cash Balance (Days of O&M)

DRAFT
WATER AND WASTEWATER COST OF SERVICE RATE STUDY | CITY OF HOUSTON
DRAFT | APRIL |
Figure ES. shows the DSCR from FYE . DSCRs for FYE through FYE are projected with and
without the recommended revenue increases.
Figure ES. Projected Debt Service Coverage Ratio
ES.6 Cost of Service Analysis
The cost of service analysis serves as a rational basis for distributing the full costs of Houston Water’s services
to each customer type in proportion to the demands placed on the system. The analysis is typically completed
in three steps:
. Allocate costs to functional categories (e.g., water production, pumping, collection system).
. Allocate functionalized costs to rate components:
a. Water – base, extra capacity, customer.
b. Wastewater – flow, loadings, customer.
. Allocate costs to customer types using rate component unit costs.
The study followed this approach to develop a detailed cost allocation that serves as the basis for the proposed
rate adjustments. This analysis yields an appropriate method for allocating costs, which could be sustained
unless substantial changes in cost drivers or customer consumption patterns occur.

DRAFT
WATER AND WASTEWATER COST OF SERVICE RATE STUDY | CITY OF HOUSTON
DRAFT | APRIL |
ES.6.1 Water System
The cost of service analysis is consistent with the AWWA M Manual Principles of Water Rates, Fees and
Charges, Seventh Edition, standard methods to allocate the revenue requirements among the various
customer types based on their usage characteristics. Table ES. summarizes the results of the water cost of
service analysis.
Table ES. Water System Cost of Service Results ( millions) ( )
Customer Type FYE FYE FYE FYE FYE
Month of Increase July April April April April April
Retail:
Single Family Residential . . . . . .
Multifamily Residential . . . . . .
Commercial/Industrial . . . . . .
Irrigation . . . . . .
Transient . . . . . .
Resale . . . . . .
Emergency Backup . . . . . .
Metered Fire . . . . . .
Unmetered Fire . . . . . .
Wholesale:
Contract Treated with Airgap
. . . . . .
Contract Treated without Airgap
. . . . . .
GRP Participants . . . . . .
Contract Water – Untreated
. . . . . .
Contract Treated – SEWPP Co‐participants
. . . . . .
Contract Treated – EWPP Water Authorities
. . . . . .
Contract Treated – NEWPP Water Authorities
. . . . . .
Total Revenue Requirements
. . . . . .
Note: ( ) Values are in million dollars and are rounded.
ES.6.2 Wastewater System
The cost‐of‐service analysis is consistent with the WEF Manual of Practice No. , Financing and Charges for
Wastewater Systems, standard methods to allocate the revenue requirements among the various customer
types based on their wastewater contributions. The results of the wastewater cost of service analysis are
summarized in Table ES. .

DRAFT
WATER AND WASTEWATER COST OF SERVICE RATE STUDY | CITY OF HOUSTON
DRAFT | APRIL |
Table ES. Wastewater System Cost of Service Results ( millions) ( )
Customer Type FYE FYE FYE FYE FYE
Month of Increase July April April April April April
Retail:
Single Family Residential . . . . . .
Multifamily Residential . . . . . .
Commercial . . . . . .
Industrial Surcharge . . . . . .
Sewer Only (Unmetered) . . . . . .
Wholesale:
Capital without Collection System
. . . . . .
No Capital with Collection System
. . . . . .
Connection‐based . . . . . .
Total Revenue Requirements
. . . . . .
Note: ( ) Values are in million dollars and are rounded.
ES.7 Rate Design
Carollo worked with Houston Water staff to analyze various adjustments with the goals of simplifying the
water and wastewater rate structures and improving equity and understanding among customers. The
allocated revenue requirements serve as the basis for the rate design, although some accommodations were
made to improve affordability, especially as the proposed rates transition toward cost‐of‐service. Existing
rates shown are FYE rates, which went into effect on April , .
ES.7.1 Water System
The water rate design analysis determines rates required to achieve cost recovery, proportionately for each
customer. Houston Water’s existing rate structure consists of two components: a volumetric rate (variable)
and a monthly meter charge (fixed). The volumetric component is assessed based on metered water usage
per , gallons (kgal) and, by design, is intended to recover the cost incurred for delivering each unit of
water. The monthly meter charge is intended to recognize that the utility incurs fixed costs to provide the
availability of water service, which must be recovered independent of monthly water demands and
consumption.
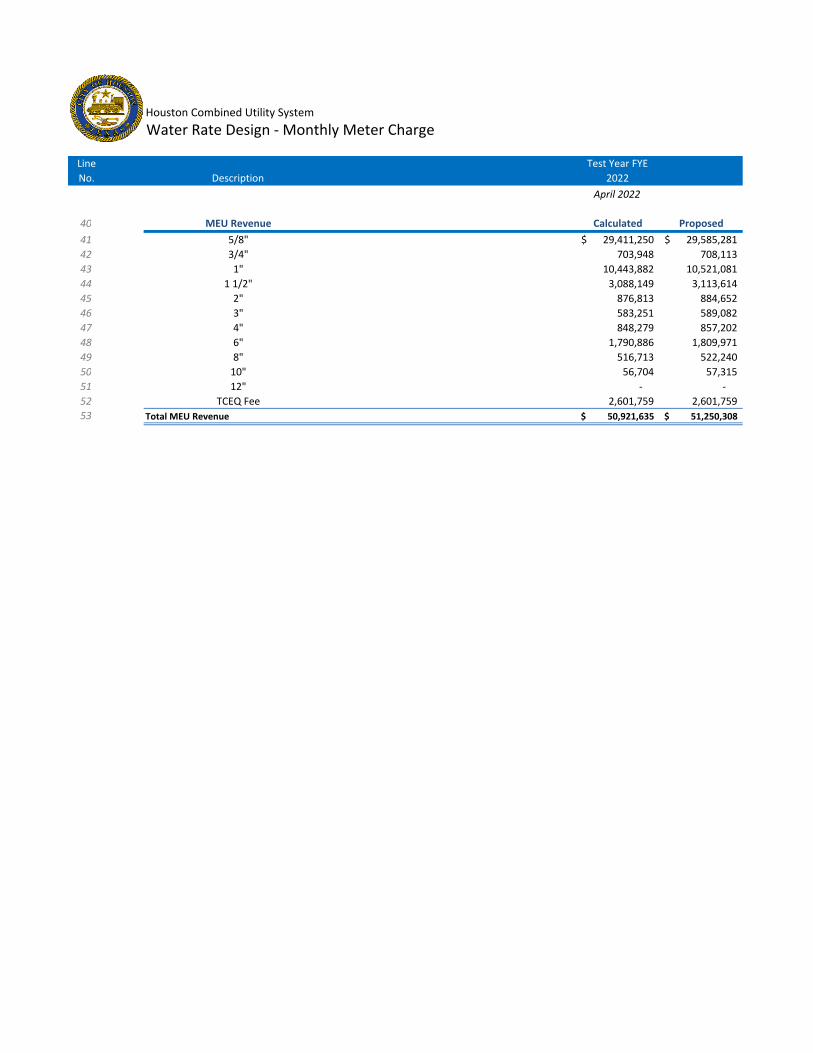
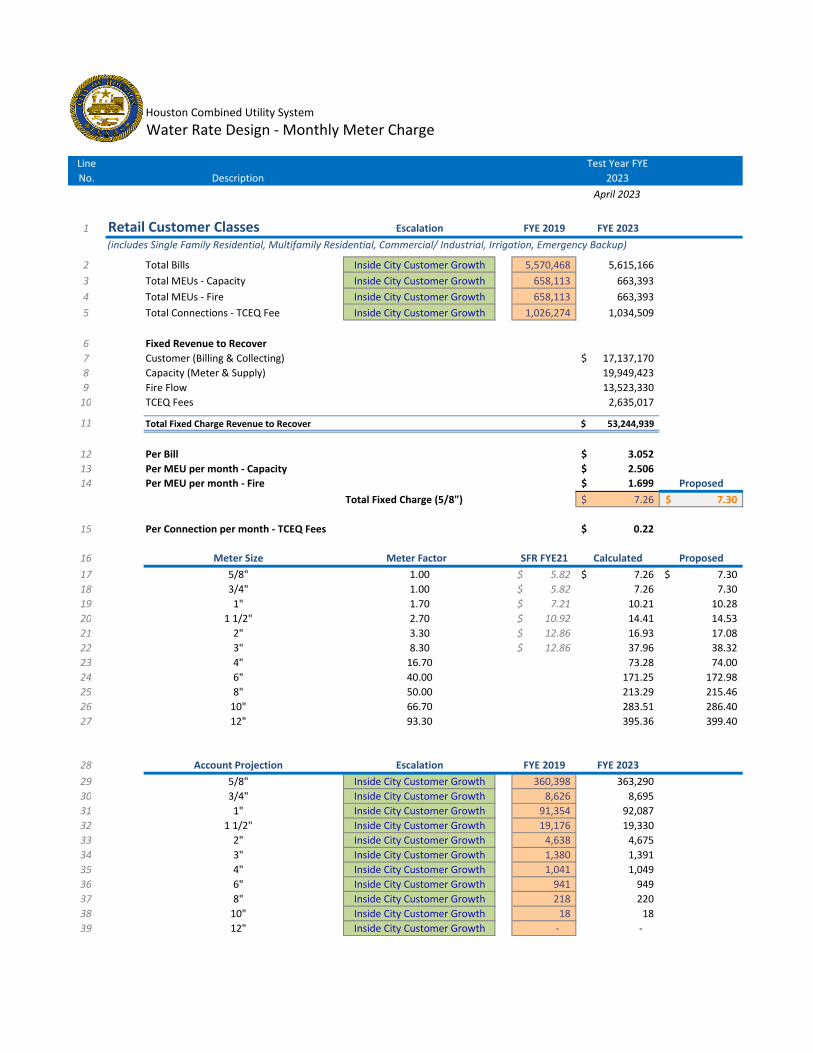
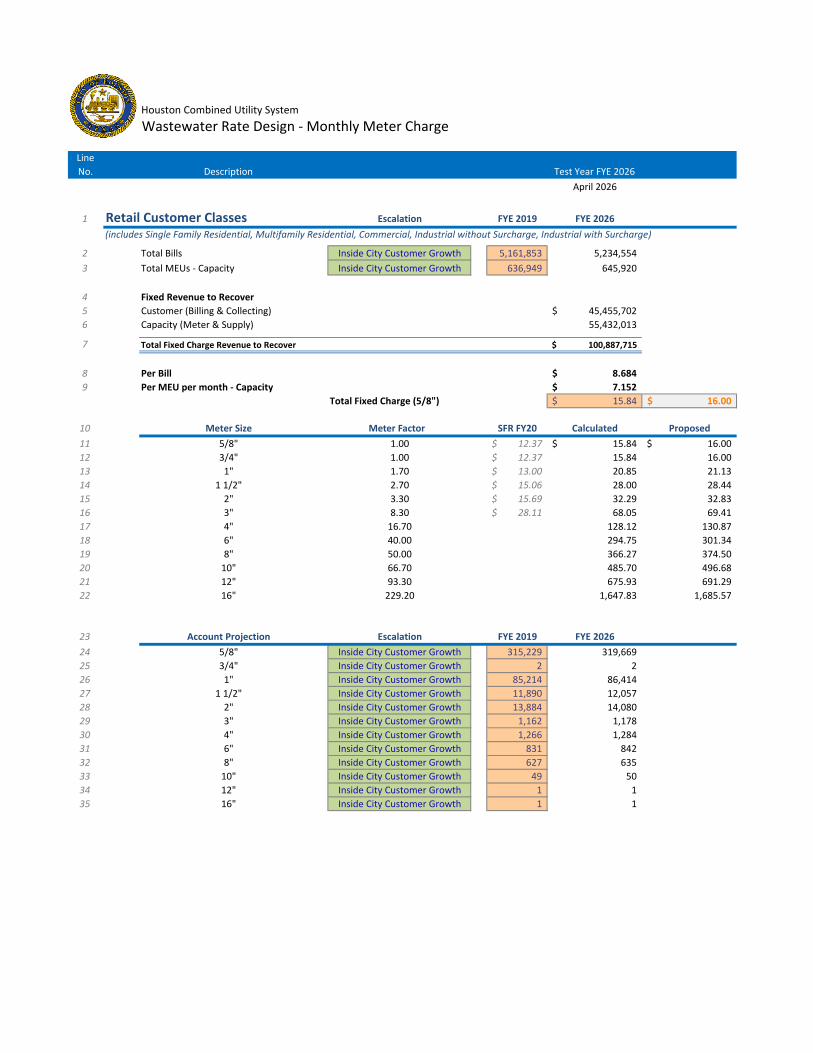
ES.7.1.1 Monthly Meter Charge
By design, the monthly meter charge includes a customer component and a capacity component based on
meter size. The customer component recovers expenses associated with billing, collection, and customer
service. This component is the same for all customers regardless of meter size. The capacity component
captures maintenance costs related to meters and services, as well as a portion of the water system capital
costs. This component varies based on meter size to reflect the difference in potential demand that can be
placed on the system by different sized meters. The capacity charge is then added to the customer unit cost
to calculate the total monthly meter charge.

DRAFT
WATER AND WASTEWATER COST OF SERVICE RATE STUDY | CITY OF HOUSTON
DRAFT | APRIL |
In addition to the monthly meter charge, the study recommends a second fixed monthly charge, which would
be assessed per connection, to equitably recover the annual fee paid to the Texas Commission on
Environmental Quality (TCEQ).
Residential, Commercial, Industrial, Irrigation, and Emergency Backup Customers
Table ES. shows the existing monthly meter charges, which vary by customer type and meter size.
Table ES. Existing Water Monthly Meter Charges by Customer Type
Meter Size SFR MFR Com/Ind Irrigation Emergency
/ ” . . . . .
/ ” . . . . .
” . . . . .
½” . . . . .
” . . . . .
” . . . . .
” ‐‐‐ . . . .
” ‐‐‐ . . , . .
” ‐‐‐ . . , . .
” ‐‐‐ . . , . .
Notes: ( ) SFR is Single Family Residential ( ) MFR is Multifamily Residential
Table ES. summarizes the proposed monthly meter charges for the study period, which vary by meter size.
Carollo recommends charging the same monthly meter charge for single family and multifamily residential,
commercial/industrial, irrigation, and emergency backup rather than varying them by customer type.
Table ES. Proposed Water Monthly Meter Charges
Meter Size FYE FYE FYE FYE FYE
Month of Increase July April April April April April
/ ” . . . . . .
/ ” . . . . . .
” . . . . . .
½” . . . . . .
” . . . . . .
” . . . . . .
” . . . . . .
” . . . . . .
” . . . . . .
” . . . . . .
” . . . . . .
TCEQ Fee per connection . . . . . .
Note: ( ) Monthly meter charges shown are proposed for single family residential, multifamily residential, commercial/industrial, irrigation, and
emergency backup customers.

DRAFT
WATER AND WASTEWATER COST OF SERVICE RATE STUDY | CITY OF HOUSTON
DRAFT | APRIL |
Transient, Resale, and Fire Customers. Houston Water has several other customer types receiving water
service, and these customers are charged different monthly meter charges based on customer type and meter
size. Table ES. shows existing and proposed monthly meter charges for these other customer types.
Table ES. Existing and Proposed Water Monthly Meter Charges – Transient, Resale, and Fire Customers
Meter Size Existing FYE FYE FYE FYE FYE
Month of Increase July April April April April April
Transient:
” . . . . . . .
” . . . . . . .
” . . . . . . .
Resale:
/ ” and / " . . . . . . .
” . . . . . . .
½” . . . . . . .
” . . . . . . .
” . . . . . . .
” . . . . . . .
” . . . . . . .
” , . , . , . , . , . , . , .
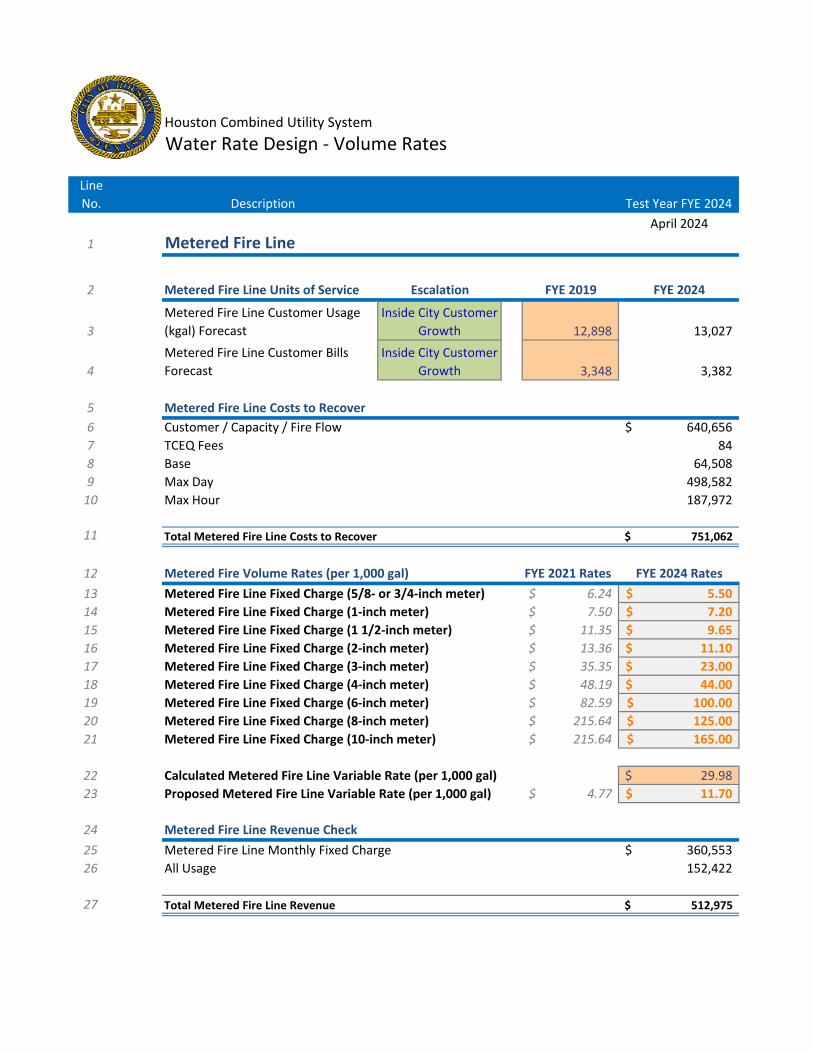
Metered Fire:
/ ” . . . . . . .
/ ” . . . . . . .
” . . . . . . .
½” . . . . . . .
” . . . . . . .
” . . . . . . .
” . . . . . . .
” . . . . . . .
” . . . . . . .
” . . . . . . .
DRAFT
WATER AND WASTEWATER COST OF SERVICE RATE STUDY | CITY OF HOUSTON
DRAFT | APRIL |
Meter Size Existing FYE FYE FYE FYE FYE
Month of Increase July April April April April April
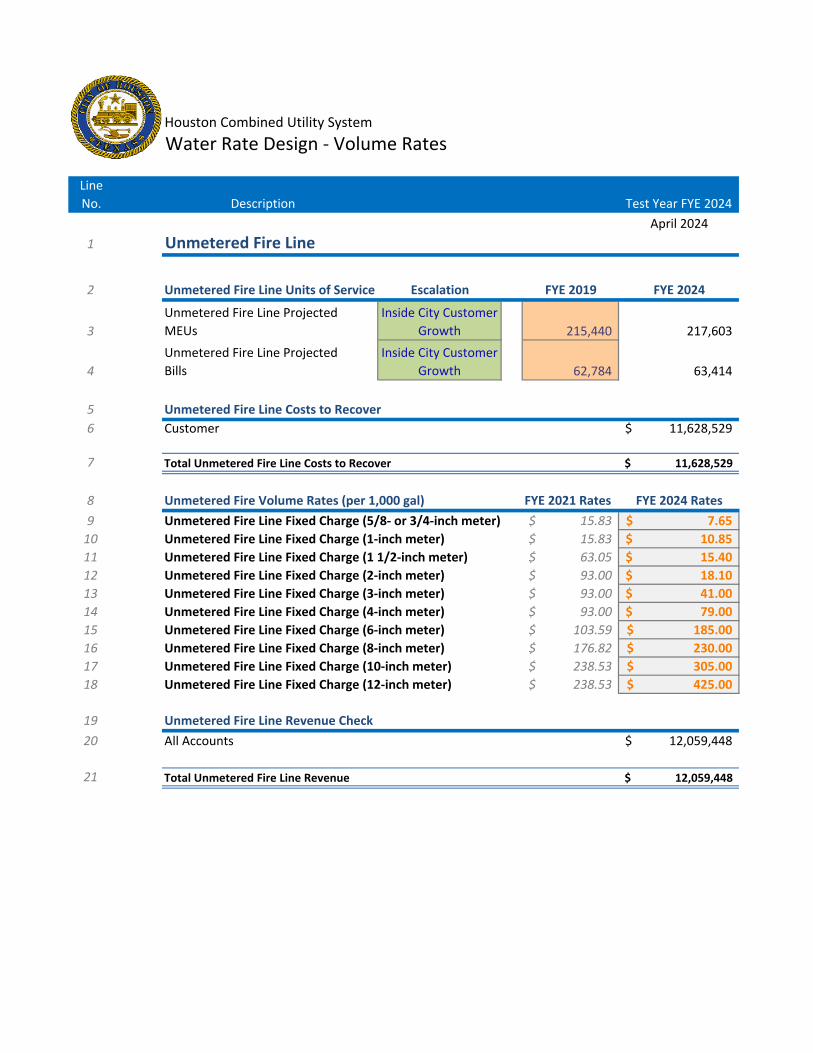
Unmetered Fire ( ):
/ ” and / " . . . . . . .
” . . . . . . .
½” . . . . . . .
” . . . . . . .
” . . . . . . .
” . . . . . . .
” . . . . . . .
” . . . . . . .
” . . . . . . .
” . . . . . . .
Note: ( ) Monthly meter charges for unmetered fire customers are based on the size of the service line.
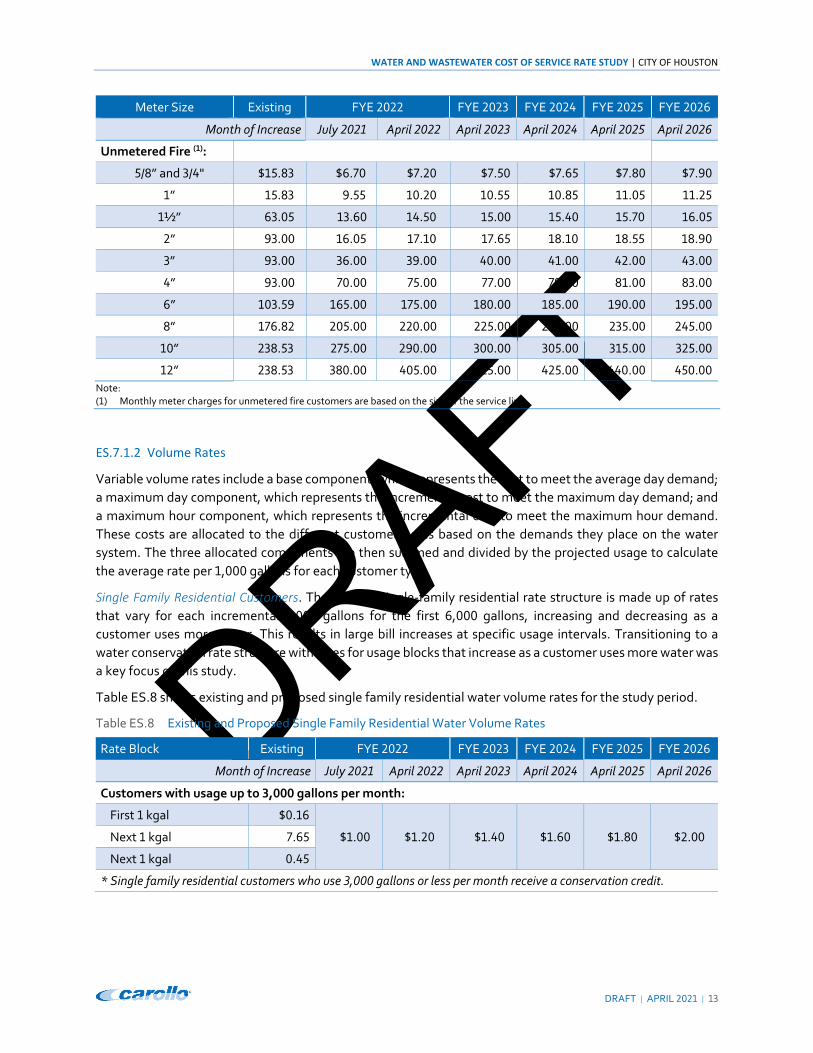
ES.7.1.2 Volume Rates
Variable volume rates include a base component, which represents the cost to meet the average day demand;
a maximum day component, which represents the incremental cost to meet the maximum day demand; and
a maximum hour component, which represents the incremental cost to meet the maximum hour demand.
These costs are allocated to the different customer types based on the demands they place on the water
system. The three allocated components are then summed and divided by the projected usage to calculate
the average rate per , gallons for each customer type.
Single Family Residential Customers. The existing single‐family residential rate structure is made up of rates
that vary for each incremental , gallons for the first , gallons, increasing and decreasing as a
customer uses more water. This results in large bill increases at specific usage intervals. Transitioning to a
water conservation rate structure with rates for usage blocks that increase as a customer uses more water was
a key focus of this study.
Table ES. shows existing and proposed single family residential water volume rates for the study period.
Table ES. Existing and Proposed Single Family Residential Water Volume Rates
Rate Block Existing FYE FYE FYE FYE FYE
Month of Increase July April April April April April
Customers with usage up to , gallons per month:
First kgal .
. . . . . . Next kgal .
Next kgal .
* Single family residential customers who use , gallons or less per month receive a conservation credit.

DRAFT
WATER AND WASTEWATER COST OF SERVICE RATE STUDY | CITY OF HOUSTON
DRAFT | APRIL |
Rate Block Existing FYE FYE FYE FYE FYE
Month of Increase July April April April April April
Customers with usage in excess of , gallons per month:
First kgal .
. . . . . .
Next kgal .
Next kgal .
Next kgal .
Next kgal .
Next kgal .
Next kgal . . . . . . .
Next kgal . . . . . . .
Over kgal . . . . . . .
To calculate the monthly water bill, customers add the appropriate monthly meter charge from Table ES.
(existing charges) or Table ES. (proposed charges) and add the volume rate for each incremental , ‐gallon unit from Table ES. . Table ES. shows existing and proposed monthly water bills for single family
residential customers with usage up to , gallons in one month.
Table ES. Existing and Proposed Single Family Residential Bills – Water Only
Billed Usage Existing FYE FYE FYE FYE FYE
Month of Increase July April April April April April
Meter Charge only . . . . . . .
, gallons . . . . . . .
, gallons . . . . . . .
, gallons . . . . . . .
, gallons . . . . . . .
, gallons . . . . . . .
, gallons . . . . . . .
Figure ES. illustrates the existing and proposed single family residential water rates and bills for the first
, gallons in , ‐gallon increments.

DRAFT
WATER AND WASTEWATER COST OF SERVICE RATE STUDY | CITY OF HOUSTON
DRAFT | APRIL |
Figure ES. Existing and Proposed Single Family Residential Water Rates and Bills
Other Retail Customer Types. With the exception of irrigation customers, all other retail customer types pay a
uniform rate per , gallons for all usage, which varies by customer type. Irrigation customers pay a reduced
rate for a “defined quantity” of water that is set based on their meter size; all usage in excess of that amount
is assessed a higher rate. Carollo recommends Houston Water continue to charge uniform rates for all retail
customer types other than single family residential, including irrigation.

DRAFT
WATER AND WASTEWATER COST OF SERVICE RATE STUDY | CITY OF HOUSTON
DRAFT | APRIL |
Table ES. shows existing and proposed volume rates for all retail customer types except single family
residential.
Table ES. Existing and Proposed Retail Water Volume Rates
Customer Type
Rate Block
Existing FYE FYE FYE FYE FYE
Month of Increase July April April April April April
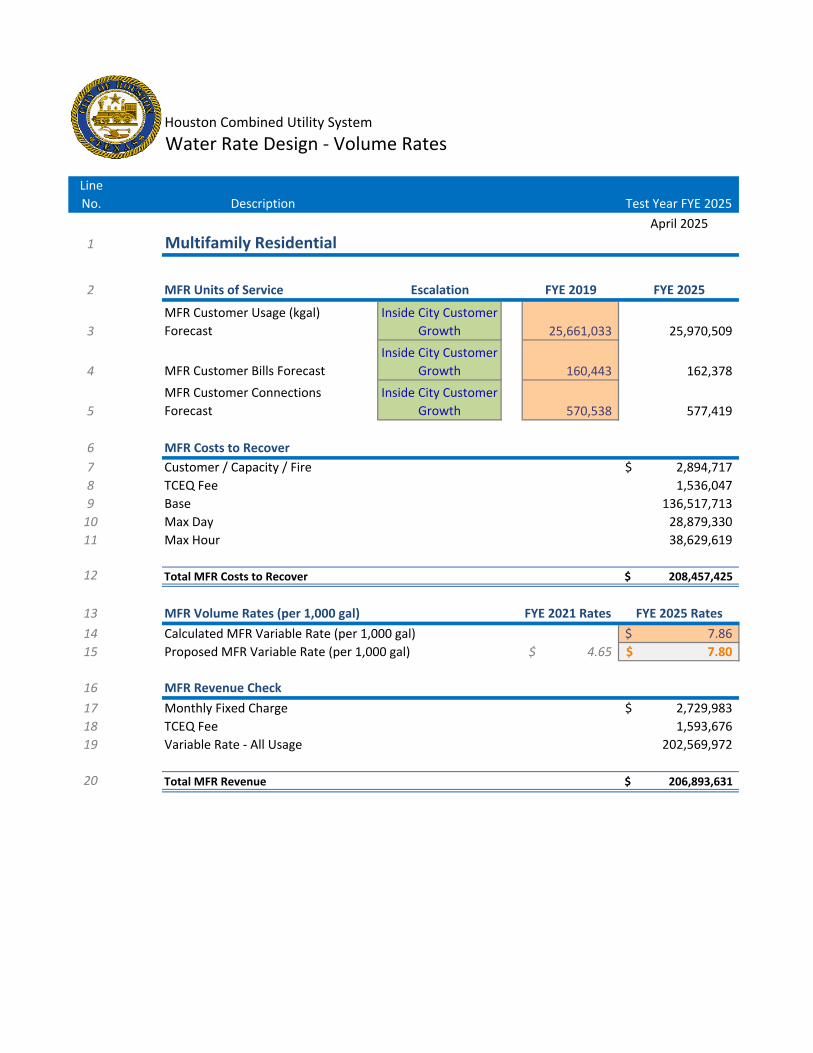
Multifamily Residential
All Usage . . . . . . .
Commercial/ Industrial
All Usage . . . . . . .
Irrigation ( )
Block . ‐‐‐ ‐‐‐ ‐‐‐ ‐‐‐ ‐‐‐ ‐‐‐
Block . ‐‐‐ ‐‐‐ ‐‐‐ ‐‐‐ ‐‐‐ ‐‐‐
All Usage ‐‐‐ . . . . . .
Transient All Usage . . . . . . .
Resale All Usage . . . . . . .
Emergency Backup
All Usage . . . . . . .
Metered Fire All Usage . . . . . . .
Note: ( ) Irrigation customers with meters larger than inch receive a “defined quantity” of water at a reduced Block rate. The defined quantity
is based on the meter size. Irrigation customers with ‐inch or smaller meters do not receive any water at the reduced Block rate.
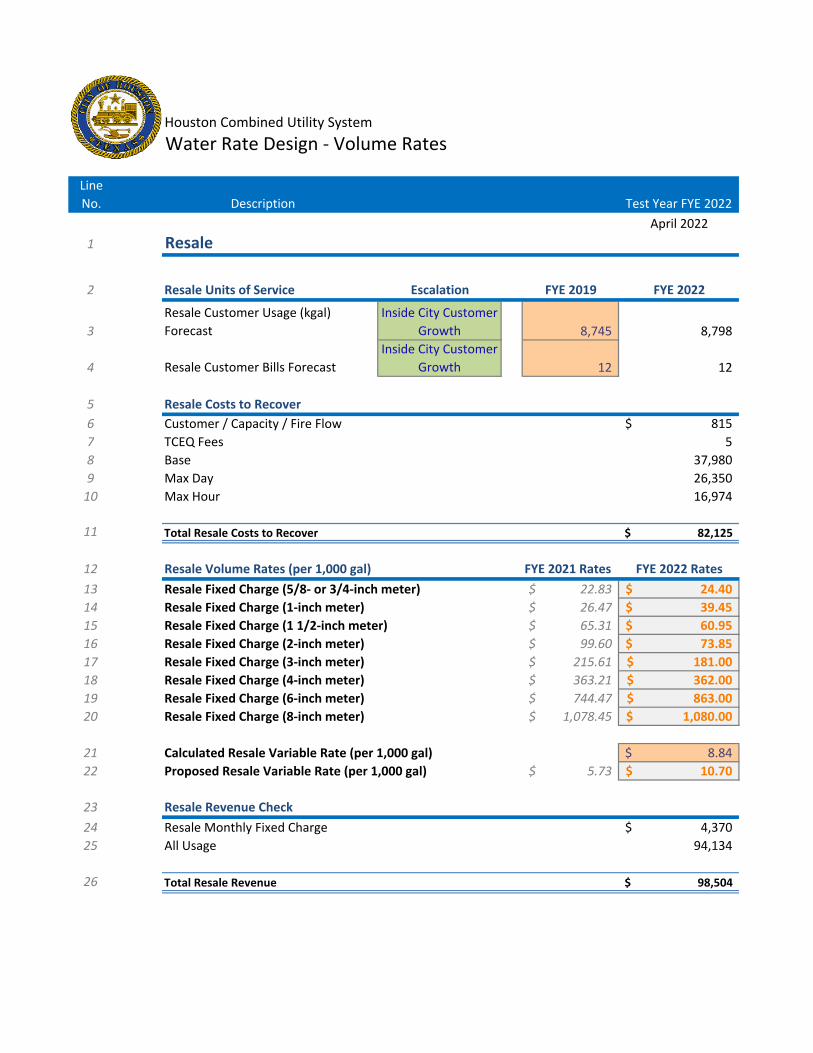
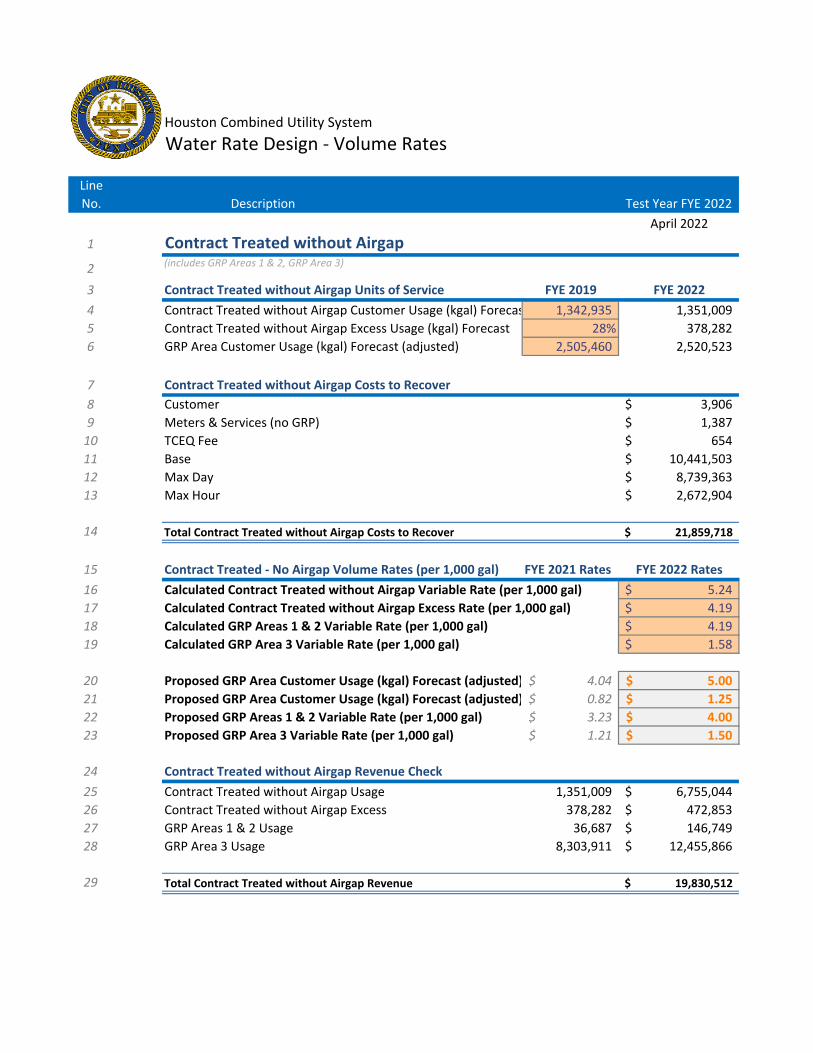
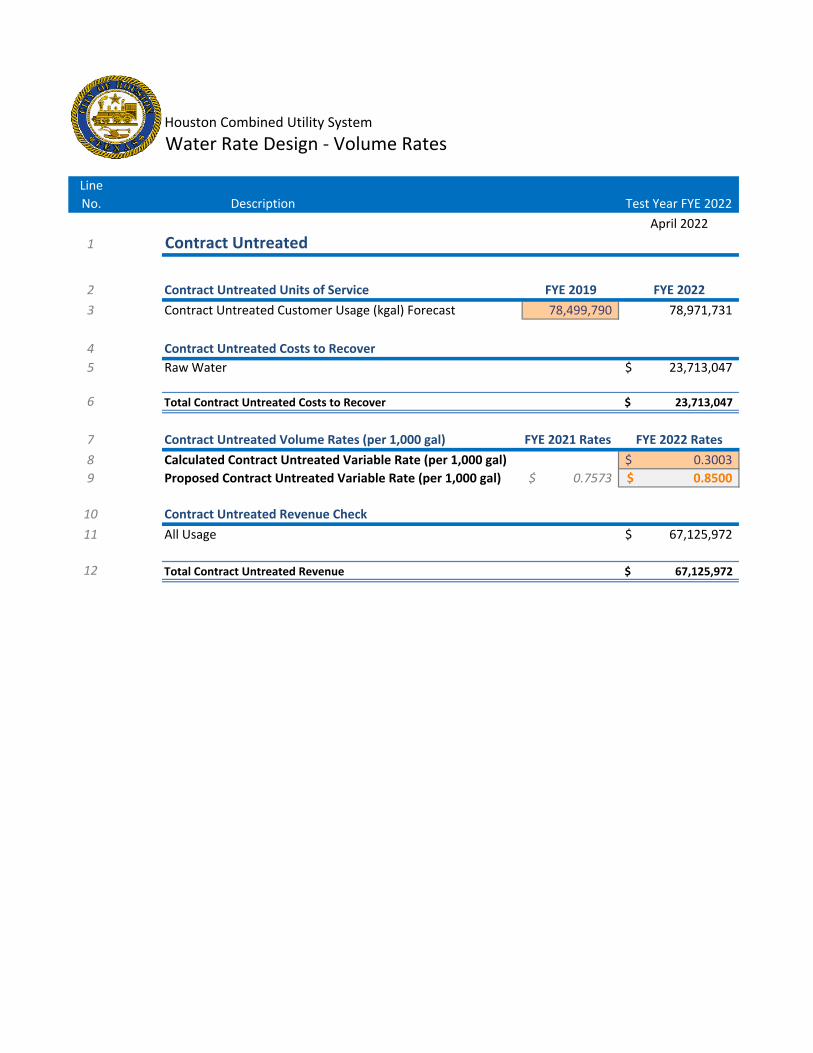
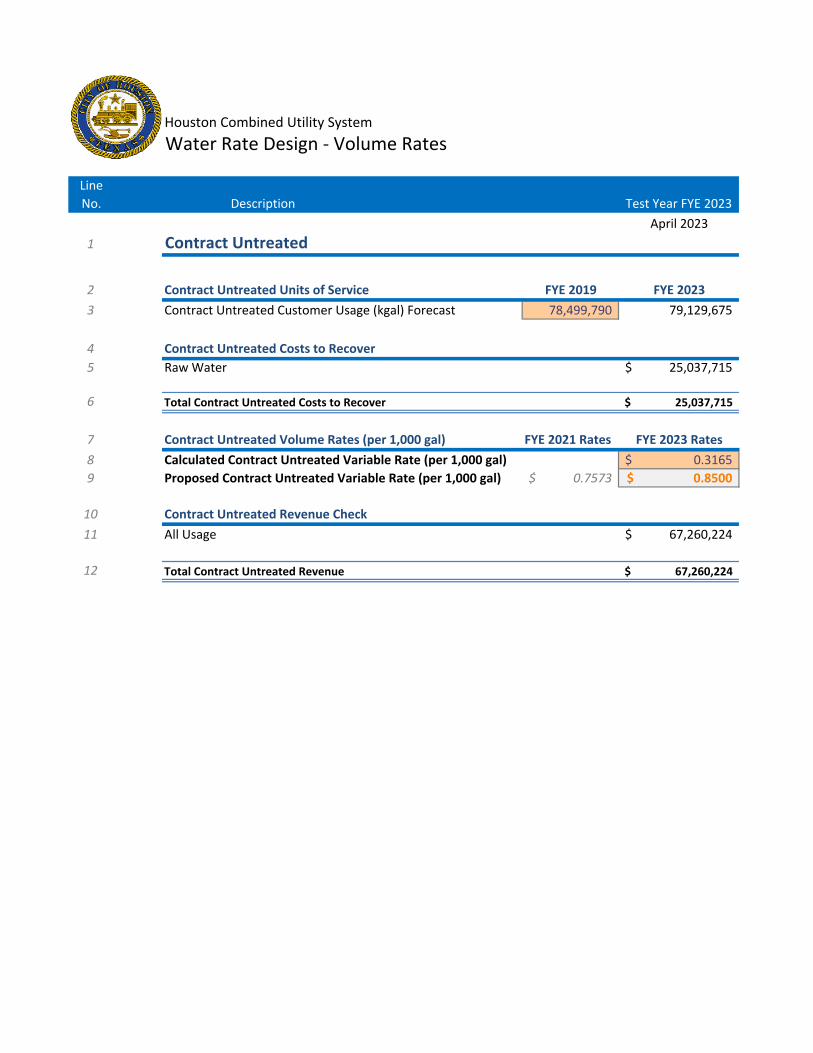
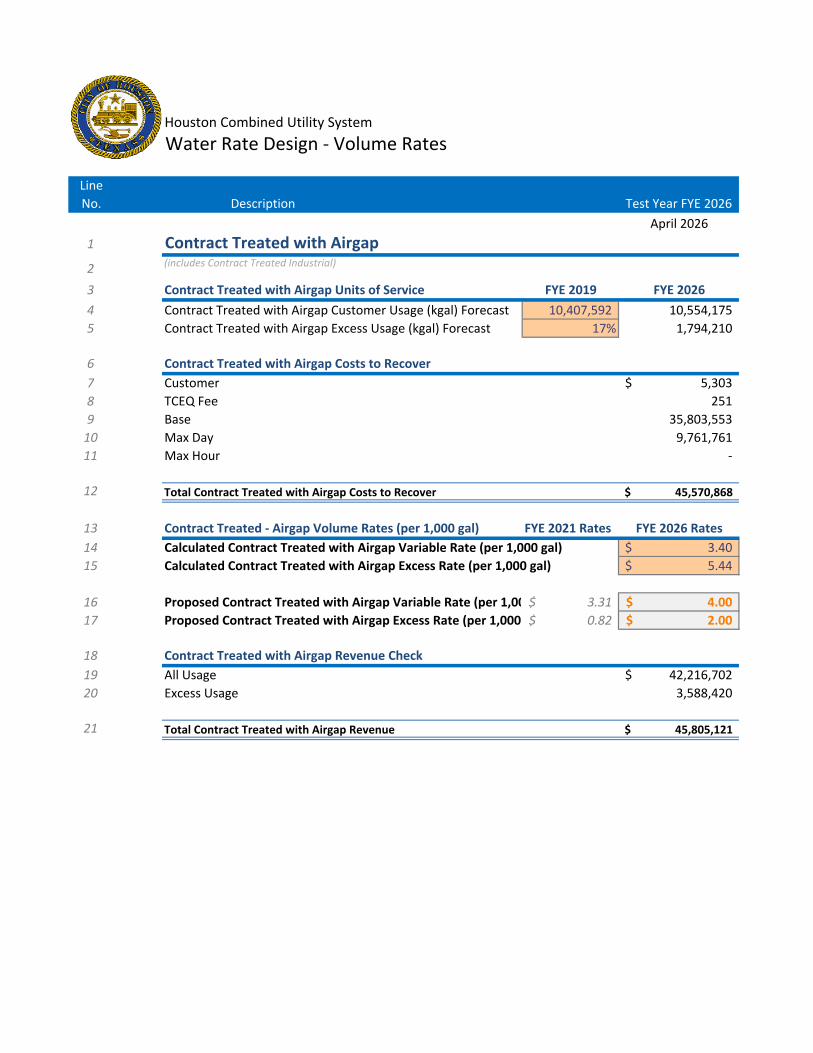
The study recommends maintaining the wholesale and contract customers’ rate structures. Contract Treated
Water customers pay a uniform rate for all usage and an excess surcharge for all usage above their contract
minimum volume. Groundwater Reduction Plan (GRP) customers’ rate is based on the Contract Treated Water
– No Airgap rate although it is reduced based on the required groundwater reduction for each Area. Areas
and pay percent of the Contract Treated rate, and Area currently pays percent, but that increases to
percent in FYE . These rates, as well as the Contract Untreated rate, are shown in Table ES. .
Table ES. Existing and Proposed Wholesale Water Volume Rates
Customer Type
Rate Block
Existing FYE FYE FYE FYE FYE
Month of Increase July April April April April April
Contract w/Airgap
Minimum . . . . . . .
Excess . . . . . . .
Contract w/o Airgap
Minimum . . . . . . .
Excess . . . . . . .
GRP Areas &
All Usage . . . . . . .
GRP Area All Usage . . . . . . .
Contract Untreated
All Usage . . . . . . .

DRAFT
WATER AND WASTEWATER COST OF SERVICE RATE STUDY | CITY OF HOUSTON
DRAFT | APRIL |
ES.7.2 Wastewater System
The wastewater rate design analysis determines rates required to achieve cost recovery, proportionately for
each customer. Like the water rates, Houston Water’s existing wastewater rate structure consists of two
components: a volumetric rate (variable) and a monthly service charge (fixed). The volumetric component is
assessed based on metered water usage per , gallons and, by design, is intended to recover the cost
incurred for collecting and treating each unit of wastewater. The monthly service charge is intended to
recognize that the utility incurs fixed costs to provide the availability of wastewater service, which must be
recovered independent of monthly wastewater flow.
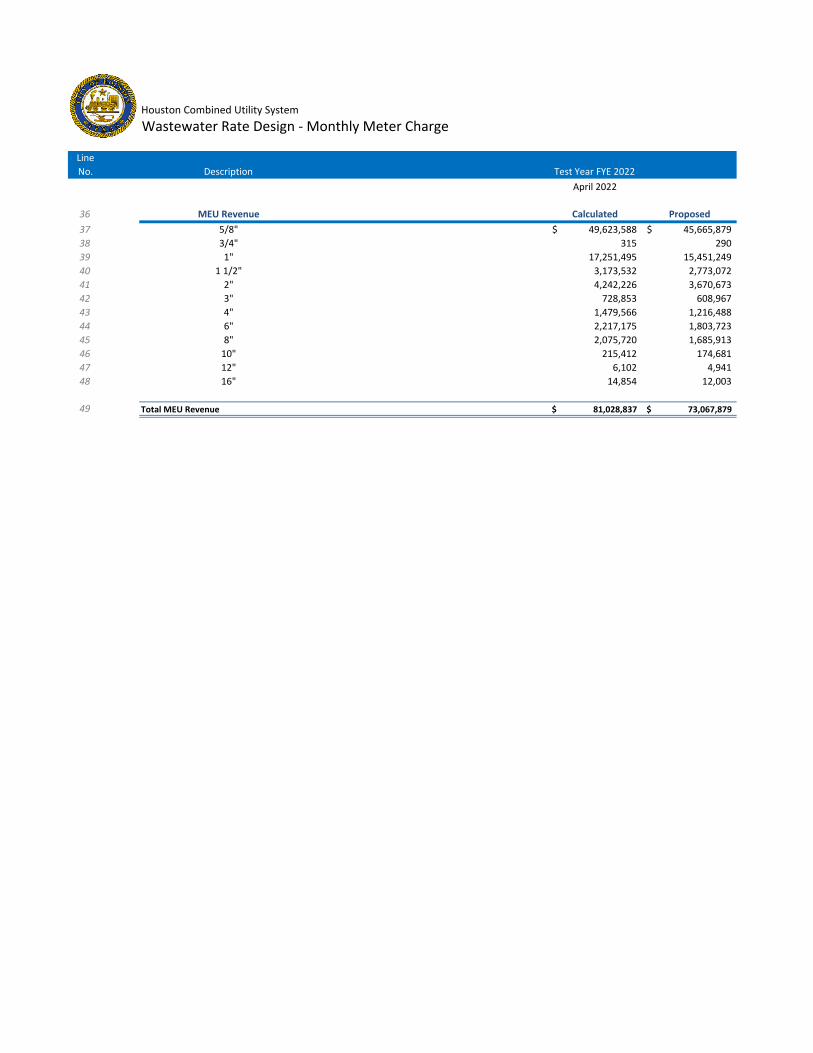
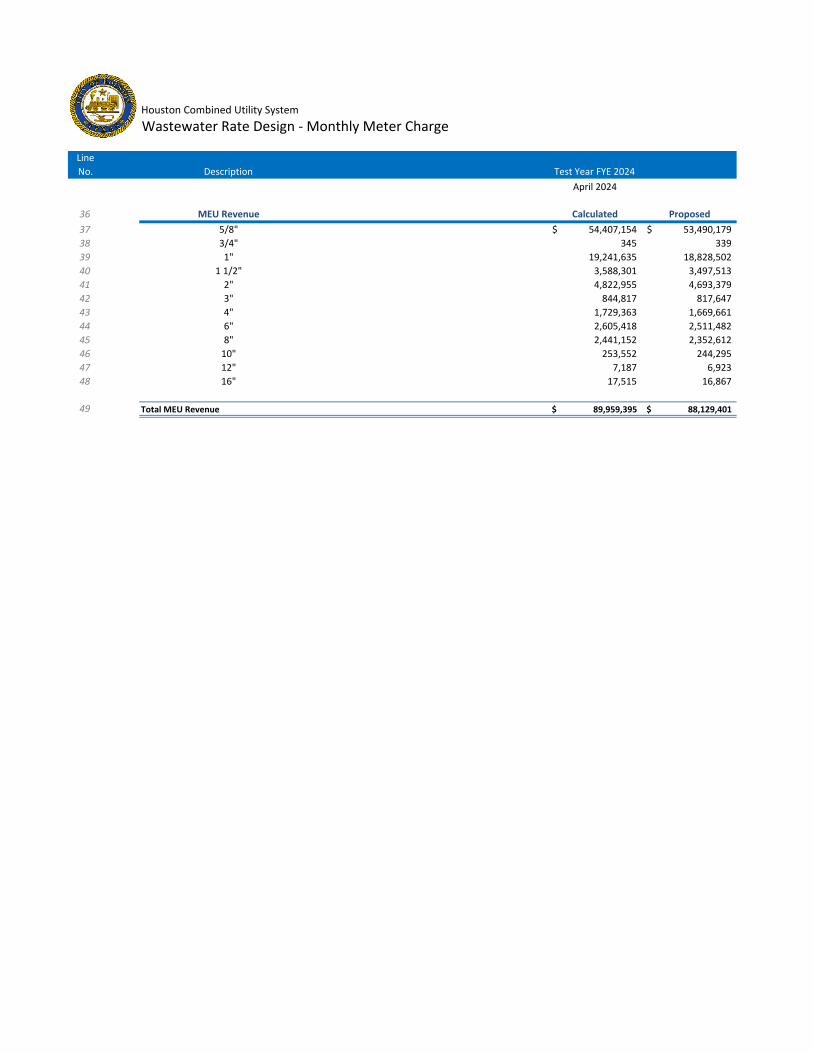
ES.7.2.1 Monthly Meter Charge
By design, the monthly meter charge includes a customer component and a capacity component based on
water meter size. The customer component recovers expenses associated with billing, collection, and
customer service. This component is the same for all customers regardless of meter size. The capacity
component captures a portion of the wastewater system capital costs. This component varies based on water
meter size to reflect the difference in potential flow that can be discharged to the system by customers with
different sized water meters. The capacity charge is then added to the customer unit cost to calculate the total
monthly meter charge.
Residential, Commercial, and Industrial Customers. Table ES. shows the existing monthly meter charges by
customer type and water meter size.
Table ES. Existing Wastewater Monthly Meter Charges by Customer Type
Meter Size SFR MFR) Commercial Industrial
/ ” . . . .
/ ” . . . .
” . . . .
½” . . . .
” . . . .
” . . . .
” ‐‐‐ . . .
” ‐‐‐ . . .
” ‐‐‐ . . .
” ‐‐‐ . . .
Notes: ( ) SFR is Single Family Residential. ( ) MFR is Multifamily Residential. ( ) Monthly meter charges for industrial customers in this table are for all industrial customers, including those who pay surcharges.
Table ES. summarizes the proposed monthly meter charges for the study period, by water meter size, for
single family residential, multifamily residential, commercial, and industrial (with and without surcharges)
customers.

DRAFT
WATER AND WASTEWATER COST OF SERVICE RATE STUDY | CITY OF HOUSTON
DRAFT | APRIL |
Table ES. Proposed Wastewater Monthly Meter Charges
Meter Size FYE FYE FYE FYE FYE
Month of Increase July April April April April April
/ ” . . . . . .
/ ” . . . . . .
” . . . . . .
½” . . . . . .
” . . . . . .
” . . . . . .
” . . . . . .
” . . . . . .
” . . . . . .
” . . . . . .
” . . . . . .
” . . , . , . , . , . Note: ( ) Monthly meter charges shown are proposed for single family residential, multifamily residential, commercial, and industrial customers,
including those who pay surcharges.
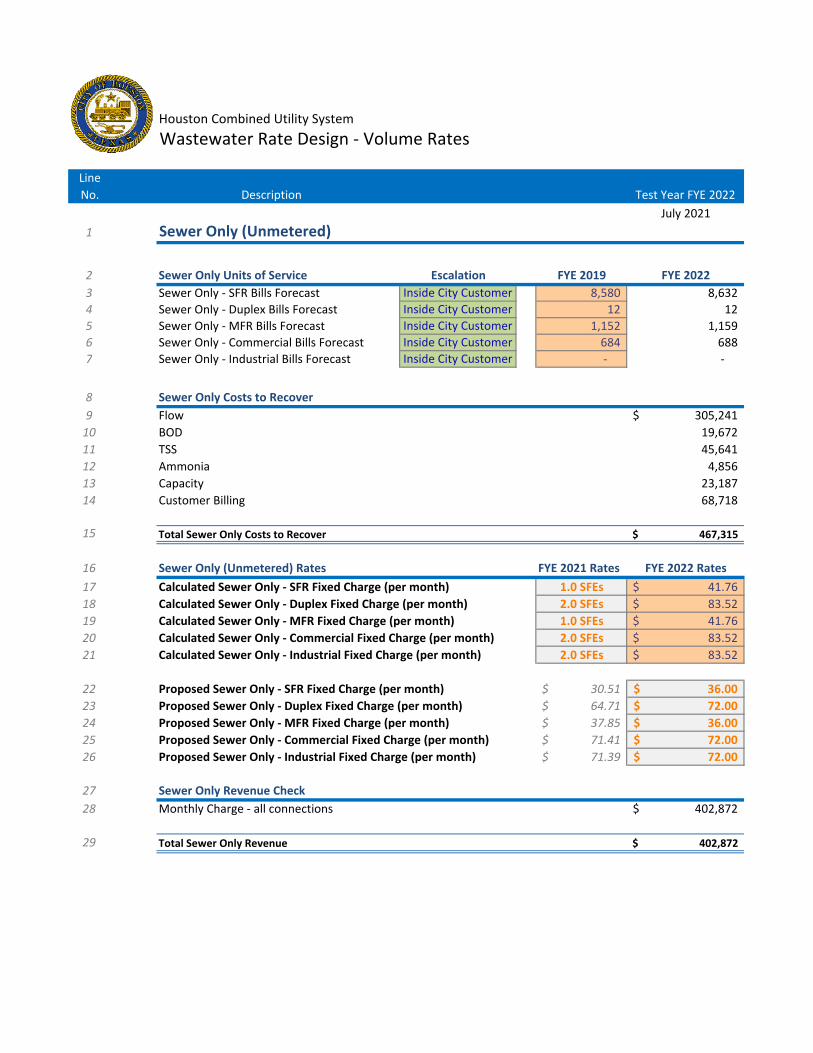
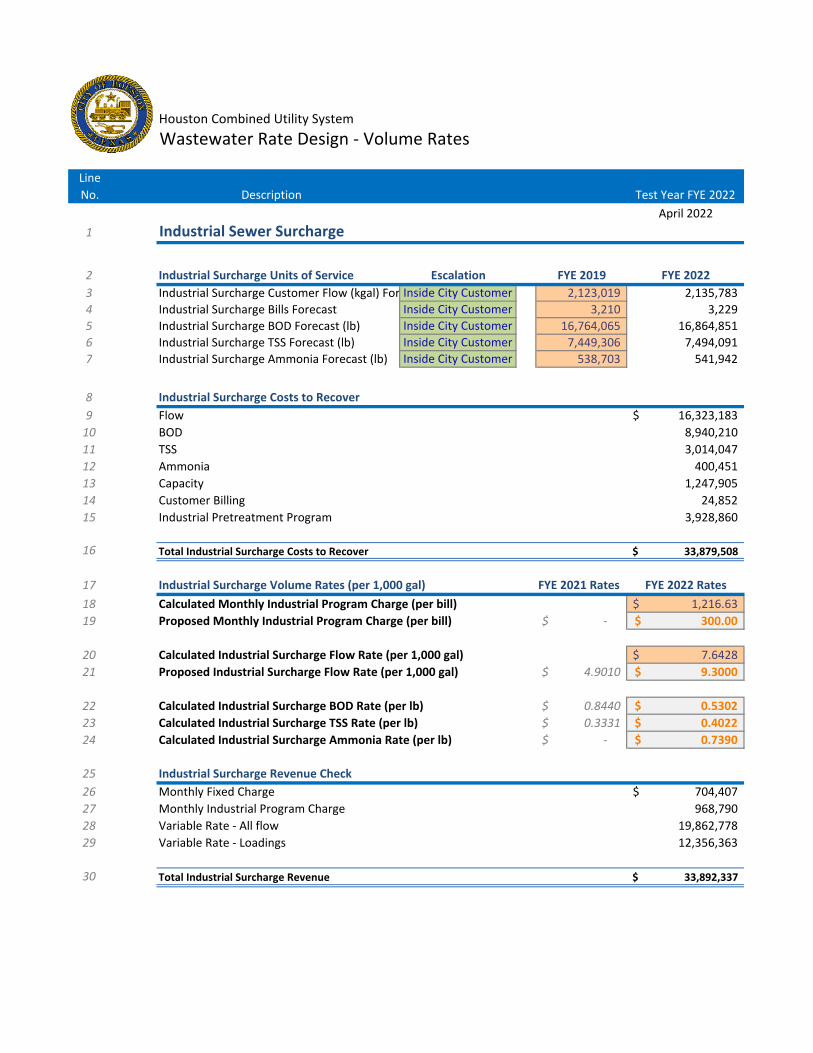
Industrial Surcharge and Sewer Only (Unmetered) Customers. Houston Water manages an Industrial
Wastewater Program for permitted industrial customers who discharge high‐strength wastewater into the
system. These customers are sampled regularly and pay surcharges based on the loadings concentrations of
their sampled wastewater. As part of the cost of service rate study, Carollo worked with Houston Water staff
to identify and isolate the cost of this program and allocate it to the industrial surcharge customers. The study
recommends implementation of an Industrial Program Charge, which would be added to the industrial
surcharge customers’ bills, in addition to the monthly service charge, to pay for the cost of the program. The
recommended charges in Table ES. show a phase‐in of this charge over the ‐year study period. Table ES.
also shows proposed monthly program charges for sewer only customers, which are based on customer type.
Table ES. Existing and Proposed Wastewater Monthly Service Charges – Industrial Customers with Surcharges
and Sewer Only Customers
Meter Size Existing FYE FYE FYE FYE FYE
Month of Increase July April April April April April
Industrial with Surcharge:
Industrial Program ‐‐‐ . . . . , . , .
Sewer Only:
Single Family Res. . . . . . . .
Duplex . . . . . . .
Multifamily Res. . . . . . . .
Commercial . . . . . . .
Industrial . . . . . . . Note: ( ) Charges shown for sewer only customers are monthly, but sewer only customers are billed and will continue to be billed bimonthly. The
existing multifamily charge is per unit for multifamily accounts with or more units. The existing commercial and industrial charges are per unit as defined in § ‐ .

DRAFT
WATER AND WASTEWATER COST OF SERVICE RATE STUDY | CITY OF HOUSTON
DRAFT | APRIL |
ES.7.2.2 Volume Rates
Variable volume rates include a flow component, which represents the cost to collect and treat wastewater
flow; a biochemical oxygen demand (BOD) component, which represents the cost to treat BOD; a total
suspended solids (TSS) component, which represents the cost to treat TSS; and an ammonia component,
which represents the cost to treat ammonia. These costs are allocated to the different customer types based
on their contributed flows and assumed loadings (BOD, TSS, and ammonia). The allocated components are
then summed and divided by the projected flow to calculate the average rate per , gallons for each
customer type. The billable volume for each customer is equal to the metered water usage, with the exception
of unmetered sewer only customers and those customers with effluent meters.
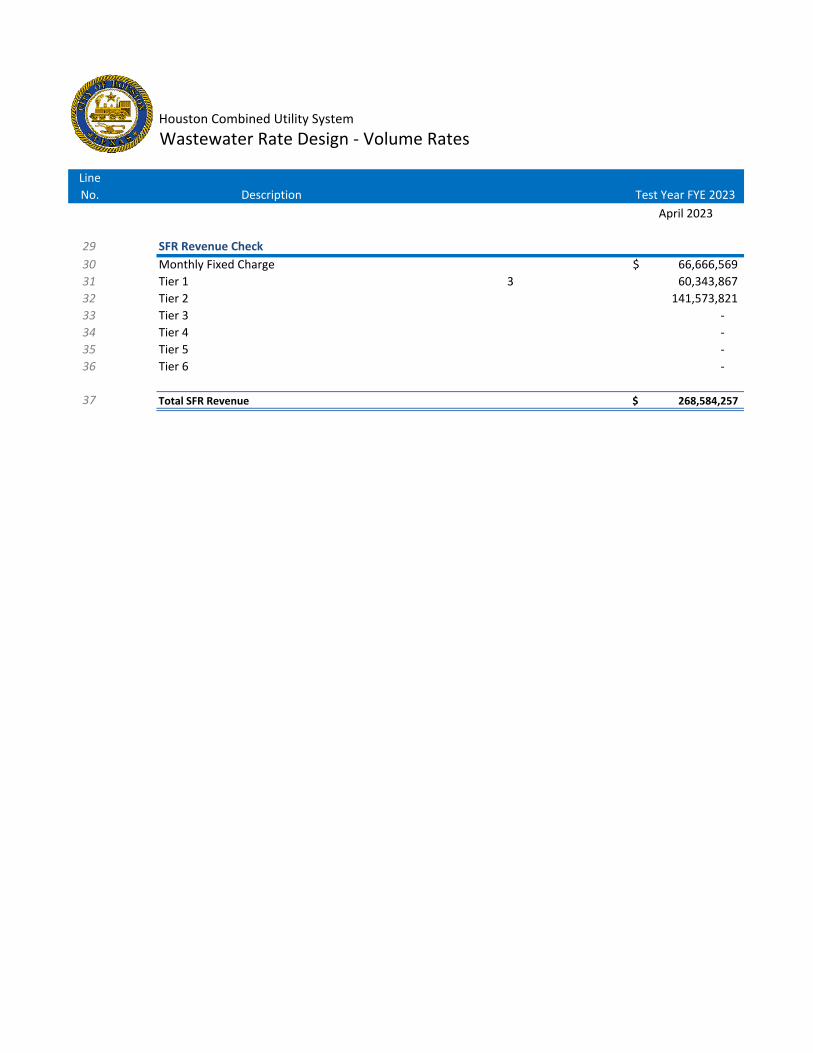
Single Family Residential Customers. Similar to the existing single family residential water rate structure, the
existing single family residential wastewater rate structure is made up of rates that vary for each incremental
, gallons for the first , gallons, increasing and decreasing as a customer’s billable volume goes up.
This results in large bill increases at specific usage intervals. Carollo recommends simplifying this structure to
two blocks with a reduced rate per , gallons for the first , gallons and a higher rate per , gallons
for all usage in excess of , gallons per month.
Table ES. shows the existing and proposed single family residential wastewater volume rates for the study
period.
Table ES. Existing and Proposed Single Family Residential Wastewater Volume Rates
Rate Block Existing FYE FYE FYE FYE FYE
Month of Increase July April April April April April
First kgal .
. . . . . . Next kgal .
Next kgal .
Next kgal .
. . . . . . Next kgal .
Over kgal .
To calculate the monthly wastewater bill, customers add the appropriate monthly meter charge from
Table ES. (existing charges) or Table ES. (proposed charges) and add the volume rate for each
incremental , ‐gallon unit from Table ES. . Table ES. shows existing and proposed monthly
wastewater bills for single family residential customers with usage up to , gallons in one month.
Table ES. Existing and Proposed Single Family Residential Bills – Wastewater Only
Billable Volume Existing FYE FYE FYE FYE FYE
Month of Increase July April April April April April
Meter Charge only . . . . . . .
, gallons . . . . . . .
, gallons . . . . . . .
, gallons . . . . . . .
, gallons . . . . . . .
, gallons . . . . . . .
, gallons . . . . . . .

DRAFT
WATER AND WASTEWATER COST OF SERVICE RATE STUDY | CITY OF HOUSTON
DRAFT | APRIL |
Figure ES. illustrates the existing and proposed single family residential wastewater rates and bills for the
first , gallons in , ‐gallon increments.
Figure ES. Existing and Proposed Single Family Residential Wastewater Rates and Bills
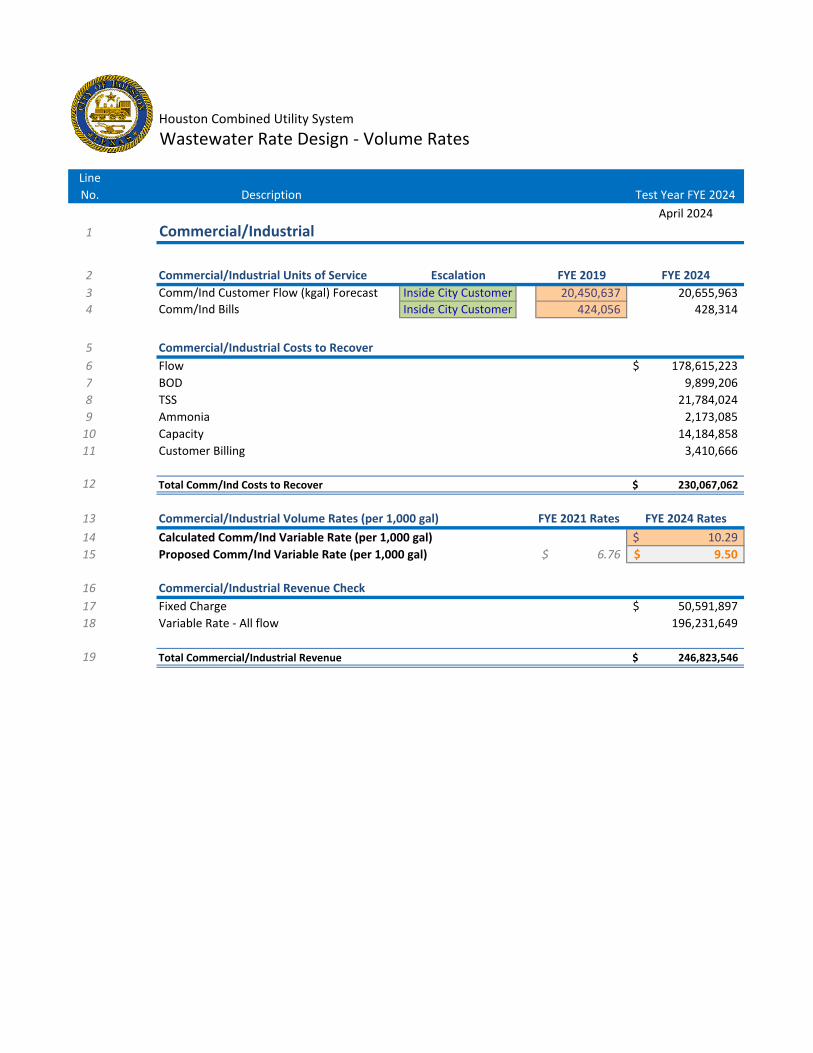
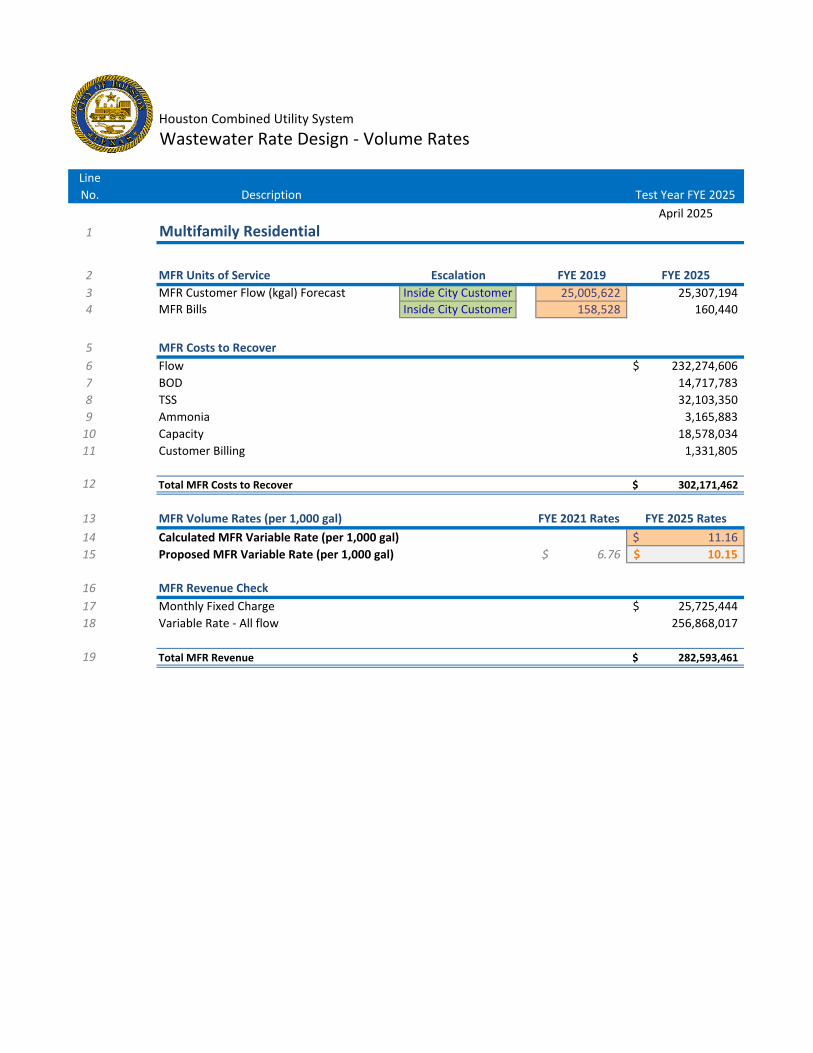
Other Retail Customer Types. With the exception of industrial customers who do not pay surcharges, all other
retail customer types pay a uniform rate per , gallons for all billable volume, which varies by customer
type. Non‐surcharge industrial customers pay a reduced rate for the first , gallons; all usage in excess of
, gallons is assessed a higher rate. Carollo recommends Houston Water continue to charge uniform rates
for all retail customer types other than single family residential, including all industrial customers. Table ES.
shows existing and proposed volume rates for all retail customer types except single family residential.

DRAFT
WATER AND WASTEWATER COST OF SERVICE RATE STUDY | CITY OF HOUSTON
DRAFT | APRIL |
Table ES. Existing and Proposed Retail Wastewater Volume Rates
Customer Type
Rate Block
Existing FYE FYE FYE FYE FYE
Month of Increase July April April April April April
Multifamily Residential
All Flow . . . . . . .
Commercial All Flow . . . . . . .
Industrial (no surcharge)
First kgal
. ‐‐‐ ‐‐‐ ‐‐‐ ‐‐‐ ‐‐‐ ‐‐‐
Over kgal
. ‐‐‐ ‐‐‐ ‐‐‐ ‐‐‐ ‐‐‐ ‐‐‐
All Usage ‐‐‐ . . . . . .
Industrial with Surcharge
All Flow . . . . . . .
BOD ( ) . . . . . . .
TSS ( ) . . . . . . .
Ammonia ‐‐‐ . . . . . .
Note: ( ) BOD, TSS, and ammonia surcharges are assessed per pound.
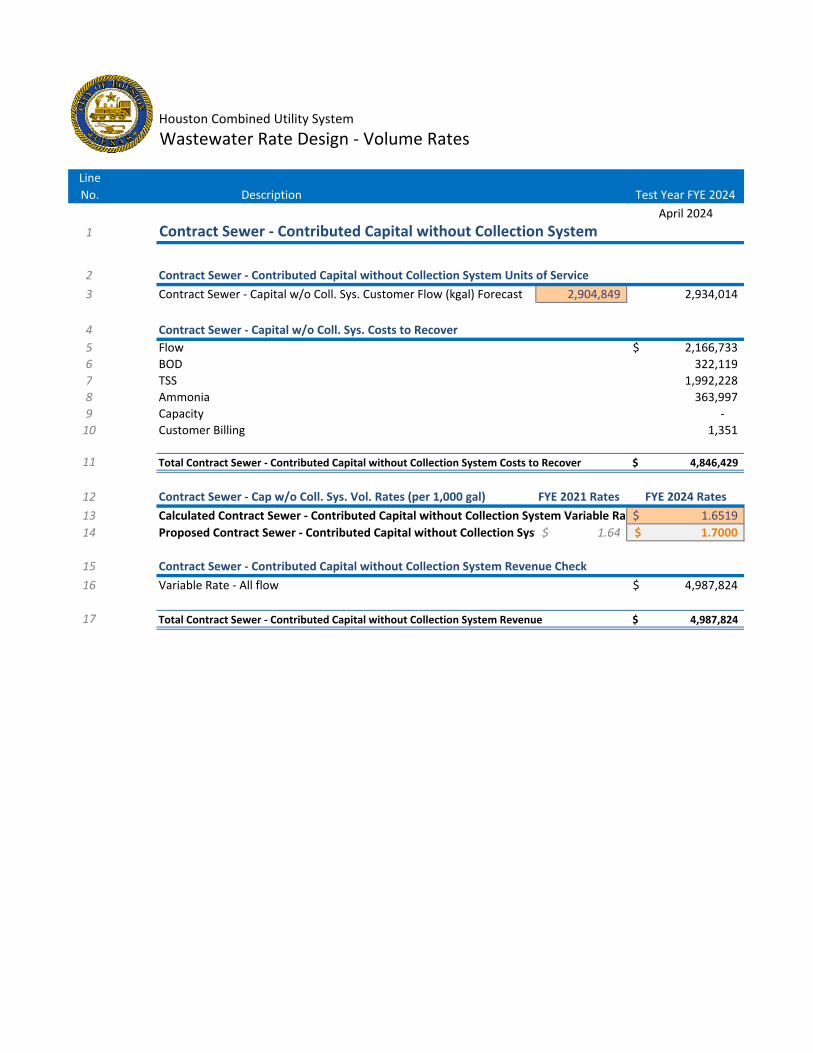
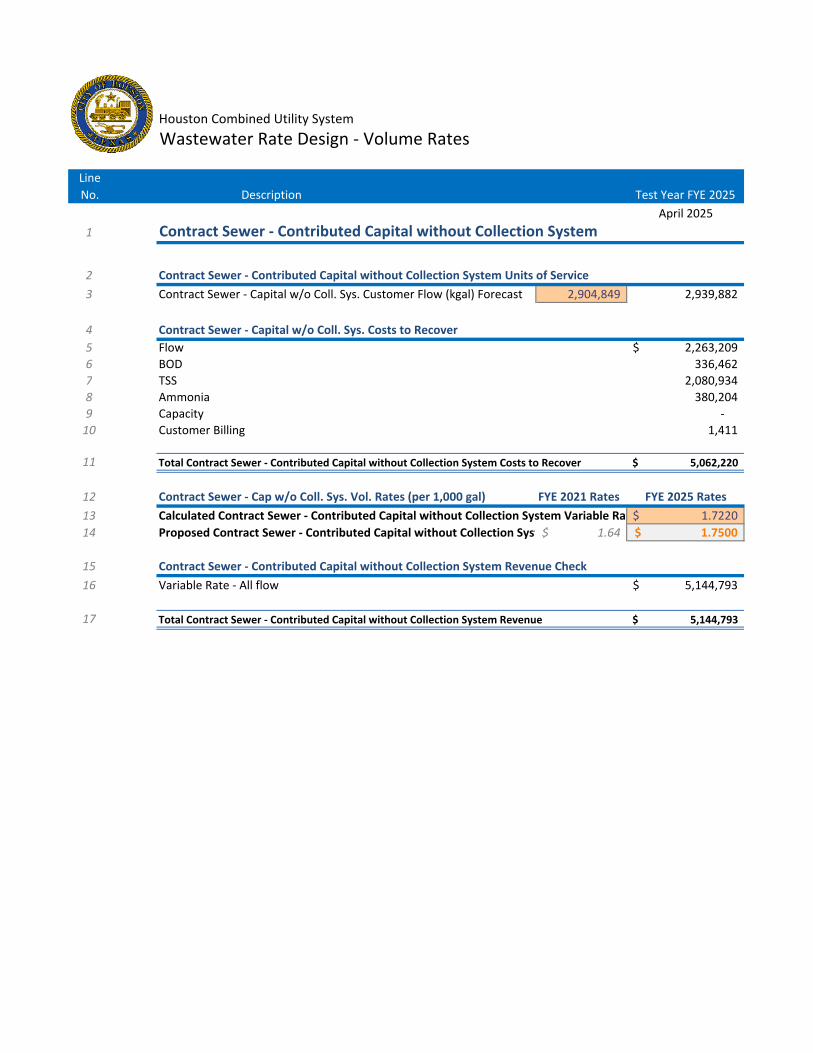
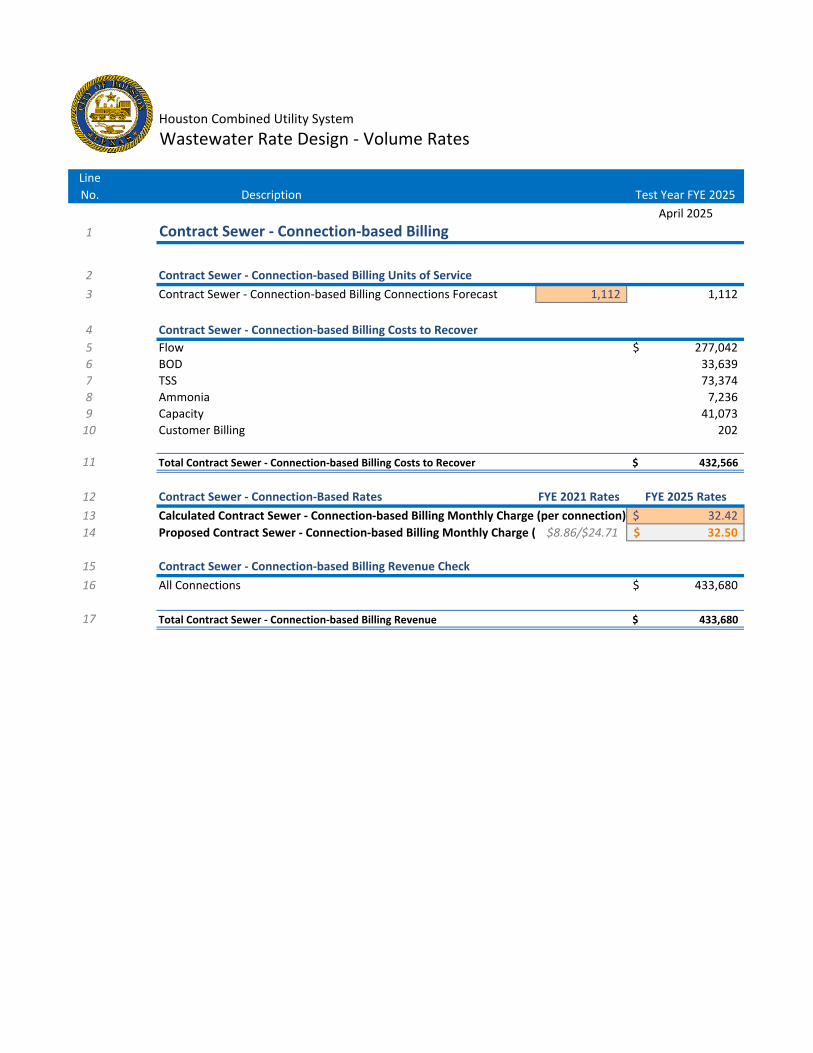
Carollo recommends maintaining the existing wholesale and contract customers’ rate structures. There are
currently three types of contract wastewater customers:
. Customers who have contributed capital and discharge directly to the wastewater treatment plant
(billed per , gallons). These customers pay a reduced rate that does not include capital costs or
costs related to collecting wastewater and conveying it to the treatment plant.
. Customers who have not contributed capital and discharge into the collection system. These
customers pay the full cost of collecting and treating wastewater based on how they are billed:
a. Billed per , gallons,
b. Billed per connection.
In addition to these existing contract rates, Houston Water requested a fourth rate for contract customers
who have contributed capital and discharge into the collection system. This rate does not include capital costs.
Existing and proposed contract wastewater rates are shown in Table ES. .
Table ES. Existing and Proposed Wholesale Wastewater Volume Rates
Customer Type Rate Block
Existing FYE FYE FYE FYE FYE
Month of Increase July April April April April April
Capital w/o Collection System
All Flow
. . . . . . .
Capital with Collection System
All Flow
‐‐‐ . . . . . .
No Capital w/Collection System
All Flow
. . . . . . .
Connection‐based
All Connections
. / . . . . . . .
DRAFT
WATER AND WASTEWATER COST OF SERVICE RATE STUDY | CITY OF HOUSTON
DRAFT | APRIL |
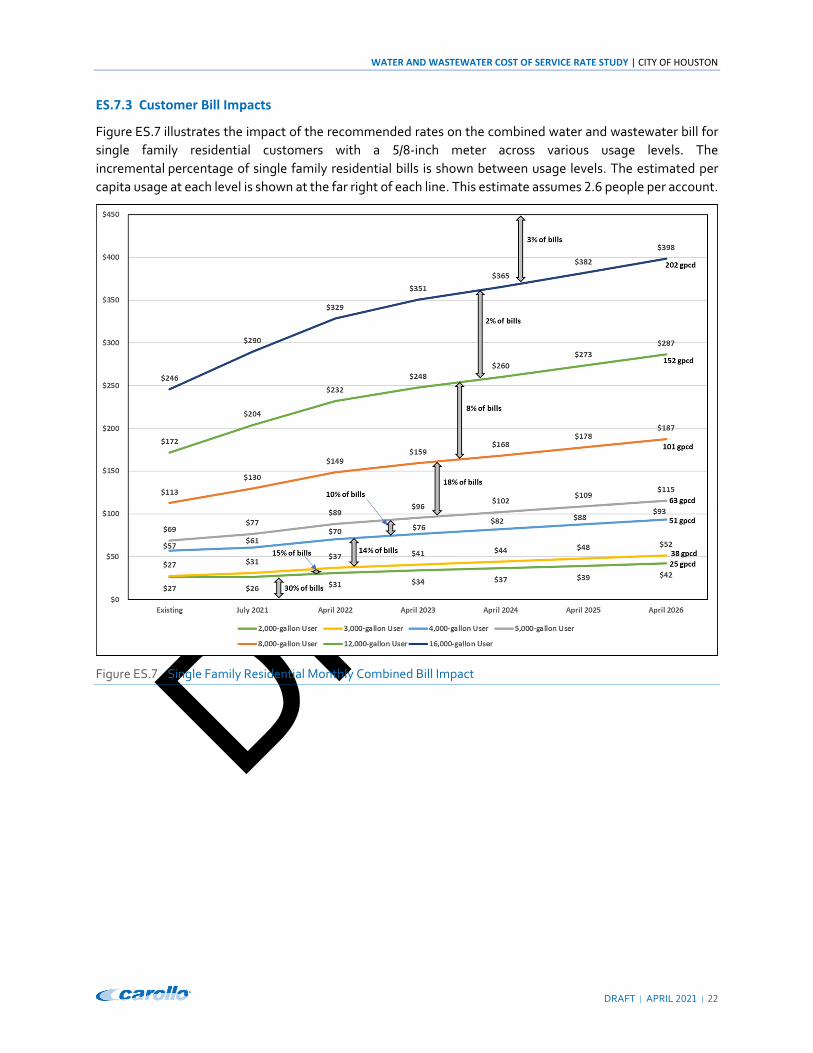
ES.7.3 Customer Bill Impacts
Figure ES. illustrates the impact of the recommended rates on the combined water and wastewater bill for
single family residential customers with a / ‐inch meter across various usage levels. The
incremental percentage of single family residential bills is shown between usage levels. The estimated per
capita usage at each level is shown at the far right of each line. This estimate assumes . people per account.
Figure ES. Single Family Residential Monthly Combined Bill Impact
DRAFT
WATER AND WASTEWATER COST OF SERVICE RATE STUDY | CITY OF HOUSTON
DRAFT | APRIL |
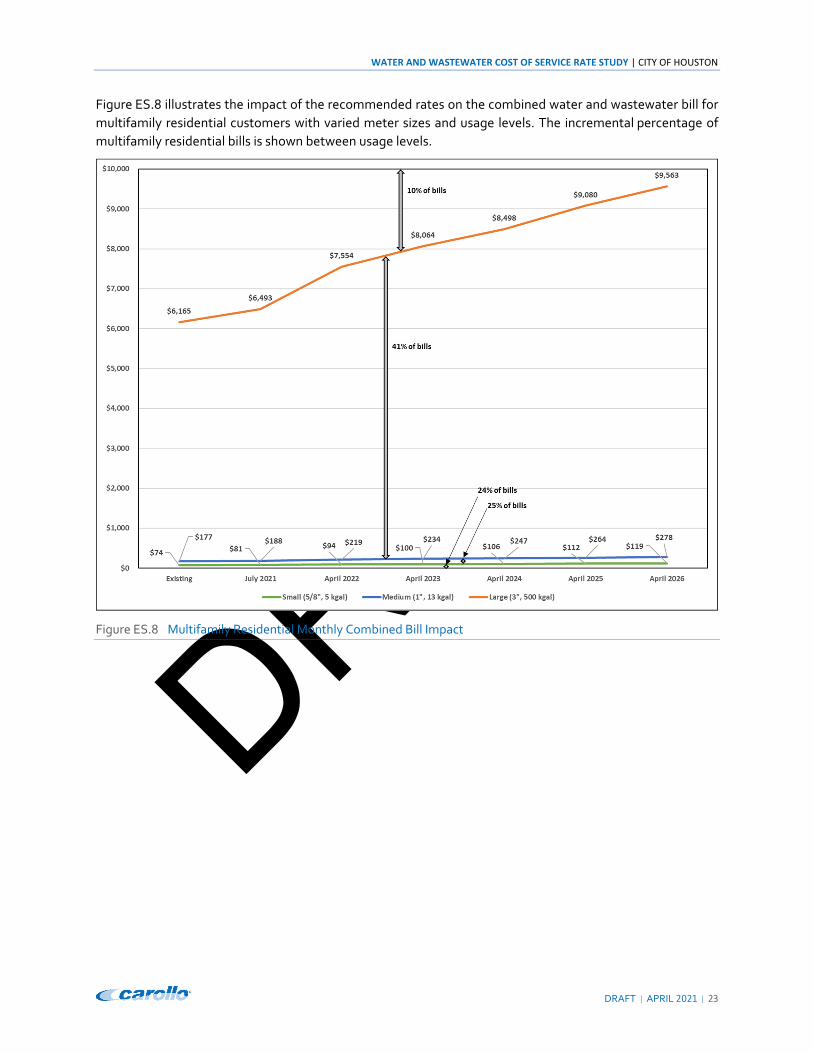
Figure ES. illustrates the impact of the recommended rates on the combined water and wastewater bill for
multifamily residential customers with varied meter sizes and usage levels. The incremental percentage of
multifamily residential bills is shown between usage levels.
Figure ES. Multifamily Residential Monthly Combined Bill Impact

DRAFT
WATER AND WASTEWATER COST OF SERVICE RATE STUDY | CITY OF HOUSTON
DRAFT | APRIL |
Figure ES. illustrates the impact of the recommended rates on the combined water and wastewater bill for
commercial and industrial customers with varied meter sizes and usage levels. The incremental percentage of
commercial and industrial bills is shown between usage levels.
Figure ES. Commercial/Industrial Monthly Combined Bill Impact

DRAFT
WATER AND WASTEWATER COST OF SERVICE RATE STUDY | CITY OF HOUSTON
DRAFT | APRIL |
Figure ES. illustrates the percentage of single family residential customers with varying levels of monthly
bill adjustments for the proposed rate schedule effective July , .
Figure ES. Distribution of July Monthly Combined Bill Impacts for Single Family Residential Customers
ES.8 Recommendations
Carollo recommends implementation of the water and wastewater rates as proposed in this Executive
Summary and described below:
Water sales revenue increases by . percent on July , , by . percent on April , , and
April , , and by . percent on April , , April , , and April , .
Wastewater user charge revenue increases by . percent on July , , by . percent on April
, , and by . percent on April , , April , , April , , and April , .
Water monthly service charge based on meter size and uniform for single family residential, multifamily
residential, commercial/industrial, and irrigation customers. Other customer types pay monthly service
charges based on meter size that differ based on the customer type and service provided.

DRAFT
WATER AND WASTEWATER COST OF SERVICE RATE STUDY | CITY OF HOUSTON
DRAFT | APRIL |
For single family residential customers, Carollo recommends a four‐tier inclining block water rate structure
with a conservation credit for customers who use , gallons or less in a month:
Block – First , gallons;
Block – Next , gallons;
Block – Next , gallons; and
Block – Over , gallons.
Figure ES. compares the existing and proposed volume water rate structures for single family residential
customers.
Figure ES. Existing and Proposed Single Family Residential Volume Water Rate Structures
For wastewater, Carollo recommends simplifying the single family residential rate structure to two tiers:
Block – First , gallons; and
Block – Over , gallons.

DRAFT
WATER AND WASTEWATER COST OF SERVICE RATE STUDY | CITY OF HOUSTON
DRAFT | APRIL |
Figure ES. compares the existing and proposed volume water rate structures for single family residential
customers.
Figure ES. Existing and Proposed Single Family Residential Volume Wastewater Rate Structures
Carollo recommends a uniform rate per , gallons for both water and wastewater for multifamily
residential and nonresidential customers.
Finally, Carollo recommends Houston Water update this cost of service rate study within five years to maintain
revenue sufficiency and equity among customers.

memo. Capital Projects | Customer Account Services | Houston Permitting Center | Houston Water | Transportation & Drainage Operations
Date: April 14, 2021
To: Mayor Sylvester Turner
City Council Members
From: Houston Public Works Director Carol Ellinger Haddock, P.E.
Subject: 2021 WATER & WASTEWATER COST OF SERVICE RATE STUDY
Houston Public Works (HPW) presents the attached 2021 Water & Wastewater Cost of Service Rate Study
(“Study”) for your review and consideration.
INTRODUCTION AND BACKGROUND
HPW transmitted the Executive Summary of the Study to you on March 22, 2021. At the time, we noted that the
Study began in 2019 with the engagement of Carollo Engineers, Inc. to support the City’s efforts to determine
cost of service and to set water and wastewater (sewer) rates for the Combined Utility System (“System”). City
Council adopted the timeline for City Council consideration and adoption of Water and Wastewater rates by
Ordinance on March 24, 2021. This adoption schedule, concurrent with the schedule for the consideration and
adoption of Water and Wastewater Impact fees, continues with the following steps:
Transmittal of the Study to City Council and posting of the Study with the City Secretary’s office on April
14, 2021
Presentation to the City Council Budget and Fiscal Affairs Committee on April 27, 2021
City Council Public Hearing on April 28, 2021
This schedule will allow final City Council action approving and implementing water and wastewater rates by
July 1, 2021. This date coincides with the state deadline for the Water and Wastewater Impact Fees Update
and the beginning of the fiscal year. Moreover, this rate setting has increased importance because the City has
not increased water and wastewater rates since 2010, beyond the automatic increases associated with
population growth and the indices referenced in the Master [Bond] Ordinance, in accordance with Ordinance No.
2010-305. The very modest increases have not kept pace with the increasing costs of the Combined Utility
System (System). f
The Study was conducted in accordance with the standard industry practices of the Water Environment
Federation and the Principles of Water Rates, Fees and Charges- Manual of Water Supply Practices M1, of the
American Water Works Association. The Study, which concludes with water and wastewater utility rates
recommended by HPW, is the product of focused and sustained efforts by HPW and its consultant. Rate setting
involves detailed analyses in the following steps: Determination of the System’s annual revenue requirement;
allocation of costs among customer types; and rate design. These processes must be performed in a manner

page 2 of 3
memo. Capital Projects | Customer Account Services | Houston Permitting Center | Houston Water | Transportation & Drainage Operations
consistent with applicable law, which prohibits rates that are unjust, unreasonable, and unduly discriminatory.
At the same time, the City must comply with its obligations to the System’s bondholders, which require that the
City operate the CUS in a prudent and lawful manner, and in keeping with specific financial guidelines. Finally,
in considering the City’s overall policy and financial goals, HPW recommends further efforts to increase System
resilience.
As stated in our March 26, 2021 memo transmitting the Executive Summary, rates and impact fees are the
primary sources of revenue for the System. While impact fees are charged to new development only; water and
wastewater rates are charged to every water and sewer customer. Unlike impact fees, no specific public
participation for water and wastewater rate setting is prescribed by Texas law. Because HPW is recommending
increased rates to address the increased cost of service, the City is providing for increased transparency and
public participation to promote trust between the City and its utility customers. Through increased transparency
in the rate setting process, HPW hopes to garner public support and confidence that the rate increases are fair,
necessary, and appropriate.
DETERMINING THE ANNUAL REVENUE REQUIREMENT
Revenue requirements are the summation of expenses or costs for providing safe drinking water and handling
wastewater to return appropriately treated water to the environment. The revenue requirement is made up of
Capital Costs, all Operations and Maintenance Costs, including personnel, chemicals, and energy, required debt
service payments, and financial requirements for debt service coverage ratio and cash reserves. The Study
recommends an annual revenue requirement of approximately $730 million for water and approximately $749
million for wastewater for Fiscal Year 2022. In addition to a growing population in the System service area, the
main drivers of the increased costs are associated with aging infrastructure, increasing commodity costs,
increasing regulatory compliance costs, and debt service related costs such as the debt service coverage ratio.
These revenue requirement increases are beyond the City’s control.
ALLOCATING COSTS AMONG CUSTOMER TYPES
Once the annual costs are identified and determined through the revenue requirements analysis, the next step
is to allocate those costs among the different customer types. Customers are grouped according to the similar
characteristics which group members share, so that the System can be designed to meet these customer
demands. Designation of customer types must also conform to standard industry practices. The main customer
types of the System are: Single Family Residential, Multifamily Residential, and Commercial/Industrial. Single
family residential customers are the largest customer type, comprising approximately 87% of System customers.
They share common usage patterns, such as peak hours and peak summer months, so the System must be
designed so that facilities and capacity are available to meet the single family residential needs. Multifamily
residential customers also share similar usage patterns which differ from the single family residential, most
notably in the lack of summer months peaking. Commercial/Industrial customers share different water demands
and peaking patterns, including, for example, the ability to use untreated versus potable water. Some industrial
customers are subject to an industrial waste surcharge which is based on the need for higher treatment
associated with increased concentrations of chemical pollutants discharged by this customer type. Other

page 3 of 3
memo. Capital Projects | Customer Account Services | Houston Permitting Center | Houston Water | Transportation & Drainage Operations
specialized customer types include: Government, Emergency Backup, Extra Container, Resale, Transient,
Irrigation, and Metered and Unmetered Fire (flow). Finally, there are contract customers and wholesale
customers, some of which have specialized demand configurations and specified costs defined by their water
supply contracts.
RATE DESIGN
After determining the revenue requirements and the costs of service for each customer type, the City must design
the rates to recover the costs of providing treated water and wastewater treatment for all customer types. In this
step, the City provides the means to recover the System costs which achieve the City’s goals of legal and
regulatory compliance, while also being affordable, equitable, and promoting resilience and judicious use of
resources through water conservation. Ideally, each customer type should pay the total of its calculated cost of
service. Competing goals of recovering full cost of service and affordability challenge the City to design a rate
structure that addresses all policy goals. HPW is recommending a series of rate increases over the study period
of 5 fiscal years ending in FY 2026. HPW recommends implementing the water and sewer rates as proposed
and set forth in the Study accomplishes the City’s goals. The main features of the recommended rates are:
The rates will recover all costs necessary to provide safe drinking water and environmentally sound
wastewater treatment.
Customer types are grouped appropriately among customers sharing similar usage profiles and System
demands, so that rates reflect the distinct needs of each customer type.
The rates promote water conservation by providing a water conservation credit for all single family
customers who use 3,000 gallons of water per month or less.
The rates promote resiliency in planning for the costs of redundancy, replacement, and disaster
preparation.
HPW looks forward to working with City Council and the public to set water and wastewater rates which will serve
the Combined Utility System for years to come.
Questions may be forwarded to Houston Public Works through Deputy Director Samir Solanki, CPA, MBA.

TBPE No. F‐
City of Houston
WATER AND WASTEWATER COST OF SERVICE RATE STUDY
DRAFT | April

10375 RICHMOND AVENUE, SUITE 1625 • HOUSTON, TEXAS 77042 • P. 281.872.4512 •F. 281.872.4505
City of Houston Combined Utility System Water and Wastewater Rate Study
WATER AND WASTEWATER
COST OF SERVICE RATE STUDY
DRAFT | April

WATER AND WASTEWATER COST OF SERVICE RATE STUDY | CITY OF HOUSTON
DRAFT | APRIL | i
Contents
EXECUTIVE SUMMARY 1
ES. Introduction
ES. Resilient Houston
ES. Background and System Overview
ES. Cost of Service Approach
ES. . Assumptions
ES. . Customer Demand Analyses
ES. Revenue Requirements Analysis
ES. . Water System
ES . Wastewater System
ES . Combined Utility System
ES Cost of Service Analysis
ES . Water System
ES . Wastewater System
ES Rate Design
ES . Water System
ES . Wastewater System
ES . Customer Bill Impacts
ES Recommendations
Chapter 1 - REVENUE REQUIREMENT ANALYSIS 28
. Overview
. . Revenue Requirement Purpose and Components
. . Revenue Requirement Tests
. Water System
. . Expenses
. . Revenues
. . Cash Balance
. . Revenue Requirement Tests before Revenue Increases
. . Recommended Revenue Increases
. Wastewater System

WATER AND WASTEWATER COST OF SERVICE RATE STUDY | CITY OF HOUSTON
DRAFT | APRIL | ii
. . Expenses
. . Revenues
. . Cash Balance
. . Revenue Requirement Tests before Revenue Increases
. . Recommended Revenue Increases
. Combined Utility System
. . Revenue Requirement Tests before Revenue Increases
. . Revenue Requirement Tests with Revenue Increases
Chapter 2 - COST OF SERVICE ANALYSIS 48
. Cost of Service Approach
. Water System
. . Functional Cost Allocation
. . Allocation to Customer Types
. Wastewater System
. . Functional Cost Allocation
. . Allocation to Customer Types
Chapter 3 - RATE DESIGN 76
. Introduction
. Water System
. . Existing User Charges
. . Proposed User Charges
. Wastewater System
. . Existing User Charges
. . Proposed User Charges
. . Customer Bill Impacts
Chapter 4 - RECOMMENDATIONS 99

WATER AND WASTEWATER COST OF SERVICE RATE STUDY | CITY OF HOUSTON
DRAFT | APRIL | iii
Appendices
Appendix A WATER FYE BUDGET AND FYE ‐ PROJECTIONS
Appendix B WASTEWATER FYE BUDGET AND FYE ‐ PROJECTIONS
Appendix C WATER REVENUE REQUIREMENTS
Appendix D WASTEWATER REVENUE REQUIREMENTS
Appendix E COMBINED UTILITY SYSTEM REVENUE REQUIREMENTS
Appendix F CUSTOMER PROFILE AND DEMAND ANALYSIS
Appendix G WATER COST OF SERVICE ANALYSIS
Appendix H WASTEWATER COST OF SERVICE ANALYSIS
Appendix I WATER RATE DESIGN
Appendix J WASTEWATER RATE DESIGN
Tables
Table ES. Revenue Requirements for Water and Wastewater Systems ( millions) ( )
Table ES. Combined Utility System Revenue Requirements ( millions) ( )
Table ES. Water System Cost of Service Results ( millions) ( )
Table ES. Wastewater System Cost of Service Results ( millions) ( )
Table ES. Existing Water Monthly Meter Charges by Customer Type
Table ES. Proposed Water Monthly Meter Charges
Table ES. Existing and Proposed Water Monthly Meter Charges –
Transient, Resale, and Fire Customers
Table ES. Existing and Proposed Single Family Residential Water Volume Rates
Table ES. Existing and Proposed Single Family Residential Bills – Water Only
Table ES. Existing and Proposed Retail Water Volume Rates
Table ES. Existing and Proposed Wholesale Water Volume Rates
Table ES. Existing Wastewater Monthly Meter Charges by Customer Type
Table ES. Proposed Wastewater Monthly Meter Charges
Table ES. Existing and Proposed Wastewater Monthly Service Charges –
Industrial Customers with Surcharges and Sewer Only Customers
Table ES. Existing and Proposed Single Family Residential Wastewater Volume Rates
Table ES. Existing and Proposed Single Family Residential Bills – Wastewater Only
Table ES. Existing and Proposed Retail Wastewater Volume Rates

WATER AND WASTEWATER COST OF SERVICE RATE STUDY | CITY OF HOUSTON
DRAFT | APRIL | iv
Table ES. Existing and Proposed Wholesale Wastewater Volume Rates
Table . Water O&M Budget Projections ( millions) ( )
Table . Water Annual Debt Service ( millions) ( )
Table . Water Capital Improvement Plan Summary ( millions) ( )
Table . Water Capital Improvement Plan Funding ( millions) ( )
Table . Proposed Water Impact Fees
Table . Projected Annual Water Revenue Before Revenue Increases ( millions) ( )
Table . Projected Water Cash Balance Before Revenue Increases ( millions) ( )
Table . Water Debt Service Coverage Test Before Revenue Increases ( millions) ( )
Table . Water Cash Balance Test Before Revenue Increases ( millions) ( )
Table . Projected Water Revenue Requirements ( millions) ( )
Table . Wastewater O&M Budget Projections ( millions) ( )
Table . Wastewater Annual Debt Service ( millions) ( )
Table . Wastewater Capital Improvement Plan Summary ( millions) ( )
Table . Wastewater Capital Improvement Plan Funding ( millions) ( )
Table . Proposed Wastewater Impact Fees ( millions)
Table . Projected Annual Wastewater Revenue Before Revenue Increases
( millions) ( )
Table . Projected Wastewater Cash Balance Before Revenue Increases
( millions) ( )
Table . Wastewater Debt Service Coverage Test Before Revenue Increases
( millions) ( )
Table . Wastewater Cash Balance Test Before Revenue Increases ( millions) ( )
Table . Projected Wastewater Revenue Requirements ( millions) ( )
Table . Combined Utility System Debt Service Coverage Test Before
Revenue Increases ( millions) ( )
Table . Combined Utility System Cash Balance Test Before Revenue
Increases ( millions) ( )
Table . Combined Utility System Debt Service Coverage Test with Revenue
Increases ( millions) ( )
Table . Combined Utility System Cash Balance Test with Revenue
Increases ( millions) ( )
Table . Allocation of Water System Assets to Cost Components ( millions) ( )
Table . Functional Allocation of Water O&M Budget ( millions) ( )
Table . Allocation of Water O&M Budget to Cost Components ( millions) ( )

WATER AND WASTEWATER COST OF SERVICE RATE STUDY | CITY OF HOUSTON
DRAFT | APRIL | v
Table . Allocation of Water Revenue Requirements to Cost Components ( millions) ( )
Table . Allocation of FYE Water Revenue Requirements to Cost Components
( millions) ( )
Table . Water Units of Service by Customer Type (FYE )
Table . Development of Water Unit Costs (FYE ) ( millions) ( )
Table . Water FYE Revenue Requirement Allocation by Customer Type (%)
Table . Water FYE Revenue Requirement Allocation by Customer Type
( millions) ( )
Table . Allocation of Wastewater System Assets to Cost Components ( millions) ( )
Table . Functional Allocation of Wastewater O&M Budget ( millions) ( )
Table . Allocation of Wastewater O&M Budget to Cost Components ( millions) ( )
Table . Allocation of Wastewater Revenue Requirements to Cost Components
( millions) ( )
Table . Allocation of FYE Wastewater Revenue Requirements to Cost Components
( millions) ( )
Table . Wastewater Units of Service by Customer Type (FYE )
Table . Development of Wastewater Unit Costs (FYE ) ( millions) ( )
Table . Wastewater FYE Revenue Requirement Allocation by Customer Type (%)
Table . Wastewater FYE Revenue Requirement Allocation by Customer
Type ( ) ( millions) ( )
Table . Development of Water Monthly Meter Charge (FYE )
Table . Existing and Proposed Water Monthly Meter Charges ( )
Table . Existing and Proposed Water Monthly Meter Charges –
Transient, Resale, Metered Fire, and Unmetered Fire Customers
Table . Proposed Monthly TCEQ Fee per Connection
Table . FYE Single Family Residential Water Cost‐of‐Service
Volume Rate Calculation
Table . Existing and Proposed Single Family Residential Water Volume Rates
Table . Existing and Proposed Single Family Residential Bills – Water Only
Table . FYE Multifamily Residential Water Cost‐of‐Service
Volume Rate Calculation
Table . Existing and Proposed Retail Water Volume Rates
Table . Existing and Proposed Wholesale Water Volume Rates
Table . Development of Wastewater Monthly Meter Charge (FYE )
Table . Existing and Proposed Wastewater Monthly Meter Charges

WATER AND WASTEWATER COST OF SERVICE RATE STUDY | CITY OF HOUSTON
DRAFT | APRIL | vi
Table . Existing and Proposed Wastewater Monthly Service Charges –
Industrial Customers with Surcharges and Sewer Only Customers
Table . FYE Single Family Residential Wastewater Cost‐of‐Service
Volume Rate Calculation
Table . Existing and Proposed Single Family Residential Wastewater Volume Rates
Table . Existing and Proposed Single Family Residential Bills – Wastewater Only
Table . FYE Multifamily Residential Wastewater Cost‐of‐Service
Volume Rate Calculation
Table . Existing and Proposed Retail Wastewater Volume Rates
Table . Existing and Proposed Wholesale Wastewater Volume Rates
Table F. Water System Retail Accounts by Meter Size F‐
Table F. Water System Retail Meter Equivalents F‐
Table F. Wastewater System Retail Accounts by Meter Size F‐
Table F. Wastewater System Retail Meter Equivalents F‐
Figures
Figure ES. Cost of Service Rate Study Process
Figure ES. Bill Frequency and Usage Analysis
Figure ES. Projected Cash Balance (Days of O&M)
Figure ES. Projected Debt Service Coverage Ratio
Figure ES. Existing and Proposed Single Family Residential Water Rates and Bills
Figure ES. Existing and Proposed Single Family Residential Wastewater Rates and Bills
Figure ES. Single Family Residential Monthly Combined Bill Impact
Figure ES. Multifamily Residential Monthly Combined Bill Impact
Figure ES. Commercial/Industrial Monthly Combined Bill Impact
Figure ES. Distribution of July Monthly Combined Bill Impacts for Single Family
Residential Customers
Figure ES. Existing and Proposed Single Family Residential Volume
Water Rate Structures
Figure ES. Existing and Proposed Single Family Residential Volume
Wastewater Rate Structures
Figure . Projected Debt Service Coverage Ratio
Figure . Projected Cash Balance (Days of O&M)
Figure . Three‐step Cost Allocation Approach
Figure . Existing and Proposed Single Family Residential Water Rates and Bills

WATER AND WASTEWATER COST OF SERVICE RATE STUDY | CITY OF HOUSTON
DRAFT | APRIL | vii
Figure . Existing and Proposed Single Family Residential Wastewater Rates and Bills
Figure . Single Family Residential Monthly Combined Bill Impact
Figure . Multifamily Residential Monthly Combined Bill Impact
Figure . Commercial/Industrial Monthly Combined Bill Impact
Figure . Distribution of July Monthly Combined Bill Impacts for Single Family
Residential Customers
Figure . Existing and Proposed Single Family Residential Volume
Water Rate Structures
Figure . Existing and Proposed Single Family Residential Volume
Wastewater Rate Structures
Figure F. Bill Frequency and Usage Analysis F‐

WATER AND WASTEWATER COST OF SERVICE RATE STUDY | CITY OF HOUSTON
DRAFT | APRIL | viii
Abbreviations
AWWA American Water Works Association
BOD biochemical oxygen demand
Carollo Carollo Engineers, Inc.
CAS Customer Account Services
CIP Capital Improvement Plan
City City of Houston
CUS Combined Utility System
DSCR debt service coverage ratio
DWO Drinking Water Operations
EBS emergency backup service
FYE fiscal year ending
G&A General & Administrative
GRP Groundwater Production Plan
HPC Houston Permitting Center
MEU meter equivalent unit
MFR multifamily residential
O&M operations and maintenance
PAYGO Pay As You Go
PPI Producer Price Index
SFR single A residential
TCEQ Texas Commission on Environmental Quality
TSS total suspended solids
WEF Water Environment Federation
WPP water production plant
WWO Wastewater Operations

WATER AND WASTEWATER COST OF SERVICE RATE STUDY | CITY OF HOUSTON
DRAFT | APRIL |
EXECUTIVE SUMMARY
ES.1 Introduction
The City of Houston, Texas (City), provides water and wastewater service to nearly , customer
accounts through its water and wastewater utility, the Combined Utility System (CUS) or “Houston Water,”
as it is called throughout this report. Houston Water is financially self‐sufficient, with funding for operating
and capital requirements derived primarily from user charge revenues, impact fees, and other miscellaneous
charges. This executive summary documents the results of the cost of service rate study and recommends
water and wastewater rates that are appropriate to meet Houston Water’s funding needs and achieve pricing
objectives.
Following a competitive proposal process, the City hired Carollo Engineers (Carollo) to complete a
comprehensive study to update water and wastewater rates and impact fees, as well as miscellaneous fees
charged by Customer Account Services (CAS) and the Houston Permitting Center (HPC), to support the utility.
The findings and recommendations of the impact fee update and the miscellaneous fees update are
summarized in separate reports.
The objectives of the cost of service rate study were to:
Fund water and wastewater revenue requirements through fiscal year ending (FYE) ,
Determine cost of service by customer type, and
Develop fair and equitable water and wastewater rates.
ES.2 Resilient Houston
Resilient Houston provides a framework for action that works to protect Houston against future disasters and
to build a more resilient City. Part of this strategy is to protect the integrity of the City’s Water and Wastewater
system through unforeseen disasters. Hurricane Harvey and Winter Storm Uri are examples that tested the
limits of the System’s capabilities. Through these events we have learned that disasters come in all shapes
and forms and that the System needs to be ready in various circumstances. In order to align with the strategy
and goals of Resilient Houston, Houston Water has taken into consideration what it would take to get us there.
This means proactively responding to the needs of the aging water and wastewater infrastructure, increasing
backups that support drinking water and wastewater plants, and identifying the vulnerabilities in the entire
system and strengthening them. In order to respond to these needs Houston Water has built into this Rate
Study the costs that are required to take steps towards a more Resilient Houston Water
ES.3 Background and System Overview
Houston Water’s mission is to protect public health, protect the environment, and provide superior customer
service. The utility serves approximately . million customers across a service area of more than square
miles and an additional . million contract and wholesale customers outside the city limits. Houston Water
must generate sufficient revenues to fully fund revenue requirements, maintain appropriate cash balances,
and meet all requirements of the Master Ordinance, including adequate debt service coverage. Ordinance No.
‐ , Houston Water’s “Master Ordinance,” provides for the issuance of Houston Water revenue
obligations and contains restrictions and covenants regarding the issuance of Houston Water debt, to be
issued pursuant to supplemental ordinances. The City completes a cost of service rate study at least every five
years to update water and wastewater rates to continue to meet its financial goals.

WATER AND WASTEWATER COST OF SERVICE RATE STUDY | CITY OF HOUSTON
DRAFT | APRIL |
Houston Water’s Drinking Water Operations (DWO) Branch operates and maintains three water purification
plants and groundwater plants, in addition to an extensive transmission and distribution system. The
Wastewater Operations (WWO) Branch operates and maintains wastewater treatment plants and the
collection system, including lift stations and , miles of sewer lines.
ES.4 Cost of Service Approach
The cost of service rate study provides a rational basis
for distributing the costs of the City’s water and
wastewater systems to each customer type, including
wholesale and contract customers, in proportion to the
demands they place on the systems. Figure ES.
provides an overview of the study process and the
questions answered at each step.
The revenue requirements analysis prepared a
financial plan for each system to determine the
revenue increases needed for each to support itself
while also considering key metrics of the combined
utility system. A detailed cost allocation was
developed for both the water and wastewater systems
based on the unique attributes of each system to
determine the portion of total revenue requirements
that should be recovered from each customer type.
Finally, recommendations were made to improve the
equity and ease of understanding of the existing rate
structure and rates were calculated to recover
sufficient revenue from each customer type.
The rates presented within this report adhere to cost of service principles, as well as industry standards set by
the American Water Works Association (AWWA) and the Water Environment Federation (WEF). The City
should continue to perform a cost of service study at least every five years so that revenues from rates
adequately fund utility operations, maintenance, and ongoing capital needs, and equitably recover costs from
system users.
ES.4.1 Assumptions
The study incorporated the key assumptions below into the analysis. Changes in these assumptions could
have a material effect on study findings and recommendations.
An automatic adjustment of . percent was implemented on April , .
With the exception of the initial adjustment recommended in this report, which will go into effect on
July , , all recommended adjustments will be implemented on April of each year.
Houston Water will use commercial paper to finance capital projects. Commercial paper debt is
converted to first lien bonds, which are assumed to have a ‐year term and percent interest rate.
The target debt service coverage ratio (DSCR) is . x for first lien and junior lien combined. DSCR is
evaluated for the combined water and wastewater utility. However, because the wastewater utility’s
projected FYE DSCR is well below the . x target, the analysis allows the wastewater DSCR to
transition to the full target in the first two years as long as the wastewater DSCR is at least . x and
the combined utility DSCR is at least . x.
Figure ES. Cost of Service Rate Study Process

WATER AND WASTEWATER COST OF SERVICE RATE STUDY | CITY OF HOUSTON
DRAFT | APRIL |
The target for Pay‐As‐You‐Go (PAYGO) or cash funding of capital projects is . percent of the
annual Capital Improvement Plan (CIP) up to a maximum of million for the combined utility.
Annual interest earnings on cash balances is . percent.
The number of accounts increases by . percent per year.
The minimum cash balance is days of operating and maintenance (O&M) expense. This is
calculated by dividing the ending cash balance by the annual O&M expenses.
Costs are projected to increase at the general annual inflation rate of . percent.
The analysis includes a bad debt allowance of . percent.
Water and wastewater impact fees will increase to . percent and . percent, respectively, of the
fees as calculated in the impact fee update, effective on July , . Subsequent increases equal
to the regional Producer Price Index (PPI) will take effect on July of each year. An additional
. percent will be added to the PPI increase for the water impact fee in and so that the
ratio of the adopted fee to the calculated fee is the same for water and wastewater.
ES.4.2 Customer Demand Analyses
Carollo analyzed FYE customer billing data to understand how different types of customers use the
water and wastewater systems. This analysis drives the allocation of costs to improve equity among
customers. Figure ES. illustrates the findings of this analysis for single family residential, multifamily
residential, and commercial customers, although the full analysis included all retail and wholesale customers.
Additional detail from the customer demand analysis is provided in Appendix F.
Figure ES. Bill Frequency and Usage Analysis

WATER AND WASTEWATER COST OF SERVICE RATE STUDY | CITY OF HOUSTON
DRAFT | APRIL |
ES.5 Revenue Requirements Analysis
The purpose of the Revenue Requirements Analysis is to determine the adequate and appropriate funding for
the Utility. Revenue requirements are the summation of expenses or costs for providing safe drinking water
and handling wastewater to return clean water to the environment. They are determined on an annual basis,
and they include:
Operations & Maintenance – salaries and benefits, chemicals, power, vehicles, equipment, supplies,
etc. Some costs vary by the volume of treatment such as chemicals and power, but other costs are
fixed and independent of volume such as salaries and vehicles.
Capital Improvements – design and construction of new and replacement infrastructure, including
labor for Houston Water employees and fees for consultants and contractors that perform this work.
Financing – debt service payments, bond issuance costs, commercial paper fees, etc.
In addition to expenses, most debt instruments (bonds and loans) require the utility to keep a certain amount
of cash in reserve dependent upon the amount of the debt. This cash reserve is restricted and cannot be used
to pay for the Utility’s expenses.
ES.5.1 Water System
The study analyzed the revenue requirements to test the fiscal health of the water system, evaluate the
adequacy of current rates and charges, and set the basis for the five‐year rate plan. The revenue requirement
analysis covers the study period FYE through FYE with the primary focus for rate setting given to
the five years, FYE through FYE , of the study period as Houston Water has approved an automatic
rate increase of . percent planned for FYE . Carollo recommends Houston Water increase water rate
revenue according to the following schedule:
July , . percent April , . percent
April , . percent April , . percent
April , . percent April , . percent
ES.5.2 Wastewater System
The study analyzed the revenue requirements to test the fiscal health of the wastewater system, evaluate the
adequacy of current rates and charges, and set the basis for the five‐year rate plan. Like for water, the
wastewater revenue requirement analysis covers the study period FYE through FYE with the
primary focus for rate setting given to the five years, FYE through FYE , of the study period as
Houston Water approved an automatic rate increase of . percent planned for FYE . Carollo
recommends Houston Water increase wastewater rate revenue according to the following schedule:
July , . percent April , . percent
April , . percent April , . percent
April , . percent April , . percent
These recommended increases for both water and wastewater are necessary to fund operational and capital
needs, as well as to meet debt service obligations associated with the CIP.

WATER AND WASTEWATER COST OF SERVICE RATE STUDY | CITY OF HOUSTON
DRAFT | APRIL |
Table ES. summarizes key elements of the revenue requirements for the water and wastewater systems,
including recommended revenue increases.
Table ES. Revenue Requirements for Water and Wastewater Systems ( millions) ( )
Description FYE FYE FYE FYE FYE FYE
Month of Increase April July April April April April April
Water System:
Recommended Revenue Increase
. % . % . % . % . % . % . %
Water Sales with Increase ( )
. . . . . . .
Impact Fee Revenue . . . . . .
O&M Expenses . . . . . .
Capital Improvements . . . . . .
Annualized Revenue Requirement ( )
. . . . . . .
Wastewater System:
Recommended Revenue Increase
. % . % . % . % . % . % . %
Wastewater Sales with Increase ( )
. . . . . . .
Impact Fee Revenue . . . . .
O&M Expenses . . . . .
Capital Improvements . . . . .
Annualized Revenue Requirement ( )
. . . . . . .
Notes: ( ) Values are in million dollars, unless otherwise noted, and are rounded. ( ) Projected annual rate revenue, including recommended revenue increase and all previous recommended revenue increases. ( ) Annualized revenue requirement represents the projected revenue if the recommended increase, as well as all previous recommended
increases, is in effect for the full ‐month period.
ES.5.3 Combined Utility System
Although the study analyzed the water and wastewater systems separately, Houston Water’s financial
performance is measured as a combined utility. The two primary indicators of the utility’s financial health are
the DSCR and the number of days of O&M expenses that can be supported by the cash balance.
Many water and wastewater utilities use revenue bonds to fund a portion of their capital expenses. The DSCR
test measures the ability of a utility to meet both legal and target revenue obligations associated with debt.
To ensure that Houston Water retains financial flexibility for contingencies, it targets higher standards than
the Master Ordinance minimum DSCR requirements of . x for first lien debt and . x for total debt. The
utility’s target DSCR for first lien and junior lien combined is . x, and the target DSCR for total debt is . x.
Carollo recommends Houston Water continue to target . x DSCR for first lien and junior lien but not drop
below . x.

WATER AND WASTEWATER COST OF SERVICE RATE STUDY | CITY OF HOUSTON
DRAFT | APRIL |
The utility’s cash balance indicates its ability to financially sustain operations during unforeseen circumstances
that may restrict its revenues. This is especially important for a utility like Houston Water that is prone to
extreme weather events. Houston Water’s minimum cash balance is equal to days of O&M expenses.
Table ES. summarizes the revenue requirements for the combined system, including cash and DSCR.
Table ES. Combined Utility System Revenue Requirements ( millions) ( )
Description FYE ( ) FYE ( ) FYE FYE FYE FYE
Expenses:
O&M Expenses . . . . . .
Jr./ st Debt Service . . . . . .
Other Debt Service . . . . . .
Cash‐funded CIP . . . . . .
Total Expenses , . , . , . , . , . , .
Plus: Required Debt Coverage ( )
. . . . . .
Plus: Required Cash ( ) . . . . . .
Required Revenue + Cash , . , . , . , . , . , .
Less: Cash Balance ( . ) ( . ) ( . ) ( . ) ( . ) ( . )
Less: Impact Fee Revenue ( . ) ( . ) ( . ) ( . ) ( . ) ( . )
Less: Other Non‐Rate Revenue
( . ) ( . ) ( . ) ( . ) ( . ) ( . )
Less: Rate Revenue (pre‐increase)
( , . ) ( , . ) ( , . ) ( , . ) ( , . ) ( , . )
Rate Revenue (Surplus)/Deficit
( . ) . ( . ) ( . ) . .
Recommended Increase ( ) ‐‐‐ . % . % . % . % . %
Additional Revenue . . . . . .
First/Junior Lien DSCR . x . x . x . x . x . x
Cash (Days O&M)
Annualized Revenue Requirement ( )
, . , . , . , . , . , .
Notes: ( ) Values are in million dollars, unless otherwise indicated, and are rounded. ( ) FYE values are based on FYE budget. ( ) FYE through FYE values are projected based on FYE budget. ( ) Debt service coverage is a revenue requirement, but not a cash expense. This revenue may be used to pay for cash‐funded CIP or debt
service payments (not junior or first lien since the coverage shown is to cover these bonds). As such, the required debt coverage shown may be reduced from the full % of the junior/first debt service payment to avoid double‐counting revenue requirements.
( ) Required cash is equal to days of O&M expenses. ( ) Recommended increase shown for FYE includes the July , , and the April , , increases, as shown in Table ES. . ( ) Annualized revenue requirement represents the projected revenue if the recommended increase, as well as all previous recommended
increases, is in effect for the full ‐month period.

WATER AND WASTEWATER COST OF SERVICE RATE STUDY | CITY OF HOUSTON
DRAFT | APRIL |
Figure ES. shows the year‐end cash balance from FYE . Year‐end balances for FYE through FYE
are projected with and without the recommended revenue increases.
Figure ES. Projected Cash Balance (Days of O&M)

WATER AND WASTEWATER COST OF SERVICE RATE STUDY | CITY OF HOUSTON
DRAFT | APRIL |
Figure ES. shows the DSCR from FYE . DSCRs for FYE through FYE are projected with and
without the recommended revenue increases.
Figure ES. Projected Debt Service Coverage Ratio
ES.6 Cost of Service Analysis
The cost of service analysis serves as a rational basis for distributing the full costs of Houston Water’s services
to each customer type in proportion to the demands placed on the system. The analysis is typically completed
in three steps:
. Allocate costs to functional categories (e.g., water production, pumping, collection system).
. Allocate functionalized costs to rate components:
a. Water – base, extra capacity, customer.
b. Wastewater – flow, loadings, customer.
. Allocate costs to customer types using rate component unit costs.
The study followed this approach to develop a detailed cost allocation that serves as the basis for the proposed
rate adjustments. This analysis yields an appropriate method for allocating costs, which could be sustained
unless substantial changes in cost drivers or customer consumption patterns occur.
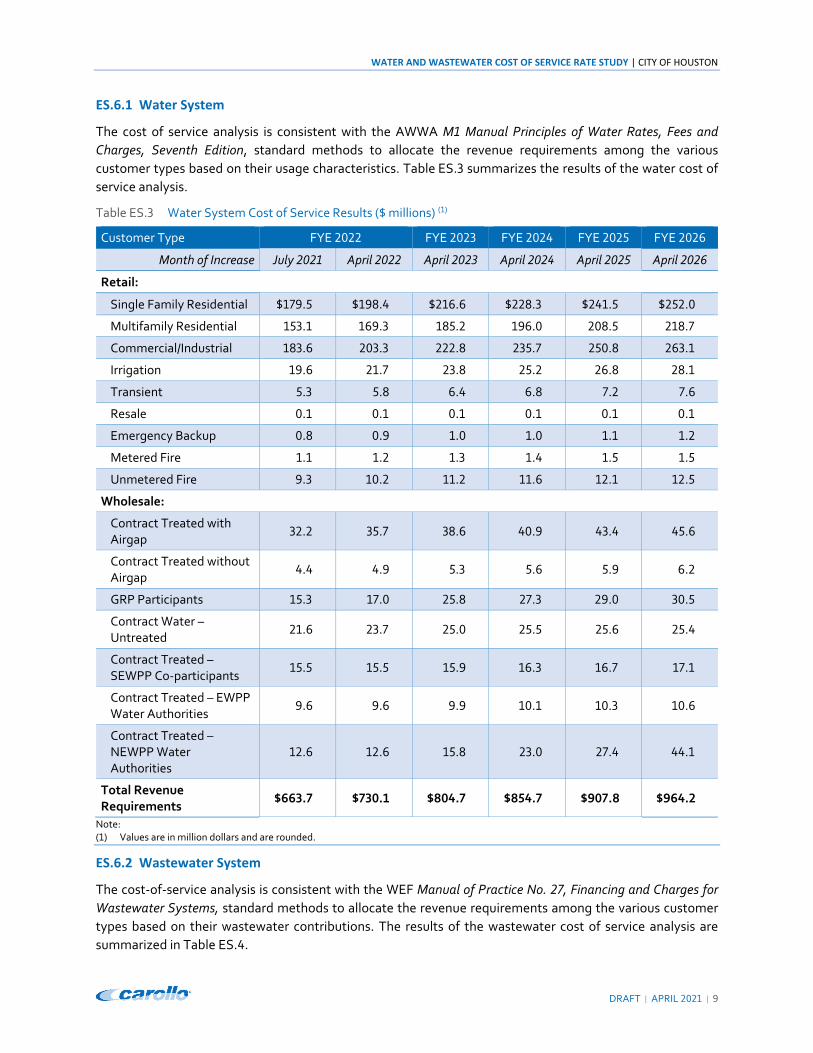
WATER AND WASTEWATER COST OF SERVICE RATE STUDY | CITY OF HOUSTON
DRAFT | APRIL |
ES.6.1 Water System
The cost of service analysis is consistent with the AWWA M Manual Principles of Water Rates, Fees and
Charges, Seventh Edition, standard methods to allocate the revenue requirements among the various
customer types based on their usage characteristics. Table ES. summarizes the results of the water cost of
service analysis.
Table ES. Water System Cost of Service Results ( millions) ( )
Customer Type FYE FYE FYE FYE FYE
Month of Increase July April April April April April
Retail:
Single Family Residential . . . . . .
Multifamily Residential . . . . . .
Commercial/Industrial . . . . . .
Irrigation . . . . . .
Transient . . . . . .
Resale . . . . . .
Emergency Backup . . . . . .
Metered Fire . . . . . .
Unmetered Fire . . . . . .
Wholesale:
Contract Treated with Airgap
. . . . . .
Contract Treated without Airgap
. . . . . .
GRP Participants . . . . . .
Contract Water – Untreated
. . . . . .
Contract Treated – SEWPP Co‐participants
. . . . . .
Contract Treated – EWPP Water Authorities
. . . . . .
Contract Treated – NEWPP Water Authorities
. . . . . .
Total Revenue Requirements
. . . . . .
Note: ( ) Values are in million dollars and are rounded.
ES.6.2 Wastewater System
The cost‐of‐service analysis is consistent with the WEF Manual of Practice No. , Financing and Charges for
Wastewater Systems, standard methods to allocate the revenue requirements among the various customer
types based on their wastewater contributions. The results of the wastewater cost of service analysis are
summarized in Table ES. .

WATER AND WASTEWATER COST OF SERVICE RATE STUDY | CITY OF HOUSTON
DRAFT | APRIL |
Table ES. Wastewater System Cost of Service Results ( millions) ( )
Customer Type FYE FYE FYE FYE FYE
Month of Increase July April April April April April
Retail:
Single Family Residential . . . . . .
Multifamily Residential . . . . . .
Commercial . . . . . .
Industrial Surcharge . . . . . .
Sewer Only (Unmetered) . . . . . .
Wholesale:
Capital without Collection System
. . . . . .
No Capital with Collection System
. . . . . .
Connection‐based . . . . . .
Total Revenue Requirements
. . . . . .
Note: ( ) Values are in million dollars and are rounded.
ES.7 Rate Design
Carollo worked with Houston Water staff to analyze various adjustments with the goals of simplifying the
water and wastewater rate structures and improving equity and understanding among customers. The
allocated revenue requirements serve as the basis for the rate design, although some accommodations were
made to improve affordability, especially as the proposed rates transition toward cost‐of‐service. Existing
rates shown are FYE rates, which went into effect on April , .
ES.7.1 Water System
The water rate design analysis determines rates required to achieve cost recovery, proportionately for each
customer. Houston Water’s existing rate structure consists of two components: a volumetric rate (variable)
and a monthly meter charge (fixed). The volumetric component is assessed based on metered water usage
per , gallons (kgal) and, by design, is intended to recover the cost incurred for delivering each unit of
water. The monthly meter charge is intended to recognize that the utility incurs fixed costs to provide the
availability of water service, which must be recovered independent of monthly water demands and
consumption.
ES.7.1.1 Monthly Meter Charge
By design, the monthly meter charge includes a customer component and a capacity component based on
meter size. The customer component recovers expenses associated with billing, collection, and customer
service. This component is the same for all customers regardless of meter size. The capacity component
captures maintenance costs related to meters and services, as well as a portion of the water system capital
costs. This component varies based on meter size to reflect the difference in potential demand that can be
placed on the system by different sized meters. The capacity charge is then added to the customer unit cost
to calculate the total monthly meter charge.

WATER AND WASTEWATER COST OF SERVICE RATE STUDY | CITY OF HOUSTON
DRAFT | APRIL |
In addition to the monthly meter charge, the study recommends a second fixed monthly charge, which would
be assessed per connection, to equitably recover the annual fee paid to the Texas Commission on
Environmental Quality (TCEQ).
Residential, Commercial, Industrial, Irrigation, and Emergency Backup Customers
Table ES. shows the existing monthly meter charges, which vary by customer type and meter size.
Table ES. Existing Water Monthly Meter Charges by Customer Type
Meter Size SFR MFR Com/Ind Irrigation Emergency
/ ” . . . . .
/ ” . . . . .
” . . . . .
½” . . . . .
” . . . . .
” . . . . .
” ‐‐‐ . . . .
” ‐‐‐ . . , . .
” ‐‐‐ . . , . .
” ‐‐‐ . . , . .
Notes: ( ) SFR is Single Family Residential ( ) MFR is Multifamily Residential
Table ES. summarizes the proposed monthly meter charges for the study period, which vary by meter size.
Carollo recommends charging the same monthly meter charge for single family and multifamily residential,
commercial/industrial, irrigation, and emergency backup rather than varying them by customer type.
Table ES. Proposed Water Monthly Meter Charges
Meter Size FYE FYE FYE FYE FYE
Month of Increase July April April April April April
/ ” . . . . . .
/ ” . . . . . .
” . . . . . .
½” . . . . . .
” . . . . . .
” . . . . . .
” . . . . . .
” . . . . . .
” . . . . . .
” . . . . . .
” . . . . . .
TCEQ Fee per connection . . . . . .
Note: ( ) Monthly meter charges shown are proposed for single family residential, multifamily residential, commercial/industrial, irrigation, and
emergency backup customers.

WATER AND WASTEWATER COST OF SERVICE RATE STUDY | CITY OF HOUSTON
DRAFT | APRIL |
Transient, Resale, and Fire Customers. Houston Water has several other customer types receiving water
service, and these customers are charged different monthly meter charges based on customer type and meter
size. Table ES. shows existing and proposed monthly meter charges for these other customer types.
Table ES. Existing and Proposed Water Monthly Meter Charges – Transient, Resale, and Fire Customers
Meter Size Existing FYE FYE FYE FYE FYE
Month of Increase July April April April April April
Transient:
” . . . . . . .
” . . . . . . .
” . . . . . . .
Resale:
/ ” and / " . . . . . . .
” . . . . . . .
½” . . . . . . .
” . . . . . . .
” . . . . . . .
” . . . . . . .
” . . . . . . .
” , . , . , . , . , . , . , .
Metered Fire:
/ ” . . . . . . .
/ ” . . . . . . .
” . . . . . . .
½” . . . . . . .
” . . . . . . .
” . . . . . . .
” . . . . . . .
” . . . . . . .
” . . . . . . .
” . . . . . . .

WATER AND WASTEWATER COST OF SERVICE RATE STUDY | CITY OF HOUSTON
DRAFT | APRIL |
Meter Size Existing FYE FYE FYE FYE FYE
Month of Increase July April April April April April
Unmetered Fire ( ):
/ ” and / " . . . . . . .
” . . . . . . .
½” . . . . . . .
” . . . . . . .
” . . . . . . .
” . . . . . . .
” . . . . . . .
” . . . . . . .
” . . . . . . .
” . . . . . . .
Note: ( ) Monthly meter charges for unmetered fire customers are based on the size of the service line.
ES.7.1.2 Volume Rates
Variable volume rates include a base component, which represents the cost to meet the average day demand;
a maximum day component, which represents the incremental cost to meet the maximum day demand; and
a maximum hour component, which represents the incremental cost to meet the maximum hour demand.
These costs are allocated to the different customer types based on the demands they place on the water
system. The three allocated components are then summed and divided by the projected usage to calculate
the average rate per , gallons for each customer type.
Single Family Residential Customers. The existing single‐family residential rate structure is made up of rates
that vary for each incremental , gallons for the first , gallons, increasing and decreasing as a
customer uses more water. This results in large bill increases at specific usage intervals. Transitioning to a
water conservation rate structure with rates for usage blocks that increase as a customer uses more water was
a key focus of this study.
Table ES. shows existing and proposed single family residential water volume rates for the study period.
Table ES. Existing and Proposed Single Family Residential Water Volume Rates
Rate Block Existing FYE FYE FYE FYE FYE
Month of Increase July April April April April April
Customers with usage up to , gallons per month:
First kgal .
. . . . . . Next kgal .
Next kgal .
* Single family residential customers who use , gallons or less per month receive a conservation credit.

WATER AND WASTEWATER COST OF SERVICE RATE STUDY | CITY OF HOUSTON
DRAFT | APRIL |
Rate Block Existing FYE FYE FYE FYE FYE
Month of Increase July April April April April April
Customers with usage in excess of , gallons per month:
First kgal .
. . . . . .
Next kgal .
Next kgal .
Next kgal .
Next kgal .
Next kgal .
Next kgal . . . . . . .
Next kgal . . . . . . .
Over kgal . . . . . . .
To calculate the monthly water bill, customers add the appropriate monthly meter charge from Table ES.
(existing charges) or Table ES. (proposed charges) and add the volume rate for each incremental , ‐gallon unit from Table ES. . Table ES. shows existing and proposed monthly water bills for single family
residential customers with usage up to , gallons in one month.
Table ES. Existing and Proposed Single Family Residential Bills – Water Only
Billed Usage Existing FYE FYE FYE FYE FYE
Month of Increase July April April April April April
Meter Charge only . . . . . . .
, gallons . . . . . . .
, gallons . . . . . . .
, gallons . . . . . . .
, gallons . . . . . . .
, gallons . . . . . . .
, gallons . . . . . . .
Figure ES. illustrates the existing and proposed single family residential water rates and bills for the first
, gallons in , ‐gallon increments.
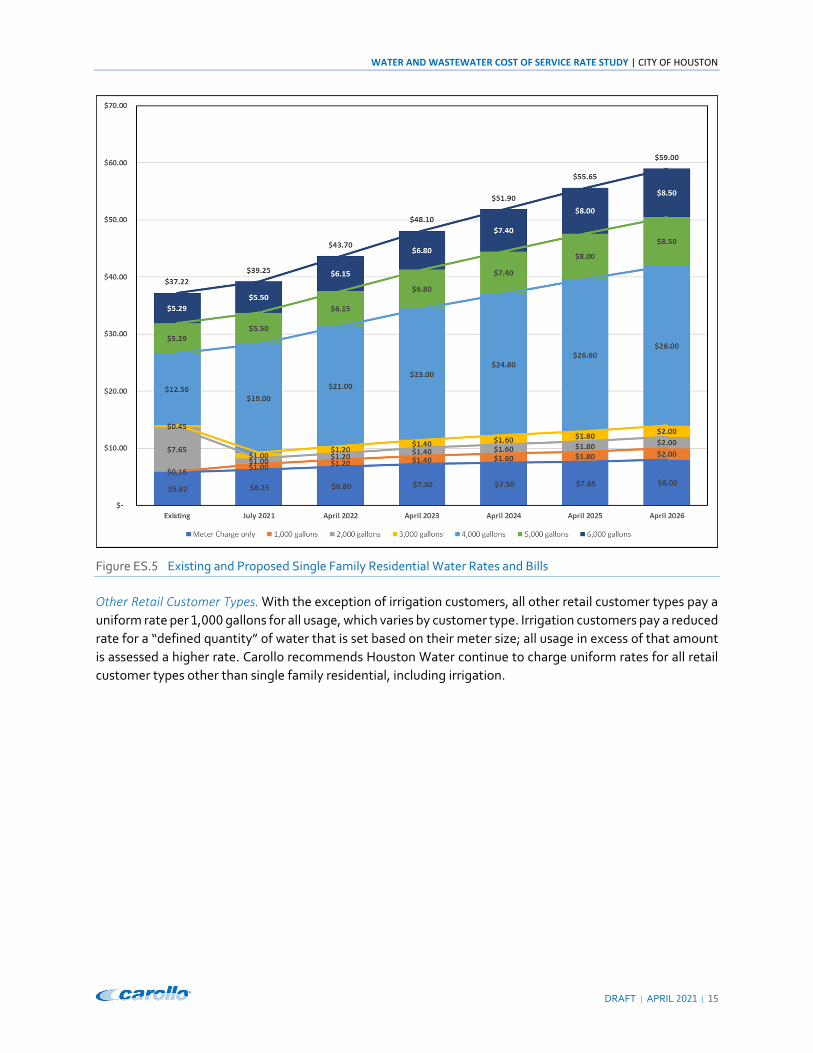
WATER AND WASTEWATER COST OF SERVICE RATE STUDY | CITY OF HOUSTON
DRAFT | APRIL |
Figure ES. Existing and Proposed Single Family Residential Water Rates and Bills
Other Retail Customer Types. With the exception of irrigation customers, all other retail customer types pay a
uniform rate per , gallons for all usage, which varies by customer type. Irrigation customers pay a reduced
rate for a “defined quantity” of water that is set based on their meter size; all usage in excess of that amount
is assessed a higher rate. Carollo recommends Houston Water continue to charge uniform rates for all retail
customer types other than single family residential, including irrigation.

WATER AND WASTEWATER COST OF SERVICE RATE STUDY | CITY OF HOUSTON
DRAFT | APRIL |
Table ES. shows existing and proposed volume rates for all retail customer types except single family
residential.
Table ES. Existing and Proposed Retail Water Volume Rates
Customer Type
Rate Block
Existing FYE FYE FYE FYE FYE
Month of Increase July April April April April April
Multifamily Residential
All Usage . . . . . . .
Commercial/ Industrial
All Usage . . . . . . .
Irrigation ( )
Block . ‐‐‐ ‐‐‐ ‐‐‐ ‐‐‐ ‐‐‐ ‐‐‐
Block . ‐‐‐ ‐‐‐ ‐‐‐ ‐‐‐ ‐‐‐ ‐‐‐
All Usage ‐‐‐ . . . . . .
Transient All Usage . . . . . . .
Resale All Usage . . . . . . .
Emergency Backup
All Usage . . . . . . .
Metered Fire All Usage . . . . . . .
Note: ( ) Irrigation customers with meters larger than inch receive a “defined quantity” of water at a reduced Block rate. The defined quantity
is based on the meter size. Irrigation customers with ‐inch or smaller meters do not receive any water at the reduced Block rate.
The study recommends maintaining the wholesale and contract customers’ rate structures. Contract Treated
Water customers pay a uniform rate for all usage and an excess surcharge for all usage above their contract
minimum volume. Groundwater Reduction Plan (GRP) customers’ rate is based on the Contract Treated Water
– No Airgap rate although it is reduced based on the required groundwater reduction for each Area. Areas
and pay percent of the Contract Treated rate, and Area currently pays percent, but that increases to
percent in FYE . These rates, as well as the Contract Untreated rate, are shown in Table ES. .
Table ES. Existing and Proposed Wholesale Water Volume Rates
Customer Type
Rate Block
Existing FYE FYE FYE FYE FYE
Month of Increase July April April April April April
Contract w/Airgap
Minimum . . . . . . .
Excess . . . . . . .
Contract w/o Airgap
Minimum . . . . . . .
Excess . . . . . . .
GRP Areas &
All Usage . . . . . . .
GRP Area All Usage . . . . . . .
Contract Untreated
All Usage . . . . . . .

WATER AND WASTEWATER COST OF SERVICE RATE STUDY | CITY OF HOUSTON
DRAFT | APRIL |
ES.7.2 Wastewater System
The wastewater rate design analysis determines rates required to achieve cost recovery, proportionately for
each customer. Like the water rates, Houston Water’s existing wastewater rate structure consists of two
components: a volumetric rate (variable) and a monthly service charge (fixed). The volumetric component is
assessed based on metered water usage per , gallons and, by design, is intended to recover the cost
incurred for collecting and treating each unit of wastewater. The monthly service charge is intended to
recognize that the utility incurs fixed costs to provide the availability of wastewater service, which must be
recovered independent of monthly wastewater flow.
ES.7.2.1 Monthly Meter Charge
By design, the monthly meter charge includes a customer component and a capacity component based on
water meter size. The customer component recovers expenses associated with billing, collection, and
customer service. This component is the same for all customers regardless of meter size. The capacity
component captures a portion of the wastewater system capital costs. This component varies based on water
meter size to reflect the difference in potential flow that can be discharged to the system by customers with
different sized water meters. The capacity charge is then added to the customer unit cost to calculate the total
monthly meter charge.
Residential, Commercial, and Industrial Customers. Table ES. shows the existing monthly meter charges by
customer type and water meter size.
Table ES. Existing Wastewater Monthly Meter Charges by Customer Type
Meter Size SFR MFR) Commercial Industrial
/ ” . . . .
/ ” . . . .
” . . . .
½” . . . .
” . . . .
” . . . .
” ‐‐‐ . . .
” ‐‐‐ . . .
” ‐‐‐ . . .
” ‐‐‐ . . .
Notes: ( ) SFR is Single Family Residential. ( ) MFR is Multifamily Residential. ( ) Monthly meter charges for industrial customers in this table are for all industrial customers, including those who pay surcharges.
Table ES. summarizes the proposed monthly meter charges for the study period, by water meter size, for
single family residential, multifamily residential, commercial, and industrial (with and without surcharges)
customers.
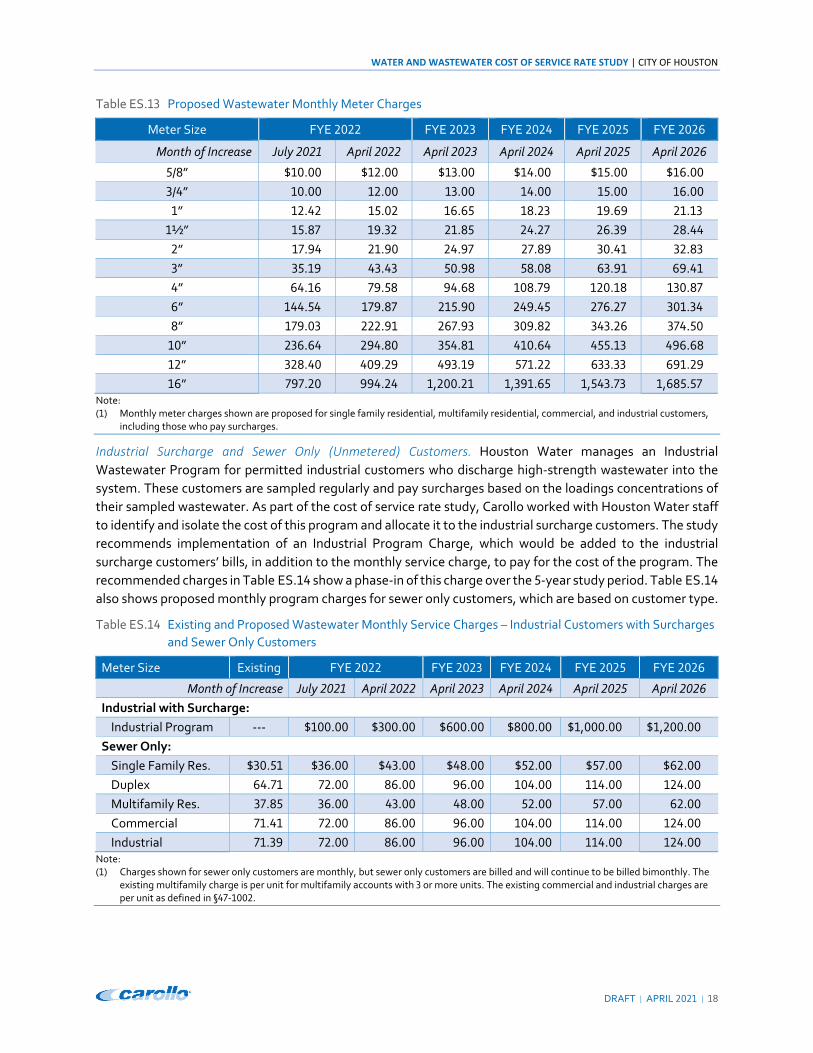
WATER AND WASTEWATER COST OF SERVICE RATE STUDY | CITY OF HOUSTON
DRAFT | APRIL |
Table ES. Proposed Wastewater Monthly Meter Charges
Meter Size FYE FYE FYE FYE FYE
Month of Increase July April April April April April
/ ” . . . . . .
/ ” . . . . . .
” . . . . . .
½” . . . . . .
” . . . . . .
” . . . . . .
” . . . . . .
” . . . . . .
” . . . . . .
” . . . . . .
” . . . . . .
” . . , . , . , . , . Note: ( ) Monthly meter charges shown are proposed for single family residential, multifamily residential, commercial, and industrial customers,
including those who pay surcharges.
Industrial Surcharge and Sewer Only (Unmetered) Customers. Houston Water manages an Industrial
Wastewater Program for permitted industrial customers who discharge high‐strength wastewater into the
system. These customers are sampled regularly and pay surcharges based on the loadings concentrations of
their sampled wastewater. As part of the cost of service rate study, Carollo worked with Houston Water staff
to identify and isolate the cost of this program and allocate it to the industrial surcharge customers. The study
recommends implementation of an Industrial Program Charge, which would be added to the industrial
surcharge customers’ bills, in addition to the monthly service charge, to pay for the cost of the program. The
recommended charges in Table ES. show a phase‐in of this charge over the ‐year study period. Table ES.
also shows proposed monthly program charges for sewer only customers, which are based on customer type.
Table ES. Existing and Proposed Wastewater Monthly Service Charges – Industrial Customers with Surcharges
and Sewer Only Customers
Meter Size Existing FYE FYE FYE FYE FYE
Month of Increase July April April April April April
Industrial with Surcharge:
Industrial Program ‐‐‐ . . . . , . , .
Sewer Only:
Single Family Res. . . . . . . .
Duplex . . . . . . .
Multifamily Res. . . . . . . .
Commercial . . . . . . .
Industrial . . . . . . . Note: ( ) Charges shown for sewer only customers are monthly, but sewer only customers are billed and will continue to be billed bimonthly. The
existing multifamily charge is per unit for multifamily accounts with or more units. The existing commercial and industrial charges are per unit as defined in § ‐ .

WATER AND WASTEWATER COST OF SERVICE RATE STUDY | CITY OF HOUSTON
DRAFT | APRIL |
ES.7.2.2 Volume Rates
Variable volume rates include a flow component, which represents the cost to collect and treat wastewater
flow; a biochemical oxygen demand (BOD) component, which represents the cost to treat BOD; a total
suspended solids (TSS) component, which represents the cost to treat TSS; and an ammonia component,
which represents the cost to treat ammonia. These costs are allocated to the different customer types based
on their contributed flows and assumed loadings (BOD, TSS, and ammonia). The allocated components are
then summed and divided by the projected flow to calculate the average rate per , gallons for each
customer type. The billable volume for each customer is equal to the metered water usage, with the exception
of unmetered sewer only customers and those customers with effluent meters.
Single Family Residential Customers. Similar to the existing single family residential water rate structure, the
existing single family residential wastewater rate structure is made up of rates that vary for each incremental
, gallons for the first , gallons, increasing and decreasing as a customer’s billable volume goes up.
This results in large bill increases at specific usage intervals. Carollo recommends simplifying this structure to
two blocks with a reduced rate per , gallons for the first , gallons and a higher rate per , gallons
for all usage in excess of , gallons per month.
Table ES. shows the existing and proposed single family residential wastewater volume rates for the study
period.
Table ES. Existing and Proposed Single Family Residential Wastewater Volume Rates
Rate Block Existing FYE FYE FYE FYE FYE
Month of Increase July April April April April April
First kgal .
. . . . . . Next kgal .
Next kgal .
Next kgal .
. . . . . . Next kgal .
Over kgal .
To calculate the monthly wastewater bill, customers add the appropriate monthly meter charge from
Table ES. (existing charges) or Table ES. (proposed charges) and add the volume rate for each
incremental , ‐gallon unit from Table ES. . Table ES. shows existing and proposed monthly
wastewater bills for single family residential customers with usage up to , gallons in one month.
Table ES. Existing and Proposed Single Family Residential Bills – Wastewater Only
Billable Volume Existing FYE FYE FYE FYE FYE
Month of Increase July April April April April April
Meter Charge only . . . . . . .
, gallons . . . . . . .
, gallons . . . . . . .
, gallons . . . . . . .
, gallons . . . . . . .
, gallons . . . . . . .
, gallons . . . . . . .

WATER AND WASTEWATER COST OF SERVICE RATE STUDY | CITY OF HOUSTON
DRAFT | APRIL |
Figure ES. illustrates the existing and proposed single family residential wastewater rates and bills for the
first , gallons in , ‐gallon increments.
Figure ES. Existing and Proposed Single Family Residential Wastewater Rates and Bills
Other Retail Customer Types. With the exception of industrial customers who do not pay surcharges, all other
retail customer types pay a uniform rate per , gallons for all billable volume, which varies by customer
type. Non‐surcharge industrial customers pay a reduced rate for the first , gallons; all usage in excess of
, gallons is assessed a higher rate. Carollo recommends Houston Water continue to charge uniform rates
for all retail customer types other than single family residential, including all industrial customers. Table ES.
shows existing and proposed volume rates for all retail customer types except single family residential.
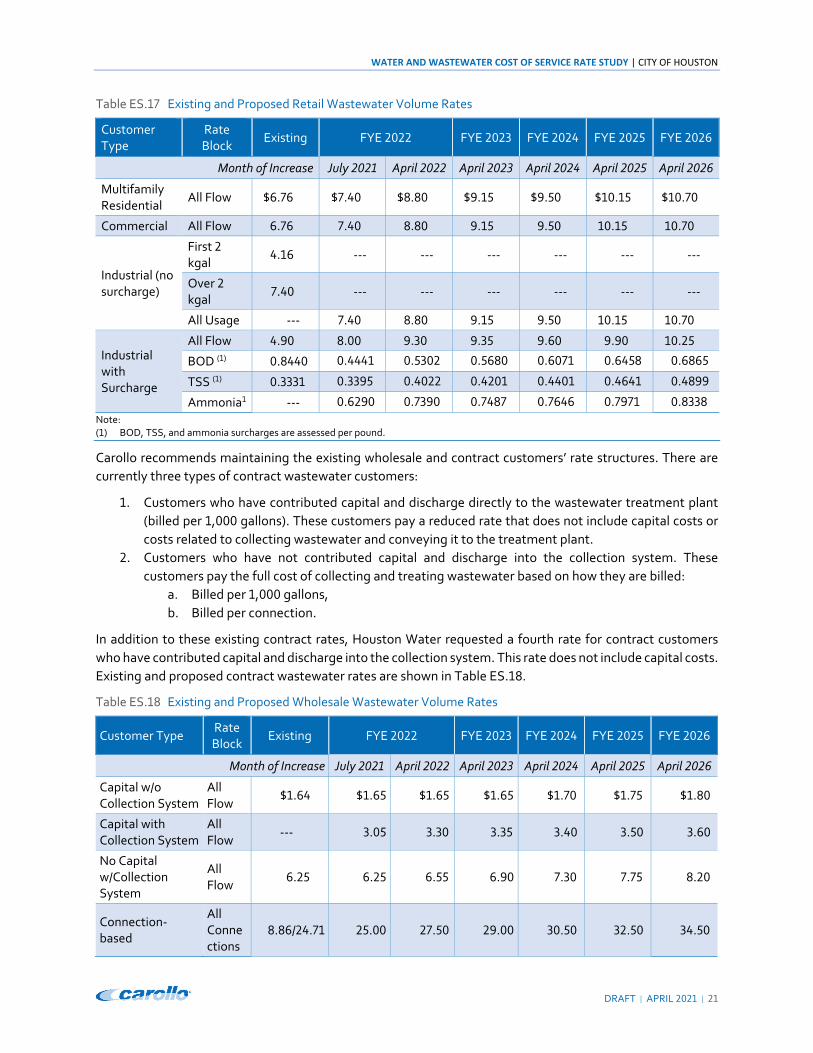
WATER AND WASTEWATER COST OF SERVICE RATE STUDY | CITY OF HOUSTON
DRAFT | APRIL |
Table ES. Existing and Proposed Retail Wastewater Volume Rates
Customer Type
Rate Block
Existing FYE FYE FYE FYE FYE
Month of Increase July April April April April April
Multifamily Residential
All Flow . . . . . . .
Commercial All Flow . . . . . . .
Industrial (no surcharge)
First kgal
. ‐‐‐ ‐‐‐ ‐‐‐ ‐‐‐ ‐‐‐ ‐‐‐
Over kgal
. ‐‐‐ ‐‐‐ ‐‐‐ ‐‐‐ ‐‐‐ ‐‐‐
All Usage ‐‐‐ . . . . . .
Industrial with Surcharge
All Flow . . . . . . .
BOD ( ) . . . . . . .
TSS ( ) . . . . . . .
Ammonia ‐‐‐ . . . . . .
Note: ( ) BOD, TSS, and ammonia surcharges are assessed per pound.
Carollo recommends maintaining the existing wholesale and contract customers’ rate structures. There are
currently three types of contract wastewater customers:
. Customers who have contributed capital and discharge directly to the wastewater treatment plant
(billed per , gallons). These customers pay a reduced rate that does not include capital costs or
costs related to collecting wastewater and conveying it to the treatment plant.
. Customers who have not contributed capital and discharge into the collection system. These
customers pay the full cost of collecting and treating wastewater based on how they are billed:
a. Billed per , gallons,
b. Billed per connection.
In addition to these existing contract rates, Houston Water requested a fourth rate for contract customers
who have contributed capital and discharge into the collection system. This rate does not include capital costs.
Existing and proposed contract wastewater rates are shown in Table ES. .
Table ES. Existing and Proposed Wholesale Wastewater Volume Rates
Customer Type Rate Block
Existing FYE FYE FYE FYE FYE
Month of Increase July April April April April April
Capital w/o Collection System
All Flow
. . . . . . .
Capital with Collection System
All Flow
‐‐‐ . . . . . .
No Capital w/Collection System
All Flow
. . . . . . .
Connection‐based
All Connections
. / . . . . . . .

WATER AND WASTEWATER COST OF SERVICE RATE STUDY | CITY OF HOUSTON
DRAFT | APRIL |
ES.7.3 Customer Bill Impacts
Figure ES. illustrates the impact of the recommended rates on the combined water and wastewater bill for
single family residential customers with a / ‐inch meter across various usage levels. The
incremental percentage of single family residential bills is shown between usage levels. The estimated per
capita usage at each level is shown at the far right of each line. This estimate assumes . people per account.
Figure ES. Single Family Residential Monthly Combined Bill Impact

WATER AND WASTEWATER COST OF SERVICE RATE STUDY | CITY OF HOUSTON
DRAFT | APRIL |
Figure ES. illustrates the impact of the recommended rates on the combined water and wastewater bill for
multifamily residential customers with varied meter sizes and usage levels. The incremental percentage of
multifamily residential bills is shown between usage levels.
Figure ES. Multifamily Residential Monthly Combined Bill Impact

WATER AND WASTEWATER COST OF SERVICE RATE STUDY | CITY OF HOUSTON
DRAFT | APRIL |
Figure ES. illustrates the impact of the recommended rates on the combined water and wastewater bill for
commercial and industrial customers with varied meter sizes and usage levels. The incremental percentage of
commercial and industrial bills is shown between usage levels.
Figure ES. Commercial/Industrial Monthly Combined Bill Impact

WATER AND WASTEWATER COST OF SERVICE RATE STUDY | CITY OF HOUSTON
DRAFT | APRIL |
Figure ES. illustrates the percentage of single family residential customers with varying levels of monthly
bill adjustments for the proposed rate schedule effective July , .
Figure ES. Distribution of July Monthly Combined Bill Impacts for Single Family Residential Customers
ES.8 Recommendations
Carollo recommends implementation of the water and wastewater rates as proposed in this Executive
Summary and described below:
Water sales revenue increases by . percent on July , , by . percent on April , , and
April , , and by . percent on April , , April , , and April , .
Wastewater user charge revenue increases by . percent on July , , by . percent on April
, , and by . percent on April , , April , , April , , and April , .
Water monthly service charge based on meter size and uniform for single family residential, multifamily
residential, commercial/industrial, and irrigation customers. Other customer types pay monthly service
charges based on meter size that differ based on the customer type and service provided.
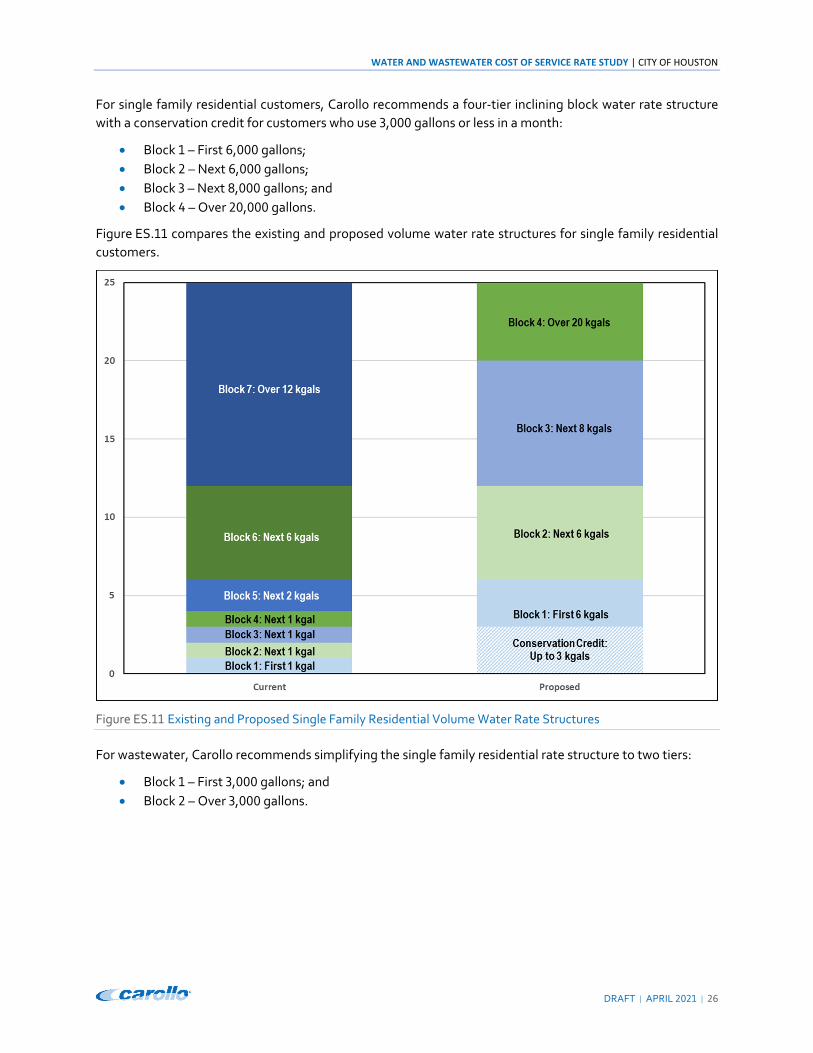
WATER AND WASTEWATER COST OF SERVICE RATE STUDY | CITY OF HOUSTON
DRAFT | APRIL |
For single family residential customers, Carollo recommends a four‐tier inclining block water rate structure
with a conservation credit for customers who use , gallons or less in a month:
Block – First , gallons;
Block – Next , gallons;
Block – Next , gallons; and
Block – Over , gallons.
Figure ES. compares the existing and proposed volume water rate structures for single family residential
customers.
Figure ES. Existing and Proposed Single Family Residential Volume Water Rate Structures
For wastewater, Carollo recommends simplifying the single family residential rate structure to two tiers:
Block – First , gallons; and
Block – Over , gallons.

WATER AND WASTEWATER COST OF SERVICE RATE STUDY | CITY OF HOUSTON
DRAFT | APRIL |
Figure ES. compares the existing and proposed volume water rate structures for single family residential
customers.
Figure ES. Existing and Proposed Single Family Residential Volume Wastewater Rate Structures
Carollo recommends a uniform rate per , gallons for both water and wastewater for multifamily
residential and nonresidential customers.
Finally, Carollo recommends Houston Water update this cost of service rate study within five years to maintain
revenue sufficiency and equity among customers.

WATER AND WASTEWATER COST OF SERVICE RATE STUDY | CITY OF HOUSTON
DRAFT | APRIL |
Chapter 1
REVENUE REQUIREMENT ANALYSIS
1.1 Overview
The study analyzed the revenue requirements to test the fiscal health of the water and wastewater system,
evaluate the adequacy of current rates and charges, and set the basis for the five‐year rate plan. The adequacy
of the existing rate structure can be measured by comparing revenue requirement projections against revenue
projections under existing rates. If revenue projections under existing rates do not meet forecasted
requirements, rates need to be adjusted.
The revenue requirement analysis covers the study period FYE through FYE . However, the primary
focus of this report is the five‐year rate setting period, FYE through FYE . Houston Water approved
an automatic rate increase of . percent, which became effective on April , .
1.1.1 Revenue Requirement Purpose and Components
The purpose of the Revenue Requirements Analysis is to determine the adequate and appropriate funding for
the Utility. Revenue requirements are the summation of expenses or costs for providing safe drinking water
and handling wastewater to return clean water to the environment. They are determined on an annual basis,
and they include:
Operations & Maintenance – salaries and benefits, chemicals, power, vehicles, equipment, supplies,
etc. Some costs vary by the volume of treatment such as chemicals and power, but other costs are
fixed and independent of volume such as salaries and vehicles.
Capital Improvements – design and construction of new and replacement infrastructure, including
labor for Houston Water employees and fees for consultants and contractors that perform this work
Financing – debt service payments, bond issuance costs, commercial paper fees, etc.
In addition to expenses, most debt instruments (bonds and loans) require the utility to keep a certain amount
of cash in reserve dependent upon the amount of the debt. This cash reserve is restricted and cannot be used
to pay for the Utility’s expenses. Houston Water also maintains unrestricted cash, which can be used to pay
for expenses in the event of unforeseen circumstances that result in insufficient revenues or unplanned
expenses.
1.1.2 Revenue Requirement Tests
The revenue requirement analysis uses two tests to evaluate Houston water’s fiscal health and measure the
adequacy of current rates. If revenues are not sufficient to satisfy both tests, the greater deficiency (shortfall)
drives the planned revenue increase.
WATER AND WASTEWATER COST OF SERVICE RATE STUDY | CITY OF HOUSTON
DRAFT | APRIL |
1.1.2.1 Debt Service Coverage Test
Many water and wastewater utilities use debt, such as revenue bonds, to fund a portion of their capital
expenses. Debt financing typically comes with a coverage requirement, which refers to the collection of
revenues to meet all operating expenses and debt service obligations. An additional multiple of that debt
service. Debt service coverage is dictated by the utility’s bond covenants and establishes a threshold above
basic debt service that the agency must collect in revenues. The debt service coverage test measures the
ability of a utility to meet both legal and target revenue obligations associated with debt.
To ensure that Houston Water retains financial flexibility for contingencies, the City targets higher standards
than the Master Ordinance minimum DSCR requirements of . x for first lien debt and . x for total debt.
The Utility’s target DSCR for first lien and junior lien combined is . x, and the target DSCR for total debt is
. x. This means Houston Water strives to generate revenue sufficient to pay all of its operating expenses
and debt service on first and junior liens, plus an amount equal to percent of first and junior lien debt
service. When all other debt service is factored into this formula, the net revenue should be equal to at least
percent of the total debt service payment. Carollo recommends Houston Water continue to target . x
DSCR for first lien and junior lien but not drop below . x.
1.1.2.2 Cash Balance Test
The utility’s cash balance indicates its ability to financially sustain operations during unforeseen circumstances
that may restrict its revenues and/or require unplanned expenses. This is especially important for a utility like
Houston Water that is vulnerable to extreme weather events. Houston Water’s minimum cash balance is equal
to days of O&M expenses.
The cash balance test determines if the cash flow generated from projected revenues is sufficient to fully fund
all revenue requirements, including maintaining the ending cash balance of at least days of O&M
expenses. Since O&M expenses are projected to increase each year, the minimum cash balance must also
increase to maintain a balance of at least days, which is factored into the revenue requirements.
1.2 Water System
1.2.1 Expenses
Houston Water’s total revenue requirements are comprised of operating expenses and capital expenses,
which are described in detail in this section. For FYE , total revenue requirements are percent
operating and percent capital. By FYE , that split has shifted to percent operating and percent
capital.
1.2.1.1 Operating Expenses
Houston Water’s FYE O&M budget for the water system is organized into cost centers under three
categories – ( ) Drinking Water Operations, ( ) Operation Services General and Administrative (G&A), and ( )
Other O&M. Drinking Water Operations is approximately percent of the total O&M budget, while
Operation Services and Other O&M make up percent and percent, respectively. The study projects O&M
expenses for the five‐year study period using the FYE budget and escalating each line item at an annual
inflation rate of . percent. The exception to this is Cost Center for the Northeast WPP Expansion. The
O&M expenses for this cost center are projected based on engineering cost estimates provided by Carollo to
Houston Water in a technical memorandum dated July , . Table . summarizes the O&M budget
projections by cost center.

WATER AND WASTEWATER COST OF SERVICE RATE STUDY | CITY OF HOUSTON
DRAFT | APRIL |
Table . Water O&M Budget Projections ( millions) ( )
Description FYE
FYE
FYE
FYE
FYE
FYE
Drinking Water Operations:
– DWO Executive Support G&A . . . . . .
– DWO Regulatory / Compliance . . . . . .
– DWO Ground Water Operations . . . . . .
– DWO East WPP . . . . . .
– DWO Technical Services G&A . . . . . .
– DWO NEWPP Expansion . . . . . .
– DWO Southeast WPP . . . . . .
– DWO Northeast WPP . . . . . .
– DWO System Maint – North . . . . . .
– DWO System Maint – South . . . . . .
River Authority Contributed Debt Service . . . . . .
Total Drinking Water Operations . . . . . .
Operation Services (G&A):
– OPS Fin / Support Op Svcs G&A . . . . . .
– Houston Water Planning . . . . . .
– OPS Maint Op Svcs – Restoration . . . . . .
– OPS Maint Op Svcs‐COS/DIS . . . . . .
– HW GIS Services . . . . . .
– OPS Executive Support . . . . . .
– OPS Support Services . . . . . .
– HW Infrastructure Planning . . . . . .
– HW Utility Analysis . . . . . .
Total Operation Services (G&A) . . . . . .
Other O&M:
‐ – Director's Office . . . . . .
– Information Technology . . . . . .
‐ – Management Support . . . . . .
/ – Houston Water – Planning . . . . . .
/ / / – Fin Mgmt Svcs Support . . . . . .
‐ , – CAS Cust Acct Svcs . . . . . .
Deductions ( . ) ( . ) ( . ) ( . ) ( . ) ( . )
Total Other O&M . . . . . .
TOTAL O&M EXPENSES . . . . . .
Notes: ( ) Values are in million dollars and are rounded.

WATER AND WASTEWATER COST OF SERVICE RATE STUDY | CITY OF HOUSTON
DRAFT | APRIL |
1.2.1.2 Capital Expenses
Capital expenses include debt service payments, bad debt expense, and cash‐funded CIP (PAYGO).
Annual Debt Service. Debt service during the study period consists of annual payments on outstanding and
proposed debt obligations and represents about percent of total revenue requirements in FYE ,
increasing to percent by FYE . Table . summarizes the existing and future annual debt service
payments by type for FYE through FYE .
Table . Water Annual Debt Service ( millions) ( )
Description FYE FYE FYE FYE FYE FYE
Existing Debt Service:
Junior Lien . . . . . .
First Lien . . . . . .
Subordinate Lien . . . . . .
Commercial Paper . . . . . .
Existing Debt Service . . . . . .
Future Debt Service:
First Lien – NEWPP . . . . . .
First Lien – Other . . . . . .
Future Debt Service . . . . . .
DEBT SERVICE ( ) . . . . . .
Note: ( ) Values are in million dollars and are rounded. ( ) For the purposes of this table, debt service calculations do not include pension obligations, discretionary debt service, and other
obligations.
From Section . . . Houston Water’s target debt service coverage ratio is . times the annual debt service
payment for junior and first liens and . times the total annual debt service payment. This means there must
be . in net revenue (revenue less operating expenses) available for every . of junior and first lien debt
service outstanding and . in net revenue available for every . of total debt service outstanding for the
year in which coverage is being measured.
Capital Improvement Plan. Houston Water’s CIP for the five‐year period FYE through FYE totals .
billion for the water system. Of this, . billion ( percent) is planned for annual infrastructure investment
from the Needs Assessment, million ( percent) is planned for the Northeast WPP Expansion, and
the remaining is allocated to various other water capital improvements. Table . summarizes Houston
Water’s CIP for the water system for the period FYE through FYE .

WATER AND WASTEWATER COST OF SERVICE RATE STUDY | CITY OF HOUSTON
DRAFT | APRIL |
Table . Water Capital Improvement Plan Summary ( millions) ( )
Description FYE FYE FYE FYE FYE FYE
Active CIP – NEWPP . . . . . .
Active CIP – Other ( ) . . . . . .
Incremental CIP – NEWPP . . . . . .
Incremental CIP – Drinking Water . . . . . .
Incremental CIP – Customer Account Svcs . . . . . .
Annual Infrastructure Investment Needs . . . . . .
Total Water CIP . . . . . .
Notes: ( ) Values are in million dollars and are rounded. ( ) Active CIP projects that were included as recommendations from the Needs Assessment have been removed and included with
Annual Infrastructure Investment Needs.
The CIP funding plan is outlined in Table . . Houston Water uses a mix of financing to pay for capital projects,
including commercial paper, revenue bonds, and cash. The annual debt service payments and PAYGO are
funded from rate revenue, impact fee revenue, and unrestricted cash. Houston Water has historically set
PAYGO at million per year, or approximately percent of the annual CIP, for the combined water and
wastewater utility. For this study, PAYGO is assumed to be percent of the CIP up to million per year.
Carollo recommends this cap based on discussions with Houston Water staff and analysis of PAYGO amounts
to minimize the required revenue increases.
Table . Water Capital Improvement Plan Funding ( millions) ( )
Description FYE FYE FYE FYE FYE FYE
Construction Fund . . . . . .
PAYGO (Cash) . . . . . .
Debt – Commercial Paper . . . . . .
Debt – First Lien ( ) . . . . . .
Total Water CIP . . . . . .
Notes: ( ) Values are in million dollars and are rounded. ( ) NEWPP construction cost will be financed entirely with FYE debt, including . million in FYE .
The FYE budgeted expenses and projected expenses for the water system for FYE through FYE
are included in Appendix A.
1.2.2 Revenues
Operating revenues for Houston Water’s water system are primarily derived from rates and charges for
treated and untreated water service, which are the focus of this report. Other operating revenues include
penalties and fees for miscellaneous services, which were updated as part of this study in a separate report.
Non‐operating revenues include impact fees, sales of assets, facility rental fees, and permitting fees. Impact
fee revenue is estimated based on the proposed impact fee implementation schedule, shown in Table .
Interest income on investments is based on projected . percent interest earned on the cash balance.

WATER AND WASTEWATER COST OF SERVICE RATE STUDY | CITY OF HOUSTON
DRAFT | APRIL |
Table . Proposed Water Impact Fees
Description FYE FYE FYE FYE FYE FYE
Percent of Calculated Impact Fee ( ) . % . % . % . % . % . %
Water Impact Fee . , . , . , . , . , .
Notes: ( ) FYE impact fee is based on calculated impact fee of , . . FYE through FYE impact fees are based on
calculated impact fee of , . .
Table . summarizes projected annual water revenue for the study period before proposed revenue increases
(rate adjustments).
Table . Projected Annual Water Revenue Before Revenue Increases ( millions) ( )
Description FYE FYE FYE FYE FYE FYE
Operating Revenue:
Water Sales ( ) . . . . . .
Water Service Penalties . . . . . .
Other Non‐rate Operating Revenue . . . . . .
Total Operating Revenue . . . . . .
Non‐operating Revenue:
Impact Fee Revenue ( ) . . . . . .
Non‐rate Non‐operating Revenue . . . . . .
Interest . . . . . .
Total Non‐operating Revenue . . . . . .
TOTAL REVENUE . . . . . .
Notes: ( ) Values are in million dollars and are rounded. ( ) Water sales revenue shown is projected using existing rates effective April , . ( ) Impact fee revenue shown is projected using recommended impact fee implementation schedule from Table . .
The FYE budgeted revenues and projected revenues for the water system for FYE through FYE
are included in Appendix A.
1.2.3 Cash Balance
The cash balance represents the funds available for daily operations of the combined utility system. Houston
Water maintains a minimum cash balance of at least days of O&M expenses or approximately million
for the water system by FYE . Total cash available, including cash reserve requirements, at the beginning
of FYE totals an estimated . billion, with percent allocated to the water system for the purpose of
this analysis. Table . shows projected total cash without proposed revenue increases for the water system
for the period FYE through FYE .

WATER AND WASTEWATER COST OF SERVICE RATE STUDY | CITY OF HOUSTON
DRAFT | APRIL |
Table . Projected Water Cash Balance Before Revenue Increases ( millions) ( )
Description FYE FYE FYE FYE FYE FYE
Beginning Cash Balance (July ) . . . . ( . ) ( . )
Additions:
Total Revenues . . . . . .
Deductions:
Operations and Maintenance . . . . . .
Stormwater Fund O&M . . . . . .
Stormwater Fund Debt Service . . . . . .
TRA/Lake Livingston Dam Debt . . . . . .
Luce Bayou Debt . . . . . .
NEWPP Debt . . . . . .
Debt Service . . . . . .
Commercial Paper . . . . . .
Bad Debt . . . . . .
Capital Rollovers . . . . . .
PAYGO . . . . . .
Ending Cash Balance (June ) . . . ( . ) ( . ) ( . )
Target Cash Balance . . . . . .
Cash Surplus / (Deficit) . . ( . ) ( . ) ( . ) ( . )
Note: ( ) Values are in million dollars and are rounded.
1.2.4 Revenue Requirement Tests before Revenue Increases
1.2.4.1 Debt Service Coverage Test
Without revenue increases, the water system is not projected to meet its target debt service coverage ratios
in any year of the study period FYE through FYE . The debt service coverage test requires that
Houston Water revenues exceed operating expenses, junior and first lien debt service, and an additional
percent of annual debt service for junior and first liens. Revenues must also exceed operating expenses,
total debt service, and an additional percent of total annual debt service. This analysis focused on coverage
for junior and first liens because it was determined that the target coverage for total debt is met if the coverage
for junior and first liens is at least . x. The results of the debt service coverage test are summarized in
Table . .
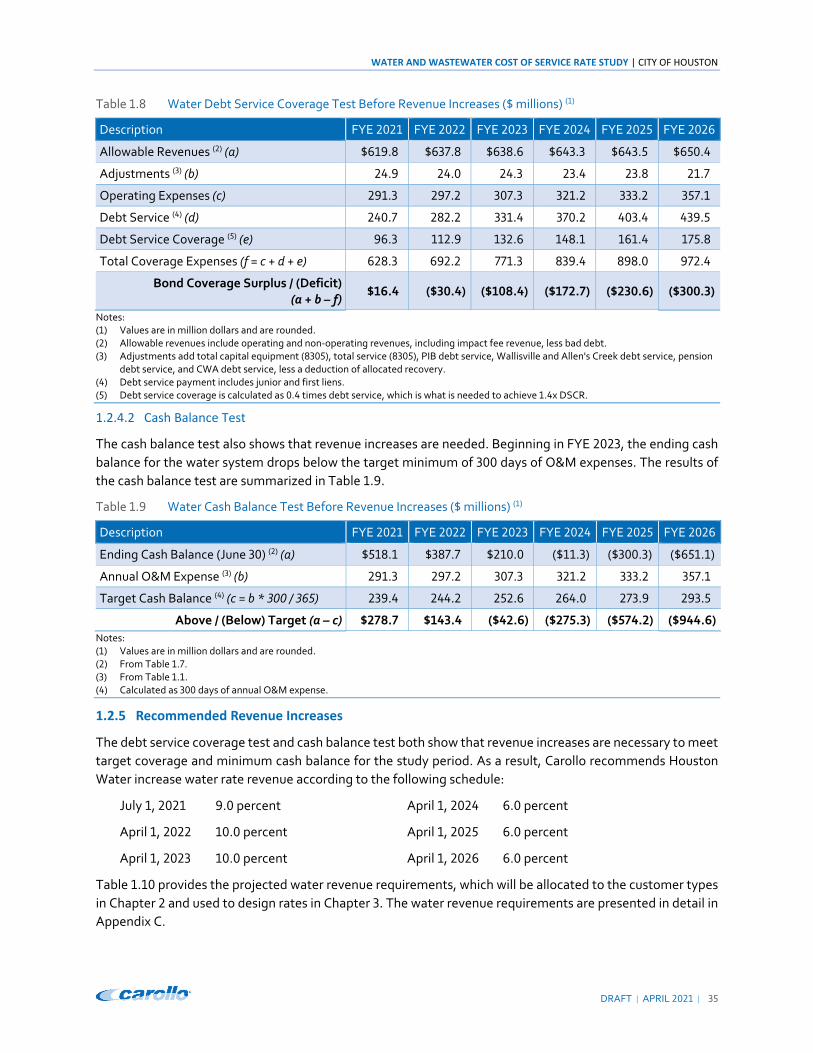
WATER AND WASTEWATER COST OF SERVICE RATE STUDY | CITY OF HOUSTON
DRAFT | APRIL |
Table . Water Debt Service Coverage Test Before Revenue Increases ( millions) ( )
Description FYE FYE FYE FYE FYE FYE
Allowable Revenues ( ) (a) . . . . . .
Adjustments ( ) (b) . . . . . .
Operating Expenses (c) . . . . . .
Debt Service ( ) (d) . . . . . .
Debt Service Coverage ( ) (e) . . . . . .
Total Coverage Expenses (f = c + d + e) . . . . . .
Bond Coverage Surplus / (Deficit) (a + b – f)
. ( . ) ( . ) ( . ) ( . ) ( . )
Notes: ( ) Values are in million dollars and are rounded. ( ) Allowable revenues include operating and non‐operating revenues, including impact fee revenue, less bad debt. ( ) Adjustments add total capital equipment ( ), total service ( ), PIB debt service, Wallisville and Allen's Creek debt service, pension
debt service, and CWA debt service, less a deduction of allocated recovery. ( ) Debt service payment includes junior and first liens. ( ) Debt service coverage is calculated as . times debt service, which is what is needed to achieve . x DSCR.
1.2.4.2 Cash Balance Test
The cash balance test also shows that revenue increases are needed. Beginning in FYE , the ending cash
balance for the water system drops below the target minimum of days of O&M expenses. The results of
the cash balance test are summarized in Table . .
Table . Water Cash Balance Test Before Revenue Increases ( millions) ( )
Description FYE FYE FYE FYE FYE FYE
Ending Cash Balance (June ) ( ) (a) . . . ( . ) ( . ) ( . )
Annual O&M Expense ( ) (b) . . . . . .
Target Cash Balance ( ) (c = b * / ) . . . . . .
Above / (Below) Target (a – c) . . ( . ) ( . ) ( . ) ( . )
Notes: ( ) Values are in million dollars and are rounded. ( ) From Table . . ( ) From Table . . ( ) Calculated as days of annual O&M expense.
1.2.5 Recommended Revenue Increases
The debt service coverage test and cash balance test both show that revenue increases are necessary to meet
target coverage and minimum cash balance for the study period. As a result, Carollo recommends Houston
Water increase water rate revenue according to the following schedule:
July , . percent April , . percent
April , . percent April , . percent
April , . percent April , . percent
Table . provides the projected water revenue requirements, which will be allocated to the customer types
in Chapter and used to design rates in Chapter . The water revenue requirements are presented in detail in
Appendix C.
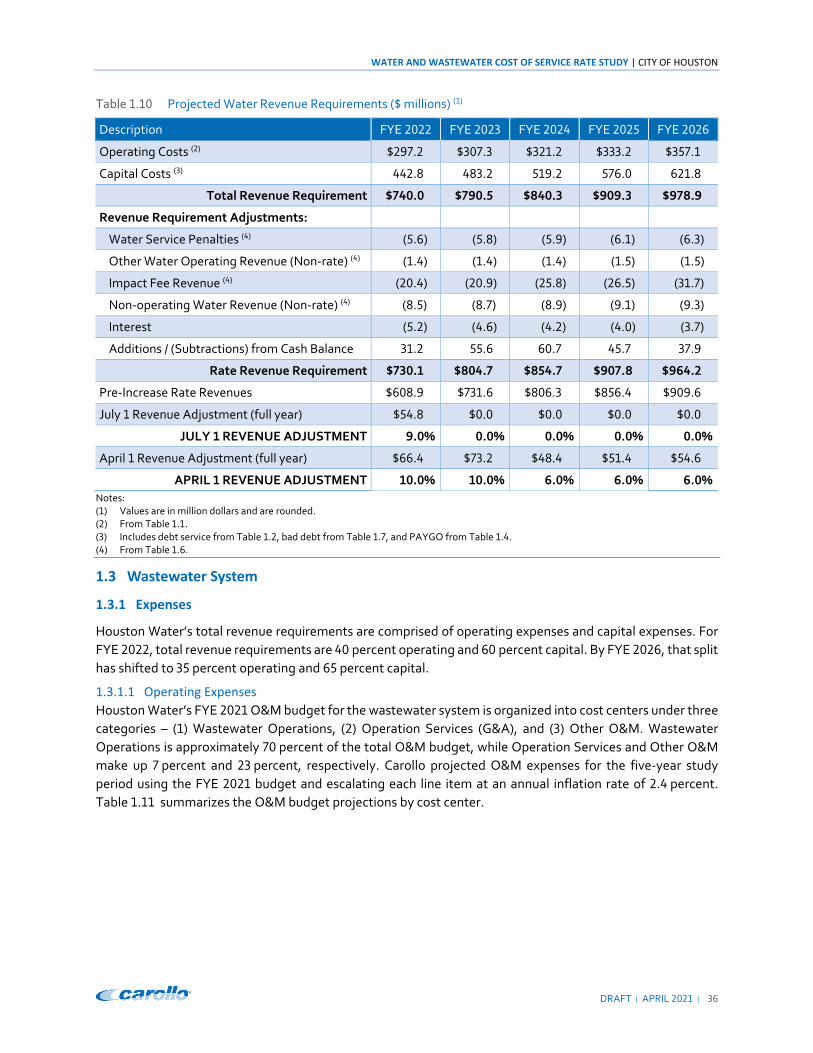
WATER AND WASTEWATER COST OF SERVICE RATE STUDY | CITY OF HOUSTON
DRAFT | APRIL |
Table . Projected Water Revenue Requirements ( millions) ( )
Description FYE FYE FYE FYE FYE
Operating Costs ( ) . . . . .
Capital Costs ( ) . . . . .
Total Revenue Requirement . . . . .
Revenue Requirement Adjustments:
Water Service Penalties ( ) ( . ) ( . ) ( . ) ( . ) ( . )
Other Water Operating Revenue (Non‐rate) ( ) ( . ) ( . ) ( . ) ( . ) ( . )
Impact Fee Revenue ( ) ( . ) ( . ) ( . ) ( . ) ( . )
Non‐operating Water Revenue (Non‐rate) ( ) ( . ) ( . ) ( . ) ( . ) ( . )
Interest ( . ) ( . ) ( . ) ( . ) ( . )
Additions / (Subtractions) from Cash Balance . . . . .
Rate Revenue Requirement . . . . .
Pre‐Increase Rate Revenues . . . . .
July Revenue Adjustment (full year) . . . . .
JULY REVENUE ADJUSTMENT . % . % . % . % . %
April Revenue Adjustment (full year) . . . . .
APRIL REVENUE ADJUSTMENT . % . % . % . % . %
Notes: ( ) Values are in million dollars and are rounded. ( ) From Table . . ( ) Includes debt service from Table . , bad debt from Table . , and PAYGO from Table . . ( ) From Table . .
1.3 Wastewater System
1.3.1 Expenses
Houston Water’s total revenue requirements are comprised of operating expenses and capital expenses. For
FYE , total revenue requirements are percent operating and percent capital. By FYE , that split
has shifted to percent operating and percent capital.
1.3.1.1 Operating Expenses
Houston Water’s FYE O&M budget for the wastewater system is organized into cost centers under three
categories – ( ) Wastewater Operations, ( ) Operation Services (G&A), and ( ) Other O&M. Wastewater
Operations is approximately percent of the total O&M budget, while Operation Services and Other O&M
make up percent and percent, respectively. Carollo projected O&M expenses for the five‐year study
period using the FYE budget and escalating each line item at an annual inflation rate of . percent.
Table . summarizes the O&M budget projections by cost center.

WATER AND WASTEWATER COST OF SERVICE RATE STUDY | CITY OF HOUSTON
DRAFT | APRIL |
Table . Wastewater O&M Budget Projections ( millions) ( )
Description FYE FYE FYE FYE FYE FYE
Wastewater Operations:
– WWO Executive Support G&A . . . . . .
– WWO Coll System Analysis . . . . . .
– WWO Collection System Repairs . . . . . .
– WWO Regulatory / Compliance . . . . . .
– WWO Technical Services G&A . . . . . .
– WWO Plant Operations . . . . . .
– WWO Electrical & Automation . . . . . .
– WWO Construction Mgmt . . . . . .
– WWO Contract Management . . . . . .
– WWO Mechanical Management . . . . . .
– WWO Maint Operation Svcs . . . . . .
– WWO EPA Compliance . . . . . .
Total Wastewater Operations . . . . . .
Operation Services (G&A):
– OPS Fin / Support Op Svcs G&A . . . . . .
– Houston Water Planning . . . . . .
– OPS Maint Op Svcs – Restoration . . . . . .
– OPS Maint Op Svcs‐COS/DIS . . . . . .
– HW GIS Services . . . . . .
– OPS Executive Support . . . . . .
– OPS Support Services . . . . . .
– HW Infrastructure Planning . . . . . .
– HW Utility Analysis . . . . . .
Total Operation Services (G&A) . . . . . .
Other O&M:
‐ – Director's Office . . . . . .
– Information Technology . . . . . .
‐ – Management Support . . . . . .
/ – Houston Water – Planning . . . . . .
/ / / – Fin Mgmt Svcs Support . . . . . .
‐ , – CAS Cust Acct Svcs . . . . . .
Deductions ( . ) ( . ) ( . ) ( . ) ( . ) ( . )
Total Other O&M . . . . . .
TOTAL O&M EXPENSES . . . . . .
Notes: ( ) Values are in million dollars and are rounded.
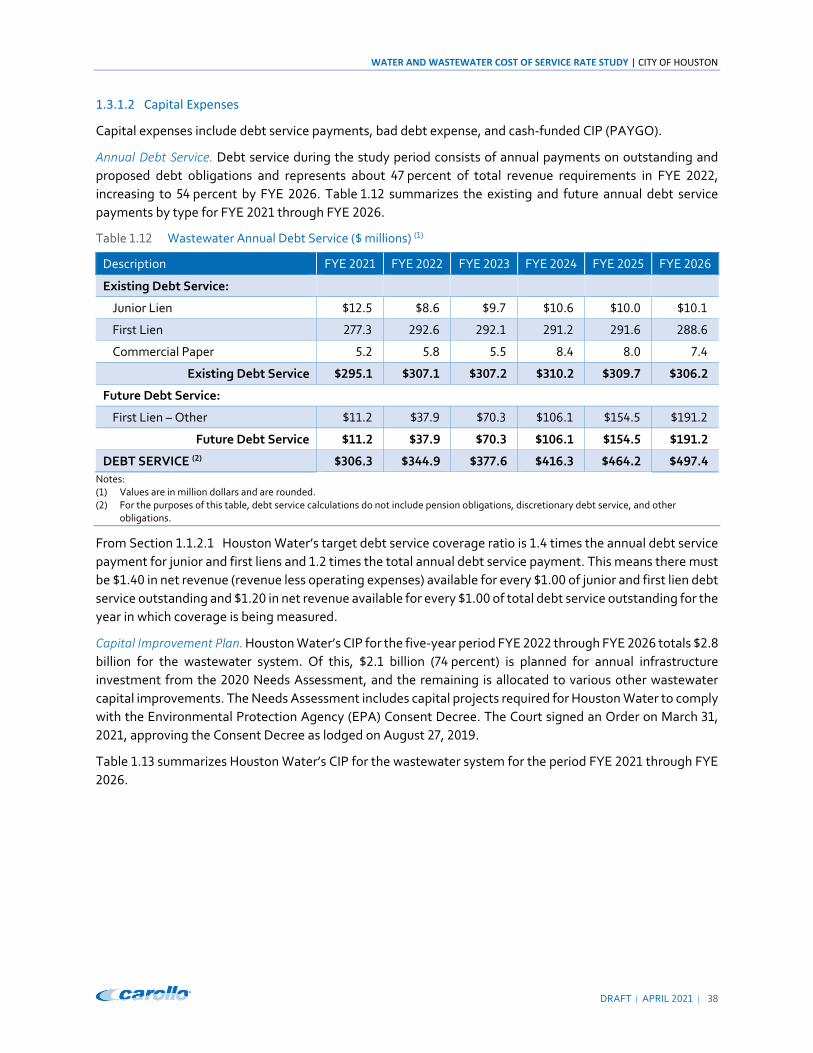
WATER AND WASTEWATER COST OF SERVICE RATE STUDY | CITY OF HOUSTON
DRAFT | APRIL |
1.3.1.2 Capital Expenses
Capital expenses include debt service payments, bad debt expense, and cash‐funded CIP (PAYGO).
Annual Debt Service. Debt service during the study period consists of annual payments on outstanding and
proposed debt obligations and represents about percent of total revenue requirements in FYE ,
increasing to percent by FYE . Table . summarizes the existing and future annual debt service
payments by type for FYE through FYE .
Table . Wastewater Annual Debt Service ( millions) ( )
Description FYE FYE FYE FYE FYE FYE
Existing Debt Service:
Junior Lien . . . . . .
First Lien . . . . . .
Commercial Paper . . . . . .
Existing Debt Service . . . . . .
Future Debt Service:
First Lien – Other . . . . . .
Future Debt Service . . . . . .
DEBT SERVICE ( ) . . . . . .
Notes: ( ) Values are in million dollars and are rounded. ( ) For the purposes of this table, debt service calculations do not include pension obligations, discretionary debt service, and other
obligations.
From Section . . . Houston Water’s target debt service coverage ratio is . times the annual debt service
payment for junior and first liens and . times the total annual debt service payment. This means there must
be . in net revenue (revenue less operating expenses) available for every . of junior and first lien debt
service outstanding and . in net revenue available for every . of total debt service outstanding for the
year in which coverage is being measured.
Capital Improvement Plan. Houston Water’s CIP for the five‐year period FYE through FYE totals .
billion for the wastewater system. Of this, . billion ( percent) is planned for annual infrastructure
investment from the Needs Assessment, and the remaining is allocated to various other wastewater
capital improvements. The Needs Assessment includes capital projects required for Houston Water to comply
with the Environmental Protection Agency (EPA) Consent Decree. The Court signed an Order on March ,
, approving the Consent Decree as lodged on August , .
Table . summarizes Houston Water’s CIP for the wastewater system for the period FYE through FYE
.

WATER AND WASTEWATER COST OF SERVICE RATE STUDY | CITY OF HOUSTON
DRAFT | APRIL |
Table . Wastewater Capital Improvement Plan Summary ( millions) ( )
Description FYE FYE FYE FYE FYE FYE
Active CIP ( ) . . . . . .
Incremental CIP . . . . . .
Annual Infrastructure Investment Needs . . . . . .
Total Wastewater CIP . . . . . .
Notes: ( ) Values are in million dollars and are rounded. ( ) Active CIP projects that were included as recommendations from the Needs Assessment have been removed and included with
Annual Infrastructure Investment Needs.
The CIP funding plan is outlined in Table . . Houston Water uses a mix of financing to pay for capital
projects, including commercial paper, revenue bonds, and cash. The annual debt service payments and
PAYGO are funded from rate revenue, impact fee revenue, and cash. Houston Water has historically set
PAYGO at million per year for the combined water and wastewater utility. For this study, PAYGO is
increased to percent of the CIP up to million per year. Carollo recommends this cap based on
discussions with Houston Water staff and analysis of PAYGO amounts to minimize the required revenue
increases.
Table . Wastewater Capital Improvement Plan Funding ( millions) ( )
Description FYE FYE FYE FYE FYE FYE
Construction Fund . . . . . .
PAYGO (Cash) . . . . . .
Debt – Commercial Paper . . . . . .
Debt – First Lien . . . . . .
Total Wastewater CIP . . . . . .
Notes: ( ) Values are in million dollars and are rounded.
The FYE budgeted expenses and projected expenses for the wastewater system for FYE through
FYE are included in Appendix B.
1.3.2 Revenues
Operating revenues for Houston Water’s wastewater system are primarily derived from rates and charges for
wastewater service, which are the focus of this report. Other operating revenues include penalties and fees
for miscellaneous services, which were updated as part of this study in a separate report.
Non‐operating revenues include impact fees, sales of assets, facility rental fees, and permitting fees. Impact
fee revenue is estimated based on the proposed impact fee implementation schedule, shown in Table . .
Interest income on investments is based on projected . percent interest earned on the cash balance.
Table . Proposed Wastewater Impact Fees ( millions)
Description FYE FYE FYE FYE FYE FYE
Percent of Calculated Impact Fee ( ) . % . % . % . % . % . %
Wastewater Impact Fee , . , . , . , . , . , .
Notes: ( ) FYE impact fee is based on calculated impact fee of , . . FYE through FYE impact fees are based on
calculated impact fee of , . .

WATER AND WASTEWATER COST OF SERVICE RATE STUDY | CITY OF HOUSTON
DRAFT | APRIL |
Table . summarizes projected annual wastewater revenue for the study period before proposed revenue
increases (rate adjustments).
Table . Projected Annual Wastewater Revenue Before Revenue Increases ( millions) ( )
Description FYE FYE FYE FYE FYE FYE
Operating Revenue:
Wastewater User Charges ( ) . . . . . .
Sewer Service Penalties . . . . . .
Other Non‐rate Operating Revenue . . . . . .
Total Operating Revenue . . . . . .
Non‐operating Revenue:
Impact Fee Revenue ( ) . . . . . .
Non‐rate Non‐operating Revenue . . . . . .
Interest . . . . . .
Total Non‐operating Revenue . . . . . .
TOTAL REVENUE . . . . . .
Notes: ( ) Values are in million dollars and are rounded. ( ) Wastewater user charge revenue shown is projected using existing rates effective April , . ( ) Impact fee revenue shown is projected using recommended impact fee implementation schedule from Table . .
The FYE budgeted revenues and projected revenues for the wastewater system for FYE through
FYE are included in Appendix B.
1.3.3 Cash Balance
The cash balance represents the funds available for daily operations of the combined utility system. Houston
Water maintains a minimum cash balance of at least days of O&M expenses or approximately million
for the wastewater system by FYE . Total cash available at the beginning of FYE totals an estimated
. billion, with percent allocated to the wastewater system for the purpose of this analysis. Table .
shows the projection of cash balances for the wastewater system for the period FYE through FYE .

WATER AND WASTEWATER COST OF SERVICE RATE STUDY | CITY OF HOUSTON
DRAFT | APRIL |
Table . Projected Wastewater Cash Balance Before Revenue Increases ( millions) ( )
Description FYE FYE FYE FYE FYE FYE
Beginning Cash Balance (July ) . . . ( . ) ( . ) ( . )
Additions:
Total Revenues . . . . . .
Deductions:
Operations and Maintenance . . . . . .
Stormwater Fund O&M . . . . . .
Stormwater Fund Debt Service . . . . . .
Debt Service . . . . . .
Commercial Paper . . . . . .
Bad Debt . . . . . .
Capital Rollovers . . . . . .
PAYGO . . . . . .
Ending Cash Balance (June ) . . ( . ) ( . ) ( . ) ( , . )
Target Cash Balance . . . . . .
Cash Surplus / (Deficit) . ( . ) ( . ) ( . ) ( . ) ( , . )
Note: ( ) Values are in million dollars and are rounded.
1.3.4 Revenue Requirement Tests before Revenue Increases
1.3.4.1 Debt Service Coverage Test
Without revenue increases, the wastewater system is not projected to meet its target debt service coverage
ratios in any year of the study period FYE through FYE . The debt service coverage test requires that
Houston Water revenues exceed operating expenses, junior and first lien debt service, and an additional
percent of annual debt service for junior and first liens. Revenues must also exceed operating expenses,
total debt service, and an additional percent of total annual debt service. This analysis focused on coverage
for junior and first liens because it was determined that the target coverage for total debt is met if the coverage
for junior and first liens is at least . x. The results of the debt service coverage test are summarized in
Table . .
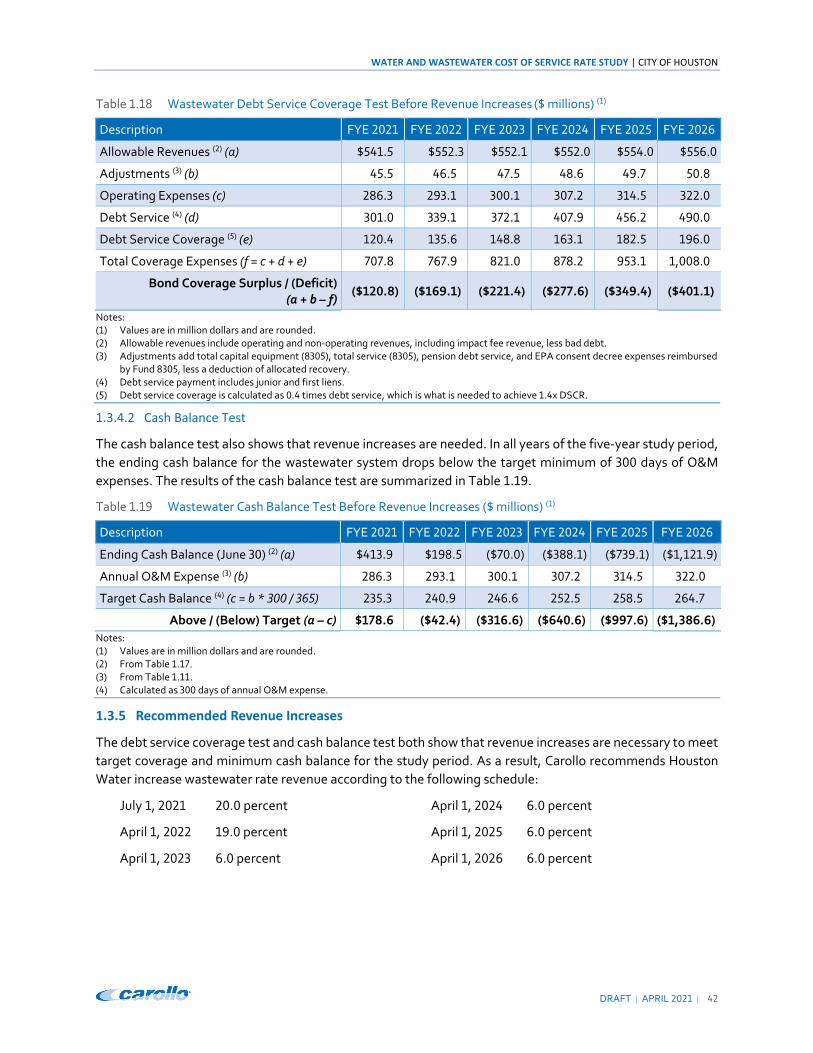
WATER AND WASTEWATER COST OF SERVICE RATE STUDY | CITY OF HOUSTON
DRAFT | APRIL |
Table . Wastewater Debt Service Coverage Test Before Revenue Increases ( millions) ( )
Description FYE FYE FYE FYE FYE FYE
Allowable Revenues ( ) (a) . . . . . .
Adjustments ( ) (b) . . . . . .
Operating Expenses (c) . . . . . .
Debt Service ( ) (d) . . . . . .
Debt Service Coverage ( ) (e) . . . . . .
Total Coverage Expenses (f = c + d + e) . . . . . , .
Bond Coverage Surplus / (Deficit) (a + b – f)
( . ) ( . ) ( . ) ( . ) ( . ) ( . )
Notes: ( ) Values are in million dollars and are rounded. ( ) Allowable revenues include operating and non‐operating revenues, including impact fee revenue, less bad debt. ( ) Adjustments add total capital equipment ( ), total service ( ), pension debt service, and EPA consent decree expenses reimbursed
by Fund , less a deduction of allocated recovery. ( ) Debt service payment includes junior and first liens. ( ) Debt service coverage is calculated as . times debt service, which is what is needed to achieve . x DSCR.
1.3.4.2 Cash Balance Test
The cash balance test also shows that revenue increases are needed. In all years of the five‐year study period,
the ending cash balance for the wastewater system drops below the target minimum of days of O&M
expenses. The results of the cash balance test are summarized in Table . .
Table . Wastewater Cash Balance Test Before Revenue Increases ( millions) ( )
Description FYE FYE FYE FYE FYE FYE
Ending Cash Balance (June ) ( ) (a) . . ( . ) ( . ) ( . ) ( , . )
Annual O&M Expense ( ) (b) . . . . . .
Target Cash Balance ( ) (c = b * / ) . . . . . .
Above / (Below) Target (a – c) . ( . ) ( . ) ( . ) ( . ) ( , . )
Notes: ( ) Values are in million dollars and are rounded. ( ) From Table . . ( ) From Table . . ( ) Calculated as days of annual O&M expense.
1.3.5 Recommended Revenue Increases
The debt service coverage test and cash balance test both show that revenue increases are necessary to meet
target coverage and minimum cash balance for the study period. As a result, Carollo recommends Houston
Water increase wastewater rate revenue according to the following schedule:
July , . percent April , . percent
April , . percent April , . percent
April , . percent April , . percent

WATER AND WASTEWATER COST OF SERVICE RATE STUDY | CITY OF HOUSTON
DRAFT | APRIL |
Table . provides the projected wastewater revenue requirements, which will be allocated to the customer types in Chapter and used to design rates in Chapter . The wastewater revenue requirements are presented in detail in Appendix D.
Table . Projected Wastewater Revenue Requirements ( millions) ( )
Description FYE FYE FYE FYE FYE
Operating Costs ( ) . . . . .
Capital Costs ( ) . . . . .
Total Revenue Requirement . . . . .
Revenue Requirement Adjustments:
Sewer Service Penalties ( ) ( . ) ( . ) ( . ) ( . ) ( . )
Other Wastewater Op Revenue (Non‐rate) ( ) ( . ) ( . ) ( . ) ( . ) ( . )
Impact Fee Revenue ( ) ( . ) ( . ) ( . ) ( . ) ( . )
Non‐op Wastewater Revenue (Non‐rate) ( ) ( . ) ( . ) ( . ) ( . ) ( . )
Interest ( . ) ( . ) ( . ) ( . ) ( . )
Additions / (Subtractions) from Cash Balance . . . . .
Rate Revenue Requirement . . . . .
Pre‐Increase Rate Revenues . . . . .
July Revenue Adjustment (full year) . . . . .
JULY REVENUE ADJUSTMENT . % . % . % . % . %
April Revenue Adjustment (full year) . . . . .
APRIL REVENUE ADJUSTMENT . % . % . % . % . %
Notes: ( ) Values are in million dollars and are rounded. ( ) From Table . . ( ) Includes debt service from Table . , bad debt from Table . , and PAYGO from Table . . ( ) From Table . .
1.4 Combined Utility System
Although the study analyzed the water and wastewater systems separately, Houston Water’s financial performance is measured as a combined utility. The two primary indicators of the utility’s financial health are the DSCR and the number of days of O&M expenses that can be supported by the cash balance. The revenue requirements for the combined utility system are presented in detail in Appendix E.
1.4.1 Revenue Requirement Tests before Revenue Increases
1.4.1.1 Debt Service Coverage Test
As with the separate water and wastewater utilities, the combined utility system is not projected to meet the target debt service coverage ratios in any year of the study period FYE through FYE without revenue increases. The results of the debt service coverage test for the combined utility are summarized in Table . .
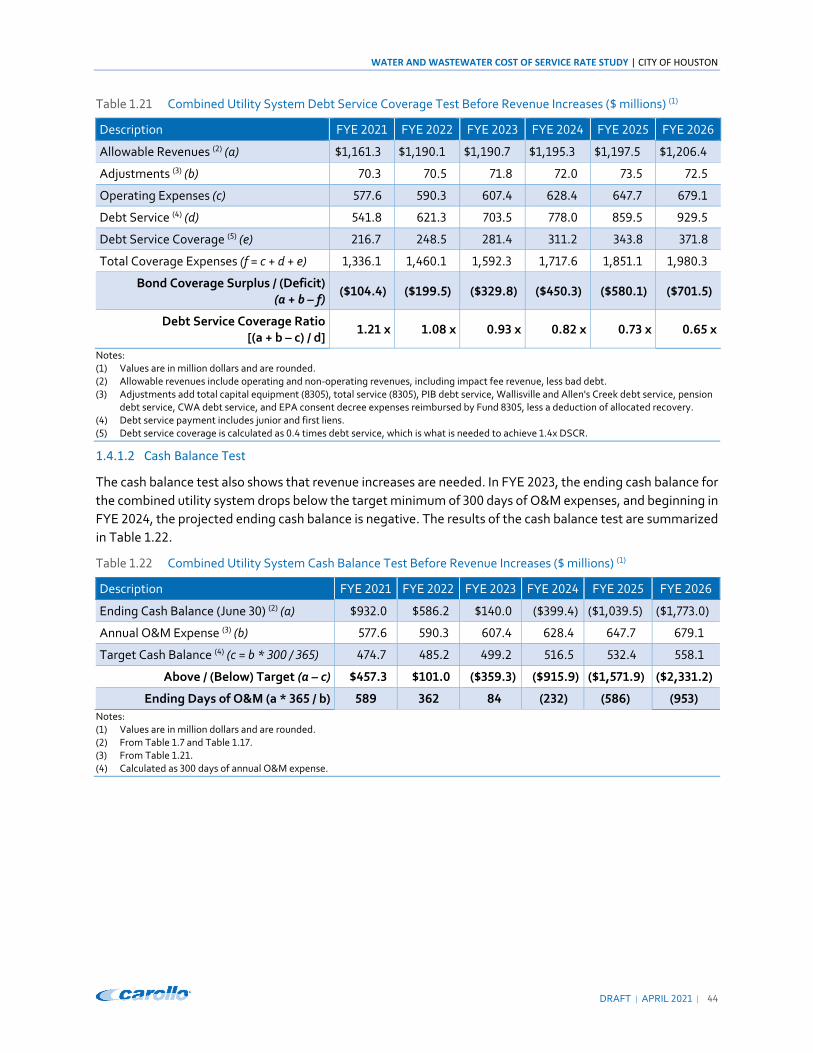
WATER AND WASTEWATER COST OF SERVICE RATE STUDY | CITY OF HOUSTON
DRAFT | APRIL |
Table . Combined Utility System Debt Service Coverage Test Before Revenue Increases ( millions) ( )
Description FYE FYE FYE FYE FYE FYE
Allowable Revenues ( ) (a) , . , . , . , . , . , .
Adjustments ( ) (b) . . . . . .
Operating Expenses (c) . . . . . .
Debt Service ( ) (d) . . . . . .
Debt Service Coverage ( ) (e) . . . . . .
Total Coverage Expenses (f = c + d + e) , . , . , . , . , . , .
Bond Coverage Surplus / (Deficit) (a + b – f)
( . ) ( . ) ( . ) ( . ) ( . ) ( . )
Debt Service Coverage Ratio [(a + b – c) / d]
. x . x . x . x . x . x
Notes: ( ) Values are in million dollars and are rounded. ( ) Allowable revenues include operating and non‐operating revenues, including impact fee revenue, less bad debt. ( ) Adjustments add total capital equipment ( ), total service ( ), PIB debt service, Wallisville and Allen's Creek debt service, pension
debt service, CWA debt service, and EPA consent decree expenses reimbursed by Fund , less a deduction of allocated recovery. ( ) Debt service payment includes junior and first liens. ( ) Debt service coverage is calculated as . times debt service, which is what is needed to achieve . x DSCR.
1.4.1.2 Cash Balance Test
The cash balance test also shows that revenue increases are needed. In FYE , the ending cash balance for
the combined utility system drops below the target minimum of days of O&M expenses, and beginning in
FYE , the projected ending cash balance is negative. The results of the cash balance test are summarized
in Table . .
Table . Combined Utility System Cash Balance Test Before Revenue Increases ( millions) ( )
Description FYE FYE FYE FYE FYE FYE
Ending Cash Balance (June ) ( ) (a) . . . ( . ) ( , . ) ( , . )
Annual O&M Expense ( ) (b) . . . . . .
Target Cash Balance ( ) (c = b * / ) . . . . . .
Above / (Below) Target (a – c) . . ( . ) ( . ) ( , . ) ( , . )
Ending Days of O&M (a * / b) ( ) ( ) ( )
Notes: ( ) Values are in million dollars and are rounded. ( ) From Table . and Table . . ( ) From Table . . ( ) Calculated as days of annual O&M expense.

WATER AND WASTEWATER COST OF SERVICE RATE STUDY | CITY OF HOUSTON
DRAFT | APRIL |
1.4.2 Revenue Requirement Tests with Revenue Increases
1.4.2.1 Debt Service Coverage Test
With the revenue increases recommended in Section . . and Section . . the combined utility system
exceeds the minimum DSCR in all years and achieves the target DSCR in three of the five years. The results of
the debt service coverage test with revenues adjusted to include the recommended revenue increases are
shown in Table . .
Table . Combined Utility System Debt Service Coverage Test with Revenue Increases ( millions) ( )
Description FYE FYE FYE FYE FYE FYE
Allowable Revenues ( ) (a) , . , . , . , . , . , .
Adjustments ( ) (b) . . . . . .
Operating Expenses (c) . . . . . .
Debt Service ( ) (d) . . . . . .
Debt Service Coverage ( ) (e) . . . . . .
Total Coverage Expenses (f = c + d + e) , . , . , . , . , . , .
Bond Coverage Surplus / (Deficit) (a + b – f)
( . ) . . . . ( . )
Debt Service Coverage Ratio [(a + b – c) / d]
. x . x . x . x . x . x
Notes: ( ) Values are in million dollars and are rounded. ( ) Allowable revenues include operating and non‐operating revenues, including impact fee revenue, less bad debt. ( ) Adjustments add total capital equipment ( ), total service ( ), PIB debt service, Wallisville and Allen's Creek debt service, pension
debt service, CWA debt service, and EPA consent decree expenses reimbursed by Fund , less a deduction of allocated recovery. ( ) Debt service payment includes junior and first liens. ( ) Debt service coverage is calculated as . times debt service, which is what is needed to achieve . x DSCR.
Figure . shows the DSCR from FYE . DSCRs for FYE through FYE are projected with and
without the recommended revenue increases, as shown in Table . and Table . .

WATER AND WASTEWATER COST OF SERVICE RATE STUDY | CITY OF HOUSTON
DRAFT | APRIL |
Figure . Projected Debt Service Coverage Ratio
1.4.2.2 Cash Balance Test
With the revenue increases recommended in Section . . and Section . . the combined utility system
meets or exceeds the target cash balance in all five years. The results of the cash balance test with revenues
adjusted to include the recommended revenue increases are shown in Table . .
Table . Combined Utility System Cash Balance Test with Revenue Increases ( millions) ( )
Description FYE FYE FYE FYE FYE FYE
Ending Cash Balance (June ) (a) . . . . . .
Annual O&M Expense ( ) (b) . . . . . .
Target Cash Balance ( ) (c = b * / ) . . . . . .
Above / (Below) Target (a – c) . . . . . .
Ending Days of O&M (a * / b)
Notes: ( ) Values are in million dollars and are rounded. ( ) From Table . . ( ) Calculated as days of annual O&M expense.

WATER AND WASTEWATER COST OF SERVICE RATE STUDY | CITY OF HOUSTON
DRAFT | APRIL |
Figure . shows the year‐end cash balance from FYE . Year‐end balances for FYE through FYE
are projected with and without the recommended revenue increases, as shown in Table . and Table . .
Figure . Projected Cash Balance (Days of O&M)

WATER AND WASTEWATER COST OF SERVICE RATE STUDY | CITY OF HOUSTON
DRAFT | APRIL |
Chapter 2
COST OF SERVICE ANALYSIS
2.1 Cost of Service Approach
The cost of service analysis employs a tailored allocation of costs with a three‐step approach, shown in
Figure . . Based on the revenue requirement analysis outlined in Chapter , the functional allocation
designates each budget item to a set of functional categories specific to Houston Water, which are then
translated into the appropriate cost components based on the operation and/or design of each function. The
functional categories and their associated costs are allocated to the customer types based on each customer
type’s unique account, meter, and water demand or wastewater discharge characteristics. A customer type
consists of users that commonly create or share responsibility for certain costs incurred by the utility, which is
determined by customer data to combine similar groups of customers.
Figure . Three‐step Cost Allocation Approach
The study evaluated the existing customer types for Houston Water and determined them to be appropriate
based upon customer demand and discharge characteristics. Details of the customer account and demand
analysis are provided in Appendix F. The rate design process establishes a rate structure that proportionately
recovers costs from customer types and customers within each customer type. The final rate structure and
rate recommendations are designed to ( ) fund the utility’s projected costs of providing service, ( ) consider
affordability of customers’ bills, and ( ) provide a reasonable balance of revenue stability while encouraging
conservation. The rate design will be further detailed in the next chapter of this report.

WATER AND WASTEWATER COST OF SERVICE RATE STUDY | CITY OF HOUSTON
DRAFT | APRIL |
2.2 Water System
The water system cost of service analysis is consistent with the AWWA M Manual Principles of Water Rates,
Fees and Charges, Seventh Edition, standard methods to allocate the revenue requirements among the various
customer types based on their usage characteristics.
The M Manual outlines the most widely used method for allocation of functionalized costs to cost
components, the Base‐Extra Capacity Method. The Base‐Extra Capacity Method allocates costs among: ( ) a
base category to provide baseline water service or average day demand; ( ) an extra capacity category to
provide peak demand service, often split into maximum day and maximum hour components; ( ) a customer
category to provide services that do not vary with water usage, such as customer service and billing; and ( )
direct fire protection.
The Base‐Extra Capacity Method recognizes that cost of service “depends not only on the total volume of
water used, but also on the rate of use, or peak demand requirements.” Costs incurred by Houston Water are
not incurred uniformly, or simply based on the total volume of water used. The cost of service changes based
on when water is used. This methodology accounts for this by including an extra capacity category to recover
costs associated with capacity that is not used consistently and that impacts operating costs and capital asset
related costs to accommodate peak flows.
The following sections discuss how costs are allocated to the system’s functions, cost components, and
customer types using the Base‐Extra Capacity Method.
2.2.1 Functional Cost Allocation
2.2.1.1 Functional Cost Categories
The functional cost allocation assigns the revenue requirement for the test year by major function. The study
developed a list of functions specific to the water system. Each functional component is allocated to specific
cost components, which can easily be assigned to rates. The water functional components used for Houston
Water are:
Supply – Untreated: Costs associated with raw
and/or recycled water to be used for non‐potable
purposes.
Supply – Treated: Costs associated with raw
water to be treated and sold as potable drinking
water.
Pumping: Costs associated with pumping treated
water.
Transmission: Costs associated with conveyance
of treated water through large‐diameter
transmission mains.
Production – EWPP: Costs associated with
production of treated water at the East WPP.
Production – NEWPP: Costs associated with
production of treated water at the Northeast WPP.
Production – NEWPP Expansion: Costs
associated with production of treated water at the
Northeast WPP Expansion.
Production – SEWPP: Costs associated with
production of treated water at the Southeast
WPP.
Production – Other: Costs associated with
production of treated water from groundwater
wells.
Storage: Costs associated with storage of treated
water to provide adequate system pressure and
meet maximum hour demands.
Distribution System: Costs associated with
delivering treated water to customers through
small‐diameter distribution lines.

WATER AND WASTEWATER COST OF SERVICE RATE STUDY | CITY OF HOUSTON
DRAFT | APRIL |
Meters: Costs associated with water meters,
including meter reading, routine maintenance,
and regular replacement.
Fire Protection: Infrastructure and costs
associated with providing fire protection services
throughout the system.
Customer Billing: Costs associated with
calculating, preparing, and sending a customer’s
bill, as well as costs associated with customer
service.
Administration: Costs associated with
management and administration of the utility.
Water Authority Overhead – EWPP: Overhead
costs related to providing service to the water
authorities receiving treated water from the East
WPP.
Water Authority Overhead – NEWPP: Overhead
costs related to providing service to the water
authorities receiving treated water from the
Northeast WPP.
Co‐participant Overhead – SEWPP: Overhead
costs related to providing service to the Southeast
WPP co‐participants.
TCEQ Fees: Annual fees charged to Houston
Water by the Texas Commission on Environmental
Quality (TCEQ) based on the number of water
system connections.
General: Costs associated with other treatment
and administrative services that do not fit any of
the other categories. Examples include GIS
services, IT, finance, electrical and mechanical
equipment, lands not associated with a specific
asset, etc.
Houston Water’s budget was analyzed line by line. Details of how the O&M, debt service, and other expenses
were distributed among functional categories are shown in the following sections.
2.2.1.2 Cost Components
Houston Water’s cost components are used to allocate costs between the monthly meter charges and the
volumetric rates. The volumetric components include raw water, base, and extra capacity (maximum day and
maximum hour). The customer‐related cost components (meter charges, fire protection, billing and
collecting, and TCEQ fees) are the basis of the monthly meter charges and monthly TCEQ fees. Finally, there
are cost components to allocate costs directly to the East WPP water authorities, the Northeast WPP water
authorities, and the Southeast WPP co‐participants through their volumetric O&M rates and overhead rates.
The following describes each of the water cost components for Houston Water:
Raw Water: Operating costs associated with
delivering raw or recycled water to Contract –
Untreated customers.
Base: Operating and capital costs incurred by the
water system to provide a basic level of service to
each customer. These costs include treatment,
distribution, pumping, and storage, up to a level
that meets the water system’s baseline (average
day) demands throughout the year.
Extra Capacity: Costs incurred to meet maximum
day and maximum hour demands for water in
excess of base demand. This cost includes capital
costs related to oversizing the system to meet
excess demand.
System peaking factors are used to determine the
appropriate allocations to the Extra Capacity cost
components. For this study, the maximum day
peaking factor is . , and the maximum hour
peaking factor is . . This means that the
maximum day demand is assumed to be . times
the average day demand, and the maximum hour
demand is assumed to be . times the average
day demand (or . times the maximum day
demand).
Meter Charges: Costs associated with customer
meters and the associated capacity that is required
to meet the demand put on the system by each
meter. These costs are included in the monthly
meter charge based on the meter’s hydraulic
capacity.

WATER AND WASTEWATER COST OF SERVICE RATE STUDY | CITY OF HOUSTON
DRAFT | APRIL |
Billing and Collecting: Costs related to
operational support activities including
accounting, billing, and customer service. These
costs are common to all customers and are
reasonably uniform across the different customer
types.
Fire Protection: Costs associated with providing
direct fire protection services. A portion of the
distribution system costs are included as the
system must have sufficient hydraulic capacity to
support the pressures and flow demands for fire
protection service.
TCEQ Fees: Annual fees charged to Houston
Water by the Texas Commission on Environmental
Quality (TCEQ) based on the number of water
system connections.
EWPP Water Authorities: Costs directly
attributable to the water authorities receiving
treated water from the East WPP.
NEWPP Water Authorities: Costs directly
attributable to the water authorities receiving
treated water from the Northeast WPP.
SEWPP Co‐participants: Costs directly
attributable to the SEWPP co‐participants.
Carollo reviewed the existing fixed assets for the water system and allocated each to the appropriate
functional category based on direction from Houston Water staff. In addition, each of the individual operating
budget line items was reviewed and its corresponding costs allocated based on the service provided. The
functionalized assets and O&M are then allocated to the appropriate cost components according to the
Base‐Extra Capacity methodology. This functional allocation process provides a reasonable, appropriate basis
for proportionately distributing costs to customer types based on their usage patterns and is grounded in cost
of service principles and standards.
Fixed Asset Allocation. Carollo reviewed the fixed asset registry provided by Houston Water staff, which
allocated each asset to a specific functional category. The study then allocated the functionalized assets to
cost components. The overall results of this allocation are used as a proxy to allocate capital‐related costs.
This minimizes large shifts in the allocation of capital costs, which can vary significantly from year to year.
Table . summarizes the allocation of the functionalized assets to the cost components to determine the
allocation factors applied to the capital related costs.
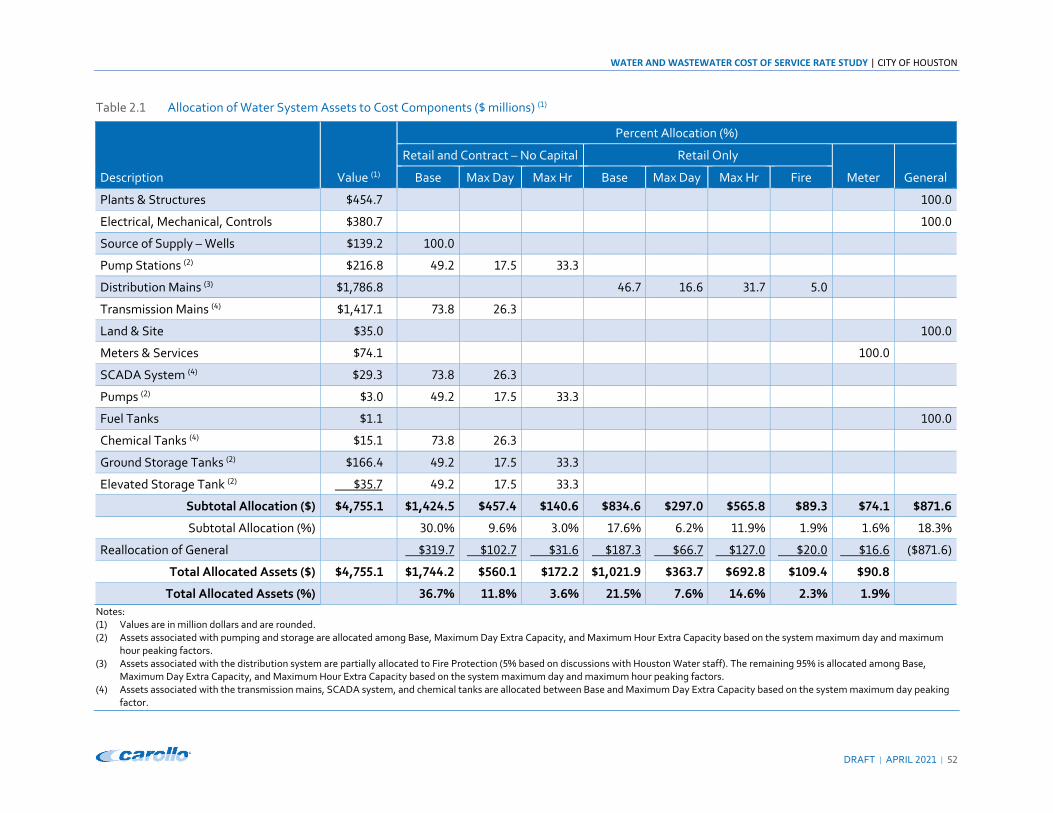
WATER AND WASTEWATER COST OF SERVICE RATE STUDY | CITY OF HOUSTON
DRAFT | APRIL |
Table . Allocation of Water System Assets to Cost Components ( millions) ( )
Description Value ( )
Percent Allocation (%)
Retail and Contract – No Capital Retail Only
Meter General Base Max Day Max Hr Base Max Day Max Hr Fire
Plants & Structures . .
Electrical, Mechanical, Controls . .
Source of Supply – Wells . .
Pump Stations ( ) . . . .
Distribution Mains ( ) , . . . . .
Transmission Mains ( ) , . . .
Land & Site . .
Meters & Services . .
SCADA System ( ) . . .
Pumps ( ) . . . .
Fuel Tanks . .
Chemical Tanks ( ) . . .
Ground Storage Tanks ( ) . . . .
Elevated Storage Tank ( ) . . . .
Subtotal Allocation ( ) , . , . . . . . . . . .
Subtotal Allocation (%) . % . % . % . % . % . % . % . % . %
Reallocation of General . . . . . . . . ( . )
Total Allocated Assets ( ) , . , . . . , . . . . .
Total Allocated Assets (%) . % . % . % . % . % . % . % . %
Notes: ( ) Values are in million dollars and are rounded. ( ) Assets associated with pumping and storage are allocated among Base, Maximum Day Extra Capacity, and Maximum Hour Extra Capacity based on the system maximum day and maximum
hour peaking factors. ( ) Assets associated with the distribution system are partially allocated to Fire Protection ( % based on discussions with Houston Water staff). The remaining % is allocated among Base,
Maximum Day Extra Capacity, and Maximum Hour Extra Capacity based on the system maximum day and maximum hour peaking factors. ( ) Assets associated with the transmission mains, SCADA system, and chemical tanks are allocated between Base and Maximum Day Extra Capacity based on the system maximum day peaking
factor.

WATER AND WASTEWATER COST OF SERVICE RATE STUDY | CITY OF HOUSTON
DRAFT | APRIL |
O&M Allocation. Similar to the fixed assets, the study allocated the water system operating expenses to
functional categories and then to cost components. The allocation percentages used to functionalize the
operating budget are estimates based on discussions with Houston Water staff. To avoid large shifts in
allocations during the five‐year rate‐setting period, the projected budgets for FYE through FYE
were averaged, and this average budget was allocated to develop the revenue requirement allocation. Then
the revenue requirement allocation was applied to each of the five test years to develop rates.
Table . provides the allocation of the five‐year average O&M budget to functional categories.
Table . summarizes the allocation of the functionalized average O&M expenses to the cost components.
Offsetting Revenue. Water service penalties, impact fee revenue, interest and other non‐rate revenue are used
to offset the revenue requirements and reduce the required increase in rate revenue. These offsetting
revenues are allocated to the general category and reallocated to the cost components based on the direct
allocation of the total revenue requirements. The exception to this is a partial allocation of other operating
revenue to Meter Charges and Billing and Collecting to directly allocate revenue from miscellaneous customer
fees to these categories where the related costs are allocated.
2.2.1.3 Revenue Requirements Allocation
To obtain an overall percentage allocation, operating expenses, capital expenses, and offsetting revenues are
weighted based on their projected expenditures for the five‐year average, as shown in Table . . Once the
overall percentage allocation to each functional category has been defined, those percentages are applied to
the test year revenue requirement in order to determine the total revenue requirement for each cost
component, as shown in Table . .

WATER AND WASTEWATER COST OF SERVICE RATE STUDY | CITY OF HOUSTON
DRAFT | APRIL |
Table . Functional Allocation of Water O&M Budget ( millions) ( )
Description ‐yr Avg
( )
Percent Allocation (%)
Su
pp
ly –
Un
trea
ted
Su
pp
ly –
Tre
ated
Pu
mp
ing
Tra
nsm
issi
on
Pro
du
ctio
n –
EW
PP
Pro
du
ctio
n –
NE
WP
P
Pro
du
ctio
n –
NE
WP
P
Exp
ansi
on
Pro
du
ctio
n –
SE
WP
P
Pro
du
ctio
n –
Oth
er
Sto
rag
e
Dis
trib
uti
on
Met
ers
Fir
e P
rote
ctio
n
Cu
sto
mer
Bill
ing
Ad
min
istr
atio
n
WA
OH
– E
WP
P
WA
OH
–
NE
WP
P
Co‐p
art
OH
SE
WP
P
TC
EQ
Fee
s
Gen
eral
Drinking Water Operations:
– DWO Executive Support G&A . . . . .
DWO Water Maintenance . . . . . . .
– DWO Regulatory and Compliance . . . . .
TCEQ Fee . .
– DWO Ground Water Operations . . . .
– DWO East WPP . .
– DWO Technical Services G&A . . . . . .
Cust. Complaints / Water System Maint. . . . . . . . . .
Source Water Protection . . . . . . . . .
– DWO Water Maintenance . .
PIB DS . .
– DWO Southeast WPP . .
– DWO Northeast WPP . .
– DWO System Maint. – North . . .
– DWO System Maint. – South . . .
River Authority Contributed Debt Service . . .
CWA O&M (CWA Trinity River and TRA) . . . .
CWA Debt Svc ( A‐H & Ref) . . . .
CWA Debt Service ( " line) . . .
Operation Services (G&A):
– OPS Fin & Supp Op Svcs G&A . .
(HWP) – HW Planning . . . . . . . . .
– OPS Maint Op Svcs – Restoration . .
– OPS Maint Op Svcs – COS/DIS . . .
– HW GIS Services . . . . . . .
– OPS Executive Support . . . . .
– OPS Support Services . .
– HW Infrastructure Planning . . . . . .
– HW Utility Analysis . . . . . . . . .

WATER AND WASTEWATER COST OF SERVICE RATE STUDY | CITY OF HOUSTON
DRAFT | APRIL |
Description ‐yr Avg
( )
Percent Allocation (%)
Su
pp
ly –
Un
trea
ted
Su
pp
ly –
Tre
ated
Pu
mp
ing
Tra
nsm
issi
on
Pro
du
ctio
n –
EW
PP
Pro
du
ctio
n –
NE
WP
P
Pro
du
ctio
n –
NE
WP
P
Exp
ansi
on
Pro
du
ctio
n –
SE
WP
P
Pro
du
ctio
n –
Oth
er
Sto
rag
e
Dis
trib
uti
on
Met
ers
Fir
e P
rote
ctio
n
Cu
sto
mer
Bill
ing
Ad
min
istr
atio
n
WA
OH
– E
WP
P
WA
OH
–
NE
WP
P
Co‐p
art
OH
SE
WP
P
TC
EQ
Fee
s
Gen
eral
Other O&M:
‐ – Director's Office . . . . .
– Information Technology . . . . .
‐ – Management Support . . . . .
& – Houston Water – Planning
. . . . . . . . .
, , , – Fin Mgmt Svcs Support . . . . .
Property and Terrorism Insurance . . . . .
Security . . . . .
‐ , – CAS Cust Acct Services . . . . . .
Deductions ( . ) .
Subtotal Allocation ( ) . . . . . . . . . . . . . . . . . . . . .
Subtotal Allocation (%) . % . % . % . % . % . % . % . % . % . % . % . % . % . % . % . % . % . % . % . %
Reallocation of General ( ) . . . . . . . . . . . ( . )
Total Allocated Assets ( ) . . . . . . . . . . . . . . . . . . . .
Total Allocated Assets (%) . % . % . % . % . % . % . % . % . % . % . % . % . % . % . % . % . % . % . %
Notes: ( ) Allocations are developed using an average of O&M costs for the ‐year period FYE through FYE . Costs are in millions of dollars and are rounded. ( ) General category is reallocated to other functional categories based on direct allocation of O&M budget. General is not reallocated to WPP‐specific categories to avoid double allocation to water authorities and co‐participants. General is also not reallocated to TCEQ fees because that category only includes the fees charged
by TCEQ to the City.

WATER AND WASTEWATER COST OF SERVICE RATE STUDY | CITY OF HOUSTON
DRAFT | APRIL |
Table . Allocation of Water O&M Budget to Cost Components ( millions) ( )
Description ‐yr Avg ( )
Percent Allocation (%)
Raw Water
Retail and Contract – No Capital Retail Only
Meter Billing EWPP WAs
NEWPP WAs
SEWPP CPs
TCEQ Fees General Base Max Day Max Hr Base Max Day Max Hr Fire
Source of Supply – Untreated . .
Source of Supply – Treated . .
Pumping ( ) . . . .
Transmission ( ) . . .
Production – EWPP ( ) . . . .
Production – NEWPP ( ) . . . .
Production – NEWPP Expansion ( ) . . . .
Production – SEWPP ( ) . . . .
Production – Other ( ) . . .
Storage ( ) . . . .
Distribution ( ) . . . . .
Meters . .
Fire Protection . .
Customer Billing . .
Admin . .
WA OH – EWPP . .
WA OH – NEWPP . .
Co‐part OH – SEWPP . .
TCEQ Fees . .
Total Allocation ( ) . . . . . . . . . . . . . . . .
Total Allocation (%) . % . % . % . % . % . % . % . % . % . % . % . % . % . % . %
Notes: ( ) Allocations are developed using an average of O&M costs for the ‐year period FYE through FYE . Costs are in millions of dollars and are rounded. ( ) Costs associated with pumping and storage are allocated among Base, Maximum Day Extra Capacity, and Maximum Hour Extra Capacity based on the system maximum day and maximum hour peaking factors. ( ) Costs associated with the transmission mains and production (other) are allocated between Base and Maximum Day Extra Capacity based on the system maximum day peaking factor. ( ) Costs associated with the production at the WPPs are allocated directly to the water authorities or co‐participants based on their sales as a percentage of production. The remainder is allocated between Base and Maximum Day Extra Capacity based on the system maximum day peaking factor. ( ) Costs associated with the distribution system are partially allocated to Fire Protection ( % based on discussions with Houston Water staff). The remaining % is allocated among Base, Maximum Day Extra Capacity, and Maximum Hour Extra Capacity based on the system maximum day and maximum hour peaking factors.

WATER AND WASTEWATER COST OF SERVICE RATE STUDY | CITY OF HOUSTON
DRAFT | APRIL |
Table . Allocation of Water Revenue Requirements to Cost Components ( millions) ( )
Description ‐yr Avg ( ) Raw
Water
Retail and Contract – No Capital Retail Only
Meter Billing EWPP WAs
NEWPP WAs
SEWPP CPs
TCEQ Fees General Base Max Day Max Hr Base Max Day Max Hr Fire
Operating Costs ( ) . . . . . . . . . . . . . . . .
Capital Costs:
Debt Service ( ) . . . . . . . . . . . . . . . .
TRA/Lake Livingston Debt ( ) . . . . . . . . . . . . . . . .
Bad Debt ( ) . . . . . . . . . . . . . . . .
Rate‐funded Capital (PAYGO) ( ) . . . . . . . . . . . . . . . .
Water Service Penalties ( ) ( . ) . . . . . . . . . . . . . . ( . )
Other Water Operating Revenue (Non‐rate) ( ) ( . ) . . . . . . . . ( . ) ( . ) . . . . ( . )
Impact Fee Revenue ( ) ( . ) . . . . . . . . . . . . . . ( . )
Non‐operating Water Revenue (Non‐rate) ( ) ( . ) . . . . . . . . . . . . . . ( . )
Interest ( ) ( . ) . . . . . . . . . . . . . . ( . )
Additions / (Subtractions) from Cash Balance ( ) . . . . . . . . . . . . . . . .
Subtotal Allocation ( ) . . . . . . . . . . . . . . . .
Subtotal Allocation (%) . % . % . % . % . % . % . % . % . % . % . % . % . % . % . % . %
Reallocation of "General" ( ) . . . . . . . . . . ( . )
Total Allocated Revenue Requirement ( ) . . . . . . . . . . . . . . . .
Total Allocated Revenue Requirement (%) . % . % . % . % . % . % . % . % . % . % . % . % . % . % . %
Notes: ( ) Values are in millions of dollars and are rounded. ( ) Allocations are developed using an average of revenue requirements for the ‐year period FYE through FYE . ( ) From Table . . ( ) Allocated using asset allocation percentages developed in Table . . ( ) Allocated based on functional allocation of CWA O&M. ( ) Allocated to General category to be reallocated based on direct allocations. ( ) Partially allocated to Meter Charges ( %) and Billing & Collecting ( %) to align revenue from fees related to these categories. Remainder is allocated to General category to be reallocated based on direct allocations. ( ) General category is reallocated to other cost components based on direct allocation of revenue requirements. General is not reallocated to water authorities and co‐participants to avoid double allocation to these customer types. General is also not reallocated to TCEQ fees because that category only includes the fees
charged by TCEQ to the City.

WATER AND WASTEWATER COST OF SERVICE RATE STUDY | CITY OF HOUSTON
DRAFT | APRIL |
Table . Allocation of FYE Water Revenue Requirements to Cost Components ( millions) ( )
Description FYE ( ) Raw Water
Retail and Contract – No Capital Retail Only
Meter Billing EWPP WAs NEWPP
WAs SEWPP CPs TCEQ Fees Base Max Day Max Hr Base Max Day Max Hr Fire
Operating Costs . . . . . . . . . . . . . . .
Capital Costs:
Debt Service . . . . . . . . . . . . . . .
TRA/Lake Livingston Debt . . . . . . . . . . . . . . .
Bad Debt . . . . . . . . . . . . . . .
Rate‐funded Capital (PAYGO) . . . . . . . . . . . . . . .
Water Service Penalties ( . ) ( . ) ( . ) ( . ) ( . ) ( . ) ( . ) ( . ) ( . ) ( . ) ( . ) . . . .
Other Water Operating Revenue (Non‐rate) ( . ) ( . ) ( . ) ( . ) ( . ) ( . ) ( . ) ( . ) ( . ) ( . ) ( . ) . . . .
Impact Fee Revenue ( . ) ( . ) ( . ) ( . ) ( . ) ( . ) ( . ) ( . ) ( . ) ( . ) ( . ) . . . .
Non‐operating Water Revenue (Non‐rate) ( . ) ( . ) ( . ) ( . ) ( . ) ( . ) ( . ) ( . ) ( . ) ( . ) ( . ) . . . .
Interest ( . ) ( . ) ( . ) ( . ) ( . ) ( . ) ( . ) ( . ) ( . ) ( . ) ( . ) . . . .
Additions / (Subtractions) from Cash Balance ( ) ( . ) ( . ) ( . ) ( . ) ( . ) ( . ) ( . ) ( . ) ( . ) ( . ) ( . ) . . . .
Total Allocated Revenue Requirement ( ) . . . . . . . . . . . . . . .
Total Allocated Revenue Requirement (%) . % . % . % . % . % . % . % . % . % . % . % . % . % . % . %
Notes: ( ) Values are in millions of dollars and are rounded. ( ) Test year revenue requirements from Table . (FYE shown in this table) are allocated based on allocation of ‐year average revenue requirements from Table . . ( ) Additions/(subtractions) shown in this table is based on revenue requirements for July , , revenue increase and does not match what is shown in Table . , which includes the April , , revenue increase.
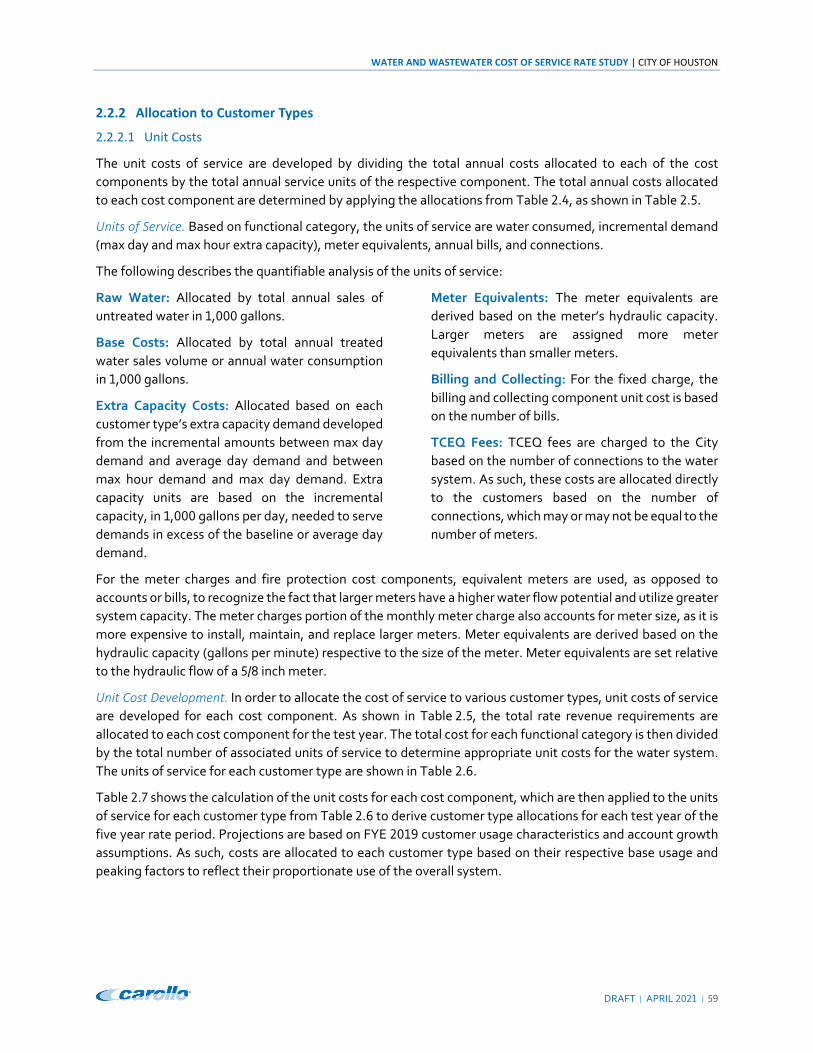
WATER AND WASTEWATER COST OF SERVICE RATE STUDY | CITY OF HOUSTON
DRAFT | APRIL |
2.2.2 Allocation to Customer Types
2.2.2.1 Unit Costs
The unit costs of service are developed by dividing the total annual costs allocated to each of the cost
components by the total annual service units of the respective component. The total annual costs allocated
to each cost component are determined by applying the allocations from Table . , as shown in Table . .
Units of Service. Based on functional category, the units of service are water consumed, incremental demand
(max day and max hour extra capacity), meter equivalents, annual bills, and connections.
The following describes the quantifiable analysis of the units of service:
Raw Water: Allocated by total annual sales of
untreated water in , gallons.
Base Costs: Allocated by total annual treated
water sales volume or annual water consumption
in , gallons.
Extra Capacity Costs: Allocated based on each
customer type’s extra capacity demand developed
from the incremental amounts between max day
demand and average day demand and between
max hour demand and max day demand. Extra
capacity units are based on the incremental
capacity, in , gallons per day, needed to serve
demands in excess of the baseline or average day
demand.
Meter Equivalents: The meter equivalents are
derived based on the meter’s hydraulic capacity.
Larger meters are assigned more meter
equivalents than smaller meters.
Billing and Collecting: For the fixed charge, the
billing and collecting component unit cost is based
on the number of bills.
TCEQ Fees: TCEQ fees are charged to the City
based on the number of connections to the water
system. As such, these costs are allocated directly
to the customers based on the number of
connections, which may or may not be equal to the
number of meters.
For the meter charges and fire protection cost components, equivalent meters are used, as opposed to
accounts or bills, to recognize the fact that larger meters have a higher water flow potential and utilize greater
system capacity. The meter charges portion of the monthly meter charge also accounts for meter size, as it is
more expensive to install, maintain, and replace larger meters. Meter equivalents are derived based on the
hydraulic capacity (gallons per minute) respective to the size of the meter. Meter equivalents are set relative
to the hydraulic flow of a / inch meter.
Unit Cost Development. In order to allocate the cost of service to various customer types, unit costs of service
are developed for each cost component. As shown in Table . , the total rate revenue requirements are
allocated to each cost component for the test year. The total cost for each functional category is then divided
by the total number of associated units of service to determine appropriate unit costs for the water system.
The units of service for each customer type are shown in Table . .
Table . shows the calculation of the unit costs for each cost component, which are then applied to the units
of service for each customer type from Table . to derive customer type allocations for each test year of the
five year rate period. Projections are based on FYE customer usage characteristics and account growth
assumptions. As such, costs are allocated to each customer type based on their respective base usage and
peaking factors to reflect their proportionate use of the overall system.
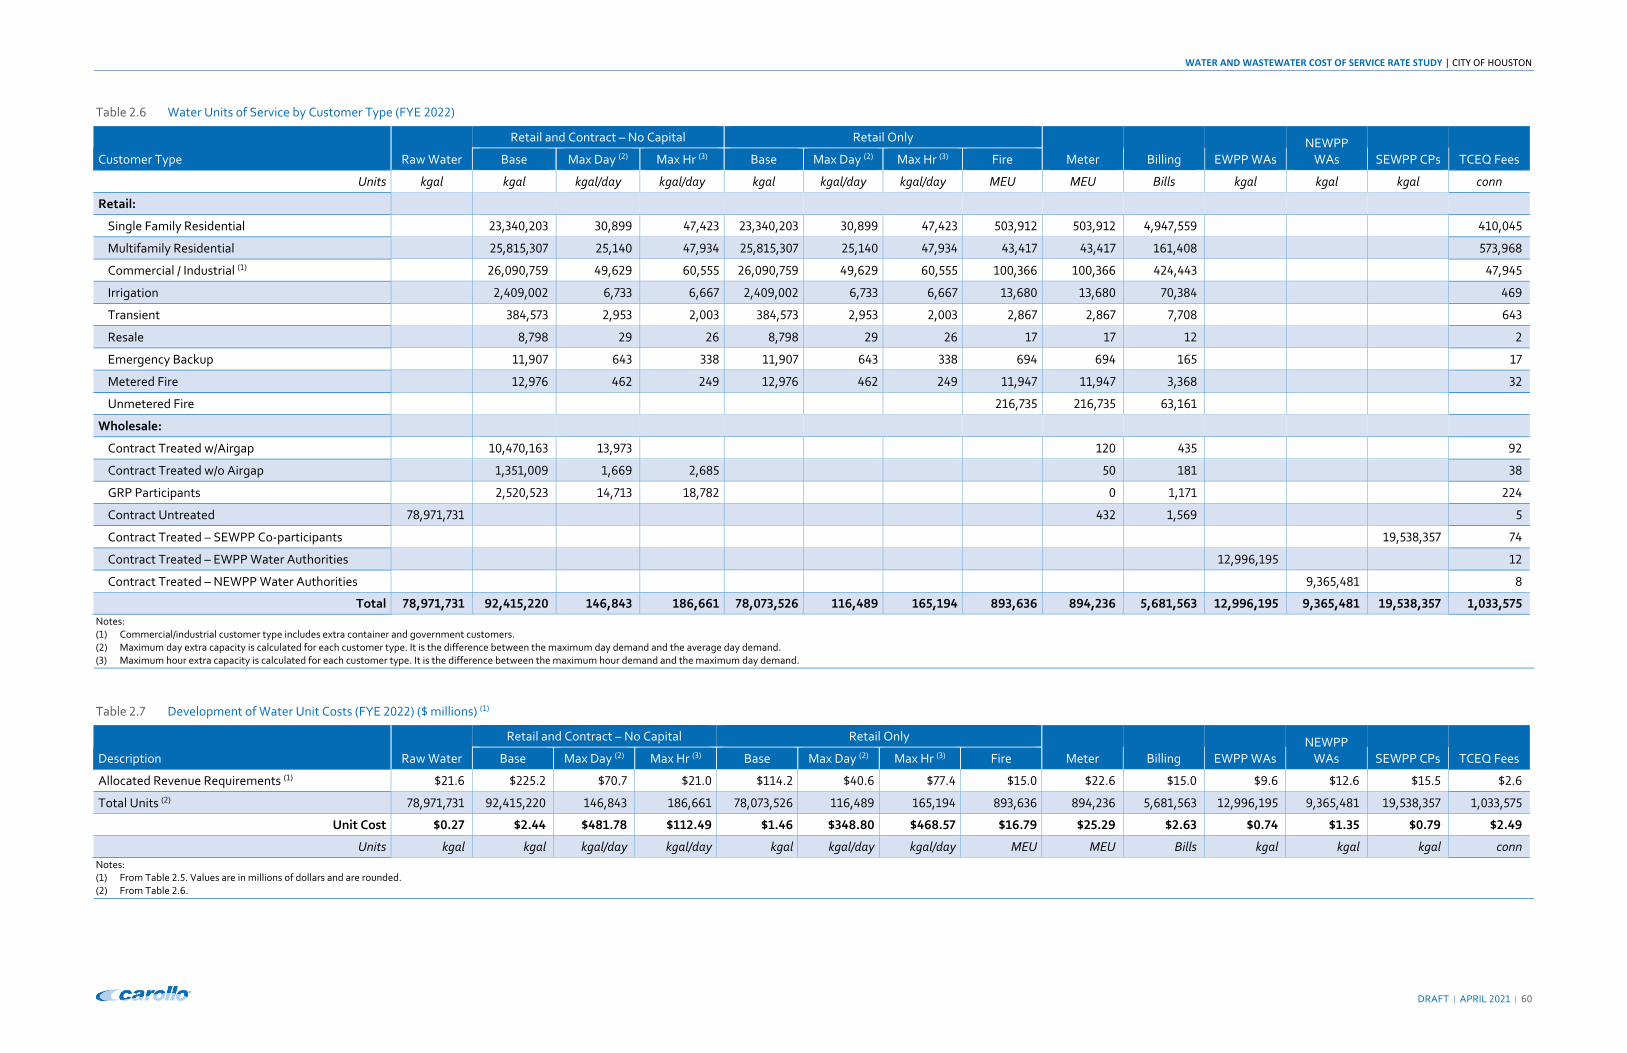
WATER AND WASTEWATER COST OF SERVICE RATE STUDY | CITY OF HOUSTON
DRAFT | APRIL |
Table . Water Units of Service by Customer Type (FYE )
Customer Type Raw Water
Retail and Contract – No Capital Retail Only
Meter Billing EWPP WAs NEWPP
WAs SEWPP CPs TCEQ Fees Base Max Day ( ) Max Hr ( ) Base Max Day ( ) Max Hr ( ) Fire
Units kgal kgal kgal/day kgal/day kgal kgal/day kgal/day MEU MEU Bills kgal kgal kgal conn
Retail:
Single Family Residential , , , , , , , , , , , , ,
Multifamily Residential , , , , , , , , , , , ,
Commercial / Industrial ( ) , , , , , , , , , , , ,
Irrigation , , , , , , , , , , ,
Transient , , , , , , , , ,
Resale , ,
Emergency Backup , ,
Metered Fire , , , , ,
Unmetered Fire , , ,
Wholesale:
Contract Treated w/Airgap , , ,
Contract Treated w/o Airgap , , , ,
GRP Participants , , , , ,
Contract Untreated , , ,
Contract Treated – SEWPP Co‐participants , ,
Contract Treated – EWPP Water Authorities , ,
Contract Treated – NEWPP Water Authorities , ,
Total , , , , , , , , , , , , , , , , , , , , , ,
Notes: ( ) Commercial/industrial customer type includes extra container and government customers. ( ) Maximum day extra capacity is calculated for each customer type. It is the difference between the maximum day demand and the average day demand. ( ) Maximum hour extra capacity is calculated for each customer type. It is the difference between the maximum hour demand and the maximum day demand.
Table . Development of Water Unit Costs (FYE ) ( millions) ( )
Description Raw Water
Retail and Contract – No Capital Retail Only
Meter Billing EWPP WAs NEWPP
WAs SEWPP CPs TCEQ Fees Base Max Day ( ) Max Hr ( ) Base Max Day ( ) Max Hr ( ) Fire
Allocated Revenue Requirements ( ) . . . . . . . . . . . . . .
Total Units ( ) , , , , , , , , , , , , , , , , , , , , , ,
Unit Cost . . . . . . . . . . . . . .
Units kgal kgal kgal/day kgal/day kgal kgal/day kgal/day MEU MEU Bills kgal kgal kgal conn
Notes: ( ) From Table . . Values are in millions of dollars and are rounded. ( ) From Table . .

WATER AND WASTEWATER COST OF SERVICE RATE STUDY | CITY OF HOUSTON
DRAFT | APRIL |
Customer Allocation. Carollo analyzed customer billing data to determine the number of bills by meter size and
customer type, as well as the usage characteristics of each customer type. The details of this analysis are
provided in Appendix F. Table . details the results of the cost allocation by customer type based on FYE
consumption data.
Based on these unit allocations, Table . details the FYE cost of service for each customer type and cost
component, which are then summed to determine the total revenue requirement by customer type. Detailed
water cost of service allocations by customer type are provided for FYE through FYE in Appendix F.
The rate design analysis determines how the costs are recovered from each customer type through specified
water rates. The focus of this process is to achieve cost recovery and substantiate that customers are paying
their fair and proportionate share of system costs. Houston Water’s existing rate structure consists of two
components: a volumetric rate (variable) and a monthly meter charge (fixed). The volumetric component is
assessed based on metered water usage per , gallons and, by design, is intended to recover the cost
incurred for delivering each unit of water. The monthly meter charge is intended to recognize that the utility
incurs fixed costs to provide the availability of water service, which must be recovered independent of monthly
water demands and consumption. These two rate components serve as a basis for the following rate design
chapter.

WATER AND WASTEWATER COST OF SERVICE RATE STUDY | CITY OF HOUSTON
DRAFT | APRIL |
Table . Water FYE Revenue Requirement Allocation by Customer Type (%)
Customer Type Raw Water
Retail and Contract – No Capital Retail Only
Meter Billing EWPP WAs NEWPP
WAs SEWPP CPs TCEQ Fees Base Max Day Max Hr Base Max Day Max Hr Fire
Retail:
Single Family Residential . % . % . % . % . % . % . % . % . % . % . % . % . % . %
Multifamily Residential . % . % . % . % . % . % . % . % . % . % . % . % . % . %
Commercial / Industrial ( ) . % . % . % . % . % . % . % . % . % . % . % . % . % . %
Irrigation . % . % . % . % . % . % . % . % . % . % . % . % . % . %
Transient . % . % . % . % . % . % . % . % . % . % . % . % . % . %
Resale . % . % . % . % . % . % . % . % . % . % . % . % . % . %
Emergency Backup . % . % . % . % . % . % . % . % . % . % . % . % . % . %
Metered Fire . % . % . % . % . % . % . % . % . % . % . % . % . % . %
Unmetered Fire . % . % . % . % . % . % . % . % . % . % . % . % . % . %
Wholesale:
Contract Treated w/Airgap . % . % . % . % . % . % . % . % . % . % . % . % . % . %
Contract Treated w/o Airgap . % . % . % . % . % . % . % . % . % . % . % . % . % . %
GRP Participants . % . % . % . % . % . % . % . % . % . % . % . % . % . %
Contract Untreated . % . % . % . % . % . % . % . % . % . % . % . % . % . %
Contract Treated – SEWPP Co‐participants . % . % . % . % . % . % . % . % . % . % . % . % . % . %
Contract Treated – EWPP Water Authorities . % . % . % . % . % . % . % . % . % . % . % . % . % . %
Contract Treated – NEWPP Water Authorities . % . % . % . % . % . % . % . % . % . % . % . % . % . %
Total . % . % . % . % . % . % . % . % . % . % . % . % . % . %
Note: ( ) Commercial/industrial customer type includes extra container and government customers.

WATER AND WASTEWATER COST OF SERVICE RATE STUDY | CITY OF HOUSTON
DRAFT | APRIL |
Table . Water FYE Revenue Requirement Allocation by Customer Type ( millions) ( )
Customer Type FYE Raw Water
Retail and Contract – No Capital Retail Only
Meter Billing EWPP WAs
NEWPP WAs
SEWPP CPs TCEQ Fees Base Max Day Max Hr Base Max Day Max Hr Fire
Retail:
Single Family Residential . . . . . . . . . . . . . . .
Multifamily Residential . . . . . . . . . . . . . . .
Commercial / Industrial ( ) . . . . . . . . . . . . . . .
Irrigation . . . . . . . . . . . . . . .
Transient . . . . . . . . . . . . . . .
Resale . . . . . . . . . . . . . . .
Emergency Backup . . . . . . . . . . . . . . .
Metered Fire . . . . . . . . . . . . . . .
Unmetered Fire . . . . . . . . . . . . . . .
Wholesale:
Contract Treated w/Airgap . . . . . . . . . . . . . . .
Contract Treated w/o Airgap . . . . . . . . . . . . . . .
GRP Participants . . . . . . . . . . . . . . .
Contract Untreated . . . . . . . . . . . . . . .
Contract Treated – SEWPP Co‐participants . . . . . . . . . . . . . . .
Contract Treated – EWPP Water Authorities . . . . . . . . . . . . . . .
Contract Treated – NEWPP Water Authorities . . . . . . . . . . . . . . .
Total . . . . . . . . . . . . . . .
Notes: ( ) Values are in millions of dollars and are rounded. ( ) Commercial/industrial customer type includes extra container and government customers.

WATER AND WASTEWATER COST OF SERVICE RATE STUDY | CITY OF HOUSTON
DRAFT | APRIL |
2.3 Wastewater System
The wastewater system cost of service analysis is consistent with the Water Environment Federation (WEF)
Manual of Practice (MOP) : Financing and Charges for Wastewater Systems, Fourth Edition, standard methods
to allocate the revenue requirements among the various customer types based on their discharge
characteristics. The following sections discuss how costs are allocated to the system’s functions, cost
components, and customer types using the methodology outlined in MOP .
2.3.1 Functional Cost Allocation
2.3.1.1 Functional Cost Categories
The functional cost allocation assigns the revenue requirement for the test year by major function. The study
developed a list of functions specific to the wastewater system. Each functional component is allocated to
specific cost components, which can easily be assigned to rates. The wastewater functional components used
for Houston Water are:
Influent Pumping/Headworks: Costs associated
with pumps used to move the wastewater from an
influent wet well to the headworks facility.
Aeration: Costs associated with adding air to the
wastewater to remove contaminants.
Clarifiers: Costs associated with the tanks used to
remove suspended solids from the wastewater.
Chlorination/Dechlorination: Costs associated
with the introduction of chlorine as a disinfectant
and its subsequent removal.
Solids Thickening/Digestion: Costs associated
with increasing the solids concentration and
producing energy from methane gas.
Biosolids Handling: Costs associated with
separating, treating, and disposing of biosolids.
Effluent Discharge: Costs associated with
managing and controlling treated wastewater
outflow.
Industrial Wastewater Program: Costs
associated with managing the program that issues
and oversees wastewater permits for industrial
customers.
Pump/Lift Stations: Costs associated with
pumping wastewater within the system.
Collection System: Costs associated with
collection system infrastructure that carries all
wastewater generated by customers to the
treatment plant.
Customer Billing: All costs associated with
producing customer bills, including billing system
software, postage, credit card processing fees, etc.
Administration: Costs associated with
management and administration of the utility.
General: Costs associated with other treatment
and administrative services that do not fit any of
the other categories. Examples include GIS
services, IT, finance, electrical and mechanical
equipment, lands not associated with a specific
asset, etc.

WATER AND WASTEWATER COST OF SERVICE RATE STUDY | CITY OF HOUSTON
DRAFT | APRIL |
Houston Water’s budget was analyzed line by line. Details of how the O&M, debt service, and other expenses
were distributed among functional categories are shown in the following sections.
2.3.1.2 Cost Components
Houston Water’s cost components are used to allocate costs between the monthly meter charges and the
volumetric rates. The volumetric components include flow and strength – biochemical oxygen demand (BOD),
total suspended solids (TSS), and ammonia. The capacity and customer cost components are the basis of the
monthly meter charges. Finally, the industrial wastewater program cost component allocates the costs of the
program directly to the industrial customers who participate in the program and pay surcharges.
The following describes each of the wastewater cost components for Houston Water:
Flow: Operating and capital costs incurred by the
wastewater system to handle the quantity of flows
discharged to or collected by the system.
Capacity: Capital costs associated with hydraulic
capacity within the wastewater treatment plants.
Biochemical Oxygen Demand (BOD): During
treatment, microbial organisms consume
dissolved oxygen while oxidizing the organic
matter present in wastewater. BOD measures the
quantity of oxygen required for that process.
Expenses include costs incurred to remove and
dispose of organic compounds.
Total Suspended Solids (TSS): TSS measures the
quantity of suspended solids or non‐filterable
residue in the wastewater. Costs include those
associated with removing and disposing of small
particles in the wastewater.
Ammonia: Cost for removing and disposing of
ammonia from the wastewater.
Industrial Wastewater Program: Costs
associated with managing the program that issues
and oversees wastewater permits for industrial
customers.
Customer: Costs that relate to operational
support activities including accounting, billing,
customer service, administrative, and technical
support. These are common to all customers.
Carollo reviewed the existing fixed assets for the wastewater system and allocated each to the appropriate
functional category based on direction from Houston Water staff. In addition, each of the individual operating
budget line items was reviewed and its corresponding costs allocated based on the service provided. The
functionalized assets and O&M are then allocated to the appropriate cost components according to the MOP
methodology. This functional allocation process provides a reasonable, appropriate basis for
proportionately distributing costs to customer types based on their usage patterns and is grounded in cost of
service principles and standards.
Fixed Asset Allocation. Carollo reviewed the fixed asset registry provided by Houston Water staff, which
allocated each asset to a specific functional category. The study then allocated the functionalized assets to
cost components. The overall results of this allocation are used as a proxy to allocate capital‐related costs.
This minimizes large shifts in the allocation of capital costs, which can vary significantly from year to year.
Table . summarizes the allocation of the functionalized assets to the cost components to determine the
allocation factors applied to the capital related costs.

WATER AND WASTEWATER COST OF SERVICE RATE STUDY | CITY OF HOUSTON
DRAFT | APRIL |
Table . Allocation of Wastewater System Assets to Cost Components ( millions) ( )
Description Value ( )
Percent Allocation (%)
Flo
w –
Ret
ail
Flo
w –
Ret
ai +
Cat
Y
Wh
ole
sale
Cap
acit
y
BO
D
TS
S
Am
mo
nia
Gen
eral
Plants & Structures , . . . .
Elec, Mech, Controls . .
Supply – Wells . .
Lift and Pump Stations . .
Interceptors , . .
Local Collector Mains , . .
Land & Site . .
SCADA System . .
Fuel Tanks . .
Chemical Tanks . .
Subtotal Allocation ( ) , . , . , . . . . . .
Subtotal Allocation (%) . % . % . % . % . % . % . %
Reallocation of General . . . . . . ( . )
Total Allocation ( ) , . , . , . . . . .
Total Allocation (%) . % . % . % . % . % . %
Note: ( ) Values are in million dollars and are rounded.
O&M Allocation. Similar to the fixed assets, the study allocated the wastewater system operating expenses to
functional categories and then to cost components. The allocation percentages used to functionalize the
operating budget are estimates based on discussions with Houston Water staff. To avoid large shifts in
allocations during the five‐year rate‐setting period, the projected budgets for FYE through FYE
were averaged, and this average budget was allocated to develop the revenue requirement allocation. Then
the revenue requirement allocation was applied to each of the five test years to develop rates.
Table . , on the following page, provides the allocation of the five‐year average O&M budget to functional
categories.
Table . summarizes the allocation of the functionalized average O&M expenses to the cost components

WATER AND WASTEWATER COST OF SERVICE RATE STUDY | CITY OF HOUSTON
DRAFT | APRIL |
Table . Functional Allocation of Wastewater O&M Budget ( millions) ( )
Description ‐yr Avg ( )
Percent Allocation (%)
Influent Pumping & Headworks Aeration Clarifiers
Chlor / Dechlor
Solids Thickening /
Digestion Biosolids Handling
Effluent Discharge
Industrial WW
Program Lift
Stations Collection
System Customer
Billing Administra
tion
Treatment Collection
General General
Wastewater Operations:
– WWO Executive Support G&A . .
– WWO Collection System Analysis . .
– WWO Collection System Repairs . .
– WWO Regulatory and Compliance . . .
– WWO Technical Services G&A . .
– WWO Plant Operations . . . . . . . .
– WWO Electrical & Automation . . . . . . . .
– WWO Construction Management . . . . . .
– WWO Contract Management . . . . . .
– WWO Mechanical Management . . . . . . .
– WWO Maint Operation Services . . . .
– WWO EPA Compliance . .
Operation Services (G&A):
– OPS Fin & Supp Op Svcs G&A . .
(HWP) – HW Planning . . . .
– OPS Maint Op Svcs – Restoration . .
– OPS Maint Op Svcs – COS/DIS . .
– HW GIS Services . . . . . . .
– OPS Executive Support . .
– OPS Support Services . .
– HW Infrastructure Planning . . . .
– HW Utility Analysis . . . .
Other O&M:
‐ – Director's Office . .
– Information Technology . .
‐ – Management Support . .
& – Houston Water – Planning . .
, , , – Fin Mgmt Svcs Support . .
‐ , – CAS Cust Acct Services . .
Deductions ( . ) .
Subtotal Allocation ( ) . . . . . . . . . . . . . . .
Subtotal Allocation (%) . % . % . % . % . % . % . % . % . % . % . % . % . % . %
Reallocation of General ( ) . . . . . . . . . . . . . ( . )
Total Allocated Assets ( ) . . . . . . . . . . . . . .
Total Allocated Assets (%) . % . % . % . % . % . % . % . % . % . % . % . % . % Notes: ( ) Allocations are developed using an average of O&M costs for the ‐year period FYE through FYE . Costs are in millions of dollars and are rounded.
( ) General category is reallocated to other functional categories based on direct allocation of O&M budget.
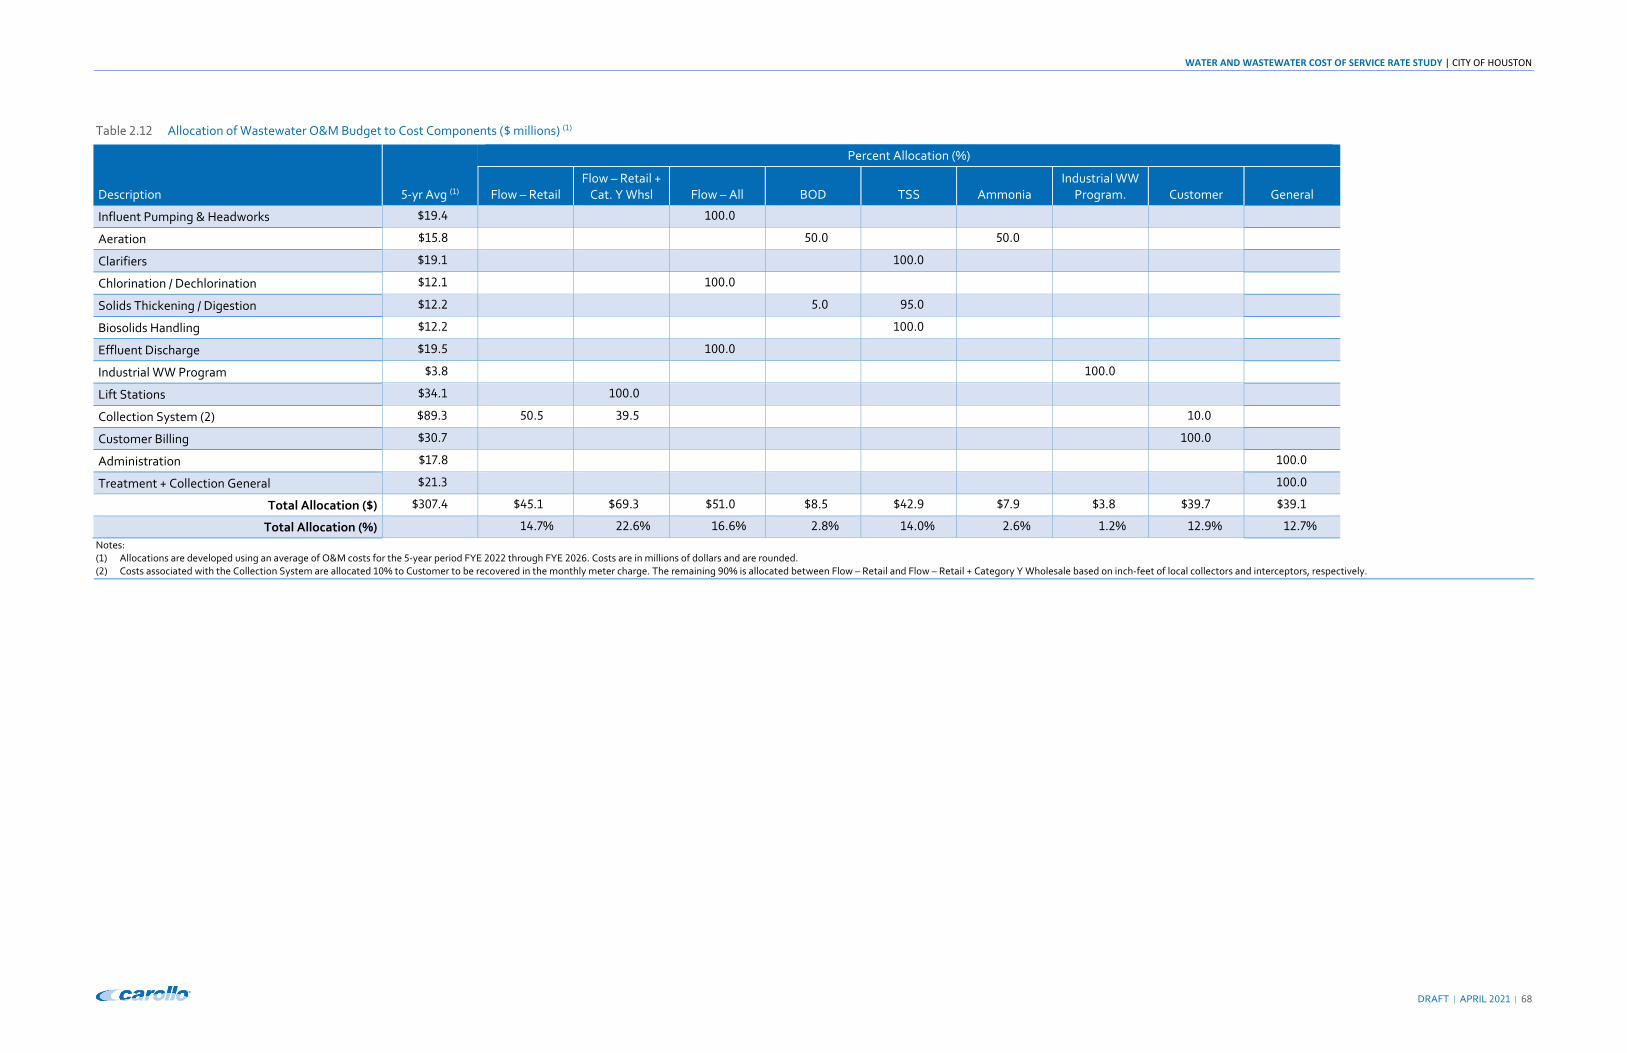
WATER AND WASTEWATER COST OF SERVICE RATE STUDY | CITY OF HOUSTON
DRAFT | APRIL |
Table . Allocation of Wastewater O&M Budget to Cost Components ( millions) ( )
Description ‐yr Avg ( )
Percent Allocation (%)
Flow – Retail Flow – Retail +
Cat. Y Whsl Flow – All BOD TSS Ammonia Industrial WW
Program. Customer General
Influent Pumping & Headworks . .
Aeration . . .
Clarifiers . .
Chlorination / Dechlorination . .
Solids Thickening / Digestion . . .
Biosolids Handling . .
Effluent Discharge . .
Industrial WW Program . .
Lift Stations . .
Collection System ( ) . . . .
Customer Billing . .
Administration . .
Treatment + Collection General . .
Total Allocation ( ) . . . . . . . . . .
Total Allocation (%) . % . % . % . % . % . % . % . % . %
Notes: ( ) Allocations are developed using an average of O&M costs for the ‐year period FYE through FYE . Costs are in millions of dollars and are rounded. ( ) Costs associated with the Collection System are allocated % to Customer to be recovered in the monthly meter charge. The remaining % is allocated between Flow – Retail and Flow – Retail + Category Y Wholesale based on inch‐feet of local collectors and interceptors, respectively.

WATER AND WASTEWATER COST OF SERVICE RATE STUDY | CITY OF HOUSTON
DRAFT | APRIL |
Offsetting Revenue. Wastewater service penalties, impact fee revenue, interest and other non‐rate revenue
are used to offset the revenue requirements and reduce the required increase in rate revenue. These offsetting
revenues are allocated to the general category and reallocated to the cost components based on the direct
allocation of the total revenue requirements. The exception to this is a partial allocation of other operating
revenue to Customer to directly allocate revenue from miscellaneous customer fees to the Customer cost
component where the related costs are allocated.
2.3.1.3 Revenue Requirements Allocation
To obtain an overall percentage allocation, operating expenses, capital expenses, and offsetting revenues are
weighted based on their projected expenditures for the five‐year average, as shown in Table . . Once the
overall percentage allocation to each functional category has been defined, those percentages are applied to
the test year revenue requirement in order to determine the total revenue requirement for each cost
component, as shown in Table . .

WATER AND WASTEWATER COST OF SERVICE RATE STUDY | CITY OF HOUSTON
DRAFT | APRIL |
Table . Allocation of Wastewater Revenue Requirements to Cost Components ( millions) ( )
Description ‐yr Avg ( )
Flow – Retail
Flow – Retail + Cat.
Y Whsl Flow – All Capacity BOD – O&M BOD – Capital TSS – O&M
TSS – Capital
Ammonia – O&M
Ammonia – Capital
Industrial WW Pgm. Customer General
Operating Costs ( ) . . . . . . . . . . . . . .
Capital Costs:
Debt Service ( ) . . . . . . . . . . . . . .
Bad Debt ( ) . . . . . . . . . . . . . .
Rate‐funded Capital (PAYGO) ( ) . . . . . . . . . . . . . .
Water Service Penalties ( ) ( . ) . . . . . . . . . . . . ( . )
Other Water Operating Revenue (Non‐rate) ( ) ( . ) . . . . . . . . . . . ( . ) ( . )
Impact Fee Revenue ( ) ( . ) . . . . . . . . . . . . ( . )
Non‐operating Water Revenue (Non‐rate) ( ) ( . ) . . . . . . . . . . . . ( . )
Interest ( ) ( . ) . . . . . . . . . . . . ( . )
Additions / (Subtractions) from Cash Balance ( ) . . . . . . . . . . . . . .
Subtotal Allocation ( ) . . . . . . . . . . . . . .
Subtotal Allocation (%) . % . % . % . % . % . % . % . % . % . % . % . % . % . %
Reallocation of "General" ( ) . . . . . . . . . . . . ( . )
Total Allocated Revenue Requirement ( ) . . . . . . . . . . . . . .
Total Allocated Revenue Requirement (%) . % . % . % . % . % . % . % . % . % . % . % . % . %
Notes: ( ) Values are in millions of dollars and are rounded. ( ) Allocations are developed using an average of revenue requirements for the ‐year period FYE through FYE . ( ) From Table . . ( ) Allocated using asset allocation percentages developed in Table . . ( ) Allocated to General category to be reallocated based on direct allocations. ( ) Partially allocated to Customer ( %) to align revenue from customer‐related fees. Remainder is allocated to General category to be reallocated based on direct allocations. ( ) General category is reallocated to other cost components based on direct allocation of revenue requirements.

WATER AND WASTEWATER COST OF SERVICE RATE STUDY | CITY OF HOUSTON
DRAFT | APRIL |
Table . Allocation of FYE Wastewater Revenue Requirements to Cost Components ( millions) ( )
Description FYE ( ) Flow – Retail Flow – Retail + Cat. Y Whsl Flow – All Capacity BOD – O&M
BOD – Capital TSS – O&M TSS – Capital
Ammonia – O&M
Ammonia – Capital
Industrial WW Pgm. Customer
Operating Costs . . . . . . . . . . . . .
Capital Costs:
Debt Service . . . . . . . . . . . . .
Bad Debt . . . . . . . . . . . . .
Rate‐funded Capital (PAYGO) . . . . . . . . . . . . .
Water Service Penalties ( . ) ( . ) ( . ) ( . ) ( . ) ( . ) ( . ) ( . ) ( . ) ( . ) . ( . ) ( . )
Other Water Operating Revenue (Non‐rate) ( . ) ( . ) ( . ) ( . ) ( . ) ( . ) ( . ) ( . ) ( . ) ( . ) . ( . ) ( . )
Impact Fee Revenue ( . ) ( . ) ( . ) ( . ) ( . ) ( . ) ( . ) ( . ) ( . ) ( . ) . ( . ) ( . )
Non‐operating Water Revenue (Non‐rate) ( . ) ( . ) ( . ) ( . ) ( . ) ( . ) ( . ) ( . ) ( . ) ( . ) . ( . ) ( . )
Interest ( . ) ( . ) ( . ) ( . ) ( . ) ( . ) ( . ) ( . ) ( . ) ( . ) . ( . ) ( . )
Additions / (Subtractions) from Cash Balance ( ) ( . ) ( . ) ( . ) ( . ) ( . ) ( . ) ( . ) ( . ) ( . ) ( . ) . ( . ) ( . )
Total Allocated Revenue Requirement ( ) . . . . . . . . . . . . .
Total Allocated Revenue Requirement (%) . % . % . % . % . % . % . % . % . % . % . % . % . %
Notes: ( ) Values are in millions of dollars and are rounded. ( ) Test year revenue requirements from Table . (FYE shown in this table) are allocated based on allocation of ‐year average revenue requirements from Table . . ( ) Additions/(subtractions) shown in this table is based on revenue requirements for July , , revenue increase and does not match what is shown in Table . , which includes the April , , revenue increase.

WATER AND WASTEWATER COST OF SERVICE RATE STUDY | CITY OF HOUSTON
DRAFT | APRIL |
2.3.2 Allocation to Customer Types
2.3.2.1 Unit Costs
The unit costs of service are developed by dividing the total annual costs allocated to each of the cost
components by the total annual service units of the respective component. The total annual costs allocated
to each cost component are determined by applying the allocations from Table . , as shown in Table . .
Units of Service. Based on functional category, the units of service are wastewater discharged, loadings (BOD,
TSS, and ammonia), and annual bills.
The following describes the quantifiable analysis of the units of service:
Flow: Allocated based on the water usage for each
customer in , gallons.
Capacity: Allocated based on average daily flow.
BOD: Allocated based on pounds of BOD returned
to the system.
TSS: Allocated based on pounds of TSS returned
to the system.
Ammonia: Allocated based on pounds of
ammonia returned to the system.
Customer: Allocated based on the number of bills.
Industrial Wastewater Program: Allocated to
industrial wastewater customers based on the
number of bills.
Unit Cost Development. In order to allocate the cost of service to various customer types, unit costs of service
are developed for each cost component. As shown in Table . , the total rate revenue requirements are
allocated to each cost component for the test year. The total cost for each functional category is then divided
by the total number of associated units of service to determine appropriate unit costs for the wastewater
system. The units of service for each customer type are shown in Table . .
Table . shows the calculation of the unit costs for each cost component, which are then applied to the units
of service for each customer type from Table . to derive customer type allocations for each test year of the
five year rate period. Projections are based on FYE customer usage characteristics and account growth
assumptions. As such, costs are allocated to each customer type based on their respective base usage and
peaking factors to reflect their proportionate use of the overall system.

WATER AND WASTEWATER COST OF SERVICE RATE STUDY | CITY OF HOUSTON
DRAFT | APRIL |
Table . Wastewater Units of Service by Customer Type (FYE )
Customer Type Flow – Retail Flow – Retail +
Cat. Y Whsl Flow – All Capacity BOD – O&M BOD – Capital TSS – O&M TSS – Capital Ammonia –
O&M Ammonia –
Capital Industrial WW
Pgm. Customer
Units kgal kgal kgal kgal/day lbs lbs lbs lbs lbs lbs ind. bills bills
Retail:
Single Family Residential , , , , , , , , , , , , , , , , , , , , ,
Multifamily Residential , , , , , , , , , , , , , , , , , , , ,
Commercial / Industrial ( ) , , , , , , , , , , , , , , , , , , , ,
Industrial with Surcharges , , , , , , , , , , , , , , , , , , ,
Sewer Only (Unmetered) , , , , , , , , , ,
Wholesale:
Capital w/o Collection System , , , , , , ,
No Capital w/Collection System , , , , , , , ,
Connection‐based , , , , , , , ,
Total , , , , , , , , , , , , , , , , , , , , , ,
Note: ( ) Commercial/industrial customer type includes industrial customers who do not pay industrial surcharges.
Table . Development of Wastewater Unit Costs (FYE ) ( millions) ( )
Description Flow – Retail Flow – Retail +
Cat. Y Whsl Flow – All Capacity BOD – O&M BOD – Capital TSS – O&M TSS – Capital Ammonia –
O&M Ammonia –
Capital Industrial WW
Pgm. Customer
Allocated Revenue Requirements ( ) . . . . . . . . . . . .
Total Units ( ) , , , , , , , , , , , , , , , , , , , , , ,
Unit Cost . . . . . . . . . . , . .
Units kgal kgal kgal kgal/day lbs lbs lbs lbs lbs lbs ind. bills bills
Notes: ( ) From Table . . Values are in millions of dollars and are rounded. ( ) From Table . .

WATER AND WASTEWATER COST OF SERVICE RATE STUDY | CITY OF HOUSTON
DRAFT | APRIL |
Customer Allocation. Carollo analyzed customer billing data to determine the number of bills by meter size and
customer type, as well as the discharge characteristics of each customer type. Table . details the results of
the cost allocation by customer type based on FYE customer data.
Based on these unit allocations, Table . details the FYE cost of service for each customer type and
cost component, which are then summed to determine the total revenue requirement by customer type.
Detailed water cost of service allocations by customer type are provided for FYE through FYE in
Appendix G.
The rate design analysis determines how the costs are recovered from each customer type through specified
wastewater rates. The focus of this process is to achieve cost recovery and substantiate that customers are
paying their fair and proportionate share of system costs. Houston Water’s existing rate structure consists of
two components: a volumetric rate (variable) and a monthly meter charge (fixed). The volumetric component
is assessed based on metered water usage per , gallons and, by design, is intended to recover the cost
incurred for collecting and treating each unit of wastewater. The monthly service charge is intended to
recognize that the utility incurs fixed costs to provide the availability of wastewater service, which must be
recovered independent of monthly wastewater flows and loadings. These two rate components serve as a
basis for the following rate design chapter.
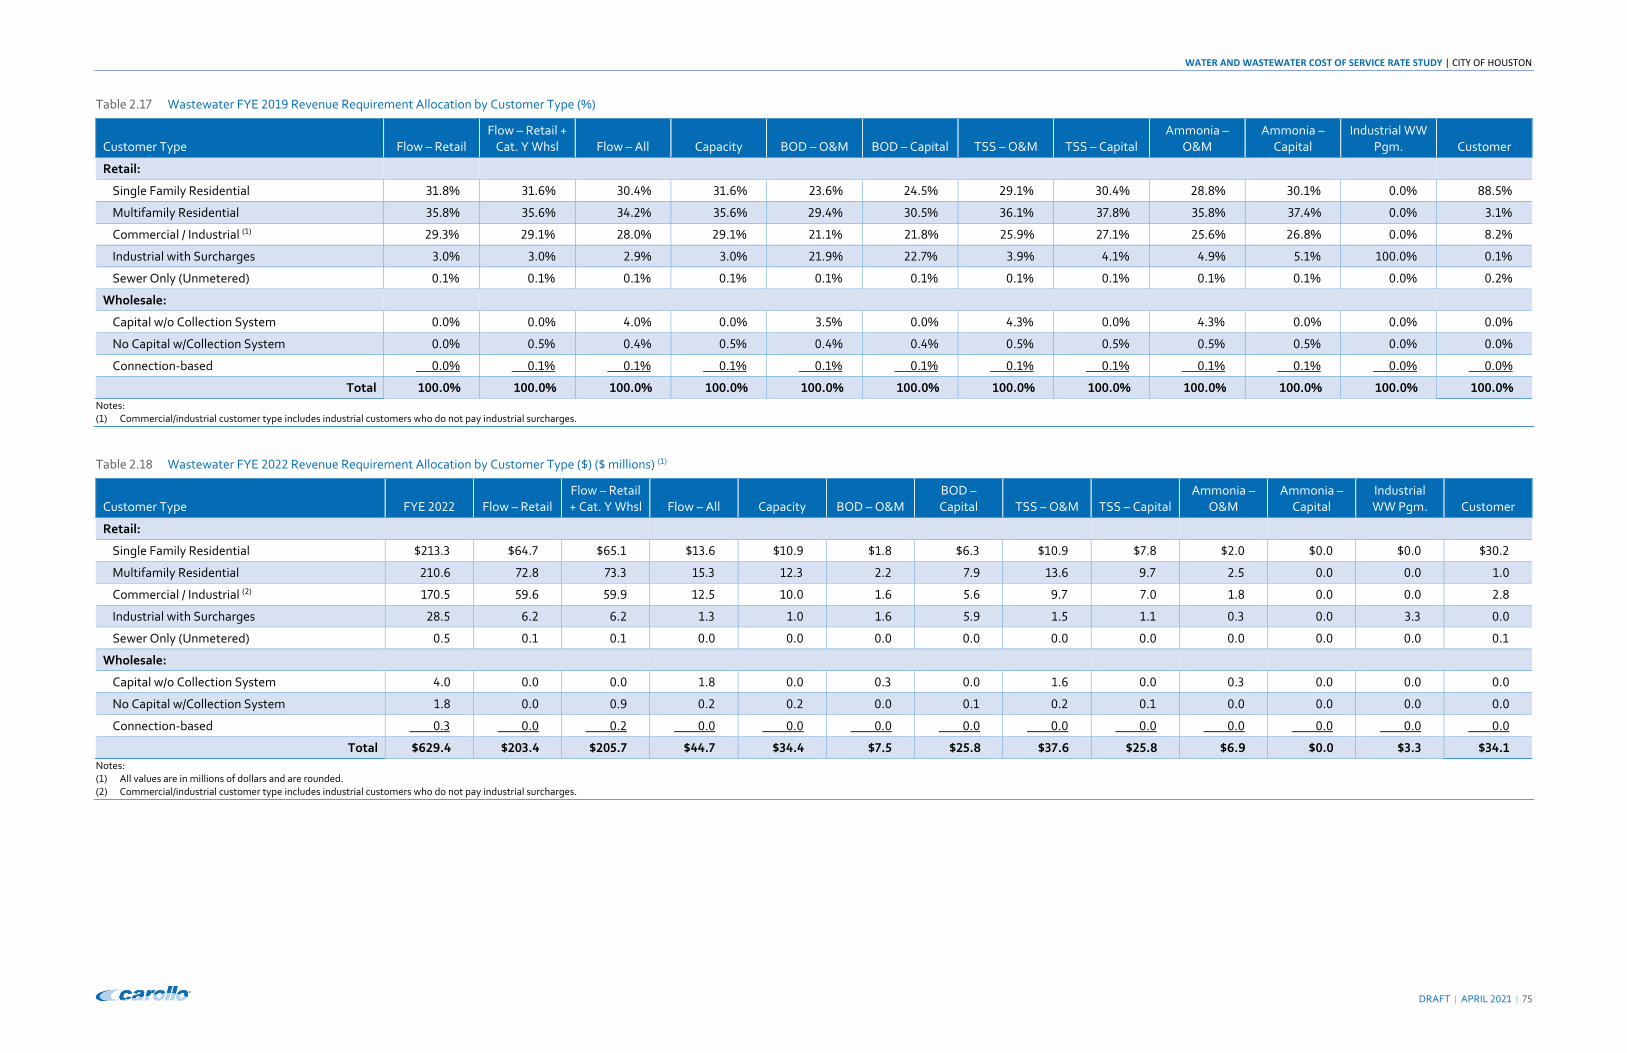
WATER AND WASTEWATER COST OF SERVICE RATE STUDY | CITY OF HOUSTON
DRAFT | APRIL |
Table . Wastewater FYE Revenue Requirement Allocation by Customer Type (%)
Customer Type Flow – Retail Flow – Retail +
Cat. Y Whsl Flow – All Capacity BOD – O&M BOD – Capital TSS – O&M TSS – Capital Ammonia –
O&M Ammonia –
Capital Industrial WW
Pgm. Customer
Retail:
Single Family Residential . % . % . % . % . % . % . % . % . % . % . % . %
Multifamily Residential . % . % . % . % . % . % . % . % . % . % . % . %
Commercial / Industrial ( ) . % . % . % . % . % . % . % . % . % . % . % . %
Industrial with Surcharges . % . % . % . % . % . % . % . % . % . % . % . %
Sewer Only (Unmetered) . % . % . % . % . % . % . % . % . % . % . % . %
Wholesale:
Capital w/o Collection System . % . % . % . % . % . % . % . % . % . % . % . %
No Capital w/Collection System . % . % . % . % . % . % . % . % . % . % . % . %
Connection‐based . % . % . % . % . % . % . % . % . % . % . % . %
Total . % . % . % . % . % . % . % . % . % . % . % . %
Notes: ( ) Commercial/industrial customer type includes industrial customers who do not pay industrial surcharges.
Table . Wastewater FYE Revenue Requirement Allocation by Customer Type ( ) ( millions) ( )
Customer Type FYE Flow – Retail Flow – Retail + Cat. Y Whsl Flow – All Capacity BOD – O&M
BOD – Capital TSS – O&M TSS – Capital
Ammonia – O&M
Ammonia – Capital
Industrial WW Pgm. Customer
Retail:
Single Family Residential . . . . . . . . . . . . .
Multifamily Residential . . . . . . . . . . . . .
Commercial / Industrial ( ) . . . . . . . . . . . . .
Industrial with Surcharges . . . . . . . . . . . . .
Sewer Only (Unmetered) . . . . . . . . . . . . .
Wholesale:
Capital w/o Collection System . . . . . . . . . . . . .
No Capital w/Collection System . . . . . . . . . . . . .
Connection‐based . . . . . . . . . . . . .
Total . . . . . . . . . . . . .
Notes: ( ) All values are in millions of dollars and are rounded. ( ) Commercial/industrial customer type includes industrial customers who do not pay industrial surcharges.

WATER AND WASTEWATER COST OF SERVICE RATE STUDY | CITY OF HOUSTON
DRAFT | APRIL |
Chapter 3
RATE DESIGN
3.1 Introduction
Revenue requirements and cost‐of‐service allocations provide the basis for designing water and wastewater
rates. Revenue requirements show the level of revenue to be recovered from rates to fund planned utility
operations and maintenance and capital projects and provide adequate resources to meet target cash levels.
Cost‐of‐service allocations provide the unit costs and ultimately the cost of service for each customer type
that can then be used in the design of user charges or rates for service.
In the development of schedules of rates for service, a basic consideration is to establish equitable charges to
customers commensurate with the cost of providing service. As this is challenging to do for each individual
customer, rates are normally designed to meet average conditions for groups of customers having similar
service requirements.
The cost‐of‐service studies are the result of cost and engineering estimates based to some extent upon
judgment and experience, and detailed results should not be used as exact answers but as guides to the
necessity for rate adjustments. Practical considerations may enter into the final choice of charges, recognizing
such factors as previous rate levels, existing rate structures, the degree of adjustments indicated, and policies
concerning the application of rates. Carollo worked with Houston Water staff to analyze various adjustments
with the goals of simplifying the water and wastewater rate structures and improving equity and
understanding among customers. The proposed rates are intended to transition each customer type toward
its cost of service.
3.2 Water System
3.2.1 Existing User Charges
Houston Water’s existing rate structure has been in effect since April , , and includes monthly meter
charges and volume rates. The existing water rate structure is complex and difficult for customers to
understand, especially the single family residential rate structure, which is not consistent with commonly used
structures. Existing water user charges have the following:
Monthly meter charge (a base charge or fixed amount per retail account) that varies by meter size
and customer type.
Volume rate ( per , gallons) structure with seven tiers for single family residential, two tiers for
irrigation, and uniform rates for all other retail customer types.
Volume rate ( per , gallons) structure with minimum and excess rates for contract – treated
water and contract – untreated water customers and O&M and overhead rates for water authorities
and Southeast WPP co‐participants.
3.2.2 Proposed User Charges
Carollo recommends the following modifications to the existing water rate structure:
Monthly meter charges are proposed to be the same for single family residential, multifamily
residential, commercial / industrial, irrigation, and emergency backup customer types.

WATER AND WASTEWATER COST OF SERVICE RATE STUDY | CITY OF HOUSTON
DRAFT | APRIL |
A new fixed charge per connection is proposed to recover the annual fee paid to TCEQ by Houston
Water. This charge would appear separately from the monthly meter charge on the customer bill.
A four‐tier inclining block rate structure is proposed for single family residential with a conservation
credit available to customers who use , gallons or less in a month, which would reduce the
volume rate per , gallons for all usage.
A uniform volume rate structure is proposed for irrigation.
For each test year, Carollo calculated cost‐of‐service rates for each customer type. To avoid significant
impacts on customer bills, the study used the cost‐of‐service rates as a target and developed rates that
transition toward cost of service over the five‐year period. This section will present the development of FYE
cost‐of‐service rates and the recommended five‐year rate plan.
3.2.2.1 Monthly Meter Charge
Monthly meter charges are intended to recognize that the utility incurs fixed costs to provide the availability
of water service, which must be recovered independent of monthly water demands and consumption.
Proposed monthly meter charges are the same for most retail customer types but vary for transient, resale,
metered fire, and unmetered fire customers. Wholesale customers do not pay monthly meter charges.
By design, the monthly meter charge includes a customer component, a capacity component based on meter
size, and a fire protection component based on meter size. The customer component recovers expenses
associated with billing, collection, and customer service. This component is the same for all customers
regardless of meter size. The capacity component captures maintenance costs related to meters and services,
as well as a portion of the water system capital costs. The fire protection component captures costs related to
providing and maintaining fire protection infrastructure (e.g., fire hydrants), as well as providing additional
capacity in the system for fire flow requirements. The capacity and fire protection components vary based on
meter size to reflect the difference in potential demand that can be placed on the system by different sized
meters. The capacity charge and fire protection charge are then added to the customer unit cost to calculate
the total monthly meter charge.
Residential, Commercial, Industrial, Irrigation, and Emergency Backup Customers. Table . shows the
development of the cost‐of‐service monthly meter charge by meter size for FYE using unit costs
developed in Table . . This applies to single family residential, multifamily residential, commercial /
industrial, irrigation, and emergency backup customers.

WATER AND WASTEWATER COST OF SERVICE RATE STUDY | CITY OF HOUSTON
DRAFT | APRIL |
Table . Development of Water Monthly Meter Charge (FYE )
Meter Size MEU
Multiplier ( )
Customer (Billing &
Collecting) Capacity (Meter
Charges) ( )
Fire Protection ( )
Cost‐of‐Service Monthly Meter
Charge ( )
Unit Cost per MEU per bill ( ) . . .
/ ” . . . . .
/ " . . . . .
” . . . . .
½” . . . . .
” . . . . .
” . . . . .
” . . . . .
” . . . . .
” . . . . .
” . . . . .
” . . . . .
Notes: ( ) MEU multipliers are based on the safe maximum operating capacity, in gallons per minute, from the AWWA M Manual. ( ) From Table . . ( ) Unit cost per MEU from Table . is divided by months to get unit cost per MEU per monthly bill. ( ) Values are rounded and may not sum.
Table . shows the existing and proposed water monthly meter charges by meter size for FYE through
FYE . The proposed meter charges differ slightly from those developed in Table . based on Houston
Water pricing objectives intended to minimize the impact to customers and improve customer affordability.
The proposed monthly meter charges apply to all retail customer types except transient, resale, and metered
and unmetered fire.

WATER AND WASTEWATER COST OF SERVICE RATE STUDY | CITY OF HOUSTON
DRAFT | APRIL |
Table . Existing and Proposed Water Monthly Meter Charges ( )
Meter Size
Existing Proposed
SFR ( ) MFR ( ) Com/Ind Irrigation EBS ( ) FYE FYE FYE FYE FYE
Month of Increase July April April April April April
/ ” . . . . . . . . . . .
/ " . . . . . . . . . . .
” . . . . . . . . . . .
½” . . . . . . . . . . .
” . . . . . . . . . . .
” . . . . . . . . . . .
” ‐‐‐ . . . . . . . . . .
” ‐‐‐ . . , . . . . . . . .
” ‐‐‐ . . , . . . . . . . .
” ‐‐‐ . . , . . . . . . . .
” ‐‐‐ . . , . . . . . . . .
Notes: ( ) Monthly meter charges shown are proposed for single family residential, multifamily residential, commercial/industrial, irrigation, and emergency backup customers. ( ) SFR is Single Family Residential. ( ) MFR is Multifamily Residential. ( ) EBS is Emergency Backup Service.

WATER AND WASTEWATER COST OF SERVICE RATE STUDY | CITY OF HOUSTON
DRAFT | APRIL |
Transient, Resale, Metered Fire, and Unmetered Fire Customers. Houston Water has several other retail
customer types receiving water service that are charged different monthly meter charges than those shown
in Table . .
Transient customers have portable water meters that are typically used for construction sites. These portable
meters cost more than the permanent meters used by other customer types. These accounts also require
quarterly audits performed by Houston Water staff. The proposed monthly meter charges for transient
customers reflect these additional costs.
Resale customers use water inconsistently and/or infrequently, which requires Houston Water to maintain
system capacity for them even when they are not using water. The proposed monthly meter charges for resale
customer reflect the cost incurred by Houston Water to provide this type of “stand‐by” service.
There are two types of fire customers – metered and unmetered. Approximately percent of fire customers
are unmetered, which makes it difficult to determine the true cost to provide service to these customers.
Houston Water wants to encourage these customers to install meters to measure any usage through the fire
line by charging a reduced monthly meter charge for metered fire customers. Unmetered fire customers will
pay higher monthly meter charges because their usage is not measured so the full cost of service must be
recovered from the monthly meter charges.
Table . shows existing and proposed monthly meter charges for transient, resale, and fire customers.
Table . Existing and Proposed Water Monthly Meter Charges – Transient, Resale, Metered Fire, and
Unmetered Fire Customers
Meter Size Existing FYE FYE FYE FYE FYE
Month of Increase July April April April April April
Transient:
‐inch . . . . . . .
‐inch . . . . . . .
‐inch . . . . . . .
Resale:
/ ‐inch and / ‐inch . . . . . . .
‐inch . . . . . . .
½‐inch . . . . . . .
‐inch . . . . . . .
‐inch . . . . . . .
‐inch . . . . . . .
‐inch . . . . . . .
‐inch , . , . , . , . , . , . , .

WATER AND WASTEWATER COST OF SERVICE RATE STUDY | CITY OF HOUSTON
DRAFT | APRIL |
Meter Size Existing FYE FYE FYE FYE FYE
Month of Increase July April April April April April
Metered Fire
/ ‐inch . . . . . . .
/ ‐inch . . . . . . .
‐inch . . . . . . .
/ ‐inch . . . . . . .
‐inch . . . . . . .
‐inch . . . . . . .
‐inch . . . . . . .
‐inch . . . . . . .
‐inch . . . . . . .
‐inch . . . . . . .
Unmetered Fire ( ):
/ ‐ and / ‐inch . . . . . . .
‐inch . . . . . . .
/ ‐inch . . . . . . .
‐inch . . . . . . .
‐inch . . . . . . .
‐inch . . . . . . .
‐inch . . . . . . .
‐inch . . . . . . .
‐inch . . . . . . .
‐inch . . . . . . .
Note: ( ) Monthly meter charges for unmetered fire customers are based on the size of the service line.
3.2.2.2 TCEQ Fee
The study proposes a new monthly fee to collect money from each connection to pay the annual TCEQ fee
charged to Houston Water. This will be a separate line item on the bill and will be a uniform charge per
connection. Every connection will pay the same each month, regardless of customer type or meter size.
However, it should be noted that this fee is assessed per connection, not per meter or per account. While most
accounts have one connection and one meter, there are some accounts with multiple connections and some
meters that serve multiple connections.
The FYE monthly TCEQ fee per connection is calculated by dividing the unit cost from Table . by
months. The monthly TCEQ fee for FYE through FYE is shown in Table . .
Table . Proposed Monthly TCEQ Fee per Connection
Description FYE FYE FYE FYE FYE
Month of Increase July April April April April April
Monthly TCEQ Fee . . . . . .

WATER AND WASTEWATER COST OF SERVICE RATE STUDY | CITY OF HOUSTON
DRAFT | APRIL |
3.2.2.3 Volume Rates
Variable volume rates include a base component, which represents the cost to meet the average day demand;
a maximum day component, which represents the incremental cost to meet the maximum day demand; and
a maximum hour component, which represents the incremental cost to meet the maximum hour demand.
These costs are allocated to the different customer types based on the demands they place on the water
system. The three allocated components are then summed and divided by the projected usage to calculate
the average rate per , gallons for each customer type.
Single Family Residential Customers. Table . shows the calculation of the cost‐of‐service uniform volume rate
that will recover the FYE single family residential revenue requirement less the projected monthly meter
charge revenue from the proposed charges shown in Table . and the projected revenue from the TCEQ fee
shown in Table . . This represents the rate that would be charged for every unit of water sold to single family
residential customers to recover the full cost to provide service to these customers.
Table . FYE Single Family Residential Water Cost‐of‐Service Volume Rate Calculation
Description FYE
Month of Increase July
Single Family Residential Revenue Requirement (a) , ,
Less Projected Monthly Meter Charge Revenue (b) ( , , )
Less Projected TCEQ Fee Revenue (c) ( , , )
Net Single Family Residential Revenue Requirement (d = a – b – c) , ,
Projected Single Family Residential Usage (kgal) (e) , ,
Cost‐of‐Service Uniform Rate ( /kgal) (d / e) .
The uniform cost‐of‐service volume rate provides important information about the true cost to treat and
deliver water to single family residential customers to meet their base and peak demands. However, single
family residential customers are not charged a uniform rate per , gallons. Single family residential is
charged for water service based on a tiered structure so the volume rate varies for each incremental unit of
water. The existing structure is made up of rates that vary for each incremental , gallons for the first ,
gallons, increasing and decreasing as a customer uses more water. This results in large bill increases at specific
usage intervals. Carollo proposes transitioning to a water conservation rate structure with rates for usage
blocks that increase as a customer uses more water. This will simplify the rate structure and make it easier for
customers to understand how their usage affects their bill.
The proposed single family residential rate structure also includes a conservation credit or reduced volume
rate for customers who use , gallons or less in a month. This credit is available to all single family
residential customers every month if their usage does not exceed , gallons. Table . shows the reduced
volume rate for customers with monthly usage up to , gallons after the conservation credit is applied.
Customers who use more than , gallons in a month pay the full Tier volume rate for the first ,
gallons, as shown in Table . .
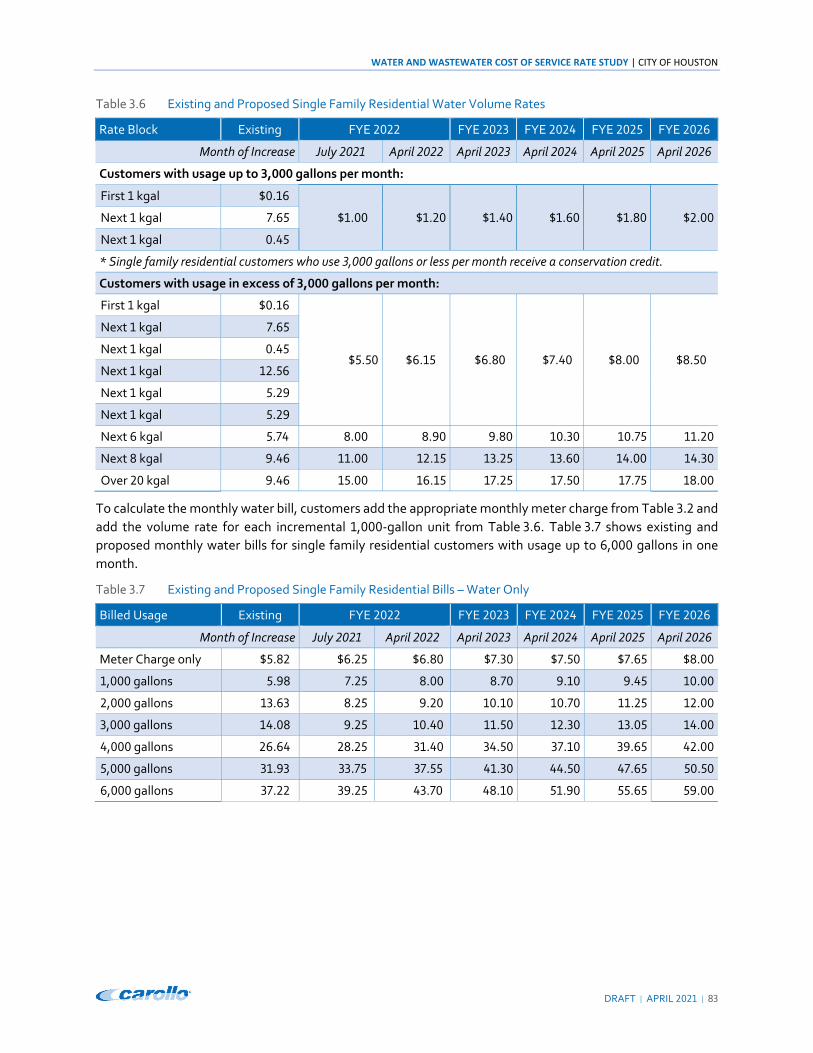
WATER AND WASTEWATER COST OF SERVICE RATE STUDY | CITY OF HOUSTON
DRAFT | APRIL |
Table . Existing and Proposed Single Family Residential Water Volume Rates
Rate Block Existing FYE FYE FYE FYE FYE
Month of Increase July April April April April April
Customers with usage up to , gallons per month:
First kgal .
. . . . . . Next kgal .
Next kgal .
* Single family residential customers who use , gallons or less per month receive a conservation credit.
Customers with usage in excess of , gallons per month:
First kgal .
. . . . . .
Next kgal .
Next kgal .
Next kgal .
Next kgal .
Next kgal .
Next kgal . . . . . . .
Next kgal . . . . . . .
Over kgal . . . . . . .
To calculate the monthly water bill, customers add the appropriate monthly meter charge from Table . and
add the volume rate for each incremental , ‐gallon unit from Table . . Table . shows existing and
proposed monthly water bills for single family residential customers with usage up to , gallons in one
month.
Table . Existing and Proposed Single Family Residential Bills – Water Only
Billed Usage Existing FYE FYE FYE FYE FYE
Month of Increase July April April April April April
Meter Charge only . . . . . . .
, gallons . . . . . . .
, gallons . . . . . . .
, gallons . . . . . . .
, gallons . . . . . . .
, gallons . . . . . . .
, gallons . . . . . . .

WATER AND WASTEWATER COST OF SERVICE RATE STUDY | CITY OF HOUSTON
DRAFT | APRIL |
Figure . illustrates the existing and proposed single family residential water rates and bills for the first ,
gallons in , ‐gallon increments.
Figure . Existing and Proposed Single Family Residential Water Rates and Bills
Other Retail Customer Types. With the exception of irrigation customers, all other retail customer types pay a
uniform rate per , gallons for all usage, which varies by customer type. Irrigation customers pay a reduced
rate for a “defined quantity” of water that is set based on their meter size; all usage in excess of that amount
is assessed a higher rate. Carollo recommends Houston Water continue to charge uniform rates for all retail
customer types other than single family residential, including irrigation.
Table . shows the calculation of the cost‐of‐service uniform volume rate that will recover the FYE
multifamily residential revenue requirement less the projected monthly meter charge revenue from the
proposed charges shown in Table . and the projected revenue from the TCEQ fee shown in Table . . This
represents the rate that would be charged for every unit of water sold to multifamily residential customers to
recover the full cost to provide service to these customers.

WATER AND WASTEWATER COST OF SERVICE RATE STUDY | CITY OF HOUSTON
DRAFT | APRIL |
Table . FYE Multifamily Residential Water Cost‐of‐Service Volume Rate Calculation
Description FYE
Month of Increase July
Multifamily Residential Revenue Requirement (a) , ,
Less Projected Monthly Meter Charge Revenue (b) ( , , )
Less Projected TCEQ Fee Revenue (c) ( , , )
Net Multifamily Residential Revenue Requirement (d = a – b – c) , ,
Projected Multifamily Residential Usage (kgal) (e) , ,
Cost‐of‐Service Uniform Rate ( /kgal) (d / e) .
Additional detail showing the calculations of the cost‐of‐service rate for each customer class for each year of
the five‐year rate‐setting period are provided in Appendix I.
Table . shows existing and proposed volume rates for all retail customer types except single family
residential.
Table . Existing and Proposed Retail Water Volume Rates
Customer Type Rate Block Existing FYE FYE FYE FYE FYE
Month of Increase July April April April April April
Multifamily Residential
All Usage . . . . . . .
Commercial/ Industrial
All Usage . . . . . . .
Irrigation ( )
Block . ‐‐‐ ‐‐‐ ‐‐‐ ‐‐‐ ‐‐‐ ‐‐‐
Block . ‐‐‐ ‐‐‐ ‐‐‐ ‐‐‐ ‐‐‐ ‐‐‐
All Usage ‐‐‐ . . . . . .
Transient All Usage . . . . . . .
Resale All Usage . . . . . . .
Emergency Backup
All Usage . . . . . . .
Metered Fire All Usage . . . . . . .
Note: ( ) Irrigation customers with meters larger than inch receive a “defined quantity” of water at a reduced Block rate. The defined quantity
is based on the meter size. Irrigation customers with ‐inch or smaller meters do not receive any water at the reduced Block rate.
The study recommends maintaining the existing wholesale and contract customers’ rate structures. Contract
Treated Water customers pay a uniform rate for all usage and an excess surcharge for all usage above their
contract minimum volume. Groundwater Reduction Plan (GRP) customers’ rate is based on the Contract
Treated Water – No Airgap rate although it is reduced based on the required groundwater reduction for each
Area. Areas and pay percent of the Contract Treated rate, and Area currently pays percent, but that
increases to percent in FYE . These rates, as well as the Contract Untreated rate, are shown in
Table . .

WATER AND WASTEWATER COST OF SERVICE RATE STUDY | CITY OF HOUSTON
DRAFT | APRIL |
Table . Existing and Proposed Wholesale Water Volume Rates
Customer Type Rate Block Existing FYE FYE FYE FYE FYE
Month of Increase July April April April April April
Contract w/Airgap
Minimum . . . . . . .
Excess . . . . . . .
Contract w/o Airgap
Minimum . . . . . . .
Excess . . . . . . .
GRP Areas &
All Usage . . . . . . .
GRP Area All Usage . . . . . . .
Contract Untreated
All Usage . . . . . . .
3.3 Wastewater System
3.3.1 Existing User Charges
Houston Water’s existing wastewater user charges have been in effect since April , , and include monthly
meter charges and volume rates. The existing rate structure is complex and difficult for customers to
understand, especially the single family residential rate structure, which is inconsistent with commonly used
structures. Existing wastewater user charges have the following:
Monthly meter charge (a base charge or fixed amount per retail account) that varies by meter size
and customer type.
Volume rate ( per , gallons) structure with six tiers for single family residential, two tiers for
industrial customers who do not pay BOD and TSS surcharges, and uniform rates for all other retail
customer types.
Monthly service charge (fixed charge per bill) for sewer only customers who are not connected to the
water system and therefore do not have metered water usage data for billing. These charges vary by
customer type.
Industrial wastewater surcharges ( per pound of BOD and TSS) assessed to customers in the
industrial wastewater program based on the strength of sampled wastewater.
Volume rate ( per , gallons) structure two types of contract wastewater customers – those who
have contributed capital and discharge wastewater directly to the treatment plant and those who
have not contributed capital and discharge wastewater into the collection system.
Monthly service charge (fixed charge per connection) for contract wastewater customers that do not
provide metered water usage data.
The monthly service charge is intended to recognize that the utility incurs fixed costs to provide the availability
of wastewater service, which must be recovered independent of monthly wastewater flow.

WATER AND WASTEWATER COST OF SERVICE RATE STUDY | CITY OF HOUSTON
DRAFT | APRIL |
3.3.2 Proposed User Charges
Carollo recommends the following modifications to the existing wastewater rate structure:
Monthly meter charges are proposed to be the same for single family residential, multifamily
residential, commercial, and industrial customer types.
A new industrial program charge is proposed to recover costs associated with Houston Water’s
industrial wastewater program. This charge would appear separately from the monthly meter charge
on the customer bill and will only be charged to industrial customers who are part of the program and
pay surcharges.
A two‐tier inclining block rate structure is proposed for single family residential.
A uniform volume rate structure is proposed for industrial customers who do not pay surcharges.
A new volume rate is proposed for contract wastewater customers who contribute capital and
discharge wastewater to the collection system.
For each test year, Carollo calculated cost‐of‐service rates for each customer type. To avoid significant
impacts on customer bills, the study used the cost‐of‐service rates as a target and developed rates that
transition toward cost of service over the five‐year period. This section will present the development of FYE
cost‐of‐service rates and the recommended five‐year rate plan.
3.3.2.1 Monthly Meter Charge
Monthly meter charges are intended to recognize that the utility incurs fixed costs to provide the availability
of wastewater service, which must be recovered independent of monthly water usage and wastewater
discharge. Proposed monthly meter charges are the same for all retail customer types except unmetered
sewer only customers. Wholesale customers do not pay monthly meter charges.
By design, the monthly meter charge includes a customer component and a capacity component based on
water meter size. The customer component recovers expenses associated with billing, collection, and
customer service. This component is the same for all customers regardless of meter size. The capacity
component captures a portion of the wastewater system capital costs. This component varies based on water
meter size to reflect the difference in potential flow that can be discharged to the system by customers with
different sized water meters. The capacity charge is then added to the customer unit cost to calculate the total
monthly meter charge.
Residential, Commercial, and Industrial Customers. Table . shows the development of the cost‐of‐service
monthly meter charge by meter size for FYE using unit costs developed in Table . . This applies to single
family residential, multifamily residential, commercial / industrial, irrigation, and emergency backup
customers.

WATER AND WASTEWATER COST OF SERVICE RATE STUDY | CITY OF HOUSTON
DRAFT | APRIL |
Table . Development of Wastewater Monthly Meter Charge (FYE )
Meter Size MEU Multiplier ( ) Customer Capacity ( )
Cost‐of‐Service Monthly Meter Charge ( )
Unit Cost per MEU per bill ( ) . .
/ ” . . . .
/ " . . . .
” . . . .
½” . . . .
” . . . .
” . . . .
” . . . .
” . . . .
” . . . .
” . . . .
” . . . .
” . . , . , .
Notes: ( ) MEU multipliers are based on the safe maximum operating capacity, in gallons per minute, from the AWWA M Manual. ( ) From Table . . ( ) Capacity revenue requirement from Table . is divided by projected , MEUs and by months to get unit cost per MEU per
monthly bill. ( ) Values are rounded and may not sum.
Table . shows the existing and proposed wastewater monthly meter charges by meter size for FYE
through FYE . The proposed meter charges differ from those developed in Table . based on Houston
Water pricing objectives intended to minimize the impact to customers and improve customer affordability.
The proposed monthly meter charges apply to all retail customer types except unmetered sewer only
customers.

WATER AND WASTEWATER COST OF SERVICE RATE STUDY | CITY OF HOUSTON
DRAFT | APRIL |
Table . Existing and Proposed Wastewater Monthly Meter Charges
Meter Size
Existing Proposed
SFR ( ) MFR ( ) Commercial Industrial ( ) FYE FYE FYE FYE FYE
Month of Increase July April April April April April
/ ” . . . . . . . . . .
/ " . . . . . . . . . .
” . . . . . . . . . .
½” . . . . . . . . . .
” . . . . . . . . . .
” . . . . . . . . . .
” ‐‐‐ . . . . . . . . .
” ‐‐‐ . . . . . . . . .
” ‐‐‐ . . . . . . . . .
” ‐‐‐ . . . . . . . . .
” ‐‐‐ . . . . . . . . .
” ‐‐‐ . . . . . , . , . , . , .
Notes: ( ) SFR is Single Family Residential. ( ) MFR is Multifamily Residential. ( ) Monthly meter charges for industrial customers in this table are for all industrial customers, including those who pay surcharges.

WATER AND WASTEWATER COST OF SERVICE RATE STUDY | CITY OF HOUSTON
DRAFT | APRIL |
Industrial Surcharge and Sewer Only (Unmetered) Customers. Houston Water manages an Industrial
Wastewater Program for permitted industrial customers who discharge high‐strength wastewater into the
system. These customers are sampled regularly and pay surcharges based on the loadings concentrations of
their sampled wastewater. As part of the cost of service rate study, Carollo worked with Houston Water staff
to identify and isolate the cost of this program and allocate it to the industrial surcharge customers. Carollo
recommends implementation of an Industrial Program Charge, which would be added to the industrial
surcharge customers’ bills, in addition to the monthly service charge, to pay for the cost of the program. The
recommended charges in Table . show a phase‐in of this charge over the ‐year study period. Table .
also shows proposed monthly service charges for sewer only customers, which are based on customer type.
Table . Existing and Proposed Wastewater Monthly Service Charges – Industrial Customers with Surcharges
and Sewer Only Customers
Customer Type Existing FYE FYE FYE FYE FYE
Month of Increase July April April April April April
Industrial with Surcharge:
Industrial Program ‐‐‐ . . . . , . , .
Sewer Only:
Single Family Res. . . . . . . .
Duplex . . . . . . .
Multifamily Res. . . . . . . .
Commercial . . . . . . .
Industrial . . . . . . .
Note: ( ) Charges shown for sewer only customers are monthly, but sewer only customers are billed and will continue to be billed bimonthly. The
existing multifamily charge is per unit for multifamily accounts with or more units. The existing commercial and industrial charges are per unit as defined in § ‐ .
3.3.2.2 Volume Rates
Variable volume rates include a flow component, which represents the cost to collect and treat wastewater
flow; a BOD component, which represents the cost to treat BOD; a TSS component, which represents the cost
to treat TSS; and an ammonia component, which represents the cost to treat ammonia. These costs are
allocated to the different customer types based on their contributed flows and assumed loadings (BOD, TSS,
and ammonia). The allocated components are then summed and divided by the projected flow to calculate
the average rate per , gallons for each customer type. The billable volume for each customer is equal to
the metered water usage, except for unmetered sewer only customers and those customers with effluent
meters.
Single Family Residential Customers. Table . shows the calculation of the cost‐of‐service uniform volume
rate that will recover the FYE single family residential revenue requirement less the projected monthly
meter charge revenue from the proposed charges shown in Table . . This represents the rate that would be
charged for every billable unit of single family residential wastewater to recover the full cost to provide service
to these customers.

WATER AND WASTEWATER COST OF SERVICE RATE STUDY | CITY OF HOUSTON
DRAFT | APRIL |
Table . FYE Single Family Residential Wastewater Cost‐of‐Service Volume Rate Calculation
Description FYE
Month of Increase July
Single Family Residential Revenue Requirement (a) , ,
Less Projected Monthly Meter Charge Revenue (b) ( , , )
Net Single Family Residential Revenue Requirement (c = a – b) , ,
Projected Single Family Residential Usage (kgal) (d) , ,
Cost‐of‐Service Uniform Rate ( /kgal) (c / d) .
The uniform cost‐of‐service volume rate provides important information about the true cost to collect, treat,
and discharge wastewater from single family residential customers. However, single family residential
customers are not charged a uniform rate per , gallons. Similar to water, the single family residential
wastewater rate structure is made up of rates that vary for each incremental , gallons for the first ,
gallons, increasing and decreasing as a customer’s billable volume goes up. This results in large bill increases
at specific usage intervals. Carollo recommends simplifying this structure to two blocks with a reduced rate
per , gallons for the first , gallons and a higher rate per , gallons for all usage in excess of ,
gallons per month.
Table . shows the existing and proposed single family residential wastewater volume rates for the study
period.
Table . Existing and Proposed Single Family Residential Wastewater Volume Rates
Rate Block Existing FYE FYE FYE FYE FYE
Month of Increase July April April April April April
First kgal .
. . . . . . Next kgal .
Next kgal .
Next kgal .
. . . . . . Next kgal .
Over kgal .
To calculate the monthly wastewater bill, customers add the appropriate monthly meter charge from
Table . and add the volume rate for each incremental , ‐gallon unit from Table . . Table . shows
existing and proposed monthly wastewater bills for single family residential customers with usage up to ,
gallons in one month.

WATER AND WASTEWATER COST OF SERVICE RATE STUDY | CITY OF HOUSTON
DRAFT | APRIL |
Table . Existing and Proposed Single Family Residential Bills – Wastewater Only
Billable Volume Existing FYE FYE FYE FYE FYE
Month of Increase July April April April April April
Meter Charge only . . . . . . .
, gallons . . . . . . .
, gallons . . . . . . .
, gallons . . . . . . .
, gallons . . . . . . .
, gallons . . . . . . .
, gallons . . . . . . .
Figure . illustrates the existing and proposed single family residential wastewater rates and bills for the first
, gallons in , ‐gallon increments.
Figure . Existing and Proposed Single Family Residential Wastewater Rates and Bills
Other Retail Customer Types. With the exception of industrial customers who do not pay surcharges, all other
retail customer types pay a uniform rate per , gallons for all billable volume, which varies by customer
type. Non‐surcharge industrial customers pay a reduced rate for the first , gallons; all usage in excess of
, gallons is assessed a higher rate. Carollo recommends Houston Water continue to charge uniform rates
for all retail customer types other than single family residential, including all industrial customers.

WATER AND WASTEWATER COST OF SERVICE RATE STUDY | CITY OF HOUSTON
DRAFT | APRIL |
Table . shows the calculation of the cost‐of‐service uniform volume rate that will recover the FYE
multifamily residential revenue requirement less the projected monthly meter charge revenue from the
proposed charges shown in Table . . This represents the rate that would be charged for every unit of
wastewater discharged from multifamily residential customers to recover the full cost to provide service to
these customers.
Table . FYE Multifamily Residential Wastewater Cost‐of‐Service Volume Rate Calculation
Description FYE
Month of Increase July
Multifamily Residential Revenue Requirement (a) , ,
Less Projected Monthly Meter Charge Revenue (b) ( , , )
Net Multifamily Residential Revenue Requirement (d = a – b – c) , ,
Projected Multifamily Residential Usage (kgal) (e) , ,
Cost‐of‐Service Uniform Rate ( /kgal) (d / e) .
Additional detail showing the calculations of the cost‐of‐service rate for each customer class for each year of
the five‐year rate‐setting period are provided in Appendix J.
Table . shows existing and proposed volume rates for all retail customer types except single family
residential.
Table . Existing and Proposed Retail Wastewater Volume Rates
Customer Type Rate Block Existing FYE FYE FYE FYE FYE
Month of Increase July April April April April April
Multifamily Residential
All Flow . . . . . . .
Commercial All Flow . . . . . . .
Industrial (no surcharge)
First kgal . ‐‐‐ ‐‐‐ ‐‐‐ ‐‐‐ ‐‐‐ ‐‐‐
Over kgal . ‐‐‐ ‐‐‐ ‐‐‐ ‐‐‐ ‐‐‐ ‐‐‐
All Usage ‐‐‐ . . . . . .
Industrial with Surcharge
All Flow . . . . . . .
BOD ( ) . . . . . . .
TSS ( ) . . . . . . .
Ammonia ( ) ‐‐‐ . . . . . .
Note: ( ) BOD, TSS, and ammonia surcharges are assessed per pound.

WATER AND WASTEWATER COST OF SERVICE RATE STUDY | CITY OF HOUSTON
DRAFT | APRIL |
Carollo recommends maintaining the existing wholesale and contract customers’ rate structures. There are
currently three types of contract wastewater customers:
. Customers who have contributed capital and discharge directly to the wastewater treatment plant
(billed per , gallons). These customers pay a reduced rate that does not include capital costs or
costs related to collecting wastewater and conveying it to the treatment plant.
. Customers who have not contributed capital and discharge into the collection system. These
customers pay the full cost of collecting and treating wastewater based on how they are billed:
a. Billed per , gallons,
b. Billed per connection.
In addition to these existing contract rates, Houston Water requested a fourth rate for contract customers
who have contributed capital and discharge into the collection system. This rate does not include capital costs.
Existing and proposed contract wastewater rates are shown in Table . .
Table . Existing and Proposed Wholesale Wastewater Volume Rates
Customer Type Rate Block Existing FYE FYE FYE FYE FYE
Month of Increase July April April April April April
Capital w/o Collection System
All Flow . . . . . . .
Capital with Collection System
All Flow ‐‐‐ . . . . . .
No Capital w/Collection System All Flow . . . . . . .
Connection‐based All Connections
. / .
. . . . . .
3.3.3 Customer Bill Impacts
Figure . illustrates the impact of the recommended rates on the combined water and wastewater bill for
single family residential customers with a / ‐inch meter across various usage levels. The
incremental percentage of single‐family residential bills is shown between usage levels. The estimated per
capita usage at each level is shown at the far right of each line. This estimate assumes . people per account.
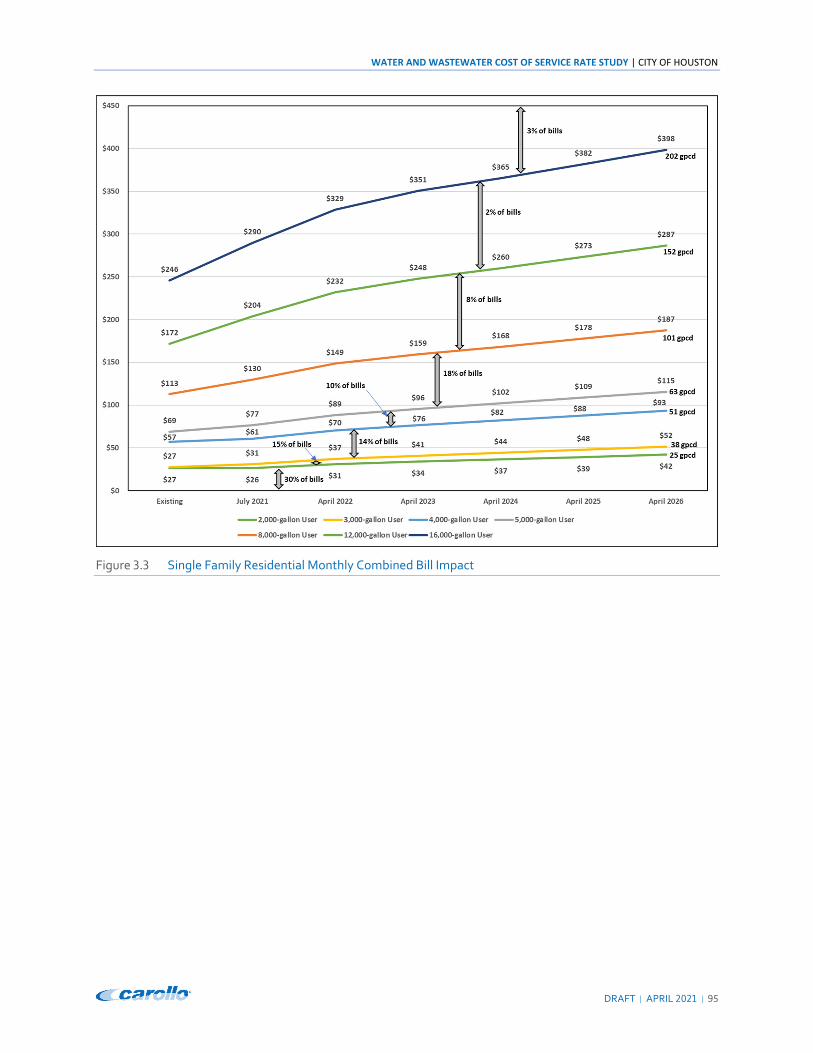
WATER AND WASTEWATER COST OF SERVICE RATE STUDY | CITY OF HOUSTON
DRAFT | APRIL |
Figure . Single Family Residential Monthly Combined Bill Impact

WATER AND WASTEWATER COST OF SERVICE RATE STUDY | CITY OF HOUSTON
DRAFT | APRIL |
Figure . illustrates the impact of the recommended rates on the combined water and wastewater bill for
multifamily residential customers with varied meter sizes and usage levels. The incremental percentage of
multifamily residential bills is shown between usage levels.
Figure . Multifamily Residential Monthly Combined Bill Impact

WATER AND WASTEWATER COST OF SERVICE RATE STUDY | CITY OF HOUSTON
DRAFT | APRIL |
Figure . illustrates the impact of the recommended rates on the combined water and wastewater bill for
commercial and industrial customers with varied meter sizes and usage levels. The incremental percentage of
commercial and industrial bills is shown between usage levels.
Figure . Commercial/Industrial Monthly Combined Bill Impact

WATER AND WASTEWATER COST OF SERVICE RATE STUDY | CITY OF HOUSTON
DRAFT | APRIL |
Figure . illustrates the percentage of single family residential customers with varying levels of monthly bill
adjustments for the proposed rate schedule effective July , .
Figure . Distribution of July Monthly Combined Bill Impacts for Single Family Residential Customers

WATER AND WASTEWATER COST OF SERVICE RATE STUDY | CITY OF HOUSTON
DRAFT | APRIL |
Chapter 4
RECOMMENDATIONS
Carollo recommends implementation of the water and wastewater rates as proposed in this rate study report
and described below:
Water sales revenue increases by . percent on July , , by . percent on April , , and
April , , and by . percent on April , , April , , and April , .
Wastewater user charge revenue increases by . percent on July , , by . percent on April
, , and by . percent on April , , April , , April , , and April , .
Water monthly service charge based on meter size and uniform for single family residential, multifamily
residential, commercial/industrial, and irrigation customers. Other customer types pay monthly service
charges based on meter size that differ based on the customer type and service provided.
For single family residential customers, Carollo recommends a four‐tier inclining block water rate structure
with a conservation credit for customers who use , gallons or less in a month:
Block – First , gallons;
Block – Next , gallons;
Block – Next , gallons; and
Block – Over , gallons.
Figure . compares the existing and proposed volume water rate structures for single family residential
customers.

WATER AND WASTEWATER COST OF SERVICE RATE STUDY | CITY OF HOUSTON
DRAFT | APRIL |
Figure . Existing and Proposed Single Family Residential Volume Water Rate Structures
For wastewater, Carollo recommends simplifying the single‐family residential rate structure to two tiers:
Block – First , gallons; and
Block – Over , gallons.

WATER AND WASTEWATER COST OF SERVICE RATE STUDY | CITY OF HOUSTON
DRAFT | APRIL |
Figure . compares the existing and proposed volume water rate structures for single family residential
customers.
Figure . Existing and Proposed Single Family Residential Volume Wastewater Rate Structures
Carollo recommends a uniform rate per , gallons for both water and wastewater for multifamily
residential and nonresidential customers.
Finally, Carollo recommends Houston Water update this cost of service rate study within five years to maintain
revenue sufficiency and equity among customers.

WATER AND WASTEWATER COST OF SERVICE RATE STUDY | CITY OF HOUSTON
DRAFT | APRIL
Appendix A
WATER FYE BUDGET AND FYE ‐
PROJECTIONS

6. 25%/35% of Maximum Impact Fee 25.0% 25.6% 31.5% 32.3% 38.6%
790.55$ 1,618.11$ 1,658.56$ 2,040.03$ 2,091.03$ 2,500.52$
Houston Combined Utility System 6,472.42$
Water Operations & MaintenanceCurrent Budget Forecasted ‐‐‐‐‐>
Line
No. Cost Center 5‐Year Average FYE 2021 FYE 2022 FYE 2023 FYE 2024 FYE 2025 FYE 2026
1 REVENUES Water
2 Operating3 Water Revenues4 Metered Customers 592,117,520$
5 456125 Fire Sprinkler Fees 6,605,367$
6 Water Sales ‐‐Revenue Sheet‐‐ 782,561,545$ 598,722,887$ 608,919,138$ 731,554,234$ 806,319,077$ 856,407,618$ 909,607,659$
7 455020 Water Service Penalties Inf + Growth 5,944,165$ 5,500,000$ 5,643,000$ 5,789,718$ 5,940,251$ 6,094,697$ 6,253,159$
8 455040 Utility Service Penalties Inf + Growth ‐$ ‐$ ‐$ ‐$ ‐$ ‐$ ‐$
9 Water Revenues Subtotal 788,505,710$ 1,202,945,774$ 614,562,138$ 737,343,952$ 812,259,328$ 862,502,315$ 915,860,819$
10 Other Water Operating Revenue (Non rate)11 431020 Contributions from Others Inflation ‐$ ‐$ ‐$ ‐$ ‐$ ‐$ ‐$
12 455010 Sewer Service Penalties Inflation ‐$ ‐$ ‐$ ‐$ ‐$ ‐$ ‐$
13 455040 Utility Service Penalties Inflation ‐$ ‐$ ‐$ ‐$ ‐$ ‐$ ‐$
14 425030 Indirect Cost Recovery Inflation ‐$ ‐$ ‐$ ‐$ ‐$ ‐$ ‐$
15 426270 Utility District Appl Review Inflation 33,432$ 31,119$ 31,865$ 32,630$ 33,413$ 34,215$ 35,036$
16 426330 Miscellaneous Copies Fees Inflation 6,402$ 5,959$ 6,102$ 6,248$ 6,398$ 6,552$ 6,709$
17 456110 Storm Water Quality Management Pe Inflation ‐$ ‐$ ‐$ ‐$ ‐$ ‐$ ‐$
18 456115 Industrial Waste Discharge Permits Inflation ‐$ ‐$ ‐$ ‐$ ‐$ ‐$ ‐$
19 456125 Fire Sprinkler Fees Inflation ‐$ ‐$ ‐$ ‐$ ‐$ ‐$ ‐$
20 456130 Water Meter Rental Fees Inflation ‐$ ‐$ ‐$ ‐$ ‐$ ‐$ ‐$
21 456135 Delinquent Reconnection Fees Inflation 215,691$ 200,765$ 205,584$ 210,518$ 215,570$ 220,744$ 226,042$
22 456140 Tap Installation Fees Inflation 1,078$ 1,004$ 1,028$ 1,053$ 1,078$ 1,104$ 1,130$
23 456145 Meter Installation Fees Inflation 539,228$ 501,913$ 513,959$ 526,294$ 538,925$ 551,859$ 565,104$
24 456150 Engineering Inspection Fees Inflation 269,614$ 250,957$ 256,980$ 263,147$ 269,463$ 275,930$ 282,552$
25 456155 Meter Testing Fees Inflation 1,078$ 1,004$ 1,028$ 1,053$ 1,078$ 1,104$ 1,130$
26 456160 Transient Meter Relocation Fee Inflation 13,966$ 13,000$ 13,312$ 13,631$ 13,959$ 14,294$ 14,637$
27 456165 New Customer Fees Inflation 134,807$ 125,478$ 128,490$ 131,574$ 134,731$ 137,965$ 141,276$
28 456170 Account Record Fees Inflation 539$ 502$ 514$ 526$ 539$ 552$ 565$
29 456175 Disposal Fees Inflation ‐$ ‐$ ‐$ ‐$ ‐$ ‐$ ‐$
30 456180 Fertilizers Sales Inflation ‐$ ‐$ ‐$ ‐$ ‐$ ‐$ ‐$
31 456185 Contract Revenues: River Authorities Inflation 2,148,692$ 2,000,000$ 2,048,000$ 2,097,152$ 2,147,484$ 2,199,023$ 2,251,800$
32 456195 Water Connection Violation Inflation ‐$ ‐$ ‐$ ‐$ ‐$ ‐$ ‐$
33 456205 Failure to Connect Sewer Inflation ‐$ ‐$ ‐$ ‐$ ‐$ ‐$ ‐$
34 456210 Missed Appointment Inflation 8,088$ 7,529$ 7,709$ 7,894$ 8,084$ 8,278$ 8,477$
35 456220 Tenant Notice Inflation 5,392$ 5,019$ 5,140$ 5,263$ 5,389$ 5,519$ 5,651$
36 456225 Failure to Apply Inflation 26,961$ 25,096$ 25,698$ 26,315$ 26,946$ 27,593$ 28,255$
37 456230 Illegal Turn on Water Inflation 539$ 502$ 514$ 526$ 539$ 552$ 565$

6. 25%/35% of Maximum Impact Fee 25.0% 25.6% 31.5% 32.3% 38.6%
790.55$ 1,618.11$ 1,658.56$ 2,040.03$ 2,091.03$ 2,500.52$
Houston Combined Utility System 6,472.42$
Water Operations & MaintenanceCurrent Budget Forecasted ‐‐‐‐‐>
Line
No. Cost Center 5‐Year Average FYE 2021 FYE 2022 FYE 2023 FYE 2024 FYE 2025 FYE 2026
38 456235 Lock Devise Damage Inflation 54$ 50$ 51$ 53$ 54$ 55$ 57$
39 456240 Submeter Application Inflation ‐$ ‐$ ‐$ ‐$ ‐$ ‐$ ‐$
40 456245 Evap Cr. Process Fee Inflation ‐$ ‐$ ‐$ ‐$ ‐$ ‐$ ‐$
41 456250 Sewage Disposal Inflation ‐$ ‐$ ‐$ ‐$ ‐$ ‐$ ‐$
42 456255 Misc Operating Revenue Inflation ‐$ ‐$ ‐$ ‐$ ‐$ ‐$ ‐$
43 456260 Oper Recov & Refunds Inflation 2,696$ 2,510$ 2,570$ 2,631$ 2,695$ 2,759$ 2,826$
44 456265 MSD Application Fee Inflation 26,961$ 25,096$ 25,698$ 26,315$ 26,946$ 27,593$ 28,255$
45 Other Water Operating Revenue (Non rate) Subtotal 3,435,222$ 3,197,501$ 3,274,241$ 3,352,823$ 3,433,290$ 3,515,689$ 3,600,066$
46 Impact Fee Revenue47 Water Allocation Growth 25,065,577$ 9,935,341$ 20,376,481$ 20,927,631$ 25,792,483$ 26,490,160$ 31,741,129$
48 Other Non Operating Water Revenue (Non rate)49 421280 Other Licenses & Permits Inflation ‐$ ‐$ ‐$ ‐$ ‐$ ‐$ ‐$
50 421630 Admin Fee‐Lic/Prmts Inflation 269,614$ 250,957$ 256,980$ 263,147$ 269,463$ 275,930$ 282,552$
51 421530 Special Event Permits Inflation ‐$ ‐$ ‐$ ‐$ ‐$ ‐$ ‐$
52 434205 Sale Of Scrap Metal Inflation 40,442$ 37,643$ 38,547$ 39,472$ 40,419$ 41,389$ 42,383$
53 434225 Sale of Non‐Capital Equipment and M Inflation ‐$ ‐$ ‐$ ‐$ ‐$ ‐$ ‐$
54 434235 Sale of Other Assets Inflation 26,961$ 25,096$ 25,698$ 26,315$ 26,946$ 27,593$ 28,255$
55 434240 Sale of Land/Street Inflation 1,078,457$ 1,003,826$ 1,027,918$ 1,052,588$ 1,077,850$ 1,103,719$ 1,130,208$
56 434245 Sale Cap‐Vehicles Inflation 107,846$ 100,383$ 102,792$ 105,259$ 107,785$ 110,372$ 113,021$
57 424110 Other Interfund Services Inflation 312,968$ 291,310$ 298,302$ 305,461$ 312,792$ 320,299$ 327,986$
58 424120 Intfd Vehicle Fuel Inflation ‐$ ‐$ ‐$ ‐$ ‐$ ‐$ ‐$
59 424170 Intfd Vehicle Repair Inflation ‐$ ‐$ ‐$ ‐$ ‐$ ‐$ ‐$
60 424510 Prior Yr Revenue Inflation ‐$ ‐$ ‐$ ‐$ ‐$ ‐$ ‐$
61 426090 Demolition Fees Inflation ‐$ ‐$ ‐$ ‐$ ‐$ ‐$ ‐$
62 426320 City Map & Related Items Inflation 54$ 50$ 51$ 53$ 54$ 55$ 57$
63 426370 Training Services Inflation 53,923$ 50,191$ 51,396$ 52,629$ 53,893$ 55,186$ 56,510$
64 426420 Bldg Space Rental Fee Inflation ‐$ ‐$ ‐$ ‐$ ‐$ ‐$ ‐$
65 426430 Facility Rental Fees Inflation 1,267,834$ 1,180,098$ 1,208,420$ 1,237,423$ 1,267,121$ 1,297,532$ 1,328,672$
66 428030 Release Of Liens Inflation 647$ 602$ 617$ 632$ 647$ 662$ 678$
67 428060 Other Interest Income Inflation ‐$ ‐$ ‐$ ‐$ ‐$ ‐$ ‐$
68 428080 Returned Check Charges Inflation 26,961$ 25,096$ 25,698$ 26,315$ 26,946$ 27,593$ 28,255$
69 428090 Misc Fines & Forfeit Inflation 539$ 502$ 514$ 526$ 539$ 552$ 565$
70 429095 Medicare Part D Distribution Inflation ‐$ ‐$ ‐$ ‐$ ‐$ ‐$ ‐$
71 434305 Judgments & Claims Inflation 539$ 502$ 514$ 526$ 539$ 552$ 565$
72 434335 Recoveries Damage Infrastructure Inflation 8,088$ 7,529$ 7,709$ 7,894$ 8,084$ 8,278$ 8,477$
73 434340 Cashier Overage Inflation ‐$ ‐$ ‐$ ‐$ ‐$ ‐$ ‐$
74 434345 Adjustments to Allowances Inflation ‐$ ‐$ ‐$ ‐$ ‐$ ‐$ ‐$
75 434505 Prior Yr Exp Recovery Inflation ‐$ ‐$ ‐$ ‐$ ‐$ ‐$ ‐$
76 434510 Prior Year Revenue Inflation ‐$ ‐$ ‐$ ‐$ ‐$ ‐$ ‐$
77 445050 Cell Tower Revenue Inflation 16,716$ 15,559$ 15,933$ 16,315$ 16,707$ 17,108$ 17,518$
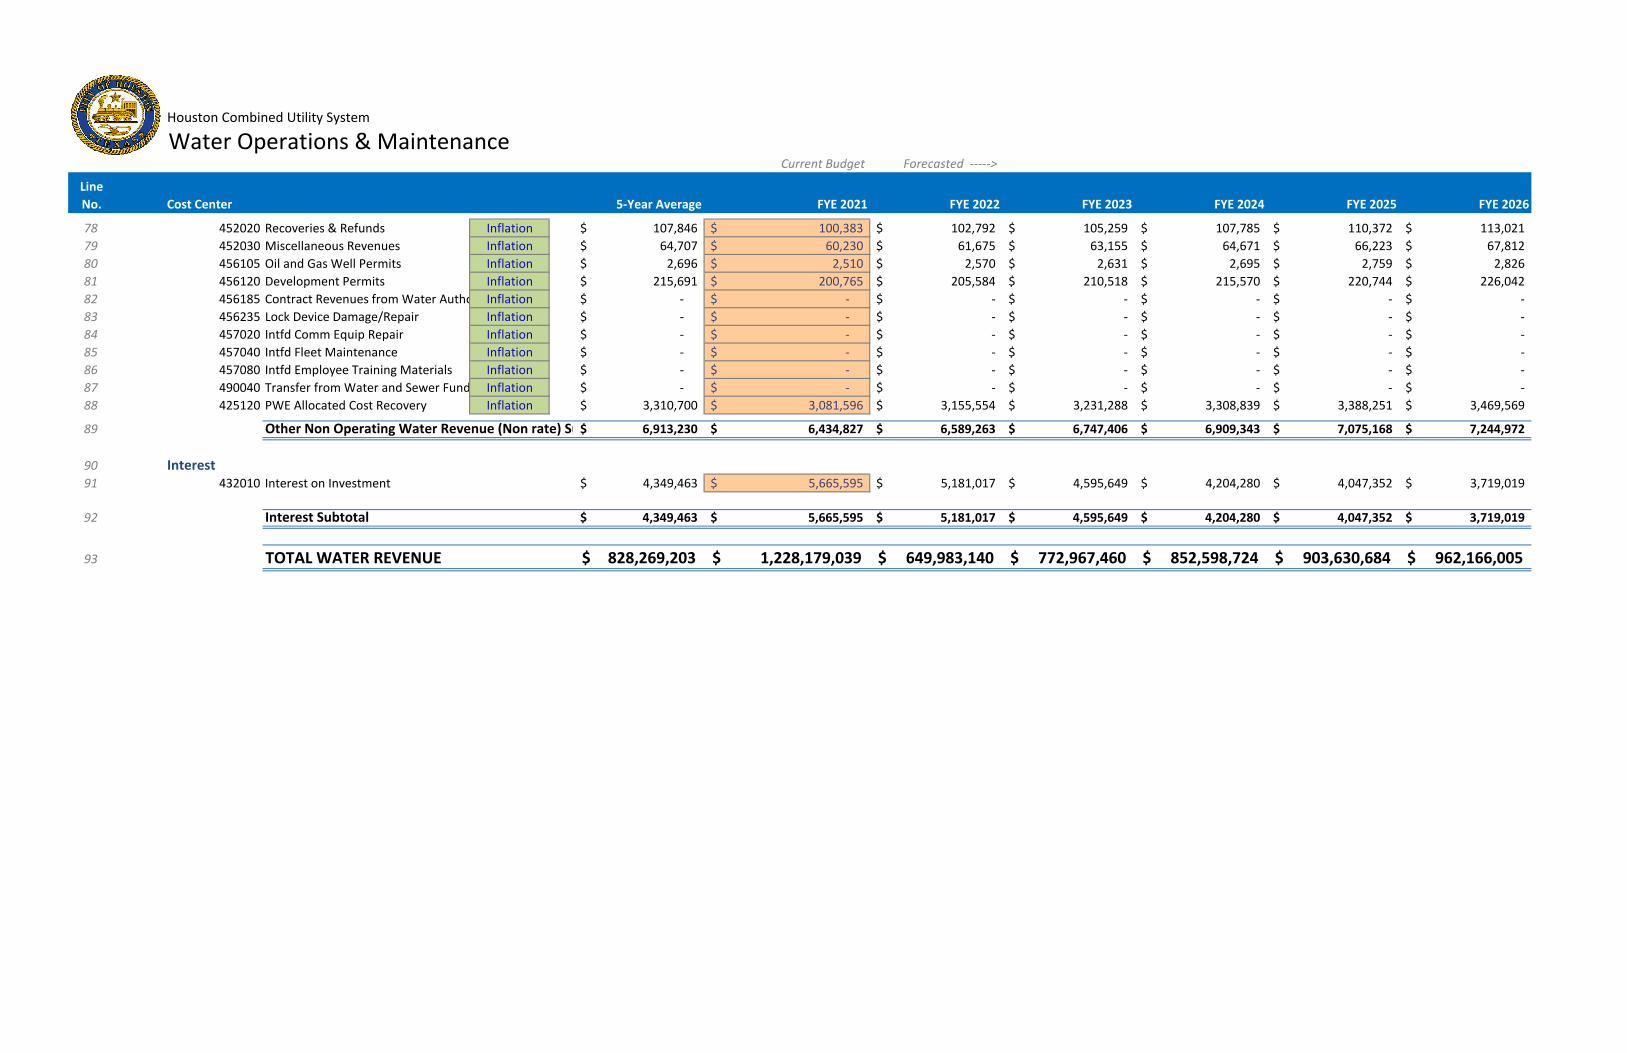
6. 25%/35% of Maximum Impact Fee 25.0% 25.6% 31.5% 32.3% 38.6%
790.55$ 1,618.11$ 1,658.56$ 2,040.03$ 2,091.03$ 2,500.52$
Houston Combined Utility System 6,472.42$
Water Operations & MaintenanceCurrent Budget Forecasted ‐‐‐‐‐>
Line
No. Cost Center 5‐Year Average FYE 2021 FYE 2022 FYE 2023 FYE 2024 FYE 2025 FYE 2026
78 452020 Recoveries & Refunds Inflation 107,846$ 100,383$ 102,792$ 105,259$ 107,785$ 110,372$ 113,021$
79 452030 Miscellaneous Revenues Inflation 64,707$ 60,230$ 61,675$ 63,155$ 64,671$ 66,223$ 67,812$
80 456105 Oil and Gas Well Permits Inflation 2,696$ 2,510$ 2,570$ 2,631$ 2,695$ 2,759$ 2,826$
81 456120 Development Permits Inflation 215,691$ 200,765$ 205,584$ 210,518$ 215,570$ 220,744$ 226,042$
82 456185 Contract Revenues from Water Autho Inflation ‐$ ‐$ ‐$ ‐$ ‐$ ‐$ ‐$
83 456235 Lock Device Damage/Repair Inflation ‐$ ‐$ ‐$ ‐$ ‐$ ‐$ ‐$
84 457020 Intfd Comm Equip Repair Inflation ‐$ ‐$ ‐$ ‐$ ‐$ ‐$ ‐$
85 457040 Intfd Fleet Maintenance Inflation ‐$ ‐$ ‐$ ‐$ ‐$ ‐$ ‐$
86 457080 Intfd Employee Training Materials Inflation ‐$ ‐$ ‐$ ‐$ ‐$ ‐$ ‐$
87 490040 Transfer from Water and Sewer Fund Inflation ‐$ ‐$ ‐$ ‐$ ‐$ ‐$ ‐$
88 425120 PWE Allocated Cost Recovery Inflation 3,310,700$ 3,081,596$ 3,155,554$ 3,231,288$ 3,308,839$ 3,388,251$ 3,469,569$
89 Other Non Operating Water Revenue (Non rate) Su 6,913,230$ 6,434,827$ 6,589,263$ 6,747,406$ 6,909,343$ 7,075,168$ 7,244,972$
90 Interest91 432010 Interest on Investment 4,349,463$ 5,665,595$ 5,181,017$ 4,595,649$ 4,204,280$ 4,047,352$ 3,719,019$
92 Interest Subtotal 4,349,463$ 5,665,595$ 5,181,017$ 4,595,649$ 4,204,280$ 4,047,352$ 3,719,019$
93 TOTAL WATER REVENUE 828,269,203$ 1,228,179,039$ 649,983,140$ 772,967,460$ 852,598,724$ 903,630,684$ 962,166,005$
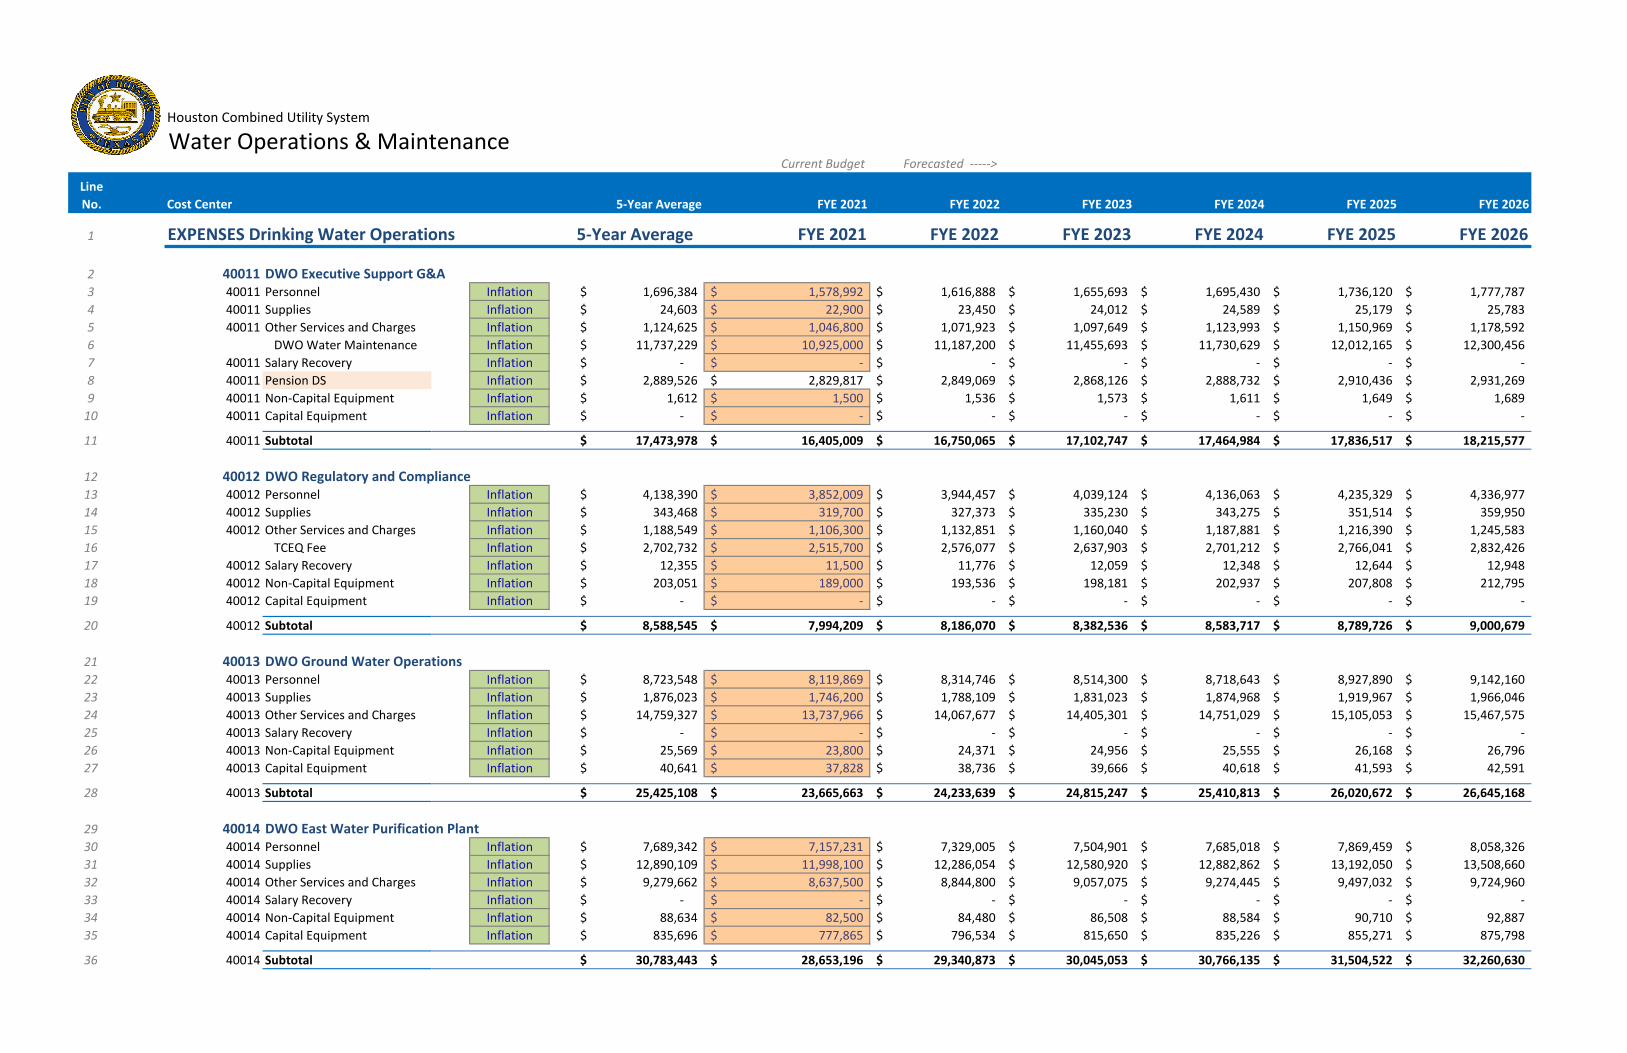
6. 25%/35% of Maximum Impact Fee 25.0% 25.6% 31.5% 32.3% 38.6%
790.55$ 1,618.11$ 1,658.56$ 2,040.03$ 2,091.03$ 2,500.52$
Houston Combined Utility System 6,472.42$
Water Operations & MaintenanceCurrent Budget Forecasted ‐‐‐‐‐>
Line
No. Cost Center 5‐Year Average FYE 2021 FYE 2022 FYE 2023 FYE 2024 FYE 2025 FYE 2026
1 EXPENSES Drinking Water Operations 5‐Year Average FYE 2021 FYE 2022 FYE 2023 FYE 2024 FYE 2025 FYE 2026
2 40011 DWO Executive Support G&A3 40011 Personnel Inflation 1,696,384$ 1,578,992$ 1,616,888$ 1,655,693$ 1,695,430$ 1,736,120$ 1,777,787$
4 40011 Supplies Inflation 24,603$ 22,900$ 23,450$ 24,012$ 24,589$ 25,179$ 25,783$
5 40011 Other Services and Charges Inflation 1,124,625$ 1,046,800$ 1,071,923$ 1,097,649$ 1,123,993$ 1,150,969$ 1,178,592$
6 DWO Water Maintenance Inflation 11,737,229$ 10,925,000$ 11,187,200$ 11,455,693$ 11,730,629$ 12,012,165$ 12,300,456$
7 40011 Salary Recovery Inflation ‐$ ‐$ ‐$ ‐$ ‐$ ‐$ ‐$
8 40011 Pension DS Inflation 2,889,526$ 2,829,817$ 2,849,069$ 2,868,126$ 2,888,732$ 2,910,436$ 2,931,269$
9 40011 Non‐Capital Equipment Inflation 1,612$ 1,500$ 1,536$ 1,573$ 1,611$ 1,649$ 1,689$
10 40011 Capital Equipment Inflation ‐$ ‐$ ‐$ ‐$ ‐$ ‐$ ‐$
11 40011 Subtotal 17,473,978$ 16,405,009$ 16,750,065$ 17,102,747$ 17,464,984$ 17,836,517$ 18,215,577$
12 40012 DWO Regulatory and Compliance13 40012 Personnel Inflation 4,138,390$ 3,852,009$ 3,944,457$ 4,039,124$ 4,136,063$ 4,235,329$ 4,336,977$
14 40012 Supplies Inflation 343,468$ 319,700$ 327,373$ 335,230$ 343,275$ 351,514$ 359,950$
15 40012 Other Services and Charges Inflation 1,188,549$ 1,106,300$ 1,132,851$ 1,160,040$ 1,187,881$ 1,216,390$ 1,245,583$
16 TCEQ Fee Inflation 2,702,732$ 2,515,700$ 2,576,077$ 2,637,903$ 2,701,212$ 2,766,041$ 2,832,426$
17 40012 Salary Recovery Inflation 12,355$ 11,500$ 11,776$ 12,059$ 12,348$ 12,644$ 12,948$
18 40012 Non‐Capital Equipment Inflation 203,051$ 189,000$ 193,536$ 198,181$ 202,937$ 207,808$ 212,795$
19 40012 Capital Equipment Inflation ‐$ ‐$ ‐$ ‐$ ‐$ ‐$ ‐$
20 40012 Subtotal 8,588,545$ 7,994,209$ 8,186,070$ 8,382,536$ 8,583,717$ 8,789,726$ 9,000,679$
21 40013 DWO Ground Water Operations22 40013 Personnel Inflation 8,723,548$ 8,119,869$ 8,314,746$ 8,514,300$ 8,718,643$ 8,927,890$ 9,142,160$
23 40013 Supplies Inflation 1,876,023$ 1,746,200$ 1,788,109$ 1,831,023$ 1,874,968$ 1,919,967$ 1,966,046$
24 40013 Other Services and Charges Inflation 14,759,327$ 13,737,966$ 14,067,677$ 14,405,301$ 14,751,029$ 15,105,053$ 15,467,575$
25 40013 Salary Recovery Inflation ‐$ ‐$ ‐$ ‐$ ‐$ ‐$ ‐$
26 40013 Non‐Capital Equipment Inflation 25,569$ 23,800$ 24,371$ 24,956$ 25,555$ 26,168$ 26,796$
27 40013 Capital Equipment Inflation 40,641$ 37,828$ 38,736$ 39,666$ 40,618$ 41,593$ 42,591$
28 40013 Subtotal 25,425,108$ 23,665,663$ 24,233,639$ 24,815,247$ 25,410,813$ 26,020,672$ 26,645,168$
29 40014 DWO East Water Purification Plant30 40014 Personnel Inflation 7,689,342$ 7,157,231$ 7,329,005$ 7,504,901$ 7,685,018$ 7,869,459$ 8,058,326$
31 40014 Supplies Inflation 12,890,109$ 11,998,100$ 12,286,054$ 12,580,920$ 12,882,862$ 13,192,050$ 13,508,660$
32 40014 Other Services and Charges Inflation 9,279,662$ 8,637,500$ 8,844,800$ 9,057,075$ 9,274,445$ 9,497,032$ 9,724,960$
33 40014 Salary Recovery Inflation ‐$ ‐$ ‐$ ‐$ ‐$ ‐$ ‐$
34 40014 Non‐Capital Equipment Inflation 88,634$ 82,500$ 84,480$ 86,508$ 88,584$ 90,710$ 92,887$
35 40014 Capital Equipment Inflation 835,696$ 777,865$ 796,534$ 815,650$ 835,226$ 855,271$ 875,798$
36 40014 Subtotal 30,783,443$ 28,653,196$ 29,340,873$ 30,045,053$ 30,766,135$ 31,504,522$ 32,260,630$

6. 25%/35% of Maximum Impact Fee 25.0% 25.6% 31.5% 32.3% 38.6%
790.55$ 1,618.11$ 1,658.56$ 2,040.03$ 2,091.03$ 2,500.52$
Houston Combined Utility System 6,472.42$
Water Operations & MaintenanceCurrent Budget Forecasted ‐‐‐‐‐>
Line
No. Cost Center 5‐Year Average FYE 2021 FYE 2022 FYE 2023 FYE 2024 FYE 2025 FYE 2026
37 40015 DWO Technical Services G&A38 55% 40015 Personnel Inflation 2,862,699$ 2,664,597$ 2,728,548$ 2,794,033$ 2,861,090$ 2,929,756$ 3,000,070$
39 36% Cust. Complaints and Water System Inflation 1,858,357$ 1,729,757$ 1,771,271$ 1,813,781$ 1,857,312$ 1,901,888$ 1,947,533$
40 10% Source Water Protection Inflation 510,169$ 474,865$ 486,262$ 497,932$ 509,882$ 522,119$ 534,650$
41 30% 40015 Supplies Inflation 64,622$ 60,150$ 61,594$ 63,072$ 64,586$ 66,136$ 67,723$
42 67% Cust. Complaints and Water System Inflation 143,801$ 133,850$ 137,062$ 140,352$ 143,720$ 147,170$ 150,702$
43 3% Source Water Protection Inflation 6,661$ 6,200$ 6,349$ 6,501$ 6,657$ 6,817$ 6,981$
44 63% 40015 Other Services and Charges Inflation 3,024,257$ 2,814,975$ 2,882,534$ 2,951,715$ 3,022,556$ 3,095,098$ 3,169,380$
45 1% Cust. Complaints and Water System Inflation 69,310$ 64,514$ 66,062$ 67,648$ 69,271$ 70,934$ 72,636$
46 35% Source Water Protection Inflation 1,681,471$ 1,565,111$ 1,602,674$ 1,641,138$ 1,680,525$ 1,720,858$ 1,762,158$
47 40015 Salary Recovery Inflation ‐$ ‐$ ‐$ ‐$ ‐$ ‐$ ‐$
48 6% 40015 Non‐Capital Equipment Inflation 12,355$ 11,500$ 11,776$ 12,059$ 12,348$ 12,644$ 12,948$
49 94% Cust. Complaints and Water System Inflation 204,233$ 190,100$ 194,662$ 199,334$ 204,118$ 209,017$ 214,034$
50 0% Source Water Protection Inflation ‐$ ‐$ ‐$ ‐$ ‐$ ‐$ ‐$
51 40015 Capital Equipment Inflation 136,442$ 127,000$ 130,048$ 133,169$ 136,365$ 139,638$ 142,989$
52 40015 Subtotal 10,574,377$ 9,842,619$ 10,078,842$ 10,320,734$ 10,568,432$ 10,822,074$ 11,081,804$
53 40016 DWO NEWPP Expansion54 40016 Personnel Inflation 2,996,116$ 1,260,600$ 1,578,532$ 1,616,417$ 2,281,584$ 3,116,918$ 6,387,128$
55 40016 Supplies Inflation 6,775,562$ ‐$ 43,200$ 2,004,692$ 6,161,965$ 8,417,984$ 17,249,968$
56 40016 Other Services and Charges Inflation 4,758,888$ 172,100$ 190,900$ 1,398,504$ 4,298,681$ 5,872,514$ 12,033,841$
57 40016 PIB DS 2,541,291$ 5,049,600$ 3,805,697$ 3,805,542$ 2,548,047$ 2,547,168$ ‐$
58 40016 Non‐Capital Equipment Inflation 93,130$ ‐$ 47,100$ 48,230$ 71,691$ 97,938$ 200,693$
59 40016 Capital Equipment Inflation 490,068$ ‐$ ‐$ 145,182$ 446,256$ 609,640$ 1,249,262$
60 40016 Subtotal 17,655,055$ 6,482,300$ 5,665,429$ 9,018,567$ 15,808,224$ 20,662,163$ 37,120,892$
61 40017 DWO Southeast Water Purification Plant62 40017 Personnel Inflation 3,607,389$ 3,357,754$ 3,438,340$ 3,520,860$ 3,605,361$ 3,691,890$ 3,780,495$
63 40017 Supplies Inflation 3,140,098$ 2,922,800$ 2,992,947$ 3,064,778$ 3,138,333$ 3,213,653$ 3,290,780$
64 40017 Other Services and Charges Inflation 5,736,652$ 5,339,670$ 5,467,822$ 5,599,050$ 5,733,427$ 5,871,029$ 6,011,934$
65 40017 Salary Recovery Inflation ‐$ ‐$ ‐$ ‐$ ‐$ ‐$ ‐$
66 40017 Non‐Capital Equipment Inflation 110,550$ 102,900$ 105,370$ 107,898$ 110,488$ 113,140$ 115,855$
67 40017 Capital Equipment Inflation 194,939$ 181,449$ 185,804$ 190,263$ 194,829$ 199,505$ 204,293$
68 40017 Subtotal 12,789,629$ 11,904,573$ 12,190,283$ 12,482,849$ 12,782,438$ 13,089,216$ 13,403,357$
69 40018 DWO Northeast Water Purification Plant70 40018 Personnel Inflation 3,835,009$ 3,569,622$ 3,655,293$ 3,743,020$ 3,832,852$ 3,924,841$ 4,019,037$
71 40018 Supplies Inflation 5,204,561$ 4,844,400$ 4,960,666$ 5,079,722$ 5,201,635$ 5,326,474$ 5,454,310$
72 40018 Other Services and Charges Inflation 7,569,594$ 7,045,770$ 7,214,868$ 7,388,025$ 7,565,338$ 7,746,906$ 7,932,832$
73 40018 Salary Recovery Inflation ‐$ ‐$ ‐$ ‐$ ‐$ ‐$ ‐$

6. 25%/35% of Maximum Impact Fee 25.0% 25.6% 31.5% 32.3% 38.6%
790.55$ 1,618.11$ 1,658.56$ 2,040.03$ 2,091.03$ 2,500.52$
Houston Combined Utility System 6,472.42$
Water Operations & MaintenanceCurrent Budget Forecasted ‐‐‐‐‐>
Line
No. Cost Center 5‐Year Average FYE 2021 FYE 2022 FYE 2023 FYE 2024 FYE 2025 FYE 2026
74 40018 Non‐Capital Equipment Inflation 90,030$ 83,800$ 85,811$ 87,871$ 89,980$ 92,139$ 94,350$
75 40018 Capital Equipment Inflation 81,973$ 76,300$ 78,131$ 80,006$ 81,927$ 83,893$ 85,906$
76 40018 Subtotal 16,781,166$ 15,619,892$ 15,994,769$ 16,378,644$ 16,771,731$ 17,174,253$ 17,586,435$
77 40019 DWO System Maintenance ‐ North78 40019 Personnel Inflation 13,882,019$ 12,921,369$ 13,231,482$ 13,549,037$ 13,874,214$ 14,207,195$ 14,548,168$
79 40019 Supplies Inflation 2,144,179$ 1,995,800$ 2,043,699$ 2,092,748$ 2,142,974$ 2,194,405$ 2,247,071$
80 40019 Other Services and Charges Inflation 2,296,307$ 2,137,400$ 2,188,698$ 2,241,226$ 2,295,016$ 2,350,096$ 2,406,498$
81 40019 Salary Recovery Inflation ‐$ ‐$ ‐$ ‐$ ‐$ ‐$ ‐$
82 40019 Non‐Capital Equipment Inflation 15,793$ 14,700$ 15,053$ 15,414$ 15,784$ 16,163$ 16,551$
83 40019 Capital Equipment Inflation 1,819,327$ 1,693,428$ 1,734,070$ 1,775,688$ 1,818,304$ 1,861,944$ 1,906,630$
84 40019 Subtotal 20,157,626$ 18,762,697$ 19,213,002$ 19,674,114$ 20,146,292$ 20,629,804$ 21,124,919$
85 40020 DWO System Maintenance ‐ South86 40020 Personnel Inflation 11,809,689$ 10,992,446$ 11,256,265$ 11,526,415$ 11,803,049$ 12,086,322$ 12,376,394$
87 40020 Supplies Inflation 1,867,858$ 1,738,600$ 1,780,326$ 1,823,054$ 1,866,808$ 1,911,611$ 1,957,490$
88 40020 Other Services and Charges Inflation 6,220,140$ 5,789,700$ 5,928,653$ 6,070,940$ 6,216,643$ 6,365,842$ 6,518,623$
89 40020 Salary Recovery Inflation ‐$ ‐$ ‐$ ‐$ ‐$ ‐$ ‐$
90 40020 Non‐Capital Equipment Inflation 21,487$ 20,000$ 20,480$ 20,972$ 21,475$ 21,990$ 22,518$
91 40020 Capital Equipment Inflation 47,009$ 43,756$ 44,806$ 45,881$ 46,983$ 48,110$ 49,265$
92 40020 Subtotal 19,966,183$ 18,584,502$ 19,030,530$ 19,487,263$ 19,954,957$ 20,433,876$ 20,924,289$
93 River Authority Contributed Debt Service94 RACDS Personnel Inflation ‐$ ‐$ ‐$ ‐$ ‐$ ‐$ ‐$
95 RACDS Supplies Inflation ‐$ ‐$ ‐$ ‐$ ‐$ ‐$ ‐$
96 RACDS River Authority Contracts Inflation 14,360,569$ 13,366,802$ 13,687,605$ 14,016,108$ 14,352,494$ 14,696,954$ 15,049,681$
97 CWA O&M Trinity River Inflation 23,220,525$ 21,613,640$ 22,132,368$ 22,663,545$ 23,207,470$ 23,764,449$ 24,334,796$
98 TRA O&M Inflation 5,097,188$ 4,744,458$ 4,858,325$ 4,974,924$ 5,094,323$ 5,216,586$ 5,341,784$
99 RACDS CWA Debt Service (1993A‐H & 2004 R Inflation 2,627,957$ 2,446,100$ 2,504,806$ 2,564,922$ 2,626,480$ 2,689,515$ 2,754,064$
100 RACDS CWA Debt Service (96" line) Inflation 4,246,459$ 3,952,600$ 4,047,462$ 4,144,601$ 4,244,072$ 4,345,930$ 4,450,232$
101 RACDS DS for Wallisville and Allens' Creek 1,857,558$ 1,912,097$ 1,912,097$ 1,843,880$ 1,843,646$ 1,841,391$ 1,846,774$
102 RACDS Salary Recovery Inflation ‐$ ‐$ ‐$ ‐$ ‐$ ‐$ ‐$
103 RACDS Non‐Capital Equipment Inflation ‐$ ‐$ ‐$ ‐$ ‐$ ‐$ ‐$
104 RACDS Capital Equipment Inflation ‐$ ‐$ ‐$ ‐$ ‐$ ‐$ ‐$
105 RACDS Subtotal 51,410,257$ 48,035,697$ 49,142,663$ 50,207,980$ 51,368,485$ 52,554,826$ 53,777,331$
106 DWO Total 231,605,367$ 205,950,356$ 209,826,165$ 217,915,733$ 229,626,206$ 239,517,648$ 261,141,082$
107 Water Allocation of G&A 50.2% 50.2%

6. 25%/35% of Maximum Impact Fee 25.0% 25.6% 31.5% 32.3% 38.6%
790.55$ 1,618.11$ 1,658.56$ 2,040.03$ 2,091.03$ 2,500.52$
Houston Combined Utility System 6,472.42$
Water Operations & MaintenanceCurrent Budget Forecasted ‐‐‐‐‐>
Line
No. Cost Center 5‐Year Average FYE 2021 FYE 2022 FYE 2023 FYE 2024 FYE 2025 FYE 2026
108 EXPENSES Operation Services ‐ Houston Water G&A
109 40021 OPS Financial & Support Operation Services G&A110 40021 Personnel Inflation 1,359,369$ 1,265,299$ 1,295,666$ 1,326,762$ 1,358,604$ 1,391,211$ 1,424,600$
111 40021 Supplies Inflation 28,363$ 26,401$ 27,034$ 27,683$ 28,347$ 29,028$ 29,724$
112 40021 Other Services and Charges Inflation 1,674,735$ 1,558,842$ 1,596,254$ 1,634,564$ 1,673,794$ 1,713,965$ 1,755,100$
113 40021 Salary Recovery Inflation ‐$ ‐$ ‐$ ‐$ ‐$ ‐$ ‐$
114 40021 Non‐Capital Equipment Inflation 2,103$ 1,957$ 2,004$ 2,053$ 2,102$ 2,152$ 2,204$
115 40021 Capital Equipment Inflation ‐$ ‐$ ‐$ ‐$ ‐$ ‐$ ‐$
116 40021 Subtotal 3,064,570$ 2,852,499$ 2,920,959$ 2,991,062$ 3,062,847$ 3,136,356$ 3,211,628$
117 40022 HW Planning118 40022 Personnel Inflation 925,243$ 861,215$ 881,884$ 903,050$ 924,723$ 946,916$ 969,642$
119 40022 Supplies Inflation 17,848$ 16,613$ 17,012$ 17,420$ 17,838$ 18,267$ 18,705$
120 40022 Other Services and Charges Inflation 773,739$ 720,195$ 737,480$ 755,179$ 773,304$ 791,863$ 810,868$
121 40022 Salary Recovery Inflation ‐$ ‐$ ‐$ ‐$ ‐$ ‐$ ‐$
122 40022 Non‐Capital Equipment Inflation 2,265$ 2,108$ 2,159$ 2,210$ 2,263$ 2,318$ 2,373$
123 40022 Capital Equipment Inflation 25,883$ 24,092$ 24,670$ 25,262$ 25,868$ 26,489$ 27,125$
124 40022 Subtotal 1,744,978$ 1,624,223$ 1,663,205$ 1,703,122$ 1,743,997$ 1,785,853$ 1,828,713$
125 40023 OPS Maintenance Operation Services ‐ Restoration 126 40023 Personnel Inflation 3,621,061$ 3,370,480$ 3,451,371$ 3,534,204$ 3,619,025$ 3,705,882$ 3,794,823$
127 40023 Supplies Inflation 851,388$ 792,471$ 811,490$ 830,966$ 850,909$ 871,331$ 892,243$
128 40023 Other Services and Charges Inflation 1,961,443$ 1,825,709$ 1,869,526$ 1,914,395$ 1,960,340$ 2,007,388$ 2,055,566$
129 40023 Salary Recovery Inflation ‐$ ‐$ ‐$ ‐$ ‐$ ‐$ ‐$
130 40023 Non‐Capital Equipment Inflation 4,637$ 4,316$ 4,420$ 4,526$ 4,635$ 4,746$ 4,860$
131 40023 Capital Equipment Inflation 2,427$ 2,259$ 2,313$ 2,368$ 2,425$ 2,483$ 2,543$
132 40023 Capital Equipment‐CP Capital Inflation ‐$ ‐$ ‐$ ‐$ ‐$ ‐$ ‐$
133 40023 Subtotal 6,440,955$ 5,995,234$ 6,139,120$ 6,286,459$ 6,437,334$ 6,591,830$ 6,750,034$
134 40024 OPS Maintenance Operation Services‐COS/DIS 135 40024 Personnel Inflation 1,272,290$ 1,184,246$ 1,212,668$ 1,241,772$ 1,271,574$ 1,302,092$ 1,333,342$
136 40024 Supplies Inflation 4,583$ 4,266$ 4,369$ 4,473$ 4,581$ 4,691$ 4,803$
137 40024 Other Services and Charges Inflation 189,377$ 176,272$ 180,502$ 184,834$ 189,270$ 193,813$ 198,465$
138 40024 Salary Recovery Inflation ‐$ ‐$ ‐$ ‐$ ‐$ ‐$ ‐$
139 40024 Non‐Capital Equipment Inflation 7,334$ 6,826$ 6,990$ 7,158$ 7,329$ 7,505$ 7,685$
140 40024 Capital Equipment Inflation ‐$ ‐$ ‐$ ‐$ ‐$ ‐$ ‐$
141 40024 Subtotal 1,473,584$ 1,371,610$ 1,404,529$ 1,438,237$ 1,472,755$ 1,508,101$ 1,544,296$

6. 25%/35% of Maximum Impact Fee 25.0% 25.6% 31.5% 32.3% 38.6%
790.55$ 1,618.11$ 1,658.56$ 2,040.03$ 2,091.03$ 2,500.52$
Houston Combined Utility System 6,472.42$
Water Operations & MaintenanceCurrent Budget Forecasted ‐‐‐‐‐>
Line
No. Cost Center 5‐Year Average FYE 2021 FYE 2022 FYE 2023 FYE 2024 FYE 2025 FYE 2026
142 40025 HW GIS Services 143 40025 Personnel Inflation 1,195,913$ 1,113,154$ 1,139,870$ 1,167,227$ 1,195,241$ 1,223,926$ 1,253,301$
144 40025 Supplies Inflation 5,932$ 5,521$ 5,654$ 5,789$ 5,928$ 6,070$ 6,216$
145 40025 Other Services and Charges Inflation 556,699$ 518,175$ 530,611$ 543,346$ 556,386$ 569,740$ 583,413$
146 40025 Salary Recovery Inflation ‐$ ‐$ ‐$ ‐$ ‐$ ‐$ ‐$
147 40025 Non‐Capital Equipment Inflation 23,564$ 21,934$ 22,460$ 22,999$ 23,551$ 24,116$ 24,695$
148 40025 Capital Equipment Inflation 6,201$ 5,772$ 5,911$ 6,052$ 6,198$ 6,346$ 6,499$
149 40025 Subtotal 1,788,309$ 1,664,556$ 1,704,506$ 1,745,414$ 1,787,304$ 1,830,199$ 1,874,124$
150 40026 OPS Executive Support151 40026 Personnel Inflation 238,133$ 221,654$ 226,974$ 232,421$ 237,999$ 243,711$ 249,560$
152 40026 Supplies Inflation 3,343$ 3,112$ 3,187$ 3,263$ 3,341$ 3,422$ 3,504$
153 40026 Other Services and Charges Inflation 1,177,675$ 1,096,178$ 1,122,487$ 1,149,426$ 1,177,012$ 1,205,261$ 1,234,187$
154 40026 Salary Recovery Inflation ‐$ ‐$ ‐$ ‐$ ‐$ ‐$ ‐$
155 40026 Non‐Capital Equipment Inflation ‐$ ‐$ ‐$ ‐$ ‐$ ‐$ ‐$
156 40026 Capital Equipment Inflation ‐$ ‐$ ‐$ ‐$ ‐$ ‐$ ‐$
157 40026 Subtotal 1,419,151$ 1,320,944$ 1,352,647$ 1,385,110$ 1,418,353$ 1,452,393$ 1,487,251$
158 40027 OPS Support Services159 40027 Personnel Inflation 618,587$ 575,780$ 589,598$ 603,749$ 618,239$ 633,076$ 648,270$
160 40027 Supplies Inflation 2,642$ 2,459$ 2,518$ 2,579$ 2,641$ 2,704$ 2,769$
161 40027 Other Services and Charges Inflation 547,964$ 510,044$ 522,285$ 534,820$ 547,656$ 560,799$ 574,259$
162 40027 Salary Recovery Inflation ‐$ ‐$ ‐$ ‐$ ‐$ ‐$ ‐$
163 40027 Non‐Capital Equipment Inflation 25,883$ 24,092$ 24,670$ 25,262$ 25,868$ 26,489$ 27,125$
164 40027 Capital Equipment Inflation ‐$ ‐$ ‐$ ‐$ ‐$ ‐$ ‐$
165 40027 Subtotal 1,195,075$ 1,112,375$ 1,139,072$ 1,166,410$ 1,194,404$ 1,223,069$ 1,252,423$
166 40028 HW Infrastructure Planning167 40028 Personnel Inflation 1,041,594$ 969,514$ 992,783$ 1,016,610$ 1,041,008$ 1,065,992$ 1,091,576$
168 40028 Supplies Inflation 3,128$ 2,911$ 2,981$ 3,053$ 3,126$ 3,201$ 3,278$
169 40028 Other Services and Charges Inflation 48,099$ 44,771$ 45,845$ 46,945$ 48,072$ 49,226$ 50,407$
170 40028 Salary Recovery Inflation ‐$ ‐$ ‐$ ‐$ ‐$ ‐$ ‐$
171 40028 Non‐Capital Equipment Inflation 46,697$ 43,466$ 44,509$ 45,577$ 46,671$ 47,791$ 48,938$
172 40028 Capital Equipment Inflation 15,422$ 14,355$ 14,699$ 15,052$ 15,413$ 15,783$ 16,162$
173 40028 Subtotal 1,154,940$ 1,075,017$ 1,100,817$ 1,127,237$ 1,154,290$ 1,181,993$ 1,210,361$
174 40029 HW Utility Analysis175 40029 Personnel Inflation 2,822,731$ 2,627,395$ 2,690,453$ 2,755,024$ 2,821,144$ 2,888,852$ 2,958,184$
176 40029 Supplies Inflation 6,686$ 6,224$ 6,373$ 6,526$ 6,683$ 6,843$ 7,007$
177 40029 Other Services and Charges Inflation 220,490$ 205,232$ 210,158$ 215,202$ 220,366$ 225,655$ 231,071$
178 40029 Salary Recovery Inflation ‐$ ‐$ ‐$ ‐$ ‐$ ‐$ ‐$

6. 25%/35% of Maximum Impact Fee 25.0% 25.6% 31.5% 32.3% 38.6%
790.55$ 1,618.11$ 1,658.56$ 2,040.03$ 2,091.03$ 2,500.52$
Houston Combined Utility System 6,472.42$
Water Operations & MaintenanceCurrent Budget Forecasted ‐‐‐‐‐>
Line
No. Cost Center 5‐Year Average FYE 2021 FYE 2022 FYE 2023 FYE 2024 FYE 2025 FYE 2026
179 40029 Non‐Capital Equipment Inflation 51,928$ 48,334$ 49,494$ 50,682$ 51,898$ 53,144$ 54,420$
180 40029 Capital Equipment Inflation 48,531$ 45,172$ 46,256$ 47,366$ 48,503$ 49,667$ 50,859$
181 40029 Subtotal 3,150,366$ 2,932,358$ 3,002,734$ 3,074,800$ 3,148,595$ 3,224,161$ 3,301,541$
182 OPS Subtotal 21,431,928$ 19,948,817$ 20,427,588$ 20,917,850$ 21,419,878$ 21,933,955$ 22,460,370$
19,948,816$
183 Houston Water Division 253,037,295$ 225,899,173$ 230,253,753$ 238,833,583$ 251,046,084$ 261,451,604$ 283,601,452$
184 Check: W&WW CC w/EPA
185 EXPENSES Other O&M
186 30001‐30009 Director's Office187 30001‐30009 Personnel Inflation 3,878,596$ 3,610,193$ 3,696,837$ 3,785,562$ 3,876,415$ 3,969,449$ 4,064,716$
188 30001‐30009 Supplies Inflation 26,206$ 24,393$ 24,978$ 25,578$ 26,192$ 26,820$ 27,464$
189 30001‐30009 Other Services and Charges Inflation 256,673$ 238,911$ 244,645$ 250,516$ 256,528$ 262,685$ 268,989$
190 30001‐30009 Indirect Cost Recovery Inflation ‐$ ‐$ ‐$ ‐$ ‐$ ‐$ ‐$
191 30001‐30009 Non‐Capital Equipment Inflation 11,378$ 10,590$ 10,845$ 11,105$ 11,371$ 11,644$ 11,924$
192 30001‐30009 Capital Equipment Inflation ‐$ ‐$ ‐$ ‐$ ‐$ ‐$ ‐$
193 30001‐30009 Subtotal 4,172,853$ 3,884,087$ 3,977,305$ 4,072,760$ 4,170,506$ 4,270,599$ 4,373,093$
194 80001 Information Technology195 80001 Personnel Inflation 4,489,862$ 4,179,159$ 4,279,459$ 4,382,166$ 4,487,338$ 4,595,034$ 4,705,315$
196 80001 Supplies Inflation 162,038$ 150,825$ 154,445$ 158,151$ 161,947$ 165,834$ 169,814$
197 80001 Other Services and Charges Inflation 4,966,616$ 4,622,921$ 4,733,871$ 4,847,484$ 4,963,824$ 5,082,955$ 5,204,946$
198 80001 Indirect Cost Recovery Inflation ‐$ ‐$ ‐$ ‐$ ‐$ ‐$ ‐$
199 80001 Non‐Capital Equipment Inflation 409,921$ 381,554$ 390,712$ 400,089$ 409,691$ 419,523$ 429,592$
200 80001 Capital Equipment Inflation 554,596$ 516,218$ 528,607$ 541,293$ 554,284$ 567,587$ 581,209$
201 80001 Subtotal 10,583,034$ 9,850,677$ 10,087,093$ 10,329,183$ 10,577,084$ 10,830,934$ 11,090,876$
202 90001‐90011 Management Support203 90001‐90011 Personnel Inflation 1,873,906$ 1,744,229$ 1,786,091$ 1,828,957$ 1,872,852$ 1,917,801$ 1,963,828$
204 90001‐90011 Supplies Inflation 126,934$ 118,150$ 120,986$ 123,890$ 126,863$ 129,908$ 133,025$
205 90001‐90011 Other Services and Charges Inflation 4,935,122$ 4,593,606$ 4,703,853$ 4,816,745$ 4,932,347$ 5,050,724$ 5,171,941$
206 90001‐90011 Salary Recovery Inflation ‐$ ‐$ ‐$ ‐$ ‐$ ‐$ ‐$
207 90001‐90011 Non‐Capital Equipment Inflation 113,561$ 105,703$ 108,240$ 110,838$ 113,498$ 116,222$ 119,011$
208 90001‐90011 Capital Equipment Inflation 206,794$ 192,484$ 197,103$ 201,834$ 206,678$ 211,638$ 216,717$
209 90001‐90011 Subtotal 7,256,318$ 6,754,173$ 6,916,273$ 7,082,263$ 7,252,238$ 7,426,291$ 7,604,522$
210 60005 & 60008 Houston Water ‐ Planning
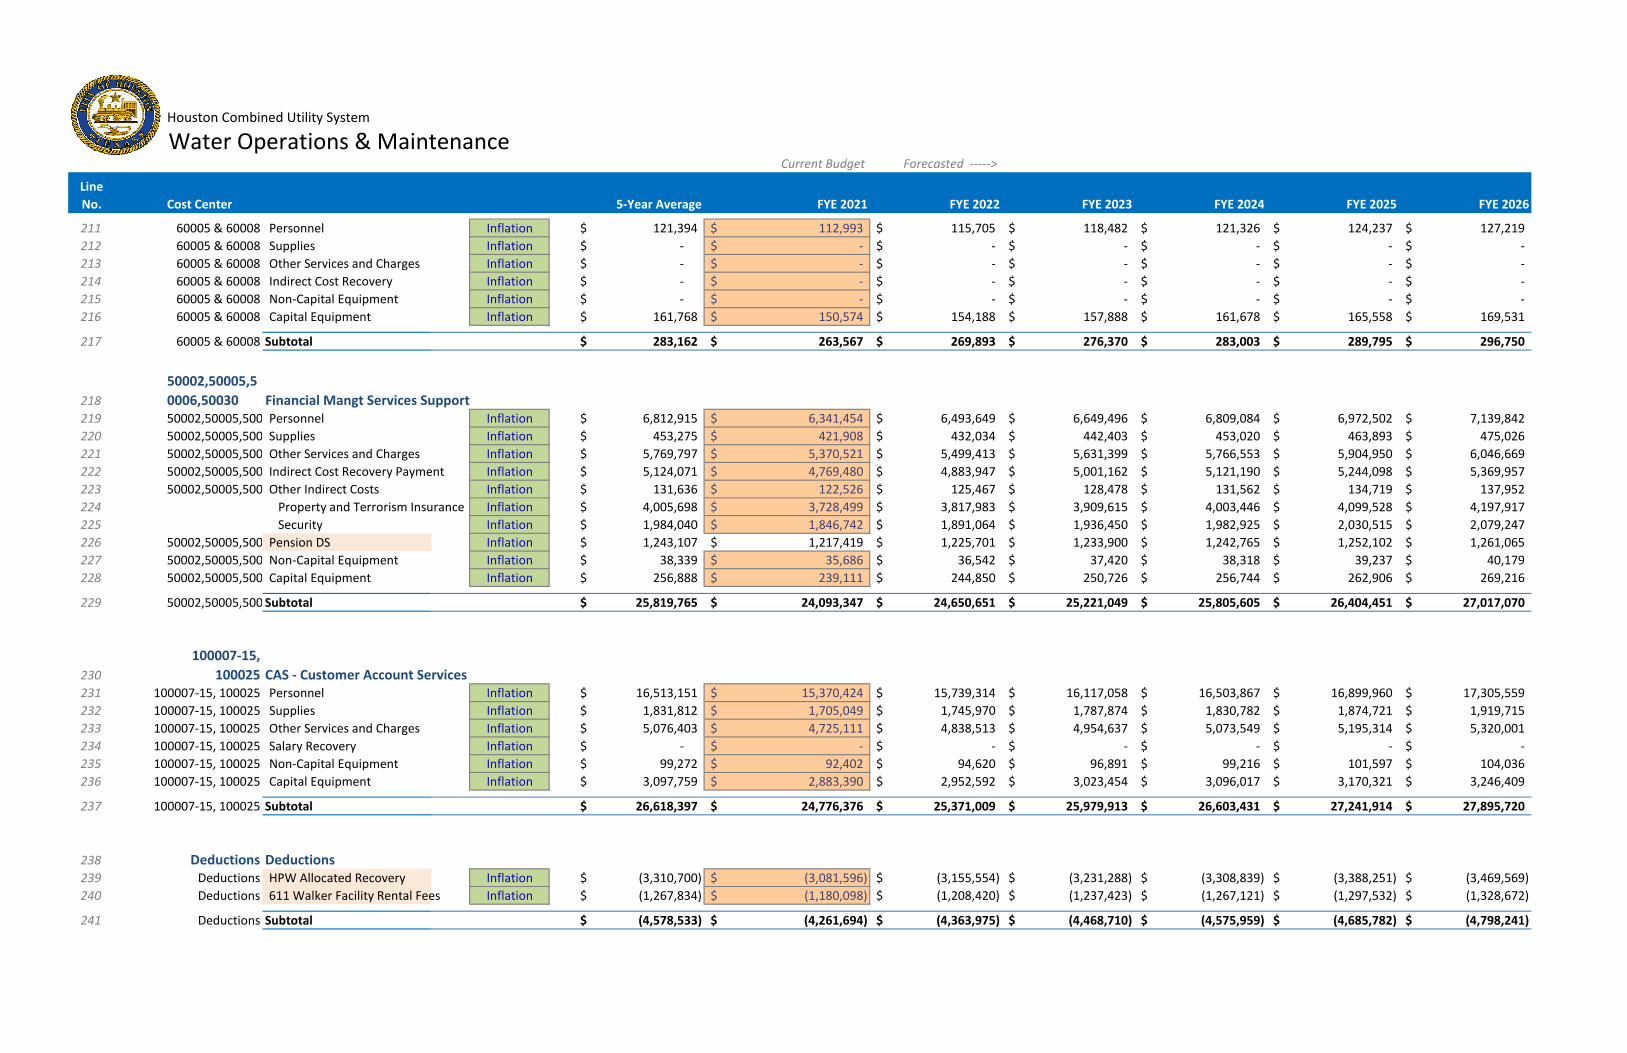
6. 25%/35% of Maximum Impact Fee 25.0% 25.6% 31.5% 32.3% 38.6%
790.55$ 1,618.11$ 1,658.56$ 2,040.03$ 2,091.03$ 2,500.52$
Houston Combined Utility System 6,472.42$
Water Operations & MaintenanceCurrent Budget Forecasted ‐‐‐‐‐>
Line
No. Cost Center 5‐Year Average FYE 2021 FYE 2022 FYE 2023 FYE 2024 FYE 2025 FYE 2026
211 60005 & 60008 Personnel Inflation 121,394$ 112,993$ 115,705$ 118,482$ 121,326$ 124,237$ 127,219$
212 60005 & 60008 Supplies Inflation ‐$ ‐$ ‐$ ‐$ ‐$ ‐$ ‐$
213 60005 & 60008 Other Services and Charges Inflation ‐$ ‐$ ‐$ ‐$ ‐$ ‐$ ‐$
214 60005 & 60008 Indirect Cost Recovery Inflation ‐$ ‐$ ‐$ ‐$ ‐$ ‐$ ‐$
215 60005 & 60008 Non‐Capital Equipment Inflation ‐$ ‐$ ‐$ ‐$ ‐$ ‐$ ‐$
216 60005 & 60008 Capital Equipment Inflation 161,768$ 150,574$ 154,188$ 157,888$ 161,678$ 165,558$ 169,531$
217 60005 & 60008 Subtotal 283,162$ 263,567$ 269,893$ 276,370$ 283,003$ 289,795$ 296,750$
218
50002,50005,5
0006,50030 Financial Mangt Services Support219 50002,50005,500 Personnel Inflation 6,812,915$ 6,341,454$ 6,493,649$ 6,649,496$ 6,809,084$ 6,972,502$ 7,139,842$
220 50002,50005,500 Supplies Inflation 453,275$ 421,908$ 432,034$ 442,403$ 453,020$ 463,893$ 475,026$
221 50002,50005,500 Other Services and Charges Inflation 5,769,797$ 5,370,521$ 5,499,413$ 5,631,399$ 5,766,553$ 5,904,950$ 6,046,669$
222 50002,50005,500 Indirect Cost Recovery Payment Inflation 5,124,071$ 4,769,480$ 4,883,947$ 5,001,162$ 5,121,190$ 5,244,098$ 5,369,957$
223 50002,50005,500 Other Indirect Costs Inflation 131,636$ 122,526$ 125,467$ 128,478$ 131,562$ 134,719$ 137,952$
224 Property and Terrorism Insurance Inflation 4,005,698$ 3,728,499$ 3,817,983$ 3,909,615$ 4,003,446$ 4,099,528$ 4,197,917$
225 Security Inflation 1,984,040$ 1,846,742$ 1,891,064$ 1,936,450$ 1,982,925$ 2,030,515$ 2,079,247$
226 50002,50005,500 Pension DS Inflation 1,243,107$ 1,217,419$ 1,225,701$ 1,233,900$ 1,242,765$ 1,252,102$ 1,261,065$
227 50002,50005,500 Non‐Capital Equipment Inflation 38,339$ 35,686$ 36,542$ 37,420$ 38,318$ 39,237$ 40,179$
228 50002,50005,500 Capital Equipment Inflation 256,888$ 239,111$ 244,850$ 250,726$ 256,744$ 262,906$ 269,216$
229 50002,50005,500 Subtotal 25,819,765$ 24,093,347$ 24,650,651$ 25,221,049$ 25,805,605$ 26,404,451$ 27,017,070$
230
100007‐15,
100025 CAS ‐ Customer Account Services231 100007‐15, 100025 Personnel Inflation 16,513,151$ 15,370,424$ 15,739,314$ 16,117,058$ 16,503,867$ 16,899,960$ 17,305,559$
232 100007‐15, 100025 Supplies Inflation 1,831,812$ 1,705,049$ 1,745,970$ 1,787,874$ 1,830,782$ 1,874,721$ 1,919,715$
233 100007‐15, 100025 Other Services and Charges Inflation 5,076,403$ 4,725,111$ 4,838,513$ 4,954,637$ 5,073,549$ 5,195,314$ 5,320,001$
234 100007‐15, 100025 Salary Recovery Inflation ‐$ ‐$ ‐$ ‐$ ‐$ ‐$ ‐$
235 100007‐15, 100025 Non‐Capital Equipment Inflation 99,272$ 92,402$ 94,620$ 96,891$ 99,216$ 101,597$ 104,036$
236 100007‐15, 100025 Capital Equipment Inflation 3,097,759$ 2,883,390$ 2,952,592$ 3,023,454$ 3,096,017$ 3,170,321$ 3,246,409$
237 100007‐15, 100025 Subtotal 26,618,397$ 24,776,376$ 25,371,009$ 25,979,913$ 26,603,431$ 27,241,914$ 27,895,720$
238 Deductions Deductions239 Deductions HPW Allocated Recovery Inflation (3,310,700)$ (3,081,596)$ (3,155,554)$ (3,231,288)$ (3,308,839)$ (3,388,251)$ (3,469,569)$
240 Deductions 611 Walker Facility Rental Fees Inflation (1,267,834)$ (1,180,098)$ (1,208,420)$ (1,237,423)$ (1,267,121)$ (1,297,532)$ (1,328,672)$
241 Deductions Subtotal (4,578,533)$ (4,261,694)$ (4,363,975)$ (4,468,710)$ (4,575,959)$ (4,685,782)$ (4,798,241)$

6. 25%/35% of Maximum Impact Fee 25.0% 25.6% 31.5% 32.3% 38.6%
790.55$ 1,618.11$ 1,658.56$ 2,040.03$ 2,091.03$ 2,500.52$
Houston Combined Utility System 6,472.42$
Water Operations & MaintenanceCurrent Budget Forecasted ‐‐‐‐‐>
Line
No. Cost Center 5‐Year Average FYE 2021 FYE 2022 FYE 2023 FYE 2024 FYE 2025 FYE 2026
242 Other Subtotal 70,154,996$ 65,360,532$ 66,908,249$ 68,492,829$ 70,115,909$ 71,778,201$ 73,479,790$
243 TOTAL O&M, CAPITAL, EXPENSES 323,192,291$ 291,259,705$ 297,162,002$ 307,326,412$ 321,161,993$ 333,229,805$ 357,081,242$

WATER AND WASTEWATER COST OF SERVICE RATE STUDY | CITY OF HOUSTON
DRAFT | APRIL
Appendix B
WASTEWATER FYE BUDGET AND FYE ‐
PROJECTIONS

6. 25%/35% of Maximum Impact Fee 35.0% 35.9% 36.8% 37.7% 38.6%
1,199.11$ 1,621.63$ 1,662.17$ 1,703.73$ 1,746.32$ 1,789.98$
Houston Combined Utility System 4,633.24$
Wastewater Operations & MaintenanceProposed Budget Forecasted ‐‐‐‐‐>
Line
No. Cost Center 5‐Year Average FYE 2021 FYE 2022 FYE 2023 FYE 2024 FYE 2025 FYE 2026
1 REVENUES Wastewater
2 Operating3 Wastewater Revenues4 Wastewater system user charges ‐‐Revenue Sheet‐‐ 763,527,440$ 515,679,089$ 524,461,104$ 750,428,317$ 797,044,924$ 846,557,355$ 899,145,498$
5 455010 Sewer Service Penalties Inf + Growth 5,944,165$ 5,500,000$ 5,643,000$ 5,789,718$ 5,940,251$ 6,094,697$ 6,253,159$ 6 Wastewater Revenues Subtotal 769,471,605$ 521,179,089$ 530,104,104$ 756,218,035$ 802,985,175$ 852,652,052$ 905,398,657$
7 Impact Fee Revenue8 Wastewater Allocation Growth 21,548,289$ 15,064,659$ 20,413,608$ 20,965,787$ 21,532,984$ 22,115,410$ 22,713,657$
9 Other Wastewater Revenue (Non rate)10 431020 Contributions from Others Inflation ‐$ ‐$ ‐$ ‐$ ‐$ ‐$ ‐$
11 455040 Utility Service Penalties Inflation ‐$ ‐$ ‐$ ‐$ ‐$ ‐$ ‐$
12 425030 Indirect Cost Recovery Inflation ‐$ ‐$ ‐$ ‐$ ‐$ ‐$ ‐$
13 426270 Utility District Appl Review Inflation 33,177$ 30,881$ 31,623$ 32,381$ 33,159$ 33,954$ 34,769$
14 426330 Miscellaneous Copies Fees Inflation 6,353$ 5,913$ 6,055$ 6,201$ 6,349$ 6,502$ 6,658$
15 456110 Storm Water Quality Management Permit Inflation ‐$ ‐$ ‐$ ‐$ ‐$ ‐$ ‐$
16 456115 Industrial Waste Discharge Permits Inflation 7,735$ 7,200$ 7,373$ 7,550$ 7,731$ 7,916$ 8,106$
17 456125 Fire Sprinkler Fees Inflation ‐$ ‐$ ‐$ ‐$ ‐$ ‐$ ‐$
18 456130 Water Meter Rental Fees Inflation ‐$ ‐$ ‐$ ‐$ ‐$ ‐$ ‐$
19 456135 Delinquent Reconnection Fees Inflation 214,047$ 199,235$ 204,016$ 208,913$ 213,927$ 219,061$ 224,318$
20 456140 Tap Installation Fees Inflation 1,070$ 996$ 1,020$ 1,045$ 1,070$ 1,095$ 1,122$
21 456145 Meter Installation Fees Inflation 535,118$ 498,087$ 510,041$ 522,282$ 534,817$ 547,652$ 560,796$
22 456150 Engineering Inspection Fees Inflation 267,559$ 249,043$ 255,020$ 261,141$ 267,408$ 273,826$ 280,398$
23 456155 Meter Testing Fees Inflation 1,070$ 996$ 1,020$ 1,045$ 1,070$ 1,095$ 1,122$
24 456160 Transient Meter Relocation Fee Inflation ‐$ ‐$ ‐$ ‐$ ‐$ ‐$ ‐$
25 456165 New Customer Fees Inflation 133,779$ 124,522$ 127,510$ 130,570$ 133,704$ 136,913$ 140,199$
26 456170 Account Record Fees Inflation 535$ 498$ 510$ 522$ 535$ 548$ 561$
27 456175 Disposal Fees Inflation ‐$ ‐$ ‐$ ‐$ ‐$ ‐$ ‐$
28 456180 Fertilizers Sales Inflation 161,152$ 150,000$ 153,600$ 157,286$ 161,061$ 164,927$ 168,885$
29 456185 Contract Revenues: River Authorities Inflation ‐$ ‐$ ‐$ ‐$ ‐$ ‐$ ‐$
30 456195 Water Connection Violation Inflation ‐$ ‐$ ‐$ ‐$ ‐$ ‐$ ‐$
31 456205 Failure to Connect Sewer Inflation ‐$ ‐$ ‐$ ‐$ ‐$ ‐$ ‐$
32 456210 Missed Appointment Inflation 8,027$ 7,471$ 7,651$ 7,834$ 8,022$ 8,215$ 8,412$
33 456220 Tenant Notice Inflation 5,351$ 4,981$ 5,100$ 5,223$ 5,348$ 5,477$ 5,608$
34 456225 Failure to Apply Inflation 26,756$ 24,904$ 25,502$ 26,114$ 26,741$ 27,383$ 28,040$
35 456230 Illegal Turn on Water Inflation 535$ 498$ 510$ 522$ 535$ 548$ 561$
36 456235 Lock Devise Damage Inflation 54$ 50$ 51$ 52$ 53$ 55$ 56$
37 456240 Submeter Application Inflation 16,115$ 15,000$ 15,360$ 15,729$ 16,106$ 16,493$ 16,888$
38 456245 Evap Cr. Process Fee Inflation 214,869$ 200,000$ 204,800$ 209,715$ 214,748$ 219,902$ 225,180$
39 456250 Sewage Disposal Inflation 10,743$ 10,000$ 10,240$ 10,486$ 10,737$ 10,995$ 11,259$
40 456255 Misc Operating Revenue Inflation ‐$ ‐$ ‐$ ‐$ ‐$ ‐$ ‐$
41 456260 Oper Recov & Refunds Inflation 2,676$ 2,490$ 2,550$ 2,611$ 2,674$ 2,738$ 2,804$

6. 25%/35% of Maximum Impact Fee 35.0% 35.9% 36.8% 37.7% 38.6%
1,199.11$ 1,621.63$ 1,662.17$ 1,703.73$ 1,746.32$ 1,789.98$
Houston Combined Utility System 4,633.24$
Wastewater Operations & MaintenanceProposed Budget Forecasted ‐‐‐‐‐>
Line
No. Cost Center 5‐Year Average FYE 2021 FYE 2022 FYE 2023 FYE 2024 FYE 2025 FYE 2026
42 456265 MSD Application Fee Inflation 26,756$ 24,904$ 25,502$ 26,114$ 26,741$ 27,383$ 28,040$
43 Other Wastewater Revenue (Non rate) Subtotal 1,673,478$ 1,557,671$ 1,595,055$ 1,633,337$ 1,672,537$ 1,712,677$ 1,753,782$
44 Other Wastewater Revenues (Non rate)45 421280 Other Licenses & Permits Inflation ‐$ ‐$ ‐$ ‐$ ‐$ ‐$ ‐$
421630 Admin Fee‐Lic/Prmts Inflation 267,559$ 249,043$ 255,020$ 261,141$ 267,408$ 273,826$ 280,398$
46 421530 Special Event Permits Inflation ‐$ ‐$ ‐$ ‐$ ‐$ ‐$ ‐$
47 434205 Sale Of Scrap Metal Inflation 40,134$ 37,357$ 38,253$ 39,171$ 40,111$ 41,074$ 42,060$
47 434225 Sale of Non‐Capital Equipment and Merchandise Inflation ‐$ ‐$ ‐$ ‐$ ‐$ ‐$ ‐$
48 434235 Sale of Other Assets Inflation 26,756$ 24,904$ 25,502$ 26,114$ 26,741$ 27,383$ 28,040$
49 434240 Sale of Land/Street Inflation 1,070,235$ 996,174$ 1,020,082$ 1,044,564$ 1,069,633$ 1,095,305$ 1,121,592$
50 434245 Sale Cap‐Vehicles Inflation 107,024$ 99,617$ 102,008$ 104,456$ 106,963$ 109,530$ 112,159$
51 424110 Other Interfund Services Inflation 310,582$ 289,090$ 296,028$ 303,132$ 310,408$ 317,857$ 325,486$
52 424120 Intfd Vehicle Fuel Inflation ‐$ ‐$ ‐$ ‐$ ‐$ ‐$ ‐$
53 424170 Intfd Vehicle Repair Inflation ‐$ ‐$ ‐$ ‐$ ‐$ ‐$ ‐$
54 424510 Prior Yr Revenue Inflation ‐$ ‐$ ‐$ ‐$ ‐$ ‐$ ‐$
55 426090 Demolition Fees Inflation ‐$ ‐$ ‐$ ‐$ ‐$ ‐$ ‐$
56 426320 City Map & Related Items Inflation 54$ 50$ 51$ 52$ 53$ 55$ 56$
57 426370 Training Services Inflation 53,512$ 49,809$ 51,004$ 52,228$ 53,482$ 54,765$ 56,080$
58 426420 Bldg Space Rental Fee Inflation ‐$ ‐$ ‐$ ‐$ ‐$ ‐$ ‐$
59 426430 Facility Rental Fees Inflation 1,258,168$ 1,171,102$ 1,199,208$ 1,227,989$ 1,257,461$ 1,287,640$ 1,318,543$
60 428030 Release Of Liens Inflation 642$ 598$ 612$ 627$ 642$ 657$ 673$
61 428060 Other Interest Income Inflation ‐$ ‐$ ‐$ ‐$ ‐$ ‐$ ‐$
62 428080 Returned Check Charges Inflation 26,756$ 24,904$ 25,502$ 26,114$ 26,741$ 27,383$ 28,040$
63 428090 Misc Fines & Forfeit Inflation 535$ 498$ 510$ 522$ 535$ 548$ 561$
64 429095 Medicare Part D Distribution Inflation ‐$ ‐$ ‐$ ‐$ ‐$ ‐$ ‐$
65 434305 Judgments & Claims Inflation 535$ 498$ 510$ 522$ 535$ 548$ 561$
66 434335 Recoveries Damage Infrastructure Inflation 8,027$ 7,471$ 7,651$ 7,834$ 8,022$ 8,215$ 8,412$
67 434340 Cashier Overage Inflation ‐$ ‐$ ‐$ ‐$ ‐$ ‐$ ‐$
68 434345 Adjustments to Allowances Inflation ‐$ ‐$ ‐$ ‐$ ‐$ ‐$ ‐$
69 434505 Prior Yr Exp Recovery Inflation ‐$ ‐$ ‐$ ‐$ ‐$ ‐$ ‐$
70 434510 Prior Year Revenue Inflation ‐$ ‐$ ‐$ ‐$ ‐$ ‐$ ‐$
71 445050 Cell Tower Revenue Inflation 16,589$ 15,441$ 15,811$ 16,191$ 16,579$ 16,977$ 17,385$
72 452020 Recoveries & Refunds Inflation 107,024$ 99,617$ 102,008$ 104,456$ 106,963$ 109,530$ 112,159$
73 452030 Miscellaneous Revenues Inflation 64,214$ 59,770$ 61,205$ 62,674$ 64,178$ 65,718$ 67,296$
74 456105 Oil and Gas Well Permits Inflation 2,676$ 2,490$ 2,550$ 2,611$ 2,674$ 2,738$ 2,804$
75 456120 Development Permits Inflation 214,047$ 199,235$ 204,016$ 208,913$ 213,927$ 219,061$ 224,318$
76 456185 Contract Revenues from Water Authorities Inflation ‐$ ‐$ ‐$ ‐$ ‐$ ‐$ ‐$
77 456235 Lock Device Damage/Repair Inflation ‐$ ‐$ ‐$ ‐$ ‐$ ‐$ ‐$
78 457020 Intfd Comm Equip Repair Inflation ‐$ ‐$ ‐$ ‐$ ‐$ ‐$ ‐$
79 457040 Intfd Fleet Maintenance Inflation ‐$ ‐$ ‐$ ‐$ ‐$ ‐$ ‐$
80 457080 Intfd Employee Training Materials Inflation ‐$ ‐$ ‐$ ‐$ ‐$ ‐$ ‐$
81 490040 Transfer from Water and Sewer Fund Inflation ‐$ ‐$ ‐$ ‐$ ‐$ ‐$ ‐$
82 425120 PWE Allocated Cost Recovery Inflation 3,285,461$ 3,058,104$ 3,131,499$ 3,206,654$ 3,283,614$ 3,362,421$ 3,443,119$
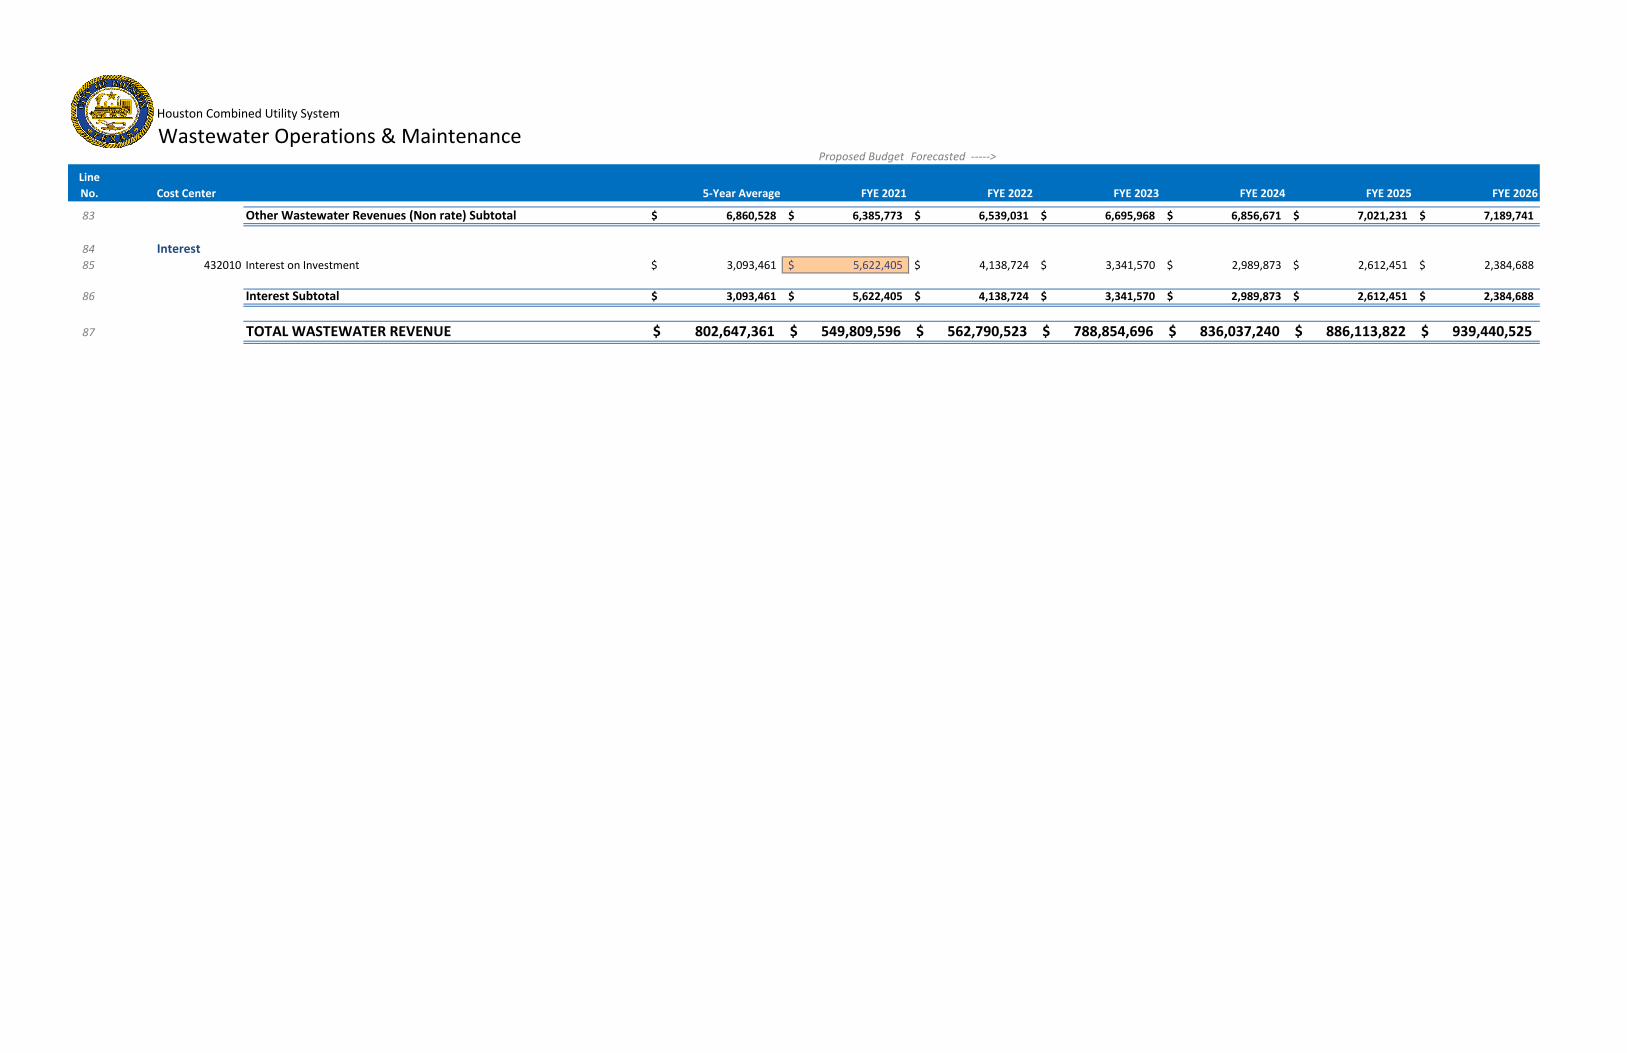
6. 25%/35% of Maximum Impact Fee 35.0% 35.9% 36.8% 37.7% 38.6%
1,199.11$ 1,621.63$ 1,662.17$ 1,703.73$ 1,746.32$ 1,789.98$
Houston Combined Utility System 4,633.24$
Wastewater Operations & MaintenanceProposed Budget Forecasted ‐‐‐‐‐>
Line
No. Cost Center 5‐Year Average FYE 2021 FYE 2022 FYE 2023 FYE 2024 FYE 2025 FYE 2026
83 Other Wastewater Revenues (Non rate) Subtotal 6,860,528$ 6,385,773$ 6,539,031$ 6,695,968$ 6,856,671$ 7,021,231$ 7,189,741$
84 Interest85 432010 Interest on Investment 3,093,461$ 5,622,405$ 4,138,724$ 3,341,570$ 2,989,873$ 2,612,451$ 2,384,688$
86 Interest Subtotal 3,093,461$ 5,622,405$ 4,138,724$ 3,341,570$ 2,989,873$ 2,612,451$ 2,384,688$
87 TOTAL WASTEWATER REVENUE 802,647,361$ 549,809,596$ 562,790,523$ 788,854,696$ 836,037,240$ 886,113,822$ 939,440,525$

6. 25%/35% of Maximum Impact Fee 35.0% 35.9% 36.8% 37.7% 38.6%
1,199.11$ 1,621.63$ 1,662.17$ 1,703.73$ 1,746.32$ 1,789.98$
Houston Combined Utility System 4,633.24$
Wastewater Operations & MaintenanceProposed Budget Forecasted ‐‐‐‐‐>
Line
No. Cost Center 5‐Year Average FYE 2021 FYE 2022 FYE 2023 FYE 2024 FYE 2025 FYE 2026
1 EXPENSES Wastewater Operations
2 40001 WWO Executive Support G&A3 40001 Personnel Inflation 2,294,587$ 2,135,799$ 2,187,058$ 2,239,548$ 2,293,297$ 2,348,336$ 2,404,696$
4 40001 Supplies Inflation 452,300$ 421,000$ 431,104$ 441,450$ 452,045$ 462,894$ 474,004$
5 40001 Other Services and Charges Inflation 947,680$ 882,100$ 903,270$ 924,949$ 947,148$ 969,879$ 993,156$
6 40001 Salary Recovery Inflation ‐$ ‐$ ‐$ ‐$ ‐$ ‐$ ‐$
7 40001 Pension DS 2,889,526$ 2,829,817$ 2,849,069$ 2,868,126$ 2,888,732$ 2,910,436$ 2,931,269$
8 40001 Non‐Capital Equipment Inflation ‐$ ‐$ ‐$ ‐$ ‐$ ‐$ ‐$
9 40001 Capital Equipment Inflation ‐$ ‐$ ‐$ ‐$ ‐$ ‐$ ‐$
10 40001 Subtotal 6,584,093$ 6,268,716$ 6,370,501$ 6,474,073$ 6,581,222$ 6,691,545$ 6,803,126$
11 40002 WWO Collection System Analysis12 40002 Personnel Inflation 3,271,075$ 3,044,713$ 3,117,786$ 3,192,613$ 3,269,236$ 3,347,697$ 3,428,042$
13 40002 Supplies Inflation 35,346$ 32,900$ 33,690$ 34,498$ 35,326$ 36,174$ 37,042$
14 40002 Other Services and Charges Inflation 1,319,404$ 1,228,100$ 1,257,574$ 1,287,756$ 1,318,662$ 1,350,310$ 1,382,718$
15 40002 Salary Recovery Inflation ‐$ ‐$ ‐$ ‐$ ‐$ ‐$ ‐$
16 40002 Non‐Capital Equipment Inflation ‐$ ‐$ ‐$ ‐$ ‐$ ‐$ ‐$
17 40002 Capital Equipment Inflation ‐$ ‐$ ‐$ ‐$ ‐$ ‐$ ‐$
18 40002 Subtotal 4,625,825$ 4,305,713$ 4,409,050$ 4,514,867$ 4,623,224$ 4,734,182$ 4,847,802$
19 40003 WWO Collection System Repairs20 40003 Personnel Inflation 11,425,123$ 10,634,492$ 10,889,720$ 11,151,073$ 11,418,699$ 11,692,748$ 11,973,374$
21 40003 Supplies Inflation 747,100$ 695,400$ 712,090$ 729,180$ 746,680$ 764,600$ 782,951$
22 40003 Other Services and Charges Inflation 2,515,581$ 2,341,500$ 2,397,696$ 2,455,241$ 2,514,166$ 2,574,506$ 2,636,295$
23 40003 Salary Recovery Inflation ‐$ ‐$ ‐$ ‐$ ‐$ ‐$ ‐$
24 40003 Non‐Capital Equipment Inflation 16,115$ 15,000$ 15,360$ 15,729$ 16,106$ 16,493$ 16,888$
25 40003 Capital Equipment Inflation 601,634$ 560,000$ 573,440$ 587,203$ 601,295$ 615,727$ 630,504$
26 40003 Subtotal 15,305,552$ 14,246,392$ 14,588,305$ 14,938,425$ 15,296,947$ 15,664,074$ 16,040,011$
27 40004 WWO Regulatory and Compliance28 40004 Personnel Inflation 6,223,749$ 5,793,059$ 5,932,092$ 6,074,463$ 6,220,250$ 6,369,536$ 6,522,405$
29 40004 Supplies Inflation 373,872$ 348,000$ 356,352$ 364,904$ 373,662$ 382,630$ 391,813$
30 40004 Other Services and Charges Inflation 3,772,673$ 3,511,600$ 3,595,878$ 3,682,179$ 3,770,552$ 3,861,045$ 3,953,710$
31 40004 Salary Recovery Inflation ‐$ ‐$ ‐$ ‐$ ‐$ ‐$ ‐$
32 40004 Non‐Capital Equipment Inflation ‐$ ‐$ ‐$ ‐$ ‐$ ‐$ ‐$
33 40004 Capital Equipment Inflation 377,383$ 351,268$ 359,698$ 368,331$ 377,171$ 386,223$ 395,493$
34 40004 Subtotal 10,747,678$ 10,003,927$ 10,244,021$ 10,489,878$ 10,741,635$ 10,999,434$ 11,263,420$
35 40005 WWO Technical Services G&A36 40005 Personnel Inflation 2,229,551$ 2,075,264$ 2,125,070$ 2,176,072$ 2,228,298$ 2,281,777$ 2,336,540$
37 40005 Supplies Inflation 14,360,244$ 13,366,500$ 13,687,296$ 14,015,791$ 14,352,170$ 14,696,622$ 15,049,341$
38 40005 Other Services and Charges Inflation 1,730,234$ 1,610,500$ 1,649,152$ 1,688,732$ 1,729,261$ 1,770,763$ 1,813,262$
39 40005 Salary Recovery Inflation ‐$ ‐$ ‐$ ‐$ ‐$ ‐$ ‐$
40 40005 Non‐Capital Equipment Inflation ‐$ ‐$ ‐$ ‐$ ‐$ ‐$ ‐$
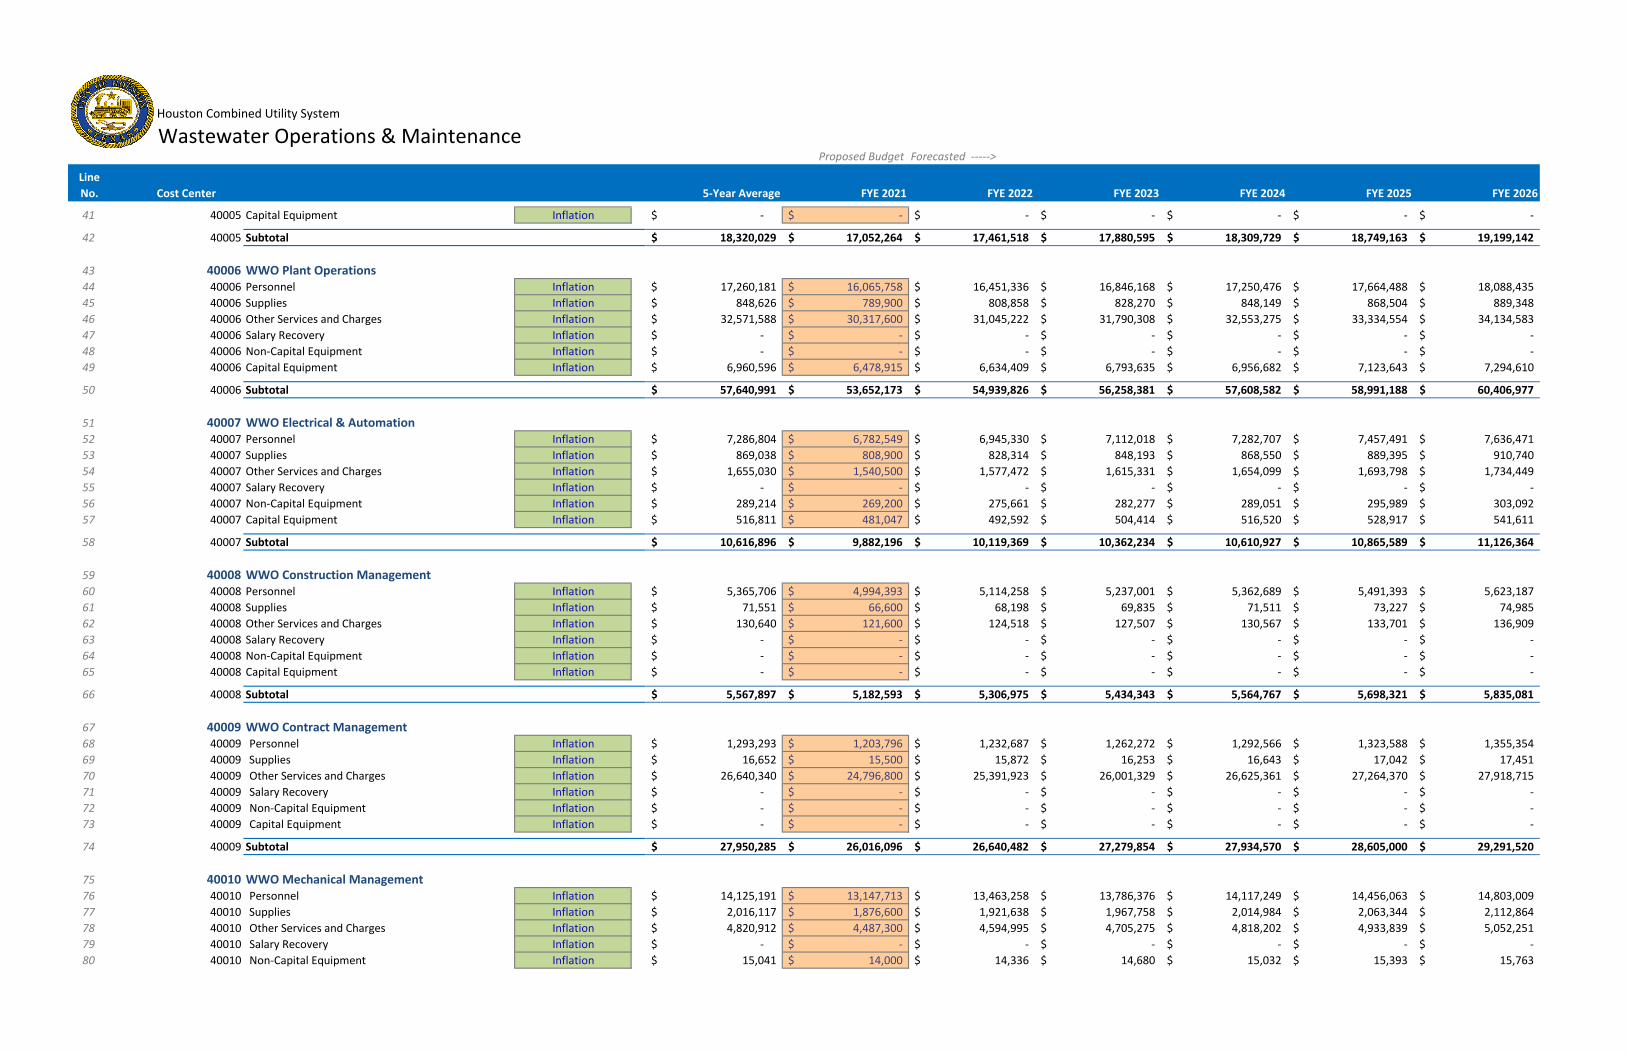
6. 25%/35% of Maximum Impact Fee 35.0% 35.9% 36.8% 37.7% 38.6%
1,199.11$ 1,621.63$ 1,662.17$ 1,703.73$ 1,746.32$ 1,789.98$
Houston Combined Utility System 4,633.24$
Wastewater Operations & MaintenanceProposed Budget Forecasted ‐‐‐‐‐>
Line
No. Cost Center 5‐Year Average FYE 2021 FYE 2022 FYE 2023 FYE 2024 FYE 2025 FYE 2026
41 40005 Capital Equipment Inflation ‐$ ‐$ ‐$ ‐$ ‐$ ‐$ ‐$
42 40005 Subtotal 18,320,029$ 17,052,264$ 17,461,518$ 17,880,595$ 18,309,729$ 18,749,163$ 19,199,142$
43 40006 WWO Plant Operations44 40006 Personnel Inflation 17,260,181$ 16,065,758$ 16,451,336$ 16,846,168$ 17,250,476$ 17,664,488$ 18,088,435$
45 40006 Supplies Inflation 848,626$ 789,900$ 808,858$ 828,270$ 848,149$ 868,504$ 889,348$
46 40006 Other Services and Charges Inflation 32,571,588$ 30,317,600$ 31,045,222$ 31,790,308$ 32,553,275$ 33,334,554$ 34,134,583$
47 40006 Salary Recovery Inflation ‐$ ‐$ ‐$ ‐$ ‐$ ‐$ ‐$
48 40006 Non‐Capital Equipment Inflation ‐$ ‐$ ‐$ ‐$ ‐$ ‐$ ‐$
49 40006 Capital Equipment Inflation 6,960,596$ 6,478,915$ 6,634,409$ 6,793,635$ 6,956,682$ 7,123,643$ 7,294,610$
50 40006 Subtotal 57,640,991$ 53,652,173$ 54,939,826$ 56,258,381$ 57,608,582$ 58,991,188$ 60,406,977$
51 40007 WWO Electrical & Automation52 40007 Personnel Inflation 7,286,804$ 6,782,549$ 6,945,330$ 7,112,018$ 7,282,707$ 7,457,491$ 7,636,471$
53 40007 Supplies Inflation 869,038$ 808,900$ 828,314$ 848,193$ 868,550$ 889,395$ 910,740$
54 40007 Other Services and Charges Inflation 1,655,030$ 1,540,500$ 1,577,472$ 1,615,331$ 1,654,099$ 1,693,798$ 1,734,449$
55 40007 Salary Recovery Inflation ‐$ ‐$ ‐$ ‐$ ‐$ ‐$ ‐$
56 40007 Non‐Capital Equipment Inflation 289,214$ 269,200$ 275,661$ 282,277$ 289,051$ 295,989$ 303,092$
57 40007 Capital Equipment Inflation 516,811$ 481,047$ 492,592$ 504,414$ 516,520$ 528,917$ 541,611$
58 40007 Subtotal 10,616,896$ 9,882,196$ 10,119,369$ 10,362,234$ 10,610,927$ 10,865,589$ 11,126,364$
59 40008 WWO Construction Management60 40008 Personnel Inflation 5,365,706$ 4,994,393$ 5,114,258$ 5,237,001$ 5,362,689$ 5,491,393$ 5,623,187$
61 40008 Supplies Inflation 71,551$ 66,600$ 68,198$ 69,835$ 71,511$ 73,227$ 74,985$
62 40008 Other Services and Charges Inflation 130,640$ 121,600$ 124,518$ 127,507$ 130,567$ 133,701$ 136,909$
63 40008 Salary Recovery Inflation ‐$ ‐$ ‐$ ‐$ ‐$ ‐$ ‐$
64 40008 Non‐Capital Equipment Inflation ‐$ ‐$ ‐$ ‐$ ‐$ ‐$ ‐$
65 40008 Capital Equipment Inflation ‐$ ‐$ ‐$ ‐$ ‐$ ‐$ ‐$
66 40008 Subtotal 5,567,897$ 5,182,593$ 5,306,975$ 5,434,343$ 5,564,767$ 5,698,321$ 5,835,081$
67 40009 WWO Contract Management68 40009 Personnel Inflation 1,293,293$ 1,203,796$ 1,232,687$ 1,262,272$ 1,292,566$ 1,323,588$ 1,355,354$
69 40009 Supplies Inflation 16,652$ 15,500$ 15,872$ 16,253$ 16,643$ 17,042$ 17,451$
70 40009 Other Services and Charges Inflation 26,640,340$ 24,796,800$ 25,391,923$ 26,001,329$ 26,625,361$ 27,264,370$ 27,918,715$
71 40009 Salary Recovery Inflation ‐$ ‐$ ‐$ ‐$ ‐$ ‐$ ‐$
72 40009 Non‐Capital Equipment Inflation ‐$ ‐$ ‐$ ‐$ ‐$ ‐$ ‐$
73 40009 Capital Equipment Inflation ‐$ ‐$ ‐$ ‐$ ‐$ ‐$ ‐$
74 40009 Subtotal 27,950,285$ 26,016,096$ 26,640,482$ 27,279,854$ 27,934,570$ 28,605,000$ 29,291,520$
75 40010 WWO Mechanical Management76 40010 Personnel Inflation 14,125,191$ 13,147,713$ 13,463,258$ 13,786,376$ 14,117,249$ 14,456,063$ 14,803,009$
77 40010 Supplies Inflation 2,016,117$ 1,876,600$ 1,921,638$ 1,967,758$ 2,014,984$ 2,063,344$ 2,112,864$
78 40010 Other Services and Charges Inflation 4,820,912$ 4,487,300$ 4,594,995$ 4,705,275$ 4,818,202$ 4,933,839$ 5,052,251$
79 40010 Salary Recovery Inflation ‐$ ‐$ ‐$ ‐$ ‐$ ‐$ ‐$
80 40010 Non‐Capital Equipment Inflation 15,041$ 14,000$ 14,336$ 14,680$ 15,032$ 15,393$ 15,763$
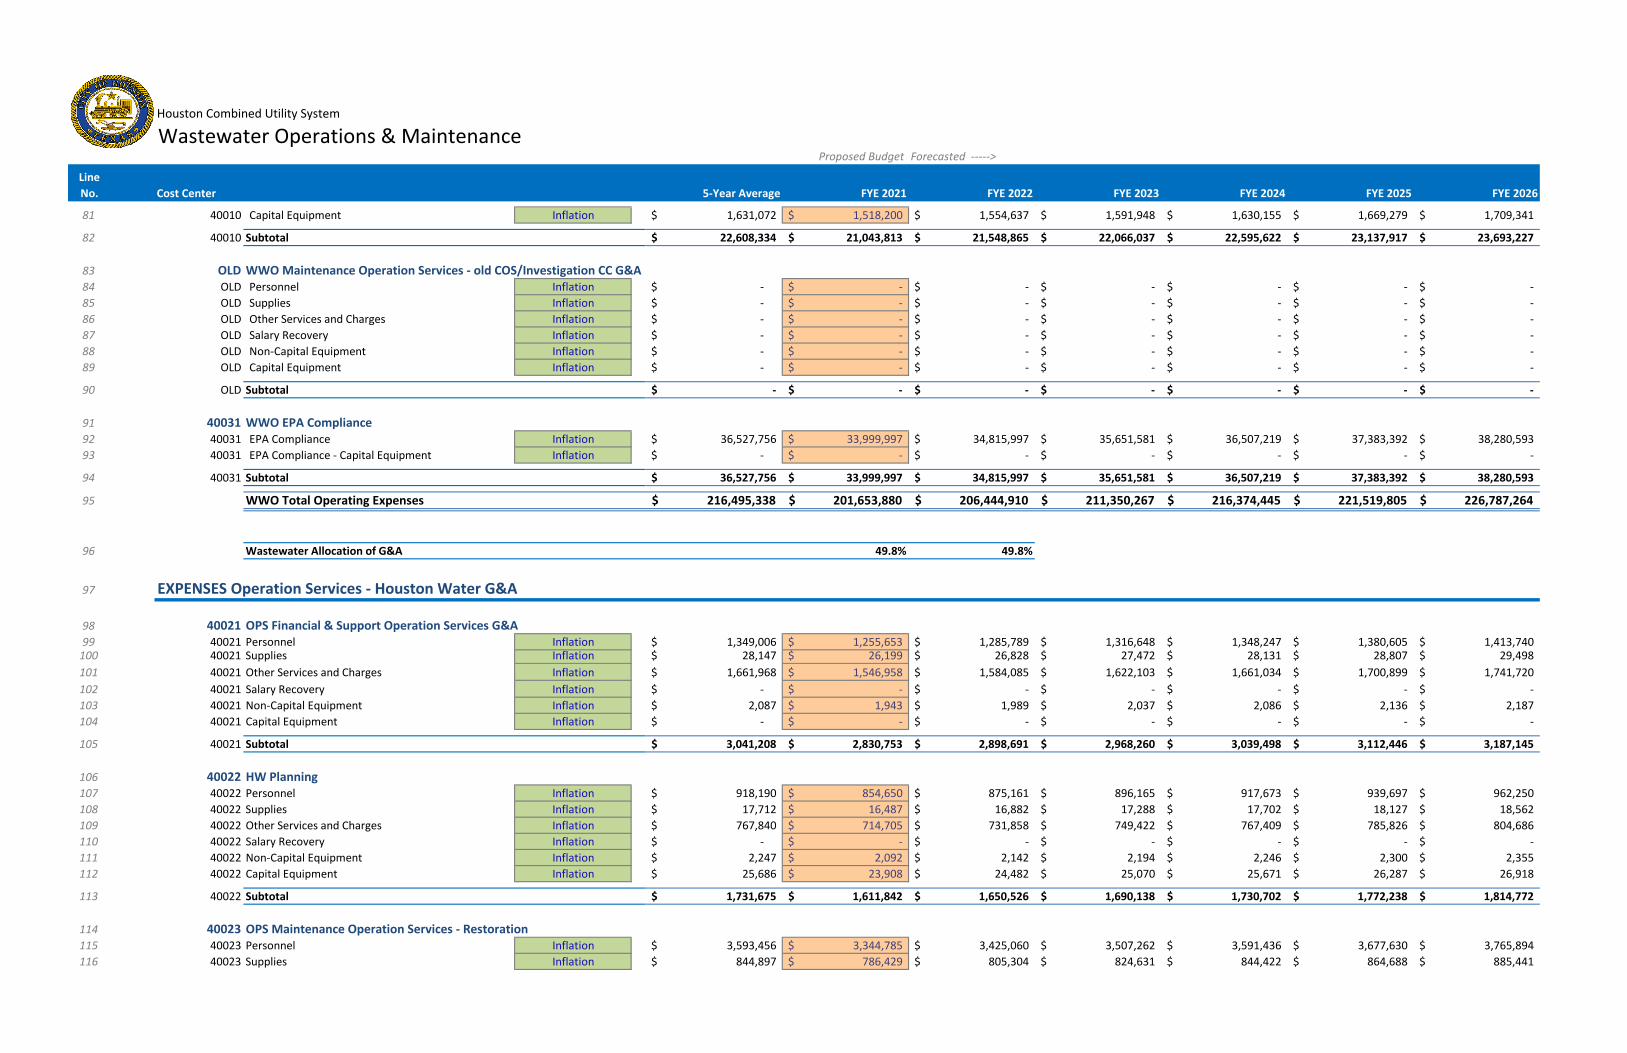
6. 25%/35% of Maximum Impact Fee 35.0% 35.9% 36.8% 37.7% 38.6%
1,199.11$ 1,621.63$ 1,662.17$ 1,703.73$ 1,746.32$ 1,789.98$
Houston Combined Utility System 4,633.24$
Wastewater Operations & MaintenanceProposed Budget Forecasted ‐‐‐‐‐>
Line
No. Cost Center 5‐Year Average FYE 2021 FYE 2022 FYE 2023 FYE 2024 FYE 2025 FYE 2026
81 40010 Capital Equipment Inflation 1,631,072$ 1,518,200$ 1,554,637$ 1,591,948$ 1,630,155$ 1,669,279$ 1,709,341$
82 40010 Subtotal 22,608,334$ 21,043,813$ 21,548,865$ 22,066,037$ 22,595,622$ 23,137,917$ 23,693,227$
83 OLD WWO Maintenance Operation Services ‐ old COS/Investigation CC G&A84 OLD Personnel Inflation ‐$ ‐$ ‐$ ‐$ ‐$ ‐$ ‐$
85 OLD Supplies Inflation ‐$ ‐$ ‐$ ‐$ ‐$ ‐$ ‐$
86 OLD Other Services and Charges Inflation ‐$ ‐$ ‐$ ‐$ ‐$ ‐$ ‐$
87 OLD Salary Recovery Inflation ‐$ ‐$ ‐$ ‐$ ‐$ ‐$ ‐$
88 OLD Non‐Capital Equipment Inflation ‐$ ‐$ ‐$ ‐$ ‐$ ‐$ ‐$
89 OLD Capital Equipment Inflation ‐$ ‐$ ‐$ ‐$ ‐$ ‐$ ‐$
90 OLD Subtotal ‐$ ‐$ ‐$ ‐$ ‐$ ‐$ ‐$
91 40031 WWO EPA Compliance92 40031 EPA Compliance Inflation 36,527,756$ 33,999,997$ 34,815,997$ 35,651,581$ 36,507,219$ 37,383,392$ 38,280,593$
93 40031 EPA Compliance ‐ Capital Equipment Inflation ‐$ ‐$ ‐$ ‐$ ‐$ ‐$ ‐$
94 40031 Subtotal 36,527,756$ 33,999,997$ 34,815,997$ 35,651,581$ 36,507,219$ 37,383,392$ 38,280,593$
95 WWO Total Operating Expenses 216,495,338$ 201,653,880$ 206,444,910$ 211,350,267$ 216,374,445$ 221,519,805$ 226,787,264$
96 Wastewater Allocation of G&A 49.8% 49.8%
97 EXPENSES Operation Services ‐ Houston Water G&A
98 40021 OPS Financial & Support Operation Services G&A99 40021 Personnel Inflation 1,349,006$ 1,255,653$ 1,285,789$ 1,316,648$ 1,348,247$ 1,380,605$ 1,413,740$ 100 40021 Supplies Inflation 28,147$ 26,199$ 26,828$ 27,472$ 28,131$ 28,807$ 29,498$
101 40021 Other Services and Charges Inflation 1,661,968$ 1,546,958$ 1,584,085$ 1,622,103$ 1,661,034$ 1,700,899$ 1,741,720$
102 40021 Salary Recovery Inflation ‐$ ‐$ ‐$ ‐$ ‐$ ‐$ ‐$
103 40021 Non‐Capital Equipment Inflation 2,087$ 1,943$ 1,989$ 2,037$ 2,086$ 2,136$ 2,187$
104 40021 Capital Equipment Inflation ‐$ ‐$ ‐$ ‐$ ‐$ ‐$ ‐$
105 40021 Subtotal 3,041,208$ 2,830,753$ 2,898,691$ 2,968,260$ 3,039,498$ 3,112,446$ 3,187,145$
106 40022 HW Planning107 40022 Personnel Inflation 918,190$ 854,650$ 875,161$ 896,165$ 917,673$ 939,697$ 962,250$
108 40022 Supplies Inflation 17,712$ 16,487$ 16,882$ 17,288$ 17,702$ 18,127$ 18,562$
109 40022 Other Services and Charges Inflation 767,840$ 714,705$ 731,858$ 749,422$ 767,409$ 785,826$ 804,686$
110 40022 Salary Recovery Inflation ‐$ ‐$ ‐$ ‐$ ‐$ ‐$ ‐$
111 40022 Non‐Capital Equipment Inflation 2,247$ 2,092$ 2,142$ 2,194$ 2,246$ 2,300$ 2,355$
112 40022 Capital Equipment Inflation 25,686$ 23,908$ 24,482$ 25,070$ 25,671$ 26,287$ 26,918$
113 40022 Subtotal 1,731,675$ 1,611,842$ 1,650,526$ 1,690,138$ 1,730,702$ 1,772,238$ 1,814,772$
114 40023 OPS Maintenance Operation Services ‐ Restoration 115 40023 Personnel Inflation 3,593,456$ 3,344,785$ 3,425,060$ 3,507,262$ 3,591,436$ 3,677,630$ 3,765,894$
116 40023 Supplies Inflation 844,897$ 786,429$ 805,304$ 824,631$ 844,422$ 864,688$ 885,441$

6. 25%/35% of Maximum Impact Fee 35.0% 35.9% 36.8% 37.7% 38.6%
1,199.11$ 1,621.63$ 1,662.17$ 1,703.73$ 1,746.32$ 1,789.98$
Houston Combined Utility System 4,633.24$
Wastewater Operations & MaintenanceProposed Budget Forecasted ‐‐‐‐‐>
Line
No. Cost Center 5‐Year Average FYE 2021 FYE 2022 FYE 2023 FYE 2024 FYE 2025 FYE 2026
117 40023 Other Services and Charges Inflation 1,946,490$ 1,811,791$ 1,855,274$ 1,899,801$ 1,945,396$ 1,992,085$ 2,039,895$
118 40023 Salary Recovery Inflation ‐$ ‐$ ‐$ ‐$ ‐$ ‐$ ‐$
119 40023 Non‐Capital Equipment Inflation 4,602$ 4,284$ 4,386$ 4,492$ 4,599$ 4,710$ 4,823$
120 40023 Capital Equipment Inflation 2,408$ 2,241$ 2,295$ 2,350$ 2,407$ 2,464$ 2,524$
121 40023 Capital Equipment‐CP Capital Inflation ‐$ ‐$ ‐$ ‐$ ‐$ ‐$ ‐$
122 40023 Subtotal 6,391,854$ 5,949,531$ 6,092,319$ 6,238,535$ 6,388,260$ 6,541,578$ 6,698,576$
123 40024 OPS Maintenance Operation Services‐COS/DIS 124 40024 Personnel Inflation 1,262,591$ 1,175,218$ 1,203,423$ 1,232,305$ 1,261,881$ 1,292,166$ 1,323,178$
125 40024 Supplies Inflation 4,548$ 4,234$ 4,335$ 4,439$ 4,546$ 4,655$ 4,767$
126 40024 Other Services and Charges Inflation 187,933$ 174,928$ 179,126$ 183,425$ 187,828$ 192,335$ 196,952$
127 40024 Salary Recovery Inflation ‐$ ‐$ ‐$ ‐$ ‐$ ‐$ ‐$
128 40024 Non‐Capital Equipment Inflation 7,278$ 6,774$ 6,937$ 7,103$ 7,274$ 7,448$ 7,627$
129 40024 Capital Equipment Inflation ‐$ ‐$ ‐$ ‐$ ‐$ ‐$ ‐$
130 40024 Subtotal 1,462,350$ 1,361,154$ 1,393,822$ 1,427,273$ 1,461,528$ 1,496,605$ 1,532,523$
131 40025 HW GIS Services 132 40025 Personnel Inflation 1,186,796$ 1,104,669$ 1,131,181$ 1,158,329$ 1,186,129$ 1,214,596$ 1,243,746$
133 40025 Supplies Inflation 5,886$ 5,479$ 5,610$ 5,745$ 5,883$ 6,024$ 6,169$
134 40025 Other Services and Charges Inflation 552,455$ 514,225$ 526,566$ 539,204$ 552,145$ 565,396$ 578,966$
135 40025 Salary Recovery Inflation ‐$ ‐$ ‐$ ‐$ ‐$ ‐$ ‐$
136 40025 Non‐Capital Equipment Inflation 23,385$ 21,766$ 22,289$ 22,824$ 23,371$ 23,932$ 24,507$
137 40025 Capital Equipment Inflation 6,154$ 5,728$ 5,865$ 6,006$ 6,150$ 6,298$ 6,449$
138 40025 Subtotal 1,774,676$ 1,651,867$ 1,691,512$ 1,732,108$ 1,773,678$ 1,816,247$ 1,859,837$
139 40026 OPS Executive Support140 40026 Personnel Inflation 236,318$ 219,964$ 225,243$ 230,649$ 236,185$ 241,853$ 247,658$
141 40026 Supplies Inflation 3,318$ 3,088$ 3,162$ 3,238$ 3,316$ 3,395$ 3,477$
142 40026 Other Services and Charges Inflation 1,168,697$ 1,087,822$ 1,113,929$ 1,140,664$ 1,168,040$ 1,196,073$ 1,224,778$
143 40026 Salary Recovery Inflation ‐$ ‐$ ‐$ ‐$ ‐$ ‐$ ‐$
144 40026 Non‐Capital Equipment Inflation ‐$ ‐$ ‐$ ‐$ ‐$ ‐$ ‐$
145 40026 Capital Equipment Inflation ‐$ ‐$ ‐$ ‐$ ‐$ ‐$ ‐$
146 40026 Subtotal 1,408,332$ 1,310,874$ 1,342,335$ 1,374,551$ 1,407,540$ 1,441,321$ 1,475,913$
147 40027 OPS Support Services148 40027 Personnel Inflation 613,871$ 571,390$ 585,104$ 599,146$ 613,526$ 628,250$ 643,328$
149 40027 Supplies Inflation 2,622$ 2,441$ 2,499$ 2,559$ 2,621$ 2,683$ 2,748$
150 40027 Other Services and Charges Inflation 543,786$ 506,156$ 518,304$ 530,743$ 543,481$ 556,524$ 569,881$
151 40027 Salary Recovery Inflation ‐$ ‐$ ‐$ ‐$ ‐$ ‐$ ‐$
152 40027 Non‐Capital Equipment Inflation 25,686$ 23,908$ 24,482$ 25,070$ 25,671$ 26,287$ 26,918$
153 40027 Capital Equipment Inflation ‐$ ‐$ ‐$ ‐$ ‐$ ‐$ ‐$
154 40027 Subtotal 1,185,965$ 1,103,895$ 1,130,388$ 1,157,518$ 1,185,298$ 1,213,745$ 1,242,875$
155 40028 HW Infrastructure Planning156 40028 Personnel Inflation 1,033,653$ 962,124$ 985,215$ 1,008,860$ 1,033,072$ 1,057,866$ 1,083,255$

6. 25%/35% of Maximum Impact Fee 35.0% 35.9% 36.8% 37.7% 38.6%
1,199.11$ 1,621.63$ 1,662.17$ 1,703.73$ 1,746.32$ 1,789.98$
Houston Combined Utility System 4,633.24$
Wastewater Operations & MaintenanceProposed Budget Forecasted ‐‐‐‐‐>
Line
No. Cost Center 5‐Year Average FYE 2021 FYE 2022 FYE 2023 FYE 2024 FYE 2025 FYE 2026
157 40028 Supplies Inflation 3,104$ 2,889$ 2,958$ 3,029$ 3,102$ 3,176$ 3,253$
158 40028 Other Services and Charges Inflation 47,732$ 44,429$ 45,496$ 46,588$ 47,706$ 48,851$ 50,023$
159 40028 Salary Recovery Inflation ‐$ ‐$ ‐$ ‐$ ‐$ ‐$ ‐$
160 40028 Non‐Capital Equipment Inflation 46,341$ 43,134$ 44,170$ 45,230$ 46,315$ 47,427$ 48,565$
161 40028 Capital Equipment Inflation 15,304$ 14,245$ 14,587$ 14,937$ 15,296$ 15,663$ 16,039$
162 40028 Subtotal 1,146,135$ 1,066,821$ 1,092,425$ 1,118,643$ 1,145,491$ 1,172,983$ 1,201,134$
163 40029 HW Utility Analysis164 40029 Personnel Inflation 2,801,213$ 2,607,366$ 2,669,943$ 2,734,021$ 2,799,638$ 2,866,829$ 2,935,633$
165 40029 Supplies Inflation 6,635$ 6,176$ 6,325$ 6,476$ 6,632$ 6,791$ 6,954$
166 40029 Other Services and Charges Inflation 218,810$ 203,668$ 208,556$ 213,561$ 218,687$ 223,935$ 229,309$
167 40029 Salary Recovery Inflation ‐$ ‐$ ‐$ ‐$ ‐$ ‐$ ‐$
168 40029 Non‐Capital Equipment Inflation 51,532$ 47,966$ 49,117$ 50,296$ 51,503$ 52,739$ 54,005$
169 40029 Capital Equipment Inflation 48,161$ 44,828$ 45,904$ 47,005$ 48,134$ 49,289$ 50,472$
170 40029 Subtotal 3,126,350$ 2,910,003$ 2,979,843$ 3,051,360$ 3,124,592$ 3,199,583$ 3,276,373$
171 OPS Subtotal 21,268,546$ 19,796,740$ 20,271,862$ 20,758,386$ 21,256,588$ 21,766,746$ 22,289,148$
19,796,740$
172 Houston Water Division 237,763,884$ 221,450,620$ 226,716,771$ 232,108,653$ 237,631,032$ 243,286,551$ 249,076,412$
173 Check: W&WW CC w/EPA
174 EXPENSES Other O&M
175 30001‐30009 Director's Office176 30001‐30009 Personnel Inflation 3,849,028$ 3,582,671$ 3,668,655$ 3,756,703$ 3,846,864$ 3,939,189$ 4,033,729$
177 30001‐30009 Supplies Inflation 26,007$ 24,207$ 24,788$ 25,383$ 25,992$ 26,616$ 27,255$
178 30001‐30009 Other Services and Charges Inflation 254,716$ 237,089$ 242,779$ 248,606$ 254,573$ 260,683$ 266,939$
179 30001‐30009 Indirect Cost Recovery Inflation ‐$ ‐$ ‐$ ‐$ ‐$ ‐$ ‐$
180 30001‐30009 Non‐Capital Equipment Inflation 11,291$ 10,510$ 10,762$ 11,020$ 11,285$ 11,555$ 11,833$
181 30001‐30009 Capital Equipment Inflation ‐$ ‐$ ‐$ ‐$ ‐$ ‐$ ‐$
182 30001‐30009 Subtotal 4,141,042$ 3,854,477$ 3,946,985$ 4,041,712$ 4,138,713$ 4,238,042$ 4,339,756$
183 80001 Information Technology184 80001 Personnel Inflation 4,455,635$ 4,147,300$ 4,246,835$ 4,348,759$ 4,453,129$ 4,560,005$ 4,669,445$
185 80001 Supplies Inflation 160,803$ 149,675$ 153,267$ 156,946$ 160,712$ 164,570$ 168,519$
186 80001 Other Services and Charges Inflation 4,928,754$ 4,587,679$ 4,697,783$ 4,810,530$ 4,925,983$ 5,044,206$ 5,165,267$
187 80001 Indirect Cost Recovery Inflation ‐$ ‐$ ‐$ ‐$ ‐$ ‐$ ‐$
188 80001 Non‐Capital Equipment Inflation 406,796$ 378,646$ 387,733$ 397,039$ 406,568$ 416,325$ 426,317$
189 80001 Capital Equipment Inflation 550,368$ 512,282$ 524,577$ 537,167$ 550,059$ 563,260$ 576,779$
190 80001 Subtotal 10,502,356$ 9,775,582$ 10,010,196$ 10,250,441$ 10,496,451$ 10,748,366$ 11,006,327$
191 90001‐90011 Management Support192 90001‐90011 Personnel Inflation 1,859,620$ 1,730,933$ 1,772,475$ 1,815,014$ 1,858,575$ 1,903,181$ 1,948,857$
193 90001‐90011 Supplies Inflation 125,967$ 117,250$ 120,064$ 122,945$ 125,896$ 128,917$ 132,011$
194 90001‐90011 Other Services and Charges Inflation 4,897,500$ 4,558,588$ 4,667,994$ 4,780,026$ 4,894,746$ 5,012,220$ 5,132,514$

6. 25%/35% of Maximum Impact Fee 35.0% 35.9% 36.8% 37.7% 38.6%
1,199.11$ 1,621.63$ 1,662.17$ 1,703.73$ 1,746.32$ 1,789.98$
Houston Combined Utility System 4,633.24$
Wastewater Operations & MaintenanceProposed Budget Forecasted ‐‐‐‐‐>
Line
No. Cost Center 5‐Year Average FYE 2021 FYE 2022 FYE 2023 FYE 2024 FYE 2025 FYE 2026
195 90001‐90011 Salary Recovery Inflation ‐$ ‐$ ‐$ ‐$ ‐$ ‐$ ‐$
196 90001‐90011 Non‐Capital Equipment Inflation 112,696$ 104,897$ 107,415$ 109,993$ 112,632$ 115,336$ 118,104$
197 90001‐90011 Capital Equipment Inflation 205,218$ 191,016$ 195,601$ 200,295$ 205,102$ 210,025$ 215,065$
198 90001‐90011 Subtotal 7,201,000$ 6,702,684$ 6,863,548$ 7,028,273$ 7,196,952$ 7,369,679$ 7,546,551$
199 60005 & 60008 Houston Water ‐ Planning200 60005 & 60008 Personnel Inflation 120,468$ 112,132$ 114,823$ 117,579$ 120,401$ 123,290$ 126,249$
201 60005 & 60008 Supplies Inflation ‐$ ‐$ ‐$ ‐$ ‐$ ‐$ ‐$
202 60005 & 60008 Other Services and Charges Inflation ‐$ ‐$ ‐$ ‐$ ‐$ ‐$ ‐$
203 60005 & 60008 Indirect Cost Recovery Inflation ‐$ ‐$ ‐$ ‐$ ‐$ ‐$ ‐$
204 60005 & 60008 Non‐Capital Equipment Inflation ‐$ ‐$ ‐$ ‐$ ‐$ ‐$ ‐$
205 60005 & 60008 Capital Equipment Inflation 160,535$ 149,426$ 153,012$ 156,685$ 160,445$ 164,296$ 168,239$
206 60005 & 60008 Subtotal 281,004$ 261,558$ 267,835$ 274,263$ 280,846$ 287,586$ 294,488$
207
50002,50005,5
0006,50030 Financial Mangt Services Support208 50002,50005,500 Personnel Inflation 6,760,978$ 6,293,111$ 6,444,146$ 6,598,805$ 6,757,177$ 6,919,349$ 7,085,413$
209 50002,50005,500 Supplies Inflation 449,820$ 418,692$ 428,740$ 439,030$ 449,567$ 460,357$ 471,405$
210 50002,50005,500 Other Services and Charges Inflation 5,725,812$ 5,329,579$ 5,457,489$ 5,588,469$ 5,722,592$ 5,859,935$ 6,000,573$
211 50002,50005,500 Indirect Cost Recovery Payment Inflation 5,085,008$ 4,733,120$ 4,846,715$ 4,963,036$ 5,082,149$ 5,204,121$ 5,329,020$
212 50002,50005,500 Other Indirect Costs Inflation 6,074,708$ 5,654,332$ 5,790,036$ 5,928,997$ 6,071,293$ 6,217,004$ 6,366,212$
213 50002,50005,500 Pension DS 1,233,630$ 1,208,138$ 1,216,357$ 1,224,494$ 1,233,291$ 1,242,557$ 1,251,452$
214 50002,50005,500 Non‐Capital Equipment Inflation 38,047$ 35,414$ 36,264$ 37,134$ 38,025$ 38,938$ 39,873$
215 50002,50005,500 Capital Equipment Inflation 254,930$ 237,289$ 242,984$ 248,815$ 254,787$ 260,902$ 267,163$
216 50002,50005,500 Subtotal 25,622,933$ 23,909,675$ 24,462,732$ 25,028,781$ 25,608,881$ 26,203,161$ 26,811,110$
217
100007‐15,
100025 CAS ‐ Customer Account Services218 100007‐15, 100025 Personnel Inflation 16,387,266$ 15,253,250$ 15,619,328$ 15,994,192$ 16,378,053$ 16,771,126$ 17,173,633$
219 100007‐15, 100025 Supplies Inflation 1,817,848$ 1,692,051$ 1,732,660$ 1,774,244$ 1,816,826$ 1,860,430$ 1,905,080$
220 100007‐15, 100025 Other Services and Charges Inflation 5,037,704$ 4,689,089$ 4,801,628$ 4,916,867$ 5,034,872$ 5,155,708$ 5,279,445$
221 100007‐15, 100025 Salary Recovery Inflation ‐$ ‐$ ‐$ ‐$ ‐$ ‐$ ‐$
222 100007‐15, 100025 Non‐Capital Equipment Inflation 98,515$ 91,698$ 93,899$ 96,152$ 98,460$ 100,823$ 103,243$
223 100007‐15, 100025 Capital Equipment Inflation 3,074,143$ 2,861,410$ 2,930,083$ 3,000,405$ 3,072,415$ 3,146,153$ 3,221,661$
224 100007‐15, 100025 Subtotal 26,415,477$ 24,587,498$ 25,177,598$ 25,781,860$ 26,400,625$ 27,034,240$ 27,683,062$
225 Deductions Deductions226 Deductions HPW Allocated Recovery Inflation (3,285,461)$ (3,058,104)$ (3,131,499)$ (3,206,654)$ (3,283,614)$ (3,362,421)$ (3,443,119)$
227 Deductions 611 Walker Facility Rental Fees Inflation (1,258,168)$ (1,171,102)$ (1,199,208)$ (1,227,989)$ (1,257,461)$ (1,287,640)$ (1,318,543)$
228 Deductions Subtotal (4,543,630)$ (4,229,206)$ (4,330,707)$ (4,434,644)$ (4,541,075)$ (4,650,061)$ (4,761,663)$
229 Other Subtotal 69,620,182$ 64,862,268$ 66,398,187$ 67,970,687$ 69,581,393$ 71,231,013$ 72,919,631$

6. 25%/35% of Maximum Impact Fee 35.0% 35.9% 36.8% 37.7% 38.6%
1,199.11$ 1,621.63$ 1,662.17$ 1,703.73$ 1,746.32$ 1,789.98$
Houston Combined Utility System 4,633.24$
Wastewater Operations & MaintenanceProposed Budget Forecasted ‐‐‐‐‐>
Line
No. Cost Center 5‐Year Average FYE 2021 FYE 2022 FYE 2023 FYE 2024 FYE 2025 FYE 2026
230 TOTAL O&M, CAPITAL, EXPENSES 307,384,066$ 286,312,888$ 293,114,958$ 300,079,340$ 307,212,425$ 314,517,564$ 321,996,042$

WATER AND WASTEWATER COST OF SERVICE RATE STUDY | CITY OF HOUSTON
DRAFT | APRIL
Appendix C
WATER REVENUE REQUIREMENTS

Houston Combined Utility System
Water Revenue Requirements
Line
No. FYE 2021 FYE 2022 FYE 2023 FYE 2024 FYE 2025 FYE 2026
1 Water Revenue Requirements50% 50% 50% 50% 50% 50%
2 CUS Fund Balance
3 Beginning Fund Balance 1,010,798,945$ 931,974,135$ 793,721,882$ 719,415,340$ 665,980,306$ 610,370,701$
4 Ending Fund Balance 931,974,135$ 793,721,882$ 719,415,340$ 665,980,306$ 610,370,701$ 563,843,889$
5 CUS Fund Balance Applied to Water 518,101,685$ 459,564,926$ 420,428,014$ 404,735,170$ 371,901,945$ 328,808,816$
6 Cash Flow / Reserves Test
7 Revenues8 Operating
9 Water Sales 598,722,887$ 608,919,138$ 731,554,234$ 806,319,077$ 856,407,618$ 909,607,659$
10 Water Service Penalties 5,500,000$ 5,643,000$ 5,789,718$ 5,940,251$ 6,094,697$ 6,253,159$ 11 Other Water Operating Revenue (Non rate) 1,333,971$ 1,365,986$ 1,398,770$ 1,432,341$ 1,466,717$ 1,501,918$
12 Total Operating Revenues 605,556,858$ 615,928,124$ 738,742,722$ 813,691,668$ 863,969,032$ 917,362,737$
13 Non Operating
14 Impact Fee Revenue 9,935,341$ 20,376,481$ 20,927,631$ 25,792,483$ 26,490,160$ 31,741,129$
15 Operating transfer from General Purpose Fund ‐$ ‐$ ‐$ ‐$ ‐$ ‐$
16 Non Operating Water Revenue (Non rate) 8,298,357$ 8,497,518$ 8,701,458$ 8,910,293$ 9,124,140$ 9,343,120$
17 Interest 5,665,595$ 5,181,017$ 4,595,649$ 4,204,280$ 4,047,352$ 3,719,019$
18 Total Non‐Operating Revenues 23,899,293$ 34,055,016$ 34,224,738$ 38,907,056$ 39,661,652$ 44,803,268$
19 Total Water Revenues 629,456,152$ 649,983,140$ 772,967,460$ 852,598,724$ 903,630,684$ 962,166,005$
20 Expenses21 Operating
22 EXPENSES Drinking Water Operations 157,914,660$ 160,683,502$ 167,707,754$ 178,257,721$ 186,962,823$ 207,363,751$
23 River Authority Contributed Debt Service 48,035,697$ 49,142,663$ 50,207,980$ 51,368,485$ 52,554,826$ 53,777,331$
24 EXPENSES Operation Services ‐ Houston Water G&A 19,948,817$ 20,427,588$ 20,917,850$ 21,419,878$ 21,933,955$ 22,460,370$
25 EXPENSES Other O&M 65,360,532$ 66,908,249$ 68,492,829$ 70,115,909$ 71,778,201$ 73,479,790$
26 Total Operating Expenses 291,259,705$ 297,162,002$ 307,326,412$ 321,161,993$ 333,229,805$ 357,081,242$
27 Non‐Operating Expenses
28 Junior Bonds 9,902,764$ 6,841,990$ 7,666,299$ 8,400,001$ 7,951,382$ 8,024,310$
29 First Lien 217,849,867$ 229,957,965$ 229,548,705$ 228,811,982$ 229,153,919$ 226,785,989$
30 Future First Lien Debt Service 12,996,403$ 45,358,373$ 80,932,947$ 110,114,881$ 143,421,785$ 181,832,374$

Houston Combined Utility System
Water Revenue Requirements
Line
No. FYE 2021 FYE 2022 FYE 2023 FYE 2024 FYE 2025 FYE 2026
31 Future First Lien Debt Service ‐ NEWPP ‐$ ‐$ 13,271,200$ 22,848,511$ 22,848,511$ 22,848,511$
32 TRA/Lake Livingston Dam 1,813,585$ 1,813,585$ 1,813,585$ 1,813,585$ 1,813,585$ 1,813,585$
33 Subordinate Lien 22,817,930$ 24,224,844$ 24,209,476$ 24,199,938$ 24,185,621$ 24,180,953$
34 Luce Bayou 4,278,954$ 4,829,498$ 5,527,270$ 6,273,797$ 7,316,090$ 8,365,596$
35 Commercial Paper Debt Service 4,003,795$ 4,722,160$ 6,004,806$ 4,334,928$ 5,671,235$ 6,282,795$
36 Commercial Paper Fees 1,750,000$ 2,100,000$ 2,100,000$ 2,450,000$ 2,450,000$ 2,450,000$
37 Bad Debt 11,974,458$ 12,178,383$ 14,631,085$ 16,126,382$ 17,128,152$ 18,192,153$
38 Cash Funded CIP ‐$ 110,794,138$ 97,478,227$ 93,786,276$ 114,097,796$ 121,026,899$
39 Total Non‐Operating Expenses 287,387,755$ 442,820,933$ 483,183,600$ 519,160,279$ 576,038,075$ 621,803,165$
40 Total Expenses 578,647,460$ 739,982,936$ 790,510,012$ 840,322,272$ 909,267,880$ 978,884,407$
41 Total Expenditures for Cash Flow Test 578,647,460$ 739,982,936$ 790,510,012$ 840,322,272$ 909,267,880$ 978,884,407$
42 Cash Flow Surplus (Deficit) 50,808,692$ (89,999,795)$ (17,542,552)$ 12,276,452$ (5,637,196)$ (16,718,403)$
43 Cash Flow Surplus (Deficit) with Reserves 277,286,643$ (39,488,279)$ 77,342,314$ 74,654,177$ 20,205,419$ (27,831,080)$
44 Debt Coverage Test
45 Junior Lien46 Gross Revenues 619,520,811$ 629,606,659$ 752,039,830$ 826,806,242$ 877,140,524$ 930,424,876$
47 Less: O&M (291,259,705)$ (297,162,002)$ (307,326,412)$ (321,161,993)$ (333,229,805)$ (357,081,242)$
46 Less: Bad Debt (11,974,458)$ (12,178,383)$ (14,631,085)$ (16,126,382)$ (17,128,152)$ (18,192,153)$
48 Plus: Total Capital Equipment included (8305) 10,318,158$ 10,565,794$ 10,819,373$ 11,079,038$ 11,344,934$ 11,617,213$
49 Plus: Total Service in 8305 1,421,518$ 1,455,635$ 1,490,570$ 1,526,344$ 1,562,976$ 1,600,487$
50 Plus: PIB Debt 5,049,600$ 3,805,697$ 3,805,542$ 2,548,047$ 2,547,168$ ‐$
51 Plus: Wallisville & Allens' Creek DS 1,912,097$ 1,912,097$ 1,843,880$ 1,843,646$ 1,841,391$ 1,846,774$
52 Plus: Pension DS 4,047,235$ 4,074,770$ 4,102,026$ 4,131,497$ 4,162,538$ 4,192,335$
51 Plus: CWA Debt Service 6,398,700$ 6,552,269$ 6,709,523$ 6,870,552$ 7,035,445$ 7,204,296$
52 Less: Deduction of Allocated recovery (4,261,694)$ (4,363,975)$ (4,468,710)$ (4,575,959)$ (4,685,782)$ (4,798,241)$
53 Net Revenue Available for Junior Lien 341,172,262$ 344,268,560$ 454,384,536$ 512,941,032$ 550,591,237$ 576,814,344$
54 Junior Lien Debt Service 9,902,764$ 6,841,990$ 7,666,299$ 8,400,001$ 7,951,382$ 8,024,310$
55 Junior Lien Coverage Ratio 34.45x 50.32x 59.27x 61.06x 69.24x 71.88x
56 Junior Lien Coverage Surplus / (Deficit) 327,308,393$ 334,689,774$ 443,651,717$ 501,181,030$ 539,459,302$ 565,580,309$
57 First Lien58 Net Revenues Available 341,172,262$ 344,268,560$ 454,384,536$ 512,941,032$ 550,591,237$ 576,814,344$

Houston Combined Utility System
Water Revenue Requirements
Line
No. FYE 2021 FYE 2022 FYE 2023 FYE 2024 FYE 2025 FYE 2026
59 Less: Junior Lien Debt Service (9,902,764)$ (6,841,990)$ (7,666,299)$ (8,400,001)$ (7,951,382)$ (8,024,310)$
60 Plus: Restricted Revenues 9,935,341$ 20,376,481$ 20,927,631$ 25,792,483$ 26,490,160$ 31,741,129$
61 Net Revenue Available for First Lien 341,204,839$ 357,803,052$ 467,645,867$ 530,333,514$ 569,130,015$ 600,531,162$
62 First Lien Debt Service 230,846,270$ 275,316,338$ 323,752,853$ 361,775,374$ 395,424,215$ 431,466,873$
63 First Lien Coverage 1.48x 1.30x 1.44x 1.47x 1.44x 1.39x
64 First Lien Coverage Surplus / (Deficit) 18,020,061$ (27,639,822)$ 14,391,873$ 23,847,990$ 15,536,114$ (3,522,460)$
65 Second Lien66 Net Revenues Available 341,204,839$ 357,803,052$ 467,645,867$ 530,333,514$ 569,130,015$ 600,531,162$
67 Less: First Lien Debt Service (230,846,270)$ (275,316,338)$ (323,752,853)$ (361,775,374)$ (395,424,215)$ (431,466,873)$
68 Plus: Restricted Revenues
69 Revenues Available for Second Lien 110,358,569$ 82,486,713$ 143,893,014$ 168,558,139$ 173,705,800$ 169,064,289$
70 Second Lien Debt Service ‐$ ‐$ ‐$ ‐$ ‐$ ‐$
71 Second Lien Coverage NA NA NA NA NA NA
72 Second Lien Coverage Surplus / (Deficit) 110,358,569$ 82,486,713$ 143,893,014$ 168,558,139$ 173,705,800$ 169,064,289$
73 Total Debt Coverage74 Net Revenues Available 341,172,262$ 344,268,560$ 454,384,536$ 512,941,032$ 550,591,237$ 576,814,344$
75 Plus: Restricted Revenues 9,935,341$ 20,376,481$ 20,927,631$ 25,792,483$ 26,490,160$ 31,741,129$
76 Revenues Available for Total Debt Coverage 351,107,603$ 364,645,041$ 475,312,167$ 538,733,515$ 577,081,397$ 608,555,473$
77 Junior Lien Debt Service 9,902,764$ 6,841,990$ 7,666,299$ 8,400,001$ 7,951,382$ 8,024,310$
78 First Lien Debt Service 230,846,270$ 275,316,338$ 310,481,653$ 338,926,863$ 372,575,704$ 408,618,363$
79 First Lien Debt Service ‐ NEWPP ‐$ ‐$ 13,271,200$ 22,848,511$ 22,848,511$ 22,848,511$
80 Third Lien Debt Service 5,753,795$ 6,822,160$ 8,104,806$ 6,784,928$ 8,121,235$ 8,732,795$
81 Subordinate Lien Debt Service 29,008,980$ 30,966,438$ 31,580,626$ 32,317,381$ 33,343,102$ 34,393,324$
82 Other Debt Service Payments 13,165,296$ 11,921,708$ 11,918,845$ 10,470,616$ 10,647,987$ 8,342,042$
83 Total Debt Service 288,677,104$ 331,868,633$ 383,023,429$ 419,748,300$ 455,487,921$ 490,959,344$
84 Junior + First + Second Coverage Ratio (1.4x) 1.46x 1.29x 1.43x 1.46x 1.43x 1.38x
85 Second Lien Coverage Surplus / (Deficit) 14,058,956$ (30,376,618)$ 11,325,354$ 20,487,989$ 12,355,561$ (6,732,184)$
86 Junior + First Coverage Ratio (1.4x) 1.46x 1.29x 1.43x 1.46x 1.43x 1.38x
87 First Lien Coverage Surplus / (Deficit) 14,058,956$ (30,376,618)$ 29,905,034$ 52,475,904$ 44,343,476$ 25,255,731$

Houston Combined Utility System
Water Revenue Requirements
Line
No. FYE 2021 FYE 2022 FYE 2023 FYE 2024 FYE 2025 FYE 2026
88 Revenue Requirement Calculation
89 Surplus (Shortfall) ‐ Pre Increase 14,058,956$ (39,488,279)$ 11,325,354$ 20,487,989$ 12,355,561$ (27,831,080)$
Surplus Need Cash Flow Surplus Surplus Surplus Need Cash Flow
90 Month of Revenue Adjustment 1 April July April April April April
91 Rate Revenue before Increase 1 598,722,887$ 608,919,138$ 731,554,234$ 806,319,077$ 856,407,618$ 909,607,659$
92 Calculated Revenue Increase 0.0% 7.0% 0.0% 0.0% 0.0% 12.0%
93 Revenue Increase 1 Override 1.5% 9.0% 10.0% 6.0% 6.0% 6.0%
94 Utilized Revenue Increase 1 1.5% 9.0% 10.0% 6.0% 6.0% 6.0%
95 Resulting Cash Flows following Revenue Adjustment 1
96 Revenues before rate adjustment 1 598,722,887$ 608,919,138$ 731,554,234$ 806,319,077$ 856,407,618$ 909,607,659$
97 Revenues from revenue adjustment 1 8,980,843$ 54,802,722$ 73,155,423$ 48,379,145$ 51,384,457$ 54,576,460$
98 Less: Revenue Increase Delay (6,670,072)$ ‐$ (54,332,533)$ (35,931,191)$ (38,163,236)$ (40,533,937)$
99 Other revenues 30,733,265$ 41,064,002$ 41,413,226$ 46,279,647$ 47,223,066$ 52,558,345$
100 Less Expenditures (from Cash Flow) (578,647,460)$ (739,982,936)$ (790,510,012)$ (840,322,272)$ (909,267,880)$ (978,884,407)$
101 Cash Flow 53,119,463$ (35,197,073)$ 1,280,338$ 24,724,406$ 7,584,025$ (2,675,879)$
102 First Lien Coverage 1.468x 1.487x 1.491x 1.489x 1.463x 1.417x
103 Month of COS Revenue Adjustment April
104 Rate Revenue before Increase 2 601,033,658$ 663,721,860$ 750,377,125$ 818,767,031$ 869,628,839$ 923,650,182$
105 Calculated Revenue Increase 0.0% 0.0% 0.0% 0.0% 0.0% 6.0%
106 Revenue Increase 2 Override 0.0% 10.0% 0.0% 0.0% 0.0% 0.0%
107 Utilized Revenue Increase 2 0.0% 10.0% 0.0% 0.0% 0.0% 0.0%
108 Cumulative Increase 1.5% 21.7% 33.9% 41.9% 50.4% 59.4%
109 Resulting Cash Flows following Revenue Adjustment 2
110 Revenues before revenue adjustment 2 601,033,658$ 663,721,860$ 750,377,125$ 818,767,031$ 869,628,839$ 923,650,182$
111 Revenues from revenue adjustment 2 ‐$ 66,372,186$ ‐$ ‐$ ‐$ ‐$
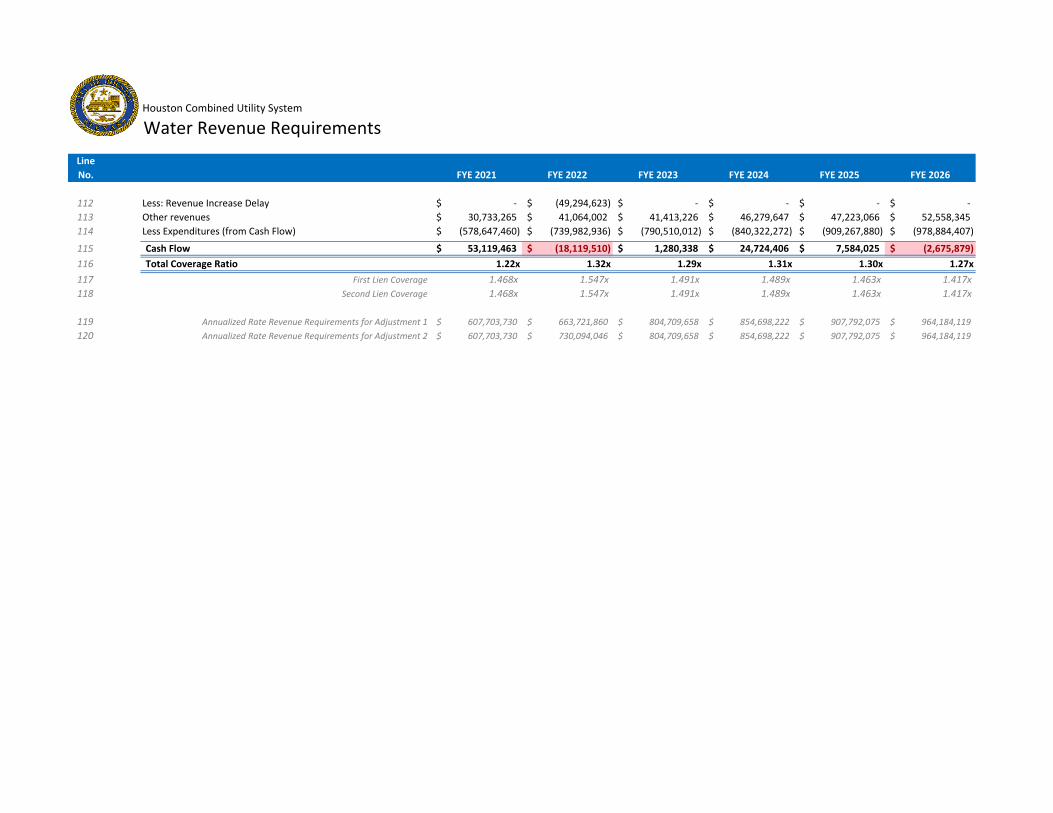
Houston Combined Utility System
Water Revenue Requirements
Line
No. FYE 2021 FYE 2022 FYE 2023 FYE 2024 FYE 2025 FYE 2026
112 Less: Revenue Increase Delay ‐$ (49,294,623)$ ‐$ ‐$ ‐$ ‐$
113 Other revenues 30,733,265$ 41,064,002$ 41,413,226$ 46,279,647$ 47,223,066$ 52,558,345$
114 Less Expenditures (from Cash Flow) (578,647,460)$ (739,982,936)$ (790,510,012)$ (840,322,272)$ (909,267,880)$ (978,884,407)$
115 Cash Flow 53,119,463$ (18,119,510)$ 1,280,338$ 24,724,406$ 7,584,025$ (2,675,879)$
116 Total Coverage Ratio 1.22x 1.32x 1.29x 1.31x 1.30x 1.27x
117 First Lien Coverage 1.468x 1.547x 1.491x 1.489x 1.463x 1.417x
118 Second Lien Coverage 1.468x 1.547x 1.491x 1.489x 1.463x 1.417x
119 Annualized Rate Revenue Requirements for Adjustment 1 607,703,730$ 663,721,860$ 804,709,658$ 854,698,222$ 907,792,075$ 964,184,119$
120 Annualized Rate Revenue Requirements for Adjustment 2 607,703,730$ 730,094,046$ 804,709,658$ 854,698,222$ 907,792,075$ 964,184,119$

WATER AND WASTEWATER COST OF SERVICE RATE STUDY | CITY OF HOUSTON
DRAFT | APRIL
Appendix D
WASTEWATER REVENUE REQUIREMENTS

Houston Combined Utility System
Wastewater Revenue Requirements
Line
No. FYE 2021 FYE 2022 FYE 2023 FYE 2024 FYE 2025 FYE 2026
1 Wastewater Revenue Requirements50% 50% 50% 50% 50% 50%
2 CUS Fund Balances
3 Beginning Fund Balance 1,010,798,945$ 931,974,135$ 793,721,882$ 719,415,340$ 665,980,306$ 610,370,701$
4 Ending Fund Balance 931,974,135$ 793,721,882$ 719,415,340$ 665,980,306$ 610,370,701$ 563,843,889$
5 CUS Fund Balance Applied to Wastewater 413,872,450$ 334,156,956$ 298,987,326$ 261,245,136$ 238,468,756$ 235,035,073$
6 Cash Flow Test
7 Revenues8 Operating
9 Wastewater system user charges 515,679,089$ 524,461,104$ 750,428,317$ 797,044,924$ 846,557,355$ 899,145,498$
10 Sewer Service Penalties 5,500,000$ 5,643,000$ 5,789,718$ 5,940,251$ 6,094,697$ 6,253,159$
11 Other Wastewater Revenue (Non rate) 1,468,101$ 1,503,335$ 1,539,415$ 1,576,361$ 1,614,194$ 1,652,935$
12 Total Operating Revenues 522,647,190$ 531,607,439$ 757,757,451$ 804,561,536$ 854,266,246$ 907,051,592$
13 Non Operating
14 Impact Fee Revenue 15,064,659$ 20,413,608$ 20,965,787$ 21,532,984$ 22,115,410$ 22,713,657$
15 Operating transfer from General Purpose Fund ‐$ ‐$ ‐$ ‐$ ‐$ ‐$
16 Non‐Operating Other Wastewater Revenues (Non rate) 6,475,343$ 6,630,751$ 6,789,889$ 6,952,846$ 7,119,715$ 7,290,588$
17 Interest 5,622,405$ 4,138,724$ 3,341,570$ 2,989,873$ 2,612,451$ 2,384,688$
18 Total Non‐Operating Revenues 27,162,407$ 31,183,084$ 31,097,245$ 31,475,704$ 31,847,576$ 32,388,933$
19 Total Revenues 549,809,596$ 562,790,523$ 788,854,696$ 836,037,240$ 886,113,822$ 939,440,525$
20 Expenses21 Operating
22 Wastewater Operations 201,653,880$ 206,444,910$ 211,350,267$ 216,374,445$ 221,519,805$ 226,787,264$
23 Operation Services ‐ Houston Water G&A 19,796,740$ 20,271,862$ 20,758,386$ 21,256,588$ 21,766,746$ 22,289,148$
24 Other O&M 64,862,268$ 66,398,187$ 67,970,687$ 69,581,393$ 71,231,013$ 72,919,631$
25 Additional Consent Decree O&M ‐$ ‐$ ‐$ ‐$ ‐$ ‐$
26 Total Operating Expenses 286,312,888$ 293,114,958$ 300,079,340$ 307,212,425$ 314,517,564$ 321,996,042$
27 Non‐Operating
28 Junior Bonds 12,502,236$ 8,638,010$ 9,678,701$ 10,604,999$ 10,038,618$ 10,130,690$

Houston Combined Utility System
Wastewater Revenue Requirements
Line
No. FYE 2021 FYE 2022 FYE 2023 FYE 2024 FYE 2025 FYE 2026
29 First Lien 277,325,050$ 292,611,520$ 292,094,830$ 291,164,717$ 291,596,412$ 288,606,901$
30 Future First Lien Debt Service 11,209,671$ 37,873,271$ 70,338,784$ 106,102,623$ 154,527,394$ 191,231,117$
31 Second Lien Debt Service ‐$ ‐$ ‐$ ‐$ ‐$ ‐$
32 Subordinate Lien ‐$ ‐$ ‐$ ‐$ ‐$ ‐$
33 Commercial Paper Debt Service 3,496,205$ 3,715,340$ 3,370,194$ 5,977,572$ 5,578,765$ 4,967,205$
34 Commercial Paper Fees 1,750,000$ 2,100,000$ 2,100,000$ 2,450,000$ 2,450,000$ 2,450,000$
35 Bad Debt 10,313,582$ 10,489,222$ 15,008,566$ 15,940,898$ 16,931,147$ 17,982,910$
36 Cash Funded CIP ‐$ 89,205,862$ 102,521,773$ 106,213,724$ 85,902,204$ 78,973,101$
37 Total Non‐Operating Expenses 316,596,745$ 444,633,226$ 495,112,848$ 538,454,535$ 567,024,540$ 594,341,924$
38 Total Expenses 602,909,633$ 737,748,184$ 795,192,189$ 845,666,960$ 881,542,104$ 916,337,966$
39 Total Expenditures for Cash Flow Test 602,909,633$ 737,748,184$ 795,192,189$ 845,666,960$ 881,542,104$ 916,337,966$
40 Cash Flow Surplus (Deficit) (53,100,036)$ (174,957,661)$ (6,337,492)$ (9,629,720)$ 4,571,718$ 23,102,559$
41 Cash Flow Surplus (Deficit) with Reserves 173,377,915$ (124,446,144)$ 88,547,374$ 52,748,005$ 30,414,333$ 11,989,881$
42 Debt Coverage Test
43 Junior Lien44 Gross Revenues 534,744,937$ 542,376,915$ 767,888,909$ 814,504,256$ 863,998,412$ 916,726,867$
45 Less: O&M (286,312,888)$ (293,114,958)$ (300,079,340)$ (307,212,425)$ (314,517,564)$ (321,996,042)$
45 Less: Bad Debt (10,313,582)$ (10,489,222)$ (15,008,566)$ (15,940,898)$ (16,931,147)$ (17,982,910)$
46 Plus: Total Capital Equipment included (8305) 10,239,499$ 10,485,247$ 10,736,893$ 10,994,579$ 11,258,448$ 11,528,651$
47 Plus: Total Service in 8305 1,410,682$ 1,444,538$ 1,479,207$ 1,514,708$ 1,551,061$ 1,588,286$
48 Plus: PIB Debt ‐$ ‐$ ‐$ ‐$ ‐$ ‐$
49 Plus: Wallisville & Allens' Creek DS ‐$ ‐$ ‐$ ‐$ ‐$ ‐$
50 Plus: Pension DS 4,037,955$ 4,065,426$ 4,092,620$ 4,122,023$ 4,152,993$ 4,182,721$
49 Plus: CWA Debt Service ‐$ ‐$ ‐$ ‐$ ‐$ ‐$
50 Less: Deduction of Allocated recovery (4,229,206)$ (4,330,707)$ (4,434,644)$ (4,541,075)$ (4,650,061)$ (4,761,663)$
51 Plus: EPA Consent Decree Reimbursed by Fund 8305 33,999,997$ 34,815,997$ 35,651,581$ 36,507,219$ 37,383,392$ 38,280,593$
52 Net Revenue Available for Junior Lien 283,577,394$ 285,253,236$ 500,326,660$ 539,948,386$ 582,245,534$ 627,566,505$
53 Junior Lien Debt Service 12,502,236$ 8,638,010$ 9,678,701$ 10,604,999$ 10,038,618$ 10,130,690$
54 Junior Lien Coverage Ratio 22.68x 33.02x 51.69x 50.91x 58.00x 61.95x
55 Junior Lien Coverage Surplus / (Deficit) 266,074,263$ 273,160,022$ 486,776,479$ 525,101,387$ 568,191,469$ 613,383,539$

Houston Combined Utility System
Wastewater Revenue Requirements
Line
No. FYE 2021 FYE 2022 FYE 2023 FYE 2024 FYE 2025 FYE 2026
56 First Lien57 Net Revenue Available 283,577,394$ 285,253,236$ 500,326,660$ 539,948,386$ 582,245,534$ 627,566,505$
58 Less: Junior Lien Debt Service (12,502,236)$ (8,638,010)$ (9,678,701)$ (10,604,999)$ (10,038,618)$ (10,130,690)$
59 Plus: Restricted Revenue 15,064,659$ 20,413,608$ 20,965,787$ 21,532,984$ 22,115,410$ 22,713,657$
60 Net Revenue Available for Junior Lien 286,139,817$ 297,028,834$ 511,613,746$ 550,876,371$ 594,322,326$ 640,149,472$
61 First Lien Debt Service 288,534,721$ 330,484,791$ 362,433,614$ 397,267,340$ 446,123,806$ 479,838,018$
62 First Lien Coverage 0.99x 0.90x 1.41x 1.39x 1.33x 1.33x
63 First Lien Coverage Surplus / (Deficit) (117,808,792)$ (165,649,873)$ 4,206,686$ (5,297,905)$ (30,251,002)$ (31,623,753)$
64 Total Debt Coverage65 Net Revenue Available 283,577,394$ 285,253,236$ 500,326,660$ 539,948,386$ 582,245,534$ 627,566,505$
66 Plus: Restricted Revenue 15,064,659$ 20,413,608$ 20,965,787$ 21,532,984$ 22,115,410$ 22,713,657$
67 Net Revenue Available 298,642,053$ 305,666,845$ 521,292,446$ 561,481,370$ 604,360,944$ 650,280,162$
68 Junior Lien Debt Service 12,502,236$ 8,638,010$ 9,678,701$ 10,604,999$ 10,038,618$ 10,130,690$
69 First Lien Debt Service 288,534,721$ 330,484,791$ 362,433,614$ 397,267,340$ 446,123,806$ 479,838,018$
70 Second Lien Debt Service ‐$ ‐$ ‐$ ‐$ ‐$ ‐$
71 Third Lien Debt Service 5,246,205$ 5,815,340$ 5,470,194$ 8,427,572$ 8,028,765$ 7,417,205$
72 Subordinate Lien Debt Service ‐$ ‐$ ‐$ ‐$ ‐$ ‐$
73 Other Debt Service Payments 8,115,696$ 8,116,011$ 8,113,304$ 7,922,569$ 8,100,819$ 8,342,042$
74 Total Debt Service 314,398,858$ 353,054,152$ 385,695,813$ 424,222,481$ 472,292,008$ 505,727,955$
75 Junior + First + Second Coverage Ratio (1.4x) 0.99x 0.90x 1.40x 1.38x 1.32x 1.33x
76 Second Lien Coverage Surplus / (Deficit) (122,809,687)$ (169,105,077)$ 335,206$ (9,539,905)$ (34,266,449)$ (35,676,029)$
77 Junior + First Coverage Ratio (1.4x) 0.99x 0.90x 1.40x 1.38x 1.32x 1.33x
78 First Lien Coverage Surplus / (Deficit) (122,809,687)$ (169,105,077)$ 335,206$ (9,539,905)$ (34,266,449)$ (35,676,029)$
79 Revenue Requirement Calculation
80 Surplus (Shortfall) ‐ Pre Increase (122,809,687)$ (169,105,077)$ 335,206$ (9,539,905)$ (34,266,449)$ (35,676,029)$
Need Additional
Coverage
Need Additional
CoverageSurplus
Need Additional
Coverage
Need Additional
Coverage
Need Additional
Coverage
81 Month of Revenue Adjustment 1 April July April April April April

Houston Combined Utility System
Wastewater Revenue Requirements
Line
No. FYE 2021 FYE 2022 FYE 2023 FYE 2024 FYE 2025 FYE 2026
82 Rate Revenue before Increase 1 515,679,089$ 524,461,104$ 750,428,317$ 797,044,924$ 846,557,355$ 899,145,498$
83 Calculated Revenue Increase 93.0% 33.0% 0.0% 5.0% 16.0% 16.0%
84 Revenue Increase 1 Override 1.5% 20.0% 6.0% 6.0% 6.0% 6.0%
85 Utilized Revenue Increase 1 1.5% 20.0% 6.0% 6.0% 6.0% 6.0%
86 Resulting Cash Flows following Revenue Adjustment 1
87 Revenues before revenue adjustment 1 515,679,089$ 524,461,104$ 750,428,317$ 797,044,924$ 846,557,355$ 899,145,498$
88 Revenues from revenue adjustment 1 7,735,186$ 104,892,221$ 45,025,699$ 47,822,695$ 50,793,441$ 53,948,730$
89 Less: Revenue Increase Delay (5,744,923)$ ‐$ (33,440,587)$ (35,517,916)$ (37,724,289)$ (40,067,722)$
90 Other revenues 34,130,507$ 38,329,419$ 38,426,379$ 38,992,316$ 39,556,467$ 40,295,027$
91 Less Expenditures (from Cash Flow) (602,909,633)$ (737,748,184)$ (795,192,189)$ (845,666,960)$ (881,542,104)$ (916,337,966)$
92 Cash Flow (51,109,773)$ (70,065,440)$ 5,247,620$ 2,675,060$ 17,640,870$ 36,983,567$
93 First Lien Coverage 0.999x 1.211x 1.432x 1.407x 1.354x 1.356x
94 Month of Revenue Adjustment 2 April
95 Rate Revenue before Increase 2 517,669,352$ 629,353,325$ 762,013,430$ 809,349,704$ 859,626,507$ 913,026,506$
96 Calculated Revenue Increase 91.0% 40.0% 0.0% 0.0% 10.0% 10.0%
97 Revenue Increase 2 Override 0.0% 19.0% 0.0% 0.0% 0.0% 0.0%
98 Utilized Revenue Increase 2 0.0% 19.0% 0.0% 0.0% 0.0% 0.0%
99 Cumulative Increase 1.5% 44.9% 53.6% 62.9% 72.6% 83.0%
100 Resulting Cash Flows following Revenue Adjustment 2
101 Revenues before revenue adjustment 2 517,669,352$ 629,353,325$ 762,013,430$ 809,349,704$ 859,626,507$ 913,026,506$
102 Revenues from revenue adjustment 2 ‐$ 119,577,132$ ‐$ ‐$ ‐$ ‐$
103 Less: Revenue Increase Delay ‐$ (88,809,936)$ ‐$ ‐$ ‐$ ‐$
104 Other revenues 34,130,507$ 38,329,419$ 38,426,379$ 38,992,316$ 39,556,467$ 40,295,027$
105 Less Expenditures (from Cash Flow) (602,909,633)$ (737,748,184)$ (795,192,189)$ (845,666,960)$ (881,542,104)$ (916,337,966)$
106 Cash Flow (51,109,773)$ (39,298,244)$ 5,247,620$ 2,675,060$ 17,640,870$ 36,983,567$
107 Total Coverage Ratio 0.96x 1.25x 1.38x 1.35x 1.31x 1.31x
108 First Lien Coverage 0.999x 1.301x 1.432x 1.407x 1.354x 1.356x
108 Second Lien Coverage 0.999x 1.301x 1.432x 1.407x 1.354x 1.356x

Houston Combined Utility System
Wastewater Revenue Requirements
Line
No. FYE 2021 FYE 2022 FYE 2023 FYE 2024 FYE 2025 FYE 2026
109 Annualized Rate Revenue Requirements for Adjustment 1 523,414,275$ 629,353,325$ 795,454,016$ 844,867,620$ 897,350,796$ 953,094,228$
110 Annualized Rate Revenue Requirements for Adjustment 2 523,414,275$ 748,930,456$ 795,454,016$ 844,867,620$ 897,350,796$ 953,094,228$

WATER AND WASTEWATER COST OF SERVICE RATE STUDY | CITY OF HOUSTON
DRAFT | APRIL
Appendix E
COMBINED UTILITY SYSTEM REVENUE
REQUIREMENTS

Houston Combined Utility System
Combined Revenue Requirements
Line No. FYE 2021 FYE 2022 FYE 2023 FYE 2024 FYE 2025 FYE 2026
1 Combined Revenue Requirements50% 50% 50% 50% 50% 50%
2 CUS Fund Balance
3 Beginning Fund Balance $1,010,798,945 $931,974,135 $793,721,882 $719,415,340 $665,980,306 $610,370,701
4 Planned Fund Balance $931,974,135 $793,721,882 $719,415,340 $665,980,306 $610,370,701 $563,843,889
5 CUS Fund Balance Applied to Water 518,101,685$ 459,564,926$ 420,428,014$ 404,735,170$ 371,901,945$ 328,808,816$
6 CUS Fund Balance Applied to Wastewater 413,872,450$ 334,156,956$ 298,987,326$ 261,245,136$ 238,468,756$ 235,035,073$
7 Cash Flow Test
8 Revenues9 Operating
10 Water Sales 598,722,887$ 608,919,138$ 731,554,234$ 806,319,077$ 856,407,618$ 909,607,659$
11 Sewer system user charges 515,679,089$ 524,461,104$ 750,428,317$ 797,044,924$ 846,557,355$ 899,145,498$
12 Penalties 11,000,000$ 11,286,000$ 11,579,436$ 11,880,501$ 12,189,394$ 12,506,319$ 13 Other Water Operating Revenue (Non rate) 2,802,072$ 2,869,322$ 2,938,185$ 3,008,702$ 3,080,911$ 3,154,853$
14 Total Operating Revenues 1,128,204,048$ 1,147,535,563$ 1,496,500,173$ 1,618,253,205$ 1,718,235,278$ 1,824,414,328$
15 Non‐Operating
16 Impact Fee Revenue 25,000,000$ 40,790,090$ 41,893,417$ 47,325,467$ 48,605,570$ 54,454,786$
17 Operating transfer from General Purpose Fund ‐$ ‐$ ‐$ ‐$ ‐$ ‐$
18 Non Operating Water Revenue (Non rate) 14,773,700$ 15,128,269$ 15,491,347$ 15,863,140$ 16,243,855$ 16,633,707$
19 Interest 11,288,000$ 9,319,741$ 7,937,219$ 7,194,153$ 6,659,803$ 6,103,707$
20 Total Non‐Operating Revenues 51,061,700$ 65,238,100$ 65,321,984$ 70,382,760$ 71,509,228$ 77,192,201$
21 Total Revenues 1,179,265,748$ 1,212,773,663$ 1,561,822,156$ 1,688,635,964$ 1,789,744,506$ 1,901,606,529$
22 Debt Coverage Revenues 1,154,265,748$ 1,171,983,574$ 1,519,928,739$ 1,641,310,498$ 1,741,138,936$ 1,847,151,743$
23 Expenses24 Operating
25 EXPENSES Drinking Water Operations 157,914,660$ 160,683,502$ 167,707,754$ 178,257,721$ 186,962,823$ 207,363,751$
26 River Authority Contributed Debt Service 48,035,697$ 49,142,663$ 50,207,980$ 51,368,485$ 52,554,826$ 53,777,331$
27 EXPENSES Wastewater Operations 201,653,880$ 206,444,910$ 211,350,267$ 216,374,445$ 221,519,805$ 226,787,264$
28 EXPENSES Operation Services ‐ G&A 39,745,557$ 40,699,450$ 41,676,236$ 42,676,466$ 43,700,701$ 44,749,518$
29 EXPENSES Other O&M 130,222,800$ 133,306,436$ 136,463,516$ 139,697,301$ 143,009,214$ 146,399,421$
30 Additional Consent Decree O&M ‐$ ‐$ ‐$ ‐$ ‐$ ‐$
31 Total Operating Expenses 577,572,593$ 590,276,960$ 607,405,753$ 628,374,418$ 647,747,369$ 679,077,285$

Houston Combined Utility System
Combined Revenue Requirements
Line No. FYE 2021 FYE 2022 FYE 2023 FYE 2024 FYE 2025 FYE 2026
32 Non‐Operating
33 Junior Bonds 22,405,000$ 15,480,000$ 17,345,000$ 19,005,000$ 17,990,000$ 18,155,000$
34 First Lien 495,174,917$ 522,569,484$ 521,643,535$ 519,976,699$ 520,750,330$ 515,392,890$
35 Future First Lien Debt Service 24,206,074$ 83,231,644$ 151,271,732$ 216,217,505$ 297,949,180$ 373,063,490$
36 Future First Lien Debt Service ‐ NEWPP ‐$ ‐$ 13,271,200$ 22,848,511$ 22,848,511$ 22,848,511$
37 TRA/Lake Livingston Dam 1,813,585$ 1,813,585$ 1,813,585$ 1,813,585$ 1,813,585$ 1,813,585$
38 Subordinate Lien 22,817,930$ 24,224,844$ 24,209,476$ 24,199,938$ 24,185,621$ 24,180,953$
39 Luce Bayou 4,278,954$ 4,829,498$ 5,527,270$ 6,273,797$ 7,316,090$ 8,365,596$
40 Commercial Paper Interest 7,500,000$ 8,437,500$ 9,375,000$ 10,312,500$ 11,250,000$ 11,250,000$
41 Commercial Paper Fees 3,500,000$ 4,200,000$ 4,200,000$ 4,900,000$ 4,900,000$ 4,900,000$
42 Bad Debt 22,288,040$ 22,667,605$ 29,639,651$ 32,067,280$ 34,059,299$ 36,175,063$
43 Cash Funded CIP ‐$ 200,000,000$ 200,000,000$ 200,000,000$ 200,000,000$ 200,000,000$
44 Total Non‐Operating Expenses 603,984,499$ 887,454,159$ 978,296,449$ 1,057,614,814$ 1,143,062,615$ 1,216,145,088$
45 Total Expenses 1,181,557,092$ 1,477,731,120$ 1,585,702,201$ 1,685,989,232$ 1,790,809,985$ 1,895,222,373$
577,572,593$ 590,276,960$ 607,405,753$ 628,374,418$ 647,747,369$ 679,077,285$
46 Total Expenditures for Cash Flow Test 1,181,557,092$ 1,477,731,120$ 1,585,702,201$ 1,685,989,232$ 1,790,809,985$ 1,895,222,373$
47 Cash Flow Surplus (Deficit) (2,291,344)$ (264,957,456)$ (23,880,045)$ 2,646,733$ (1,065,478)$ 6,384,156$
48 Cash Flow Surplus (Deficit) with Reserves 450,664,557$ (163,934,423)$ 165,889,688$ 127,402,181$ 50,619,752$ (15,841,200)$
49 Debt Coverage Test
50 Junior Lien51 Gross Revenues 1,154,265,748$ 1,171,983,574$ 1,519,928,739$ 1,641,310,498$ 1,741,138,936$ 1,847,151,743$
52 Less: O&M (577,572,593) (590,276,960) (607,405,753) (628,374,418) (647,747,369) (679,077,285)
52 Less: Bad Debt (22,288,040) (22,667,605) (29,639,651) (32,067,280) (34,059,299) (36,175,063)
53 Plus: Total Capital Equipment included (8305) 20,557,657 21,051,041 21,556,266 22,073,616 22,603,383 23,145,864
54 Plus: Total Service in 8305 2,832,200 2,900,173 2,969,777 3,041,052 3,114,037 3,188,774
55 Plus: PIB Debt 5,049,600 3,805,697 3,805,542 2,548,047 2,547,168 0
56 Plus: Wallisville & Allens' Creek DS 1,912,097 1,912,097 1,843,880 1,843,646 1,841,391 1,846,774
57 Plus: Pension DS 8,085,190 8,140,196 8,194,646 8,253,521 8,315,531 8,375,056
57 Plus: CWA Debt Service 6,398,700 6,552,269 6,709,523 6,870,552 7,035,445 7,204,296
58 Less: Deduction of Allocated recovery (8,490,900) (8,694,682) (8,903,354) (9,117,034) (9,335,843) (9,559,904)
59 Plus: EPA Consent Decree Reimbursed by Fund 830 33,999,997 34,815,997 35,651,581 36,507,219 37,383,392 38,280,593
60 Revenues Available for Junior Lien 624,749,656$ 629,521,796$ 954,711,196$ 1,052,889,418$ 1,132,836,771$ 1,204,380,848$

Houston Combined Utility System
Combined Revenue Requirements
Line No. FYE 2021 FYE 2022 FYE 2023 FYE 2024 FYE 2025 FYE 2026
61 Junior Lien Debt Service 22,405,000$ 15,480,000$ 17,345,000$ 19,005,000$ 17,990,000$ 18,155,000$
62 Junior Lien Coverage Ratio 27.88x 40.67x 55.04x 55.40x 62.97x 66.34x
63 Junior Lien Coverage Surplus / (Deficit) 593,382,656$ 607,849,796$ 930,428,196$ 1,026,282,418$ 1,107,650,771$ 1,178,963,848$
64 First Lien65 Net Revenues Available 624,749,656$ 629,521,796$ 954,711,196$ 1,052,889,418$ 1,132,836,771$ 1,204,380,848$
66 Less: Junior Lien Debt Service (22,405,000)$ (15,480,000)$ (17,345,000)$ (19,005,000)$ (17,990,000)$ (18,155,000)$
67 Plus: Restricted Revenues 25,000,000$ 40,790,090$ 41,893,417$ 47,325,467$ 48,605,570$ 54,454,786$
68 Revenues Available for Junior Lien 627,344,656$ 654,831,886$ 979,259,613$ 1,081,209,884$ 1,163,452,341$ 1,240,680,635$
69 First Lien Debt Service 519,380,991$ 605,801,129$ 686,186,467$ 759,042,714$ 841,548,021$ 911,304,891$
70 First Lien Coverage 1.21x 1.08x 1.43x 1.42x 1.38x 1.36x
71 First Lien Coverage Surplus / (Deficit) (131,155,731)$ (214,961,695)$ (5,684,441)$ (8,056,916)$ (39,900,888)$ (60,563,213)$
72 Second Lien73 Net Revenues Available 627,344,656$ 654,831,886$ 979,259,613$ 1,081,209,884$ 1,163,452,341$ 1,240,680,635$
74 Less: First Lien Debt Service (519,380,991)$ (605,801,129)$ (686,186,467)$ (759,042,714)$ (841,548,021)$ (911,304,891)$
75 Plus: Restricted Revenues
76 Revenues Available for Second Lien 107,963,665$ 49,030,757$ 293,073,146$ 322,167,170$ 321,904,321$ 329,375,743$
77 Second Lien Debt Service ‐$ ‐$ ‐$ ‐$ ‐$ ‐$
78 Second Lien Coverage NA NA NA NA NA NA
79 Second Lien Coverage Surplus / (Deficit) 107,963,665$ 49,030,757$ 293,073,146$ 322,167,170$ 321,904,321$ 329,375,743$
80 Total Debt Coverage81 Net Revenues Available 624,749,656$ 629,521,796$ 954,711,196$ 1,052,889,418$ 1,132,836,771$ 1,204,380,848$
82 Plus: Restricted Revenues 25,000,000$ 40,790,090$ 41,893,417$ 47,325,467$ 48,605,570$ 54,454,786$
83 Revenues Available for Junior Lien 649,749,656$ 670,311,886$ 996,604,613$ 1,100,214,884$ 1,181,442,341$ 1,258,835,635$
84 Junior Lien Debt Service 22,405,000$ 15,480,000$ 17,345,000$ 19,005,000$ 17,990,000$ 18,155,000$
85 First Lien Debt Service 519,380,991$ 605,801,129$ 686,186,467$ 759,042,714$ 841,548,021$ 911,304,891$
86 Second Lien Debt Service ‐$ ‐$ ‐$ ‐$ ‐$ ‐$
87 Third Lien Debt Service 11,000,000$ 12,637,500$ 13,575,000$ 15,212,500$ 16,150,000$ 16,150,000$
88 Subordinate Lien Debt Service 29,008,980$ 30,966,438$ 31,580,626$ 32,317,381$ 33,343,102$ 34,393,324$
89 Other Debt Service Payments 21,280,991$ 20,037,719$ 20,032,149$ 18,393,185$ 18,748,806$ 16,684,084$

Houston Combined Utility System
Combined Revenue Requirements
Line No. FYE 2021 FYE 2022 FYE 2023 FYE 2024 FYE 2025 FYE 2026
90 Total Debt Service 603,075,963$ 684,922,786$ 768,719,241$ 843,970,781$ 927,779,928$ 996,687,299$
91 Total Coverage Ratio 1.20x 1.08x 1.42x 1.41x 1.37x 1.35x
92 Total Coverage Surplus / (Deficit) (194,556,691)$ (288,580,014)$ (79,602,325)$ (81,344,209)$ (117,449,559)$ (136,526,584)$
93 Resulting Cash Flows After Revenue Adjustment 1
94 Revenues before rate adjustment 1 1,114,401,976$ 1,133,380,242$ 1,481,982,552$ 1,603,364,001$ 1,702,964,973$ 1,808,753,157$
95 Revenues from revenue adjustment 1 16,716,030$ 159,694,943$ 118,181,122$ 96,201,840$ 102,177,898$ 108,525,189$
96 Less: Revenue Increase Delay (12,414,995)$ ‐$ (87,773,120)$ (71,449,107)$ (75,887,525)$ (80,601,658)$
97 Other revenues 64,863,772$ 79,393,422$ 79,839,605$ 85,271,963$ 86,779,533$ 92,853,372$
98 Less Expenditures (from Cash Flow) (1,181,557,092)$ (1,477,731,120)$ (1,585,702,201)$ (1,685,989,232)$ (1,790,809,985)$ (1,895,222,373)$
99 Cash Flow 2,009,690$ (105,262,513)$ 6,527,958$ 27,399,466$ 25,224,895$ 34,307,688$
100 Resulting Cash Flows After Revenue Adjustment 2
101 Revenues before rate adjustment 2 1,118,703,010$ 1,293,075,185$ 1,512,390,554$ 1,628,116,735$ 1,729,255,346$ 1,836,676,688$
102 Revenues from revenue adjustment 2 ‐$ 185,949,318$ ‐$ ‐$ ‐$ ‐$
103 Less: Revenue Increase Delay ‐$ (138,104,558)$ ‐$ ‐$ ‐$ ‐$
104 Other revenues 64,863,772$ 79,393,422$ 79,839,605$ 85,271,963$ 86,779,533$ 92,853,372$
105 Less Expenditures (from Cash Flow) (1,181,557,092)$ (1,477,731,120)$ (1,585,702,201)$ (1,685,989,232)$ (1,790,809,985)$ (1,895,222,373)$
106 Cash Flow 2,009,690$ (57,417,754)$ 6,527,958$ 27,399,466$ 25,224,895$ 34,307,688$
107 Junior + First + Second Coverage Ratio (1.4x) 1.21x 1.41x 1.46x 1.45x 1.41x 1.38x
108 Second Lien Coverage Surplus / (Deficit) (104,449,697)$ 8,058,008$ 42,068,562$ 35,700,818$ 4,379,486$ (14,484,682)$
109 Junior + First Coverage Ratio (1.4x) 1.21x 1.41x 1.46x 1.45x 1.41x 1.38x
110 First Lien Coverage Surplus / (Deficit) (104,449,697)$ 8,058,008$ 42,068,562$ 35,700,818$ 4,379,486$ (14,484,682)$
111 Total Coverage Ratio (1.2x) 1.08x 1.28x 1.34x 1.33x 1.30x 1.29x
112 Total Coverage Surplus / (Deficit) (190,255,657)$ (81,040,311)$ (49,194,322)$ (56,591,475)$ (91,159,185)$ (108,603,052)$
113 Annualized Rate Revenue Requirements for Adjustment 1 1,131,118,006$ 1,293,075,185$ 1,600,163,674$ 1,699,565,841$ 1,805,142,871$ 1,917,278,347$
114 Annualized Rate Revenue Requirements for Adjustment 2 1,131,118,006$ 1,479,024,503$ 1,600,163,674$ 1,699,565,841$ 1,805,142,871$ 1,917,278,347$

WATER AND WASTEWATER COST OF SERVICE RATE STUDY | CITY OF HOUSTON
DRAFT | APRIL
Appendix F
CUSTOMER PROFILE AND DEMAND ANALYSIS

WATER AND WASTEWATER COST OF SERVICE RATE STUDY | CITY OF HOUSTON
DRAFT | APRIL | F‐
Carollo analyzed FYE customer billing data to understand how different types of customers use the
water and wastewater systems. This analysis drives the allocation of costs to improve equity among
customers.
F.1. Customer Accounts and Growth
F.1.1. Water System Customer Accounts
Houston Water’s customer base is made up of distinctly different customer types with varied usage
characteristics. Carollo analyzed each customer group’s meter counts by size to equitably distribute customer
and capacity costs based on this information.
Table F. summarizes the number of retail water accounts by meter size and customer type. Single family
residential is the largest customer type with approximately percent of retail water accounts.
Commercial/industrial is the next largest with approximately percent of retail water accounts. The remaining
accounts are distributed among all other customer types such as multifamily residential, irrigation, transient,
resale, emergency backup service, and fire customers.
Table F. Water System Retail Accounts by Meter Size
Meter Size
SFR MFR COM/IND IRRIG TRANS RESALE EMERG MTR FIRE
UNMTR FIRE( )
/ ” , , , , ‐‐‐ ‐‐‐ ‐‐‐ ‐‐‐
/ " , , ‐‐‐ ‐‐‐ ‐‐‐ ‐‐‐ ‐‐‐ ‐‐‐
” , , , ‐‐‐ ‐‐‐ ‐‐‐
½” , , , ‐‐‐ ‐‐‐ ‐‐‐
” , , ‐‐‐ ‐‐‐
” ‐‐‐ ‐‐‐ ‐‐‐
” ‐‐‐ ‐‐‐ ‐‐‐
” ‐‐‐ ‐‐‐ ‐‐‐ ,
” ‐‐‐ ‐‐‐ ‐‐‐ ,
” ‐‐‐ ‐‐‐ ‐‐‐ ‐‐‐
” ‐‐‐ ‐‐‐ ‐‐‐ ‐‐‐ ‐‐‐ ‐‐‐ ‐‐‐ ‐‐‐
Total , , , , ,
Note: ( ) Meter sizes shown for unmetered fire accounts are based on service line size.
To reflect the impact of larger meters on the system, the meters are scaled based on the hydraulic capacity of
the meter. Larger meters have the potential to demand more capacity, or rather, exert a greater
instantaneous demand on the system. The potential capacity demand is proportional to the potential flow
through each meter size as established by AWWA hydraulic capacity ratios. These ratios, provided in
Table F. , are known as meter equivalent units (MEU). Table F. also provides the number of meter
equivalents for each retail customer type, which are calculated by multiplying the number of meters from
Table F. by the appropriate MEU.
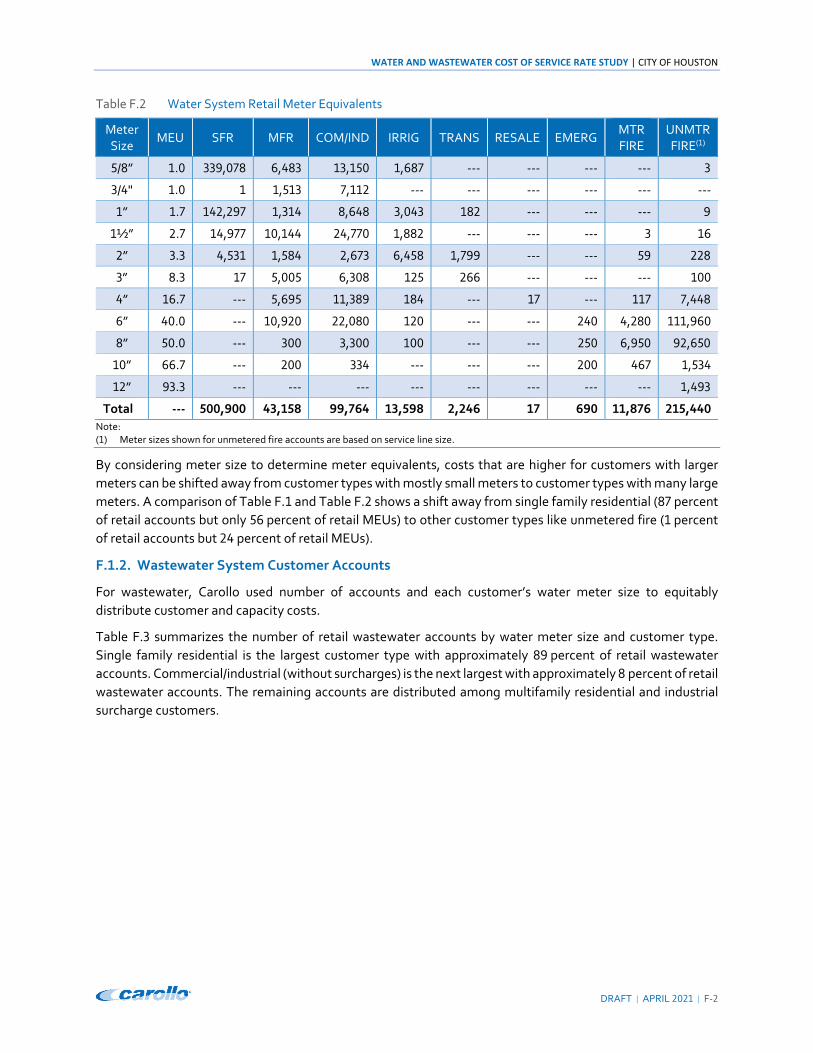
WATER AND WASTEWATER COST OF SERVICE RATE STUDY | CITY OF HOUSTON
DRAFT | APRIL | F‐
Table F. Water System Retail Meter Equivalents
Meter Size
MEU SFR MFR COM/IND IRRIG TRANS RESALE EMERG MTR FIRE
UNMTR FIRE( )
/ ” . , , , , ‐‐‐ ‐‐‐ ‐‐‐ ‐‐‐
/ " . , , ‐‐‐ ‐‐‐ ‐‐‐ ‐‐‐ ‐‐‐ ‐‐‐
” . , , , , ‐‐‐ ‐‐‐ ‐‐‐
½” . , , , , ‐‐‐ ‐‐‐ ‐‐‐
” . , , , , , ‐‐‐ ‐‐‐
” . , , ‐‐‐ ‐‐‐ ‐‐‐
” . ‐‐‐ , , ‐‐‐ ‐‐‐ ,
” . ‐‐‐ , , ‐‐‐ ‐‐‐ , ,
” . ‐‐‐ , ‐‐‐ ‐‐‐ , ,
” . ‐‐‐ ‐‐‐ ‐‐‐ ‐‐‐ ,
” . ‐‐‐ ‐‐‐ ‐‐‐ ‐‐‐ ‐‐‐ ‐‐‐ ‐‐‐ ‐‐‐ ,
Total ‐‐‐ , , , , , , ,
Note: ( ) Meter sizes shown for unmetered fire accounts are based on service line size.
By considering meter size to determine meter equivalents, costs that are higher for customers with larger
meters can be shifted away from customer types with mostly small meters to customer types with many large
meters. A comparison of Table F. and Table F. shows a shift away from single family residential ( percent
of retail accounts but only percent of retail MEUs) to other customer types like unmetered fire ( percent
of retail accounts but percent of retail MEUs).
F. . . Wastewater System Customer Accounts
For wastewater, Carollo used number of accounts and each customer’s water meter size to equitably
distribute customer and capacity costs.
Table F. summarizes the number of retail wastewater accounts by water meter size and customer type.
Single family residential is the largest customer type with approximately percent of retail wastewater
accounts. Commercial/industrial (without surcharges) is the next largest with approximately percent of retail
wastewater accounts. The remaining accounts are distributed among multifamily residential and industrial
surcharge customers.
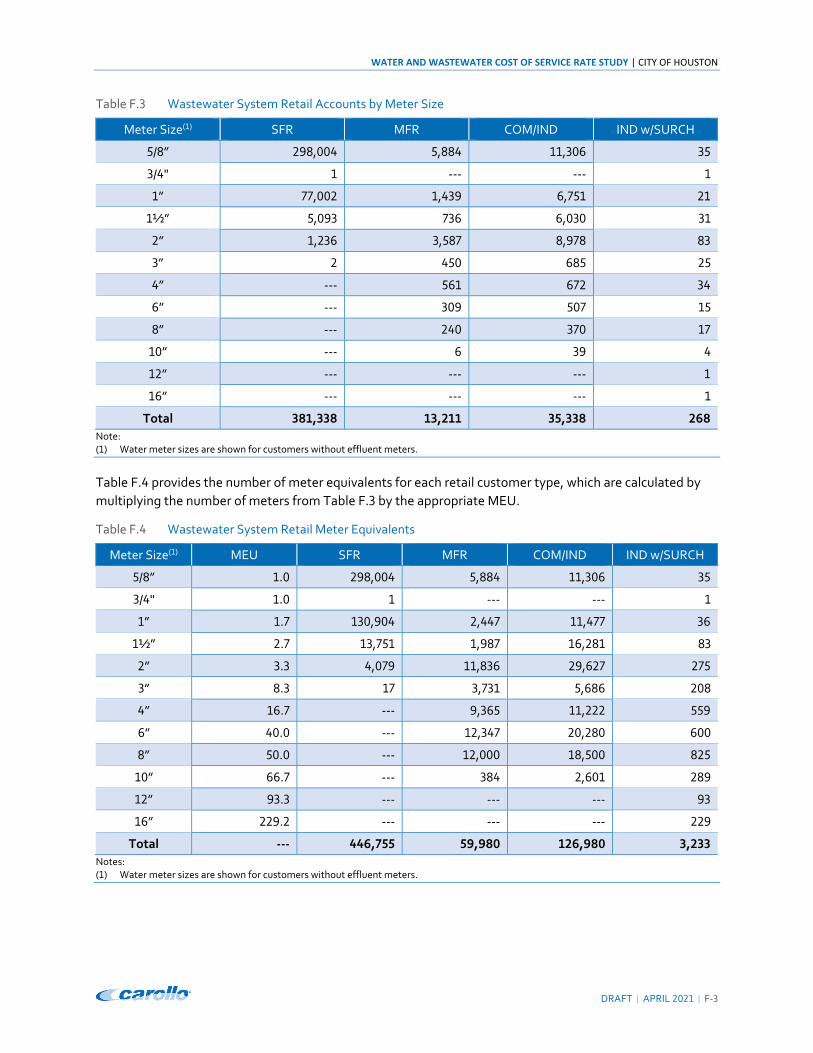
WATER AND WASTEWATER COST OF SERVICE RATE STUDY | CITY OF HOUSTON
DRAFT | APRIL | F‐
Table F. Wastewater System Retail Accounts by Meter Size
Meter Size( ) SFR MFR COM/IND IND w/SURCH
/ ” , , ,
/ " ‐‐‐ ‐‐‐
” , , ,
½” , ,
” , , ,
”
” ‐‐‐
” ‐‐‐
” ‐‐‐
” ‐‐‐
” ‐‐‐ ‐‐‐ ‐‐‐
” ‐‐‐ ‐‐‐ ‐‐‐
Total , , ,
Note: ( ) Water meter sizes are shown for customers without effluent meters.
Table F. provides the number of meter equivalents for each retail customer type, which are calculated by
multiplying the number of meters from Table F. by the appropriate MEU.
Table F. Wastewater System Retail Meter Equivalents
Meter Size( ) MEU SFR MFR COM/IND IND w/SURCH
/ ” . , , ,
/ " . ‐‐‐ ‐‐‐
” . , , ,
½” . , , ,
” . , , ,
” . , ,
” . ‐‐‐ , ,
” . ‐‐‐ , ,
” . ‐‐‐ , ,
” . ‐‐‐ ,
” . ‐‐‐ ‐‐‐ ‐‐‐
” . ‐‐‐ ‐‐‐ ‐‐‐
Total ‐‐‐ , , , ,
Notes: ( ) Water meter sizes are shown for customers without effluent meters.

WATER AND WASTEWATER COST OF SERVICE RATE STUDY | CITY OF HOUSTON
DRAFT | APRIL | F‐
By considering meter size to determine meter equivalents, costs that are higher for customers with larger
meters can be shifted away from customer types with mostly small meters to customer types with many large
meters. A comparison of Table F. and Table F. shows a shift away from single family residential ( percent
of retail accounts but only percent of retail MEUs) to other customer types like commercial / industrial
without surcharges ( percent of retail accounts but percent of retail MEUs).
F. . . Forecasted Customer Account Growth
Based on discussions with Houston Water staff, Carollo used an annual growth rate of . percent to project
the number of customer accounts and MEUs in each year of the study period. It is assumed that all customer
types and meter sizes grow at this rate so the distribution of accounts among customer types and meter sizes
does not change.
F. . Customer Demands
Retail water customers account for approximately percent of treated water demand. The remaining
percent of treated water is purchased by contract and wholesale customers, including Southeast Water
Purification Plant (WPP) co‐participants and Northeast WPP and East WPP Water Authorities.
Figure F. illustrates the findings of this analysis for single family residential, multifamily residential, and
commercial customers, although the full analysis included all retail and wholesale customers.
Figure F. Bill Frequency and Usage Analysis

WATER AND WASTEWATER COST OF SERVICE RATE STUDY | CITY OF HOUSTON
DRAFT | APRIL
Appendix G
WATER COST OF SERVICE ANALYSIS

Houston Combined Utility System
Water Cost Allocation
Line
No. Raw Water Base Max Day Max Hour Base Max Day Max Hour Fire
Meter
Charges
Billing &
Collecting
EWPP
WAs
NEWPP
WAs
SEWPP
Co‐parts TCEQ Fees Recycled General Total
Common to AllCommon to Retail & Contract Customers
Not Contributing CapitalCommon to Retail
Allocation of Functionalized Assets to Rate ComponentsAllocation Basis
1 Plants & Structures General 0.0% 0.0% 0.0% 0.0% 0.0% 0.0% 0.0% 0.0% 0.0% 0.0% 0.0% 0.0% 0.0% 0.0% 0.0% 100.0% 454,668$
2 Electrical, Mechanical, Controls General 0.0% 0.0% 0.0% 0.0% 0.0% 0.0% 0.0% 0.0% 0.0% 0.0% 0.0% 0.0% 0.0% 0.0% 0.0% 100.0% 380,735$
3 Source of Supply ‐ Wells Source of Supply ‐ Treated 0.0% 100.0% 0.0% 0.0% 0.0% 0.0% 0.0% 0.0% 0.0% 0.0% 0.0% 0.0% 0.0% 0.0% 0.0% 0.0% 139,157$
4 Lifts and Pump Stations Storage 0.0% 49.2% 17.5% 33.3% 0.0% 0.0% 0.0% 0.0% 0.0% 0.0% 0.0% 0.0% 0.0% 0.0% 0.0% 0.0% 216,801$
Water and Wastewater Lines
5 Distribution Distribution 0.0% 0.0% 0.0% 0.0% 46.7% 16.6% 31.7% 5.0% 0.0% 0.0% 0.0% 0.0% 0.0% 0.0% 0.0% 0.0% 1,786,781$
6 Transmission Transmission 0.0% 73.8% 26.2% 0.0% 0.0% 0.0% 0.0% 0.0% 0.0% 0.0% 0.0% 0.0% 0.0% 0.0% 0.0% 0.0% 1,417,065$
7 Land & Site General 0.0% 0.0% 0.0% 0.0% 0.0% 0.0% 0.0% 0.0% 0.0% 0.0% 0.0% 0.0% 0.0% 0.0% 0.0% 100.0% 35,049$
8 Meters & Water Supply Line to the Meter Meters 0.0% 0.0% 0.0% 0.0% 0.0% 0.0% 0.0% 0.0% 100.0% 0.0% 0.0% 0.0% 0.0% 0.0% 0.0% 0.0% 74,131$
9 SCADA System Production ‐ Other 0.0% 73.8% 26.2% 0.0% 0.0% 0.0% 0.0% 0.0% 0.0% 0.0% 0.0% 0.0% 0.0% 0.0% 0.0% 0.0% 29,334$
10 Pumps Pumping 0.0% 49.2% 17.5% 33.3% 0.0% 0.0% 0.0% 0.0% 0.0% 0.0% 0.0% 0.0% 0.0% 0.0% 0.0% 0.0% 3,004$
11 Fuel Tanks General 0.0% 0.0% 0.0% 0.0% 0.0% 0.0% 0.0% 0.0% 0.0% 0.0% 0.0% 0.0% 0.0% 0.0% 0.0% 100.0% 1,108$
12 Chemical Tanks Production ‐ Other 0.0% 73.8% 26.2% 0.0% 0.0% 0.0% 0.0% 0.0% 0.0% 0.0% 0.0% 0.0% 0.0% 0.0% 0.0% 0.0% 15,097$
13 Ground Storage Tanks Storage 0.0% 49.2% 17.5% 33.3% 0.0% 0.0% 0.0% 0.0% 0.0% 0.0% 0.0% 0.0% 0.0% 0.0% 0.0% 0.0% 166,420$
14 Elevated Storage Tank Storage 0.0% 49.2% 17.5% 33.3% 0.0% 0.0% 0.0% 0.0% 0.0% 0.0% 0.0% 0.0% 0.0% 0.0% 0.0% 0.0% 35,724$
15 Asset Allocation Subtotal ‐$ 1,424,535$ 457,417$ 140,649$ 834,619$ 297,009$ 565,814$ 89,339$ 74,131$ ‐$ ‐$ ‐$ ‐$ ‐$ ‐$ 871,560$ 4,755,073$
16 0% 30% 10% 3% 18% 6% 12% 2% 2% 0% 0% 0% 0% 0% 0% 18%
17 Reallocation as "As All Others" 0% 7% 2% 1% 4% 1% 3% 0% 0% 0% 0% 0% 0% 0% 0%
18 Total ($) Allocation ‐$ 1,744,237$ 560,073$ 172,215$ 1,021,929$ 363,666$ 692,797$ 109,389$ 90,768$ ‐$ ‐$ ‐$ ‐$ ‐$ ‐$ 4,755,073$
19 Total (%) Allocation 0% 37% 12% 4% 21% 8% 15% 2% 2% 0% 0% 0% 0% 0% 0%

Houston Combined Utility System
Water Functionalization of Costs
Line
No. Cost Center
Source of
Supply ‐
Untreated
Source of
Supply ‐
Treated Pumping Transmission
Production ‐
EWPP
Production ‐
NEWPP
Production ‐
NEWPP
Expansion
Production ‐
SEWPP
Production ‐
Other Storage Distribution Meters
Fire
Protection
Customer
Billing Admin
WA OH ‐
EWPP
WA OH ‐
NEWPP
Co‐part OH
SEWPP TCEQ Fees General
1 Functional Allocation of O&M Cost Centers (%)2 Drinking Water Operations
3 40011 DWO Executive Support G&A 0% 0% 0% 0% 0% 0% 0% 0% 0% 0% 0% 0% 0% 0% 92% 2.0% 3.1% 3.3% 0% 0%
4 DWO Water Maintenance 0% 0% 6% 0% 52% 10% 0% 22% 6% 3% 0% 0% 0% 0% 0% 0% 0% 0% 0% 0%
5 40012 DWO Regulatory and Compliance 0% 0% 0% 0% 0% 0% 0% 0% 0% 0% 0% 0% 0% 0% 81% 4.6% 7.4% 6.9% 0% 0%
6 TCEQ Fee 0% 0% 0% 0% 0% 0% 0% 0% 0% 0% 0% 0% 0% 0% 0% 0% 0% 0% 100% 0%
7 40013 DWO Ground Water Operations 0% 0% 40% 0% 0% 0% 0% 0% 40% 20% 0% 0% 0% 0% 0% 0% 0% 0% 0% 0%
8 40014 DWO East Water Purification Plant 0% 0% 0% 0% 100% 0% 0% 0% 0% 0% 0% 0% 0% 0% 0% 0% 0% 0% 0% 0%
9 40015 DWO Technical Services G&A 4% 6% 0% 35% 0% 0% 0% 0% 5% 0% 50% 0% 0% 0% 0% 0% 0% 0% 0% 0%
10 Cust. Complaints and Water System Maint. 4% 5% 0% 32% 0% 0% 0% 0% 5% 0% 45% 0% 0% 0% 0% 3.3% 2.3% 4.3% 0% 0%
11 Source Water Protection 4% 5% 0% 32% 0% 0% 0% 0% 5% 0% 45% 0% 0% 0% 0% 3.3% 2.3% 4.3% 0% 0%
12 40016 DWO NEWPP Expansion 0% 0% 0% 0% 0% 0% 100% 0% 0% 0% 0% 0% 0% 0% 0% 0% 0% 0% 0% 0%
13 PIB DS 0% 0% 0% 0% 0% 0% 0% 0% 0% 0% 0% 0% 0% 0% 0% 0% 0% 0% 0% 100%
14 40017 DWO Southeast Water Purification Plant 0% 0% 0% 0% 0% 0% 0% 100% 0% 0% 0% 0% 0% 0% 0% 0% 0% 0% 0% 0%
15 40018 DWO Northeast Water Purification Plant 0% 0% 0% 0% 0% 100% 0% 0% 0% 0% 0% 0% 0% 0% 0% 0% 0% 0% 0% 0%
16 40019 DWO System Maintenance ‐ North 0% 0% 0% 0% 0% 0% 0% 0% 0% 0% 95% 0% 5% 0% 0% 0% 0% 0% 0% 0%
17 40020 DWO System Maintenance ‐ South 0% 0% 0% 0% 0% 0% 0% 0% 0% 0% 95% 0% 5% 0% 0% 0% 0% 0% 0% 0%
18 RACDS River Authority Contributed Debt Service 40% 60% 0% 0% 0% 0% 0% 0% 0% 0% 0% 0% 0% 0% 0% 0% 0% 0% 0% 0%
19 CWA O&M (CWA Trinity River and TRA) 35% 0% 0% 0% 47% 0% 0% 19% 0% 0% 0% 0% 0% 0% 0% 0% 0% 0% 0% 0%
20 CWA Debt Service (1993A‐H & 2004 Ref to 2014) 35% 0% 0% 0% 47% 0% 0% 19% 0% 0% 0% 0% 0% 0% 0% 0% 0% 0% 0% 0%
21 CWA Debt Service (96" line) 19% 0% 0% 0% 0% 0% 0% 81% 0% 0% 0% 0% 0% 0% 0% 0% 0% 0% 0% 0%
22 Operation Services ‐ Houston Water G&A
23 40021 OPS Financial & Support Operation Services G&A 0% 0% 0% 0% 0% 0% 0% 0% 0% 0% 0% 0% 0% 0% 100% 0% 0% 0% 0% 0%
24 40022 HW Planning 2% 3% 5% 15% 0% 0% 0% 0% 5% 5% 15% 0% 0% 0% 50% 0% 0% 0% 0% 0%
25 40023 OPS Maintenance Operation Services ‐ Restoration 0% 0% 0% 0% 0% 0% 0% 0% 0% 0% 100% 0% 0% 0% 0% 0% 0% 0% 0% 0%
26 40024 OPS Maintenance Operation Services‐COS/DIS 0% 0% 0% 10% 0% 0% 0% 0% 0% 0% 90% 0% 0% 0% 0% 0% 0% 0% 0% 0%
27 40025 HW GIS Services 0% 0% 0% 15% 0% 0% 0% 0% 0% 0% 45% 10% 25% 0% 2% 0% 0% 0% 0% 3%
28 40026 OPS Executive Support 0% 0% 0% 0% 0% 0% 0% 0% 0% 0% 0% 0% 0% 0% 92% 2.0% 3.1% 3.3% 0% 0%
29 40027 OPS Support Services 0% 0% 0% 0% 0% 0% 0% 0% 0% 0% 0% 0% 0% 0% 100% 0% 0% 0% 0% 0%
30 40028 HW Infrastructure Planning 0% 0% 10% 30% 0% 0% 0% 0% 0% 10% 30% 0% 0% 0% 20% 0% 0% 0% 0% 0%
31 40029 HW Utility Analysis 2% 3% 5% 15% 0% 0% 0% 0% 5% 5% 15% 0% 0% 0% 50% 0% 0% 0% 0% 0%
32 Other O&M
33 30001‐30009 Director's Office 0% 0% 0% 0% 0% 0% 0% 0% 0% 0% 0% 0% 0% 0% 0% 2.0% 3.1% 3.3% 0% 92%
34 80001 Information Technology 0% 0% 0% 0% 0% 0% 0% 0% 0% 0% 0% 0% 0% 0% 0% 2.0% 3.1% 3.3% 0% 92%
35 90001‐90011 Management Support 0% 0% 0% 0% 0% 0% 0% 0% 0% 0% 0% 0% 0% 0% 0% 2.0% 3.1% 3.3% 0% 92%
36 60005 & 60008 Houston Water ‐ Planning 2% 3% 5% 15% 0% 0% 0% 0% 5% 5% 15% 0% 0% 0% 50% 0% 0% 0% 0% 0%
37 0005,50006,50030 Financial Mangt Services Support 0% 0% 0% 0% 0% 0% 0% 0% 0% 0% 0% 0% 0% 0% 0% 0.1% 0.1% 0.3% 0% 100%
38 Property and Terrorism Insurance 0% 0% 0% 0% 17% 5% 0% 8% 0% 0% 0% 0% 0% 0% 0% 0% 0% 0% 0% 70%
39 Security 0% 0% 0% 0% 24% 24% 0% 24% 0% 0% 0% 0% 0% 0% 0% 0% 0% 0% 0% 28%
40 100007‐15, 100025 CAS ‐ Customer Account Services 0% 0% 0% 0% 0% 0% 0% 0% 0% 0% 0% 49.5% 0% 50.0% 0% 0.1% 0.1% 0.3% 0% 0%
41 Deductions 0% 0% 0% 0% 0% 0% 0% 0% 0% 0% 0% 0% 0% 0% 0% 0% 0% 0% 0% 100%

Houston Combined Utility System
Water Cost Allocation
Line
No. Raw Water Base Max Day Max Hour Base Max Day Max Hour Fire
Meter
Charges
Billing &
Collecting
EWPP
WAs
NEWPP
WAs
SEWPP
Co‐parts TCEQ Fees General Total FYE 2022
Allocation of Functionalized O&M to Rate Components1 Source of Supply ‐ Untreated 100% 0% 0% 0% 0% 0% 0% 0% 0% 0% 0% 0% 0% 0% 0% 22,289$
2 Source of Supply ‐ Treated 0% 100% 0% 0% 0% 0% 0% 0% 0% 0% 0% 0% 0% 0% 0% 12,707$
3 Pumping 0% 49% 17% 33% 0% 0% 0% 0% 0% 0% 0% 0% 0% 0% 0% 13,587$ 4 Transmission 0% 74% 26% 0% 0% 0% 0% 0% 0% 0% 0% 0% 0% 0% 0% 6,114$
5 Production ‐ EWPP 0% 61% 22% 0% 0% 0% 0% 0% 0% 0% 17% 0% 0% 0% 0% 50,027$
6 Production ‐ NEWPP 0% 34% 12% 0% 0% 0% 0% 0% 0% 0% 0% 54% 0% 0% 0% 17,743$
7 Production ‐ NEWPP Expansion 0% 10% 4% 0% 0% 0% 0% 0% 0% 0% 0% 86% 0% 0% 0% 1,860$
8 Production ‐ SEWPP 0% 32% 11% 0% 0% 0% 0% 0% 0% 0% 0% 0% 56% 0% 0% 24,242$
9 Production ‐ Other 0% 74% 26% 0% 0% 0% 0% 0% 0% 0% 0% 0% 0% 0% 0% 14,057$
10 Storage 0% 49% 17% 33% 0% 0% 0% 0% 0% 0% 0% 0% 0% 0% 0% 7,019$
11 Distribution 0% 0% 0% 0% 47% 17% 32% 5% 0% 0% 0% 0% 0% 0% 0% 63,601$
12 Meters 0% 0% 0% 0% 0% 0% 0% 0% 100% 0% 0% 0% 0% 0% 0% 16,071$
13 Fire Protection 0% 0% 0% 0% 0% 0% 0% 100% 0% 0% 0% 0% 0% 0% 0% 2,951$
14 Customer Billing 0% 0% 0% 0% 0% 0% 0% 0% 0% 100% 0% 0% 0% 0% 0% 16,008$
15 Admin 0% 0% 0% 0% 0% 0% 0% 0% 0% 0% 0% 0% 0% 0% 100% 22,277$
16 WA OH ‐ EWPP 0% 0% 0% 0% 0% 0% 0% 0% 0% 0% 100% 0% 0% 0% 0% 989$
17 WA OH ‐ NEWPP 0% 0% 0% 0% 0% 0% 0% 0% 0% 0% 0% 100% 0% 0% 0% 1,397$
18 Co‐part OH ‐ SEWPP 0% 0% 0% 0% 0% 0% 0% 0% 0% 0% 0% 0% 100% 0% 0% 1,647$
19 TCEQ Fees 0% 0% 0% 0% 0% 0% 0% 0% 0% 0% 0% 0% 0% 100% 0% 2,576$
20 General 0% 0% 0% 0% 0% 0% 0% 0% 0% 0% 0% 0% 0% 0% 100%
Common to AllCommon to Retail & Contract Customers
Not Contributing CapitalCommon to Retail

Houston Combined Utility System
Water System Customer Allocation ‐ FYE 2022 July Increase
Line
No. Customer Type Raw Water Base Max Day Max Hour Base Max Day Max Hour Fire
Meter
Charges
Billing &
Collecting EWPP WAs NEWPP WAs
SEWPP Co‐
parts TCEQ Fees Total
Development of Unit Costs1 Units of Service kGal kGal kGal / day kGal / day kGal kGal / day kGal / day MEU MEU Bills kGal kGal kGal Connections
2 Single Family Residential ‐ 23,340,203 30,899 47,423 23,340,203 30,899 47,423 503,912 503,912 4,947,559 ‐ ‐ ‐ 410,045
3 Multifamily Residential ‐ 25,815,307 25,140 47,934 25,815,307 25,140 47,934 43,417 43,417 161,408 ‐ ‐ ‐ 573,968
4 CII ‐ Commercial ‐ 21,656,992 25,296 42,315 21,656,992 25,296 42,315 88,790 88,790 407,916 ‐ ‐ ‐ 43,300
5 CII ‐ Emergency Backup ‐ 11,907 643 338 11,907 643 338 694 694 165 ‐ ‐ ‐ 17
6 CII ‐ Extra Container ‐ 791 25 14 791 25 14 4 4 24 ‐ ‐ ‐ ‐
7 CII ‐ Government ‐ 3,746,549 23,425 16,845 3,746,549 23,425 16,845 10,150 10,150 14,488 ‐ ‐ ‐ 4,376
8 CII ‐ Industrial Sewer Surcharge ‐ 686,428 882 1,381 686,428 882 1,381 1,422 1,422 2,015 ‐ ‐ ‐ 269
9 CII ‐ Resale ‐ 8,798 29 26 8,798 29 26 17 17 12 ‐ ‐ ‐ 2
10 CII ‐ Transient ‐ 384,573 2,953 2,003 384,573 2,953 2,003 2,867 2,867 7,708 ‐ ‐ ‐ 643
11 Irrigation ‐ 2,409,002 6,733 6,667 2,409,002 6,733 6,667 13,680 13,680 70,384 ‐ ‐ ‐ 469
12 Metered Fire ‐ 12,976 462 249 12,976 462 249 11,947 11,947 3,368 ‐ ‐ ‐ 32
13 Unmetered Fire ‐ ‐ ‐ ‐ ‐ ‐ ‐ 216,735 216,735 63,161 ‐ ‐ ‐ ‐
14 Sewer Only ‐ ‐ ‐ ‐ ‐ ‐ ‐ ‐ ‐ ‐ ‐ ‐ ‐ ‐
15 Drainage Only ‐ ‐ ‐ ‐ ‐ ‐ ‐ ‐ ‐ ‐ ‐ ‐ ‐ ‐
16 GRP Participants ‐ Areas 1 & 2 ‐ 29,350 298 199 ‐ ‐ ‐ ‐ ‐ 85 ‐ ‐ ‐ 16
17 GRP Participants ‐ Area 3 ‐ 2,491,173 14,415 18,583 ‐ ‐ ‐ ‐ ‐ 1,086 ‐ ‐ ‐ 208
18 Contract Treated ‐ SEWPP Co‐participants ‐ ‐ ‐ ‐ ‐ ‐ ‐ ‐ ‐ ‐ ‐ ‐ 19,538,357 74
19 Contract Treated ‐ EWPP Water Authorities ‐ ‐ ‐ ‐ ‐ ‐ ‐ ‐ ‐ ‐ 12,996,195 ‐ ‐ 12
20 Contract Treated ‐ NEWPP Water Authorities ‐ ‐ ‐ ‐ ‐ ‐ ‐ ‐ ‐ ‐ ‐ 9,365,481 ‐ 8
21 Contract Treated with Airgap ‐ 10,470,163 13,973 ‐ ‐ ‐ ‐ ‐ 120 435 ‐ ‐ ‐ 92
22 Contract Treated without Airgap ‐ 1,351,009 1,669 2,685 ‐ ‐ ‐ ‐ 50 181 ‐ ‐ ‐ 38
23 Contract Water ‐ Untreated 78,971,731 ‐ ‐ ‐ ‐ ‐ ‐ ‐ 432 1,569 ‐ ‐ ‐ 5
24 Total 78,971,731 92,415,220 146,843 186,661 78,073,526 116,489 165,194 893,636 894,236 5,681,563 12,996,195 9,365,481 19,538,357 1,033,575
25 Test Year Unit Cost 0.27$ 2.44$ 481.78$ 112.49$ 1.46$ 348.80$ 468.57$ 16.79$ 25.29$ 2.63$ 0.74$ 1.35$ 0.79$ 2.49$
Common to Retail & Contract Customers Not
Contributing CapitalCommon to Retail Common to All

Houston Combined Utility System
Water System Customer Allocation ‐ FYE 2022 July Increase
Line
No. Customer Type Raw Water Base Max Day Max Hour Base Max Day Max Hour Fire
Meter
Charges
Billing &
Collecting EWPP WAs NEWPP WAs
SEWPP Co‐
parts TCEQ Fees Total
Common to Retail & Contract Customers Not
Contributing CapitalCommon to Retail Common to All
Allocation of Unit Costs to Customer Types26 Single Family Residential ‐$ 56,865,463$ 14,886,770$ 5,334,477$ 34,133,708$ 10,777,768$ 22,220,687$ 8,461,035$ 12,744,285$ 13,034,800$ ‐$ ‐$ ‐$ 1,021,995$ 179,480,990$
27 Multifamily Residential ‐ 62,895,743 12,112,253 5,391,973 37,753,406 8,769,065 22,460,186 729,005 1,098,051 425,243 ‐ ‐ ‐ 1,430,555 153,065,481$
28 CII ‐ Commercial ‐ 52,764,531 12,187,264 4,759,961 31,672,108 8,823,372 19,827,548 1,490,848 2,245,563 1,074,692 ‐ ‐ ‐ 107,920 134,953,807$
29 CII ‐ Emergency Backup ‐ 29,010 309,921 38,015 17,414 224,377 158,353 11,657 17,558 435 ‐ ‐ ‐ 43 806,782$
30 CII ‐ Extra Container ‐ 1,927 12,183 1,544 1,156 8,820 6,432 73 109 64 ‐ ‐ ‐ ‐ 32,307$
31 CII ‐ Government ‐ 9,127,994 11,285,977 1,894,861 5,479,112 8,170,855 7,893,016 170,420 256,692 38,169 ‐ ‐ ‐ 10,907 44,328,004$
32 CII ‐ Industrial Sewer Surcharge ‐ 1,672,396 424,921 155,380 1,003,862 307,635 647,233 23,878 35,966 5,309 ‐ ‐ ‐ 669 4,277,248$
33 CII ‐ Resale ‐ 21,434 13,801 2,967 12,866 9,991 12,358 282 425 32 ‐ ‐ ‐ 5 74,161$
34 CII ‐ Transient ‐ 936,964 1,422,747 225,354 562,416 1,030,044 938,708 48,140 72,509 20,308 ‐ ‐ ‐ 1,602 5,258,793$
35 Irrigation ‐ 5,869,231 3,243,854 749,904 3,523,028 2,348,495 3,123,714 229,696 345,976 185,432 ‐ ‐ ‐ 1,168 19,620,499$
36 Metered Fire ‐ 31,613 222,647 27,992 18,976 161,193 116,599 200,604 302,156 8,874 ‐ ‐ ‐ 80 1,090,734$
37 Unmetered Fire ‐ ‐ ‐ ‐ ‐ ‐ ‐ 3,639,141 5,481,392 166,405 ‐ ‐ ‐ ‐ 9,286,937$
38 Sewer Only ‐ ‐ ‐ ‐ ‐ ‐ ‐ ‐ ‐ ‐ ‐ ‐ ‐ ‐ ‐$
39 Drainage Only ‐ ‐ ‐ ‐ ‐ ‐ ‐ ‐ ‐ ‐ ‐ ‐ ‐ ‐ ‐$
40 GRP Participants ‐ Areas 1 & 2 ‐ 71,507 143,373 22,391 ‐ ‐ ‐ ‐ ‐ 223 ‐ ‐ ‐ 40 237,533$
41 GRP Participants ‐ Area 3 ‐ 6,069,430 6,944,877 2,090,334 ‐ ‐ ‐ ‐ ‐ 2,862 ‐ ‐ ‐ 519 15,108,022$
42 Contract Treated ‐ SEWPP Co‐participants ‐ ‐ ‐ ‐ ‐ ‐ ‐ ‐ ‐ ‐ ‐ ‐ 15,531,167 186 15,531,352$
43 Contract Treated ‐ EWPP Water Authorities ‐ ‐ ‐ ‐ ‐ ‐ ‐ ‐ ‐ ‐ 9,645,248 ‐ ‐ 30 9,645,278$
44 Contract Treated ‐ NEWPP Water Authorities ‐ ‐ ‐ ‐ ‐ ‐ ‐ ‐ ‐ ‐ ‐ 12,647,125 ‐ 20 12,647,145$
45 Contract Treated with Airgap ‐ 25,509,231 6,731,809 ‐ ‐ ‐ ‐ ‐ 3,023 1,145 ‐ ‐ ‐ 228 32,245,436$
46 Contract Treated without Airgap ‐ 3,291,563 804,160 302,061 ‐ ‐ ‐ ‐ 1,259 477 ‐ ‐ ‐ 95 4,399,615$
47 Contract Water ‐ Untreated 21,616,675 ‐ ‐ ‐ ‐ ‐ ‐ ‐ 10,915 4,135 ‐ ‐ ‐ 13 21,631,737$
48 Total 21,616,675$ 225,158,036$ 70,746,557$ 20,997,214$ 114,178,052$ 40,631,616$ 77,404,834$ 15,004,778$ 22,615,879$ 14,968,603$ 9,645,248$ 12,647,125$ 15,531,167$ 2,576,077$ 663,721,860$

Houston Combined Utility System
Water Cost of Service ComparisonFYE 2022 ‐ July Increase
A
Line
No. Cost of Service
1 Single Family Residential 179,480,990$
2 Multifamily Residential 153,065,481
3 CII ‐ Commercial 134,953,807
4 CII ‐ Emergency Backup 806,782
5 CII ‐ Extra Container 32,307
6 CII ‐ Government 44,328,004
7 CII ‐ Industrial Sewer Surcharge 4,277,248
8 CII ‐ Resale 74,161
9 CII ‐ Transient 5,258,793
10 Irrigation 19,620,499
11 Metered Fire 1,090,734
12 Unmetered Fire 9,286,937
13 GRP Participants ‐ Areas 1 & 2 237,533
14 GRP Participants ‐ Area 3 15,108,022
15 Contract Treated ‐ SEWPP Co‐participants 15,531,352
16 Contract Treated ‐ EWPP Water Authorities 9,645,278
17 Contract Treated ‐ NEWPP Water Authorities 12,647,145
18 Contract Treated with Airgap 32,245,436
19 Contract Treated without Airgap 4,399,615
20 Contract Water ‐ Untreated 21,631,737
21 Total 663,721,860$
Customer Type

Houston Combined Utility System
Water System Customer Allocation ‐ FYE 2022 April Increase
Line
No. Customer Type Raw Water Base Max Day Max Hour Base Max Day Max Hour Fire
Meter
Charges
Billing &
Collecting EWPP WAs NEWPP WAs
SEWPP Co‐
parts TCEQ Fees Total
Development of Unit Costs1 Units of Service kGal kGal kGal / day kGal / day kGal kGal / day kGal / day MEU MEU Bills kGal kGal kGal Connections
2 Single Family Residential ‐ 23,340,203 30,899 47,423 23,340,203 30,899 47,423 503,912 503,912 4,947,559 ‐ ‐ ‐ 410,045
3 Multifamily Residential ‐ 25,815,307 25,140 47,934 25,815,307 25,140 47,934 43,417 43,417 161,408 ‐ ‐ ‐ 573,968
4 CII ‐ Commercial ‐ 21,656,992 25,296 42,315 21,656,992 25,296 42,315 88,790 88,790 407,916 ‐ ‐ ‐ 43,300
5 CII ‐ Emergency Backup ‐ 11,907 643 338 11,907 643 338 694 694 165 ‐ ‐ ‐ 17
6 CII ‐ Extra Container ‐ 791 25 14 791 25 14 4 4 24 ‐ ‐ ‐ ‐
7 CII ‐ Government ‐ 3,746,549 23,425 16,845 3,746,549 23,425 16,845 10,150 10,150 14,488 ‐ ‐ ‐ 4,376
8 CII ‐ Industrial Sewer Surcharge ‐ 686,428 882 1,381 686,428 882 1,381 1,422 1,422 2,015 ‐ ‐ ‐ 269
9 CII ‐ Resale ‐ 8,798 29 26 8,798 29 26 17 17 12 ‐ ‐ ‐ 2
10 CII ‐ Transient ‐ 384,573 2,953 2,003 384,573 2,953 2,003 2,867 2,867 7,708 ‐ ‐ ‐ 643
11 Irrigation ‐ 2,409,002 6,733 6,667 2,409,002 6,733 6,667 13,680 13,680 70,384 ‐ ‐ ‐ 469
12 Metered Fire ‐ 12,976 462 249 12,976 462 249 11,947 11,947 3,368 ‐ ‐ ‐ 32
13 Unmetered Fire ‐ ‐ ‐ ‐ ‐ ‐ ‐ 216,735 216,735 63,161 ‐ ‐ ‐ ‐
14 Sewer Only ‐ ‐ ‐ ‐ ‐ ‐ ‐ ‐ ‐ ‐ ‐ ‐ ‐ ‐
15 Drainage Only ‐ ‐ ‐ ‐ ‐ ‐ ‐ ‐ ‐ ‐ ‐ ‐ ‐ ‐
16 GRP Participants ‐ Areas 1 & 2 ‐ 29,350 298 199 ‐ ‐ ‐ ‐ ‐ 85 ‐ ‐ ‐ 16
17 GRP Participants ‐ Area 3 ‐ 2,491,173 14,415 18,583 ‐ ‐ ‐ ‐ ‐ 1,086 ‐ ‐ ‐ 208
18 Contract Treated ‐ SEWPP Co‐participants ‐ ‐ ‐ ‐ ‐ ‐ ‐ ‐ ‐ ‐ ‐ ‐ 19,538,357 74
19 Contract Treated ‐ EWPP Water Authorities ‐ ‐ ‐ ‐ ‐ ‐ ‐ ‐ ‐ ‐ 12,996,195 ‐ ‐ 12
20 Contract Treated ‐ NEWPP Water Authorities ‐ ‐ ‐ ‐ ‐ ‐ ‐ ‐ ‐ ‐ ‐ 9,365,481 ‐ 8
21 Contract Treated with Airgap ‐ 10,470,163 13,973 ‐ ‐ ‐ ‐ ‐ 120 435 ‐ ‐ ‐ 92
22 Contract Treated without Airgap ‐ 1,351,009 1,669 2,685 ‐ ‐ ‐ ‐ 50 181 ‐ ‐ ‐ 38
23 Contract Water ‐ Untreated 78,971,731 ‐ ‐ ‐ ‐ ‐ ‐ ‐ 432 1,569 ‐ ‐ ‐ 5
24 Total 78,971,731 92,415,220 146,843 186,661 78,073,526 116,489 165,194 893,636 894,236 5,681,563 12,996,195 9,365,481 19,538,357 1,033,575
25 Test Year Unit Cost 0.30$ 2.70$ 533.48$ 124.51$ 1.62$ 386.42$ 519.09$ 18.57$ 27.86$ 2.89$ 0.74$ 1.35$ 0.79$ 2.49$
Common to Retail & Contract Customers Not
Contributing CapitalCommon to Retail Common to All

Houston Combined Utility System
Water System Customer Allocation ‐ FYE 2022 April Increase
Line
No. Customer Type Raw Water Base Max Day Max Hour Base Max Day Max Hour Fire
Meter
Charges
Billing &
Collecting EWPP WAs NEWPP WAs
SEWPP Co‐
parts TCEQ Fees Total
Common to Retail & Contract Customers Not
Contributing CapitalCommon to Retail Common to All
Allocation of Unit Costs to Customer Types26 Single Family Residential ‐$ 62,948,416$ 16,484,304$ 5,904,685$ 37,814,424$ 11,939,960$ 24,616,795$ 9,355,747$ 14,039,334$ 14,293,587$ ‐$ ‐$ ‐$ 1,021,995$ 198,419,248$
27 Multifamily Residential ‐ 69,623,761 13,412,047 5,968,327 41,824,443 9,714,653 24,882,120 806,094 1,209,633 466,309 ‐ ‐ ‐ 1,430,555 169,337,943$
28 CII ‐ Commercial ‐ 58,408,804 13,495,108 5,268,758 35,087,385 9,774,816 21,965,598 1,648,497 2,473,753 1,178,476 ‐ ‐ ‐ 107,920 149,409,115$
29 CII ‐ Emergency Backup ‐ 32,114 343,179 42,079 19,291 248,572 175,428 12,890 19,342 477 ‐ ‐ ‐ 43 893,415$
30 CII ‐ Extra Container ‐ 2,133 13,490 1,709 1,281 9,771 7,125 80 121 70 ‐ ‐ ‐ ‐ 35,779$
31 CII ‐ Government ‐ 10,104,424 12,497,101 2,097,405 6,069,938 9,051,937 8,744,138 188,441 282,777 41,855 ‐ ‐ ‐ 10,907 49,088,923$
32 CII ‐ Industrial Sewer Surcharge ‐ 1,851,293 470,520 171,989 1,112,111 340,808 717,026 26,403 39,621 5,821 ‐ ‐ ‐ 669 4,736,261$
33 CII ‐ Resale ‐ 23,727 15,282 3,284 14,253 11,069 13,691 312 468 35 ‐ ‐ ‐ 5 82,125$
34 CII ‐ Transient ‐ 1,037,192 1,575,425 249,442 623,063 1,141,117 1,039,931 53,230 79,878 22,269 ‐ ‐ ‐ 1,602 5,823,149$
35 Irrigation ‐ 6,497,068 3,591,960 830,062 3,902,924 2,601,739 3,460,552 253,985 381,133 203,340 ‐ ‐ ‐ 1,168 21,723,931$
36 Metered Fire ‐ 34,995 246,540 30,984 21,022 178,575 129,172 221,816 332,860 9,731 ‐ ‐ ‐ 80 1,205,775$
37 Unmetered Fire ‐ ‐ ‐ ‐ ‐ ‐ ‐ 4,023,961 6,038,400 182,475 ‐ ‐ ‐ ‐ 10,244,835$
38 Sewer Only ‐ ‐ ‐ ‐ ‐ ‐ ‐ ‐ ‐ ‐ ‐ ‐ ‐ ‐ ‐$
39 Drainage Only ‐ ‐ ‐ ‐ ‐ ‐ ‐ ‐ ‐ ‐ ‐ ‐ ‐ ‐ ‐$
40 GRP Participants ‐ Areas 1 & 2 ‐ 79,156 158,758 24,784 ‐ ‐ ‐ ‐ ‐ 244 ‐ ‐ ‐ 40 262,983$
41 GRP Participants ‐ Area 3 ‐ 6,718,682 7,690,148 2,313,772 ‐ ‐ ‐ ‐ ‐ 3,139 ‐ ‐ ‐ 519 16,726,260$
42 Contract Treated ‐ SEWPP Co‐participants ‐ ‐ ‐ ‐ ‐ ‐ ‐ ‐ ‐ ‐ ‐ ‐ 15,531,167 186 15,531,352$
43 Contract Treated ‐ EWPP Water Authorities ‐ ‐ ‐ ‐ ‐ ‐ ‐ ‐ ‐ ‐ 9,645,248 ‐ ‐ 30 9,645,278$
44 Contract Treated ‐ NEWPP Water Authorities ‐ ‐ ‐ ‐ ‐ ‐ ‐ ‐ ‐ ‐ ‐ 12,647,125 ‐ 20 12,647,145$
45 Contract Treated with Airgap ‐ 28,237,978 7,454,215 ‐ ‐ ‐ ‐ ‐ 3,330 1,256 ‐ ‐ ‐ 228 35,697,007$
46 Contract Treated without Airgap ‐ 3,643,664 890,457 334,348 ‐ ‐ ‐ ‐ 1,387 523 ‐ ‐ ‐ 95 4,870,475$
47 Contract Water ‐ Untreated 23,696,476 ‐ ‐ ‐ ‐ ‐ ‐ ‐ 12,024 4,534 ‐ ‐ ‐ 13 23,713,047$
48 Total 23,696,476$ 249,243,407$ 78,338,533$ 23,241,629$ 126,490,136$ 45,013,017$ 85,751,577$ 16,591,457$ 24,914,060$ 16,414,139$ 9,645,248$ 12,647,125$ 15,531,167$ 2,576,077$ 730,094,046$

Houston Combined Utility System
Water Cost of Service ComparisonFYE 2022 ‐ April Increase
A
Line
No. Cost of Service
1 Single Family Residential 198,419,248$
2 Multifamily Residential 169,337,943
3 CII ‐ Commercial 149,409,115
4 CII ‐ Emergency Backup 893,415
5 CII ‐ Extra Container 35,779
6 CII ‐ Government 49,088,923
7 CII ‐ Industrial Sewer Surcharge 4,736,261
8 CII ‐ Resale 82,125
9 CII ‐ Transient 5,823,149
10 Irrigation 21,723,931
11 Metered Fire 1,205,775
12 Unmetered Fire 10,244,835
13 GRP Participants ‐ Areas 1 & 2 262,983
14 GRP Participants ‐ Area 3 16,726,260
15 Contract Treated ‐ SEWPP Co‐participants 15,531,352
16 Contract Treated ‐ EWPP Water Authorities 9,645,278
17 Contract Treated ‐ NEWPP Water Authorities 12,647,145
18 Contract Treated with Airgap 35,697,007
19 Contract Treated without Airgap 4,870,475
20 Contract Water ‐ Untreated 23,713,047
21 Total 730,094,046$
Customer Type

Houston Combined Utility System
Water System Customer Allocation ‐ FYE 2023 April Increase
Line
No. Customer Type Raw Water Base Max Day Max Hour Base Max Day Max Hour Fire
Meter
Charges
Billing &
Collecting EWPP WAs NEWPP WAs
SEWPP Co‐
parts TCEQ Fees Total
Development of Unit Costs1 Units of Service kGal kGal kGal / day kGal / day kGal kGal / day kGal / day MEU MEU Bills kGal kGal kGal Connections
2 Single Family Residential ‐ 23,386,883 30,961 47,517 23,386,883 30,961 47,517 504,919 504,919 4,957,454 ‐ ‐ ‐ 410,866
3 Multifamily Residential ‐ 25,866,938 25,191 48,030 25,866,938 25,191 48,030 43,504 43,504 161,730 ‐ ‐ ‐ 575,116
4 CII ‐ Commercial ‐ 21,700,306 25,347 42,400 21,700,306 25,347 42,400 88,968 88,968 408,732 ‐ ‐ ‐ 43,386
5 CII ‐ Emergency Backup ‐ 11,931 645 339 11,931 645 339 696 696 165 ‐ ‐ ‐ 17
6 CII ‐ Extra Container ‐ 792 25 14 792 25 14 4 4 24 ‐ ‐ ‐ ‐
7 CII ‐ Government ‐ 3,754,042 23,472 16,879 3,754,042 23,472 16,879 10,170 10,170 14,517 ‐ ‐ ‐ 4,385
8 CII ‐ Industrial Sewer Surcharge ‐ 687,801 884 1,384 687,801 884 1,384 1,425 1,425 2,019 ‐ ‐ ‐ 269
9 CII ‐ Resale ‐ 8,815 29 26 8,815 29 26 17 17 12 ‐ ‐ ‐ 2
10 CII ‐ Transient ‐ 385,342 2,959 2,007 385,342 2,959 2,007 2,873 2,873 7,723 ‐ ‐ ‐ 644
11 Irrigation ‐ 2,413,820 6,746 6,680 2,413,820 6,746 6,680 13,707 13,707 70,524 ‐ ‐ ‐ 470
12 Metered Fire ‐ 13,001 463 249 13,001 463 249 11,971 11,971 3,375 ‐ ‐ ‐ 32
13 Unmetered Fire ‐ ‐ ‐ ‐ ‐ ‐ ‐ 217,169 217,169 63,288 ‐ ‐ ‐ ‐
14 Sewer Only ‐ ‐ ‐ ‐ ‐ ‐ ‐ ‐ ‐ ‐ ‐ ‐ ‐ ‐
15 Drainage Only ‐ ‐ ‐ ‐ ‐ ‐ ‐ ‐ ‐ ‐ ‐ ‐ ‐ ‐
16 GRP Participants ‐ Areas 1 & 2 ‐ 29,408 298 199 ‐ ‐ ‐ ‐ ‐ 85 ‐ ‐ ‐ 16
17 GRP Participants ‐ Area 3 ‐ 4,992,311 14,444 18,620 ‐ ‐ ‐ ‐ ‐ 1,089 ‐ ‐ ‐ 209
18 Contract Treated ‐ SEWPP Co‐participants ‐ ‐ ‐ ‐ ‐ ‐ ‐ ‐ ‐ ‐ ‐ ‐ 19,577,433 75
19 Contract Treated ‐ EWPP Water Authorities ‐ ‐ ‐ ‐ ‐ ‐ ‐ ‐ ‐ ‐ 13,022,188 ‐ ‐ 12
20 Contract Treated ‐ NEWPP Water Authorities ‐ ‐ ‐ ‐ ‐ ‐ ‐ ‐ ‐ ‐ ‐ 14,194,431 ‐ 8
21 Contract Treated with Airgap ‐ 10,491,103 14,001 ‐ ‐ ‐ ‐ ‐ 120 435 ‐ ‐ ‐ 92
22 Contract Treated without Airgap ‐ 1,353,711 1,672 2,691 ‐ ‐ ‐ ‐ 50 181 ‐ ‐ ‐ 38
23 Contract Water ‐ Untreated 79,129,675 ‐ ‐ ‐ ‐ ‐ ‐ ‐ 432 1,573 ‐ ‐ ‐ 5
24 Total 79,129,675 95,096,206 147,137 187,035 78,229,673 116,722 165,525 895,423 896,025 5,692,927 13,022,188 14,194,431 19,577,433 1,035,642
25 Test Year Unit Cost 0.32$ 2.89$ 588.61$ 137.35$ 1.79$ 427.89$ 574.81$ 20.39$ 30.07$ 3.05$ 0.76$ 1.11$ 0.81$ 2.55$
Common to Retail & Contract Customers Not
Contributing CapitalCommon to Retail Common to All

Houston Combined Utility System
Water System Customer Allocation ‐ FYE 2023 April Increase
Line
No. Customer Type Raw Water Base Max Day Max Hour Base Max Day Max Hour Fire
Meter
Charges
Billing &
Collecting EWPP WAs NEWPP WAs
SEWPP Co‐
parts TCEQ Fees Total
Common to Retail & Contract Customers Not
Contributing CapitalCommon to Retail Common to All
Allocation of Unit Costs to Customer Types26 Single Family Residential ‐$ 67,675,382$ 18,223,926$ 6,526,564$ 41,956,909$ 13,247,955$ 27,313,510$ 10,292,828$ 15,183,832$ 15,129,871$ ‐$ ‐$ ‐$ 1,046,523$ 216,597,301$
27 Multifamily Residential ‐ 74,851,996 14,827,448 6,596,909 46,406,216 10,778,872 27,607,900 886,833 1,308,243 493,592 ‐ ‐ ‐ 1,464,889 185,222,897$
28 CII ‐ Commercial ‐ 62,794,878 14,919,274 5,823,662 38,931,129 10,845,625 24,371,880 1,813,612 2,675,415 1,247,426 ‐ ‐ ‐ 110,510 163,533,411$
29 CII ‐ Emergency Backup ‐ 34,525 379,395 46,511 21,405 275,803 194,646 14,181 20,919 505 ‐ ‐ ‐ 44 987,932$
30 CII ‐ Extra Container ‐ 2,293 14,913 1,889 1,421 10,841 7,906 88 130 74 ‐ ‐ ‐ ‐ 39,556$
31 CII ‐ Government ‐ 10,863,192 13,815,946 2,318,303 6,734,886 10,043,557 9,702,039 207,315 305,829 44,304 ‐ ‐ ‐ 11,169 54,046,539$
32 CII ‐ Industrial Sewer Surcharge ‐ 1,990,312 520,175 190,102 1,233,940 378,143 795,574 29,048 42,851 6,162 ‐ ‐ ‐ 686 5,186,992$
33 CII ‐ Resale ‐ 25,509 16,894 3,630 15,815 12,281 15,190 343 506 37 ‐ ‐ ‐ 5 90,211$
34 CII ‐ Transient ‐ 1,115,078 1,741,683 275,713 691,318 1,266,123 1,153,854 58,562 86,389 23,572 ‐ ‐ ‐ 1,641 6,413,932$
35 Irrigation ‐ 6,984,950 3,971,027 917,484 4,330,481 2,886,753 3,839,647 279,425 412,203 215,236 ‐ ‐ ‐ 1,196 23,838,403$
36 Metered Fire ‐ 37,623 272,558 34,247 23,325 198,137 143,322 244,034 359,995 10,300 ‐ ‐ ‐ 82 1,323,624$
37 Unmetered Fire ‐ ‐ ‐ ‐ ‐ ‐ ‐ 4,427,005 6,530,655 193,151 ‐ ‐ ‐ ‐ 11,150,811$
38 Sewer Only ‐ ‐ ‐ ‐ ‐ ‐ ‐ ‐ ‐ ‐ ‐ ‐ ‐ ‐ ‐$
39 Drainage Only ‐ ‐ ‐ ‐ ‐ ‐ ‐ ‐ ‐ ‐ ‐ ‐ ‐ ‐ ‐$
40 GRP Participants ‐ Areas 1 & 2 ‐ 85,100 175,512 27,394 ‐ ‐ ‐ ‐ ‐ 258 ‐ ‐ ‐ 41 288,307$
41 GRP Participants ‐ Area 3 ‐ 14,446,413 8,501,705 2,557,458 ‐ ‐ ‐ ‐ ‐ 3,323 ‐ ‐ ‐ 531 25,509,429$
42 Contract Treated ‐ SEWPP Co‐participants ‐ ‐ ‐ ‐ ‐ ‐ ‐ ‐ ‐ ‐ ‐ ‐ 15,897,588 190 15,897,778$
43 Contract Treated ‐ EWPP Water Authorities ‐ ‐ ‐ ‐ ‐ ‐ ‐ ‐ ‐ ‐ 9,872,287 ‐ ‐ 31 9,872,318$
44 Contract Treated ‐ NEWPP Water Authorities ‐ ‐ ‐ ‐ ‐ ‐ ‐ ‐ ‐ ‐ ‐ 15,794,580 ‐ 21 15,794,601$
45 Contract Treated with Airgap ‐ 30,358,444 8,240,874 ‐ ‐ ‐ ‐ ‐ 3,601 1,329 ‐ ‐ ‐ 234 38,604,482$
46 Contract Treated without Airgap ‐ 3,917,277 984,428 369,562 ‐ ‐ ‐ ‐ 1,500 554 ‐ ‐ ‐ 98 5,273,418$
47 Contract Water ‐ Untreated 25,019,899 ‐ ‐ ‐ ‐ ‐ ‐ ‐ 13,004 4,799 ‐ ‐ ‐ 13 25,037,715$
48 Total 25,019,899$ 275,182,971$ 86,605,758$ 25,689,427$ 140,346,844$ 49,944,092$ 95,145,468$ 18,253,274$ 26,945,074$ 17,374,492$ 9,872,287$ 15,794,580$ 15,897,588$ 2,637,903$ 804,709,658$

Houston Combined Utility System
Water Cost of Service ComparisonFYE 2023 ‐ April Increase
A
Line
No. Cost of Service
1 Single Family Residential 216,597,301$
2 Multifamily Residential 185,222,897
3 CII ‐ Commercial 163,533,411
4 CII ‐ Emergency Backup 987,932
5 CII ‐ Extra Container 39,556
6 CII ‐ Government 54,046,539
7 CII ‐ Industrial Sewer Surcharge 5,186,992
8 CII ‐ Resale 90,211
9 CII ‐ Transient 6,413,932
10 Irrigation 23,838,403
11 Metered Fire 1,323,624
12 Unmetered Fire 11,150,811
13 GRP Participants ‐ Areas 1 & 2 288,307
14 GRP Participants ‐ Area 3 25,509,429
15 Contract Treated ‐ SEWPP Co‐participants 15,897,778
16 Contract Treated ‐ EWPP Water Authorities 9,872,318
17 Contract Treated ‐ NEWPP Water Authorities 15,794,601
18 Contract Treated with Airgap 38,604,482
19 Contract Treated without Airgap 5,273,418
20 Contract Water ‐ Untreated 25,037,715
21 Total 804,709,658$
Customer Type

Houston Combined Utility System
Water System Customer Allocation ‐ FYE 2024 April Increase
Line
No. Customer Type Raw Water Base Max Day Max Hour Base Max Day Max Hour Fire
Meter
Charges
Billing &
Collecting EWPP WAs NEWPP WAs
SEWPP Co‐
parts TCEQ Fees Total
Development of Unit Costs1 Units of Service kGal kGal kGal / day kGal / day kGal kGal / day kGal / day MEU MEU Bills kGal kGal kGal Connections
2 Single Family Residential ‐ 23,433,657 31,023 47,612 23,433,657 31,023 47,612 505,929 505,929 4,967,369 ‐ ‐ ‐ 411,687
3 Multifamily Residential ‐ 25,918,672 25,241 48,126 25,918,672 25,241 48,126 43,591 43,591 162,054 ‐ ‐ ‐ 576,266
4 CII ‐ Commercial ‐ 21,743,707 25,397 42,485 21,743,707 25,397 42,485 89,146 89,146 409,549 ‐ ‐ ‐ 43,473
5 CII ‐ Emergency Backup ‐ 11,955 646 339 11,955 646 339 697 697 166 ‐ ‐ ‐ 17
6 CII ‐ Extra Container ‐ 794 25 14 794 25 14 4 4 24 ‐ ‐ ‐ ‐
7 CII ‐ Government ‐ 3,761,550 23,519 16,912 3,761,550 23,519 16,912 10,190 10,190 14,546 ‐ ‐ ‐ 4,394
8 CII ‐ Industrial Sewer Surcharge ‐ 689,177 886 1,387 689,177 886 1,387 1,428 1,428 2,023 ‐ ‐ ‐ 270
9 CII ‐ Resale ‐ 8,833 29 26 8,833 29 26 17 17 12 ‐ ‐ ‐ 2
10 CII ‐ Transient ‐ 386,113 2,965 2,011 386,113 2,965 2,011 2,879 2,879 7,739 ‐ ‐ ‐ 645
11 Irrigation ‐ 2,418,648 6,760 6,693 2,418,648 6,760 6,693 13,735 13,735 70,665 ‐ ‐ ‐ 471
12 Metered Fire ‐ 13,027 464 250 13,027 464 250 11,995 11,995 3,382 ‐ ‐ ‐ 32
13 Unmetered Fire ‐ ‐ ‐ ‐ ‐ ‐ ‐ 217,603 217,603 63,414 ‐ ‐ ‐ ‐
14 Sewer Only ‐ ‐ ‐ ‐ ‐ ‐ ‐ ‐ ‐ ‐ ‐ ‐ ‐ ‐
15 Drainage Only ‐ ‐ ‐ ‐ ‐ ‐ ‐ ‐ ‐ ‐ ‐ ‐ ‐ ‐
16 GRP Participants ‐ Areas 1 & 2 ‐ 29,467 299 200 ‐ ‐ ‐ ‐ ‐ 85 ‐ ‐ ‐ 16
17 GRP Participants ‐ Area 3 ‐ 5,002,296 14,473 18,657 ‐ ‐ ‐ ‐ ‐ 1,091 ‐ ‐ ‐ 209
18 Contract Treated ‐ SEWPP Co‐participants ‐ ‐ ‐ ‐ ‐ ‐ ‐ ‐ ‐ ‐ ‐ ‐ 19,616,588 75
19 Contract Treated ‐ EWPP Water Authorities ‐ ‐ ‐ ‐ ‐ ‐ ‐ ‐ ‐ ‐ 13,048,232 ‐ ‐ 12
20 Contract Treated ‐ NEWPP Water Authorities ‐ ‐ ‐ ‐ ‐ ‐ ‐ ‐ ‐ ‐ ‐ 23,852,331 ‐ 8
21 Contract Treated with Airgap ‐ 10,512,085 14,029 ‐ ‐ ‐ ‐ ‐ 120 436 ‐ ‐ ‐ 92
22 Contract Treated without Airgap ‐ 1,356,418 1,676 2,696 ‐ ‐ ‐ ‐ 50 182 ‐ ‐ ‐ 38
23 Contract Water ‐ Untreated 79,287,934 ‐ ‐ ‐ ‐ ‐ ‐ ‐ 433 1,576 ‐ ‐ ‐ 5
24 Total 79,287,934 95,286,398 147,431 187,409 78,386,132 116,955 165,856 897,214 897,817 5,704,312 13,048,232 23,852,331 19,616,588 1,037,713
25 Test Year Unit Cost 0.32$ 3.06$ 622.25$ 144.75$ 1.90$ 452.32$ 607.63$ 21.40$ 31.13$ 3.10$ 0.77$ 0.96$ 0.83$ 2.60$
Common to Retail & Contract Customers Not
Contributing CapitalCommon to Retail Common to All

Houston Combined Utility System
Water System Customer Allocation ‐ FYE 2024 April Increase
Line
No. Customer Type Raw Water Base Max Day Max Hour Base Max Day Max Hour Fire
Meter
Charges
Billing &
Collecting EWPP WAs NEWPP WAs
SEWPP Co‐
parts TCEQ Fees Total
Common to Retail & Contract Customers Not
Contributing CapitalCommon to Retail Common to All
Allocation of Unit Costs to Customer Types26 Single Family Residential ‐$ 71,595,729$ 19,304,142$ 6,891,945$ 44,440,948$ 14,032,294$ 28,930,593$ 10,828,267$ 15,750,759$ 15,410,619$ ‐$ ‐$ ‐$ 1,071,640$ 228,256,937$
27 Multifamily Residential ‐ 79,188,076 15,706,339 6,966,228 49,153,674 11,417,030 29,242,412 932,966 1,357,090 502,751 ‐ ‐ ‐ 1,500,046 195,966,613$
28 CII ‐ Commercial ‐ 66,432,504 15,803,608 6,149,692 41,236,028 11,487,735 25,814,805 1,907,958 2,775,308 1,270,573 ‐ ‐ ‐ 113,162 172,991,374$
29 CII ‐ Emergency Backup ‐ 36,525 401,884 49,115 22,672 292,132 206,170 14,918 21,700 514 ‐ ‐ ‐ 45 1,045,674$
30 CII ‐ Extra Container ‐ 2,426 15,797 1,995 1,506 11,483 8,374 93 135 75 ‐ ‐ ‐ ‐ 41,884$
31 CII ‐ Government ‐ 11,492,483 14,634,881 2,448,090 7,133,622 10,638,181 10,276,444 218,100 317,248 45,126 ‐ ‐ ‐ 11,437 57,215,610$
32 CII ‐ Industrial Sewer Surcharge ‐ 2,105,608 551,008 200,745 1,306,995 400,531 842,676 30,559 44,451 6,276 ‐ ‐ ‐ 702 5,489,550$
33 CII ‐ Resale ‐ 26,986 17,896 3,833 16,751 13,008 16,090 361 525 38 ‐ ‐ ‐ 5 95,493$
34 CII ‐ Transient ‐ 1,179,673 1,844,920 291,149 732,247 1,341,084 1,222,167 61,608 89,615 24,009 ‐ ‐ ‐ 1,680 6,788,152$
35 Irrigation ‐ 7,389,579 4,206,408 968,848 4,586,865 3,057,662 4,066,972 293,961 427,594 219,230 ‐ ‐ ‐ 1,225 25,218,344$
36 Metered Fire ‐ 39,802 288,714 36,164 24,706 209,868 151,808 256,729 373,437 10,491 ‐ ‐ ‐ 84 1,391,803$
37 Unmetered Fire ‐ ‐ ‐ ‐ ‐ ‐ ‐ 4,657,301 6,774,493 196,735 ‐ ‐ ‐ ‐ 11,628,529$
38 Sewer Only ‐ ‐ ‐ ‐ ‐ ‐ ‐ ‐ ‐ ‐ ‐ ‐ ‐ ‐ ‐$
39 Drainage Only ‐ ‐ ‐ ‐ ‐ ‐ ‐ ‐ ‐ ‐ ‐ ‐ ‐ ‐ ‐$
40 GRP Participants ‐ Areas 1 & 2 ‐ 90,030 185,916 28,928 ‐ ‐ ‐ ‐ ‐ 263 ‐ ‐ ‐ 42 305,179$
41 GRP Participants ‐ Area 3 ‐ 15,283,275 9,005,640 2,700,633 ‐ ‐ ‐ ‐ ‐ 3,384 ‐ ‐ ‐ 544 26,993,477$
42 Contract Treated ‐ SEWPP Co‐participants ‐ ‐ ‐ ‐ ‐ ‐ ‐ ‐ ‐ ‐ ‐ ‐ 16,272,842 195 16,273,037$
43 Contract Treated ‐ EWPP Water Authorities ‐ ‐ ‐ ‐ ‐ ‐ ‐ ‐ ‐ ‐ 10,104,797 ‐ ‐ 32 10,104,829$
44 Contract Treated ‐ NEWPP Water Authorities ‐ ‐ ‐ ‐ ‐ ‐ ‐ ‐ ‐ ‐ ‐ 22,985,114 ‐ 21 22,985,135$
45 Contract Treated with Airgap ‐ 32,117,070 8,729,348 ‐ ‐ ‐ ‐ ‐ 3,736 1,354 ‐ ‐ ‐ 239 40,851,746$
46 Contract Treated without Airgap ‐ 4,144,199 1,042,780 390,251 ‐ ‐ ‐ ‐ 1,557 564 ‐ ‐ ‐ 100 5,579,451$
47 Contract Water ‐ Untreated 25,457,015 ‐ ‐ ‐ ‐ ‐ ‐ ‐ 13,490 4,888 ‐ ‐ ‐ 13 25,475,407$
48 Total 25,457,015$ 291,123,966$ 91,739,280$ 27,127,616$ 148,656,013$ 52,901,008$ 100,778,511$ 19,202,820$ 27,951,136$ 17,696,890$ 10,104,797$ 22,985,114$ 16,272,842$ 2,701,212$ 854,698,222$

Houston Combined Utility System
Water Cost of Service ComparisonFYE 2024 ‐ April Increase
A
Line
No. Cost of Service
1 Single Family Residential 228,256,937$
2 Multifamily Residential 195,966,613
3 CII ‐ Commercial 172,991,374
4 CII ‐ Emergency Backup 1,045,674
5 CII ‐ Extra Container 41,884
6 CII ‐ Government 57,215,610
7 CII ‐ Industrial Sewer Surcharge 5,489,550
8 CII ‐ Resale 95,493
9 CII ‐ Transient 6,788,152
10 Irrigation 25,218,344
11 Metered Fire 1,391,803
12 Unmetered Fire 11,628,529
13 GRP Participants ‐ Areas 1 & 2 305,179
14 GRP Participants ‐ Area 3 26,993,477
15 Contract Treated ‐ SEWPP Co‐participants 16,273,037
16 Contract Treated ‐ EWPP Water Authorities 10,104,829
17 Contract Treated ‐ NEWPP Water Authorities 22,985,135
18 Contract Treated with Airgap 40,851,746
19 Contract Treated without Airgap 5,579,451
20 Contract Water ‐ Untreated 25,475,407
21 Total 854,698,222$
Customer Type

Houston Combined Utility System
Water System Customer Allocation ‐ FYE 2025 April Increase
Line
No. Customer Type Raw Water Base Max Day Max Hour Base Max Day Max Hour Fire
Meter
Charges
Billing &
Collecting EWPP WAs NEWPP WAs
SEWPP Co‐
parts TCEQ Fees Total
Development of Unit Costs1 Units of Service kGal kGal kGal / day kGal / day kGal kGal / day kGal / day MEU MEU Bills kGal kGal kGal Connections
2 Single Family Residential ‐ 23,480,524 31,085 47,708 23,480,524 31,085 47,708 506,941 506,941 4,977,304 ‐ ‐ ‐ 412,511
3 Multifamily Residential ‐ 25,970,509 25,292 48,222 25,970,509 25,292 48,222 43,678 43,678 162,378 ‐ ‐ ‐ 577,419
4 CII ‐ Commercial ‐ 21,787,194 25,448 42,570 21,787,194 25,448 42,570 89,324 89,324 410,368 ‐ ‐ ‐ 43,560
5 CII ‐ Emergency Backup ‐ 11,979 647 340 11,979 647 340 698 698 166 ‐ ‐ ‐ 17
6 CII ‐ Extra Container ‐ 795 25 14 795 25 14 4 4 24 ‐ ‐ ‐ ‐
7 CII ‐ Government ‐ 3,769,073 23,566 16,946 3,769,073 23,566 16,946 10,211 10,211 14,575 ‐ ‐ ‐ 4,402
8 CII ‐ Industrial Sewer Surcharge ‐ 690,555 887 1,390 690,555 887 1,390 1,431 1,431 2,027 ‐ ‐ ‐ 270
9 CII ‐ Resale ‐ 8,850 29 27 8,850 29 27 17 17 12 ‐ ‐ ‐ 2
10 CII ‐ Transient ‐ 386,885 2,971 2,015 386,885 2,971 2,015 2,884 2,884 7,754 ‐ ‐ ‐ 647
11 Irrigation ‐ 2,423,485 6,773 6,707 2,423,485 6,773 6,707 13,762 13,762 70,807 ‐ ‐ ‐ 472
12 Metered Fire ‐ 13,054 465 250 13,054 465 250 12,019 12,019 3,388 ‐ ‐ ‐ 32
13 Unmetered Fire ‐ ‐ ‐ ‐ ‐ ‐ ‐ 218,038 218,038 63,541 ‐ ‐ ‐ ‐
14 Sewer Only ‐ ‐ ‐ ‐ ‐ ‐ ‐ ‐ ‐ ‐ ‐ ‐ ‐ ‐
15 Drainage Only ‐ ‐ ‐ ‐ ‐ ‐ ‐ ‐ ‐ ‐ ‐ ‐ ‐ ‐
16 GRP Participants ‐ Areas 1 & 2 ‐ 29,526 299 200 ‐ ‐ ‐ ‐ ‐ 85 ‐ ‐ ‐ 16
17 GRP Participants ‐ Area 3 ‐ 5,012,300 14,502 18,694 ‐ ‐ ‐ ‐ ‐ 1,093 ‐ ‐ ‐ 209
18 Contract Treated ‐ SEWPP Co‐participants ‐ ‐ ‐ ‐ ‐ ‐ ‐ ‐ ‐ ‐ ‐ ‐ 19,655,822 75
19 Contract Treated ‐ EWPP Water Authorities ‐ ‐ ‐ ‐ ‐ ‐ ‐ ‐ ‐ ‐ 13,074,329 ‐ ‐ 12
20 Contract Treated ‐ NEWPP Water Authorities ‐ ‐ ‐ ‐ ‐ ‐ ‐ ‐ ‐ ‐ ‐ 28,681,281 ‐ 8
21 Contract Treated with Airgap ‐ 10,533,109 14,057 ‐ ‐ ‐ ‐ ‐ 120 437 ‐ ‐ ‐ 92
22 Contract Treated without Airgap ‐ 1,359,131 1,679 2,701 ‐ ‐ ‐ ‐ 50 182 ‐ ‐ ‐ 38
23 Contract Water ‐ Untreated 79,446,510 ‐ ‐ ‐ ‐ ‐ ‐ ‐ 434 1,579 ‐ ‐ ‐ 5
24 Total 79,446,510 95,476,971 147,726 187,784 78,542,904 117,189 166,188 899,008 899,613 5,715,721 13,074,329 28,681,281 19,655,822 1,039,789
25 Test Year Unit Cost 0.32$ 3.24$ 659.83$ 153.55$ 2.02$ 482.02$ 647.53$ 22.58$ 32.14$ 3.11$ 0.79$ 0.96$ 0.85$ 2.66$
Common to Retail & Contract Customers Not
Contributing CapitalCommon to Retail Common to All
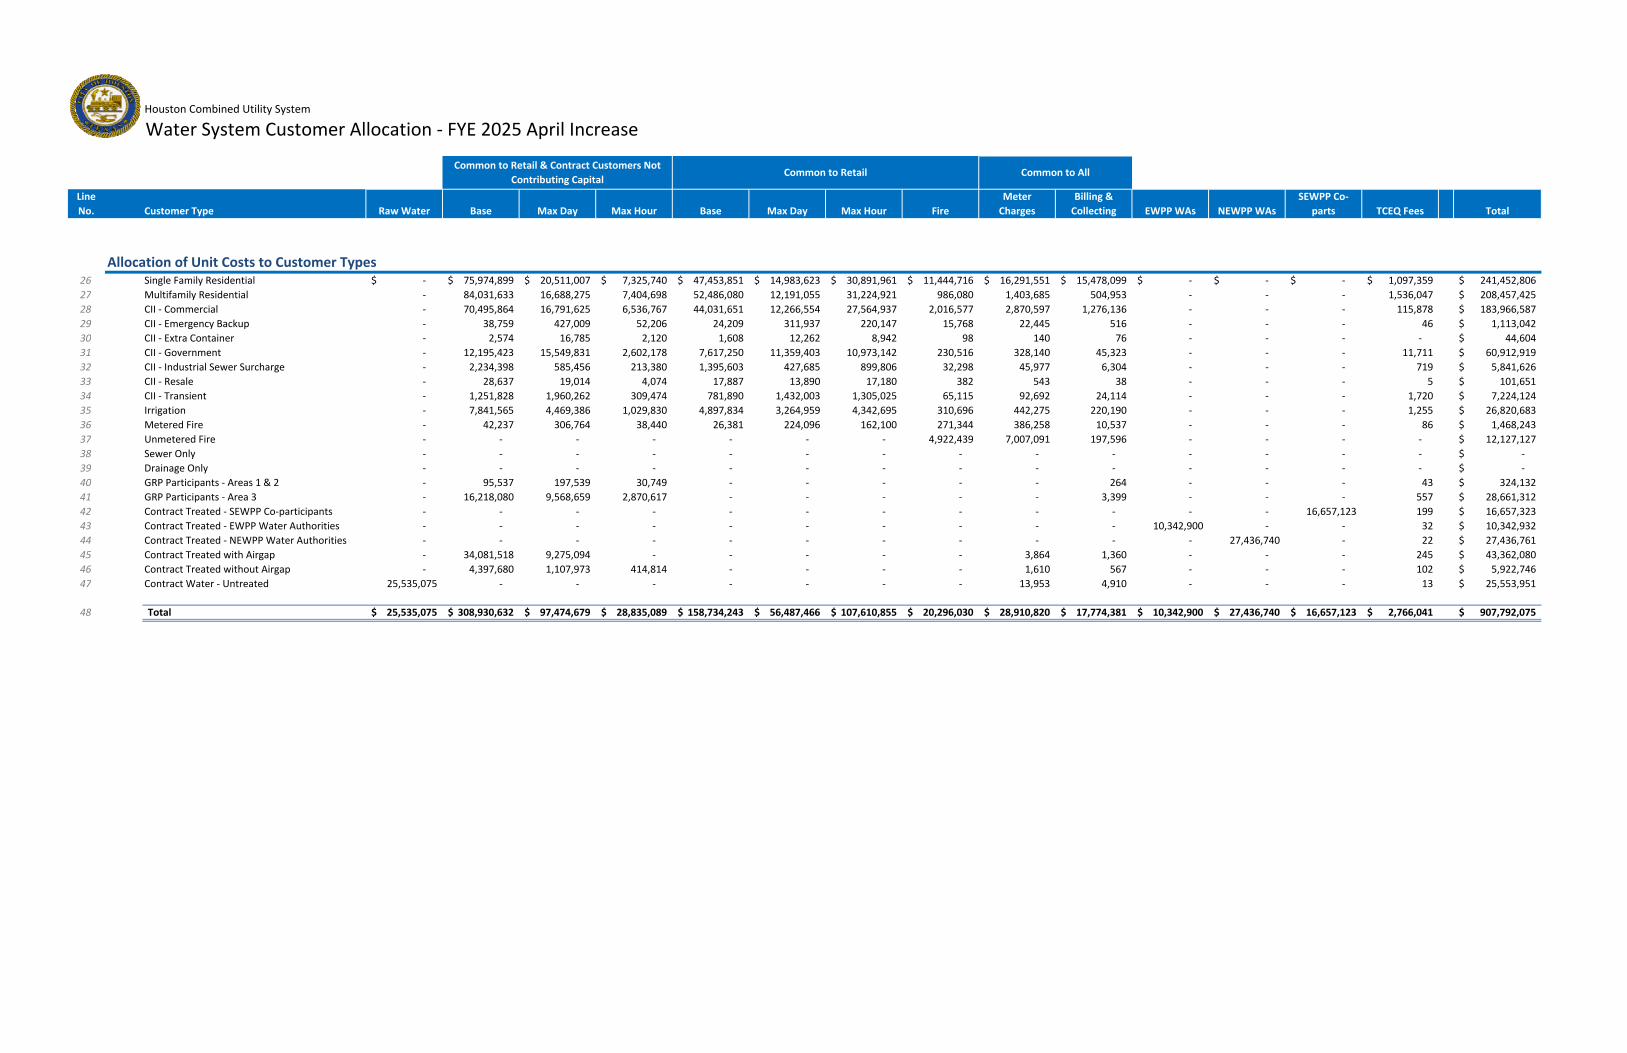
Houston Combined Utility System
Water System Customer Allocation ‐ FYE 2025 April Increase
Line
No. Customer Type Raw Water Base Max Day Max Hour Base Max Day Max Hour Fire
Meter
Charges
Billing &
Collecting EWPP WAs NEWPP WAs
SEWPP Co‐
parts TCEQ Fees Total
Common to Retail & Contract Customers Not
Contributing CapitalCommon to Retail Common to All
Allocation of Unit Costs to Customer Types26 Single Family Residential ‐$ 75,974,899$ 20,511,007$ 7,325,740$ 47,453,851$ 14,983,623$ 30,891,961$ 11,444,716$ 16,291,551$ 15,478,099$ ‐$ ‐$ ‐$ 1,097,359$ 241,452,806$
27 Multifamily Residential ‐ 84,031,633 16,688,275 7,404,698 52,486,080 12,191,055 31,224,921 986,080 1,403,685 504,953 ‐ ‐ ‐ 1,536,047 208,457,425$
28 CII ‐ Commercial ‐ 70,495,864 16,791,625 6,536,767 44,031,651 12,266,554 27,564,937 2,016,577 2,870,597 1,276,136 ‐ ‐ ‐ 115,878 183,966,587$
29 CII ‐ Emergency Backup ‐ 38,759 427,009 52,206 24,209 311,937 220,147 15,768 22,445 516 ‐ ‐ ‐ 46 1,113,042$
30 CII ‐ Extra Container ‐ 2,574 16,785 2,120 1,608 12,262 8,942 98 140 76 ‐ ‐ ‐ ‐ 44,604$
31 CII ‐ Government ‐ 12,195,423 15,549,831 2,602,178 7,617,250 11,359,403 10,973,142 230,516 328,140 45,323 ‐ ‐ ‐ 11,711 60,912,919$
32 CII ‐ Industrial Sewer Surcharge ‐ 2,234,398 585,456 213,380 1,395,603 427,685 899,806 32,298 45,977 6,304 ‐ ‐ ‐ 719 5,841,626$
33 CII ‐ Resale ‐ 28,637 19,014 4,074 17,887 13,890 17,180 382 543 38 ‐ ‐ ‐ 5 101,651$
34 CII ‐ Transient ‐ 1,251,828 1,960,262 309,474 781,890 1,432,003 1,305,025 65,115 92,692 24,114 ‐ ‐ ‐ 1,720 7,224,124$
35 Irrigation ‐ 7,841,565 4,469,386 1,029,830 4,897,834 3,264,959 4,342,695 310,696 442,275 220,190 ‐ ‐ ‐ 1,255 26,820,683$
36 Metered Fire ‐ 42,237 306,764 38,440 26,381 224,096 162,100 271,344 386,258 10,537 ‐ ‐ ‐ 86 1,468,243$
37 Unmetered Fire ‐ ‐ ‐ ‐ ‐ ‐ ‐ 4,922,439 7,007,091 197,596 ‐ ‐ ‐ ‐ 12,127,127$
38 Sewer Only ‐ ‐ ‐ ‐ ‐ ‐ ‐ ‐ ‐ ‐ ‐ ‐ ‐ ‐ ‐$
39 Drainage Only ‐ ‐ ‐ ‐ ‐ ‐ ‐ ‐ ‐ ‐ ‐ ‐ ‐ ‐ ‐$
40 GRP Participants ‐ Areas 1 & 2 ‐ 95,537 197,539 30,749 ‐ ‐ ‐ ‐ ‐ 264 ‐ ‐ ‐ 43 324,132$
41 GRP Participants ‐ Area 3 ‐ 16,218,080 9,568,659 2,870,617 ‐ ‐ ‐ ‐ ‐ 3,399 ‐ ‐ ‐ 557 28,661,312$
42 Contract Treated ‐ SEWPP Co‐participants ‐ ‐ ‐ ‐ ‐ ‐ ‐ ‐ ‐ ‐ ‐ ‐ 16,657,123 199 16,657,323$
43 Contract Treated ‐ EWPP Water Authorities ‐ ‐ ‐ ‐ ‐ ‐ ‐ ‐ ‐ ‐ 10,342,900 ‐ ‐ 32 10,342,932$
44 Contract Treated ‐ NEWPP Water Authorities ‐ ‐ ‐ ‐ ‐ ‐ ‐ ‐ ‐ ‐ ‐ 27,436,740 ‐ 22 27,436,761$
45 Contract Treated with Airgap ‐ 34,081,518 9,275,094 ‐ ‐ ‐ ‐ ‐ 3,864 1,360 ‐ ‐ ‐ 245 43,362,080$
46 Contract Treated without Airgap ‐ 4,397,680 1,107,973 414,814 ‐ ‐ ‐ ‐ 1,610 567 ‐ ‐ ‐ 102 5,922,746$
47 Contract Water ‐ Untreated 25,535,075 ‐ ‐ ‐ ‐ ‐ ‐ ‐ 13,953 4,910 ‐ ‐ ‐ 13 25,553,951$
48 Total 25,535,075$ 308,930,632$ 97,474,679$ 28,835,089$ 158,734,243$ 56,487,466$ 107,610,855$ 20,296,030$ 28,910,820$ 17,774,381$ 10,342,900$ 27,436,740$ 16,657,123$ 2,766,041$ 907,792,075$

Houston Combined Utility System
Water Cost of Service ComparisonFYE 2025 ‐ April Increase
A
Line
No. Cost of Service
1 Single Family Residential 241,452,806$
2 Multifamily Residential 208,457,425
3 CII ‐ Commercial 183,966,587
4 CII ‐ Emergency Backup 1,113,042
5 CII ‐ Extra Container 44,604
6 CII ‐ Government 60,912,919
7 CII ‐ Industrial Sewer Surcharge 5,841,626
8 CII ‐ Resale 101,651
9 CII ‐ Transient 7,224,124
10 Irrigation 26,820,683
11 Metered Fire 1,468,243
12 Unmetered Fire 12,127,127
13 GRP Participants ‐ Areas 1 & 2 324,132
14 GRP Participants ‐ Area 3 28,661,312
15 Contract Treated ‐ SEWPP Co‐participants 16,657,323
16 Contract Treated ‐ EWPP Water Authorities 10,342,932
17 Contract Treated ‐ NEWPP Water Authorities 27,436,761
18 Contract Treated with Airgap 43,362,080
19 Contract Treated without Airgap 5,922,746
20 Contract Water ‐ Untreated 25,553,951
21 Total 907,792,075$
Customer Type

Houston Combined Utility System
Water System Customer Allocation ‐ FYE 2026 April Increase
Line
No. Customer Type Raw Water Base Max Day Max Hour Base Max Day Max Hour Fire
Meter
Charges
Billing &
Collecting EWPP WAs NEWPP WAs
SEWPP Co‐
parts TCEQ Fees Total
Development of Unit Costs1 Units of Service kGal kGal kGal / day kGal / day kGal kGal / day kGal / day MEU MEU Bills kGal kGal kGal Connections
2 Single Family Residential ‐ 23,527,485 31,147 47,803 23,527,485 31,147 47,803 507,955 507,955 4,987,258 ‐ ‐ ‐ 413,336
3 Multifamily Residential ‐ 26,022,450 25,342 48,318 26,022,450 25,342 48,318 43,766 43,766 162,703 ‐ ‐ ‐ 578,574
4 CII ‐ Commercial ‐ 21,830,768 25,499 42,655 21,830,768 25,499 42,655 89,502 89,502 411,189 ‐ ‐ ‐ 43,647
5 CII ‐ Emergency Backup ‐ 12,003 648 341 12,003 648 341 700 700 166 ‐ ‐ ‐ 17
6 CII ‐ Extra Container ‐ 797 25 14 797 25 14 4 4 24 ‐ ‐ ‐ ‐
7 CII ‐ Government ‐ 3,776,611 23,613 16,980 3,776,611 23,613 16,980 10,231 10,231 14,604 ‐ ‐ ‐ 4,411
8 CII ‐ Industrial Sewer Surcharge ‐ 691,936 889 1,392 691,936 889 1,392 1,434 1,434 2,031 ‐ ‐ ‐ 271
9 CII ‐ Resale ‐ 8,868 29 27 8,868 29 27 17 17 12 ‐ ‐ ‐ 2
10 CII ‐ Transient ‐ 387,659 2,977 2,019 387,659 2,977 2,019 2,890 2,890 7,770 ‐ ‐ ‐ 648
11 Irrigation ‐ 2,428,332 6,787 6,720 2,428,332 6,787 6,720 13,790 13,790 70,948 ‐ ‐ ‐ 473
12 Metered Fire ‐ 13,080 466 251 13,080 466 251 12,043 12,043 3,395 ‐ ‐ ‐ 32
13 Unmetered Fire ‐ ‐ ‐ ‐ ‐ ‐ ‐ 218,474 218,474 63,668 ‐ ‐ ‐ ‐
14 Sewer Only ‐ ‐ ‐ ‐ ‐ ‐ ‐ ‐ ‐ ‐ ‐ ‐ ‐ ‐
15 Drainage Only ‐ ‐ ‐ ‐ ‐ ‐ ‐ ‐ ‐ ‐ ‐ ‐ ‐ ‐
16 GRP Participants ‐ Areas 1 & 2 ‐ 29,585 300 201 ‐ ‐ ‐ ‐ ‐ 85 ‐ ‐ ‐ 16
17 GRP Participants ‐ Area 3 ‐ 5,022,325 14,531 18,732 ‐ ‐ ‐ ‐ ‐ 1,095 ‐ ‐ ‐ 210
18 Contract Treated ‐ SEWPP Co‐participants ‐ ‐ ‐ ‐ ‐ ‐ ‐ ‐ ‐ ‐ ‐ ‐ 19,695,133 75
19 Contract Treated ‐ EWPP Water Authorities ‐ ‐ ‐ ‐ ‐ ‐ ‐ ‐ ‐ ‐ 13,100,477 ‐ ‐ 12
20 Contract Treated ‐ NEWPP Water Authorities ‐ ‐ ‐ ‐ ‐ ‐ ‐ ‐ ‐ ‐ ‐ 47,997,081 ‐ 8
21 Contract Treated with Airgap ‐ 10,554,175 14,085 ‐ ‐ ‐ ‐ ‐ 120 438 ‐ ‐ ‐ 92
22 Contract Treated without Airgap ‐ 1,361,849 1,683 2,707 ‐ ‐ ‐ ‐ 50 183 ‐ ‐ ‐ 39
23 Contract Water ‐ Untreated 79,605,403 ‐ ‐ ‐ ‐ ‐ ‐ ‐ 435 1,582 ‐ ‐ ‐ 5
24 Total 79,605,403 95,667,925 148,021 188,159 78,699,990 117,423 166,520 900,806 901,412 5,727,153 13,100,477 47,997,081 19,695,133 1,041,868
25 Test Year Unit Cost 0.32$ 3.39$ 693.07$ 160.15$ 2.12$ 504.56$ 677.81$ 23.44$ 32.77$ 3.09$ 0.81$ 0.92$ 0.87$ 2.72$
Common to Retail & Contract Customers Not
Contributing CapitalCommon to Retail Common to All

Houston Combined Utility System
Water System Customer Allocation ‐ FYE 2026 April Increase
Line
No. Customer Type Raw Water Base Max Day Max Hour Base Max Day Max Hour Fire
Meter
Charges
Billing &
Collecting EWPP WAs NEWPP WAs
SEWPP Co‐
parts TCEQ Fees Total
Common to Retail & Contract Customers Not
Contributing CapitalCommon to Retail Common to All
Allocation of Unit Costs to Customer Types26 Single Family Residential ‐$ 79,813,679$ 21,587,228$ 7,655,847$ 49,772,676$ 15,715,795$ 32,401,492$ 11,905,947$ 16,647,081$ 15,418,761$ ‐$ ‐$ ‐$ 1,123,696$ 252,042,202$
27 Multifamily Residential ‐ 88,277,496 17,563,915 7,738,363 55,050,804 12,786,769 32,750,722 1,025,820 1,434,317 503,017 ‐ ‐ ‐ 1,572,912 218,704,134$
28 CII ‐ Commercial ‐ 74,057,805 17,672,689 6,831,322 46,183,251 12,865,957 28,911,893 2,097,846 2,933,242 1,271,244 ‐ ‐ ‐ 118,659 192,943,909$
29 CII ‐ Emergency Backup ‐ 40,717 449,414 54,558 25,392 327,180 230,905 16,403 22,935 514 ‐ ‐ ‐ 47 1,168,066$
30 CII ‐ Extra Container ‐ 2,704 17,666 2,216 1,686 12,861 9,379 102 143 75 ‐ ‐ ‐ ‐ 46,832$
31 CII ‐ Government ‐ 12,811,621 16,365,737 2,719,435 7,989,466 11,914,479 11,509,343 239,806 335,301 45,150 ‐ ‐ ‐ 11,992 63,942,330$
32 CII ‐ Industrial Sewer Surcharge ‐ 2,347,296 616,175 222,996 1,463,799 448,584 943,774 33,600 46,980 6,280 ‐ ‐ ‐ 736 6,130,219$
33 CII ‐ Resale ‐ 30,084 20,012 4,258 18,761 14,569 18,020 397 555 38 ‐ ‐ ‐ 6 106,699$
34 CII ‐ Transient ‐ 1,315,079 2,063,118 323,420 820,097 1,501,978 1,368,794 67,740 94,715 24,022 ‐ ‐ ‐ 1,762 7,580,723$
35 Irrigation ‐ 8,237,775 4,703,896 1,076,235 5,137,166 3,424,500 4,554,900 323,217 451,927 219,346 ‐ ‐ ‐ 1,285 28,130,248$
36 Metered Fire ‐ 44,371 322,860 40,173 27,670 235,046 170,021 282,279 394,688 10,497 ‐ ‐ ‐ 88 1,527,693$
37 Unmetered Fire ‐ ‐ ‐ ‐ ‐ ‐ ‐ 5,120,817 7,160,007 196,839 ‐ ‐ ‐ ‐ 12,477,663$
38 Sewer Only ‐ ‐ ‐ ‐ ‐ ‐ ‐ ‐ ‐ ‐ ‐ ‐ ‐ ‐ ‐$
39 Drainage Only ‐ ‐ ‐ ‐ ‐ ‐ ‐ ‐ ‐ ‐ ‐ ‐ ‐ ‐ ‐$
40 GRP Participants ‐ Areas 1 & 2 ‐ 100,364 207,904 32,134 ‐ ‐ ‐ ‐ ‐ 263 ‐ ‐ ‐ 44 340,710$
41 GRP Participants ‐ Area 3 ‐ 17,037,530 10,070,730 2,999,971 ‐ ‐ ‐ ‐ ‐ 3,386 ‐ ‐ ‐ 571 30,112,188$
42 Contract Treated ‐ SEWPP Co‐participants ‐ ‐ ‐ ‐ ‐ ‐ ‐ ‐ ‐ ‐ ‐ ‐ 17,050,579 204 17,050,783$
43 Contract Treated ‐ EWPP Water Authorities ‐ ‐ ‐ ‐ ‐ ‐ ‐ ‐ ‐ ‐ 10,586,689 ‐ ‐ 33 10,586,722$
44 Contract Treated ‐ NEWPP Water Authorities ‐ ‐ ‐ ‐ ‐ ‐ ‐ ‐ ‐ ‐ ‐ 44,064,885 ‐ 22 44,064,907$
45 Contract Treated with Airgap ‐ 35,803,553 9,761,761 ‐ ‐ ‐ ‐ ‐ 3,948 1,354 ‐ ‐ ‐ 251 45,570,868$
46 Contract Treated without Airgap ‐ 4,619,882 1,166,109 433,506 ‐ ‐ ‐ ‐ 1,645 564 ‐ ‐ ‐ 105 6,221,811$
47 Contract Water ‐ Untreated 25,416,251 ‐ ‐ ‐ ‐ ‐ ‐ ‐ 14,258 4,891 ‐ ‐ ‐ 14 25,435,413$
48 Total 25,416,251$ 324,539,956$ 102,589,215$ 30,134,434$ 166,490,768$ 59,247,718$ 112,869,243$ 21,113,975$ 29,541,740$ 17,706,240$ 10,586,689$ 44,064,885$ 17,050,579$ 2,832,426$ 964,184,119$

Houston Combined Utility System
Water Cost of Service ComparisonFYE 2026 ‐ April Increase
A
Line
No. Cost of Service
1 Single Family Residential 252,042,202$
2 Multifamily Residential 218,704,134
3 CII ‐ Commercial 192,943,909
4 CII ‐ Emergency Backup 1,168,066
5 CII ‐ Extra Container 46,832
6 CII ‐ Government 63,942,330
7 CII ‐ Industrial Sewer Surcharge 6,130,219
8 CII ‐ Resale 106,699
9 CII ‐ Transient 7,580,723
10 Irrigation 28,130,248
11 Metered Fire 1,527,693
12 Unmetered Fire 12,477,663
13 GRP Participants ‐ Areas 1 & 2 340,710
14 GRP Participants ‐ Area 3 30,112,188
15 Contract Treated ‐ SEWPP Co‐participants 17,050,783
16 Contract Treated ‐ EWPP Water Authorities 10,586,722
17 Contract Treated ‐ NEWPP Water Authorities 44,064,907
18 Contract Treated with Airgap 45,570,868
19 Contract Treated without Airgap 6,221,811
20 Contract Water ‐ Untreated 25,435,413
21 Total 964,184,119$
Customer Type

WATER AND WASTEWATER COST OF SERVICE RATE STUDY | CITY OF HOUSTON
DRAFT | APRIL
Appendix H
WASTEWATER COST OF SERVICE ANALYSIS

Houston Combined Utility System
Wastewater Cost Allocation
Line
No. Flow ‐ Retail
Flow ‐ Retail + Cat.
Y Wholesale Flow ‐ All Capacity BOD ‐ O&M BOD ‐ Capital TSS ‐ O&M TSS ‐ Capital Ammonia ‐ O&M Ammonia ‐ Capital Industrial Customer General
Allocation of Functionalized Assets to Rate ComponentsAllocation Basis
1 Plants & Structures General 0.0% 0.0% 0.0% 40.0% 0.0% 30.0% 0.0% 30.0% 0.0% 0.0% 0.0% 0.0% 0.0% 1,113,643$
2 Electrical, Mechanical, Controls General 0.0% 0.0% 0.0% 0.0% 0.0% 0.0% 0.0% 0.0% 0.0% 0.0% 0.0% 0.0% 100.0% 810,752$
3 Source of Supply ‐ Wells General 0.0% 0.0% 0.0% 0.0% 0.0% 0.0% 0.0% 0.0% 0.0% 0.0% 0.0% 0.0% 100.0% 3,472$
4 Lifts and Pump Stations Lift Stations 0.0% 100.0% 0.0% 0.0% 0.0% 0.0% 0.0% 0.0% 0.0% 0.0% 0.0% 0.0% 0.0% 220,842$
Wastewater Lines
5 Interceptors Collection System 0.0% 100.0% 0.0% 0.0% 0.0% 0.0% 0.0% 0.0% 0.0% 0.0% 0.0% 0.0% 0.0% 1,654,900$
6 Local Collectors Collection System 100.0% 0.0% 0.0% 0.0% 0.0% 0.0% 0.0% 0.0% 0.0% 0.0% 0.0% 0.0% 0.0% 2,120,338$
7 Land & Site General 0.0% 0.0% 0.0% 0.0% 0.0% 0.0% 0.0% 0.0% 0.0% 0.0% 0.0% 0.0% 100.0% 34,233$
8 Meters & Water Supply Line to the Meter General 0.0% 0.0% 0.0% 0.0% 0.0% 0.0% 0.0% 0.0% 0.0% 0.0% 0.0% 0.0% 100.0% ‐$
9 SCADA System General 0.0% 0.0% 0.0% 0.0% 0.0% 0.0% 0.0% 0.0% 0.0% 0.0% 0.0% 0.0% 100.0% 25,464$
10 Pumps General 0.0% 0.0% 0.0% 0.0% 0.0% 0.0% 0.0% 0.0% 0.0% 0.0% 0.0% 0.0% 100.0% ‐$
11 Fuel Tanks General 0.0% 0.0% 0.0% 0.0% 0.0% 0.0% 0.0% 0.0% 0.0% 0.0% 0.0% 0.0% 100.0% 1,072$
12 Chemical Tanks General 0.0% 0.0% 0.0% 0.0% 0.0% 0.0% 0.0% 0.0% 0.0% 0.0% 0.0% 0.0% 100.0% 14,958$
13 Ground Storage Tanks General 0.0% 0.0% 0.0% 0.0% 0.0% 0.0% 0.0% 0.0% 0.0% 0.0% 0.0% 0.0% 100.0% ‐$
14 Elevated Storage Tank General 0.0% 0.0% 0.0% 0.0% 0.0% 0.0% 0.0% 0.0% 0.0% 0.0% 0.0% 0.0% 100.0% ‐$
15 Asset Allocation Subtotal 2,120,338$ 1,875,742$ ‐$ 445,457$ ‐$ 334,093$ ‐$ 334,093$ ‐$ ‐$ ‐$ ‐$ 889,952$ 5,999,676$
16 35% 31% 0% 7% 0% 6% 0% 6% 0% 0% 0% 0% 15%
17 Reallocation as "As All Others" 6% 5% 0% 1% 0% 1% 0% 1% 0% 0% 0% 0%
18 Total ($) Allocation 2,489,634$ 2,202,437$ ‐$ 523,042$ ‐$ 392,281$ ‐$ 392,281$ ‐$ ‐$ ‐$ ‐$ 5,999,676$
19 Total (%) Allocation 41.5% 36.7% 0.0% 8.7% 0.0% 6.5% 0.0% 6.5% 0.0% 0.0% 0.0% 0.0%

Houston Combined Utility System
Wastewater Functionalization of Costs
Line
No. Cost Center
Influent
Pumping &
Headworks Aeration Clarifiers
Chrlor. /
Dechlor.
Solids
Thickening /
Digestion
Biosolids
Handling
Effluent
Discharge Ind. WW Svc. Lift Stations
Collection
System
Customer
Billing Admin
Treatment +
Collection
General General
Functional Allocation of O&M Cost Centers (%)Wastewater Operations
1 40001 WWO Executive Support G&A 0% 0% 0% 0% 0% 0% 0% 0% 0% 0% 0% 100% 0% 0%
2 40002 WWO Collection System Analysis 0% 0% 0% 0% 0% 0% 0% 0% 0% 100% 0% 0% 0% 0%
3 40003 WWO Collection System Repairs 0% 0% 0% 0% 0% 0% 0% 0% 0% 100% 0% 0% 0% 0%
4 40004 WWO Regulatory and Compliance 0% 0% 0% 0% 0% 0% 70% 30% 0% 0% 0% 0% 0% 0%
5 40005 WWO Technical Services G&A 0% 0% 0% 0% 0% 0% 0% 0% 0% 0% 0% 0% 100% 0%
6 40006 WWO Plant Operations 14% 14% 14% 14% 14% 14% 14% 0% 0% 0% 0% 0% 0% 0%
7 40007 WWO Electrical & Automation 5% 3% 3% 20% 0% 0% 5% 0% 60% 5% 0% 0% 0% 0%
8 40008 WWO Construction Management 1% 1% 1% 0% 0% 0% 0% 0% 2% 95% 0% 0% 0% 0%
9 40009 WWO Contract Management 20% 10% 20% 0% 0% 0% 0% 0% 40% 10% 0% 0% 0% 0%
10 40010 WWO Mechanical Management 10% 10% 10% 0% 10% 10% 0% 0% 50% 0% 0% 0% 0% 0%
11 40031 WWO EPA Compliance 0% 0% 0% 0% 0% 0% 0% 0% 0% 100% 0% 0% 0% 0%
Operation Services ‐ Houston Wastewater G&A
12 40021 OPS Financial & Support Operation Services G&A 0% 0% 0% 0% 0% 0% 0% 0% 0% 0% 0% 100% 0% 0%
13 40022 HW Planning 0% 0% 0% 0% 0% 0% 5% 0% 0% 45% 0% 50% 0% 0%
14 40023 OPS Maintenance Operation Services ‐ Restoration 0% 0% 0% 0% 0% 0% 0% 0% 0% 100% 0% 0% 0% 0%
15 40024 OPS Maintenance Operation Services‐COS/DIS 0% 0% 0% 0% 0% 0% 0% 0% 0% 100% 0% 0% 0% 0%
16 40025 HW GIS Services 0% 0% 0% 0% 0% 0% 10% 3% 20% 60% 0% 2% 0% 5%
17 40026 OPS Executive Support 0% 0% 0% 0% 0% 0% 0% 0% 0% 0% 0% 100% 0% 0%
18 40027 OPS Support Services 0% 0% 0% 0% 0% 0% 0% 0% 0% 0% 0% 100% 0% 0%
19 40028 HW Infrastructure Planning 0% 0% 0% 0% 0% 0% 5% 0% 0% 45% 0% 50% 0% 0%
20 40029 HW Utility Analysis 0% 0% 0% 0% 0% 0% 5% 0% 0% 45% 0% 50% 0% 0%
Other O&M
21 30001‐30009 Director's Office 0% 0% 0% 0% 0% 0% 0% 0% 0% 0% 0% 0% 0% 100%
22 80001 Information Technology 0% 0% 0% 0% 0% 0% 0% 0% 0% 0% 0% 0% 0% 100%
23 90001‐90011 Management Support 0% 0% 0% 0% 0% 0% 0% 0% 0% 0% 0% 0% 0% 100%
24 60005 & 60008 Houston Water ‐ Planning 0% 0% 0% 0% 0% 0% 0% 0% 0% 0% 0% 0% 0% 100%
25 0005,50006,50030 Financial Mangt Services Support 0% 0% 0% 0% 0% 0% 0% 0% 0% 0% 0% 0% 0% 100%
26 100007‐15, 100025 CAS ‐ Customer Account Services 0% 0% 0% 0% 0% 0% 0% 0% 0% 0% 100% 0% 0% 0%
27 Deductions 0% 0% 0% 0% 0% 0% 0% 0% 0% 0% 0% 0% 0% 100%

Houston Combined Utility System
Wastewater Cost Allocation
Line
No. Flow ‐ Retail
Flow ‐ Retail + Cat.
Y Wholesale Flow ‐ All Capacity BOD ‐ O&M BOD ‐ Capital TSS ‐ O&M TSS ‐ Capital Ammonia ‐ O&M Ammonia ‐ Capital Industrial Customer General Total FYE 2022
Allocation of Functionalized O&M to Rate Components1 Influent Pumping & Headworks 0% 0% 100% 0% 0% 0% 0% 0% 0% 0% 0% 0% 0% 18,498$
2 Aeration 0% 0% 0% 0% 50% 0% 0% 0% 50% 0% 0% 0% 0% 15,102$ 3 Clarifiers 0% 0% 0% 0% 0% 0% 100% 0% 0% 0% 0% 0% 0% 18,204$
4 Chrlor. / Dechlor. 0% 0% 100% 0% 0% 0% 0% 0% 0% 0% 0% 0% 0% 11,492$
5 Solids Thickening / Digestion 0% 0% 0% 0% 5% 0% 95% 0% 0% 0% 0% 0% 0% 11,645$
6 Biosolids Handling 0% 0% 0% 0% 0% 0% 100% 0% 0% 0% 0% 0% 0% 11,645$
7 Effluent Discharge 0% 0% 100% 0% 0% 0% 0% 0% 0% 0% 0% 0% 0% 18,603$
8 Ind. WW Svc. 0% 0% 0% 0% 0% 0% 0% 0% 0% 0% 100% 0% 0% 3,637$
9 Lift Stations 0% 100% 0% 0% 0% 0% 0% 0% 0% 0% 0% 0% 0% 32,533$
10 Collection System 51% 39% 0% 0% 0% 0% 0% 0% 0% 0% 0% 10% 0% 85,097$
11 Customer Billing 0% 0% 0% 0% 0% 0% 0% 0% 0% 0% 0% 100% 0% 29,309$
12 Admin 0% 0% 0% 0% 0% 0% 0% 0% 0% 0% 0% 0% 100% 17,023$
13 Treatment + Collection General 0% 0% 0% 0% 0% 0% 0% 0% 0% 0% 0% 0% 100% 20,327$
14 General 0% 0% 0% 0% 0% 0% 0% 0% 0% 0% 0% 0% 100%

Houston Combined Utility System
Wastewater System Customer Allocation ‐ FYE 2022 July Increase
Line
No. Flow ‐ Retail
Flow ‐ Retail + Cat.
Y Wholesale Flow ‐ All Capacity BOD ‐ O&M BOD ‐ Capital TSS ‐ O&M TSS ‐ Capital Ammonia ‐ O&M Ammonia ‐ Capital Industrial Customer Total
Development of Unit Costs1 Units of Service kGal kGal kGal kGal / day lbs lbs lbs lbs lbs lbs Industrial bills Bills
2 Single Family Residential 22,344,168 22,344,168 22,344,168 61,217 18,222,940 18,222,940 55,316,332 55,316,332 3,175,970 3,175,970 ‐ 4,603,570
3 Multifamily Residential 25,155,956 25,155,956 25,155,956 68,920 22,654,672 22,654,672 68,769,001 68,769,001 3,948,351 3,948,351 ‐ 159,481
4 Commercial 20,573,586 20,573,586 20,573,586 56,366 16,242,722 16,242,722 49,305,316 49,305,316 2,830,850 2,830,850 ‐ 426,605
5 Industrial Surcharge 2,135,783 2,135,783 2,135,783 5,851 16,864,851 16,864,851 7,494,091 7,494,091 541,942 541,942 3,229 3,229
6 Sewer Only 47,581 47,581 47,581 130 44,298 44,298 134,469 134,469 7,721 7,721 ‐ 10,491
7 Capital without Collection System ‐ ‐ 2,922,313 ‐ 2,720,695 ‐ 8,258,758 ‐ 474,174 ‐ ‐ 169
8 No Capital with Collection System ‐ 324,234 324,234 888 301,864 301,864 916,318 916,318 52,610 52,610 ‐ 133
9 Connections‐based Billing ‐ 55,616 55,616 152 51,779 51,779 157,176 157,176 9,024 9,024 ‐ 24
10 Total 70,257,074 70,636,923 73,559,236 193,526 77,103,821 74,383,126 190,351,460 182,092,703 11,040,642 10,566,468 3,229 5,203,703
11 Test Year Unit Cost 2.90$ 2.91$ 0.61$ 177.87$ 0.10$ 0.35$ 0.20$ 0.14$ 0.63$ ‐$ 1,035.56$ 6.55$
Allocation of Unit Costs to Customer Types
12 Single Family Residential 64,688,825$ 65,078,872$ 13,573,689$ 10,888,541$ 1,767,708$ 6,324,738$ 10,932,833$ 7,842,588$ 1,997,521$ ‐$ ‐$ 30,155,320$ 213,250,635$
13 Multifamily Residential 72,829,262 73,268,393 15,281,801 12,258,754 2,197,606 7,862,885 13,591,646 9,749,868 2,483,309 ‐ ‐ 1,044,668 210,568,192
14 Commercial 59,562,797 59,921,937 12,498,092 10,025,719 1,575,618 5,637,453 9,744,804 6,990,363 1,780,458 ‐ ‐ 2,794,445 170,531,686
15 Industrial Surcharge 6,183,326 6,220,609 1,297,450 1,040,789 1,635,967 5,853,379 1,481,148 1,062,490 340,854 ‐ 3,344,146 21,153 28,481,310
16 Sewer Only 137,753 138,583 28,905 23,187 4,297 15,375 26,577 19,065 4,856 ‐ ‐ 68,718 467,315
17 Capital without Collection System ‐ ‐ 1,775,254 ‐ 263,920 ‐ 1,632,278 ‐ 298,231 ‐ ‐ 1,107 3,970,789
18 No Capital with Collection System ‐ 944,352 196,966 158,002 29,282 104,770 181,103 129,913 33,089 ‐ ‐ 870 1,778,347
19 Connections‐based Billing ‐ 161,985 33,786 27,102 5,023 17,971 31,065 22,284 5,676 ‐ ‐ 158 305,050
20 Total 203,401,962$ 205,734,731$ 44,685,944$ 34,422,094$ 7,479,420$ 25,816,571$ 37,621,453$ 25,816,571$ 6,943,993$ ‐$ 3,344,146$ 34,086,439$ 629,353,325$
Customer Type

Houston Combined Utility System
Wastewater Cost of Service ComparisonFYE 2022 ‐ July Increase
A
Line
No. Cost of Service
1 Single Family Residential $213,250,635
2 Multifamily Residential 210,568,192
3 Commercial 170,531,686
4 Industrial Surcharge 28,481,310
5 Sewer Only 467,315
6 Capital without Collection System 3,970,789
7 No Capital with Collection System 1,778,347
8 Connection‐based 305,050
9 Total $629,353,325
Customer Type

Houston Combined Utility System
Wastewater System Customer Allocation ‐ FYE 2022 April Increase
Line
No. Flow ‐ Retail
Flow ‐ Retail + Cat.
Y Wholesale Flow ‐ All Capacity BOD ‐ O&M BOD ‐ Capital TSS ‐ O&M TSS ‐ Capital Ammonia ‐ O&M Ammonia ‐ Capital Industrial Customer Total
Development of Unit Costs1 Units of Service kGal kGal kGal kGal / day lbs lbs lbs lbs lbs lbs Industrial bills Bills
2 Single Family Residential 22,344,168 22,344,168 22,344,168 61,217 18,222,940 18,222,940 55,316,332 55,316,332 3,175,970 3,175,970 ‐ 4,603,570
3 Multifamily Residential 25,155,956 25,155,956 25,155,956 68,920 22,654,672 22,654,672 68,769,001 68,769,001 3,948,351 3,948,351 ‐ 159,481
4 Commercial 20,573,586 20,573,586 20,573,586 56,366 16,242,722 16,242,722 49,305,316 49,305,316 2,830,850 2,830,850 ‐ 426,605
5 Industrial Surcharge 2,135,783 2,135,783 2,135,783 5,851 16,864,851 16,864,851 7,494,091 7,494,091 541,942 541,942 3,229 3,229
6 Sewer Only 47,581 47,581 47,581 130 44,298 44,298 134,469 134,469 7,721 7,721 ‐ 10,491
7 Capital without Collection System ‐ ‐ 2,922,313 ‐ 2,720,695 ‐ 8,258,758 ‐ 474,174 ‐ ‐ 169
8 No Capital with Collection System ‐ 324,234 324,234 888 301,864 301,864 916,318 916,318 52,610 52,610 ‐ 133
9 Connections‐based Billing ‐ 55,616 55,616 152 51,779 51,779 157,176 157,176 9,024 9,024 ‐ 24
10 Total 70,257,074 70,636,923 73,559,236 193,526 77,103,821 74,383,126 190,351,460 182,092,703 11,040,642 10,566,468 3,229 5,203,703
11 Test Year Unit Cost 3.46$ 3.47$ 0.71$ 213.26$ 0.11$ 0.42$ 0.23$ 0.17$ 0.74$ ‐$ 1,216.63$ 7.70$
Allocation of Unit Costs to Customer Types
12 Single Family Residential 77,258,039$ 77,565,113$ 15,947,007$ 13,055,358$ 2,076,786$ 7,583,360$ 12,844,405$ 9,403,261$ 2,346,782$ ‐$ ‐$ 35,427,867$ 253,507,977$
13 Multifamily Residential 86,980,186 87,325,901 17,953,777 14,698,243 2,581,850 9,427,597 15,968,103 11,690,089 2,917,508 ‐ ‐ 1,227,324 250,770,578
14 Commercial 71,136,011 71,418,751 14,683,345 12,020,834 1,851,109 6,759,305 11,448,652 8,381,444 2,091,766 ‐ ‐ 3,283,043 203,074,261
15 Industrial Surcharge 7,384,763 7,414,115 1,524,306 1,247,905 1,922,011 7,018,200 1,740,122 1,273,926 400,451 ‐ 3,928,860 24,852 33,879,508
16 Sewer Only 164,518 165,172 33,959 27,801 5,048 18,434 31,224 22,859 5,705 ‐ ‐ 80,734 555,454
17 Capital without Collection System ‐ ‐ 2,085,651 ‐ 310,065 ‐ 1,917,676 ‐ 350,376 ‐ ‐ 1,301 4,665,069
18 No Capital with Collection System ‐ 1,125,538 231,405 189,445 34,402 125,619 212,768 155,765 38,875 ‐ ‐ 1,022 2,114,839
19 Connections‐based Billing ‐ 193,064 39,693 32,496 5,901 21,547 36,496 26,719 6,668 ‐ ‐ 186 362,770
20 Total 242,923,517$ 245,207,654$ 52,499,142$ 41,272,082$ 8,787,173$ 30,954,062$ 44,199,447$ 30,954,062$ 8,158,129$ ‐$ 3,928,860$ 40,046,329$ 748,930,456$
Customer Type

Houston Combined Utility System
Wastewater Cost of Service ComparisonFYE 2022 ‐ April Increase
A
Line
No. Cost of Service
1 Single Family Residential $253,507,977
2 Multifamily Residential 250,770,578
3 Commercial 203,074,261
4 Industrial Surcharge 33,879,508
5 Sewer Only 555,454
6 Capital without Collection System 4,665,069
7 No Capital with Collection System 2,114,839
8 Connection‐based 362,770
9 Total $748,930,456
Customer Type

Houston Combined Utility System
Wastewater System Customer Allocation ‐ FYE 2023 April Increase
Line
No. Flow ‐ Retail
Flow ‐ Retail + Cat.
Y Wholesale Flow ‐ All Capacity BOD ‐ O&M BOD ‐ Capital TSS ‐ O&M TSS ‐ Capital Ammonia ‐ O&M Ammonia ‐ Capital Industrial Customer Total
Development of Unit Costs1 Units of Service kGal kGal kGal kGal / day lbs lbs lbs lbs lbs lbs Industrial bills Bills
2 Single Family Residential 22,388,856 22,388,856 22,388,856 61,339 18,259,386 18,259,386 55,426,965 55,426,965 3,182,322 3,182,322 ‐ 4,612,777
3 Multifamily Residential 25,206,268 25,206,268 25,206,268 69,058 22,699,982 22,699,982 68,906,539 68,906,539 3,956,248 3,956,248 ‐ 159,800
4 Commercial 20,614,734 20,614,734 20,614,734 56,479 16,275,208 16,275,208 49,403,926 49,403,926 2,836,511 2,836,511 ‐ 427,459
5 Industrial Surcharge 2,140,054 2,140,054 2,140,054 5,863 16,898,581 16,898,581 7,509,079 7,509,079 543,026 543,026 3,236 3,236
6 Sewer Only 47,676 47,676 47,676 131 44,387 44,387 134,738 134,738 7,736 7,736 ‐ 10,512
7 Capital without Collection System ‐ ‐ 2,928,158 ‐ 2,726,136 ‐ 8,275,275 ‐ 475,122 ‐ ‐ 169
8 No Capital with Collection System ‐ 324,882 324,882 890 302,468 302,468 918,150 918,150 52,715 52,715 ‐ 133
9 Connections‐based Billing ‐ 55,727 55,727 153 51,882 51,882 157,491 157,491 9,042 9,042 ‐ 24
10 Total 70,397,588 70,778,197 73,706,355 193,913 77,258,029 74,531,893 190,732,163 182,456,888 11,062,724 10,587,601 3,236 5,214,110
11 Test Year Unit Cost 3.71$ 3.70$ 0.72$ 231.86$ 0.12$ 0.45$ 0.24$ 0.18$ 0.75$ ‐$ 1,232.72$ 7.80$
Allocation of Unit Costs to Customer Types
12 Single Family Residential 83,068,662$ 82,824,041$ 16,190,273$ 14,222,423$ 2,108,467$ 8,261,263$ 13,040,342$ 10,243,852$ 2,382,581$ ‐$ ‐$ 35,968,260$ 268,310,163$
13 Multifamily Residential 93,522,017 93,246,612 18,227,655 16,012,172 2,621,236 10,270,363 16,211,691 12,735,108 2,962,013 ‐ ‐ 1,246,045 267,054,912
14 Commercial 76,486,193 76,260,955 14,907,334 13,095,420 1,879,347 7,363,543 11,623,297 9,130,691 2,123,675 ‐ ‐ 3,333,121 216,203,576
15 Industrial Surcharge 7,940,175 7,916,793 1,547,558 1,359,460 1,951,330 7,645,582 1,766,667 1,387,806 406,559 ‐ 3,988,793 25,231 35,935,955
16 Sewer Only 176,892 176,371 34,477 30,286 5,125 20,082 31,700 24,902 5,792 ‐ ‐ 81,965 587,592
17 Capital without Collection System ‐ ‐ 2,117,467 ‐ 314,795 ‐ 1,946,930 ‐ 355,721 ‐ ‐ 1,320 4,736,233
18 No Capital with Collection System ‐ 1,201,850 234,935 206,380 34,927 136,848 216,014 169,690 39,468 ‐ ‐ 1,038 2,241,149
19 Connections‐based Billing ‐ 206,154 40,299 35,400 5,991 23,474 37,053 29,107 6,770 ‐ ‐ 189 384,436
20 Total 261,193,939$ 261,832,775$ 53,299,998$ 44,961,541$ 8,921,218$ 33,721,156$ 44,873,694$ 33,721,156$ 8,282,578$ ‐$ 3,988,793$ 40,657,168$ 795,454,016$
Customer Type

Houston Combined Utility System
Wastewater Cost of Service ComparisonFYE 2023 ‐ April Increase
A
Line
No. Cost of Service
1 Single Family Residential $268,310,163
2 Multifamily Residential 267,054,912
3 Commercial 216,203,576
4 Industrial Surcharge 35,935,955
5 Sewer Only 587,592
6 Capital without Collection System 4,736,233
7 No Capital with Collection System 2,241,149
8 Connection‐based 384,436
9 Total $795,454,016
Customer Type
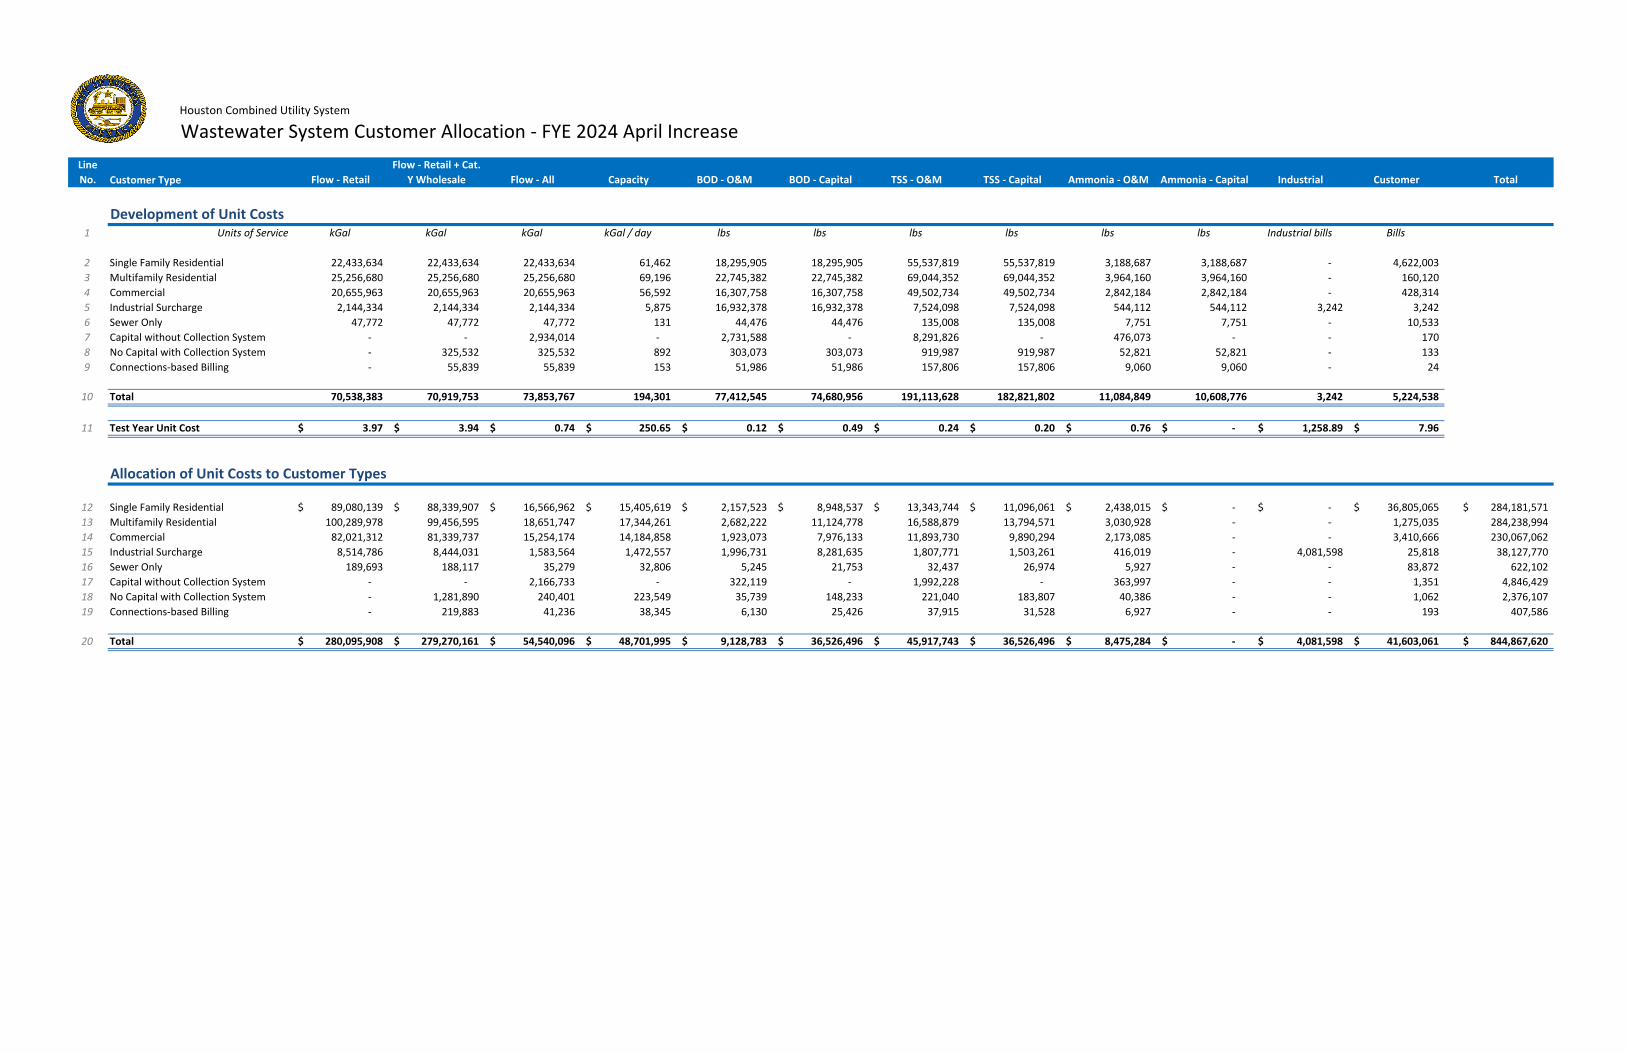
Houston Combined Utility System
Wastewater System Customer Allocation ‐ FYE 2024 April Increase
Line
No. Flow ‐ Retail
Flow ‐ Retail + Cat.
Y Wholesale Flow ‐ All Capacity BOD ‐ O&M BOD ‐ Capital TSS ‐ O&M TSS ‐ Capital Ammonia ‐ O&M Ammonia ‐ Capital Industrial Customer Total
Development of Unit Costs1 Units of Service kGal kGal kGal kGal / day lbs lbs lbs lbs lbs lbs Industrial bills Bills
2 Single Family Residential 22,433,634 22,433,634 22,433,634 61,462 18,295,905 18,295,905 55,537,819 55,537,819 3,188,687 3,188,687 ‐ 4,622,003
3 Multifamily Residential 25,256,680 25,256,680 25,256,680 69,196 22,745,382 22,745,382 69,044,352 69,044,352 3,964,160 3,964,160 ‐ 160,120
4 Commercial 20,655,963 20,655,963 20,655,963 56,592 16,307,758 16,307,758 49,502,734 49,502,734 2,842,184 2,842,184 ‐ 428,314
5 Industrial Surcharge 2,144,334 2,144,334 2,144,334 5,875 16,932,378 16,932,378 7,524,098 7,524,098 544,112 544,112 3,242 3,242
6 Sewer Only 47,772 47,772 47,772 131 44,476 44,476 135,008 135,008 7,751 7,751 ‐ 10,533
7 Capital without Collection System ‐ ‐ 2,934,014 ‐ 2,731,588 ‐ 8,291,826 ‐ 476,073 ‐ ‐ 170
8 No Capital with Collection System ‐ 325,532 325,532 892 303,073 303,073 919,987 919,987 52,821 52,821 ‐ 133
9 Connections‐based Billing ‐ 55,839 55,839 153 51,986 51,986 157,806 157,806 9,060 9,060 ‐ 24
10 Total 70,538,383 70,919,753 73,853,767 194,301 77,412,545 74,680,956 191,113,628 182,821,802 11,084,849 10,608,776 3,242 5,224,538
11 Test Year Unit Cost 3.97$ 3.94$ 0.74$ 250.65$ 0.12$ 0.49$ 0.24$ 0.20$ 0.76$ ‐$ 1,258.89$ 7.96$
Allocation of Unit Costs to Customer Types
12 Single Family Residential 89,080,139$ 88,339,907$ 16,566,962$ 15,405,619$ 2,157,523$ 8,948,537$ 13,343,744$ 11,096,061$ 2,438,015$ ‐$ ‐$ 36,805,065$ 284,181,571$
13 Multifamily Residential 100,289,978 99,456,595 18,651,747 17,344,261 2,682,222 11,124,778 16,588,879 13,794,571 3,030,928 ‐ ‐ 1,275,035 284,238,994
14 Commercial 82,021,312 81,339,737 15,254,174 14,184,858 1,923,073 7,976,133 11,893,730 9,890,294 2,173,085 ‐ ‐ 3,410,666 230,067,062
15 Industrial Surcharge 8,514,786 8,444,031 1,583,564 1,472,557 1,996,731 8,281,635 1,807,771 1,503,261 416,019 ‐ 4,081,598 25,818 38,127,770
16 Sewer Only 189,693 188,117 35,279 32,806 5,245 21,753 32,437 26,974 5,927 ‐ ‐ 83,872 622,102
17 Capital without Collection System ‐ ‐ 2,166,733 ‐ 322,119 ‐ 1,992,228 ‐ 363,997 ‐ ‐ 1,351 4,846,429
18 No Capital with Collection System ‐ 1,281,890 240,401 223,549 35,739 148,233 221,040 183,807 40,386 ‐ ‐ 1,062 2,376,107
19 Connections‐based Billing ‐ 219,883 41,236 38,345 6,130 25,426 37,915 31,528 6,927 ‐ ‐ 193 407,586
20 Total 280,095,908$ 279,270,161$ 54,540,096$ 48,701,995$ 9,128,783$ 36,526,496$ 45,917,743$ 36,526,496$ 8,475,284$ ‐$ 4,081,598$ 41,603,061$ 844,867,620$
Customer Type

Houston Combined Utility System
Wastewater Cost of Service ComparisonFYE 2024 ‐ April Increase
A
Line
No. Cost of Service
1 Single Family Residential $284,181,571
2 Multifamily Residential 284,238,994
3 Commercial 230,067,062
4 Industrial Surcharge 38,127,770
5 Sewer Only 622,102
6 Capital without Collection System 4,846,429
7 No Capital with Collection System 2,376,107
8 Connection‐based 407,586
9 Total $844,867,620
Customer Type

Houston Combined Utility System
Wastewater System Customer Allocation ‐ FYE 2025 April Increase
Line
No. Flow ‐ Retail
Flow ‐ Retail + Cat.
Y Wholesale Flow ‐ All Capacity BOD ‐ O&M BOD ‐ Capital TSS ‐ O&M TSS ‐ Capital Ammonia ‐ O&M Ammonia ‐ Capital Industrial Customer Total
Development of Unit Costs1 Units of Service kGal kGal kGal kGal / day lbs lbs lbs lbs lbs lbs Industrial bills Bills
2 Single Family Residential 22,478,501 22,478,501 22,478,501 61,585 18,332,496 18,332,496 55,648,894 55,648,894 3,195,064 3,195,064 ‐ 4,631,247
3 Multifamily Residential 25,307,194 25,307,194 25,307,194 69,335 22,790,872 22,790,872 69,182,440 69,182,440 3,972,089 3,972,089 ‐ 160,440
4 Commercial 20,697,275 20,697,275 20,697,275 56,705 16,340,373 16,340,373 49,601,740 49,601,740 2,847,869 2,847,869 ‐ 429,170
5 Industrial Surcharge 2,148,623 2,148,623 2,148,623 5,887 16,966,242 16,966,242 7,539,146 7,539,146 545,200 545,200 3,249 3,249
6 Sewer Only 47,867 47,867 47,867 131 44,565 44,565 135,278 135,278 7,767 7,767 ‐ 10,554
7 Capital without Collection System ‐ ‐ 2,939,882 ‐ 2,737,051 ‐ 8,308,409 ‐ 477,025 ‐ ‐ 170
8 No Capital with Collection System ‐ 326,183 326,183 894 303,679 303,679 921,827 921,827 52,926 52,926 ‐ 134
9 Connections‐based Billing ‐ 55,950 55,950 153 52,090 52,090 158,121 158,121 9,078 9,078 ‐ 24
10 Total 70,679,460 71,061,593 74,001,475 194,689 77,567,370 74,830,318 191,495,855 183,187,445 11,107,019 10,629,994 3,249 5,234,987
11 Test Year Unit Cost 4.23$ 4.18$ 0.77$ 267.95$ 0.12$ 0.52$ 0.25$ 0.21$ 0.80$ ‐$ 1,312.31$ 8.30$
Allocation of Unit Costs to Customer Types
12 Single Family Residential 95,008,245$ 93,999,420$ 17,304,619$ 16,501,488$ 2,253,588$ 9,585,085$ 13,937,884$ 11,885,373$ 2,546,569$ ‐$ ‐$ 38,443,793$ 301,466,065$
13 Multifamily Residential 106,964,075 105,828,300 19,482,231 18,578,034 2,801,650 11,916,133 17,327,512 14,775,839 3,165,883 ‐ ‐ 1,331,805 302,171,462
14 Commercial 87,479,667 86,550,783 15,933,378 15,193,889 2,008,699 8,543,510 12,423,307 10,593,834 2,269,843 ‐ ‐ 3,562,524 244,559,435
15 Industrial Surcharge 9,081,428 8,984,999 1,654,074 1,577,306 2,085,637 8,870,744 1,888,263 1,610,195 434,542 ‐ 4,263,334 26,967 40,477,490
16 Sewer Only 202,317 200,169 36,850 35,139 5,478 23,301 33,882 28,892 6,190 ‐ ‐ 87,606 659,824
17 Capital without Collection System ‐ ‐ 2,263,209 ‐ 336,462 ‐ 2,080,934 ‐ 380,204 ‐ ‐ 1,411 5,062,220
18 No Capital with Collection System ‐ 1,364,015 251,105 239,451 37,331 158,777 230,882 196,882 42,184 ‐ ‐ 1,109 2,521,736
19 Connections‐based Billing ‐ 233,970 43,072 41,073 6,403 27,235 39,603 33,771 7,236 ‐ ‐ 202 432,566
20 Total 298,735,732$ 297,161,656$ 56,968,537$ 52,166,381$ 9,535,249$ 39,124,786$ 47,962,267$ 39,124,786$ 8,852,652$ ‐$ 4,263,334$ 43,455,418$ 897,350,796$
Customer Type

Houston Combined Utility System
Wastewater Cost of Service ComparisonFYE 2025 ‐ April Increase
A
Line
No. Cost of Service
1 Single Family Residential $301,466,065
2 Multifamily Residential 302,171,462
3 Commercial 244,559,435
4 Industrial Surcharge 40,477,490
5 Sewer Only 659,824
6 Capital without Collection System 5,062,220
7 No Capital with Collection System 2,521,736
8 Connection‐based 432,566
9 Total $897,350,796
Customer Type

Houston Combined Utility System
Wastewater System Customer Allocation ‐ FYE 2026 April Increase
Line
No. Flow ‐ Retail
Flow ‐ Retail + Cat.
Y Wholesale Flow ‐ All Capacity BOD ‐ O&M BOD ‐ Capital TSS ‐ O&M TSS ‐ Capital Ammonia ‐ O&M Ammonia ‐ Capital Industrial Customer Total
Development of Unit Costs1 Units of Service kGal kGal kGal kGal / day lbs lbs lbs lbs lbs lbs Industrial bills Bills
2 Single Family Residential 22,523,458 22,523,458 22,523,458 61,708 18,369,161 18,369,161 55,760,192 55,760,192 3,201,454 3,201,454 ‐ 4,640,509
3 Multifamily Residential 25,357,808 25,357,808 25,357,808 69,473 22,836,454 22,836,454 69,320,805 69,320,805 3,980,033 3,980,033 ‐ 160,761
4 Commercial 20,738,670 20,738,670 20,738,670 56,818 16,373,054 16,373,054 49,700,943 49,700,943 2,853,565 2,853,565 ‐ 430,029
5 Industrial Surcharge 2,152,920 2,152,920 2,152,920 5,898 17,000,175 17,000,175 7,554,224 7,554,224 546,291 546,291 3,255 3,255
6 Sewer Only 47,963 47,963 47,963 131 44,654 44,654 135,548 135,548 7,782 7,782 ‐ 10,575
7 Capital without Collection System ‐ ‐ 2,945,762 ‐ 2,742,526 ‐ 8,325,026 ‐ 477,979 ‐ ‐ 170
8 No Capital with Collection System ‐ 326,835 326,835 895 304,286 304,286 923,670 923,670 53,032 53,032 ‐ 134
9 Connections‐based Billing ‐ 56,062 56,062 154 52,194 52,194 158,438 158,438 9,097 9,097 ‐ 24
10 Total 70,820,819 71,203,716 74,149,478 195,079 77,722,504 74,979,979 191,878,846 183,553,820 11,129,233 10,651,254 3,255 5,245,457
11 Test Year Unit Cost 4.49$ 4.44$ 0.81$ 285.88$ 0.13$ 0.56$ 0.26$ 0.23$ 0.83$ ‐$ 1,372.84$ 8.68$
Allocation of Unit Costs to Customer Types
12 Single Family Residential 101,235,875$ 99,980,561$ 18,138,888$ 17,641,235$ 2,362,236$ 10,247,121$ 14,609,841$ 12,706,288$ 2,669,342$ ‐$ ‐$ 40,297,152$ 319,888,538$
13 Multifamily Residential 113,975,391 112,562,108 20,421,484 19,861,207 2,936,720 12,739,172 18,162,885 15,796,396 3,318,513 ‐ ‐ 1,396,011 321,169,886
14 Commercial 93,213,812 92,057,970 16,701,539 16,243,321 2,105,540 9,133,605 13,022,245 11,325,544 2,379,274 ‐ ‐ 3,734,272 259,917,122
15 Industrial Surcharge 9,676,701 9,556,711 1,733,818 1,686,250 2,186,187 9,483,441 1,979,298 1,721,410 455,492 ‐ 4,468,873 28,268 42,976,446
16 Sewer Only 215,578 212,905 38,626 37,566 5,742 24,910 35,515 30,888 6,489 ‐ ‐ 91,830 700,050
17 Capital without Collection System ‐ ‐ 2,372,320 ‐ 352,683 ‐ 2,181,257 ‐ 398,534 ‐ ‐ 1,479 5,306,273
18 No Capital with Collection System ‐ 1,450,806 263,211 255,990 39,131 169,744 242,013 210,480 44,218 ‐ ‐ 1,162 2,676,755
19 Connections‐based Billing ‐ 248,857 45,149 43,910 6,712 29,116 41,513 36,104 7,585 ‐ ‐ 211 459,157
20 Total 318,317,356$ 316,069,919$ 59,715,035$ 55,769,479$ 9,994,951$ 41,827,109$ 50,274,565$ 41,827,109$ 9,279,446$ ‐$ 4,468,873$ 45,550,385$ 953,094,228$
Customer Type

Houston Combined Utility System
Wastewater Cost of Service ComparisonFYE 2026 ‐ April Increase
A
Line
No. Cost of Service
1 Single Family Residential $319,888,538
2 Multifamily Residential 321,169,886
3 Commercial 259,917,122
4 Industrial Surcharge 42,976,446
5 Sewer Only 700,050
6 Capital without Collection System 5,306,273
7 No Capital with Collection System 2,676,755
8 Connection‐based 459,157
9 Total $953,094,228
Customer Type

WATER AND WASTEWATER COST OF SERVICE RATE STUDY | CITY OF HOUSTON
DRAFT | APRIL
Appendix I
WATER RATE DESIGN

Houston Combined Utility System
Water Rate Design ‐ Monthly Meter Charge
Line
No. Description
Test Year FYE
2022
July 2021
1 Retail Customer Classes Escalation FYE 2019 FYE 2022
(includes Single Family Residential, Multifamily Residential, Commercial/ Industrial, Irrigation, Emergency Backup)
2 Total Bills Inside City Customer Growth 5,570,468 5,603,958
3 Total MEUs ‐ Capacity Inside City Customer Growth 658,113 662,069
4 Total MEUs ‐ Fire Inside City Customer Growth 658,113 662,069
5 Total Connections ‐ TCEQ Fee Inside City Customer Growth 1,026,274 1,032,444
6 Fixed Revenue to Recover
7 Customer (Billing & Collecting) 14,764,143$
8 Capacity (Meter & Supply) 16,744,201
9 Fire Flow 11,116,612
10 TCEQ Fees 2,573,259
11 Total Fixed Charge Revenue to Recover 45,198,215$
12 Per Bill 2.635$
13 Per MEU per month ‐ Capacity 2.108$
14 Per MEU per month ‐ Fire 1.399$ Proposed
Total Fixed Charge (5/8") 6.15$ 6.25$
15 Per Connection per month ‐ TCEQ Fees 0.21$
16 Meter Size Meter Factor SFR FYE21 Calculated Proposed
17 5/8" 1.00 5.82$ 6.15$ 6.25$
18 3/4" 1.00 5.82$ 6.15 6.25
19 1" 1.70 7.21$ 8.60 8.79
20 1 1/2" 2.70 10.92$ 12.11 12.40
21 2" 3.30 12.86$ 14.21 14.57
22 3" 8.30 12.86$ 31.75 32.65
23 4" 16.70 61.20 63.02
24 6" 40.00 142.91 147.26
25 8" 50.00 177.98 183.41
26 10" 66.70 236.54 243.79
27 12" 93.30 329.82 339.96
28 Account Projection Escalation FYE 2019 FYE 2022
29 5/8" Inside City Customer Growth 360,398 362,565
30 3/4" Inside City Customer Growth 8,626 8,678
31 1" Inside City Customer Growth 91,354 91,903
32 1 1/2" Inside City Customer Growth 19,176 19,291
33 2" Inside City Customer Growth 4,638 4,666
34 3" Inside City Customer Growth 1,380 1,388
35 4" Inside City Customer Growth 1,041 1,047
36 6" Inside City Customer Growth 941 947
37 8" Inside City Customer Growth 218 219
38 10" Inside City Customer Growth 18 18
39 12" Inside City Customer Growth ‐ ‐

Houston Combined Utility System
Water Rate Design ‐ Monthly Meter Charge
Line
No. Description
Test Year FYE
2022
July 2021
40 MEU Revenue Calculated Proposed
41 5/8" 26,757,276$ 27,192,354$
42 3/4" 640,426 650,839
43 1" 9,484,412 9,693,952
44 1 1/2" 2,803,410 2,870,543
45 2" 795,626 815,783
46 3" 528,941 543,935
47 4" 769,107 791,979
48 6" 1,623,442 1,672,857
49 8" 468,395 482,685
50 10" 51,400 52,975
51 12" ‐ ‐
52 TCEQ Fee 2,601,759 2,601,759
53 Total MEU Revenue 46,524,193$ 47,369,661$

Houston Combined Utility System
Water Rate Design ‐ Volume Rates
Line
No. Description Test Year FYE 2022
July 2021
1 Single Family Residential
2 SFR Units of Service Escalation FYE 2019 FYE 2022
3
SFR Customer Usage (kgal)
Forecast
Inside City Customer
Growth 23,200,720 23,340,203
4 SFR Customer Bills Forecast
Inside City Customer
Growth 4,917,992 4,947,559
5
SFR Customer Connections
Forecast
Inside City Customer
Growth 407,595 410,045
6 SFR Costs to Recover
7 Customer / Capacity / Fire 34,240,121$
8 TCEQ Fee 1,021,995
9 Base 90,999,170
10 Max Day 25,664,538
11 Max Hour 27,555,164
12 Total SFR Costs to Recover 179,480,990$
13 Calculated SFR Uniform Variable Rate (per 1,000 gal) 6.18$
14 Conservation Credit? Yes
15 SFR Tier Allocation
16 SFR Tier Demand Tier breakpoint Tier % of kGal
17 Tier 1 ‐ Conservation Credit 3 16% 3,767,090
18 Tier 2 6 58% 13,572,521
19 Tier 3 12 15% 3,581,481
20 Tier 4 20 5% 1,217,721
21 Tier 5 5% 1,201,390
22 Tier 4 0% ‐
23 Tier 5 0% ‐
0% ‐

Houston Combined Utility System
Water Rate Design ‐ Volume Rates
Line
No. Description Test Year FYE 2022
July 2021
24 SFR Volume Rates (per 1,000 gal) FYE 2021 Rates FYE 2022 Rates
25 Tier 1 ‐ Monthly usage less than 3 0.16$ 1.00$
26 Tier 2 6 7.65$ 5.50$
27 Tier 3 12 0.45$ 8.00$
28 Tier 4 20 12.56$ 11.00$
29 Tier 5 5.29$ 15.00$
30 Tier 6 5.29$ 15.00$
31 Tier 7 5.74$ 15.00$
32 Tier 8 9.46$ 15.00$
33 SFR Revenue Check
34 Monthly Fixed Charge 33,815,324$
35 TCEQ Fee 1,033,315
36 Tier 1 ‐ Monthly usage less than 3 3,767,090
37 Tier 2 6 74,648,863
38 Tier 3 12 28,651,850
39 Tier 4 20 13,394,931
40 Tier 5 18,020,857
41 Tier 6 ‐
42 Tier 7 ‐
43 Tier 8 ‐
44 Total SFR Revenue 173,332,230$

Houston Combined Utility System
Water Rate Design ‐ Volume Rates
Line
No. Description Test Year FYE 2022
July 2021
1 Multifamily Residential
2 MFR Units of Service Escalation FYE 2019 FYE 2022
3
MFR Customer Usage (kgal)
Forecast
Inside City Customer
Growth 25,661,033 25,815,307
4 MFR Customer Bills Forecast
Inside City Customer
Growth 160,443 161,408
5
MFR Customer Connections
Forecast
Inside City Customer
Growth 570,538 573,968
6 MFR Costs to Recover
7 Customer / Capacity / Fire 2,252,299$
8 TCEQ Fee 1,430,555
9 Base 100,649,149
10 Max Day 20,881,318
11 Max Hour 27,852,159
12 Total MFR Costs to Recover 153,065,481$
13 MFR Volume Rates (per 1,000 gal) FYE 2021 Rates FYE 2022 Rates
14 Calculated MFR Variable Rate (per 1,000 gal) 5.79$
15 Proposed MFR Variable Rate (per 1,000 gal) 4.65$ 5.45$
16 MFR Revenue Check
17 Monthly Fixed Charge 2,186,649$
18 TCEQ Fee 1,446,400
19 Variable Rate ‐ All Usage 140,693,425
20 Total MFR Revenue 144,326,474$

Houston Combined Utility System
Water Rate Design ‐ Volume Rates
Line
No. Description Test Year FYE 2022
July 2021
1 Commercial/Industrial
2 (includes Government, Extra Container)
3 Commercial/Industrial Units of Servic Escalation FYE 2019 FYE 2022
4
Commercial/Industrial Customer
Usage (kgal) Forecast
Inside City Customer
Growth 25,934,839 26,090,759
5
Commercial/Industrial Customer
Bills Forecast
Inside City Customer
Growth 421,906 424,443
6
Commercial/Industrial Customer
Connections Forecast
Inside City Customer
Growth 47,658 47,945
7 Commercial/Industrial Costs to Recover
8 Customer / Capacity / Fire 5,341,782$
9 TCEQ Fee 119,497
10 Base 101,723,086
11 Max Day 41,221,026
12 Max Hour 35,185,975
13 Total Commercial/Industrial Costs to Recover 183,591,365$
14 Commercial/Industrial Volume Rates (per 1,000 gal) FYE 2021 Rates FYE 2022 Rates
15 Calculated Com/Ind Variable Rate (per 1,000 gal) 6.83$
16 Proposed Com/Ind Variable Rate (per 1,000 gal) 4.77$ 5.55$
17 Commercial/Industrial Revenue Check
18 Monthly Fixed Charge 5,231,939$
19 TCEQ Fee 120,820
20 All Usage 144,803,715
21 Total Commercial/Industrial Revenue 150,156,474$

Houston Combined Utility System
Water Rate Design ‐ Volume Rates
Line
No. Description Test Year FYE 2022
July 2021
1 Transient
2 Transient Units of Service Escalation FYE 2019 FYE 2022
3
Transient Customer Usage (kgal)
Forecast
Inside City Customer
Growth 382,275 384,573
4 Transient Customer Bills Forecast
Inside City Customer
Growth 7,662 7,708
5 Transient Costs to Recover
6 Customer / Capacity / Fire Flow 140,956$
7 TCEQ Fees 1,602
8 Base 1,499,381
9 Max Day 2,452,791
10 Max Hour 1,164,062
11 Total Transient Costs to Recover 5,258,793$
12 Transient Volume Rates (per 1,000 gal) FYE 2021 Rates FYE 2022 Rates
13 Transient Fixed Charge (1‐inch meter) 20.17$ 95.00$
14 Transient Fixed Charge (2‐inch meter) 26.90$ 185.00$
15 Transient Fixed Charge (3‐inch meter) 33.62$ 460.00$
16 Calculated Transient Variable Rate (per 1,000 gal) 10.00$
17 Proposed Transient Variable Rate (per 1,000 gal) 5.35$ 10.00$
18 Transient Revenue Check
19 Transient Monthly Fixed Charge 1,414,005$
20 All Usage 3,845,732
21 Total Transient Revenue 5,259,738$

Houston Combined Utility System
Water Rate Design ‐ Volume Rates
Line
No. Description Test Year FYE 2022
July 2021
1 Irrigation
2 Irrigation Units of Service Escalation FYE 2019 FYE 2022
3
Irrigation Customer Usage (kgal)
Forecast
Inside City Customer
Growth 2,394,606 2,409,002
4 Irrigation Customer Bills Forecast
Inside City Customer
Growth 69,963 70,384
5
Irrigation Customer Connections
Forecast
Inside City Customer
Growth 466 469
6 Irrigation Costs to Recover
7 Customer / Capacity / Fire Flow 761,104$
8 TCEQ Fees 1,168
9 Base 9,392,258
10 Max Day 5,592,349
11 Max Hour 3,873,619
12 Total Irrigation Costs to Recover 19,620,499$
13 Irrigation Volume Rates (per 1,000 gal) FYE 2021 Rates FYE 2022 Rates
14 Calculated Irrigation Variable Rate (per 1,000 gal) 7.83$
15 Proposed Irrigation Variable Rate (per 1,000 gal) 8.06$ 10.00$
16 Irrigation Revenue Check
17 Monthly Fixed Charge 755,046$
18 TCEQ Fee 1,181
19 All Usage 24,090,024
20 Total Irrigation Revenue 24,846,251$

Houston Combined Utility System
Water Rate Design ‐ Volume Rates
Line
No. Description Test Year FYE 2022
July 2021
1 Resale
2 Resale Units of Service Escalation FYE 2019 FYE 2022
3
Resale Customer Usage (kgal)
Forecast
Inside City Customer
Growth 8,745 8,798
4 Resale Customer Bills Forecast
Inside City Customer
Growth 12 12
5 Resale Costs to Recover
6 Customer / Capacity / Fire Flow 739$
7 TCEQ Fees 5
8 Base 34,300
9 Max Day 23,792
10 Max Hour 15,325
11 Total Resale Costs to Recover 74,161$
12 Resale Volume Rates (per 1,000 gal) FYE 2021 Rates FYE 2022 Rates
13 Resale Fixed Charge (5/8‐ or 3/4‐inch meter) 22.83$ 24.05$
14 Resale Fixed Charge (1‐inch meter) 26.47$ 39.00$
15 Resale Fixed Charge (1 1/2‐inch meter) 65.31$ 60.40$
16 Resale Fixed Charge (2‐inch meter) 99.60$ 73.25$
17 Resale Fixed Charge (3‐inch meter) 215.61$ 180.00$
18 Resale Fixed Charge (4‐inch meter) 363.21$ 360.00$
19 Resale Fixed Charge (6‐inch meter) 744.47$ 859.00$
20 Resale Fixed Charge (8‐inch meter) 1,078.45$ 1,075.00$
21 Calculated Resale Variable Rate (per 1,000 gal) 7.94$
22 Proposed Resale Variable Rate (per 1,000 gal) 5.73$ 10.00$
23 Resale Revenue Check
24 Resale Monthly Fixed Charge 4,346$
25 All Usage 87,976
26 Total Resale Revenue 92,322$