Melbourne Institute Working Paper No. 10/2016 · Melbourne Institute Working Paper Series Working...
31
Melbourne Institute Working Paper Series Working Paper No. 10/16 Gendered Selection of STEM Subjects for Matriculation Moshe Justman and Susan J. Méndez
Transcript of Melbourne Institute Working Paper No. 10/2016 · Melbourne Institute Working Paper Series Working...

Melbourne Institute Working Paper Series
Working Paper No. 10/16
Gendered Selection of STEM Subjects for Matriculation
Moshe Justman and Susan J. Méndez

Gendered Selection of STEM Subjects for Matriculation
Moshe Justman† and Susan J. Méndez‡ † Department of Economics, Ben Gurion University; and Melbourne Institute
of Applied Economic and Social Research, The University of Melbourne ‡ Melbourne Institute of Applied Economic and Social Research,
The University of Melbourne
Melbourne Institute Working Paper No. 10/16
ISSN 1328-4991 (Print)
ISSN 1447-5863 (Online)
ISBN 978-0-7340-4408-2
March 2016
* This research was commissioned by the Victorian Department of Education and Training (DET). It uses unit record data provided by DET. The findings and views reported in this paper are those of the authors and should not be attributed to DET or any other branch of the Victorian or Australian Commonwealth government. We thank Deborah Cobb-Clark, Brendan Houng, Gary Marks, Julie Moschion, Dave Ribar, Chris Ryan, and seminar participants at the University of Melbourne for helpful comments. For correspondence, email <[email protected]>.
Melbourne Institute of Applied Economic and Social Research
The University of Melbourne
Victoria 3010 Australia
Telephone (03) 8344 2100
Fax (03) 8344 2111
Email [email protected]
WWW Address http://www.melbourneinstitute.com

2
Abstract
Women’s under-representation in high-paying jobs in engineering and information
technology contributes substantially to the gender wage gap, reflecting similar patterns in
higher education. We trace these patterns back to students’ choice of advanced science,
technology, engineering, and mathematics (STEM) subjects in the final years of secondary
school. We find large male majorities in physics, information technology and specialist
mathematics; and large female majorities in life sciences and health and human development.
The significant mathematical component in male-dominated fields has led many to assume
that these patterns are driven by males’ absolute or comparative advantage in mathematics.
We show that this is not the case. Linking data on Victorian Certificate of Education (VCE)
subject choices to standardized test scores in seventh and ninth grades, we find that these
patterns remain largely intact when comparing male and female students with similar prior
achievement. We find little support for the comparative advantage hypothesis: in all STEM
subjects except specialist mathematics students who excel in ninth-grade numeracy and
reading choose STEM subjects more frequently than those who excel only in numeracy. We
also find that socio-economic disadvantage adversely affects male students’ choice of STEM
electives more than it affects female students.
JEL classification: I2, J24, J16
Keywords: Gender streaming, STEM subjects, gender gap in mathematics, secondary school,
Australia

3
1 Introduction
Lower rates of female participation in high-paying jobs in engineering and information
technology contribute substantially to the wage gap between men and women in Australia as
in other countries. The 2013 Graduate Destination Survey (Graduate Careers Australia, 2014,
Table 3) reveals an overall gender wage gap of 9.5% favouring males in the starting salaries
of university graduates in Australia. Decomposing this gap to gender wage gaps within and
between study fields, reveals that only 31% of the overall gap is attributable to gender wage
gaps within study fields; the rest, more than two thirds, is attributable to wage gaps between
better-paid, predominantly male study fields such as engineering, and lower-paying,
predominantly female study fields such as nursing and teaching.1 These patterns reflect
similar gendered patterns observed in the choice of tertiary degree programs, in Australia and
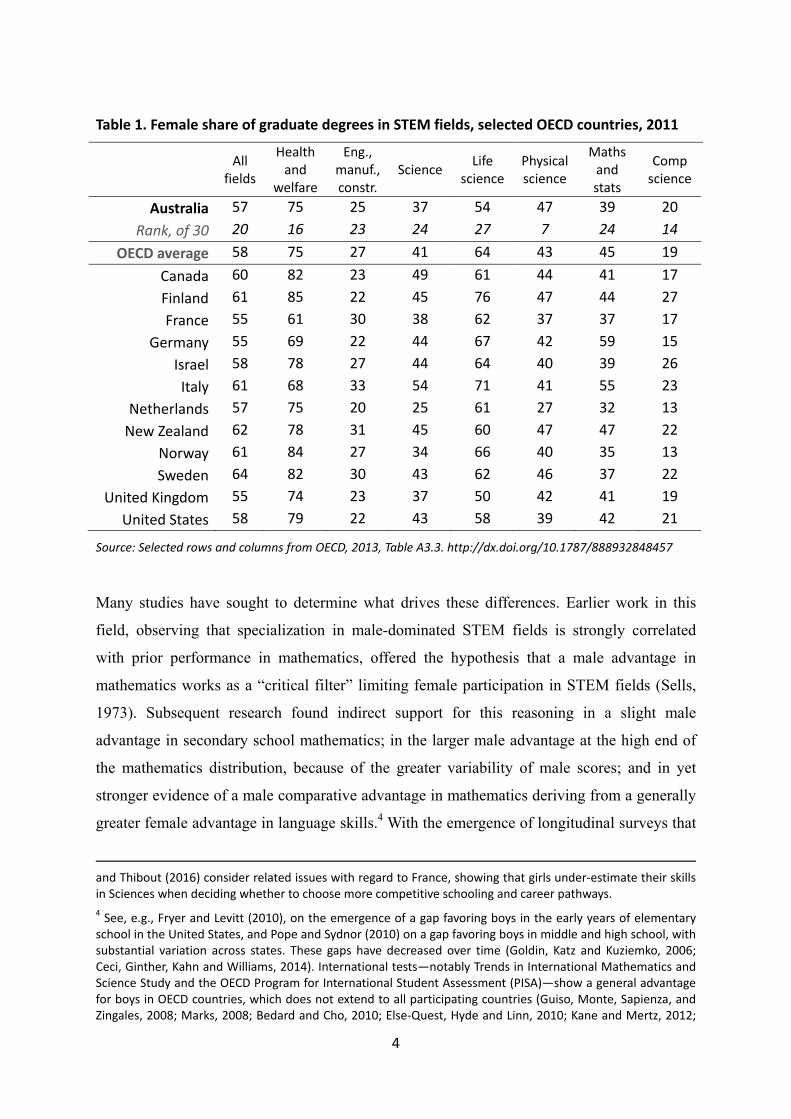
in other OECD countries (Table 1). Women are in the majority among graduates receiving
any degree across all science, technology, engineering and mathematics (STEM) fields, but
make up only 20-25% of graduates in engineering and computer science while accounting for
the large majority of degrees in life sciences and health and human services.2
In this paper, we show that these patterns emerge yet earlier, in the choice of STEM subjects
in senior secondary school, when students prepare for the Victorian Certificate of Education
(VCE). Choices among STEM fields differ markedly across genders. Men are the large
majority in physics and information technology (comprising software development, IT
applications, and systems engineering), and a smaller majority in specialist mathematics;
women are the large majority in life sciences (biology and environmental science) and health
and human development; and chemistry and mathematical methods are more or less evenly
distributed.3
1 See also Birch, Li and Miller (2009). The correlation across study fields between average starting salary and the ratio of the share of males working in a field to the share of females is 0.58. Similar patterns appear in other industrialized economies (Paglin and Rufolo, 1990). Our data refer to gender gaps in starting wages within and between study fields. Cobb‐Clark and Tan (2011) show that gender wage gaps in a sample of older Australians are greater within rather than between occupations.
2 Marginson, Tytler, Freeman and Roberts (2013) expand on this.
3 Specialist mathematics is the most demanding level of the four VCE mathematics subjects, and mathematical methods is the next level of difficulty. Similar patterns were found by Collins, Kenway and McLeod (2000) in their survey‐based study of secondary‐school specialization in Australia; by Buser, Niederle and Oosterbeek (2014) in the Netherlands; and by Ayalon (1995) and Friedman‐Sokuler and Justman (2015) in Israel. Rapoport
4
Table 1. Female share of graduate degrees in STEM fields, selected OECD countries, 2011
All
fields
Health and
welfare
Eng., manuf., constr.
Science Life
science Physical science
Maths and stats
Comp science
Australia 57 75 25 37 54 47 39 20
Rank, of 30 20 16 23 24 27 7 24 14
OECD average 58 75 27 41 64 43 45 19
Canada 60 82 23 49 61 44 41 17
Finland 61 85 22 45 76 47 44 27
France 55 61 30 38 62 37 37 17
Germany 55 69 22 44 67 42 59 15
Israel 58 78 27 44 64 40 39 26
Italy 61 68 33 54 71 41 55 23
Netherlands 57 75 20 25 61 27 32 13
New Zealand 62 78 31 45 60 47 47 22
Norway 61 84 27 34 66 40 35 13
Sweden 64 82 30 43 62 46 37 22
United Kingdom 55 74 23 37 50 42 41 19
United States 58 79 22 43 58 39 42 21
Source: Selected rows and columns from OECD, 2013, Table A3.3. http://dx.doi.org/10.1787/888932848457
Many studies have sought to determine what drives these differences. Earlier work in this
field, observing that specialization in male-dominated STEM fields is strongly correlated
with prior performance in mathematics, offered the hypothesis that a male advantage in
mathematics works as a “critical filter” limiting female participation in STEM fields (Sells,
1973). Subsequent research found indirect support for this reasoning in a slight male
advantage in secondary school mathematics; in the larger male advantage at the high end of
the mathematics distribution, because of the greater variability of male scores; and in yet
stronger evidence of a male comparative advantage in mathematics deriving from a generally
greater female advantage in language skills.4 With the emergence of longitudinal surveys that
and Thibout (2016) consider related issues with regard to France, showing that girls under‐estimate their skills in Sciences when deciding whether to choose more competitive schooling and career pathways.
4 See, e.g., Fryer and Levitt (2010), on the emergence of a gap favoring boys in the early years of elementary school in the United States, and Pope and Sydnor (2010) on a gap favoring boys in middle and high school, with substantial variation across states. These gaps have decreased over time (Goldin, Katz and Kuziemko, 2006; Ceci, Ginther, Kahn and Williams, 2014). International tests—notably Trends in International Mathematics and Science Study and the OECD Program for International Student Assessment (PISA)—show a general advantage for boys in OECD countries, which does not extend to all participating countries (Guiso, Monte, Sapienza, and Zingales, 2008; Marks, 2008; Bedard and Cho, 2010; Else‐Quest, Hyde and Linn, 2010; Kane and Mertz, 2012;

5
followed large samples of high-school graduates through to college these hypotheses could be
tested directly. Analysing longitudinal data on the choice of college majors in the United
States conditional on high-school course choices and grades, led Turner and Bowen (1999),
Xie and Shauman (2003), Riegle-Crumb and King (2010), and Riegle-Crumb, King, Grodsky
and Muller (2012) to conclude that most of the gendered patterns in selecting STEM majors
remain after controlling for high school performance.5
In this paper, we apply this direct approach to analyse the choice of VCE subjects in senior
secondary school in Victoria, using longitudinal data on a full cohort of seventh grade
students, which links their achievement on Australia’s National Assessment Program—
Literacy and Numeracy (NAPLAN) in grades seven and nine to their subsequent choice of
VCE subjects. Together with a similarly structured, parallel study of STEM matriculation
electives in Israel (Friedman-Sokuler and Justman, 2015), this is the first such effort to apply
this direct approach to choice of STEM subjects in secondary school. Using both non-
parametric analyses and regression estimation to control for prior achievement, we show that
the gendered patterns observed in the raw data remain largely intact after controlling for
NAPLAN scores. These patterns are thus driven predominantly by gender differences in the
specific propensity to choose each STEM subject, after controlling for prior scores, rather
than by gender differences in prior achievement.
We also find no support in the data for the comparative advantage hypothesis. This
hypothesis notes that female students do much better than male students in language arts,
implying that male students' comparative advantage in mathematics is more pronounced than
their absolute advantage; and attributes the male majority in mathematically intensive
subjects to this comparative advantage. We test this hypothesis directly and find to the
contrary that students, male or female, who do well in both numeracy and reading in ninth
grade, are more likely to choose each of the STEM subjects than students who do well only in
Bharadwaj, Giorgi, Hansen and Neilson, 2012). For evidence of a male advantage at higher levels of achievement, as a result of the greater variability in male outcomes, see Hedges and Nowell (1995), Hyde, Lindberg, Linn, Ellis and Williams (2008), Ellison and Swanson (2010), Pope and Sydnor (2010) and Friedman‐Sokuler and Justman (2015). For evidence of a male comparative advantage in mathematics see, among others, Goldin et al. (2006), Fryer and Levitt (2010) and Wang, Eccles and Kenny (2013).
5 Paglin and Rufolo's (1990) earlier study, which did not have access to such data used cross‐sectional data on students' majors and their scores on the Graduate Record Exam, taken in the last year of college—and thus itself strongly affected by the choice of major. This led them to the unwarranted conclusion that observed differences in mathematical ability between women and men explain much of the gender gap in occupational choice and wages among college graduates.
6
numeracy. These results agree with Friedman-Sokuler and Justman’s (2015) findings on
gender streaming in the choice of STEM matriculation electives in Israel, conditioned on
eighth-grade standardized test scores. They reinforce the view that what is driving women's
under-representation in STEM study fields, in secondary school as in tertiary education, is
not inferior mathematical performance, but rather social norms, economic opportunity, school
practices or other such factors.6
Socio-economic status (SES) reflected in parents’ education and occupation categories also
has a significant positive effect on selection of VCE subjects in physics and specialist
mathematics, after controlling for prior performance. Consequently, absolute gender gaps in
these subjects are more prevalent in the higher SES categories. Relative gaps in these subjects
also decline as SES rises, but more weakly, as suggested by Goldin et al. (2006) and others,
who observe that socio-economic disadvantage has a stronger adverse effect on boys than on
girls. School effects account for a substantial portion of the gaps between SES categories,
suggesting that students from low SES backgrounds do not have adequate access to advanced
STEM programs in the schools they attend, a point emphasized by Collins et al. (2000) in
their analysis of the scope for policy intervention to narrow socio-economic gaps in STEM
selection. However, including school fixed effects in our regressions does not diminish
gender gaps; if anything, it amplifies them.
We also find that female VCE scores are consistently higher than male scores in all STEM
subjects. This is not surprising as a general pattern, but it is worth noting that even in male-
dominated subjects—physics, IT and specialist mathematics—female average test scores are
substantially higher than male scores by 0.16-0.21 of a standard deviation. This highlights the
behavioural differences between boys and girls in choosing STEM subjects. It also points to a
potential inefficiency inasmuch as the marginal woman opting out of high-paying STEM
fields performs better on these tests than the marginal man opting in.7
6 Joensen and Nielsen (2015) show how modest administrative changes in Danish schools—the way courses are bundled—can elicit substantial changes in subject choice and raise female STEM participation. Lavy and Sand (2015) maintain that high‐school choice patterns can be traced back to gender biases among primary school teachers. Gneezy, Leonard and List (2009), Niederle and Vesterlund (2010) and Booth, Cardona‐Sosac and Nolena (2014) highlight gender differences in attitudes to risk and competition. See also OECD (2015).
7 Joensen and Nielsen's (2015) study of Danish schools quantifies this effect, concluding that encouraging more students to opt for advanced mathematics has a sizeable positive earnings effect for girls but not for boys.
7
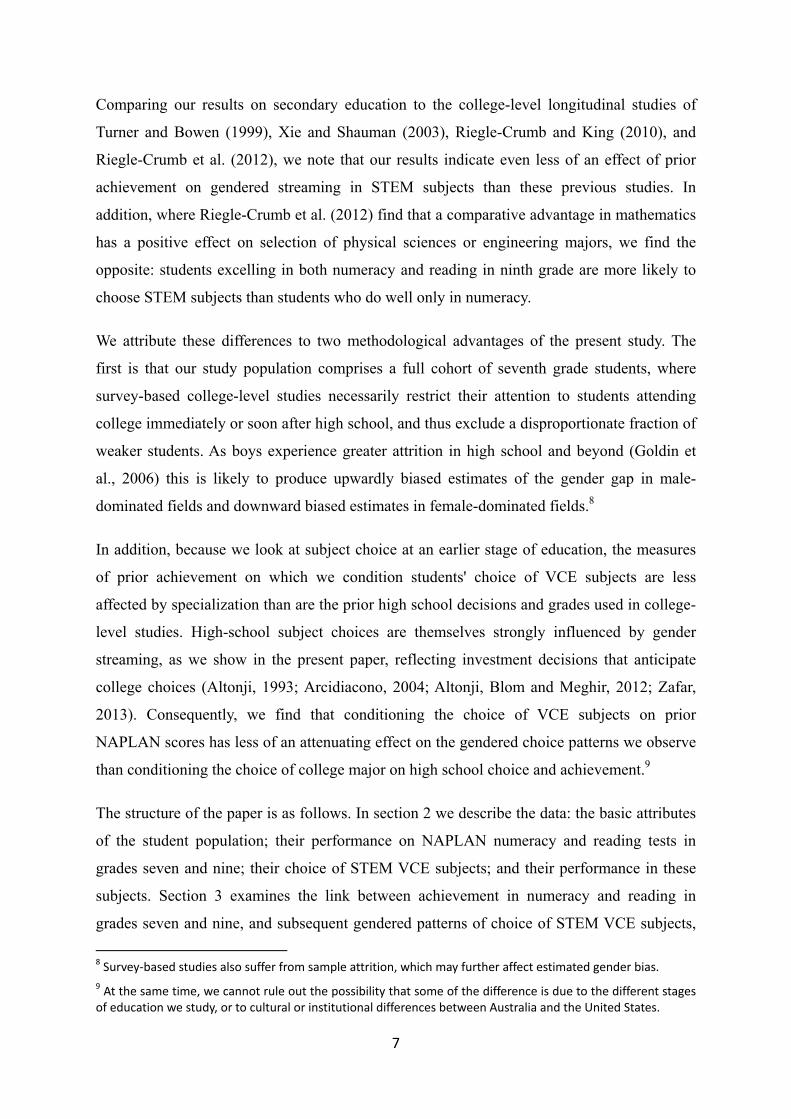
Comparing our results on secondary education to the college-level longitudinal studies of
Turner and Bowen (1999), Xie and Shauman (2003), Riegle-Crumb and King (2010), and
Riegle-Crumb et al. (2012), we note that our results indicate even less of an effect of prior
achievement on gendered streaming in STEM subjects than these previous studies. In
addition, where Riegle-Crumb et al. (2012) find that a comparative advantage in mathematics
has a positive effect on selection of physical sciences or engineering majors, we find the
opposite: students excelling in both numeracy and reading in ninth grade are more likely to
choose STEM subjects than students who do well only in numeracy.
We attribute these differences to two methodological advantages of the present study. The
first is that our study population comprises a full cohort of seventh grade students, where
survey-based college-level studies necessarily restrict their attention to students attending
college immediately or soon after high school, and thus exclude a disproportionate fraction of
weaker students. As boys experience greater attrition in high school and beyond (Goldin et
al., 2006) this is likely to produce upwardly biased estimates of the gender gap in male-
dominated fields and downward biased estimates in female-dominated fields.8
In addition, because we look at subject choice at an earlier stage of education, the measures
of prior achievement on which we condition students' choice of VCE subjects are less
affected by specialization than are the prior high school decisions and grades used in college-
level studies. High-school subject choices are themselves strongly influenced by gender
streaming, as we show in the present paper, reflecting investment decisions that anticipate
college choices (Altonji, 1993; Arcidiacono, 2004; Altonji, Blom and Meghir, 2012; Zafar,
2013). Consequently, we find that conditioning the choice of VCE subjects on prior
NAPLAN scores has less of an attenuating effect on the gendered choice patterns we observe
than conditioning the choice of college major on high school choice and achievement.9
The structure of the paper is as follows. In section 2 we describe the data: the basic attributes
of the student population; their performance on NAPLAN numeracy and reading tests in
grades seven and nine; their choice of STEM VCE subjects; and their performance in these
subjects. Section 3 examines the link between achievement in numeracy and reading in
grades seven and nine, and subsequent gendered patterns of choice of STEM VCE subjects,
8 Survey‐based studies also suffer from sample attrition, which may further affect estimated gender bias.
9 At the same time, we cannot rule out the possibility that some of the difference is due to the different stages of education we study, or to cultural or institutional differences between Australia and the United States.

8
using both non-parametric methods and probit regressions. Section 4 examines the impact of
SES on gender differences in STEM selection. Section 5 concludes.
2 Data
We follow a full cohort of students in Victoria enrolled in the seventh-grade in 2008 through
to the twelfth grade in 2013. Of the 66,686 students in the full cohort, of whom 51.2% are
male, we omit 3,744 students younger than 11 or older than 12 in May 2008 (66% of them
male); 1,076 students for whom we lack both seventh grade and ninth grade NAPLAN scores
(62% male);10 and 3,395 students for whom we lack both ninth grade NAPLAN scores and
VCE completion (52.9% male). We refer to the remaining 58,471 students, of whom 50% are
male, as our seventh-grade cohort (Table 2). Almost a quarter of these students have a
language background other than English (LBOTE), and 0.8% are Aborigines and Torres Strait
Islanders (ATSI). Of this seventh-grade cohort, 66.6% completed their VCE in 2013.
Table 2. Descriptive statistics
Seventh grade students, all 58,471
% Female 50.0%
% Language background other than English 24.1%
% Aborigine and Torres Strait Islanders 0.8%
VCE complete, all students 38,947
of whom female 21,069
Success rate, all students 66.6%
success rate, female 72.1%
Average ATAR, female students with ATAR 64.53
Average ATAR, male students with ATAR 62.49
Socio‐economic status (SES) in seventh grade
SES 1 SES 2 SES 3 SES 4
23% 24% 28% 24%
10 For students with at least one NAPLAN score but missing one or more scores, we imputed the missing scores as follows (all scores are standardized). Where a ninth‐grade score was missing and we had the corresponding seventh‐grade score we set the ninth‐grade score equal to the seventh‐grade score (6,542 cases in numeracy and 6,435 cases in reading), and vice versa (1,443 in numeracy and 1,516 in reading). Where we had a reading score in at least one year but no numeracy score in either year we set the numeracy score equal to the reading score in each year (240 cases); and vice versa (284).
9
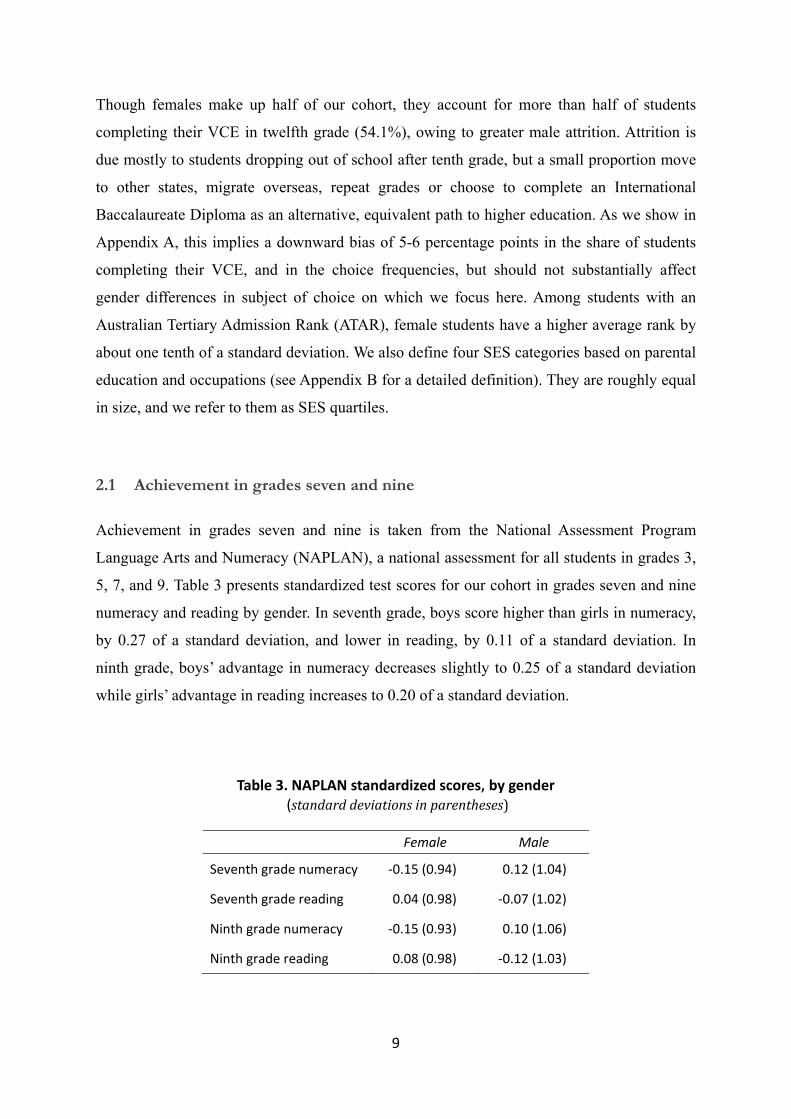
Though females make up half of our cohort, they account for more than half of students
completing their VCE in twelfth grade (54.1%), owing to greater male attrition. Attrition is
due mostly to students dropping out of school after tenth grade, but a small proportion move
to other states, migrate overseas, repeat grades or choose to complete an International
Baccalaureate Diploma as an alternative, equivalent path to higher education. As we show in
Appendix A, this implies a downward bias of 5-6 percentage points in the share of students
completing their VCE, and in the choice frequencies, but should not substantially affect
gender differences in subject of choice on which we focus here. Among students with an
Australian Tertiary Admission Rank (ATAR), female students have a higher average rank by
about one tenth of a standard deviation. We also define four SES categories based on parental
education and occupations (see Appendix B for a detailed definition). They are roughly equal
in size, and we refer to them as SES quartiles.
2.1 Achievement in grades seven and nine
Achievement in grades seven and nine is taken from the National Assessment Program
Language Arts and Numeracy (NAPLAN), a national assessment for all students in grades 3,
5, 7, and 9. Table 3 presents standardized test scores for our cohort in grades seven and nine
numeracy and reading by gender. In seventh grade, boys score higher than girls in numeracy,
by 0.27 of a standard deviation, and lower in reading, by 0.11 of a standard deviation. In
ninth grade, boys’ advantage in numeracy decreases slightly to 0.25 of a standard deviation
while girls’ advantage in reading increases to 0.20 of a standard deviation.
Table 3. NAPLAN standardized scores,by gender (standarddeviationsinparentheses)
Female Male
Seventh grade numeracy ‐0.15 (0.94) 0.12 (1.04)
Seventh grade reading 0.04 (0.98) ‐0.07 (1.02)
Ninth grade numeracy ‐0.15 (0.93) 0.10 (1.06)
Ninth grade reading 0.08 (0.98) ‐0.12 (1.03)

In all ca
by their
distribu
panel pr
these ra
takes o
illustrat
11 The grobservedSwanson
ases, boys’
r larger stan
ution of out
resents the
atios for ea
on values g
tes the stron
Figure 1. R
reater variabild in many co (2010), Pope
numeracy
ndard deviat
tcomes. Fig
ratio of boy
ach percenti
greater than
ng advantag
Ratio of num
lity of male ontexts. See, ae and Sydnor (
scores exhi
tions, leadin
gure 1 illus
ys to girls in
ile in the to
n one at th
ge boys have
mber of boys
utcomes and among others2010) and Fri
10
ibit greater
ng to their
trates this
n each achie
op six perc
he high en
e at the very
s to number
a male advas, Hedges andedman‐Sokule
variability t
over-repres
for NAPLA
evement de
entage poin
d of the d
y top of the
of girls by N
ntage at highd Nowell (199er and Justma
than girls’ s
entation at
AN numera
cile; the bot
nts. In the t
distribution;
distribution
APLAN num
er levels of ac95), Hyde et an (2015).
scores, as in
the high en
acy scores.
ttom panel
top panel, t
the bottom
n.11
meracy rank
chievement hal. (2008), E
ndicated
nd of the
The top
presents
the ratio
m panel
have been llison and

11
2.2 Selection of VCE STEM subjects
In senior secondary school, students are free to structure their own curriculum and complete
their VCE. If they wish to continue with tertiary education, they work to obtain an Australian
Tertiary Admission Rank (ATAR), the primary criterion for entry into most university
programs.12 To earn a VCE, students must attain an advanced level (units 3 and 4) in a
mandatory English subject, and at least three and at most five additional subjects. These
subject scores are then scaled, aggregated and harmonized with counterpart scores in other
Australian states and territories to reflect competitiveness and difficulty within a cohort,
producing a rank, which places each student within the full cohort of Australian students in
his or her year.13 Admissions are determined by ATAR cut-off values and specific degree
program prerequisites.14 Students presumably choose their advanced VCE subjects with a
view to achieving as high an ATAR as they can, given their specific abilities and application,
while meeting specific degree program prerequisites, preparing themselves for a future course
of study, and addressing their personal interests and inclinations.
Table 4 shows the percentage of boys, percentage of girls, and the male-to-female ratio for
each of our STEM categories, and for any STEM field ("any of the above"). The same
gendered patterns of specialization in tertiary education shown in Table 1 are already
apparent in the earlier choice of VCE subjects in senior secondary school. The subjects
appear in the order of the percentage-point male-female difference in choice frequencies.15
Male students choose physics, IT, and specialist mathematics much more frequently than
female students; female students choose life sciences and health and human development
12 There are, of course, other criteria, such as portfolios for arts courses, and interviews for medical studies; and there are alternative pathways to higher education for non‐school‐leavers and mature‐age students.
13 The lowest ATAR value assigned to a student is 30 and the highest is 99.95. An ATAR of 50 places one at the median of the full cohort—well below the median of students with an ATAR. Five of the STEM subjects we consider here are scaled up. They are, in descending order, specialist mathematics, mathematical methods, chemistry, physics, and life sciences. Two are scaled down: health and human development, and IT.
14 For example, entry to the University of Melbourne Bachelor of Biomedicine in 2015 requires an ATAR of 98.85 and VCE units 3 and 4 in English/ESL Creative Writing, chemistry and mathematical methods or specialist mathematics. http://coursesearch.unimelb.edu.au/undergrad/1504‐bachelor‐of‐biomedicine. The University of Queensland’s Bachelor of Engineering program requires an ATAR of 89 and VCE units 3 and 4 in English, Mathematical methods, and either physics or chemistry; and recommends taking both chemistry and physics, as well as specialist mathematics. https://www.uq.edu.au/study/program.html?acad_prog=2001.
15 Ordering the subjects by the ratio of male to female students would interchange physics and IT but otherwise leave the others unchanged.
12
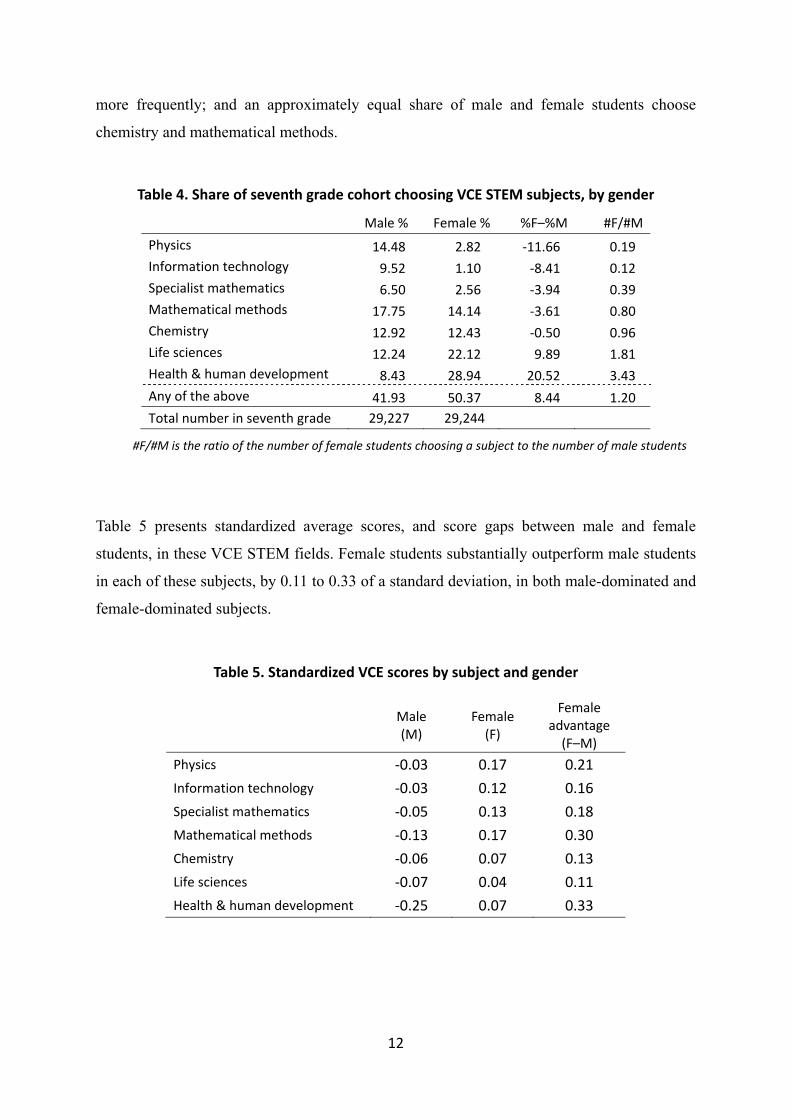
more frequently; and an approximately equal share of male and female students choose
chemistry and mathematical methods.
Table 4. Share of seventh grade cohort choosing VCE STEM subjects, by gender
Male % Female % %F–%M #F/#M
Physics 14.48 2.82 ‐11.66 0.19
Information technology 9.52 1.10 ‐8.41 0.12
Specialist mathematics 6.50 2.56 ‐3.94 0.39
Mathematical methods 17.75 14.14 ‐3.61 0.80
Chemistry 12.92 12.43 ‐0.50 0.96
Life sciences 12.24 22.12 9.89 1.81
Health & human development 8.43 28.94 20.52 3.43
Any of the above 41.93 50.37 8.44 1.20
Total number in seventh grade 29,227 29,244
#F/#M is the ratio of the number of female students choosing a subject to the number of male students
Table 5 presents standardized average scores, and score gaps between male and female
students, in these VCE STEM fields. Female students substantially outperform male students
in each of these subjects, by 0.11 to 0.33 of a standard deviation, in both male-dominated and
female-dominated subjects.
Table 5. Standardized VCE scores by subject and gender
Male (M)
Female (F)
Female advantage (F–M)
Physics ‐0.03 0.17 0.21
Information technology ‐0.03 0.12 0.16
Specialist mathematics ‐0.05 0.13 0.18
Mathematical methods ‐0.13 0.17 0.30
Chemistry ‐0.06 0.07 0.13
Life sciences ‐0.07 0.04 0.11
Health & human development ‐0.25 0.07 0.33

13
3 Gender differences in subject choice conditioned on prior achievement
In this section, we explore the relationship between mathematical achievement observed in
NAPLAN test results and the choice of STEM subjects, decomposing gender differences in
the choice of STEM subjects into two parts. The first is the contribution of gender differences
in prior mathematical achievement; the second is the contribution of gender differences in the
specific propensity to choose a STEM subject after conditioning on prior mathematical
achievement. We characterize these two components first graphically, then through a non-
parametric decomposition, and finally by regression analysis.
Figure 2 describes graphically the share of male and female students in the seventh-grade
cohort subsequently choosing each STEM field, at each percentile in the distribution of
seventh grade NAPLAN numeracy scores.16 We find for all subjects that the share of both
male and female students choosing a subject generally increases with prior achievement in
numeracy. However, the role of prior mathematical achievement differs across subjects. As
expected, it plays a more important role in more mathematically oriented subjects, especially
physics or specialist mathematics, and no clear role in health and human development. These
graphs highlight how the gendered patterns of choice noted above remain after conditioning
on prior achievement. Physics, IT and specialist mathematics are male-dominated subjects at
each point of the distribution of prior achievement (above a certain threshold), while life
sciences, and health and human development are female-dominated subjects at each point of
the distribution of prior scores. Figure 2 also shows that conditioned on prior achievement,
female students have a slightly greater propensity to choose chemistry than male students—a
pattern not revealed by the raw differences.
16 The graphs are smoothed by local quadratic regressions using the STATA LOWESS procedure.

Figure 2
2. Gender sspecific proppensity
14

15
Next, we quantify the contribution of differences in prior scores and in specific propensities
to the total gender effects, illustrated in Figure 2, using a simple, non-parametric
decomposition as follows. By definition, the difference in choice frequencies of male and
female students, and , equals:
∑ ∑ (1)
Where and denote the percentage of male and female students in percentile
; and and denote the percentage of male and female students in percentile of the
grade 7 numeracy distribution taking subject . We can rewrite equation (1) as:
∑ ∑ . (2)
The first term on the right-hand side is the effect of gender differences in specific propensities
and the second term is the effect of differences in mathematical performance. Table 6
presents the results of this decomposition, quantifying the gender differences in specific
propensities after controlling for gender differences in prior numeracy outcomes. As the
rightmost column indicates, differences in specific propensities are the prime factor driving
the male domination of IT and physics and the female domination of life sciences and health
and human development. Only in specialist mathematics, mathematical methods and
chemistry do gender differences in prior achievement in mathematics play a dominant role.
Table 6. Decomposition of the total gender effect, percentage points
Total gender
Effect (F – M)
Due to gender differences in seventh‐grade numeracy scores
Due to gender differences in
specific propensities
Ratio of propensity
effect to total gender effect
(a) (b) (c) |c/a|
Physics ‐11.66 ‐2.25 ‐9.41 0.24
IT ‐8.41 ‐0.24 ‐8.17 0.03
Specialist math ‐3.94 ‐1.87 ‐2.08 0.90
Math methods ‐3.61 ‐4.16 0.55 7.60
Chemistry ‐0.50 ‐3.67 3.17 1.16
Life sciences 9.89 ‐2.18 12.07 0.18
Health & hum dev 20.52 0.67 19.84 0.03
16
Table 7. Gender (female) effect on probability of choice, from probit regressions
Blinder‐Oaxaca
(1) (2) (3) (4)
Unobserved coefficient
Ratio to total effect
Physics ‐0.117 ‐0.090 ‐0.093 ‐0.094 ‐0.103 0.88
(0.004) (0.003) (0.003) (0.003) (0.002)
Information ‐0.084 ‐0.081 ‐0.084 ‐0.085 ‐0.084 1.00
technology (0.003) (0.003) (0.003) (0.003) (0.002)
Specialist ‐0.039 ‐0.017 ‐0.016 ‐0.018 ‐0.020 0.52
Mathematics (0.003) (0.002) (0.002) (0.002) (0.002)
Mathematical ‐0.036 0.006 ‐0.003 ‐0.007 ‐0.000 0.00
methods (0.006) (0.004) (0.004) (0.004) (0.003)
Chemistry ‐0.005 0.034 0.028 0.024 0.029 7.86
(0.006) (0.004) (0.004) (0.004) (0.003)
Life sciences 0.099 0.122 0.103 0.101 0.107 1.08
(0.005) (0.004) (0.004) (0.004) (0.003)
Health & 0.205 0.203 0.198 0.198 0.195 0.95
human dev (0.005) (0.005) (0.005) (0.005) (0.003)
Controls:
Numeracy G7&9 no yes yes yes yes
Reading G7&9 no no yes yes yes
SES, LBOTE no no no yes yes
Notes: N = 58,471. Standard errors in parenthesis clustered by seventh‐grade school. All coefficients significant
at p=0.01 or better except where entered in gray. The first four columns present marginal gender effects from
probit regressions. For example: The probability of choosing physics as a VCE subject is 11.7 percentage points
lower for a girl than for a boy, without controls (column 1); and 9.4 percentage points lower after controlling
for numeracy and reading scores in grades 7 and 9, socio‐economic variables and language background
(column 4). The fifth column presents the coefficient of unobserved characteristics estimated from a Blinder‐
Oaxaca decomposition controlling for the same variables as in column (4). The sixth column presents the ratio
of this coefficient to the total gender effect.
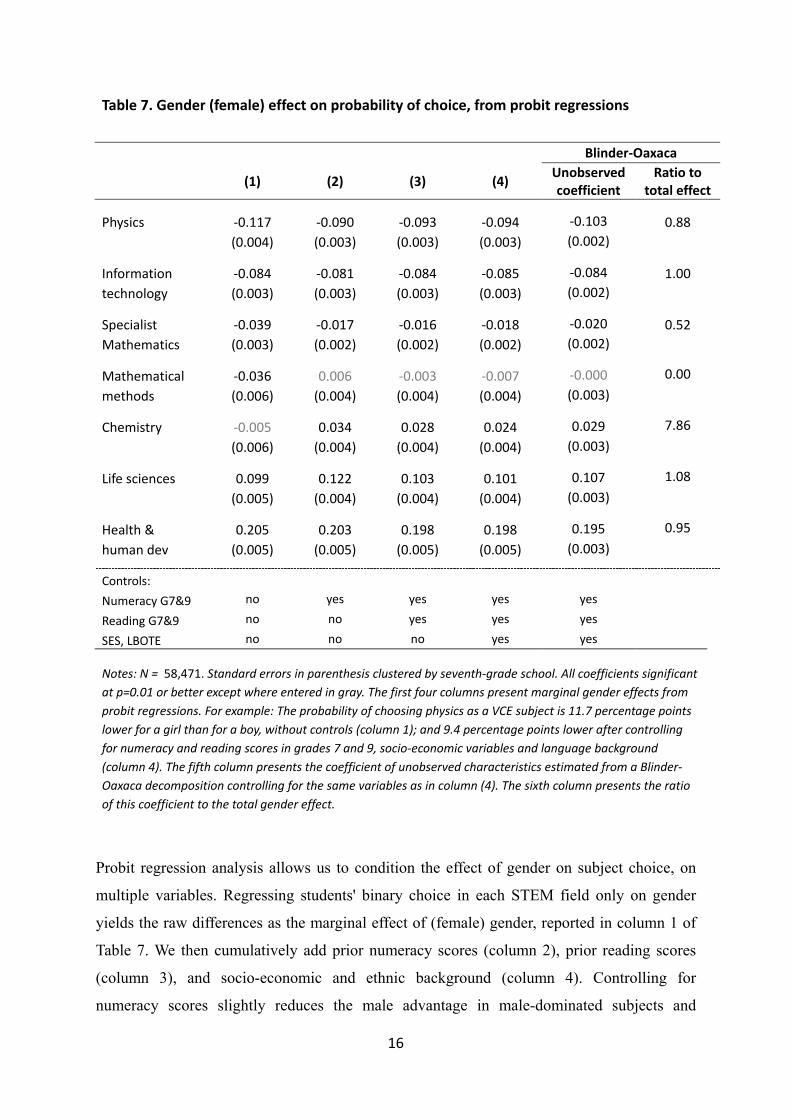
Probit regression analysis allows us to condition the effect of gender on subject choice, on
multiple variables. Regressing students' binary choice in each STEM field only on gender
yields the raw differences as the marginal effect of (female) gender, reported in column 1 of
Table 7. We then cumulatively add prior numeracy scores (column 2), prior reading scores
(column 3), and socio-economic and ethnic background (column 4). Controlling for
numeracy scores slightly reduces the male advantage in male-dominated subjects and
17
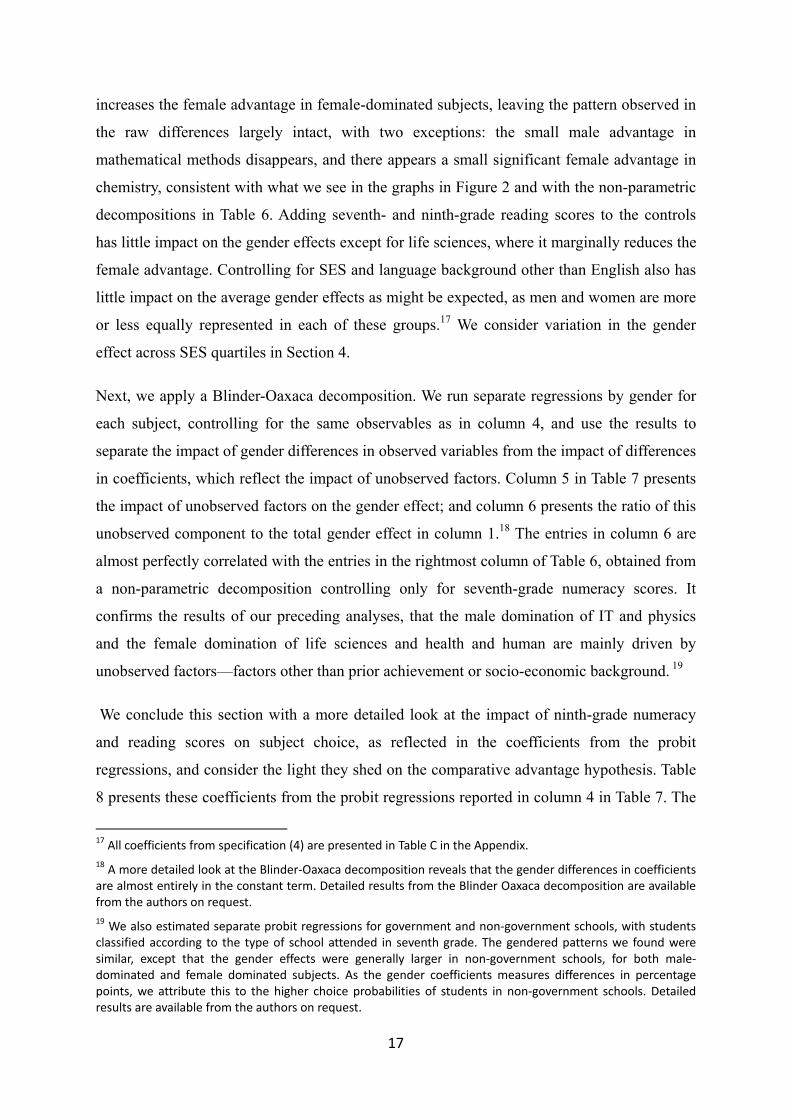
increases the female advantage in female-dominated subjects, leaving the pattern observed in
the raw differences largely intact, with two exceptions: the small male advantage in
mathematical methods disappears, and there appears a small significant female advantage in
chemistry, consistent with what we see in the graphs in Figure 2 and with the non-parametric
decompositions in Table 6. Adding seventh- and ninth-grade reading scores to the controls
has little impact on the gender effects except for life sciences, where it marginally reduces the
female advantage. Controlling for SES and language background other than English also has
little impact on the average gender effects as might be expected, as men and women are more
or less equally represented in each of these groups.17 We consider variation in the gender
effect across SES quartiles in Section 4.
Next, we apply a Blinder-Oaxaca decomposition. We run separate regressions by gender for
each subject, controlling for the same observables as in column 4, and use the results to
separate the impact of gender differences in observed variables from the impact of differences
in coefficients, which reflect the impact of unobserved factors. Column 5 in Table 7 presents
the impact of unobserved factors on the gender effect; and column 6 presents the ratio of this
unobserved component to the total gender effect in column 1.18 The entries in column 6 are
almost perfectly correlated with the entries in the rightmost column of Table 6, obtained from
a non-parametric decomposition controlling only for seventh-grade numeracy scores. It
confirms the results of our preceding analyses, that the male domination of IT and physics
and the female domination of life sciences and health and human are mainly driven by
unobserved factors—factors other than prior achievement or socio-economic background. 19
We conclude this section with a more detailed look at the impact of ninth-grade numeracy
and reading scores on subject choice, as reflected in the coefficients from the probit
regressions, and consider the light they shed on the comparative advantage hypothesis. Table
8 presents these coefficients from the probit regressions reported in column 4 in Table 7. The
17 All coefficients from specification (4) are presented in Table C in the Appendix.
18 A more detailed look at the Blinder‐Oaxaca decomposition reveals that the gender differences in coefficients are almost entirely in the constant term. Detailed results from the Blinder Oaxaca decomposition are available from the authors on request.
19 We also estimated separate probit regressions for government and non‐government schools, with students classified according to the type of school attended in seventh grade. The gendered patterns we found were similar, except that the gender effects were generally larger in non‐government schools, for both male‐dominated and female dominated subjects. As the gender coefficients measures differences in percentage points, we attribute this to the higher choice probabilities of students in non‐government schools. Detailed results are available from the authors on request.
18
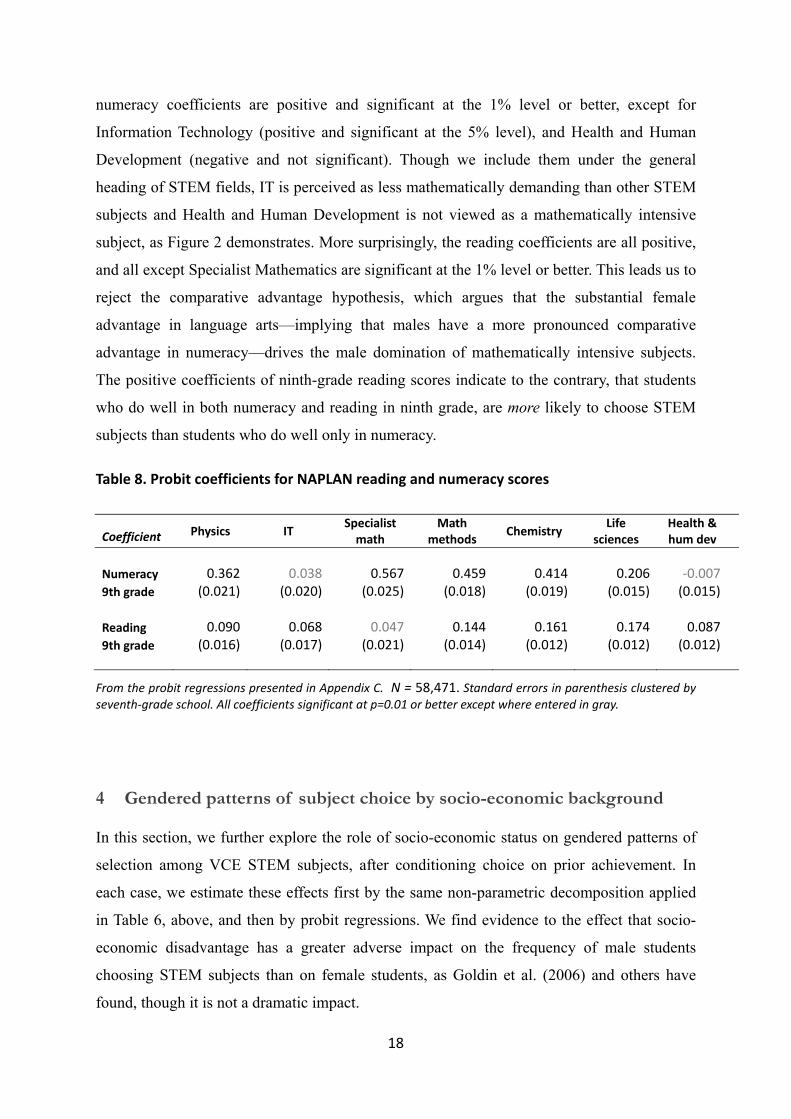
numeracy coefficients are positive and significant at the 1% level or better, except for
Information Technology (positive and significant at the 5% level), and Health and Human
Development (negative and not significant). Though we include them under the general
heading of STEM fields, IT is perceived as less mathematically demanding than other STEM
subjects and Health and Human Development is not viewed as a mathematically intensive
subject, as Figure 2 demonstrates. More surprisingly, the reading coefficients are all positive,
and all except Specialist Mathematics are significant at the 1% level or better. This leads us to
reject the comparative advantage hypothesis, which argues that the substantial female
advantage in language arts—implying that males have a more pronounced comparative
advantage in numeracy—drives the male domination of mathematically intensive subjects.
The positive coefficients of ninth-grade reading scores indicate to the contrary, that students
who do well in both numeracy and reading in ninth grade, are more likely to choose STEM
subjects than students who do well only in numeracy.
Table 8. Probit coefficients for NAPLAN reading and numeracy scores
Coefficient Physics IT Specialist math
Math methods
Chemistry Life
sciences Health &hum dev
Numeracy 0.362 0.038 0.567 0.459 0.414 0.206 ‐0.007 9th grade (0.021) (0.020) (0.025) (0.018) (0.019) (0.015) (0.015)
Reading 0.090 0.068 0.047 0.144 0.161 0.174 0.087 9th grade (0.016) (0.017) (0.021) (0.014) (0.012) (0.012) (0.012)
From the probit regressions presented in Appendix C. N = 58,471. Standard errors in parenthesis clustered by seventh‐grade school. All coefficients significant at p=0.01 or better except where entered in gray.
4 Gendered patterns of subject choice by socio-economic background
In this section, we further explore the role of socio-economic status on gendered patterns of
selection among VCE STEM subjects, after conditioning choice on prior achievement. In
each case, we estimate these effects first by the same non-parametric decomposition applied
in Table 6, above, and then by probit regressions. We find evidence to the effect that socio-
economic disadvantage has a greater adverse impact on the frequency of male students
choosing STEM subjects than on female students, as Goldin et al. (2006) and others have
found, though it is not a dramatic impact.

19
Table 10 presents the choice frequencies within SES for each subject for male and female
students. The gender differences (female minus male) in choice frequencies increase with
socio-economic status, so the percentage point differences are generally higher in higher
socio-economic levels. However, as the rightmost column of Table 10 indicates, in five of our
seven categories the relative increase in the male choice probability is greater than the
relative female increase, reflecting a greater adverse effect of socio-economic disadvantage
on male students.
Table 10. Choice frequencies of STEM subjects, by gender and SES
SES 1 SES 2 SES 3 SES 4 Quotient*
Physics Male 8.6 10.5 15.3 22.8
0.95 Female 1.5 2.0 3.2 4.4
IT Male 7.8 9.6 10.5 10.0
1.06 Female 0.9 1.1 1.2 1.2
Specialist math Male 3.0 4.2 6.7 11.8
1.10 Female 1.2 1.7 3.0 4.2
Math methods Male 9.3 11.9 19.8 28.9
1.12 Female 8.0 9.7 15.8 22.6
Chemistry Male 6.3 8.0 14.2 22.3
1.20 Female 6.7 8.1 14.3 20.1
Life sciences Male 6.7 9.2 13.6 18.7
1.32 Female 14.1 19.1 24.1 30.5
Health & hum dev Male 7.1 9.1 9.1 8.3
0.98 Female 23.7 31.9 30.6 29.0
*The quotient is defined as (SES4/SES1)male / (SES4/SES1)female . It is the ratio of the increase in the male choice frequency from the lowest to the highest SES to the increase in the female choice frequency.
This is further supported by a decomposition of the total gender effect within SES quartiles
for each subject, using the method defined by equation (2) above and used in the preceding
section to construct Table 6. Table 11 presents the ratio of the contribution of gender
differences in specific propensities to specialize in each subject, controlling for seventh-grade
numeracy scores, to the overall gender differences in choice frequencies, in percentage
points.20 In the three male-dominated subjects—physics, IT and specialist mathematics—the
contribution of the role of specific propensities to the male advantage is least pronounced at
the lowest SES level; in the two female-dominated subjects—life sciences and health and
20 The denominator of this ratio is the difference between the female and male rows in Table 10.

20
human development—their contribution to a female advantage is most pronounced at the
lowest SES level.
Table 11. Ratio of gender differences in specific propensities to gender differences in choice frequencies, by SES
SES1
(weakest) SES2 SES3
SES4 (strongest)
Physics 0.80 0.76 0.82 0.84
IT 0.94 0.95 0.97 1.00
Specialist math 0.56 0.44 0.47 0.60
Math methods ‐0.77 ‐0.59 ‐0.05 0.17
Chemistry 7.33 29.00 39.00 ‐1.32
Life sciences 1.22 1.21 1.19 1.15
Health & hum dev 1.01 1.00 0.95 0.91
Ratio of the contribution of specific propensities to the overall female – male percentage point difference in choice frequencies. Calculated from a decomposition as in Table 6, defined by equation (2).
These findings are further supported by regression analysis. Column (a) of Table 12 gives the
marginal effect of SES4 from the probit choice regressions. This is the average difference in
choice probabilities between a student in the highest SES category and a student in the lowest
SES category after controlling for gender, NAPLAN numeracy and reading scores in grades 7
and 9, LBOTE, and the second, third and highest SES quartiles. The probability of choosing
to specialize in STEM subjects increases with SES, significantly so in all subjects except IT;
and less in mathematically intensive subjects. Columns (b) and (c) present the gender
(female) marginal effects from probit choice regressions for each subject estimated within,
respectively, the lowest and highest SES categories. The larger entries in column (c) reflect
the generally higher choice probabilities in the highest SES category. The rightmost column
of Table 12 gives the ratio of the difference in female advantage between the highest and
lowest category—the difference between columns (c) and (b)—to the overall advantage of
SES, given by column (a). In the first four subjects, where we find a male advantage, the
relative increase in the gender gap is greater than the relative increase in the overall choice
frequency; in the other three categories, where there is a female advantage, the relative
increase in the gender gap is less than the relative increase in the choice frequency.

21
Table 12. SES effects on probability of choice compared to gender effects on probability of choice within SES categories, from probit regressions
SES 4‐ SES1, all
(a) F – M, SES 1
(b) F– M, SES 4
(c) Ratio (c‐b)/a
Physics 0.016 ‐0.057 ‐0.152 ‐5.9
(0.004) (0.004) (0.007)
IT 0.002 ‐0.067 ‐0.089 ‐11.0
(0.003) (0.004) (0.005)
Specialist math 0.008 ‐0.010 ‐0.040 ‐2.75
(0.003) (0.002) (0.005)
Math methods 0.049 0.004 ‐0.019 ‐2.1
(0.005) (0.005) (0.008)
Chemistry 0.039 0.016 0.026 0.26
(0.005) (0.004) (0.008)
Life sciences 0.062 0.077 0.121 0.71
(0.005) (0.006) (0.008)
Health & hum dev 0.038 0.162 0.197 0.92 (0.006) (0.007) (0.009)
Notes: Column (a) reports the marginal effect of SES4 from probit regressions, reported in Table C. All regressions have controls for NAPLAN numeracy and reading scores in grades 7 and 9, and for LBOTE, for the second, third and highest SES quartiles. Reading example: the probability of choosing physics as a VCE subject is on average 1.6 percentage points higher for a student in the highest SES category than for a student in the lowest SES category after controlling for all of the above. Standard errors in parenthesis, clustered at seventh‐grade school level. All coefficients significant at p<0.01 except where entered in gray. Columns (b) and (c) report the gender (female) coefficients marginal effect from probit regressions within SES categories 1 and 4, respectively. All regressions have controls for NAPLAN numeracy and reading scores in grades 7 and 9, and for LBOTE. Again, standard errors are clustered at seventh‐grade school level in parentheses, and all coefficients are significant at p<0.01 except where entered in gray. Reading example: In the highest SES category, the probability of choosing physics as a VCE subject is 15.2 percentage points lower for a female student than for a male student. Standard errors in parenthesis.
Ethnic differences also have an impact on gendered patterns of choice of STEM electives.
Almost a quarter of our seventh grade cohort reports having a language background other
than English (LBOTE). We find that both male and female LBOTE students have uniformly
higher STEM choice frequencies, as indicated by the significant positive coefficients of
LBOTE in each of subject equations reported in Table C in the Appendix. We also find larger
relative gender gaps among LBOTE students: the female-to-male ratios are smaller in male

22
dominated subjects and larger in female dominated subjects.21 The gendered patterns of
choice among STEM subjects observed in the population as a whole are more pronounced
among students with a language background other than English. This may reflect the role of
cultural factors in shaping these gendered choices. However, this is a very varied category
and the average effect no doubt hides larger differences between immigrants from different
countries. Unfortunately, we do not have individual information on country of origin.
Finally, Table 13 shows the extremely low participation in STEM subjects among Indigenous
students. Of 498 Aboriginal students in our cohort, only 44 chose any STEM elective. No
female Indigenous student chose physics, IT or specialist mathematics.
Table 13. Choice of VCE STEM subjects by Indigenous students
Female Male Total
Physics 0 6 6
IT 0 1 1
Specialist math 0 1 1
Math methods 1 5 6
Chemistry 1 1 2
Life sciences 10 5 15
Health & hum dev 20 7 27
Any STEM 27 17 44
5 Conclusions
As earlier studies have shown, women’s under-representation in high-paying jobs in
engineering and information technology, reflects earlier patterns in tertiary education, and
contributes substantially to the gender wage gap. In this paper, we show that gender
streaming into STEM related subjects appears already in the final years of senior secondary
school, in students' choice of VCE STEM subjects. We find a male majority among students
choosing physics, information technology, and specialist mathematics; and a female majority
among those choosing life sciences and health and human development. We then use
21 We derive this from separate tabulations and from regressions restricted to LBOTE students, available from the authors on request.

23
longitudinal data to test directly the widely maintained hypothesis that these choices are
driven by gender differences in prior performance in mathematics limiting female
participation in mathematics-intensive fields, and reject it.
Our data follows a full cohort of seventh grade students in Victoria in 2008 to their choice of
VCE subjects in the final years of secondary school, in 2013. This allows us to control for
prior achievement on national tests in seventh and ninth grades in numeracy and reading in
estimating the gender effect on the probability of choosing different subjects. We find that
controlling for prior achievement has little impact on the different male and female choice
patterns we observe; when comparing male and female students with similar prior scores, the
gendered patterns of subject choice remain essentially intact. Moreover, we find no evidence
for the hypothesis that comparative advantage explains these gendered patterns: except in
specialist mathematics, students who do well in numeracy and reading, male and female
alike, are generally more likely to choose STEM subjects than students who do well only in
numeracy. Our analysis also indicates that specific propensities to choose STEM subjects
increase with SES, though this advantage is less pronounced in more mathematically oriented
subjects. We find less of a female disadvantage among students with a weaker socio-
economic background, supporting previous findings on the greater adverse effect of socio-
economic disadvantage on boys than on girls.
Overall, we find that pronounced gendered patterns of specialization in STEM fields are
already apparent in the final years of secondary school. These patterns remain essentially
intact after controlling for prior performance and socio-economic background, suggesting
that they are shaped by social norms and perceived economic incentives.

24
References
Altonji, JG, 1993. The demand for and return to education when education outcomes are uncertain. Journal of Labor Economics, 11: 48-83.
Altonji, JG, Blom, E and Meghir, C, 2012. Heterogeneity in human capital investments: High school curriculum, college major, and careers. WP 17985, NBER.
Arcidiacono, P 2004. Ability sorting and the returns to college major. Journal of Econometrics, 121: 343-375.
Ayalon, H, 1995. Math as a gatekeeper: Ethnic and gender inequality in course taking of the sciences in Israel. American Journal of Education, 104: 34-56.
Bedard, K and Cho, I, 2010. Early gender test score gaps across OECD countries. Economics of Education Review, 29: 348-363.
Bharadwaj, P, Giorgi, GD, Hansen, D and Neilson, C, 2012. The gender gap in mathematics: Evidence from low- and middle-income countries. WP 18464. Cambridge, MA: NBER.
Birch, ER, Li, I, and Miller, PW, 2009. The influence of institution attended and field of study on graduates’ starting salaries. Australian Economic Review, 42 (1): 42-63.
Booth, A, Cardona-Sosac, L, and Nolena, P, 2014. Gender differences in risk aversion: Do single-sex environments affect their development? Journal of Economic Behavior and Organization 99: 126–154.
Buser, T, Niederle, M and Oosterbeek, H, 2014. Gender, competitiveness, and career choices. The Quarterly Journal of Economics, 129: 1409-1447.
Ceci, SJ, Ginther, DK, Kahn, S and Williams, WM, 2014. Women in academic science: A changing landscape. Psychological Science in the Public Interest, 15(3): 75-141.
Cobb-Clark, D and Tan, M, 2011. Noncognitive skills, occupational attainment, and relative wages. Labour Economics, 18: 1-13.
Collins, C, Kenway, J and McLeod, J, 2000. Factors influencing the educational performance of males and females in school and their initial destinations after leaving school. Deakin University and the University of South Australia.
Ellison, G and Swanson, A, 2010. The gender gap in secondary school mathematics at high achievement levels: Evidence from the American mathematics competitions, Journal of Economic Perspectives, 24: 109-28.
Else-Quest, NM, Hyde, JS and Linn, MC, 2010. Cross-national patterns of gender differences in mathematics: A meta-analysis. Psychological Bulletin, 136: 103-127.
Friedman-Sokuler, N and Justman, M, 2015. Gender streaming and prior achievement in high school science and mathematics: Evidence from Israel. Working paper. Department of Economics, Ben Gurion University.
Fryer, RG and Levitt, SD, 2010. An empirical analysis of the gender gap in mathematics. American Economic Journal: Applied Economics, 2: 210-240.
Gneezy, U, Leonard, KL and List, JA, 2009. Gender differences in competition: Evidence from a matrilineal and a patriarchal society. Econometrica, 77: 1637-1664.
Goldin, C., Katz, L. F. and Kuziemko, I, 2006. The homecoming of American college women: The reversal of the college gender gap. WP12139. Cambridge, MA: NBER.

25
Graduate Careers Australia, 2014. An analysis of the gender wage gap in the Australian graduate labour market, 2013.
Guiso, L, Monte, F, Sapienza, P and Zingales, L, 2008. Culture, gender, and math. Science, 320: 1164-1165.
Hedges, LV and Nowell, A, 1995. Sex differences in mental test scores, variability, and numbers of high-scoring individuals. Science, 269: 41-45.
Hyde, JS, Lindberg, SM, Linn, MC, Ellis, AB and Williams, CC, 2008. Gender similarities characterize math performance. Science, 321: 494-495.
Joensen, JS and Nielsen, HS, 2015. Mathematics and gender: Heterogeneity in causes and consequences. The Economic Journal, forthcoming.
Kane, JM and Mertz, JE, 2012. Debunking myths about gender and mathematics performance. Notices of the American Mathematical Society, 59: 10-21.
Lavy, V and Sand, E, 2015. On the origins of gender human capital gaps: Short and long term consequences of teachers' stereotypical biases. WP 20909. Cambridge, MA: NBER.
Marginson, S, Tytler, R, Freeman, B and Roberts, K, 2013. STEM: Country comparisons. Report for the Australian Council of Learned Academies.
Marks, GN, 2008. Accounting for the gender gaps in student performance in reading and mathematics: evidence from 31 countries. Oxford Review of Education, 34(1): 89-109.
National Centre for Vocational Education Research, 2012. Tertiary education and training in Australia 2010. Department of Industry, Innovation, Science, Research and Tertiary Education. http://www.ncver.edu.au/publications/2489.html.45
Niederle, M. and Vesterlund, L. (2010) Explaining the gender gap in math test scores: The role of competition, The Journal of Economic Perspectives, 24: 129-144.
OECD (2013), Education at a Glance 2013: OECD Indicators, OECD Publishing, Paris. DOI: http://dx.doi.org/10.1787/eag-2013-en
OECD (2015), The ABC of gender equality in education: Aptitude, behaviour, confidence, PISA. OECD Publishing. DOI: http://dx.doi.org/10.1787/9789264229945-en
Paglin, M. and Rufolo, AM, 1990. Heterogeneous human capital, occupational choice, and male-female earnings differences. Journal of Labor Economics, 8: 123-144.
Pope, DG and Sydnor, JR, 2010. Geographic variation in the gender differences in test scores, The Journal of Economic Perspectives, 24: 95-108.
Rapoport, B and Thibout, C. 2016. Why do boys and girls make different educational choices? The influence of expected earnings and test scores. Melbourne Institute Working Paper 1/2016. The University of Melbourne.
Riegle-Crumb, C and King, B, 2010. Questioning a white male advantage in STEM: Examining disparities in college major by gender and race/ethnicity. Educational Researcher, 39: 656-664.
Riegle-Crumb, C, King, B, Grodsky, E and Muller, C, 2012. The more things change, the more they stay the same? Prior achievement fails to explain gender inequality in entry into stem college majors over time. American Educational Research Journal, 49: 1048-1073.
Sells, LW, 1973. High school mathematics as the critical filter in the job market. Developing opportunities for minorities in graduate education. 37-39.

26
Turner, SE and Bowen, WG (1999) Choice of major: The changing (unchanging) gender gap. Industrial and Labor Relations Review, 52: 289-313.
Wang, M-T, Eccles, JS and Kenny, S, 2013). Not lack of ability but more choice: Individual and gender differences in choice of careers in science, technology, engineering, and mathematics, Psychological Science, 24: 770-775.
Xie, Y and Shauman, KA, 2003. Women in science: Career processes and outcomes. Cambridge, MA: Harvard University Press.
Zafar, B, 2013. College major choice and the gender gap. Journal of Human Resources, 48: 545-595.
27
Appendix A. Seventh grade students not present in the twelfth-grade data There are three categories of students in our seventh-grade cohort who do not appear in the
twelfth-grade data and are therefore counted as not having achieved an ATAR but who may
have achieved a VCE (or equivalent qualification) elsewhere or at a different time: those
leaving Victoria between the seventh and twelfth grades; those held back a year or skipping a
year between the seventh and twelfth grades; and those achieving the International
Baccalaureate Diploma (IBD), an equivalent qualification.
Students leaving Victoria between the seventh and twelfth grades. Total annual departures
from Victoria in 2009 amounted to just over 60,000; in Australia as a whole, just fewer than
4% of internal migrants were between the ages of 15-19 (Australian Bureau of Statistics,
2009, Migration Australia, cat. no. 3412.0, tables 5.3, 5.8, from
http://www.abs.gov.au/AUSSTATS/[email protected]/DetailsPage/3412.02009-10?OpenDocument).
Assuming this age distribution applies to Victoria as well, and distributes evenly among the
five years from 15 to 19, then there were 480 departures per cohort each year, or 2640
departures in the 5.5 years between the seventh grade NAPLAN tests in May 2008 and the
twelfth grade VCE exams in November 2012, equal to about 4.4% of our year seventh-grade
cohort of nearly 60,000. If their success rates in achieving a VCE are similar to the general
population, 70%, this leads us to understate the true share achieving a VCE by 3.1 percentage
points. It seems reasonable to assume that this lowers choice frequencies uniformly across
STEM subjects and gender, suggesting that this omission should not have a substantial effect
on our estimates of gendered patterns of choice in STEM.
Students held back a year or skipping a year between grades seven and twelve. NAPLAN
data from 2008 to 2011 indicates that on average roughly 0.8% of students in Victoria
government schools repeat grade 9 annually (Table A). Assuming the share of repeaters in
earlier years is similar while those in later years is half that, we posit an overall rate of 3.2%
between grades seven and twelve in government schools, and a substantially lower rate of
1.0% in non-government schools, or 2.6% overall. The fraction of students achieving a VCE
among repeaters is likely to be lower than the 70% observed in the general population, say
40%. Then adding repeaters who achieve a VCE in later years adds 1.0 percentage point. This
category is probably not gender neutral, as male attrition rates are generally higher. However,
the share of students in this group choosing mathematically intensive subjects is not high, and
therefore should not have a substantial impact on gender biases in subject choice.

28
We do not have data on the share of students skipping a year between grades seven and
twelve. Their share in the population at these ages is likely to be significantly smaller than the
share of repeaters, say 0.5% of the cohort but their success rate should be close to 100%, and
many of these are likely to choose mathematically intensive VCE subjects. The impact on
gender bias is less clear, but the small size of this category of students suggests that it must be
limited.
Table A. Students repeating Grade 9 in Victoria government schools
Year Number of students in cohort Students repeating Grade 9 Share
2009 40,794 335 0.82%
2010 39,962 309 0.77%
2011 39,848 373 0.94%
2012 39,486 344 0.87%
total 160,090 1,361 0.85%
Source: Victoria DET NAPLAN data, authors’ tabulation
Students earning an International Baccalaureate Diploma (IBD). The IBD is an alternative
system of high school matriculation, equivalent to a VCE. (Australia's University Admission
Centre (UAC) publishes an equivalence scale equating IB Diploma scores to its ranks on the
ATAR scale.) About five hundred students earn an IB Diploma in Victoria annually, about
0.8% of the cohort. Globally, students sitting for the November session of the IB exams are
split equally between male and female students.
In sum, this implies that we are understating the share of the seventh-grade cohort achieving a
VCE by 3.1 + 1.0 + 0.5 + 0.8 = 5.4% of the cohort. Adding this to the observed frequency of
66.6 in Table 2, yields a total of 71%, close to the target share of 70%. Of these, the first and
last categories appear to be gender neutral; the proportion of students repeating a year who
choose mathematically intensive VCE subjects is likely to be small. There may be a small
bias introduced by the absence from our data of students completing their VCE a year early
from our data, but its direction is not clear a priori.
29
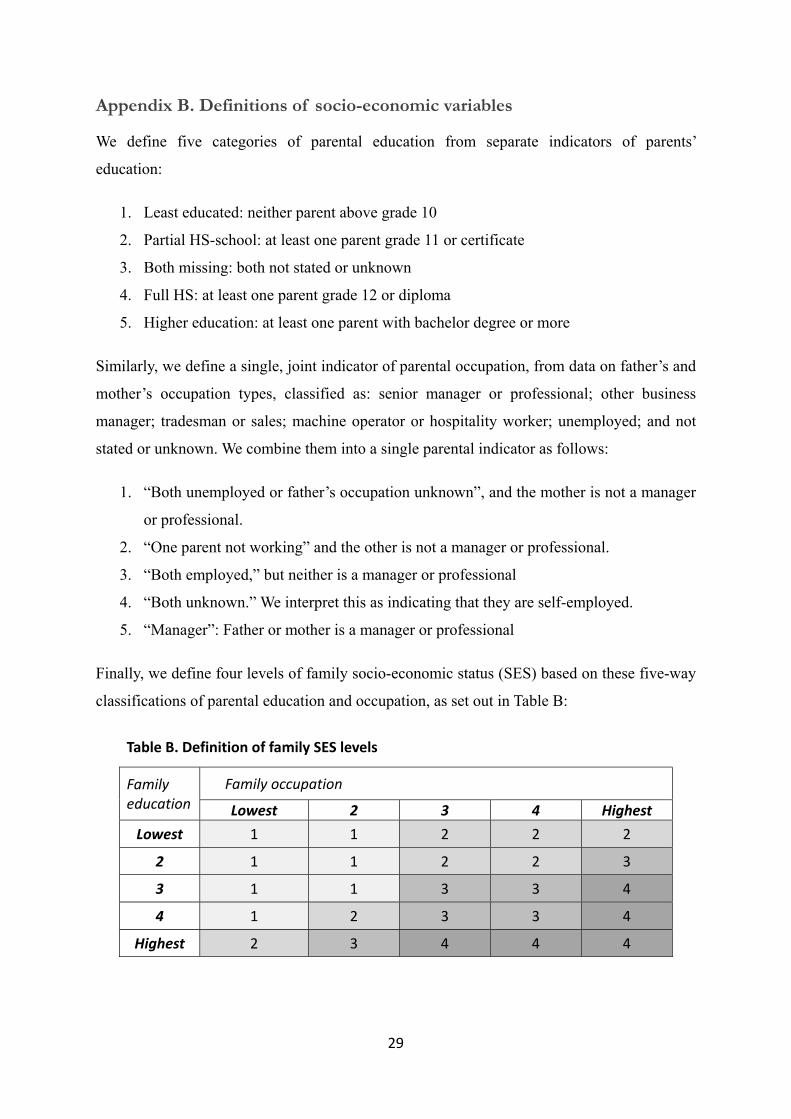
Appendix B. Definitions of socio-economic variables
We define five categories of parental education from separate indicators of parents’
education:
1. Least educated: neither parent above grade 10
2. Partial HS-school: at least one parent grade 11 or certificate
3. Both missing: both not stated or unknown
4. Full HS: at least one parent grade 12 or diploma
5. Higher education: at least one parent with bachelor degree or more
Similarly, we define a single, joint indicator of parental occupation, from data on father’s and
mother’s occupation types, classified as: senior manager or professional; other business
manager; tradesman or sales; machine operator or hospitality worker; unemployed; and not
stated or unknown. We combine them into a single parental indicator as follows:
1. “Both unemployed or father’s occupation unknown”, and the mother is not a manager
or professional.
2. “One parent not working” and the other is not a manager or professional.
3. “Both employed,” but neither is a manager or professional
4. “Both unknown.” We interpret this as indicating that they are self-employed.
5. “Manager”: Father or mother is a manager or professional
Finally, we define four levels of family socio-economic status (SES) based on these five-way
classifications of parental education and occupation, as set out in Table B:
Table B. Definition of family SES levels
Family education
Family occupation
Lowest 2 3 4 Highest
Lowest 1 1 2 2 2
2 1 1 2 2 3
3 1 1 3 3 4
4 1 2 3 3 4
Highest 2 3 4 4 4

30
Ap
pen
dix
C. C
oeff
icie
nt
esti
mat
es f
rom
th
e p
rob
it r
egre
ssio
ns
Table C. P
robit coefficient estim
ates
Probit
Physics
IT
Specialist math
Math m
ethods
Chemistry
Life scien
ces
H&H.Dev
Any STEM
Female
‐0.842***
‐0.995***
‐0.295***
0.153***
‐0.037*
0.445***
0.797***
0.346***
(0.028)
(0.038)
(0.032)
(0.023)
(0.021)
(0.019)
(0.022)
(0.017)
Numeracy
0.177***
‐0.008
0.264***
0.153***
0.152***
‐0.032**
‐0.060***
0.080***
Grade 7
(0.018)
(0.020)
(0.023)
(0.017)
(0.018)
(0.014)
(0.016)
(0.014)
Numeracy
0.362***
0.038*
0.567***
0.459***
0.414***
0.206***
‐0.007
0.386***
Grade 9
(0.021)
(0.020)
(0.025)
(0.018)
(0.019)
(0.015)
(0.015)
(0.014)
Read
ing
‐0.018
0.042**
‐0.090***
‐0.017
‐0.021
0.071***
‐0.064***
‐0.017
Grade 7
(0.015)
(0.016)
(0.019)
(0.013)
(0.013)
(0.011)
(0.012)
(0.011)
Read
ing
0.090***
0.068***
0.047**
0.144***
0.161***
0.174***
0.087***
0.140***
Grade 9
(0.016)
(0.017)
(0.021)
(0.014)
(0.012)
(0.012)
(0.012)
(0.010)
SES cat. 2
0.024
0.091***
0.030
0.011
0.033
0.130***
0.209***
0.178***
(0.028)
(0.029)
(0.039)
(0.028)
(0.024)
(0.022)
(0.020)
(0.018)
SES cat. 3
0.063**
0.093***
0.042
0.162***
0.171***
0.204***
0.200***
0.258***
(0.030)
(0.031)
(0.040)
(0.028)
(0.024)
(0.024)
(0.023)
(0.020)
SES cat. 4
0.136***
0.019
0.128***
0.249***
0.260***
0.275***
0.163***
0.334***
(0.030)
(0.036)
(0.042)
(0.029)
(0.025)
(0.024)
(0.024)
(0.021)
LBOTE
0.308***
0.200***
0.467***
0.526***
0.461***
0.213***
‐0.084***
0.374***
(0.025)
(0.033)
(0.029)
(0.026)
(0.025)
(0.022)
(0.023)
(0.021)
Cons
‐1.450***
‐1.421***
‐2.319***
‐1.750***
‐1.451***
‐1.478***
‐1.497***
‐0.558***
(0.025)
(0.029)
(0.040)
(0.028)
(0.023)
(0.023)
(0.025)
(0.019)
N
58,471
58,471
58,471
58,471
58,471
58,471
58,471
58,471
Pseudo R‐sq
0.249
0.109
0.348
0.245
0.221
0.100
0.081
0.148
Coefficients from probit regressions. Standard errors in parentheses, clustered
by seventh‐grade school level. Significance levels: *p<0.1, **p<0.05, ***p<0.01.