Meiotic Chromosome Segregation in Triploid Strains of ... · Some of the inferences concerning...
33
Copyright Ó 2010 by the Genetics Society of America DOI: 10.1534/genetics.110.121533 Meiotic Chromosome Segregation in Triploid Strains of Saccharomyces cerevisiae Jordan St. Charles, Monica L. Hamilton and Thomas D. Petes 1 Department of Molecular Genetics and Microbiology, Duke University Medical Center, Durham, North Carolina 27710 Manuscript received April 13, 2010 Accepted for publication August 1, 2010 ABSTRACT Meiosis in triploids results in four highly aneuploid gametes because six copies of each homolog must be segregated into four meiotic products. Using DNA microarrays and other physical approaches, we examined meiotic chromosome segregation in triploid strains of Saccharomyces cerevisiae. In most tetrads with four viable spores, two of the spores had two copies of a given homolog and two spores had only one copy. Chromosomes segregated randomly into viable spores without preferences for generating near haploid or near diploid spores. Using single-nucleotide polymorphisms, we showed that, in most tetrads, all three pairs of homologs recombined. Strains derived from some of the aneuploid spore colonies had very high frequencies of mitotic chromosome loss, resulting in genetically diverse populations of cells. P OLYPLOIDY is very common in plants; for exam- ple, the frequency of polyploidy in angiosperms is 30–80% (Hegarty and Hiscock 2008). Most poly- ploidy is thought to arise by whole-genome duplication of diploids, producing tetraploids. One mode of producing a triploid is by union of a haploid gamete produced by a ‘‘normal’’ diploid with a diploid gamete produced by a tetraploid. Triploids produced by this mechanism have been detected in animals as well as plants. In a region with both diploid and tetraploid Palearctic green toads, triploid male toads resulting from crosses of diploid females and tetraploid males were observed (Stock et al. 2009). Triploids can also arise from a cross of diploid individuals in which one individual has tetraploid germinal tissue (Bridges and Anderson 1925). Although the fertility of triploid Dro- sophila is reduced, viable offspring between diploids and triploids can be readily obtained. In humans, triploidy is responsible for 15–18% of spontaneous abortions, but only 1 in 1200 fetuses live after birth; all of the live-born individuals die within a few months (Iliopoulos et al. 2005). Triploid yeast strains have been observed in the wild (Ezov et al. 2006) and have been generated in the lab by forced matings between haploids and diploids (Pomper et al. 1954). Since diploids of the MATa/MATa genotype do not mate, it is likely that the forced matings selected for rare diploids that had become homozygous for MAT a or MATa as a consequence of a mitotic recombi- nation at the mating-type locus on chromosome III. In most recent studies, triploids are generated by mating haploids to diploids that have been constructed to be homozygous at the mating-type locus (Parry and Cox 1970; Campbell et al. 1981; Campbell and Doolittle 1987). The meiotic products derived from sporulating a triploid would be expected to be highly aneuploid, containing chromosome numbers varying between the haploid number of 16 and the diploid number of 32. Since even extra copies of single chromosomes often adversely affect cellular growth rates (Torres et al. 2007), it is unsurprising that the viability of spores derived from triploids is lower than those derived from diploids. There is, however, a wide range of spore viabilities reported in different labs varying between 15 and 18% (Parry and Cox 1970; Campbell et al. 1981) to about 75% (Pomper et al. 1954). The first detailed analysis of chromosome segregation in viable spores derived from triploids was carried out by Parry and Cox (1970). The viable spores were crossed with haploids that had multiple auxotrophic markers and the resulting diploids were sporulated. Departures from 2:2 segregation of the markers were used to diagnose aneuploidy. Markers on 14 of the 16 yeast chromosomes were used. Of 34 segregants examined, 3 had one copy of all chromosomes tested, and 2 had two copies of all chromosomes tested. The other 29 segre- gants had between one and five disomic chromosomes. Parry and Cox (1970) noted that disomes of chromo- somes V, VIII, IX, XII, and XIII were more frequently observed in the viable spores than disomes of the other chromosomes. In addition, they suggested that the ability of the triploid-derived spores to tolerate aneu- Supporting information is available online at http://www.genetics.org/ cgi/content/full/genetics.110.121533/DC1. Available freely online through the author-supported open access option. 1 Corresponding author: Department of Molecular Genetics and Microbi- ology, Duke University Medical Center, Box 3054, Durham, NC 27710. E-mail: [email protected] Genetics 186: 537–550 (October 2010)
Transcript of Meiotic Chromosome Segregation in Triploid Strains of ... · Some of the inferences concerning...

Copyright � 2010 by the Genetics Society of AmericaDOI: 10.1534/genetics.110.121533
Meiotic Chromosome Segregation in TriploidStrains of Saccharomyces cerevisiae
Jordan St. Charles, Monica L. Hamilton and Thomas D. Petes1
Department of Molecular Genetics and Microbiology, Duke University Medical Center, Durham, North Carolina 27710
Manuscript received April 13, 2010Accepted for publication August 1, 2010
ABSTRACT
Meiosis in triploids results in four highly aneuploid gametes because six copies of each homolog mustbe segregated into four meiotic products. Using DNA microarrays and other physical approaches, weexamined meiotic chromosome segregation in triploid strains of Saccharomyces cerevisiae. In most tetradswith four viable spores, two of the spores had two copies of a given homolog and two spores had only onecopy. Chromosomes segregated randomly into viable spores without preferences for generating nearhaploid or near diploid spores. Using single-nucleotide polymorphisms, we showed that, in most tetrads,all three pairs of homologs recombined. Strains derived from some of the aneuploid spore colonies hadvery high frequencies of mitotic chromosome loss, resulting in genetically diverse populations of cells.
POLYPLOIDY is very common in plants; for exam-ple, the frequency of polyploidy in angiosperms is
30–80% (Hegarty and Hiscock 2008). Most poly-ploidy is thought to arise by whole-genome duplicationof diploids, producing tetraploids. One mode ofproducing a triploid is by union of a haploid gameteproduced by a ‘‘normal’’ diploid with a diploid gameteproduced by a tetraploid. Triploids produced by thismechanism have been detected in animals as well asplants. In a region with both diploid and tetraploidPalearctic green toads, triploid male toads resultingfrom crosses of diploid females and tetraploid maleswere observed (Stock et al. 2009). Triploids can alsoarise from a cross of diploid individuals in which oneindividual has tetraploid germinal tissue (Bridges andAnderson 1925). Although the fertility of triploid Dro-sophila is reduced, viable offspring between diploids andtriploids can be readily obtained. In humans, triploidy isresponsible for 15–18% of spontaneous abortions, butonly 1 in 1200 fetuses live after birth; all of the live-bornindividuals die within a few months (Iliopoulos et al.2005).
Triploid yeast strains have been observed in the wild(Ezov et al. 2006) and have been generated in the lab byforced matings between haploids and diploids (Pomper
et al. 1954). Since diploids of the MATa/MATa genotypedo not mate, it is likely that the forced matings selectedfor rare diploids that had become homozygous for
MATa or MATa as a consequence of a mitotic recombi-nation at the mating-type locus on chromosome III. Inmost recent studies, triploids are generated by matinghaploids to diploids that have been constructed to behomozygous at the mating-type locus (Parry and Cox
1970; Campbell et al. 1981; Campbell and Doolittle
1987).The meiotic products derived from sporulating a
triploid would be expected to be highly aneuploid,containing chromosome numbers varying between thehaploid number of 16 and the diploid number of 32.Since even extra copies of single chromosomes oftenadversely affect cellular growth rates (Torres et al. 2007),it is unsurprising that the viability of spores derived fromtriploids is lower than those derived from diploids. Thereis, however, a wide range of spore viabilities reported indifferent labs varying between 15 and 18% (Parry andCox 1970; Campbell et al. 1981) to about 75% (Pomper
et al. 1954).The first detailed analysis of chromosome segregation
in viable spores derived from triploids was carried out byParry and Cox (1970). The viable spores were crossedwith haploids that had multiple auxotrophic markersand the resulting diploids were sporulated. Departuresfrom 2:2 segregation of the markers were used todiagnose aneuploidy. Markers on 14 of the 16 yeastchromosomes were used. Of 34 segregants examined, 3had one copy of all chromosomes tested, and 2 had twocopies of all chromosomes tested. The other 29 segre-gants had between one and five disomic chromosomes.Parry and Cox (1970) noted that disomes of chromo-somes V, VIII, IX, XII, and XIII were more frequentlyobserved in the viable spores than disomes of the otherchromosomes. In addition, they suggested that theability of the triploid-derived spores to tolerate aneu-
Supporting information is available online at http://www.genetics.org/cgi/content/full/genetics.110.121533/DC1.
Available freely online through the author-supported open accessoption.
1Corresponding author: Department of Molecular Genetics and Microbi-ology, Duke University Medical Center, Box 3054, Durham, NC 27710.E-mail: [email protected]
Genetics 186: 537–550 (October 2010)
ploidy was limited, since most of the spores had less thanfive disomic chromosomes or were diploid.
A more extensive analysis of viable spores derivedfrom triplods was done by Campbell et al. (1981). Forchromosome III, they observed that about half of thespores had one chromosome and about half had two.They concluded that during meiotic segregation in thetriploid, two spores received two copies of each homo-log and two received one. For most chromosomes, thefrequency of spores with two copies was significantly lessthan the frequency with one copy. They attributed thisdifference to loss of disomic chromosomes duringmitotic growth of the spore cultures.
In a subsequent study, Campbell and Doolittle
(1987) examined chromosome compositions in triploid-derived tetrads that had two viable spores. If thesetwo viable spores are sister spores either both shouldhave two copies of any given chromosome or both sporesshould have one copy (Figure 1); below, we use the term‘‘monosomy’’ to describe spores that have only one copyof a homolog, although this term is also used to describediploid cells that lack a single chromosome. These twoclasses of events should be equally frequent. The observedfrequencies of tetrads in which both viable spores weredisomic for the same chromosome varied between 0(chromosome VII) and 0.5 (chromosome XIII) with anaverage of about 0.19 (Campbell and Doolittle 1987).The deviation between the expected (0.5) and observedfrequencies of two disomic spores was explained as aconsequence of mitotic chromosome loss.
Because of the low spore viability, meiotic recombina-tion in triploid yeast has not been examined previously.However, meiotic recombination in otherwise diploidcells that are trisomic or tetrasomic for a single chromo-some has been studied by a number of researchers.Shaffer et al. (1971) suggested two possible mechanismsby which trisomic chromosomes can pair, recombine,and segregate during meiosis. According to the bivalent/univalent-pairing model, two homologs pair, recombine,and segregate to opposite poles while the third homolograndomly segregates to either pole. By the second model(trivalent pairing), all three homologs pair, possibly recom-bine, and randomly segregate to either pole. A distinguish-ing feature of the trivalent model is that two chromosomesthat have recombined with each other are capable of seg-regating to the same pole during meiosis I. The majority ofstudies support the trivalent-pairing model (Shaffer et al.1971; Culbertson and Henry 1973; Riley and Manney
1978; Koller et al. 1996). From the genetic data, it isimpossible to determine whether all three homologs pairand recombine at the same time or whether there aremultiple cycles of pairing and recombination although, byvisualizing the synaptonemal complex in triploid strains,Loidl (1995) showed that simultaneous pairing of allthree homologs was common.
Some of the inferences concerning meiotic segrega-tion and recombination in past studies of triploids were
indirect for two reasons. First, not all of the meioticproducts from a single tetrad were examined. Second,mitotic chromosome loss occurred during the time-consuming assay of disomic chromosomes duringgrowth of the spore cultures or in the diploid strainsderived from mating the spore cultures. In the currentstudy, we examine the meiotic segregation of chromo-somes in triploid yeast in tetrads with four viable sporesusing physical methods (microarray analysis and a PCR-based examination of single-nucleotide polymorphisms)that are more rapid and sensitive than the methods usedpreviously. We show that meiotic chromosome segrega-tion in triploids is generally accurate, resulting in twospores with two copies and two spores with one copy ofeach homolog. The mean number of aneuploid chro-mosomes for each spore is initially close to 8, but we showdirectly that mitotic chromosome loss in spore culturescan be very rapid. In addition, we show that triploidchromosomes, like trisomic chromosomes, usually un-dergo trivalent pairing.
MATERIALS AND METHODS
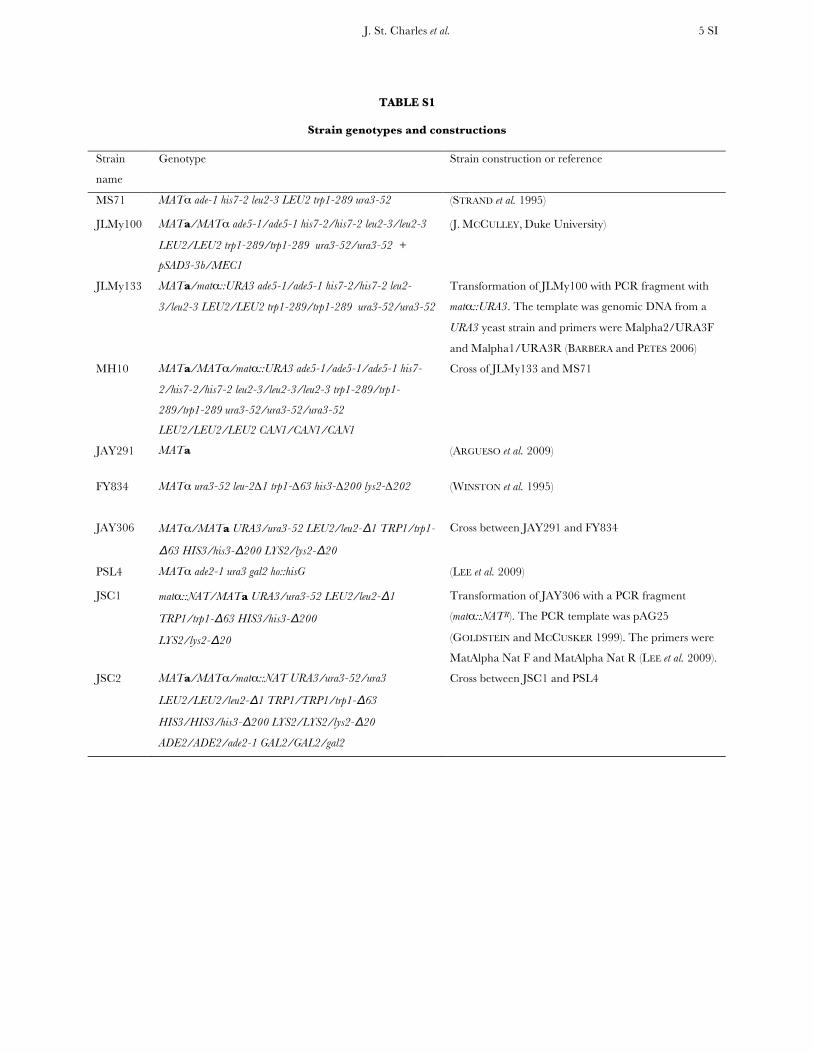
Strain construction: Our experiments were conducted usingtwo triploid strains: MH10 and JSC2. The three copies of eachhomolog in MH10 are identical except for alterations intro-duced by transformation, whereas the three copies of eachhomolog in JSC2 are derived from three diverged haploidstrains. The genotypes of all strains used in our study are given insupporting information, File S1 and Table S1. MH10 wasgenerated by crossing MS71 (MATa strain) to JLMy133, anisogenic diploid (MATa/mataTURA3). Thus, all three homo-logs of MH10 have the same DNA sequence except for themating-type locus on chromosome III. The JSC2 triploid wasconstructed to contain three diverged homologs of each yeastchromosome. JSC2 was generated by mating the haploid PSL4to the diploid JSC1. The haploid PSL4 (MATa mating type) wasderived from the YJM789 genetic background (Wei et al. 2007;Lee et al. 2009). The JSC1 diploid is a MATa/mataTNATderivative of JAY306, a diploid generated by crossing FY834(a haploid isogenic with S288c; Winston et al. 1995) withJAY291 (a recently sequenced haploid derived from an ethanol-producing strain; Argueso et al. 2009).
Genetic methods and media: We used standard genetic andmedia protocols (Guthrie and Fink 1991). Strains were matedby mixing the parental strains on a plate containing rich growthmedium (YPD) and incubating the mixture for 6 hr at 30�. Wethen picked zygotes and sporulated the resulting triploids.Following tetrad dissection of sporulated triploids, the dissec-tion plates were incubated at 30� for up to 5 days. The entirespore colony of tetrads with four viable spores was transferred asa patch to a YPD plate and grown for 1–2 more days at 30�.Glycerol stocks were then prepared using the entire patch.
Comparative Genome Hybridization (CGH) microarrays:DNA for CGH microarrays was isolated from 5 ml YPD cellcultures grown for 1–2 days at 30�. The isolation procedure wasthe same as that used for preparing DNA samples for contour-clamped homogeneous electric field (CHEF) gel analysis(Narayanan et al. 2006). DNA was isolated from the agaroseplugs using a QIAgen gel extraction kit. After the plugs weredissolved with buffer QG from the QIAgen kit, the DNA wassonicated. After sonication, DNA was isolated using thestandard QIAgen protocol. DNA from spore cultures was
538 J. St. Charles et al.

labeled with Cy5–dUTP and the control DNA was labeled withCy3–dUTP (Lemoine et al. 2005). For the analysis of DNA fromMH10-derived spore cultures, MS71 was used as the controlDNA; for JSC2-derived spore samples, we used JSC2 DNAfor the control. The experimental and control DNAs werecompetitively hybridized overnight at 65� to microarrays thatcontained both ORFs and intergenic regions from the yeastgenome (Argueso et al. 2008).
Following hybridization, the slides were scanned using aGenePix 4000B scanner and GenePix Pro 6.0 software. Datafiles were analyzed using the University of North CarolinaMicroarray Database (http://genome.unc.edu). The log2 ra-tios (hybridization values of experimental and control DNAsamples) for each element on the array were first normalizedusing the log2 median ratio for the whole data set. If theexperimental strain has a mixture of disomic and monosomicchromosomes, following this normalization, the monosomicchromosomes are expected to have an average log2 ratio of lessthan zero. Consequently, we determined the average log2 ratiofor all chromosomes with a log2 ratio less than zero and addedthis number to the average log2 ratio for each individualchromosome. If this sum was greater than 0.17, thenthe chromosome was considered disomic; if it was less than0.17, then the chromosome was considered monosomic.A log2 ratio of 0.17 represents disomy of a chromosome in12.5% of the population. The patterns of hybridization weredepicted using CGH Miner (Wang et al. 2005).
Diagnostic PCR and restriction digests: The primers listedin Table S2 were used to PCR amplify polymorphic regionsnear the centromere using genomic DNA from JSC2 spores. Bytreating the resulting fragments with various restrictionenzymes (Table S2), we could determine the source of thehomologs (S288c, YJM789, or JAY291) in each spore. Theidentity of chromosomes XIII and XIV were also diagnosed byamplification of centromeric regions that generated DNAfragments differing by 9–13 bp in size. These PCR productswere resolved on a 2% agarose gel. Right and left armidentities were also diagnosed using this method with primerslocated near the telomeres of each chromosome arm. Primersand restriction enzymes used to diagnose these distal markersare listed in Table S3. We also used PCR methods to specificallyamplify the centromere-linked JAY291 SNP on chromosome Iand the YJM789-specific polymorphism on chromosome XIII.The names and sequences of the primers used for this analysiswere DIST 1.1F (59 CCACGCCAGGGAATCATCC) and DIST1.1R (59 TGCTACAGCATCTCGGCCC) for chromosome I andDIST 13.1F (59 TTGTCCATAGCAGCAATCATACCAGCACCACC)and DIST 13.2R (59 AGAAACGCGTCTGGCTTATCTACCGC)for chromosome XIII.
Statistical analysis: The VassarStats Website for StatisticalComputation (http://faculty.vassar.edu/lowry/VassarStats.html)was used for the chi-square goodness-of-fit tests and Fisher exacttests. We used the Benjamini and Hochberg (1995) test tocontrol for the false discovery rate when 12 or more comparisonswere made.
RESULTS
Description of experimental methods: We examinedmeiotic chromosome segregation in two different typesof triploids. In the triploid MH10, all three copies of eachhomolog were identical in DNA sequence, except for avery small number of changes introduced by transforma-tion. In the triploid JSC2, the three copies of eachhomolog were derived from three different haploid yeaststrains, each of which is diverged in DNA sequence from
the other two by about 0.1%. As explained below, thissequence divergence allowed a sensitive assay for disomyin spores derived from JSC2 and also allowed detection ofmeiotic recombination events. Diploids derived from thediverged haploids had good spore viability, indicatingthat these strains do not have translocations or inversions(data not shown).
Both triploid strains were sporulated and dissected.Spore viability for both strains was about 50% (Table S4).This spore viability is considerably higher than that ob-served by Parry and Cox (1970) and Campbell et al.(1981) (15% and 17.9%, respectively) but less than thatobserved by Pomper et al. (1954) (69–83%). In addition,the distribution of the classes of tetrads (4 live:0 dead,3 live:1 dead, 2 live:2 dead, 1 live:3 dead, 0 live:4 dead)deviated significantly from that expected by a binomialexpansion (Fisher exact test, P , 0.001; Table S4). We donot know the reasons for the differences in spore via-bilities in different studies. The differences may reflecttechnical issues (for example, the length of time that asciwere treated with glusulase) or variation in the toleranceof aneuploidy in different genetic backgrounds.
About 16% of the tetrads derived from MH10 andJSC2 had four viable spores. All cells in each sporecolony were transferred as patches to rich growth solidmedium and frozen stocks were prepared. DNA wasisolated for microarray analysis by growing large inoculaderived from the frozen stocks. This protocol was de-signed to limit loss or duplication of chromosomes inthe mitotic divisions following meiosis. We examinedDNA isolated from all four spores for 10 tetrads derivedfrom MH10 and 6 tetrads derived from JSC2. The chro-mosome compositions of all of these spore cultures wereexamined by CGH microarrays; we also determined thatboth of the starting triploids were euploid. In addition,we analyzed the chromosomes in JSC2 spore cultures byexamining SNPs as described below.
Analysis of meiotic segregants of the triploid MH10:Figure 2 shows a representative example of analysis ofDNA samples from four spores of an MH10 tetrad byCGH microarrays. DNA from MH10 spores and an iso-genic haploid reference strain (MS71) were labeled withdifferent fluorescent nucleotides (Cy3 and Cy5) andcompetitively annealed to a microarray containing allyeast ORFs and intergenic regions. In the depiction ofthe microarray shown in Figure 2, each of the 16chromosomes is represented by a line. Along each lineare vertical lines whose length and position representsrelative hybridization differences between the referenceand sample genomic DNA at each element of themicroarray. Red and green represent duplications ordeletions of the experimental strain with respect tothe control strain. For example, the spore MH10-32a(Figure 2A) was disomic for chromosomes X and XIII.In many of the microarrays, chromosomes had signifi-cantly elevated hybridization signals, although thehybridization level was not twofold higher than for the
Meiosis in Triploid Yeast 539

other chromosomes. It is likely that this effect is a con-sequence of loss of the disomic chromosomes in somefraction of the subcultured cells during vegetative growth.
The spore MH10-32c had the chromosome composi-tion identical to that of MH10-32a (Figure 2A). Theother two spores, MH10-32b and MH10-32d, were bothdisomic for chromosomes I, II, IX, XI, and XIV. MH10-32d was also disomic for chromosomes III, V-VIII, XII,XV, and XVI. The nonsister pairs of spores had non-overlapping patterns of disomy, and all chromosomeswere disomic in at the least one spore except chromo-some IV, the largest chromosome. From the pattern ofchromosome segregation shown in Figure 1, one wouldexpect that two pairs of spores (the sister spores) shouldhave reciprocal patterns of disomy, and, for each ho-molog, one pair of sisters would have two copies and onepair would have one copy. Although chromosomes I, II,IX, X, XI, XIII, and XVI met this expectation, the otherchromosomes did not. It should be noted that the pairsof spores that had similar patterns of disomic chromo-somes had growth properties similar to those of sporecolonies on the dissection plates (Figure 2B).
One simple explanation of this discrepancy is that thedisomic chromosomes are frequently lost during mi-totic growth. For example, the sister spores MH10-32aand MH10-32c initially may have had two copies ofchromosomes X and XIII and one copy of all of theother chromosomes. The sister spores MH10-32b andMH10-32d had one copy of chromosomes X and XIIIand two copies of all of the other chromosomes. Thestrain MH10-32b subsequently lost many of the chro-mosomes originally present in two copies, whereasMH10-32d lost only chromosome IV. It is also possiblethat sister spores MH10-32a and MH10-32c were origi-nally disomic for chromosome IV, but the extra chro-mosome was lost in both spore cultures. One alternativeexplanation of the results is that chromosome loss is veryfrequent during meiotic segregation in triploids atmeiosis I (leading to loss of two copies) or meiosis II(leading to loss of one copy). Another possibility is thatthere is a high rate of chromosome loss in the triploidprior to meiosis. These issues are discussed in moredetail below.
We examined nine other tetrads with four viablespores derived from MH10 by CGH arrays and thesedata are summarized in Table 1. For the most part, onlymeiotic sisters were disomic for the same chromosomein any given tetrad. Most tetrads consisted of coloniesthat were of two different sizes that corresponded withmeiotic sisters as determined by disomy of the samechromosome (Table 1).
After we compiled the results of all 10 tetrads analyzedby CGH microarray, it was apparent that spores derivedfrom the triploids are subject to extensive chromosomeloss (Table 1). Assuming that there should be six chro-mosome copies of each homolog per tetrad (followingmeiotic DNA synthesis), there should be 96 chromo-
somes summed over the four spores of the tetrad. Onaverage, however, each tetrad had about 85 chromo-somes, representing a loss of about 11 chromosomesdistributed over the four spores. Chromosomes IV, VI,
Figure 1.—Expected meiotic segregation pattern of chro-mosomes of a triploid. In this figure, we show the meiotic seg-regation of two homologs in blue and in red. The three copiesof each homolog are shown as lines with long dashes, shortdashes, or an uninterrupted straight line. Following the sec-ond meiotic division, one would expect to get two disomicspores and two monosomic spores for each chromosome.In this depiction, the sister spores ‘‘a’’ and ‘‘b’’ are disomicfor the red homolog and monosomic for the blue homolog,whereas the sister spores ‘‘c’’ and ‘‘d’’ have the reciprocal pat-tern. With equal frequency, one would observe a pair of dou-bly disomic sister spores and a pair of spores that aremonosomic for both chromosomes. In this figure, we havenot shown recombination between the homologs, althoughsuch exchanges occur in most tetrads.
540 J. St. Charles et al.

and XV were lost at relatively high frequencies andchromosomes I, II, V, VIII, and XI at relatively low fre-quencies (Table 1).
Previous studies have already shown that spores de-rived from triploids have unstable karyotypes (Parry andCox 1970; Campbell et al. 1981), although directmeasurements of chromosome stability in the sporeswere not done. In addition, these studies did not de-termine whether meiotic chromosome segregation wasfundamentally accurate in a triploid (Parry and Cox
1970; Campbell et al. 1981). To investigate this issue witha more sensitive assay for aneuploidy than CGH arrays, weanalyzed sequence polymorphisms that distinguished thethree copies of each homolog in the triploid JSC2.
Analysis of meiotic chromosome segregation in atriploid ( JSC2): We generated the triploid JSC2 withequal contributions of DNA sequences from three dif-ferent sequenced backgrounds: S288c, YJM789 (Wei et al.2007), and JAY291 (Argueso et al. 2009). The details ofthe construction of the triploid are in materials and
methods. YJM789 and JAY291 have 6.1 and 5.4 singlenucleotide polymorphisms (SNPs) per kilobase, respec-tively, relative to S288c (Wei et al. 2007; Argueso et al.2009). Although the genome alignments of YJM789 toJAY291 have not been completed, in one 49-kb intervalaligned in these strains, there were about 10 SNPs/kb(Argueso et al. 2009). Using a CGH microarray, weconfirmed that JSC2 had three copies of every homologprior to sporulation.
We were able to distinguish each of the three copies ofeach homolog for all homologs in JSC2 by PCRamplification of sequences within 5 kb of the centro-meres, followed by treatment of the PCR fragment withrestriction enzymes that distinguish the amplified re-gions of each strain. For this analysis, we utilized SNPsthat altered restriction enzyme recognition sites. InFigure 3, we illustrate how the three copies of chromo-some VI were distinguished by this approach. As shownin Figure 3A, chromosome VI of S288c has a BbsI sitenear CEN6 that is not present in JAY291 or YJM789, andJAY291 has a CEN6-linked EcoRI site that is not presentin either S288c or YJM789. Using PCR with primers thatflank these heterozygous sites, we generated a DNA frag-ment of about 530 bp. By examining the sizes of thefragments produced following treatment of the 530-bpfragment with EcoRI and BbsI, we can distinguish thethree homologs individually (lanes 2–7; Figure 3B) andin pairs (lanes 8–13, Figure 3B). Table S2 lists all theprimers and restriction enzymes used to diagnose eachchromosome. We refer to this method of analysis as SPA(single-nucleotide-polymorphism PCR analysis).
We analyzed 10 JSC2 tetrads that had four viablespores by SPA, and these data are summarized in Table2. Additionally, six JSC2 tetrads were also analyzed byCGH microarrays (Table S5). Figure 4 shows a CGHanalysis of tetrad 5 of JSC2; the SPA data for this sametetrad are in the first four rows of data of Table 2. By bothmethods, it is clear that the two pairs of meiotic sister
Figure 2.—CGH microarray analysis of DNA derived from four spores of a tetrad derived from the triploid MH10. (A) Analysisof the MH10-32 tetrad by CGH microarray. DNA was isolated from individual spore cultures and labeled with Cy5-tagged nucleo-tides. DNA from the isogenic haploid strain was labeled with Cy3-tagged nucleotides. The individual samples from spore cultureswere mixed with the labeled control DNA and the mixture was hybridized to microarrays containing all ORFs and intergenicregion. Each chromosome is depicted by a horizontal line whose length is proportional to the length of the chromosome.Red indicates gene amplification relative to the reference strain. The meiotic sister pairs of spores are MH10-32a/MH10-32cand MH10-32b/MH10-32d. Extensive loss of disomic chromosomes is evident in spore MH10-32b. (B) Photograph of MH10-32 spore colonies on the tetrad dissection plate.
Meiosis in Triploid Yeast 541

spores are JSC2-1-5a and -5d, and JSC2-1-5b and -5c. Thetwo methods of analysis are completely concordant forspores JSC2-1-5b and -5c, both methods showing thatthese strains are disomic for chromosomes I, III, V, X,XII, and XIII.
The spores JSC2-1-5a and -5d are substantially differ-ent when examined by CGH and, in addition, show a
number of discrepancies when analyzed by CGH vs.SPA. By CGH, JSC2-1-5a is disomic for chromosomes I,II, VII-IX, and XIV-XVI, whereas JSC2-1-5d is onlydisomic for chromosomes II, IX, and XIV. One obviousexplanation for this discrepancy is that many of thedisomic chromosomes originally present in the JSC2-1-5d spore were rapidly lost during the mitotic divisions
TABLE 1
CGH analysis of disomy and monosomy in spores derived from the triploid MH10
Spore Colony size
Chromosomes
I II III IV V VI VII VIII IX X XI XII XIII XIV XV XVI
4a Small 1 1 1 1 1 1 1 1 1 1 1 1 1 1 1 14b Big 1 2 1 2 1 2 1 2a 1 1 1 1 1 2 1 14c Small 2 1 2 1 2 2a 2 2a 2 2 2 2 2 1 2 24d Big 1 2 1 2 1 2 1 1 1 1 1 1 1 2 1 122a Small 2 1 1 1 2 1 2 2 1 1 1 1 1 1 2 122b Big 1 2 1 1 1 1 1 1 1 1 2 1 1 2 1 122c Small 2 1 1 1 2 1 2 2 1 1 1 1 1 1 2 122d Big 1 1 1 1 1 1 1 1 1 1 1 1 1 1 1 124a Big 1 1 2 1 2 1 1 1 2 1 2 1 1 1 1 124b Big 1 1 2 1 2 1 1 1 2 1 2 1 1 1 1 124c Small 2 2 1 1 1 1 2 2 1 2 1 1 1 1 1 124d Small 2 2 1 1 1 1 1 2 1 2 1 1 1 2 1 125a Small 1 2 1 1 1 1 1 1 1 2 2 1 1 1 1 125b Big 1 1 2 1 2 1 1 1 2 1 1 2 2 2 1 225c Big 1 1 2 1 2 1 1 1 2 1 1 2 2 2 1 225d Big 2 2 1 2 2a 2 2 2 1 2 2 1 1 1 2 128a Small 1 2a 2 2 2 1 1 2 2 2 1 1 2 2 1 228b Big 2 1 1 1 1 1 2 1 1 1 2 1 1 1 1 128c Small 1 1 1 1 2 1 1 2 2 1 1 1 1 1 1 128d Big 2 2a 1 1 1 1 2 1 1 1 2 2 1 1 1 129a Average 1 2 1 1 1 2 2 2 1 2 2 2 2 2 2 229b Average 2 1 1 1 2 1 1 1 2 1 1 1 1 1 1 129c Average 2 1 1 2 2 1 1 1 2 1 1 1 1 1 1 129d Average 1 2 1 1 1 2 2 2 1 2 2 2 2 2 2 230a Big 1 1 1 1 2 1 1 2 2 1 1 1 1 1 2 230b Small 2 2 2 2 1 2 2 1 1 2 2 2 2 2 1 130c Big 1 1 1 1 2 1 1 2 2 1 1 1 1 1 2 230d Small 2 2 2 2 1 2 1 1 1 2 2 2 2 2 1 132a Small 1 1 1 1 1 1 1 1 1 2 1 1 2 1 1 132b Big 2 2 1 1 1 1 1 1 2 1 2 1 1 2 1 132c Small 1 1 1 1 1 1 1 1 1 2 1 1 2 1 1 132d Big 2 2 2 1 2 2 2 2 2 1 2 2 1 2 2 234a Small 1 1 1 1 1 1 1 1 1 1 1 2 1 1 1 134b Big 1 1 2 1 2 1 1 2 1 2 2 1 1 1 1 234c Small 2 2 1 1 1 1 1 1 1 1 1 1 1 2 1 134d Big 1 1 2 1 2 1 1 2 1 1 1 1 1 1 1 137a Average 2 1 1 1 1 2 2 1 2 1 1 2 2 2 1 237b Average 1 2 2 1 2 1 1 2 1 2 2 1 1 1 1 137c Average 1 2 2 1 1 1 1 2 1 2 2 1 1 1 1 137d Average 2 1 1 1 1 1 1 1 1 1 1 1 1 1 1 2
Averageb 5.7 5.7 5.3 4.7 5.7 4.9 5.2 5.7 5.4 5.5 5.7 5.1 5.1 5.5 4.9 5.2
Based on CGH microarrays, we determined whether the spore cultures were disomic (indicated by 2 in the table) or monosomic(indicated by 1) for each homolog. Boldface indicates a tetrad in which one sister spore was monosomic, although the other sisterwas disomic, indicating a chromosome loss event in the monosomic spore.
a In these spores, there was a possible chromosome gain. The extra chromosomes were not counted in the averages at the bot-tom of the table.
b Average number of individual homologs per tetrad.
542 J. St. Charles et al.

required to produce the cultures for the CGH analysis.In support of this explanation, when we examined DNAisolated from JSC2-1-5d by SPA, we observed disomy forchromosomes II, IV, VI–IX, XI, and XIV–XVI. Thisincreased level of disomy detected by SPA is the result oftwo factors. First, it is easier to detect disomy present in asmall fraction (less than 12.5%) by SPA than by CGHanalysis. Second, we found that some of the sporecultures had two types of cells in approximately equalamounts, one population that had one variant for aparticular homolog and one that had a different variant.An example of such a spore culture is shown in Figure 5.We performed SPA on 10 colonies derived from theJSC2-1-8d spore culture; eight had the SNP characteris-tic of the S288c-derived chromosome II, one had theSNP characteristic of the JAY2981 homolog, and onehad both types of homolog, although the S288c-derivedhomolog predominated. Thus, in this spore colony,although most of cells have only a single copy ofchromosome II, the original spore must have had twocopies.
As shown in Table 2, in most of the tetrads, most of thehomologs segregated to produce two disomic sporesand two monosomic spores. This result demonstratesthat meiotic chromosome segregation in triploids isaccurate, and most of the chromosome loss eventsdetected by CGH arrays represent mitotic chromosomeloss. Analyzing 10 MH10 tetrads with CGH arrays, wefound 107 chromosome loss events. Analyzing 10 JSC2tetrads using SPA, we found only 15 chromosome lossevents, reflecting the greater sensitivity of SPA indetecting disomy. At least some of these 15 loss events
also represent mitotic loss (as discussed further below),presumably at a very early stage in the growth of the sporecolony. Figure 6 shows a comparison of the number ofrecovered disomes for each method. A line depicts theexpected binomial distribution of disomes, assumingthat the probabilities of a chromosome being disomic ormonosomic are both equal to 0.5. The peaks for theJSC2 spores are shifted to the right relative to the MH10spores, reflecting the more sensitive nature of SPAcompared to CGH. Additionally, the line representingJSC2 spores is symmetrical around eight disomes. Sincewe examined only complete tetrads, this symmetry isexpected.
There were two other observations of interest con-cerning the JSC2 spore analysis. First, in comparing theCGH and SPA data, we found six examples of apparentchromosome duplication. For example, by CGH, thespores JSC2-1-5a, -5b, and -5c are disomic for chromo-some I. By SPA, the spores JSC2-1-5b and -5c both havethe S288c-derived and the YJM789-derived copies ofchromosome I, but the spore JSC2-1-5a has only theJAY291 homolog. We interpret this result as indicatingthat a single copy of chromosome I originally present inspore JSC2-1-5a underwent a chromosome gain, eitherby nondisjunction or by rereplication.
The last unusual class of tetrad likely reflects meioticgene conversion, the nonreciprocal transfer of informa-tion from one chromosome to the other. One exampleof conversion is JSC2-1 tetrad 8. In this tetrad, forchromosome XII, there were two chromosomes withthe centromere-linked SNP characteristic of S288c, threechromosomes with the SNP characteristic of the JAY291,
Figure 3.—Use of SNPs to determine thenumber and identity of homologous chromo-some homologs within a JSC2-derived spore.For this analysis, we designed primers thatcould be used to amplify SNP-containing re-gions located very near (within 10 kb) the cen-tromere of each of the 16 chromosomes(Table S2). By digestion of the resultingPCR products with the relevant restriction en-zyme(s), we could diagnose the source of thevarious copies of each homolog. (A) Depic-tion of the differential restriction sites presentin each strain in the amplified region of chro-mosome VI. The PCR-amplified regions ofS288c, JAY291, and YJM789 are depicted ingreen, red, and blue, respectively. Positionsof PCR primers are indicated by horizontal ar-rows, and the centromere is indicated bycircles. There is a BbsI restriction site on theS288c PCR fragment (shown as a vertical ar-row) that is not present in JAY291 orYJM789 and an EcoRI restriction site on the
JAY291 PCR fragment that is not present in the other two strains. The BbsI and EcoRI restriction sites are located at 165 and355 bp, respectively, from the left end of the PCR fragment. (B) Demonstration of how differential restriction sites can be usedto diagnose the source(s) of homologs in spore colonies. Digestion of each possible monosome and heterozygous disome withboth BbsI and EcoRI produces a unique restriction pattern shown as a schematic gel. The leftmost lane is a 100-bp DNA standardranging from 100 to 600 bp. The horizontal rows above the gel indicate which lane corresponds to which digest with plus signsindicating treatment with that enzyme.
Meiosis in Triploid Yeast 543

and only one chromosome with the SNP characteristic ofYJM789. This pattern could be explained if there was agene conversion that substituted the chromosome XIIregion on one of the YJM789-derived homologs withinformation derived from the JAY291-derived homologs.
Since the amount of DNA transferred in meiotic geneconversion is usually limited to about 1–3 kb (Petes et al.1991; Mancera et al. 2008), in the spore representing theputative conversion ( JSC2-1-8d), we examined (by SPA) aSNP located on chromosome XII on the opposite side
TABLE 2
Analysis of disomy and monosomy in spores derived from the triploid JSC2-1
Spore
Chromosomes
I II III IV V VI VII VIII IX X XI XII XIII XIV XV XVI
5a Ja J Y Y Yb Y S Y S Y J Y S J J S J Y S J Y S Y S J5b S Y S S J S S J J J S Y S Y Y S J J Y S J Y5c S Y S S J S S J J J S Y S Y Y S J J Y S J Y5d J J Y Y J Y Y S Y S Y J Y S J J S J Y S J Y S Y S J6a J J Y S S Ja J S J Y J J Y Y Y S Y S S6b S Y S Y S J J Y J Y S Y S Y J Y S S Y S S J S J J J Y J Y6c J J Y S S J J S J Y J J Y Y Y S Y S S6d S Y S Y S J J Y J Y S Y S Y J Y S S Y S S J S J J J Y J Y8a S S J J Y J Y J J S S J Y S Y J Ya S J S Y S S J8b J Y Y S S S Y S Y J Y Y S J J S Y S J Y J J Y Y8c J Y Y S S S Y S Y J Y Y S J J S Y S J Y J J Y Y8d S S J J Y J Y J J S S J Y S Y J Jc S J S Y S S J9a Y S J J S S S Y S J J S Y Y S J S J S S J S Y J Y9b S J Y S Y J Y J Y J Y S Y J S J Y Y J Y Y J S9c S J Y S Y J Y J Y J Y S Y J S J Y Y J Y Y J S9d Y S J J S S S Y Sb J S Y Y S J S J S S J S Y J Y10a J Y J Y J Y J J Y S S Y Y J S Y J S J S S J J J Y10b Jd Y Yb Jb J J Y S S Y Y J S Y J S J S Jb J Yb
10c S S S S Y S J Y J S J S Y J S Y Ya J Y Y S Y S10d S S S Yb S J Y J S J S Y J S Y Y Yb Y S Y S11a S Y Y Y J S Y S S J Y J S Y Y Y Y S Y S J Y11b J S J S J S Y J J Y Y S J S Y J S J S J S J J J Y S11c J S J S J S Y J J Y Y S J S Y J S J S J S J J J Y S11d S Y Y Y J S Y S S J Y J S Y Y Y Y S Y S J Y12a Y S J J J J S Y Y S Y S Y S S J S J S Y S Y S J12b Y S J J J J S Y Y Sa,b S Y S S J S J S Y S Y S J12c S J Y S Y S Y S Y J Sb J J J Y Y J Y S Sc J J Y12d S J Y S Y S Y S Y J S J J J J Y Y J Y S Sc J J Y13a J S J S S J S Y Y J Y S J J S J S Y S J S Y S13b S Y Y J Y Y J S J S Y S Y J Y S Y J J Y S Y J J Y13c S Y Y J Y Y J S J S Y S Y J Y S Y Ja J Y S Y J J Y13d J S J S S Je S Y Y J Y S J J S J S Y S J Yb,e S14a J Y S J S Y J S Y J J Y S J S S S Y S14b J Y S J S Y J S Y J J Y S J S S S Y S14c S Y S J Y J Y S J S Y J Y S J S Y S Y S J Y J Y J Y J J Y14d S Y S J Y J Y S J S Y J Y S J S Y S Y S J Y J Y J Y J J Y15a S Y S J S J Y J S J S J S J J J J Y J Y S Y Y J Y15b J Y Y S J S Y Y Y J Y S Y S Y S Y S S J S J S15c J Y Y S J S Y Y Y J Y S Y S Y S Y S S J S J S15d S Y S J S J Y J S J S J S J J J J Y J Y S Y Y J Y
Averagef 6 5.9 5.9 5.8 6 6 5.8 5.9 6 6 6 6 5.9 5.9 5.9 5.9
Using SPA (described in text), we determined whether spores were monosomic or disomic, and the source of each homolog (S,S288c; J, JAY291; Y, YJM789).
a Extra chromosome homolog detected by CGH microarrays. These extra chromosomes were not counted in the averages shownat the bottom of this table.
b Chromosome loss.c Putative gene conversion event.d Boldface indicates that homologs were detected using PCR and primers that exclusively amplified only one of the strain-
specific SNPs.e Translocation between chromosome IV and XV detected by CGH microarray and gel analysis.f Average number of individual homologs per tetrad.
544 J. St. Charles et al.

of the centromere located about 4 kb from the originalSNP (primers described in Table S2). As expected, thispolymorphism had the SNP characteristic of the YJM789chromosome. We also observed one tetrad ( JSC2-1-12) inwhich two chromosomes appeared to have undergonegene conversion: four copies of the S288c-associatedSNP, no copies of the YJM789-associated SNP, and twocopies of the JAY291-associated SNP. Although this tetradmay have undergone a double meiotic event (twoconversions of the YJM789 SNP to the S288c SNP), onthe basis of the rarity of the single conversion events, it ismore likely that the observed pattern reflects a mitoticgene conversion.
Mitotic chromosome loss: Our analysis of JSC2 demon-strates that most tetrads have two spores with two copiesand two spores with one copy of each homolog (Table 2).
However, in some tetrads, one or more chromosomes waslost. As discussed above, such losses have three possiblesources: (1) loss of one or more chromosomes in thetriploid prior to meiosis, (2) loss of chromosomes duringthe first or second meiotic divisions, and (3) loss of chro-mosomes during the mitotic growth of the spores. Severalarguments strongly support the third mechanism as theprinciple factor.
First, we can directly detect chromosome instabilityin some of the aneuploid spores. We examined the dis-tribution of disomic chromosomes in 10 individual col-onies derived from JSC2-1-8c. Our SPA analysis of thechromosome distribution of the original spore colonyshowed that this spore was disomic for eight chromo-
Figure 4.—Analysis of a JSC2 tetrad by CGH microarrays. DNA was isolated from spore colonies of a triploid-derived tetrad ofJSC2 and examined by the same method described in Figure 2. The meiotic sister pairs are JSC2-1-5a/JSC2-1-5d and JSC2-1-5b/JSC2-1-5c. Extensive loss of disomes from spore JSC2-1-5d is evident.
Figure 5.—Analysis of SNPs in colonies derived from a sin-gle meiotic spore culture ( JSC2-1-8d). We isolated DNA fromsingle colonies derived from individual cells of the spore cul-ture JSC2-1-8d and DNA from the original spore culture. ByCGH microarrays, this spore had one copy of chromosomeII. The region near CEN2 was amplified in all DNA samplesand treated with the restriction enzymes DraI and BbsI, andthe resulting fragments were separated by gel electrophoresis.By SPA, the spore colony was disomic for chromosome II withcopies derived from S288C and JAY291. In this figure, the DraIdigests of the PCR fragment are shown. The digest of DNAisolated from the original spore colony (third lane fromthe right) indicates that more cells in the culture have theS288c chromosome (uncut band) than the JAY291 chromo-some (cut band). This conclusion is confirmed by examiningsingle-colony isolates (labeled 1–10).
Figure 6.—Comparison of the detection of disomes inspores derived from the triploids MH10 and JSC2. The graphshows the number of disomic chromosomes per spore as afunction of the frequency of spores with that chromosomecomposition. The blue line with diamonds represents thedata from the MH10 triploid (based on CGH), and the redline with squares shows the data from the JSC2 triploid (basedon SPA). The black line with triangles is the curve predictedby the binomial expansion with the assumption that there isthe same probability (0.5) that a spore will be monosomic ordisomic.
Meiosis in Triploid Yeast 545

somes (I, V–VII, IX, XI, XII, and XV). As shown inFigure 7, none of the 10 colonies (labeled 8c-1 to 8c-10)examined retained disomy for all eight chromosomes.All disomic chromosomes, except I, XI, and XII, werelost in at least 1 of the 10 colonies. In Figure 7, we show apathway by which the chromosomes may have been lost;although other pathways could be depicted, the oneshown requires the fewest steps.
Although it is difficult to calculate a rate of chromo-some loss from this analysis, we estimated the rate of lossof chromosome V in JSC2-8c by another method. Theinitial spore isolate had two copies of chromosome V,one with the wild-type URA3 allele and one with themutant allele. Thus, the spore was initially Ura1. Sincethe URA3 gene is centromere linked, the rate of sec-tored Ura1/Ura� colonies observed when JSC2-8c colo-nies cultured on rich growth medium are replica platedto medium lacking uracil is an estimate of the rate of lossof the chromosome with the wild-type allele. Of 8200colonies examined, 223 were sectored, a rate of about0.027. This rate of loss is much higher than the rate ofchromosome V loss in a wild-type diploid (10�5; Hartwell
and Smith 1985). The frequency of chromosome losswas somewhat spore specific, and lower rates of loss wereobserved in JSC2-1-5b (3.5 3 10�3) and JSC2-1-6d (nosectored colonies observed).
Since the triploid JSC2 had one copy of chromosomeV with a wild-type URA3 gene and two copies ofchromosome V with mutant ura3 genes, we also exam-ined sectored colonies in this strain. No sectored Ura1/Ura� colonies were observed in 24,000 examined, sug-gesting a low rate of chromosome loss (,4 3 10�5). This
result is consistent with the measurement of chromo-some loss rate of 1.4 3 10�5 obtained by Mayer andAguilera (1990). Thus, mitotic loss of chromosomes inthe JSC2 triploid prior to sporulation is unlikely to be asubstantial contributor to the observed loss in the sporesderived from JSC2.
A second argument for a high rate of chromosomeloss during mitotic growth of spores of the triploid isthat we find a lower rate of chromosome loss when weexamine the spores with a method of detection that ismore sensitive (SPA vs. CGH). For two JSC2 spores, weextended our analysis using a method that was evenmore sensitive than SPA. By our initial SPA analysis,spore cultures of JSC2-1-10b and JSC2-1-12d weremonosomic for chromosome I, although their meioticsisters were disomic. By SPA, JSC2-1-10b had only the ‘‘Y’’homolog whereas the sister spore had both the Y and Jhomologs; for JSC2-1-12d, only the S form was detect-able by SPA, although the sister spore had both the Sand J homologs. To determine whether cells with the Jhomolog of chromosome I were present in very lowamounts in spore cultures of JSC2-1-10b and JSC2-1-12d,we designed a pair of primers that would specificallyamplify a centromere-linked sequence from the J ho-molog (primer sequence in materials and methods).As shown in Figure 8, by PCR, we found that the J ho-molog was present in both spore cultures. A similar assaywas used to detect missing chromosome XIII in sporesJSC2-1-9c and JSC2-1-14c (data not shown). In summary,taking into account these results, there are maximally 11meiotic chromosome loss events in JSC2 of a total of 960total chromosomes, establishing an upper limit for the
Figure 7.—Mitotic lossof disomic chromosomesfrom spore JSC2-1-8c. Thespore JSC2-1-8c was origi-nally disomic for eightchromosomes (I, V-VII,IX, XI, XII, and XV). Weexamined 10 single-colonyisolates of JSC2-1-8c (la-beled 8c-1-10) by SPA, andfound six genotypes(shown in solid-line depic-tions of yeast cells). In thisfigure, we show a pathwayof chromosome loss consis-tent with these genotypes.The silhouette of a yeastcell with dashed lines is ahypothetical intermediatethat was not detected. Thenumbers within each circleare the chromosome num-bers, and the colors indi-cate the haploid fromwhich the chromosomewas derived.
546 J. St. Charles et al.

frequency of meiotic chromosome loss events in trip-loids as 0.01.
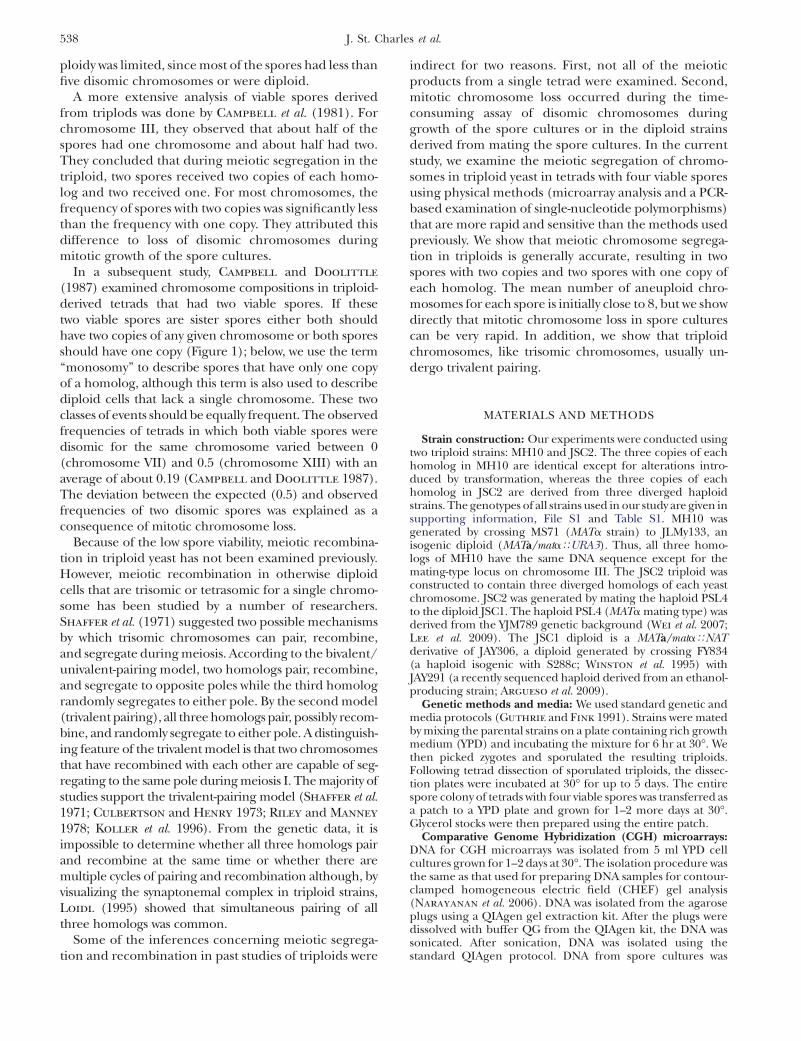
Chromosome pairing during meiosis: As discussed inthe introduction, in near-diploid strains with onetrisomic chromosome, all three copies of the trisomicchromosome recombine (Shaffer et al. 1971). Todetermine whether the three copies of each homologin triploid also engage in trivalent pairing, we examinedmeiotic recombination for four chromosomes (IV, V,IX, and XIII) using the same centromere-linked SNPs asin our previous analysis and SNPs located near (within50 kb) of the left and right telomeres of each chromo-some. Table S3 lists the primers and restriction enzymesused for the telomere-linked SNPs, and Table S6 summa-rizes the results. The evidence for trivalent pairing is thatat least one spore contains a chromosome in which therehas been a crossover between the centromere-linkedmarkers for the S, J, and Y SNPs and the telomere-linkedSNPs. One example of this analysis (for chromosome IVof JSC2-1-8) is shown in Table S6 and Figure 9. In sporeswith a single copy of chromosome IV (spores -8b and-8c), the coupling of the chromosome IV markers isunambiguous. For spores that are disomic for IV, thecoupling relationships of the markers are unclear. Forsome spores of this type, we screened multiple coloniesderived from the original spore colony to identifyderivatives that had lost one of the two disomicchromosomes. Analysis of the SNPs in these derivativesclarified the coupling relationships. In this tetrad,there is redundant information demonstrating triva-lent pairing. For example, the existence of a single copyof chromosome IV in JSC2-1-8a-2 (a colony derived fromthe -8a spore) with the centromere-linked Y marker, theleft telomere J marker, and the right telomere S marker
(Table S6) is sufficient to argue for trivalent pairing inthis meiosis.
Chromosomes IV and V had trivalent pairing in all10 tetrads. Six of 10 tetrads had trivalent pairing forchromosome IX. Four tetrads ( JSC2-1-5, -6, -12, and-13) could not be completely diagnosed because wewere unable to isolate derivatives of disomic spores thathad only copy of IX; in such spores, we could notdetermine the coupling arrangements of the markers.Chromosome XIII underwent trivalent pairing in 9 of10 tetrads, but, in 1 tetrad ( JSC2-1-5), the couplingarrangements of the markers on chromosome XIII alsocould not be determined. In summary, of 35 events inwhich we could unambiguously determine the recom-bination patterns, the chromosomes showed trivalentpairing in all cases.
DISCUSSION
In this study, we showed that meiotic segregation ofchromosomes in triploids is usually accurate with twospores receiving one copy and two spores receiving twocopies of each homolog. As expected from previousstudies, spore viability was low (about 50%) compared tothe viability of spores derived from diploids. No partic-ular combinations of two or three disomic chromosomeswere favored in the viable spores. The aneuploid strainsderived from the spores often had very high rates of mi-totic chromosome loss. In most meioses, all three copiesof each homolog pair and recombine.
Spore viability: We studied meiotic chromosomesegregation in two very different triploids. MH10 hasthree copies of a haploid set derived from MS71(Strand et al. 1995) and JSC2 is a triploid derived from
Figure 8.—PCR method of detecting verysmall amounts of JAY291-derived chromosomeI in strains with S288c- or YJM789-derivedchromosomes. Although the sister spores ofJSC2-1-10b and JSC2-1-12d were disomic forchromosome I and contained the JAY291-derivedhomolog, we could not detect this homolog us-ing SPA. Consequently, to detect very smallamounts of this homolog, we designed primersto specifically amplify DNA with this polymor-phism. (A) Primer combinations DIST1.1F/DIST1.1R amplify a region �12 kb from the cen-tromere of chromosome I. The 39-end ofDIST1.1R anneals to a 4-bp mismatch region thatis present only in the JAY291 strain. (B) 1% aga-rose gel of a PCR products generated with theDIST1.1F/DIST1.1R primer pair. GenomicDNA from JAY291 was diluted into YJM789 geno-mic DNA in 10-fold serial dilutions from 10�1 to10�6 in lanes 3–8. The same analysis is shown withJAY291 genomic DNA diluted into S288c in lanes11–16. Lanes 17 and 18 contain the products ofthe same PCR reaction with genomic DNA fromspores JSC2-1-10b and JSC2-1-12d, showing thatthese samples have the JAY291-specific sequence.
Meiosis in Triploid Yeast 547
three different haploid strains with diverged sequences:S288c, YJM789, and JAY291. Despite this difference,both triploids had similar spore viabilities which weregreater than those observed in most past triploid studies(Parry and Cox 1970; Campbell et al. 1981; Campbell
and Doolittle 1987; Loidl 1995). The similar sporeviability between our strains indicates that the 0.4–1%sequence divergence between homologs in JSC2 doesnot affect spore viability in triploids.
We examined patterns of chromosome segregation todetermine whether certain combination of disomic chro-mosomes led to spore inviability. All 120 two-chromosomedisomy combinations and all 560 three-chromosomedisomy combinations within the MH10 and/or JSC2 tet-rads were observed in viable spores (Tables 1 and Tables
2). No combination of two or three coincident disomieswere significantly overrepresented or underrepresentedin the viable spores (analysis described in File S1),consistent with previous studies (Campbell et al. 1981).
Parry and Cox (1970) observed that most triploid-derived spores were aneuploid for five chromosomes orless, with an average of 2.6 disomes per spore. Theysuggested that either triploid segregation produced twonear-haploid and two near-diploid spores or that aneu-ploid chromosomes were rapidly eliminated duringvegetative growth of the spore cultures. Our resultsdemonstrate that the second explanation is correct,although the strains in our study seem more tolerant ofhigh levels of disomy (Figure 6) than those examined byParry and Cox (1970).
Patterns of chromosome loss: Complete or partial lossof disomic chromosomes during the vegetative growth ofspore cultures was very common in our study. Two types ofobservations demonstrate a high rate of chromosomeloss. First, the loss events (chromosomes with less than sixcopies in the tetrad) were much more common when weanalyzed the spore cultures by CGH than when weanalyzed them by the more sensitive SPA procedure; forsix tetrads of JSC2, both methods were used on the sameDNA samples. Second, we directly showed that subcul-tures of some of the disomic spores had unstablekaryotypes (Figure 5 and 7).
In MH10-derived spores, we frequently observed thatone sister spore was disomic for a particular chromo-some and the other was not, suggesting a chromosomeloss event. There were 53 such loss events (indicated inboldface in Table 1). These loss events were nonran-domly distributed among the spores; 70% of the losseswere in 5 of the 40 spores. In addition, the two sisterspores often had very different loss rates. One extremeexample is the sister spores MH10-4a and MH10-4c. TheMH10-4a spore lost 11 chromosomes (becoming a eu-ploid haploid strain), whereas the MH10-4c spore didnot lose any chromosomes.
Two different statistical tests were applied to thesedata (Table S7). First, for each of the 40 spores, we de-termined whether there was a significantly elevated rateof chromosome loss compared to the expected rate ofloss per disomic chromosome for all 40 spores (0.2 lossevents/disomic chromosome). By the chi-square goodness-of-fit test, spores MH10-4a, -22d, -25a, -28b, -32b, and -37chad significantly elevated rates. Second, we used the Fisherexact test to compare chromosome loss events in pairs ofsister spores. By this test, five pairs of sister spores hadsignificantly different numbers of loss events (Table S7).Thus, multiple pairs of sister spores in MH10, whichpresumably initially had identical karyotypes and geno-types, had different rates of chromosome loss. We sug-gest two explanations of this interesting observation.One possibility is that certain spores receive a partiallydefective spindle pole body and this defect persists for anumber of generations following spore germination,
Figure 9.—Chromosome pairing and recombination dur-ing meiosis in a triploid. As discussed in the text, using SNPslocated near the centromere and telomeres, we mapped cross-overs on four chromosomes in 10 tetrads (data in Table S6).This figure shows patterns of crossovers consistent with the re-combination events detected in tetrad JSC2-1-8 on chromo-some IV. The centromeres are shown as circles and ovals atthe telomeres represent SNPs; the left and right telomeresare at the top and bottom of the chromosome. The individualspore numbers corresponding to those in Table S6 are shownat the bottom of the figure. In this tetrad, every chromatid en-gaged in at least one exchange. The pattern of exchanges isshown in this figure is not the only possible pathway for gen-erating the recombinant chromosomes at the bottom of thepicture.
548 J. St. Charles et al.

leading to an elevated rate of chromosome loss. Analternative possibility is that a stochastic loss of one ofthe disomic chromosomes from a spore results in amuch elevated rate of loss of other chromosomes.
Several more points concerning these observationsshould be made. First, in analyzing the MH10 data, wedid not consider chromosome loss events in which allfour spores were monosomic, since we could not de-termine which of the four spores had lost chromosomes.Second, the observation that certain spores have veryhigh rates of chromosome loss in MH10 was consider-ably less obvious in the JSC2 data (Table S8). Of the 24JSC2 spore cultures examined by microarrays, we de-tected 33 examples of loss in one sister but not the other(total of 160 events). Five spores had lost five or morechromosomes, whereas the other 19 spores had lost twoor fewer chromosomes. Despite this asymmetry, none ofthe spores had a significantly elevated rate of chromo-some loss compared to the average loss rate for the sixtetrads (0.21 events/disomic chromosome). Since the sisterspores of JSC2 are not isogenic (unlike those of MH10),it is possible that genotype-dependent mechanisms ofchromosome loss prevent the detection of genotype-independent mechanisms of loss.
Another important point to emphasize is that we do notknow the mechanism of chromosome loss. If the loss ofthe disomic chromosome isa consequenceofnondisjunc-tion, then we should observe trisomic derivatives at thesame frequency as monosomic derivatives. Trisomic strainswere not observed, although it is possible that suchstrains would have a severe growth disadvantage.Althoughwe found a few examples of monosomic chromosomesbecoming disomic consistent with chromosome nondis-junction events (Tables 1 and Tables 2), such events weremuch less frequent than chromosome losses.
An alternative mechanism for chromosome loss isfailure to replicate one or both of the disomic chromo-somes before cell division. Although we have no directevidence in favor of this mechanism, the pattern ofchromosome loss diagrammed in Figure 7 has severalbranch points in which symmetrical chromosome loss(consistent with a defect in chromosome replication) ispostulated. For example, we show a symmetric loss ofchromosomes VI and XV at the first branch point. Thispattern is consistent with failure to replicate VI and XVand segregation of the unreplicated homologs to thetwo daughter cells. To prove this mechanism, however,one would need to perform pedigree analysis on theaneuploid strains.
Torres et al. (2007) constructed 13 yeast strains, eachdisomic for a different yeast chromosome. All disomicstrains had proliferative defects, increased glucose uptake,and were sensitive to cycloheximide, a protein synthesisinhibitor. Strains disomic for chromosomes IV and XVwere among those with the most profound proliferativedefect, and these chromosomes were among those mostfrequently lost from the MH10 tetrads. Torres et al.
(2007) were unable to isolate a strain that was disomiconly for chromosome VI and suggested that such strainscould not be recovered because of the imbalance bet-ween levels of b-tubulin (located on chromosome VI)and a-tubulin (located on chromosome XIII). In sup-port of this suggestion, they were able to obtain strainsdisomic for both VI and XIII. Similarly, in our experi-ments, chromosome VI was frequently lost from MH10tetrads (Table 1), although we were able to recover strainsthat were disomic for VI and monosomic for XIII.
The rate of chromosome loss that we observed in thespore cultures is clearly much greater than that of wild-type diploid cells. The rate of chromosome V loss in awild-type diploid is about 10�5/cell division (Hartwell
and Smith 1985). Since many of the disomic chromo-somes were lost in less than 50 cell divisions, the lost rateis likely to be considerably greater than 10�2/division.This high loss rate probably reflects defective structuresinvolved in segregation or replication of the chromo-somes resulting from nonstochiometric amounts of theproteins required to form these structures. In addition,since most disomic yeast strains grow more slowly thanwild type (Torres et al. 2007), those strains that lose chro-mosomes have a selective advantage. In our study, twoof the haploid strains derived by sporulating MH10(MH10-4a and MH10-22d) lost all disomic chromo-somes to revert to haploidy (Table 1).
There is also evidence that chromosome segregationmay be inherently less accurate in triploids and tetra-ploids compared to diploids. Gerstein et al. (2008) ob-served that subcultured triploid and tetraploid strainsunderwent a reduction in chromosome number to dip-loidy. Since this reduction occurred quickly, they suggestedthat there was a mechanism of concerted chromosomeloss. Mayer and Aguilera (1990) showed that triploidshad chromosome loss rates elevated about 30-fold com-pared to a diploid (Mayer and Aguilera 1990; Andalis
et al. 2004). In addition, Mayer and Aguilera found thatloss of one chromosome from the triploid or tetraploidincreased the likelihood of loss of a second chromo-some. Storchova et al. (2006) showed that tetraploidshave an elevated level of monopolar kinetochore attach-ments and suggested that tetraploids had partially de-fective spindle pole bodies, spindles, and/or kinetochoresas a consequence of defective ‘‘scaling’’ of complex struc-tures in yeast cells with high ploidies.
Chromosome pairing and recombination: We firstexamined whether there was any evidence of preferentialsegregation of homologs derived from the three strainsused to construct JSC2. More specifically, using thecentromere-linked polymorphism data (Table 2), we testedeach of the sixteen homologs for whether the disomicspores had a significant excess of the chromosomesderived from any of the three possible pairs of S288c,YJM789, or JAY291. After correcting for the rate of falsediscoveries with the Benjamini and Hochberg (1995)test, no significant strain-specific selection for any
Meiosis in Triploid Yeast 549

pairing combination was observed (detailed discussionof the statistical analysis in File S1).
Although meiotic recombination in triploids has notbeen examined in any detail, several studies have shownthat all three copies of a trisomic chromosome in a near-diploid strain frequently engage in recombination in asingle meiosis (Shaffer et al. 1971; Culbertson andHenry 1973; Riley and Manney 1978; Koller et al.1996). In our study, we examined meiotic recombina-tion on chromosomes IV, V, IX, and XIII. As discussedabove, in all of the 35 events in which we could unam-biguously diagnose meiotic exchanges, all three copiesof these homologs recombined. Our results are consis-tent with the cytological studies of Loidl (1995) in whichhe observed that all three homologs in triploids wereinvolved in synaptonemal complex formation.
We thank all members of the Petes and Jinks-Robertson labs for theirdiscussions and technical help, and we thank John McCusker, JenniferMcCulley, Hengshan Zhang, Joseph Heitman, and Sue Jinks-Robertsonfor comments on the manuscript. We thank Lucas Argueso and PiotrMieczkowski for generating the microarrays, and Einat Hazkani-Covofor help with the statistical analyses. This research was supported bygrants from the National Institutes of Health (GM24110, GM52319,and 1RC1ES018091-01).
LITERATURE CITED
Andalis, A. A., Z. Storchova, C. Styles, T. Galitski, D. Pellman
et al., 2004 Defects arising from whole-genome duplication in Sac-charomyces cerevisiae. Genetics 167: 1109–1121.
Argueso, J. L., M. F. Carazzolle, P. A. Mieczkowski, F. M. Duarte, O. V.Netto et al., 2009 Genome structure of a Saccharomyces cerevisiaestrain widely used in bioethanol production. Genome Res. 19:2258–2270.
Argueso, J. L., J. Westmoreland, P. A. Mieczkowski, M. Gawel, T. D.Petes et al., 2008 Double-strand breaks associated with repeti-tive DNA can reshape the genome. Proc. Natl. Acad. Sci. USA105: 11845–11850.
Benjamini, Y., and Y. Hochberg, 1995 Controlling the false discoveryrate: a practical and powerful approach to multiple testing. J. R. Stat-ist. Soc. B 57: 289–300.
Bridges, C. B., and E. A. Anderson, 1925 Crossing over in the Xchromosome of triploid females of Drosophila melanogaster.Genetics 10: 418–441.
Campbell, D., J. S. Doctor, J. H. Feuersanger and M. M. Doolittle,1981 Differential mitotic stability of yeast disomes derived fromtriploid meiosis. Genetics 98: 239–255.
Campbell, D. A., and M. M. Doolittle, 1987 Coincident chromo-somal disomy in meiotic dyads from triploid yeast. Curr. Genet.12: 569–576.
Culbertson, M. R., and S. A. Henry, 1973 Genetic analysis of hy-brid strains trisomic for the chromosome containing a fattyacid synthetase gene complex (fas1) in yeast. Genetics 75:441–458.
Ezov, T. K., E. Boger-Nadjar, Z. Frenkel, I. Katsperovski, S. Kemeny
et al., 2006 Molecular-genetic biodiversity in a natural popula-tion of the yeast Saccharomyces cerevisiae from ‘‘Evolution Canyon’’:microsatellite polymorphism, ploidy and controversial sexualstatus. Genetics 174: 1455–1468.
Gerstein, A. C., R. M. McBride and S. P. Otto, 2008 Ploidy re-duction in Saccharomyces cerevisiae. Biol. Lett. 4: 91–94.
Guthrie, C., and G. R. Fink, 1991 Guide to Yeast Genetics and MolecularBiology. Academic Press, San Diego.
Hartwell, L. H., and D. Smith, 1985 Altered fidelity of mitoticchromosome transmission in cell cycle mutants of Saccharomycescerevisiae. Genetics 110: 381–395.
Hegarty, M. J., and S. J. Hiscock, 2008 Genomic clues to the evo-lutionary success of polyploid plants. Curr. Biol. 18: R435–R444.
Iliopoulos, D., G. Vassiliou, E. Sekerli, V. Sidiropoulou, A. Tsiga
et al., 2005 Long survival in a 69, XXX triploid infant in Greece.Genet. Mol. Res. 4: 755–759.
Koller, A., J. Heitman and M. N. Hall, 1996 Regional bivalent-univalent pairing versus trivalent pairing of a trisomic chromosomein Saccharomyces cerevisiae. Genetics 144: 957–966.
Lee, P. S., P. W. Greenwell, M. Dominska, M. Gawel, M. Hamilton
et al., 2009 A fine-structure map of spontaneous mitotic cross-overs in the yeast Saccharomyces cerevisiae. PLoS Genet. 5: e1000410.
Lemoine, F. J., N. P. Degtyareva, K. Lobachev and T. D. Petes,2005 Chromosomal translocations in yeast induced by low levelsof DNA polymerase a: a model for chromome fragile sites. Cell120: 587–598.
Loidl, J., 1995 Meiotic chromosome pairing in triploid and tetra-ploid Saccharomyces cerevisiae. Genetics 139: 1511–1520.
Mancera, E., R. Bourgon, A. Brozzi, W. Huber and L. M. Steinmetz,2008 High-resolution mapping of meiotic crossovers and non-crossovers in yeast. Nature 454: 479–485.
Mayer, V. W., and A. Aguilera, 1990 High levels of chromosomeinstability in polyploids of Saccharomyces cerevisiae. Mut. Res.231: 177–186.
Narayanan, V., P. A. Mieczkowski, H. M. Kim, T. D. Petes and K.S. Lobachev, 2006 The pattern of gene amplification is de-termined by the chromosomal location of hairpin-cappedbreaks. Cell 125: 1283–1296.
Parry, E. M., and B. S. Cox, 1970 The tolerance of aneuploidy inyeast. Genet. Res. 16: 333–340.
Petes, T. D., R. E. Malone and L. S. Symington, 1991 Re-combination in yeast, pp. 407–521 in The Molecular and CellularBiology of the Yeast Saccharomyces, edited by J. Broach, E. W. Jones
and J. R. Pringle. Cold Spring Harbor Laboratory Press, ColdSpring Harbor, NY.
Pomper, S., K. M. Daniels and D. W. McKee, 1954 Genetic analysis ofpolyploid yeast. Genetics 39: 343–355.
Riley, M. I., and T. R. Manney, 1978 Tetraploid strains of Saccharo-myces cerevisiae that are trisomic for chromosome III. Genetics 89:667–684.
Shaffer, B., I. Brearley, R. Littlewood and G. R. Fink, 1971 Astable aneuploid of Saccharomyces cerevisiae. Genetics 67: 483–495.
Stock, M., J. Ustinova, D. K. Lamatsch, M. Schartl, N. Perrin
et al., 2009 A vertebrate reproductive system involving threeploidy levels: hybrid origin of triploids in a contact zone of dip-loid and tetraploid Palearctic green toads (Bufo viridis subgroup).Evolution 64: 944–959.
Storchova, Z., A. Breneman, J. Cande, J. Dunn, K. Burbank et al.,2006 Genome-wide genetic analysis of polyploidy in yeast. Nature443: 541–547.
Strand, M., M. C. Earley, G. F. Crouse and T. D. Petes,1995 Mutations in the MSH3 gene preferentially lead to dele-tions within tracts of simple repetitive DNA in Saccharomyces cere-visiae. Proc. Natl. Acad. Sci. USA 92: 10418–10421.
Torres, E. M., T. Sokolsky, C. M. Tucker, L. Y. Chan, M. Boselli
et al., 2007 Effects of aneuploidy on cellular physiology and celldivision in haploid yeast. Science 317: 916–924.
Wang, P., Y. Kim, J. Pollack, B. Narasimhan and R. Tibshirani,2005 A method for calling gains and losses in array CGH data.Biostatistics 6: 45–58.
Wei, W., J. H. McCusker, R. W. Hyman, T. Jones, Y. Ning et al.,2007 Genome sequencing and comparative analysis of Saccharo-myces cerevisiae strain YJM789. Proc. Natl. Acad. Sci. USA 104:12825–12830.
Winston, F., C. Dollard and S. L. Ricupero-Hovasse, 1995 Con-structionof a set of convenient Saccharomyces cerevisiae strainsthat are isogenic to S288C. Yeast 11: 53–55.
Communicating editor: R. S. Hawley
550 J. St. Charles et al.

GENETICSSupporting Information
http://www.genetics.org/cgi/content/full/genetics.110.121533/DC1
Meiotic Chromosome Segregation in TriploidStrains of Saccharomyces cerevisiae
Jordan St. Charles, Monica L. Hamilton and Thomas D. Petes
Copyright � 2010 by the Genetics Society of AmericaDOI: 10.1534/genetics.110.121533
J. St. Charles et al. 2 SI
FILE S1
Supporting Materials and Methods
Statistical analysis of preferential co-segregation of two different homologues into sister spores
Following a triploid meiosis, there are only two ways to distribute the twelve copies of two different homologous
chromosomes within a single tetrad: 1) double disomes (two sister spores disomic for both chromosomes and the remaining two
sister spores monosomic for both chromosomes) or 2) mixed disomes (two sister spores disomic for one homologue and
monosomic for the other with the other sister pair receiving the reciprocal arrangement of chromosomes). If segregation of the
chromosomes into four-viable spore tetrads is random, these two events should occur at equal frequencies. Among the
MH10/JSC2 data set, for all 120 two-chromosome combinations, we found some tetrads with double-disomes (indicating no
double-disome combination is lethal). In addition, since we also recovered some tetrads with mixed disomes for all two-
chromosome combinations, there is no situation in which disomy for one type of homologue requires disomy for another type of
homologue for viability.
We calculated whether the numbers of double disomes and mixed disomes were significantly different for each two-
chromosome combination by comparing the number of tetrads in each class for each homologue with the expectation of equality
by using the chi-square “Goodness of Fit” test on the Vassar Stat Website (http://faculty.vassar.edu/lowry/VassarStats.html).
After correcting for the false-discovery rate (BENJAMINI and HOCHBERG 1995), no significant departures from equality were
observed. We point out, however, that because of the relatively small number of tetrads examined and the large number of
comparisons examined, this statistical test is not particularly sensitive.
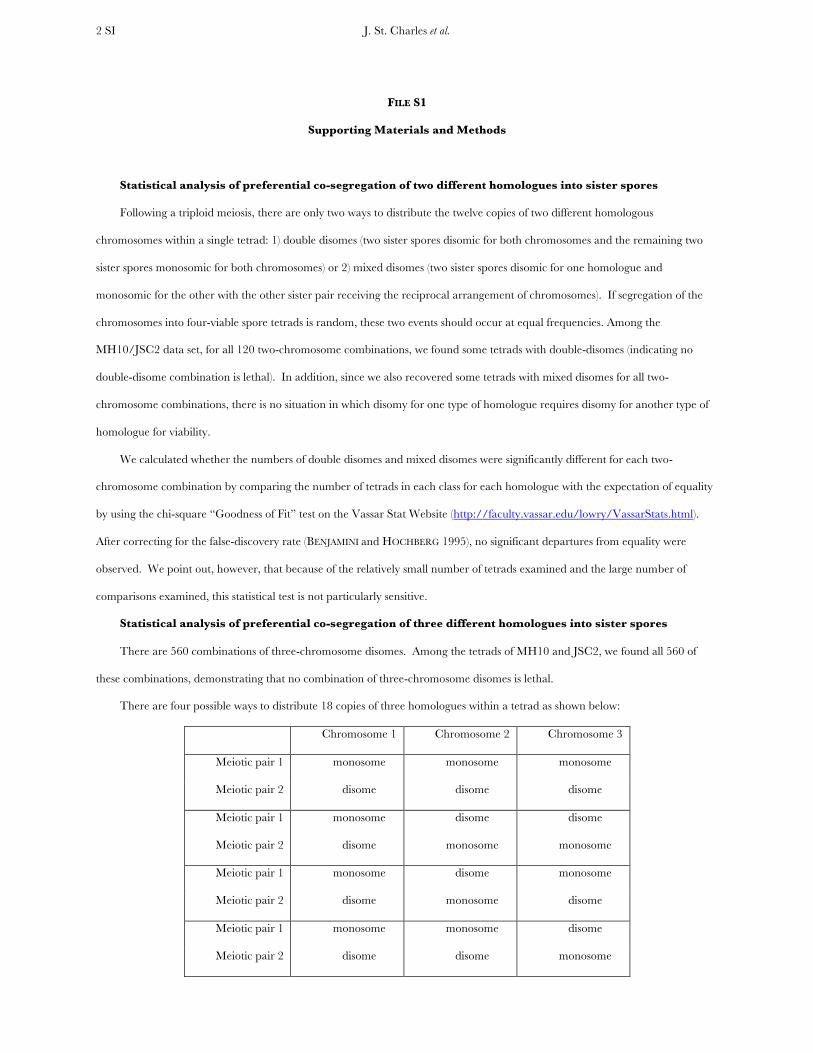
Statistical analysis of preferential co-segregation of three different homologues into sister spores
There are 560 combinations of three-chromosome disomes. Among the tetrads of MH10 and JSC2, we found all 560 of
these combinations, demonstrating that no combination of three-chromosome disomes is lethal.
There are four possible ways to distribute 18 copies of three homologues within a tetrad as shown below:
Chromosome 1 Chromosome 2 Chromosome 3
Meiotic pair 1 monosome monosome monosome
Meiotic pair 2 disome disome disome
Meiotic pair 1 monosome disome disome
Meiotic pair 2 disome monosome monosome
Meiotic pair 1 monosome disome monosome
Meiotic pair 2 disome monosome disome
Meiotic pair 1 monosome monosome disome
Meiotic pair 2 disome disome monosome
J. St. Charles et al. 3 SI
As with the two-chromosome combinations, each of these situations should occur at equal frequencies if presence of a
disome is independent of all other disomes. Because there were so many missing homologues in the MH10 experiment, we tested
this expectation with only the JSC2 data. Using the chi-square “Goodness of Fit” test and the BENJAMINI-HOCHBERG correction
as described above, we did not detect any significant deviation from random. As discussed above, because of the relatively small
numbers of tetrads examined, this test is not sensitive.
Statistical analysis of the non-random segregation of disomic chromosomes in JSC2 based on whether the
chromosomes are derived from S288c, JAY291, or YJM789
We also examined whether disomes had a non-random pattern with respect to which genetic background they were derived
from. For each spore with a disomic chromosome, there are three possible patterns: 1) one chromosome derived from S288c and
one derived from JAY291, 2) one chromosome derived from S288c and one derived from YJM789, and 3) one chromosome
derived from JAY291 and one derived from YJM789. In the absence of preferential segregation, these three patterns should be
found with equal frequencies. We examined the JSC2 tetrad data for any deviation from random pairing for all 16 chromosomes
with both the chi-square “Goodness of Fit” test and the BENJAMINI-HOCHBERG method as described above. No evidence for
preferential segregation was obtained.

J. St. Charles et al. 4 SI
REFERENCES
ARGUESO, J. L., M. F. CARAZZOLLE, P. A. MIECZKOWSKI, F. M. DUARTE, O. V. NETTO et al., 2009 Genome structure of a
Saccharomyces cerevisiae strain widely used in bioethanol production. Genome Res.
BARBERA, M. A., and T. D. PETES, 2006 Selection and analysis of spontaneous reciprocal mitotic cross-overs in Saccharomyces
cerevisiae. Proc. Natl. Acad. Sci. USA 103: 12819-12824.
BENJAMINI, Y., and Y. HOCHBERG, 1995 Controlling the false discovery rate: a practical and powerful approach to multiple
testing. J. R. Statist. Soc. B 57: 289-300.
GOLDSTEIN, A. L., and J. H. MCCUSKER, 1999 Three new dominant drug resistance cassettes for gene disruption in Saccharomyces
cerevisiae. Yeast 15: 1541-1553.
LEE, P. S., P. W. GREENWELL, M. DOMINSKA, M. GAWEL, M. HAMILTON et al., 2009 A fine-structure map of spontaneous mitotic
crossovers in the yeast Saccharomyces cerevisiae. PLoS Genet. 5: e1000410.
STRAND, M., M. C. EARLEY, G. F. CROUSE and T. D. PETES, 1995 Mutations in the MSH3 gene preferentially lead to deletions
within tracts of simple repetitive DNA in Saccharomyces cerevisiae. Proc. Natl. Acad. Sci. USA 92: 10418-10421.
WINSTON, F., C. DOLLARD and S. L. RICUPERO-HOVASSE, 1995 Construction of a set of convenient Saccharomyces cerevisiae strains
that are isogenic to S288C. Yeast 11: 53-55.
J. St. Charles et al. 5 SI
TABLE S1
Strain genotypes and constructions
Strain
name
Genotype Strain construction or reference
MS71 MATα ade-1 his7-2 leu2-3 LEU2 trp1-289 ura3-52 (STRAND et al. 1995)
JLMy100 MATa/MATα ade5-1/ade5-1 his7-2/his7-2 leu2-3/leu2-3
LEU2/LEU2 trp1-289/trp1-289 ura3-52/ura3-52 +
pSAD3-3b/MEC1
(J. MCCULLEY, Duke University)
JLMy133 MATa/matα::URA3 ade5-1/ade5-1 his7-2/his7-2 leu2-
3/leu2-3 LEU2/LEU2 trp1-289/trp1-289 ura3-52/ura3-52
Transformation of JLMy100 with PCR fragment with
matα::URA3. The template was genomic DNA from a
URA3 yeast strain and primers were Malpha2/URA3F
and Malpha1/URA3R (BARBERA and PETES 2006)
MH10 MATa/MATα/matα::URA3 ade5-1/ade5-1/ade5-1 his7-
2/his7-2/his7-2 leu2-3/leu2-3/leu2-3 trp1-289/trp1-
289/trp1-289 ura3-52/ura3-52/ura3-52
LEU2/LEU2/LEU2 CAN1/CAN1/CAN1
Cross of JLMy133 and MS71
JAY291 MATa (ARGUESO et al. 2009)
FY834 MATα ura3-52 leu-2∆1 trp1-∆63 his3-∆200 lys2-∆202
(WINSTON et al. 1995)
JAY306 MATα/MATa URA3/ura3-52 LEU2/leu2-Δ1 TRP1/trp1-
Δ63 HIS3/his3-Δ200 LYS2/lys2-Δ20
Cross between JAY291 and FY834
PSL4 MATα ade2-1 ura3 gal2 ho::hisG (LEE et al. 2009)
JSC1 matα::NAT/MATa URA3/ura3-52 LEU2/leu2-Δ1
TRP1/trp1-Δ63 HIS3/his3-Δ200
LYS2/lys2-Δ20
Transformation of JAY306 with a PCR fragment
(matα::NATR). The PCR template was pAG25
(GOLDSTEIN and MCCUSKER 1999). The primers were
MatAlpha Nat F and MatAlpha Nat R (LEE et al. 2009).
JSC2 MATa/MATα/matα::NAT URA3/ura3-52/ura3
LEU2/LEU2/leu2-Δ1 TRP1/TRP1/trp1-Δ63
HIS3/HIS3/his3-Δ200 LYS2/LYS2/lys2-Δ20
ADE2/ADE2/ade2-1 GAL2/GAL2/gal2
Cross between JSC1 and PSL4

J. St. Charles et al. 6 SI
TABLE S2
Primers and restriction enzymes used to distinguish centromeric sequences derived from strains S288c, JAY291, and YJM789a
Diagnostic restriction enzymes and fragment sizes following
digestion of PCR product
SGD coordinates for
forward primerb
Primer namec Primer sequence (5’ to 3’) Restriction Enzyme Size of PCR fragment after treatment with restriction enzyme for each strain (bp)
S288C JAY291 YJM789
149166 CEN1 PM F TCTTTCAGGATGTACCTTTGGATAGC XcmI 549 150, 399 150, 399
CEN1 PM R TACAACGGACAGCGATGGAC HpaI 256, 293 256, 293 549
239655 CEN2 PM F CCAAAATACTCCTTAATGACGAAAG BsrI 158, 324 482 158, 324
CEN2 PM R AGATCTCAGCCACCATTCCTAAC DraI 482 89, 393 89, 393
115864 CEN3 PM F TCCCAACTCCTTCGGCTAATATG BslI 143, 359 502 502
CEN3 PM R ATGCGCAGGTGAGCTGATTG PstI 502 502 131, 371
451010 CEN4 PM F GGCACATACGCCCTCAAACC BstXI 543 56, 487 543
CEN4 PM R TGGTTGGGACTCCTATATGATGG BsmI 119, 424 543 543
151849 CEN5 PM F TTGGTAAACAAAGGGCCAAGC TaqαI 447 100, 347 447
CEN5 PM R ATGTGCGGCTTTGTCAGCAG Cac8I 132, 315 132, 315 447
148329 CEN6 PM F AATTTGGGCGATGGAAGAGG BbsI 165, 367 532 532
CEN6 PM R TTCTGCTTTCCTTCCCAAACAG EcoRI 532 177, 355 532

J. St. Charles et al. 7 SI
499780 CEN7 PM F CTTTGCATGCCCGTCACTTG MwoI 341 141, 200 341
CEN7 PM R TCAGATTTGAGTTAGCCCGTTTAGAG DraIII 341 121, 220 121, 220
104245 CEN8 PM F GGAAATAAACGCGCAAATAAACC NcoI 469 178, 291 178, 291
CEN8 PM R TTTGGCAATTGAGGAGGTATGG HphI 469 190, 279 469
355523 CEN9 PM F CGGATGAATATTGCCAATGACTG DraI 173, 173 173, 173 346
CEN9 PM R CAGCTGAAGCTTGCCTCTGTATG AseI 154, 192 346 346
434671 CEN10 PM F TGCGTCTTGTTCCGAGCTAAAG NsiI 368 161, 207 161, 207
CEN10 PM R CGGATTCCGTTGCGAGTG MfeI 171, 197 368 171, 197
437899 CEN11 PM F TTTGATGGGTCAACGACAGG AclI 274 45, 229 274
CEN11 PM R CAAAGTGTTCAACCGAGCTTGC HinfI 78, 196 274 274
147404 CEN12 PM F CAGAGGAAGGCGCAATAGAAGC BcgI 30, 137,
436
604 30, 137, 436
CEN12 PM R CCGGAGGATTGTGACCCAAC PstI 75, 529 75, 529 604
152181 CEN12.2 PM Fc GGATGGATAACTCCCTGGTTGA ApoI 68, 129 68,129 196
CEN12.2 PM R TTCGAAGACCTTATTTATTCCAACA
267890 CEN13 PM F AGGGATGTGATGGCCCTTTC MfeI 363 78, 285 363
CEN13 PM R TCAACTCTAGCCAATTTATCCTGTCG

J. St. Charles et al. 8 SI
267890 CEN13 PM F AGGGATGTGATGGCCCTTTC PCRd 258 249 249
CEN13.2 PM R TTTAAAGTTCGGAACGCATACAC
628382 CEN14.1 PM F GGCTGAGTATGGCGCAATTAG BsrI 299 299 129, 170
CEN14.1 PM R TCCGATTTATTATAGGGTTGCAAAT
627401 CEN14.4 PM F TTCGTTGCTGCATCGTTGTC PCRd 151 164 164
CEN14.5 PM R AACAGTAAACAGATCTTCCTTGTCCTC
326813 CEN15.1 PM F AAGCACCCAATAAGTGCGTTATG BbvI 87, 230 317 87, 230
CEN15.1 PM R CAGCTTATCCAGCGAATGGTCTG
328652 CEN15.2 PM F AGTCTGCCTTAGCAAACTTGGAG Sau3AI 137, 173 310 310
CEN15.2 PM R TCGCTAGATGATGGGTCGAATC
555679 CEN16 PM F GATGATTATAGGCGCATTATAGAGTCG BsmAI 46, 149 46, 149 195
CEN16.2 PM R CGACAACATAACGGCTTCAACC DraI 195 81, 114 81, 114
aAs described in the text, we could diagnose strain-specific SNPs for the S288c-, JAY298-, and YJM789-derived chromosomes by PCR amplification of the chromosomal region containing the SNP, followed by restriction digests of the resulting fragments. bThe Saccharomyces Genome Database (SGD) coordinate is for the first base of the forward primer. cAs discussed in the text, this primer pair was used to characterize a meiotic gene conversion in tetrad 8 of JSC2. dFor these PCR products, we diagnosed the source of the homologue by measuring the size of the PCR product rather than by restriction enzyme digestion of the product.

J. St. Charles et al. 9 SI
TABLE S3
Primers and restriction enzymes used to distinguish telomeric sequences of chromosomes IV, V, IX, and XIII derived from strains S288c, JAY291, and
YJM789a
Restriction enzymes used for diagnosis and strains diagnosed
SGD coordinates
for forward primer
Primer
Name Primer sequence (5’ to 3’) Restriction Enzyme
Size of PCR fragment after
treatment with restriction enzyme
for each strain (bp)
S288c JAY291 YJM789
48202 LA 4.1 F TTCTGCAAACCTCATTTGAGTAGC HphI 70, 83,
134 287 287
LA 4.1 R AAACCTATGGTTTACGAAATGATCC
49577 LA 4.2 F TGATAAAGGAACCATGTGATCTTACG DdeI 169 169 69, 100
LA 4.2 R GTGCGTAGAATAACGAACATTCATAGC
1515307 RA 4 F AAAGTGGGATTCTGCCTGTGG PvuI 143, 242 385 385
RA 4 R GCGACCTGGGTTTACATTTCC BsaI 140, 245 140, 245 385
24783 LA 5 F CACTTGAGGCCACGCATACTG HindIII 402 402 120, 282
LA 5 R GCAACGTTTGGGAAGAAAACG EcoRV 136, 266 402 136, 266
560490 RA 5 F TTCTCAGCCGTACAATCATGC TaqαI 491 55, 436 491
RA 5 R AAACTCCTTCCAAAGGGTCTGG EcoRI 491 491 221, 270
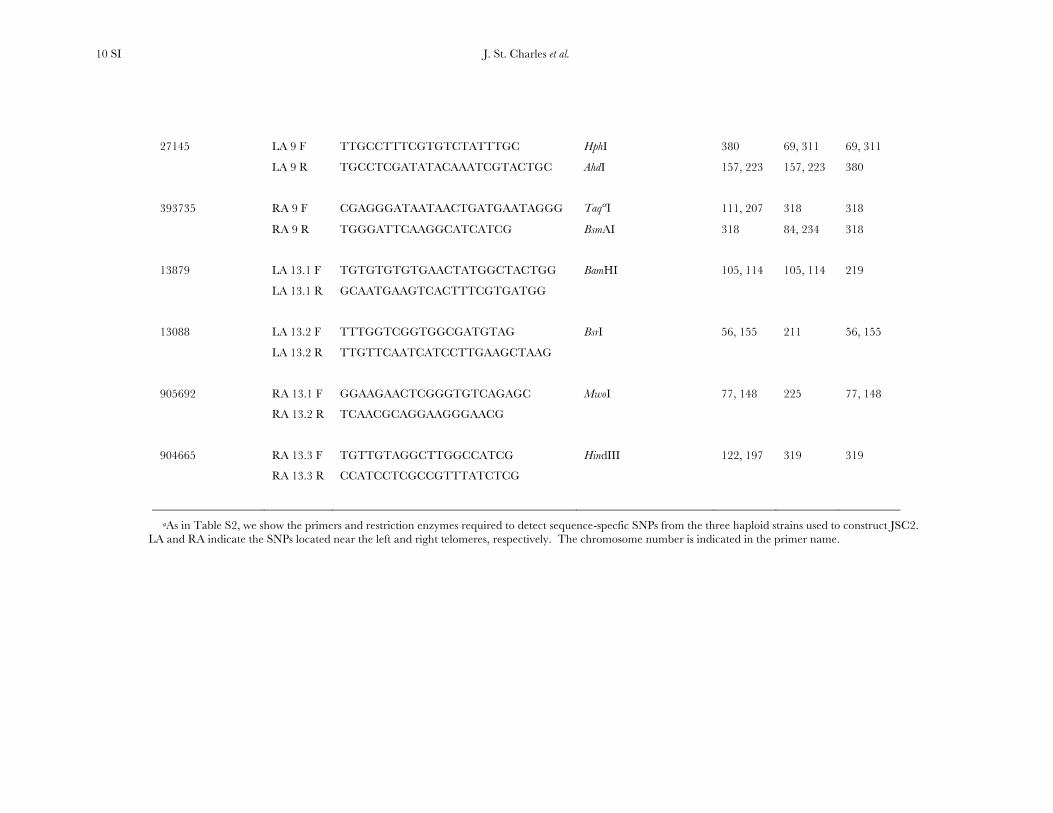
J. St. Charles et al. 10 SI
27145 LA 9 F TTGCCTTTCGTGTCTATTTGC HphI 380 69, 311 69, 311
LA 9 R TGCCTCGATATACAAATCGTACTGC AhdI 157, 223 157, 223 380
393735 RA 9 F CGAGGGATAATAACTGATGAATAGGG TaqαI 111, 207 318 318
RA 9 R TGGGATTCAAGGCATCATCG BsmAI 318 84, 234 318
13879 LA 13.1 F TGTGTGTGTGAACTATGGCTACTGG BamHI 105, 114 105, 114 219
LA 13.1 R GCAATGAAGTCACTTTCGTGATGG
13088 LA 13.2 F TTTGGTCGGTGGCGATGTAG BsrI 56, 155 211 56, 155
LA 13.2 R TTGTTCAATCATCCTTGAAGCTAAG
905692 RA 13.1 F GGAAGAACTCGGGTGTCAGAGC MwoI 77, 148 225 77, 148
RA 13.2 R TCAACGCAGGAAGGGAACG
904665 RA 13.3 F TGTTGTAGGCTTGGCCATCG HindIII 122, 197 319 319
RA 13.3 R CCATCCTCGCCGTTTATCTCG
aAs in Table S2, we show the primers and restriction enzymes required to detect sequence-specfic SNPs from the three haploid strains used to construct JSC2. LA and RA indicate the SNPs located near the left and right telomeres, respectively. The chromosome number is indicated in the primer name.

J. St. Charles et al. 11 SI
TABLE S4
Patterns of spore viability in the triploid strains JSC2 and MH10a
Strain
name
Total
tetrads
dissected
4 live:0
dead
3 live: 1
dead
2 live: 2
dead
1 live: 3
dead
0 live: 4
dead
Spore
viability
JSC2-1 77 13 22 22 12 8 0.56
JSC2-2 79 11 15 28 19 6 0.52
MH10 135 24 17 58 19 17 0.52
Totals 291 48 54 108 50 31 0.53
Observed
frequencies 0.16 0.19 0.37 0.17 0.11
Expected
frequenciesb 0.08 0.28 0.37 0.22 0.05
aTetrads of JSC2 and MH10 were dissected onto solid rich growth medium and the patterns of spore viability monitored by colony growth. JSC2-1 and JSC2-2 are isogenic and were generated by mating the same two parental strains, and picking two different zygotes. bExpected frequencies were calculated by a binomial expansion based on the observed spore viability frequency of 0.53.

J. St. Charles et al. 12 SI
TABLE S5
CGH analysis of disomy and monosomy in spores derived six tetrads of the triploid JSC2a
Chromosomes
Spore I II III IV V VI VII VIII IX X XI XII XIII XIV XV XVI
5a 2b 2 1 1 1 1 2 2 2 1 1 1 1 2 2 2
5b 2 1 2 1 2 1 1 1 1 2 1 2 2 1 1 1
5c 2 1 2 1 2 1 1 1 1 2 1 2 2 1 1 1
5d 1 2 1 1 1 1 1 1 2 1 2 1 1 2 1 1
6a 1 1 1 1 1 2b 1 1 2 1 1 1 1 1 1 1
6b 2 1 2 2 2 2 1 2 1 1 1 1 1 1 1 1
6c 1 1 1 1 1 1 1 1 2 1 2 1 1 2 1 1
6d 2 2 2 2 2 2 2 2 1 2 1 2 2 1 1 1
8a 1 2 2 2 1 1 1 2 1 1 1 2b 2 1 1 2
8b 2 1 1 1 2 2 1 1 2 1 1 2 1 1 1 1
8c 2 1 1 1 2 2 2 1 2 1 2 2 1 1 1 1
8d 1 1 1 1 1 1 1 2 1 1 1 1 1 2 1 1
10a 2 2 2 1 2 1 2 1 1 2 1 2 1 2 1 1
10b 1 1 1 1 2 1 1 1 1 2 1 2 1 1 1 1
10c 1 1 1 2 1 2 1 2 2 1 2 2b 2 1 2 1
10d 1 1 1 1 1 1 1 2 2 1 1 1 1 1 2 1

J. St. Charles et al. 13 SI
12a 1 2 1 1 1 2 1 2 2 1 2 1 1 2 2 2
12b 1 2 1 1 1 2 1 2b 2 1 2 1 1 2 2 2
12c 2 1 2 1 1 1 1 1 1 1 1 1 1 1 1 1
12d 1 1 2 1 1 1 1 1 1 1 1 1 1 1 1 1
13a 1 2 1 1 2 1 1 2 1 1 1 2 1 1 1 1
13b 2 1 2 1 1 1 1 1 2 2 2 1 2 2 1 2
13c 2 1 2 1 1 1 1 1 2 2 1 2b 2 2 1 2
13d 1 2 1 2 2 1 2 2 1 1 1 1 1 1 1 1
Ave. 5.7 5.5 5.7 4.8 5.7 5.0 4.8 5.8 6.0 5.2 5.2 5.5 5.2 5.5 4.8 5.0
aBased on CGH microarrays, we determined whether the spore cultures were disomic (indicated by 2 in the table) or monosomic (indicated by 1) for each homologue. Boldface indicates a tetrad in which one sister spore was monosomic, although the other sister was disomic, indicating a chromosome loss event in the monosomic spore. bIn these spores, there was a possible chromosome gain. The extra chromosomes were not counted in the averages at the bottom of the table.

J. St. Charles et al. 14 SI
TABLE S6
Patterns of marker exchange on chromosomes IV, V, IX, and XIII in spores derived from the triploid JSC2a
Chromosomes
IV V IX XIII
Spore LT CEN RT LT CEN RT LT CEN RT LT CEN RT
5a S Y S J Y Jb J Y S J S J S S S
5b J S J S J S J J J S Y Y J Y J Y J Y
5c S S S S Y S J S Y S Y Y J Y J Y S Y
5d J Y J Y Y Y Y Y S J Y S J S J S S J
5d-7c J J Y
6a Y S Sb S S S S J J Y S J S Y S
6b S J J Y S Y J J J Y S J S S S J Y S J S Y
6c J S Y Y S Y J Y J Y J Y S Y J
6d S Y J Y S J S Y J Y J Y Y S Y J Y S J J Y
8a S J J Y S J J J Y J Y Y S Yb S J S Y
8a-2 J Y S
8b S S J S Y S Y J Y J Y S J S J J Y J
8c Y S Y J Y S Y S J S S S J S J Y Y J
8d J Y J Y S Y S J S Y Y Y J J S J S Y
8d-1 J J Y
8d-2 Y Y S
9a S S S S S J SS S Y S Y J S S
9b S Y J Y S J Y Y J Y S Y J J J S J J Y S J
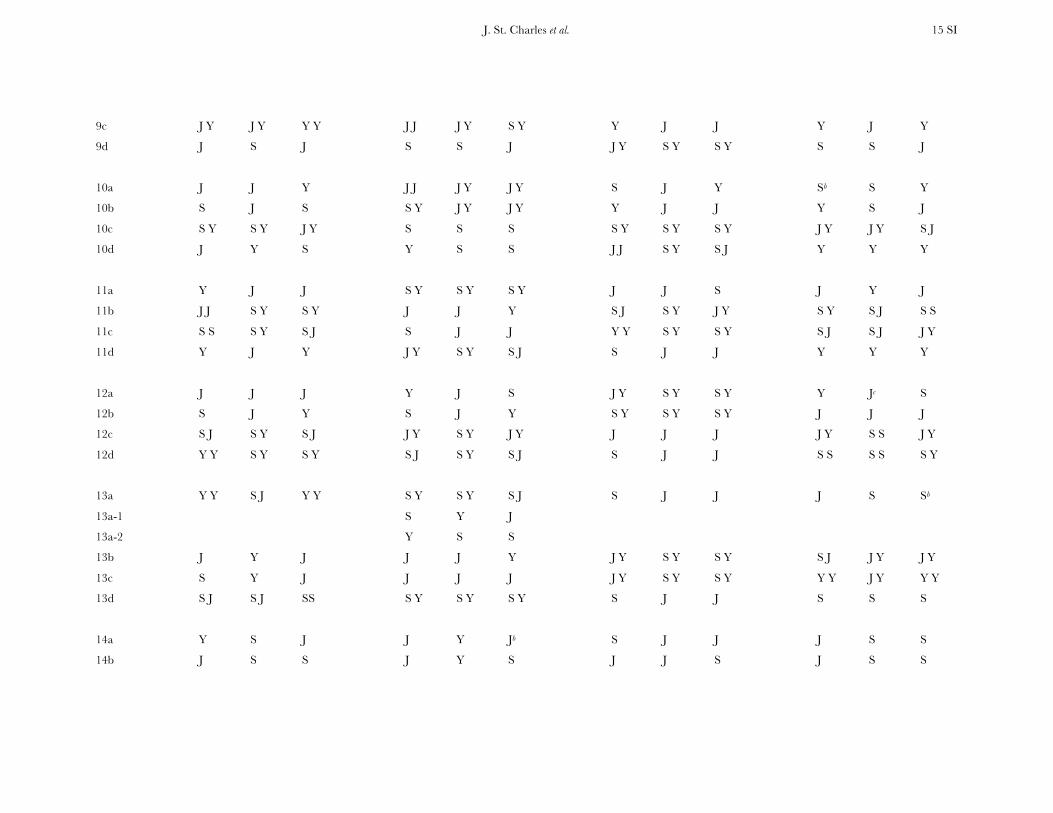
J. St. Charles et al. 15 SI
9c J Y J Y Y Y J J J Y S Y Y J J Y J Y
9d J S J S S J J Y S Y S Y S S J
10a J J Y J J J Y J Y S J Y Sb S Y
10b S J S S Y J Y J Y Y J J Y S J
10c S Y S Y J Y S S S S Y S Y S Y J Y J Y S J
10d J Y S Y S S J J S Y S J Y Y Y
11a Y J J S Y S Y S Y J J S J Y J
11b J J S Y S Y J J Y S J S Y J Y S Y S J S S
11c S S S Y S J S J J Y Y S Y S Y S J S J J Y
11d Y J Y J Y S Y S J S J J Y Y Y
12a J J J Y J S J Y S Y S Y Y Jc S
12b S J Y S J Y S Y S Y S Y J J J
12c S J S Y S J J Y S Y J Y J J J J Y S S J Y
12d Y Y S Y S Y S J S Y S J S J J S S S S S Y
13a Y Y S J Y Y S Y S Y S J S J J J S Sb
13a-1 S Y J
13a-2 Y S S
13b J Y J J J Y J Y S Y S Y S J J Y J Y
13c S Y J J J J J Y S Y S Y Y Y J Y Y Y
13d S J S J SS S Y S Y S Y S J J S S S
14a Y S J J Y Jb S J J J S S
14b J S S J Y S J J S J S S

J. St. Charles et al. 16 SI
14c J Y J Y S Y Y Y S J J Y S J S Y S Y S ?d J Y Y ?d
14d S S J Y J Y S S S J S J Y Y S Y J Y S Y J Y J Y
15a Y Y S J J J S J J S J J Y S Y
15b S J S J J Y S Y S Y S Y J Y S Y S Y Y S S
15c S J S J J Y S Y S Y J Y J Y S Y S J S S J
15c-1 J S J Y S J
15c-2 S J Y S J Y
15d Y Y S J J S S J Y J Y J Y J Y
aAs described in the text, we examined the patterns of marker segregation using SNPs located near the centromere (CEN), the left telomere (LT), and the right telomere (RT). As in other tables, chromosomes that are derived from S288c, JAY291, and YJM789 are indicated by S, J, and Y, respectively. The data from the original spore cultures are indicated by a number and a letter (for example, 15c). Strain names that contain an additional hyphen and a number are single colony isolates derived from the original spore culture (for example, 15c-1). b This superscript indicates a tetrad with a meiotic gene conversion event. For example, in tetrad 5, for the SNP at the right end of chromosome V, the Y-associated SNP was converted to a J-associated SNP. cIn this tetrad, the CEN-linked SNP for chromosome XIII underwent a double meiotic conversion or a mitotic gene conversion. dThe spore culture JSC2-1-14c had much more of the J-derived chromosome than the Y-derived chromosome; the YJM789-derived chromosome could only be detected with primers designed to specifically amplify the YJM789 SNP. Consequently, we detected only one allele for the left and right telomere SNPs JSC2-1-14c.

J. St. Charles et al. 17 SI
TABLE S7
Statistical analysis of loss of disomic chromosomes in spores derived from MH10a
Spore nameb
Initial #
disomic
chrom.c # chrom.
lostd
Freq. of
losse
Exp. # of
lost chrom.f (χ2)g p value for
χ2
p value for
sister spore
testh
4a 11 11 1.0 2.2 39 <0.0001i
4c 11 0 0 2.2 1.6 0.2 <0.0001i
4b 4 0 0 0.8 0.1 0.7
4d 4 0 0 0.8 0.1 0.7 1
22a 5 0 0 1 0.3 0.6
22c 5 0 0 1 0.3 0.6 1
22b 3 0 0 0.6 0.02 0.9
22d 3 3 1.0 0.6 7.5 0.006i 0.1
24a 4 0 0 0.8 0.1 0.7
24b 4 0 0 0.8 0.1 0.7 1
24c 6 1 0.2 1.2 0 1
24d 6 1 0.2 1.2 0 1 1
25a 9 6 0.7 1.8 9.5 0.002i
25d 9 0 0 1.8 1.2 0.3 0.009i
25b 7 0 0 1.4 0.7 0.4
25c 7 0 0 1.4 0.7 0.4 1
28a 9 0 0 1.8 1.2 0.3
28c 9 6 0.7 1.8 9.5 0.002i 0.009i
28b 4 1 0.3 0.8 0 1
28d 4 0 0 0.8 0.1 0.8 1
29a 11 0 0 2.2 1.6 0.2
29d 11 0 0 2.2 1.6 0.2 1
29b 4 1 0.3 0.8 0 1
29c 4 0 0 0.8 0.1 0.8 1
30a 5 0 0 1 0.3 0.6
30c 5 0 0 1 0.3 0.6 1
30b 11 0 0 2.2 1.6 0.2
30d 11 1 0.1 2.2 0.3 0.6 1

J. St. Charles et al. 18 SI
32a 2 0 0 0.4 0 1
32c 2 0 0 0.4 0 1 1
32b 13 8 0.6 2.6 11.5 0.0007i
32d 13 0 0 2.6 2.1 0.1 0.002i
34a 4 3 0.8 0.8 4.5 0.03
34c 4 1 0.3 0.8 0 1 0.5
34b 6 0 0 1.2 0.5 0.48
34d 6 3 0.5 1.2 1.8 0.2 0.2
37a 8 0 0 1.6 1 0.3
37d 8 6 0.8 1.6 11.9 0.0006i 0.007i
37b 6 0 0 1.2 0.5 0.5
37c 6 1 0.17 1.2 0 1 1
Total 264 53
aThis analysis is based on using CGH microarrays to examine disomy and monosomy in spores derived from the MH10 triploid. For this analysis, we count only those chromosomes that were disomic in one spore of the meiotic sister pair and monosomic in the other. This condition allows us to diagnose chromosome loss unambiguously. If a homologue is present in one copy in all spores, we are unable to determine which spores lost the chromosomes. bOne pair of sister spores is shown in boldface and the other shown without boldface. cThe total number of homologues that are present in two copies in at least one of the two sister spores. dThe number of homologues present in one copy in the spore that were present in two copies in the sister spore. eThe number of chromosomes lost divided by the initial number of disomic chromosomes. fThe expected number of chromosomes lost was calculated by multiplying the initial number of disomic chromosomes by 0.20. The value of 0.20 is the number of chromosomes lost for the whole data set (53) divided by the number of disomic chromosomes for the whole data set (264). gThe “goodness of fit” chi-square value was calculated from the observed numbers of chromosomes lost and retained, and the expected numbers of chromosomes lost and retained. hThese p values were calculated by comparing the number of lost and retained chromosomes in each member of the pair of meiotic sisters by the Fisher exact test. The boldface numbers represent the calculation for the meiotic sisters shown in boldface in the leftmost column. iSignificant difference at a p value of <0.05 after application of the BENJAMINI-HOCHBERG correction (1995).

TABLE S8
Statistical analysis of loss of disomic chromosomes in spores derived from JSC2a
Spore name
Initial #
disomic
chrom.
# chrom.
lost
Freq. of
loss
Exp. # of
lost chrom. χ2
p value for
χ2
p value for
sister spore
test
5a 8 1 0.1 1.7 0.02 0.9
5d 8 4 0.5 1.7 2.6 0.1 0.3
5b 6 0 0 1.2 0.6 0.5
5c 6 0 0 1.2 0.6 0.5 1
6a 3 2 0.7 0.6 1.6 0.2
6c 3 0 0 0.6 0.03 0.9 0.4
6b 11 5 0.5 2.3 2.7 0.1
6d 11 0 0 2.3 1.8 0.2 0.04
8a 7 1 0.1 1.4 0 1
8d 7 5 0.7 1.4 8.1 0.004 0.1
8b 7 2 0.3 1.4 0 1
8c 7 0 0 1.4 0.8 0.4 0.5
10a 8 0 0 1.7 1 0.3
10b 8 5 0.6 1.7 6.1 0.01 0.03
10c 7 0 0 1.4 0.8 0.4
10d 7 4 0.6 1.4 3.7 0.06 0.07
12a 8 0 0 1.7 1 0.3
12b 8 0 0 1.7 1 0.3 1
12c 2 0 0 0.4 0 1
12d 2 1 0.5 0.4 0.02 0.9 1
13a 5 2 0.4 1 0.3 0.6
13d 5 0 0 1 0.3 0.6 0.4
13b 8 0 0 1.7 1 0.3
13c 8 1 0.1 1.7 0.01 0.9 1
Total 160 33
aThis analysis is based on using CGH microarrays to examine disomy and monosomy in spores derived from the JSC2 triploid; to make the comparison similar to that used for MH10, we did not incorporated our SPA data. The methods and descriptions of each column are identical to those previously described for Table S7.