Molecular mechanism of recombination, post meiotic segregation
Upload
dinhnguyetCategory
view
217download
0
Meiotic chromosome segregation in triploid strains of Saccharomyces cerevisiae
Jordan St. Charles, Monica L. Hamilton, and Thomas D. Petes
Department of Molecular Genetics and Microbiology, Box 3054, Duke University
Medical Center, Durham, NC 27710
Genetics: Published Articles Ahead of Print, published on August 9, 2010 as 10.1534/genetics.110.121533

2
Running head: Meiosis in triploid yeast
Key words/phrases: triploid, meiosis, meiotic chromosome segregation, trisomic
chromosome pairing
Corresponding author:
Thomas D. Petes
Department of Molecular Genetics and Microbiology
Box 3054, Duke University Medical Center
Durham, NC 27710
Telephone: (919) 684
Fax: (919) 684-4986
Email: [email protected]

3
ABSTRACT
Meiosis in triploids results in four highly aneuploid gametes because six copies of
each homologue must be segregated into four meiotic products. Using DNA microarrays
and other physical approaches, we examined meiotic chromosome segregation in triploid
strains of Saccharomyces cerevisiae. In most tetrads with four viable spores, two of the
spores had two copies of a given homologue and two spores had only one copy.
Chromosomes segregated randomly into viable spores without preferences for generating
near haploid or near diploid spores. Using single-nucleotide polymorphisms, we showed
that, in most tetrads, all three pairs of homologues recombined. Strains derived from
some of the aneuploid spore colonies had very high frequencies of mitotic chromosome
loss, resulting in genetically diverse populations of cells.

4
INTRODUCTION
Polyploidy is very common in plants; for example, it has been estimated that the
frequency of polyploidy in angiosperms is 30-80% (HEGARTY AND HISCOCK 2008). Most
polyploidy is thought to arise by whole-genome duplication of diploids, producing
tetraploids. One mode of producing a triploid is by union of a haploid gamete produced
by a “normal” diploid with a diploid gamete produced by a tetraploid. Triploids produced
by this mechanism have been detected in animals as well as plants. For example, in a
region with both diploid and tetraploid Palearctic green toads, triploid male toads
resulting from crosses of diploid females and tetraploid males were observed (STOCK et
al. 2009). As first shown in Drosophila (BRIDGES and ANDERSON 1925), triploids can
also arise from a cross of diploid individuals in which one individual has tetraploid
germinal tissue. Although the fertility of triploid Drosophila is reduced, viable offspring
between diploids and triploids can be readily obtained (BRIDGES and ANDERSON 1925).
In humans, triploidy is responsible for 15-18% of spontaneous abortions, but only 1 in
1200 fetuses live after birth; all of the live-born individuals die within a few months
((ILIOPOULOS et al. 2005).
Triploid yeast strains have been observed in the wild (Ezov et al. 2006) and have
been generated in the lab by forced matings between haploids and diploids (POMPER et al.
1954). Since diploids of the MATa/MATα genotype do not mate, it is likely that the
forced matings selected for rare diploids that had become homozygous for MATa or
MATα as a consequence of a mitotic recombination at the mating type locus on
chromosome III. In most recent studies, triploids are generated by mating haploids to

5
diploids that have been constructed to be homozygous at the mating type locus
(CAMPBELL et al. 1981; CAMPBELL and DOOLITTLE 1987; PARRY and COX 1970).
The meiotic products derived from sporulating a triploid would be expected to be
highly aneuploid, containing chromosome numbers varying between the haploid number
of 16 and the diploid number of 32. Since even extra copies of single chromosomes often
adversely affect cellular growth rates (TORRES et al. 2007), it is unsurprising that the
viability of spores derived from triploids is lower than those derived from diploids.
There is, however, a wide range of spore viabilities reported in different labs varying
between 15-18% (CAMPBELL et al. 1981; PARRY and COX 1970) to about 75% (POMPER
et al. 1954).
The first detailed analysis of patterns of chromosome segregation in viable spores
derived from triploids was carried out by PARRY and COX (1970). In this study, the viable
spores were crossed with haploids that had multiple auxotrophic markers and the
resulting diploids were sporulated. Departures from 2:2 segregation of the auxotrophic
marker was used to diagnose aneuploidy. In this analysis, markers on 14 of the 16 yeast
chromosomes were used. Of 34 segregants examined, three had one copy of all
chromosomes tested, and two had two copies of all chromosomes tested. The other 29
segregants had between one and five disomic chromosomes with the following
distribution (number of disomic chromosomes shown in parentheses): 5 segregants (1), 4
(2), 13 (3), 2 (4), and 5 (5). PARRY and COX noted that disomes of chromosomes V, VIII,
IX, XII, and XIII were more frequently observed in the viable spores than disomes of the
other chromosomes. In addition, they suggested that the ability of the triploid-derived

6
spores to tolerate aneuploidy was limited, since the spores had less than five disomic
chromosomes or were diploid.
A similar, but more extensive, analysis of viable spores generated by sporulation of a
triploid was done by CAMPBELL and co-workers (1981). For chromosome III, they
observed that about half of the spores had one chromosome and about half had two.
They concluded that during meiotic segregation in the triploid, two spores received two
copies of each homologue and two received one. For most chromosomes, the frequency
of spores with two copies was significantly less than the frequency with one copy. They
attributed this difference to loss of disomic chromosomes during mitotic growth of the
spore cultures. Most of the spores were disomic for more than one chromosome with a
mean of about four.
In a subsequent study, CAMPBELL and DOOLITTLE (1987) examined chromosome
compositions in triploid-derived tetrads that had two viable spores. If these two viable
spores are sister spores either both should have two copies of any given chromosome or
both spores should have one copy (Fig. 1); below, we will use the term “monosomy” to
describe spores that have only one copy of a homologue, although this term is also used
in other contexts to describe diploid cells that lack a single chromosome. These two
classes of events should be equally frequent. The observed frequencies of tetrads in
which both viable spores were disomic for the same chromosome varied between 0
(chromosome VII) and 0.5 (chromosome XIII) with an average of about 0.19 (CAMPBELL
and DOOLITTLE (1987). The deviation between the expected (0.5) and observed
frequencies of two disomic spores was explained as a consequence of mitotic
chromosome loss.

7
Because of the low spore viability, meiotic recombination in triploid yeast has not
been examined previously. However, meiotic recombination in otherwise diploid cells
that are trisomic or tetrasomic for a single chromosome has been studied by a number of
researchers. SHAFFER et al. (1971) suggested two possible mechanisms by which trisomic
chromosomes can pair, recombine, and segregate during meiosis. According to the
bivalent/univalent pairing model, two homologues pair, recombine and segregate to
opposite poles while the third homologue randomly segregates to either pole. By the
second model (trivalent pairing), all three homologues pair, possibly recombine, and
randomly segregate to either pole. A distinguishing feature of the trivalent model is that
two chromosomes that have recombined with each other are capable of segregating to the
same pole during meiosis I. The majority of studies support the trivalent pairing model
(CULBERTSON and HENRY 1973; KOLLER et al. 1996; RILEY and MANNEY 1978;
SHAFFER et al. 1971). From the genetic data, it is impossible to determine whether all
three homologues pair and recombine at the same time or whether there are multiple
cycles of pairing and recombination although, by visualizing the synaptonemal complex
in triploid strains, LOIDL (1995) showed that simultaneous pairing of all three
homologues was common.
Some of the inferences concerning meiotic segregation and recombination in past
studies of triploids were indirect for two reasons. First, not all of the meiotic products
from a single tetrad were examined. Second, mitotic chromosome loss occurred during
the time-consuming assay of disomic chromosomes during growth of the spore cultures
or in the diploid strains derived from mating the spore cultures. In the current study, we
examine the meiotic segregation of chromosomes in triploid yeast in tetrads with four

8
viable spores using physical methods (microarray analysis and a PCR-based examination
of single-nucleotide polymorphisms) that are more rapid and sensitive than the methods
used previously. We show that meiotic chromosome segregation in triploids is generally
accurate, resulting in two spores with two copies and two spores with one copy of each
homologue. The mean number of aneuploid chromosomes for each spore is initially
close to 8, but we show directly that mitotic chromosome loss in spore cultures can be
very rapid. In addition, we show that triploid chromosomes, like trisomic chromosomes,
usually undergo trivalent pairing.

9
MATERIALS AND METHODS
Strain construction: Most of our experiments were conducted using two triploid
strains: MH10 and JSC2. The three copies of each homologue in MH10 are identical
except for alterations introduced by transformation, whereas the three copies of each
homologue in JSC2 are derived from three diverged haploid strains. The genotypes of all
strains used in our study are given in Table S1. MH10 was generated by crossing MS71
(MATα strain) to JLMy133, an isogenic diploid (MATa/matα::URA3). Thus, all three
homologues of MH10 have the same DNA sequence except for the mating type locus on
chromosome III. The JSC2 triploid was constructed to contain three diverged
homologues of each yeast chromosome. JSC2 was generated by mating the haploid
PSL4 to the diploid JSC1. The haploid PSL4 (MATα mating type) was derived from the
YJM789 genetic background (Lee et al. 2009; Wei et al. 2007). The JSC1 diploid is a
MATa/matα::NAT derivative of JAY306, a diploid generated by crossing FY834 (a
haploid isogenic with S288c; WINSTON et al. 1995) with JAY291 (a recently-sequenced
haploid derived from an ethanol-producing strain; ARGUESO et al. 2009).
Genetic methods and media: We used standard genetic and media protocols
(GUTHRIE and FINK 1995). Strains were mated by mixing the parental strains on a plate
containing rich growth medium (YPD), and incubating the mixture for six hours at 30°.
We then picked zygotes and sporulated the resulting triploids. Following tetrad
dissection of sporulated triploids, the dissection plates were incubated at 30° for up to
five days. The entire spore colony of tetrads with four viable spores was transferred as a
patch to a YPD plate and grown for one to two more days at 30° C. Glycerol stocks were
then prepared using the entire patch.
10
CGH (Comparative Genome Hybridization) microarrays: DNA for CGH
microarrays was isolated from 5 ml YPD cell cultures grown for one to two days at 30°.
The isolation procedure was the same as that used for preparing DNA samples for
Contour-clamped Homogeneous Electric Field (CHEF) gel analysis (NARAYANAN et al.
2006). DNA was isolated from the agarose plugs using a QIAgen gel extraction kit. After
the plugs were dissolved with buffer QG from the QIAgen kit, the DNA was sonicated.
After sonication, DNA was isolated using the standard QIAgen protocol. DNA from
spore cultures was labeled with Cy5-dUTP and the control DNA was labeled with Cy3-
dUTP (LEMOINE et al. 2005). For the analysis of DNA from MH10-derived spore
cultures, MS71 was used as the control DNA; for JSC2-derived spore samples, we used
JSC2 DNA for the control. The experimental and control DNAs were competitively
hybridized overnight at 65° to microarrays that contained both ORFs and intergenic
regions from the yeast genome (ARGUESO et al. 2008).
Following hybridization, the slides were scanned using a GenePix 4000B scanner and
GenePix Pro 6.0 software. Data files were analyzed using the University of North
Carolina Microarray Database (http://genome.unc.edu). The log2 ratios (hybridization
values of experimental and control DNA samples) for each element on the array were
first normalized using the log2 median ratio for the whole data set. If the experimental
strain has a mixture of disomic and monosomic chromosomes, following this
normalization, the monosomic chromosomes are expected to have an average log2 ratio
of less than zero. Consequently, we determined the average log2 ratio for all
chromosomes with a log2 ratio less than zero, and added this number to the average log2
ratio for each individual chromosome. If this sum was greater than 0.17, then the

11
chromosome was considered disomic; if less than 0.17, then the chromosome was
considered monosomic. A log2 ratio of 0.17 represents disomy of a chromosome in
12.5% of the population. The patterns of hybridization were depicted using CGH Miner
(http://www-stat.stanford.edu/~wp57/CGH-Miner/).
Diagnostic PCR and restriction digests: The primers listed in Table S2 were used
to PCR amplify polymorphic regions near the centromere using genomic DNA from
JSC2 spores. By treating the resulting fragments with various restriction enzymes (Table
S2), we could determine the source of the homologues (S288c, YJM789, or JAY291) in
each spore. The identity of chromosomes XIII and XIV were also diagnosed by
amplification of centromeric regions that generated DNA fragments differing by 9 to 13
base pairs in size. These PCR products were resolved on a 2% agarose gel. Right and left
arm identities were also diagnosed using this method with primers located near the
telomeres of each chromosome arm. Primers and restriction enzymes used to diagnose
these distal markers are listed in Table S3. We also used PCR methods to specifically
amplify the centromere-linked JAY291 SNP on chromosome I and the YJM789-specific
polymorphism on chromosome XIII. The names and sequences of the primers used for
this analysis were: DIST 1.1F (5’ CCACGCCAGGGAATCATCC) and DIST 1.1R (5’
TGCTACAGCATCTCGGCCC) for chromosome I and DIST 13.1F (5’
TTGTCCATAGCAGCAATCATACCAGCACCACC) and DIST 13.2R (5’
AGAAACGCGTCTGGCTTATCTACCGC) for chromosome XIII.
Statistical analysis: The VassarStats Website for Statistical Computation
(http://faculty.vassar.edu/lowry/VassarStats.html) was used for the chi-square goodness-

12
of-fit tests and Fisher exact tests. We used the BENJAMINI and HOCHBERG test (1995) to
control for the false discovery rate when 12 or more comparisons were made.
13
RESULTS
Description of experimental methods: We examined meiotic chromosome
segregation in two different types of triploids. In the triploid MH10, all three copies of
each homologue were identical in DNA sequence, except for a very small number of
changes introduced by transformation. In the triploid JSC2, the three copies of each
homologue were derived from three different haploid yeast strains, each of which is
diverged in DNA sequence from the other two by about 0.1%. As explained below, this
sequence divergence allowed a sensitive assay for disomy in spores derived from JSC2
and also allowed detection of meiotic recombination events. Diploids derived from the
diverged haploids had good spore viability, indicating that these strains do not have
translocations or inversions (data not shown).
Both triploid strains were sporulated and dissected. Spore viability for both strains
was about 50% (Table S4). This spore viability is considerably higher than that observed
by PARRY and COX (1970) and CAMPBELL et al. (1981) (15% and 17.9% respectively)
but less than that observed by POMPER et al. (1954) (69-83%). In addition, the
distribution of the classes of tetrads (4 live: 0 dead, 3 live: 1 dead, 2 live: 2 dead; 1 live: 3
dead, 0 live: 4 dead) deviated significantly from that expected by a binomial expansion
(Fisher exact test, p<0.001; Table S4).
About 16% of the tetrads derived from MH10 and JSC2 had four viable spores. All
cells in each spore colony were transferred as patches to rich growth solid medium and
frozen stocks were prepared. DNA was isolated for microarray analysis by growing large
inocula derived from the frozen stocks. This protocol was designed to limit loss or
duplication of chromosomes in the mitotic divisions following meiosis. We examined
14
DNA isolated from all four spores for ten tetrads derived from MH10 and six tetrads
derived from JSC2. The chromosome compositions of all of these spore cultures were
examined by CGH microarrays; we also determined that both of the starting triploids
were euploid. In addition, we analyzed the chromosomes in JSC2 spore cultures by
examining SNPs as described below. The data from MH10 and JSC2 will be discussed
separately.
Analysis of meiotic segregants of the triploid MH10: Fig. 2 shows a representative
example of analysis of DNA samples from four spores of an MH10 tetrad by CGH
microarrays. DNA from MH10 spores and an isogenic haploid reference strain (MS71)
were labeled with different fluorescent nucleotides (Cy3 and Cy5) and competitively
annealed to a microarray containing all yeast ORFs and intergenic regions. In the
depiction of the microarray shown in Fig. 2, each of the sixteen chromosomes is
represented by a line. Along each line, there are vertical lines whose length and position
represents relative hybridization differences between the reference and sample genomic
DNA at each element of the microarray. Red and green colors represent duplications or
deletions of the experimental strain with respect to the control strain. For example, the
spore MH10-32a (Fig. 2A) had an elevated level of hybridization of chromosomes X and
XIII relative to all other chromosomes. The normalized log2 hybridization ratio for these
chromosomes was about 0.8, equivalent to a 1.7-fold increase relative to the other
chromosomes. Thus, we considered MH10-32A to be disomic for chromosomes X and
XIII. It should be pointed out that, in many of the microarrays, chromosomes had
significantly elevated hybridization signals, although the hybridization level was not two-
fold higher than for the other chromosomes. It is possible that this effect is a consequence

15
of loss of the disomic chromosomes in some fraction of the sub-cultured cells during
vegetative growth.
The spore MH10-32c had the identical chromosome composition as MH10-32a (Fig.
2A). The other two spores, MH10-32b and MH10-32d, were both disomic for
chromosomes I, II, IX, XI, and XIV. MH10-32d was also disomic for chromosomes III,
V-VIII, XII, XV, and XVI. The non-sister pairs of spores had non-overlapping patterns of
disomy, and all chromosomes were disomic in at the least one spore except chromosome
IV, the largest chromosome. From the pattern of chromosome segregation shown in Fig.
1, one would expect that two pairs of spores (the sister spores) should have reciprocal
patterns of disomy, and, for each homologue, one pair of sisters would have two copies
and one pair would have one copy. Although chromosomes I, II, IX, X, XI, XIII, and
XVI met this expectation, the other chromosomes did not. It should be noted that the
pairs of spores that had similar patterns of disomic chromosomes had similar growth
properties as spore colonies on the dissection plates (Fig. 2B).
One simple explanation of this discrepancy is that the disomic chromosomes are
frequently lost during mitotic growth. For example, it is possible that in the spores before
mitotic growth, the sister spores MH10-32a and MH10-32c had two copies of
chromosomes X and XIII and one copy of all of the other chromosomes. The sister
spores MH10-32b and MH10-32d had one copy of chromosomes X and XIII, and two
copies of all of the other chromosomes. The strain MH10-32b subsequently lost many of
the chromosomes originally present in two copies, whereas MH10-32d lost only
chromosome IV. It is also possible that sister spores MH10-32a and MH10-32c were
originally disomic for chromosome IV, but the extra chromosome was lost in both spore

16
cultures. One alternative explanation of the results is that chromosome loss is very
frequent during meiotic segregation in triploids at meiosis I (leading to loss of two
copies) or meiosis II (leading to loss of one copy). Another possibility is that there is
high rate of chromosome loss in the triploid prior to meiosis. These issues will be
discussed in more detail below.
We examined nine other tetrads with four viable spores derived from MH10 by CGH
arrays and these data are summarized in Table 1. For the most part, only meiotic sisters
were disomic for the same chromosome in any given tetrad. Most tetrads consisted of
colonies that were of two different sizes which corresponded with meiotic sisters as
determined by disomy of the same chromosome (Table 1).
After we compiled the results of all 10 tetrads analyzed by CGH microarray, it was
apparent that spores derived from the triploids are subject to extensive chromosome loss
(Table 1). Assuming that there should be six chromosome copies of each homologue per
tetrad (following meiotic DNA synthesis), there should be 96 chromosomes summed over
the four spores of the tetrad. On average, however, each tetrad had about 85
chromosomes, representing a loss of about 11 chromosomes distributed over the four
spores. Chromosomes IV, VI, and XV were lost at relatively high frequencies and
chromosomes I, II, V, VIII, and XI at relatively low frequencies (Table 1). Below, we
will discuss the evidence that most of these chromosome loss events are post-meiotic loss
of chromosomes from spores rather than meiotic chromosome losses.
Previous studies have already shown that spores derived from triploids have unstable
karyotypes (CAMPBELL et al. 1981; PARRY and COX 1970), although direct measurements
of chromosome stability in the spores were not done. In addition, these studies did not
17
determine whether meiotic chromosome segregation was fundamentally accurate in a
triploid (CAMPBELL et al. 1981; PARRY and COX 1970). To investigate this issue with a
more sensitive assay for aneuploidy than CGH arrays, we analyzed sequence
polymorphisms that distinguished the three copies of each homologue in the triploid.
Analysis of meiotic chromosome segregation in a triploid (JSC2) in which the
three copies of each homologue have diverged DNA sequences: We generated the
triploid JSC2 with equal contributions of DNA sequences from three different sequenced
backgrounds: S288c, YJM789 (WEI et al. 2007), and JAY291 (ARGUESO et al. 2009).
The details of the construction of the triploid are in Materials and Methods. YJM789 and
JAY291 have 6.1 and 5.4 single nucleotide polymorphisms (SNPs) per kb, respectively,
relative to S288c (ARGUESO et al. 2009; WEI et al. 2007). Although the genome
alignments of YJM789 to JAY291 have not been completed, in one 49 kb interval
aligned in these strains, there were about 10 SNPs/kb (ARGUESO et al. 2009). Using a
CGH microarray, we confirmed that JSC2 had three copies of every homologue prior to
sporulation.
We were able to distinguish each of the three copies of each homologue for all
homologues in JSC2 by PCR amplification of sequences within 5 kb of the centromeres,
followed by treatment of the PCR fragment with restriction enzymes that distinguish the
amplified regions of each strain. For this analysis, we utilized SNPs that altered
restriction enzyme recognition sites. In Fig. 3, we illustrate how the three copies of
chromosome VI were distinguished by this approach. As shown in Fig. 3A, chromosome
VI of S288c has a BbsI site near CEN6 that is not present in JAY291 or YJM789, and
JAY291 has a CEN6-linked EcoRI site that is not present in either S288c or YJM789.
18
Using PCR with primers that flank these heterozygous sites, we generated a DNA
fragment of about 530 bp. By examining the sizes of the fragments produced following
treatment of the 530 bp fragment with EcoRI and BbsI, we can distinguish the three
homologues individually (lanes 2-7; Fig. 3B) and in pairs (lanes 8-13, Fig. 3B). Table S2
lists all the primers and restriction enzymes used to diagnose each chromosome. We will
refer to this method of analysis as SPA (Single-nucleotide-polymorphism PCR Analysis).
We analyzed 10 JSC2 tetrads that had four viable spores by SPA, and these data are
summarized in Table 2. Additionally, six JSC2 tetrads were also analyzed by CGH
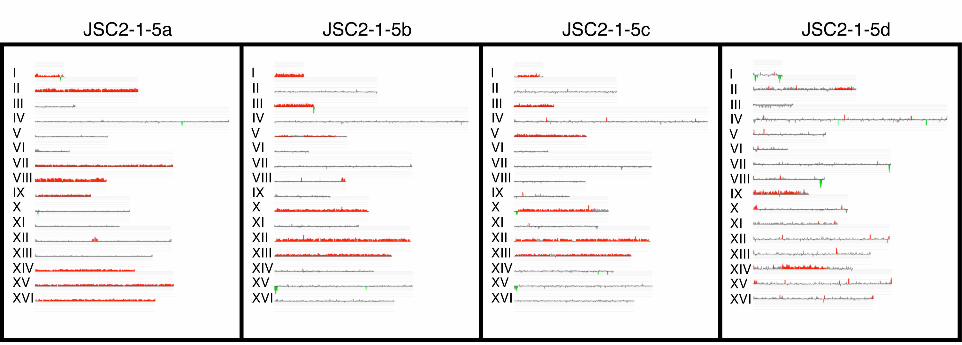
microarrays (Table S5). Fig. 4 shows a CGH analysis of tetrad 5 of JSC2; the SPA data
for this same tetrad are in the first four rows of data of Table 2. By both methods, it is
clear that the two pairs of meiotic sister spores are JSC2-1-5a and -5d, and JSC2-1-5b and
-5c. The two methods of analysis are completely concordant for spores JSC2-1-5b and -
5c, both methods showing that these strains are disomic for chromosomes I, III, V, X,
XII, and XIII.
The spores JSC2-1-5a and -5d are substantially different when examined by CGH
and, in addition, show a number of discrepancies when analyzed by CGH versus SPA.
By CGH, JSC2-1-5a is disomic for chromosomes I, II, VII-IX, and XIV-XVI, whereas
JSC2-1-5d is only disomic for chromosomes II, IX, and XIV. One obvious explanation
for this discrepancy is that many of the disomic chromosomes originally present in the
JSC2-1-5d spore were rapidly lost during the mitotic divisions required to produce the
cultures for the CGH analysis. In support of this explanation, when we examined DNA
isolated from JSC2-1-5d by SPA, we observed disomy for chromosomes II, IV, VI-IX,
XI, and XIV-XVI. This increased level of disomy detected by SPA is the result of two

19
factors. First, it is easier to detect disomy present in a small fraction (less than 25%) by
SPA than by CGH analysis. Second, we found that some of the spore cultures had two
types of cells in approximately equal amounts, one population that had one variant for a
particular homologue and one that had a different variant. An example of such a spore
culture is shown in Fig. 5. We performed SPA on 10 colonies derived from the JSC2-1-
8d spore culture; eight had the SNP characteristic of the S288c-derived chromosome II,
one had the SNP characteristic of the JAY2981 homologue, and one had both types of
homologue, although the S288c-derived homologue predominated. Thus, in this spore
colony, although most of cells have only a single copy of chromosome II, the original
spore must have had two copies.
As shown in Table 2, in most of the tetrads, most of the homologues segregated to
produce two disomic spores and two monosomic spores. This result demonstrates that
meiotic chromosome segregation in triploids is accurate, and most of the chromosome
loss events detected by CGH arrays represent mitotic chromosome loss. Analyzing ten
MH10 tetrads with CGH arrays, we found 107 chromosome loss events. Analyzing ten
JSC2 tetrads using SPA, we found only 15 chromosome loss events, reflecting the greater
sensitivity of SPA in detecting disomy. At least some of these 15 loss events also
represent mitotic loss (as discussed further below), presumably at a very early stage in the
growth of the spore colony. Fig. 6 shows a comparison of the number of recovered
disomes for each method. A line depicts the expected binomial distribution of disomes,
assuming that the probabilities of a chromosome being disomic or monosomic are both
equal to 0.5. The peaks for the JSC2 spores are shifted to the right relative to the MH10
spores, reflecting the more sensitive nature of SPA compared to CGH. Additionally, the

20
line representing JSC2 spores is symmetrical around eight disomes. Since we examined
only complete tetrads, this symmetry is expected.
There were two other observations of interest concerning the JSC2 spore analysis.
First, in comparing the CGH and SPA data, we found six examples of apparent
chromosome duplication. For example, by CGH, the spores JSC2-1-5a, -5b, and -5c are
disomic for chromosome I. By SPA, the spores JSC2-1-5b and -5c both have the S288c-
derived and the YJM789-derived copies of chromosome I, but the spore JSC2-1-5a has
only the JAY291 homologue. We interpret this result as indicating that a single copy of
chromosome I originally present in spore JSC2-1-5a underwent a chromosome gain,
either by non-disjunction or by re-replication.
The last unusual class of tetrad likely reflects meiotic gene conversion, the non-
reciprocal transfer of information from one chromosome to the other. One example of
conversion is JSC2-1 tetrad 8. In this tetrad, for chromosome XII, there were two
chromosomes with the centromere-linked SNP characteristic of S288c, three
chromosomes with the SNP characteristic of the JAY291, and only one chromosome with
the SNP characteristic of YJM789. This pattern can be explained if there was a gene
conversion that substituted the chromosome XII region on one of the YJM789-derived
homologues with information derived from the JAY291-derived homologues. Since the
amount of DNA transferred in meiotic gene conversion is usually limited to about 1-3 kb
(PETES et al. 1991; MANCERA et al. 2008), in the spore representing the putative
conversion (JSC2-1-8d), we examined (by SPA) a SNP located on chromosome XII on
the opposite side of the centromere located about 4 kb from the original SNP (primers
described in Table S2). As expected, this polymorphism had the SNP characteristic of
21
the YJM789 chromosome. We also observed one tetrad (JSC2-1-12) in which two
chromosomes appeared to have undergone gene conversion: four copies of the S288c-
associated SNP, no copies of the YJM789-associated SNP, and two copies of the
JAY291-associated SNP. Although this tetrad may have undergone a double meiotic
event (two conversions of the YJM789 SNP to the S288c SNP), based on the rarity of the
single conversion events, it is more likely that the observed pattern reflects a mitotic gene
conversion.
Patterns of chromosome segregation in viable spores of MH10 and JSC2: It is
unclear why the spore viability in our experiments was not higher since our data argue
that spores can tolerate high levels of aneuploidy. A possible explanation for spore death
is that certain combinations of disomic chromosomes are lethal. All 120 two-
chromosome disomy combinations and all 560 three-chromosome disomy combinations
within the MH10 and/or JSC2 tetrads were observed (Tables 1 and 2). No combination
of two or three coincident disomies were significantly overrepresented or
underrepresented in the viable spores (analysis described in Supporting Information); this
observation is consistent with previous studies (CAMPBELL et al. 1981). In our initial
analysis of the JSC2 tetrads, however, all ten tetrads were coincidently disomic for
chromosomes IX and XI. In examining an additional ten JSC2 tetrads, however, we
found only three additional tetrads that were coincidently disomic for IX and XI. Our
data do not exclude the possibility that certain combinations of two or three extra
chromosomes reduce the probability of spore germination/viability or that higher order
combinations of coincident disomy reduce spore viability.
22
Mitotic chromosome loss: Our analysis of JSC2 demonstrates that most tetrads have
two spores with two copies and two spores with one copy of each homologue (Table 2).
However, in some tetrads, one or more chromosomes was lost. As discussed above, such
losses have three possible sources: 1) loss of one or more chromosomes in the triploid
prior to meiosis, 2) loss of chromosomes during the first or second meiotic divisions, and
3) loss of chromosomes during the mitotic growth of the spores. Several arguments
strongly support the third mechanism as the principle factor.
First, we can directly detect chromosome instability in some of the aneuploid spores.
We examined the distribution of disomic chromosomes in ten individual colonies derived
from JSC2-1-8c. Our SPA analysis of the chromosome distribution of the original spore
colony showed that this spore was disomic for eight chromosomes (I, V-VII, IX, XI, XII,
and XV). As shown in Fig. 7, none of the ten colonies (labeled 8C-1 to 8C-10) examined
retained disomy for all eight chromosomes. All disomic chromosomes, except I, XI, and
XII, were lost in at least one of the ten colonies. In Fig. 7, we show a pathway by which
the chromosomes may have been lost; although other pathways could be depicted, the
one shown requires the fewest steps. Other features of the chromosome loss pattern
shown in Fig. 7 will be described in the Discussion.
Although it is difficult to calculate a rate of chromosome loss from this analysis, we
estimated the rate of loss of chromosome V in JSC2-8c by another method. The initial
spore isolate had two copies of chromosome V, one with the wild-type URA3 allele and
one with the mutant allele. Thus, the spore was initially Ura+. Since the URA3 gene is
centromere-linked, the rate of sectored Ura+/Ura- colonies observed when JSC2-8c
colonies cultured on rich growth medium are replica-plated to medium lacking uracil is
23
an estimate of the rate of loss of the chromosome with the wild-type allele. Of 8200
colonies examined, 223 were sectored, a rate of about 0.027. This rate of loss is much
higher than the rate of chromosome V loss in a wild-type diploid (10-5; HARTWELL and
SMITH 1985). The frequency of chromosome loss was somewhat spore-specific, and
lower rates of loss were observed in JSC2-1-5b (3.5 x 10⁻³) and JSC2-1-6d (no sectored
colonies observed). It is possible that these differences reflect the degree of chromosome
imbalance. JSC2-8c is maximally imbalanced (8 monosomes and 8 disomes), whereas
JSC2-5b is closer to a haploid strain (10 monosomes and 6 disomes) and JSC2-6d is
closer to a diploid strain (3 monosomes and 13 disomes).
Since the triploid JSC2 had one copy of chromosome V with a wild-type URA3 gene
and two copies of chromosome V with mutant ura3 genes, we also examined sectored
colonies in this strain. No sectored Ura+/Ura- colonies were observed in 24,000
examined, suggesting a low rate of chromosome loss (<4 x 10⁻⁵). This result is consistent
with the measurement of chromosome loss rate in a triploid of 1.4 x 10⁻⁵ obtained by
MAYER and AGUILERA (1990). Thus, mitotic loss of chromosomes in the JSC2 triploid
prior to sporulation is unlikely to be a substantial contributor to the observed loss in the
spores derived from JSC2. Another observation against mitotic loss in the triploid is that
in all 11 of the JSC2 tetrads in which there is loss of one chromosome, the sister spore
retained two copies of that homologue (Table 2). This pattern is inconsistent with a pre-
meiotic loss of chromosomes from the triploid or a loss of a pair of chromosomes during
meiosis I.
An additional argument for a high rate of chromosome loss during mitotic growth of
spores of the triploid is that we find a lower rate of chromosome loss when we examine

24
the spores with a method of detection that is more sensitive (SPA versus CGH). For two
JSC2 spores, we extended our analysis using a method that was even more sensitive than
SPA. By our initial analysis by SPA, spore cultures of JSC2-1-10b and JSC2-1-12d were
monosomic for chromosome I, although their meiotic sisters were disomic. By SPA,
JSC2-1-10b had only the “Y” homologue whereas the sister spore had both the Y and J
homologues; for JSC2-1-12d, only the S form was detectable by SPA, although the sister
spore had both the S and J homologues. To determine whether cells with the J
homologue of chromosome I were present in very low amounts in spore cultures of JSC2-
1-10b and JSC2-1-12d, we designed a pair of primers that would specifically amplify a
centromere-linked sequence from the J homologue (primer sequence in Materials and
Methods). As shown in Fig. 8, by PCR, we found that the J homologue was present in
both spore cultures. A similar assay was used to detect missing chromosome XIII in
spores JSC2-1-9c and JSC2-1-14c (data not shown).
In summary, in the ten tetrads derived from triploid JSC2, there was an average
chromosome loss rate of 0.007/chromosome/meiosis. This rate is a maximum since some
or all of the chromosome loss events may have occurred during early post-meiotic
divisions within the spore cultures.
Chromosome pairing during meiosis: In a study of a near-diploid strain trisomic for
chromosome III, two patterns of chromosome pairing for chromosome III were proposed
(SHAFFER and FINK 1971). In bivalent/univalent pairing, two homologues pair and
recombine, with the remaining homologue unengaged in pairing or recombination. In
trivalent pairing, all three homologues pair, at least within some regions, and recombine.
SHAFFER and FINK found that the pairing was often trivalent and similar conclusions
25
involving trisomic chromosomes were obtained in other studies (reviewed in the
Introduction). To our knowledge, this issue has not been examined previously in triploid
strains.
We examined meiotic recombination for four chromosomes (IV, V, IX, and XIII)
using the same centromere-linked SNPs as in our previous analysis and SNPs located
near (within 50 kb) of the left and right telomeres of each chromosome. Table S3 lists
the primers and restriction enzymes used for the telomere-linked SNPs, and Table S6
summarizes the results. The evidence for trivalent pairing is that at least one spore
contains a chromosome in which there has been a crossover between the centromere-
linked markers for the S, J, and Y SNPs and the telomere-linked SNPs. One example of
this analysis (for chromosome IV of JSC2-1-8) is shown in Table S6 and Fig. 9. In
spores with a single copy of chromosome IV (spores -8b and -8c), the coupling of the
chromosome IV markers is unambiguous. For spores that are disomic for IV, the
coupling relationships of the markers are unclear. For some spores of this type, we
screened multiple colonies derived from the original spore colony to identify derivatives
that had lost one of the two disomic chromosomes. Analysis of the SNPs in these
derivatives clarified the coupling relationships. In this tetrad, there is redundant
information demonstrating trivalent pairing. For example, the existence of a single copy
of chromosome IV in JSC2-1-8a-2 (a colony derived from the -8a spore) with the
centromere-linked Y marker, the left telomere J marker, and the right telomere S marker
(Table S6) is sufficient to argue for trivalent pairing in this meiosis.
Chromosomes IV and V had trivalent pairing in all ten tetrads. Six of ten tetrads had
trivalent pairing for chromosome IX. Four tetrads (JSC2-1-5, -6, -12, and -13) could not
26
be completely diagnosed because we were unable to isolate derivatives of disomic spores
that had only copy of IX; in such spores, we could not determine the coupling
arrangements of the markers. Chromosome XIII underwent trivalent pairing in nine of
ten tetrads, but, in one tetrad (JSC2-1-5), the coupling arrangements of the markers on
chromosome XIII also could not be determined. In summary, of 35 events in which we
could unambiguously determine the recombination patterns, the chromosomes showed
trivalent pairing in all cases.

27
DISCUSSION
In this study, we showed that meiotic segregation of chromosomes in triploids is
usually accurate with two spores receiving one copy and two spores receiving two copies
of each homologue. As expected from previous studies, spore viability was low (about
50%) compared to the viability of spores derived from diploids. No particular
combinations of two or three disomic chromosomes were favored in the viable spores.
The aneuploid strains derived from the spores often had very high rates of mitotic
chromosome loss. In most meioses, all three copies of each homologue pair and
recombine. Below, we compare our observations with previous studies in other labs.
Spore viability: We studied meiotic chromosome segregation in two very different
triploids. MH10 has three copies of a haploid set derived from MS71 (STRAND et al.
1995) and JSC2 is a triploid derived from three different haploid strains with diverged
sequences: S288c, YJM789, and JAY291. Despite this difference, both triploids had
similar spore viabilities which were greater than those observed in most past triploid
studies (CAMPBELL et al. 1981; CAMPBELL and DOOLITTLE 1987; LOIDL 1995; PARRY
and COX 1970). The similar spore viability between our strains indicates that the 0.4-1%
sequence divergence between homologues in JSC2 does not affect spore viability in
triploids. We do not know the reasons for the differences in spore viabilities in different
studies. The differences may reflect technical issues (for example, the length of time that
asci were treated with glusulase) or variation in the tolerance of aneuploidy in different
genetic backgrounds.
Patterns of chromosome loss: Complete or partial loss of disomic chromosomes
during the vegetative growth of spore cultures was very common in our study. The
28
pattern of chromosome loss in the MH10-derived spores was particularly interesting. In
MH10-derived spores, we frequently observed that one sister spore was disomic for a
particular chromosome and the other was not, suggesting a chromosome loss event.
There were 53 such loss events (indicated in boldface in Table 1). These loss events
were non-randomly distributed among the spores; 70% of the losses were in five of the
40 spores. In addition, the two sister spores often had very different loss rates. One
extreme example is the sister spores MH10-4a and MH10-4c. The MH10-4a spore lost
11 chromosomes (becoming a euploid haploid strain), whereas the MH10-4c spore did
not lose any chromosomes.
Two different statistical tests were applied to these data (Table S7). First, for each of
the 40 spores, we determined whether there was a significantly elevated rate of
chromosome loss compared to the expected rate of loss per disomic chromosome for all
40 spores (0.2 loss events/disomic chromosome). By the chi-square goodness-of-fit test,
spores MH10-4a, -22d, -25a, -28b, -32b, and -37c had significantly elevated rates.
Second, we used the Fisher exact test to compare chromosome loss events in pairs of
sister spores. By this test, five pairs of sister spores had significantly different numbers
of loss events (Table S7). Thus, multiple pairs of sister spores in MH10, which
presumably initially had identical karyotypes and genotypes, had different rates of
chromosome loss. We suggest two explanations of this interesting observation. One
possibility is that certain spores receive a partially defective spindle pole body and this
defect persists for a number of generations following spore germination, leading to an
elevated rate of chromosome loss. An alternative possibility is that a stochastic loss of

29
one of the disomic chromosomes from a spore results in a much elevated rate of loss of
other chromosomes.
Several more points concerning these observations should be made. First, in
analyzing the MH10 data, we did not consider chromosome loss events in which all four
spores were monosomic, since we could not determine which of the four spores had lost
chromosomes. Second, the observation that certain spores have very high rates of
chromosome loss in MH10 was considerably less obvious in the JSC2 data (Table S8).
Of the 24 JSC2 spore cultures examined by microarrays, we detected 33 examples of loss
in one sister but not the other (total of 160 events). Five spores had lost > 5
chromosomes, whereas the other 19 spores had lost < 2 chromosomes. Despite this
asymmetry, none of the spores had a significantly elevated rate of chromosome loss
compared to the average loss rate for the six tetrads (0.21 events/disomic chromosome).
Since the sister spores of JSC2 are not isogenic (unlike those of MH1), it is possible that
genotype-dependent mechanisms of chromosome loss prevent the detection of genotype-
independent mechanisms of loss.
Another important point to emphasize is that we do not know the mechanism of
chromosome loss. If the loss of the disomic chromosome is a consequence of non-
disjunction, then we should observe trisomic derivatives at the same frequency as
monosomic derivatives. Trisomic strains were not observed, although it is possible that
such strains would have a severe growth disadvantage. Although we found a few
examples of monosomic chromosomes becoming disomic consistent with chromosome
non-disjunction events (Tables 1 and 2), such events were much less frequent than
chromosome losses.

30
An alternative mechanism for chromosome loss is failure to replicate one or both of
the disomic chromosomes before cell division. Although we have no direct evidence in
favor of this mechanism, the pattern of chromosome loss diagrammed in Fig. 7 has
several branch points in which symmetrical chromosome loss (consistent with a defect in
chromosome replication) is postulated. For example, we show a symmetric loss of
chromosome VI and XV at the first branch point. This pattern is consistent with failure
to replicate VI and XV, and segregation of the unreplicated homologues to the two
daughter cells. To prove this mechanism, however, one would need to perform pedigree
analysis on the aneuploid strains.
TORRES et al. (2007) constructed thirteen yeast strains, each disomic for a different
yeast chromosome. All disomic strains had proliferative defects, increased glucose
uptake, and were sensitive to cycloheximide, a protein synthesis inhibitor. Strains
disomic for chromosome IV and XV were among those with the most profound
proliferative defect, and these chromosomes were among those most frequently lost from
the MH10 tetrads. TORRES et al. (2007) were unable to isolate a strain that was disomic
only for chromosome VI, and suggested that such strains could not be recovered because
of the imbalance between levels of beta tubulin (located on chromosome VI) and alpha
tubulin (located on chromosome XIII). In support of this suggestion, they were able to
obtain strains disomic for both VI and XIII. Similarly, in our experiments, chromosome
VI was frequently lost from MH10 tetrads (Table 1), although we were able to recover
strains that were disomic for VI and monosomic for XIII. There is no obvious pattern of
chromosome losses in MH10 based on size or other properties that we can discern. For
31
example, chromosome IV, one of the biggest chromosomes, was frequently lost, but the
largest chromosome (chromosome XII) was not.
The rate of chromosome loss that we observed in the spore cultures is clearly much
greater than that of wild-type diploid cells. The rate of chromosome V loss in a wild-type
diploid is about 10-5/cell division (HARTWELL and SMITH 1985). The loss rate in some of
the spores is 10-2-10-3/division. This high loss rate probably reflects defective structures
involved in segregation or replication of the chromosomes resulting from non-
stochiometric amounts of the proteins required to form these structures. In addition,
since most disomic yeast strains grow more slowly than wild-type (TORRES et al. 2007),
those strains that lose chromosomes have a selective advantage. In our study, two of the
haploid strains derived by sporulating MH10 (MH10-4a and MH10-22d) lost all disomic
chromosomes to revert to haploidy (Table 1).
In summary, from our results and those of others, it is likely that there are at least two
factors contributing to the very high rate of chromosome loss in the aneuploid strains.
First, in aneuploid strains, imbalance in the stochiometry of proteins important in
replication and segregation likely increases chromosome loss rates. Second, since
aneuploid cells grow more slowly than euploid cells, selection favors loss of extra
chromosomes.
Chromosome pairing and recombination: We first examined whether there was
any evidence of preferential segregation of homologues derived from the three strains
used to construct JSC2. More specifically, using the centromere-linked polymorphism
data (Table 2), we tested each of the sixteen homologues for whether the disomic spores
had a significant excess of the chromosomes derived from any of the three possible pairs

32
of S288c, YJM789 or JAY291. After correcting for the rate of false discoveries with the
BENJAMINI and HOCHBERG test (1995), no significant strain-specific selection for any
pairing combination was observed (detailed discussion of the statistical analysis in
Supporting Information).
Although meiotic recombination in triploids has not been examined in any detail,
several studies have shown that all three copies of a trisomic chromosome in a near-
diploid strain frequently engage in recombination in a single meiosis (CULBERTSON and
HENRY 1973; KOLLER et al. 1996; RILEY and MANNEY 1978; SHAFFER et al. 1971). In
our study, we used SNPs to examine meiotic recombination between the centromeres and
telomeres on chromosomes IV, V, IX, and XIII. As discussed above, in all of the 35
events in which we could unambiguously diagnose meiotic exchanges, all three copies of
these homologues recombined. Our results are consistent with the cytological studies of
LOIDL (1995). In triploid yeast cells undergoing meiosis, he observed regions in which
all three homologues were involved in synaptonemal complex formation at the same
position, as well as regions where only two homologues were complexed. In addition, he
observed partner switching of the homologues within the complex.

33
ACKNOWLEDGMENTS
We would like to thank all members of the PETES and JINKS-ROBERTSON labs for
their discussions and technical help, and we thank JOHN MCCUSKER, JENNIFER
MCCULLEY, HENGSHAN ZHANG, JOSEPH HEITMAN, and SUE JINKS-ROBERTSON for
comments on the manuscript. We thank LUCAS ARGUESO and PIOTR MIECZKOWSKI for
generating the microarrays, and EINAT HAZKANI-COVO for help with the statistical
analyses. This research was supported by grants from the National Institutes of Health
(GM24110, GM52319, and 1RC1ES018091-01).

34
FIGURE LEGENDS
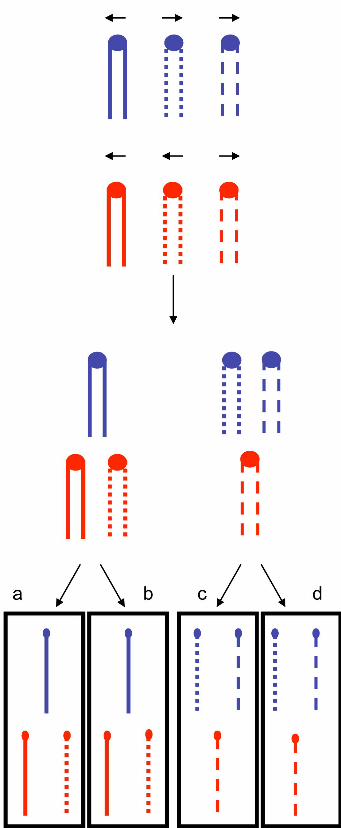
Figure 1. Expected meiotic segregation pattern of chromosomes of a triploid.
In this figure, we show the meiotic segregation of two homologues shown in blue and
in red. The three copies of each homologue are shown as lines with long dashes, short
dashes or an uninterrupted straight line. Following the second meiotic division, one
would expect to get two disomic spores and two monosomic spores for each
chromosome. In this depiction, the sister spores “a” and “b” are disomic for the red
homologue and monosomic for the blue homologue, whereas the sister spores “c” and
“d” have the reciprocal pattern. With equal frequency, one would observe a pair of
doubly disomic sister spores and a pair of spores that are monosomic for both
chromosomes. In this figure, we have not shown recombination between the
homologues, although such exchanges occur in most tetrads.
Figure 2. CGH microarray analysis of DNA derived from four spores of a tetrad
derived from the triploid MH10.
A. Analysis of the MH10-32 tetrad by CGH microarray. DNA was isolated from
individual spore cultures and labeled with Cy5-tagged nucleotides. DNA from the
isogenic haploid strain was labeled with Cy3-tagged nucleotides. The individual samples
from spore cultures were mixed with the labeled control DNA and the mixture was
hybridized to microarrays containing all ORFs and intergenic region. Each chromosome
is depicted by a horizontal line whose length is proportional to the length of the
chromosome. Red colors indicate gene amplification relative to the reference strain. The

35
meiotic sister pairs of spores are MH10-32a/MH10-32c and MH10-32b/MH10-32d.
Extensive loss of disomic chromosomes is evident in spore MH10-32b.
B. Photograph of MH10-32 spore colonies on the tetrad dissection plate.
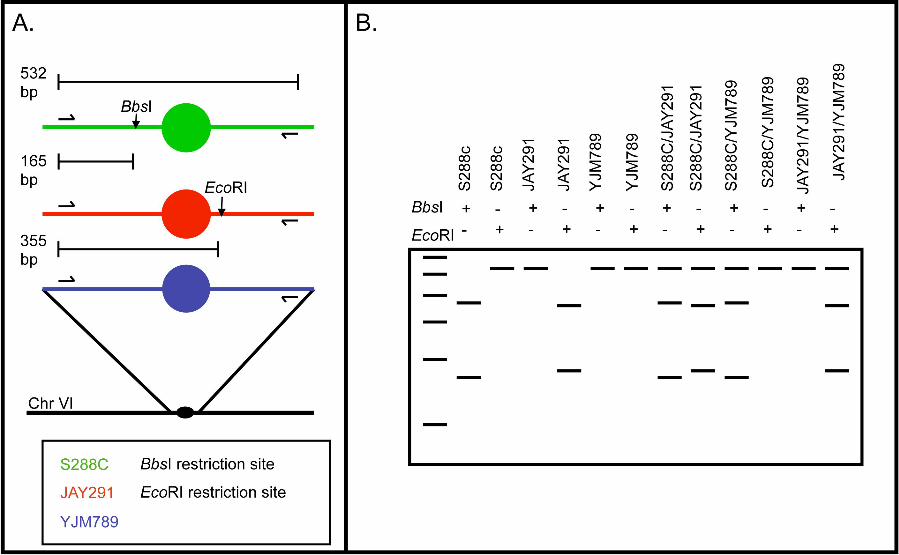
Figure 3. Use of SNPs to determine the number and identity of homologous
chromosome homologues within a JSC2-derived spore.
For this analysis, we designed primers that could be used to amplify SNP-containing
regions located very near (within 10 kb) the centromere of each of the 16 chromosomes
(Table S2). By digestion of the resulting PCR products with the relevant restriction
enzyme(s), we could diagnose the source of the various copies of each homologue.
A. Depiction of the differential restriction sites present in each strain in the amplified
region of chromosome VI. The PCR amplified regions of S288c, JAY291, and YJM789
are depicted in green, red and blue colors respectively. Positions of PCR primers are
indicated by horizontal arrows, and circles show the centromere. There is a BbsI
restriction site on the S288c PCR fragment (shown as a vertical arrow) that is not present
in JAY291 or YJM789, and an EcoRI restriction site on the JAY291 PCR fragment that
is not present in the other two strains. The BbsI and EcoRI restriction sites are located at
165 and 355 bp, respectively, from the left end of the PCR fragment.
B. Demonstration of how differential restriction sites can be used to diagnose the
source(s) of homologues in spore colonies. Digestion of each possible monosome and
heterozygous disome with both BbsI and EcoRI produces a unique restriction pattern
shown as a schematic gel. The leftmost lane is a 100 bp DNA standard ranging from 100
to 600 bp. The horizontal rows above the gel indicate which lane corresponds to which
digest with plus signs indicating treatment with that enzyme.
36
Figure 4. Analysis of a JSC2 tetrad by CGH microarrays.
DNA was isolated from spore colonies of a triploid-derived tetrad of JSC2 and
examined by the same method described in Figure 2. The meiotic sister pairs are JSC2-1-
5a/JSC2-1-5d and JSC2-1-5b/JSC2-1-5c. Extensive loss of disomes from spore JSC2-1-
5d is evident.
Figure 5. Analysis of SNPs in colonies derived from a single meiotic spore
culture (JSC2-1-8d).
We isolated DNA from single colonies derived from individual cells of the spore
culture JSC2-1-8d, and DNA from the original spore culture. By CGH microarrays, this
spore had one copy of chromosome II. The region near CEN2 was amplified in all DNA
samples, treated with the restriction enzymes DraI and BbsI, and the resulting fragments
separated by gel electrophoresis. By SPA, the spore colony was disomic for chromosome
II with copies derived from S288C and JAY291. In this figure, the DraI digests of the
PCR fragment are shown. The digest of DNA isolated from the original spore colony
(third lane from the right) indicates that more cells in the culture have the S288c
chromosome (uncut band) than the JAY291 chromosome (cut band). This conclusion is
confirmed by examining single-colony isolates (labeled 1-10).
Figure 6. Comparison of the detection of disomes in spores derived from the
triploids MH10 and JSC2.
The graph shows the number of disomic chromosomes per spore as a function of
the frequency of spores with that chromosome composition. The blue line with diamonds
represents the data from the MH10 triploid (based on CGH), and the red line with squares
shows the data from the JSC2 triploid (based on SPA). The black line with triangles is the

37
curve predicted by the binomial expansion with the assumption that there is the same
probability (0.5) that a spore will be monosomic or disomic.
Figure 7. Mitotic loss of disomic chromosomes from spore JSC2-1-8c.
The spore JSC2-1-8c was originally disomic for eight chromosomes (I, V-VII, IX,
XI, XII, and XV). We examined 10 single-colony isolates of JSC2-1-8c (labeled 8c-1-
10) by SPA, and found six genotypes (shown in solid-line depictions of yeast cells). In
this figure, we show a pathway of chromosome loss consistent with these genotypes. The
silhouette of a yeast cell with dashed lines is a hypothetical intermediate that was not
detected. The numbers within each circle are the chromosome numbers, and the colors
indicate the haploid from which the chromosome was derived.
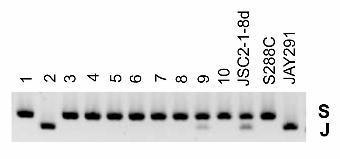
Figure 8. PCR method of detecting very small amounts of JAY291-derived
chromosome I in strains with S288c- or YJM789-derived chromosomes.
Although the sister spores of JSC2-1-10b and JSC2-1-12d were disomic for
chromosome I and contained the JAY291-derived homologue, we could not detect this
homologue using SPA. Consequently, to detect very small amounts of this homologue,
we designed primers to specifically amplify DNA with this polymorphism.
A. Primer combinations DIST1.1F/DIST1.1R amplify a region about 12 kb from the
centromere of chromosome I. The 3’ end of DIST1.1R anneals to a four bp mismatch
region that is only present in the JAY291 strain.
B. 1% agarose gel of a PCR products generated with the DIST1.1F/DIST1.1R
primer pair. Genomic DNA from JAY291 was diluted into YJM789 genomic DNA in 10-
fold serial dilutions from 10-1 to 10-6 in lanes 3 through 8. The same analysis is shown
with JAY291 genomic DNA diluted into S288c in lanes 11 through 16. Lanes 17 and 18
38
contain the products of the same PCR reaction with genomic DNA from spores JSC2-1-
10b and JSC2-1-12d, showing that these samples have the JAY291-specific sequence.
Figure 9. Chromosome pairing and recombination during meiosis in a
triploid.
As discussed in the text, using SNPs located near the centromere and telomeres,
we mapped crossovers on four chromosomes in ten tetrads (data in Table S6). This figure
shows patterns of crossovers consistent with the recombination events detected in tetrad
JSC2-1-8 on chromosome IV. The centromeres are shown as circles and ovals at the
telomeres represent SNPs; the left and right telomeres are at the top and bottom of the
chromosome. The individual spore numbers corresponding to those in Table S6 are
shown at the bottom of the figure. In this tetrad, every chromatid engaged in at least one
exchange. The pattern of exchanges is shown in this figure is not the only possible
pathway for generating the recombinant chromosomes at the bottom of the picture.

39
REFERENCES
ARGUESO, J. L., M. F. CARAZZOLLE, P. A. MIECZKOWSKI, F. M. DUARTE, O. V. NETTO et
al., 2009 Genome structure of a Saccharomyces cerevisiae strain widely used in
bioethanol production. Genome Res. 19: 2258-2270.
ARGUESO, J. L., J. WESTMORELAND, P. A. MIECZKOWSKI, M. GAWEL, T. D. PETES et al.,
2008 Double-strand breaks associated with repetitive DNA can reshape the
genome. Proc. Natl. Acad. Sci. USA 105: 11845-11850.
BENJAMINI, Y., and Y. HOCHBERG, 1995 Controlling the false discovery rate: a practical
and powerful approach to multiple testing. J. R. Statist. Soc. B 57: 289-300.
BRIDGES, C. B., and E. A. ANDERSON, 1925 Crossing over in the X chromosome of
triploid females of Drosophila melanogaster. Genetics 10: 418-441.
CAMPBELL, D., J. S. DOCTOR, J. H. FEUERSANGER and M. M. DOOLITTLE, 1981
Differential mitotic stability of yeast disomes derived from triploid meiosis.
Genetics 98: 239-255.
CAMPBELL, D. A., and M. M. DOOLITTLE, 1987 Coincident chromosomal disomy in
meiotic dyads from triploid yeast. Curr Genet 12: 569-576.
CULBERTSON, M. R., and S. A. HENRY, 1973 Genetic analysis of hybrid strains trisomic
for the chromosome containing a fatty acid synthetase gene complex (fas1) in
yeast. Genetics 75: 441-458.
EZOV, T. K., E. BOGER-NADJAR, Z. FRENKEL, I. KATSPEROVSKI, S. KEMENY et al., 2006
Molecular-genetic biodiversity in a natural population of the yeast Saccharomyces

40
cerevisiae from "Evolution Canyon": microsatellite polymorphism, ploidy and
controversial sexual status. Genetics 174: 1455-1468.
GUTHRIE, C. and G. R. FINK, 1991 Guide to Yeast Genetics and Molecular Biology,
Academic Press, San Diego.
HARTWELL, L. H., and D. SMITH, 1985 Altered fidelity of mitotic chromosome
transmission in cell cycle mutants of S. cerevisiae. Genetics 110: 381-395.
HEGARTY, M. J., and S. J. HISCOCK, 2008 Genomic clues to the evolutionary success of
polyploid plants. Curr. Biol. 18: R435-R444.
ILIOPOULOS, D., G. VASSILIOU, E. SEKERLI, V. SIDIROPOULOU, A. TSIGA, D. DIMOPOULOU,
and N. VOYIATZIS, 2005 Long survival in a 69, XXX triploid infant in Greece.
Genetics and Mol. Res. 4: 755-759.
KOLLER, A., J. HEITMAN and M. N. HALL, 1996 Regional bivalent-univalent pairing
versus trivalent pairing of a trisomic chromosome in Saccharomyces cerevisiae.
Genetics 144: 957-966.
LEE, P. S., P. W. GREENWELL, M. DOMINSKA, M. GAWEL, M. HAMILTON et al., 2009 A
fine-structure map of spontaneous mitotic crossovers in the yeast Saccharomyces
cerevisiae. PLoS Genet 5: e1000410.
LEMOINE, F. J., N. P. DEGTYAREVA, K. LOBACHEV and T. D. PETES, 2005 Chromosomal
translocations in yeast induced by low levels of DNA polymerase α: a model for
chromome fragile sites. Cell 120: 587-598.
LOIDL, J., 1995 Meiotic chromosome pairing in triploid and tetraploid Saccharomyces
cerevisiae. Genetics 139: 1511-1520.

41
MANCERA, E., R. BOURGON, A. BROZZI, W. HUBER and L. M. STEINMETZ, 2008 High-
resolution mapping of meiotic crossovers and non-crossovers in yeast. Nature
454: 479-485.
MAYER, V. W. and A. AGUILERA, 1990 High levels of chromosome instability in
polyploids of Saccharomyces cerevisiae. Mut.ation Res. 231: 177-186.
NARAYANAN, V., P. A. MIECZKOWSKI, H. M. KIM, T. D. PETES and K. S. LOBACHEV,
2006 The pattern of gene amplification is determined by the chromosomal
location of hairpin-capped breaks. Cell 125: 1283-1296.
PARRY, E. M., and B. S. COX, 1970 The tolerance of aneuploidy in yeast. Genet Res 16:
333-340.
PETES, T. D., R. E. MALONE and L. S. SYMINGTON, 1991 Recombination in yeast, pp. 407-
521 in The Molecular and Cellular Biology of the Yeast Saccharomyces, edited by
J. BROACH, E. W. JONES and J. R. PRINGLE. Cold Spring Harbor Laboratory Press,
Cold Spring Harbor , NY.
POMPER, S., 1952 Isolation of triploid Saccharomyces cerevisiae. Nature 170: 892-893.
POMPER, S., K. M. DANIELS and D. W. MCKEE, 1954 Genetic analysis of polyploid yeast.
Genetics 39: 343-355.
RILEY, M. I., and T. R. MANNEY, 1978 Tetraploid strains of Saccharomyces cerevisiae
that are trisomic for chromosome III. Genetics 89: 667-684.
SHAFFER, B., I. BREARLEY, R. LITTLEWOOD and G. R. FINK, 1971 A stable aneuploid of
Saccharomyces cerevisiae. Genetics 67: 483-495.
STOCK, M., J. USTINOVA, D. K. LAMATSCH, M. SCHARTL, N. PERRIN et al., 2009 A
vertebrate reproductive system involving three ploidy levels: hybrid origin of

42
triploids in a contact zone of diploid and tetraploid Palearctic green toads (Bufo
viridis subgroup). Evolution 64: 944-959.
STRAND, M., M. C. EARLEY, G. F. CROUSE and T. D. PETES, 1995 Mutations in the MSH3
gene preferentially lead to deletions within tracts of simple repetitive DNA in
Saccharomyces cerevisiae. Proc. Natl. Acad. Sci. USA 92: 10418-10421.
TORRES, E. M., T. SOKOLSKY, C. M. TUCKER, L. Y. CHAN, M. BOSELLI et al., 2007
Effects of aneuploidy on cellular physiology and cell division in haploid yeast.
Science 317: 916-924.
WEI, W., J. H. MCCUSKER, R. W. HYMAN, T. JONES, Y. NING et al., 2007 Genome
sequencing and comparative analysis of Saccharomyces cerevisiae strain
YJM789. Proc Natl Acad Sci U S A 104: 12825-12830.
WINSTON, F., C. DOLLARD and S. L. RICUPERO-HOVASSE, 1995 Construction of a set of
convenient Saccharomyces cerevisiae strains that are isogenic to S288C. Yeast
11: 53-55.

Table 1. CGH analysis of disomy and monosomy in spores derived from the triploid MH10.a
Chromosomes
Spore
Colony Size I II III IV V VI VII VIII IX X XI XII XIII XIV XV XVI
4a small 1 1
1 1
1 1
1 1
1 1 1 1 1 1
1 1
4b big 1 2 1 2 1 2 1 2b 1 1 1 1 1 2 1 1
4c small 2 1 2 1 2 2b 2 2b 2 2 2 2 2 1 2 2
4d big 1 2 1 2 1 2 1 1 1 1 1 1 1 2 1 1
22a small 2 1 1 1 2 1 2 2 1 1 1 1 1 1 2 1
22b big 1 2 1 1 1 1 1 1 1 1 2 1 1 2 1 1
22c small 2 1 1 1 2 1 2 2 1 1 1 1 1 1 2 1
22d big 1
1 1 1 1 1 1 1 1 1
1 1 1
1 1 1
24a big 1 1 2 1 2 1 1 1 2 1 2 1 1 1 1 1
24b big 1 1 2 1 2 1 1 1 2 1 2 1 1 1 1 1
24c small 2 2 1 1 1 1 2 2 1 2 1 1 1
1 1 1
24d small 2 2 1 1 1 1
1 2 1 2 1 1 1 2 1 1
25a small 1 2 1
1 1
1 1 1 1 2 2 1 1 1
1 1
25b big 1 1 2 1 2 1 1 1 2 1 1 2 2 2 1 2
25c big 1 1 2 1 2 1 1 1 2 1 1 2 2 2 1 2
25d big 2 2 1 2 2b 2 2 2 1 2 2 1 1 1 2 1

44
28a small 1 2b 2 2 2 1 1 2 2 2 1 1 2 2 1 2
28b big 2 1 1 1 1 1 2 1 1 1 2
1 1 1 1 1
28c small 1 1
1 1 2 1 1 2 2 1
1 1
1 1 1
1
28d big 2 2b 1 1 1 1 2 1 1 1 2 2 1 1 1 1
29a average 1 2 1 1 1 2 2 2 1 2 2 2 2 2 2 2
29b average 2 1 1
1 2 1 1 1 2 1 1 1 1 1 1 1
29c average 2 1 1 2 2 1 1 1 2 1 1 1 1 1 1 1
29d average 1 2 1 1 1 2 2 2 1 2 2 2 2 2 2 2
30a big 1 1 1 1 2 1 1 2 2 1 1 1 1 1 2 2
30b small 2 2 2 2 1 2 2 1 1 2 2 2 2 2 1 1
30c big 1 1 1 1 2 1 1 2 2 1 1 1 1 1 2 2
30d small 2 2 2 2 1 2
1 1 1 2 2 2 2 2 1 1
32a small 1 1 1 1 1 1 1 1 1 2 1 1 2 1 1 1
32b big 2 2
1 1
1 1 1 1 2 1 2
1 1 2
1 1
32c small 1 1 1 1 1 1 1 1 1 2 1 1 2 1 1 1
32d big 2 2 2 1 2 2 2 2 2 1 2 2 1 2 2 2
34a small 1 1 1 1 1 1 1 1 1 1 1 2 1
1 1 1
34b big 1 1 2 1 2 1 1 2 1 2 2 1 1 1 1 2
34c small 2 2 1 1 1 1 1 1 1 1 1
1 1 2 1 1
34d big 1 1 2 1 2 1 1 2 1
1 1 1 1 1 1
1

45
37a average 2 1 1 1 1 2 2 1 2 1 1 2 2 2 1 2
37b average 1 2 2 1 2 1 1 2 1 2 2 1 1 1 1 1
37c average 1 2 2 1
1 1 1 2 1 2 2 1 1 1 1 1
37d average 2 1 1 1 1 1 1 1 1 1 1 1 1 1 1 2
Averagec 5.7 5.7 5.3 4.7 5.7 4.9 5.2 5.7 5.4 5.5 5.7 5.1 5.1 5.5 4.9 5.2
aBased on CGH microarrays, we determined whether the spore cultures were disomic (indicated by 2 in the table) or monosomic (indicated by 1) for each homologue. Boldface indicates a tetrad in which one sister spore was monosomic, although the other sister was disomic, indicating a chromosome loss event in the monosomic spore. bIn these spores, there was a possible chromosome gain. The extra chromosomes were not counted in the averages at the bottom of the table. cAverage number of individual homologues per tetrad
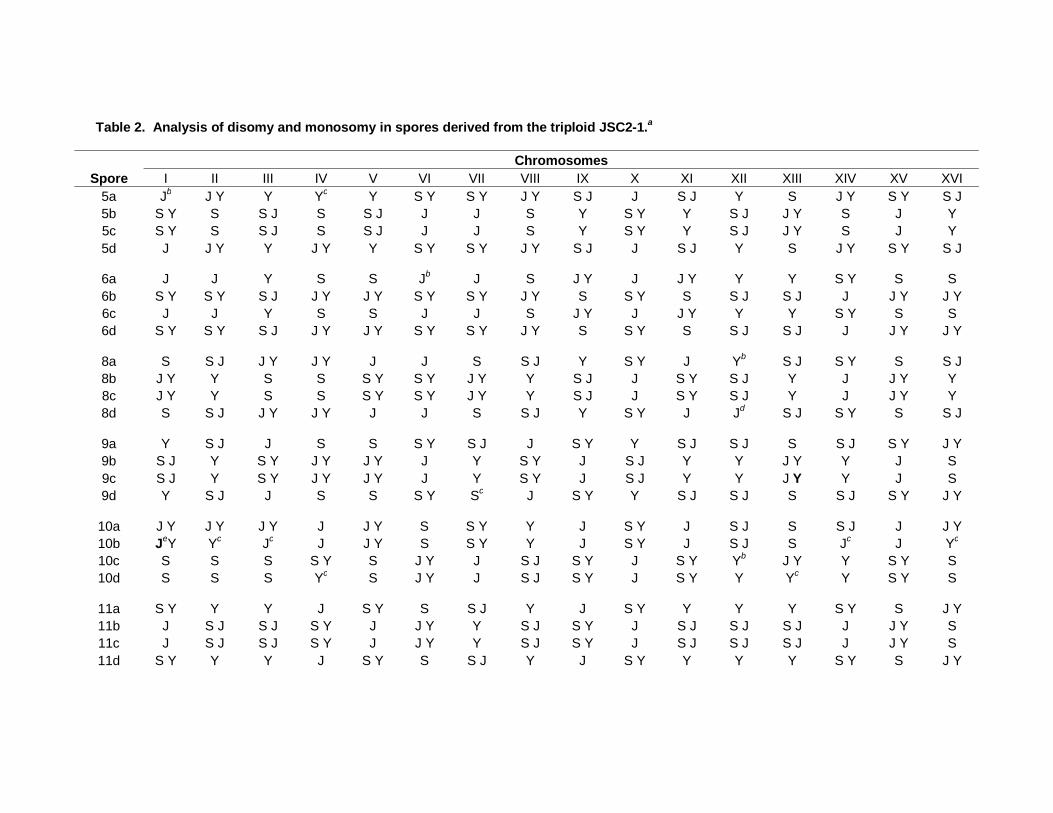
Table 2. Analysis of disomy and monosomy in spores derived from the triploid JSC2-1.a
Chromosomes
Spore I II III IV V VI VII VIII IX X XI XII XIII XIV XV XVI 5a Jb J Y Y Yc Y S Y S Y J Y S J J S J Y S J Y S Y S J 5b S Y S S J S S J J J S Y S Y Y S J J Y S J Y 5c S Y S S J S S J J J S Y S Y Y S J J Y S J Y 5d J J Y Y J Y Y S Y S Y J Y S J J S J Y S J Y S Y S J
6a J J Y S S Jb J S J Y J J Y Y Y S Y S S 6b S Y S Y S J J Y J Y S Y S Y J Y S S Y S S J S J J J Y J Y 6c J J Y S S J J S J Y J J Y Y Y S Y S S 6d S Y S Y S J J Y J Y S Y S Y J Y S S Y S S J S J J J Y J Y
8a S S J J Y J Y J J S S J Y S Y J Yb S J S Y S S J 8b J Y Y S S S Y S Y J Y Y S J J S Y S J Y J J Y Y 8c J Y Y S S S Y S Y J Y Y S J J S Y S J Y J J Y Y 8d S S J J Y J Y J J S S J Y S Y J Jd S J S Y S S J
9a Y S J J S S S Y S J J S Y Y S J S J S S J S Y J Y 9b S J Y S Y J Y J Y J Y S Y J S J Y Y J Y Y J S 9c S J Y S Y J Y J Y J Y S Y J S J Y Y J Y Y J S 9d Y S J J S S S Y Sc J S Y Y S J S J S S J S Y J Y
10a J Y J Y J Y J J Y S S Y Y J S Y J S J S S J J J Y 10b JeY Yc Jc J J Y S S Y Y J S Y J S J S Jc J Yc
10c S S S S Y S J Y J S J S Y J S Y Yb J Y Y S Y S 10d S S S Yc S J Y J S J S Y J S Y Y Yc Y S Y S
11a S Y Y Y J S Y S S J Y J S Y Y Y Y S Y S J Y 11b J S J S J S Y J J Y Y S J S Y J S J S J S J J J Y S 11c J S J S J S Y J J Y Y S J S Y J S J S J S J J J Y S 11d S Y Y Y J S Y S S J Y J S Y Y Y Y S Y S J Y

47
12a Y S J J J J S Y Y S Y S Y S S J S J S Y S Y S J 12b Y S J J J J S Y Y Sb,c S Y S S J S J S Y S Y S J 12c S J Y S Y S Y S Y J Sc J J J Y Y J Y S Sd J J Y 12d S J Y S Y S Y S Y J S J J J J Y Y J Y S Sd J J Y
13a J S J S S J S Y Y J Y S J J S J S Y S J S Y S 13b S Y Y J Y Y J S J S Y S Y J Y S Y J J Y S Y J J Y 13c S Y Y J Y Y J S J S Y S Y J Y S Y Jb J Y S Y J J Y 13d J S J S S Jf S Y Y J Y S J J S J S Y S J Yc,f S
14a J Y S J S Y J S Y J J Y S J S S S Y S 14b J Y S J S Y J S Y J J Y S J S S S Y S 14c S Y S J Y J Y S J S Y J Y S J S Y S Y S J Y J Y J Y J J Y 14d S Y S J Y J Y S J S Y J Y S J S Y S Y S J Y J Y J Y J J Y
15a S Y S J S J Y J S J S J S J J J J Y J Y S Y Y J Y 15b J Y Y S J S Y Y Y J Y S Y S Y S Y S S J S J S 15c J Y Y S J S Y Y Y J Y S Y S Y S Y S S J S J S 15d S Y S J S J Y J S J S J S J J J J Y J Y S Y Y J Y
Averageg 6 5.9 5.9 5.8 6 6 5.8 5.9 6 6 6 6 5.9 5.9 5.9 5.9
aUsing SPA (described in text), we determined whether spores were monosomic or disomic, and the source of each homologue (S=S288c; J=JAY291; Y=YJM789). b Extra chromosome homolog detected by CGH microarrays. These extra chromosomes were not counted in the averages shown at the bottom of this table. cChromosome loss. dPutative gene conversion event. eBoldface indicates that homologues were detected using PCR and primers that exclusively amplified only one of the strain-specific SNPs. f Translocation between chromosome IV and XV detected by CGH microarray and gel analysis. gAverage number of individual homologues per tetrad.