Mechanism, Quantitative Calculation and Countermeasures of ...
10
Mechanism, Quantitative Calculation and Countermeasures of Liquefaction during Earthquake Yukitake Shioi Hachinohe Institute of Technology, Aomori, Japan Yutaka Hashizume Izumo, Misawa, Aomori, Japan SUMMARY The authors show that the main cause of the liquefaction is the soft and flexible clayey layer beneath the liquefied sandy soil, and that the process of liquefaction can be explained with the multi-reflection theory and dynamic response calculation from the bedrock through the thick sedimentary layers above. The seismic waves and their energy gather from the hard bedrock to the soft surface layers. The seismic energy absorbed in the soft and flexible clayey layer generates self vibration of the layer with long periods, which transfers shear strain to the saturated sandy layer above and induces liquefaction. This calculation method is useful for speculating the limit and the level of liquefaction for various geological ground types and for investigating countermeasures against liquefaction. Then, we can know the possibility of liquefaction based on the scale of strain by the energy of an earthquake at any places. Keywords: Liquefaction, Shear strain, Multi-reflection theory, Rigidity of soil, FEM analysis 1. INTRODUCTION The large-scaled liquefaction of saturated sandy soil was observed in many places during the 2011 East Japan Earthquake. With regard to the liquefaction phenomena described as originating from excess pore water pressure and diminishing effective stresses among grain structures caused by repeated of strong acceleration waves, the following curious points are noted, ①the maximum accelerations observed at the sites are not large (<200 gal). ②the seismic waves with little acceleration during liquefaction have relatively long periods. ③the liquefaction appears after the main shock. ④the liquefaction continues for a long time after the earthquake. ⑤the liquefaction is seen in gravel or silt layers at times and ⑥ large landslide is sometimes observed without sand boils being apparent. Such phenomena seem to depend on the soft and flexible cohesive layer beneath the liquefied sandy soil. This means that it is necessary to clarify the influence of this soft layer using response calculations. To resolve the curious points above-mentioned, a series of dynamic response analyses were conducted, which led to the formulation of a new hypothesis. This hypothesis was applied to previous liquefaction phenomena in order to generate a clearer explanation of the liquefaction mechanism than one provided by existing theories. It gives a reasonable explanation of these phenomena and the influence of the soft layer during large earthquakes, making it possible to simulate and thereby predict actual liquefaction. The hypothesis is applied to the liquefaction in Urayasu City (which neighbors Tokyo) that resulted in many houses being severely damaged. It offers a sound explanation for why liquefaction occurred in this instance, and why it did not occur in past earthquakes. It is also applicable to other areas that have experienced liquefaction.
Transcript of Mechanism, Quantitative Calculation and Countermeasures of ...

Mechanism, Quantitative Calculation and
Countermeasures of Liquefaction during Earthquake
Yukitake Shioi
Hachinohe Institute of Technology, Aomori, Japan
Yutaka Hashizume
Izumo, Misawa, Aomori, Japan
SUMMARY
The authors show that the main cause of the liquefaction is the soft and flexible clayey layer beneath the liquefied sandy
soil, and that the process of liquefaction can be explained with the multi-reflection theory and dynamic response
calculation from the bedrock through the thick sedimentary layers above. The seismic waves and their energy gather from
the hard bedrock to the soft surface layers. The seismic energy absorbed in the soft and flexible clayey layer generates self
vibration of the layer with long periods, which transfers shear strain to the saturated sandy layer above and induces
liquefaction.
This calculation method is useful for speculating the limit and the level of liquefaction for various geological ground
types and for investigating countermeasures against liquefaction. Then, we can know the possibility of liquefaction based
on the scale of strain by the energy of an earthquake at any places.
Keywords: Liquefaction, Shear strain, Multi-reflection theory, Rigidity of soil, FEM analysis
1. INTRODUCTION
The large-scaled liquefaction of saturated sandy soil was observed in many places during the 2011 East Japan
Earthquake. With regard to the liquefaction phenomena described as originating from excess pore water
pressure and diminishing effective stresses among grain structures caused by repeated of strong acceleration
waves, the following curious points are noted, ①the maximum accelerations observed at the sites are not large
(<200 gal). ②the seismic waves with little acceleration during liquefaction have relatively long periods.
③the liquefaction appears after the main shock. ④the liquefaction continues for a long time after the
earthquake. ⑤the liquefaction is seen in gravel or silt layers at times and ⑥ large landslide is sometimes
observed without sand boils being apparent.
Such phenomena seem to depend on the soft and flexible cohesive layer beneath the liquefied sandy soil. This
means that it is necessary to clarify the influence of this soft layer using response calculations.
To resolve the curious points above-mentioned, a series of dynamic response analyses were conducted, which led
to the formulation of a new hypothesis. This hypothesis was applied to previous liquefaction phenomena in order
to generate a clearer explanation of the liquefaction mechanism than one provided by existing theories. It gives a
reasonable explanation of these phenomena and the influence of the soft layer during large earthquakes, making it
possible to simulate and thereby predict actual liquefaction.
The hypothesis is applied to the liquefaction in Urayasu City (which neighbors Tokyo) that resulted in many
houses being severely damaged. It offers a sound explanation for why liquefaction occurred in this instance,
and why it did not occur in past earthquakes. It is also applicable to other areas that have experienced
liquefaction.

2. HYPOTHESIS FOR THE LIQUEFACTION MECHANISM
The liquefaction of saturated sandy soil is the result of large shear strains which destroys the particle structure
of the sand bearing the effective stress, resulting in a high excess pore water pressure in a suspension of sand.
Where do such large shear strains come from?
At the liquefied places there exists without exception a thick, soft and flexible cohesive layer. This cohesive
layer absorbs and stores the energy of seismic waves propagating upwards from the bedrock layer. The seismic
waves easily propagate from hard layers to soft layers but propagation from soft layers to hard layers is
minimal. As a result, the seismic waves move upwards and concentrate in the surface layers, repeatedly,
reflecting and refracting through the intermediate layers below. Most of the seismic energy is stored in the
cohesive layer near the surface.
This cohesive layer vibrates at its own first mode of natural frequency, with a relatively long periods and small
accelerations in the case of a weak upper layer. It then transmits the large amplitudes and large shear strains of
the seismic waves, and its vibration continues for long time. In the case of a firm upper layer, it vibrates in its
own second mode or high modes of natural frequency with short periods and large accelerations because the
upper layer binds the soft lower cohesive layer together strongly (Figure 2.1).
The large shear strain generated by waves with long periods travelling upwards from the soft lower soil
destroys the particle structures of the saturated sand layer. Then, the effective stress in the sand layer is
transferred to the pore water pressure. If the pore water is confined under the surface, the pore water pressure
increases and the liquefaction results with suspended sand.
The liquefaction of sandy soils results in various phenomena, such as spout of ground water, sand boils,
settlement of structures or the ground surface, cracks and fissures in the ground, horizontal displacement of
slope, inclining of piers or tower, sliding or collapse of embankment, etc.
The abovementioned kinds of damage occur on the upper side of the cohesive layers. Effective measures to
prevent liquefaction are defined as release of excess pore water pressure, rigid walls to constrain the shear strain,
rigid foundation for structures, connecting beams between the tops of piers or towers, consolidation of sandy
soil, dewatering of the ground water table, etc.
3. LIQUEFACTION AT URAYASU CAUSED BY THE 2011 EAST JAPAN EARTHQUAKE
The 2011 East Japan Earthquake (Magnitude 9) occurred at 14:46 on the 11th of March 2011, 130 km far from
the main land (Figure3.1). Its source region extends 500 km in length and 200 km in width and consists of
three hypocenters, two of which are located off Miyagi prefecture and one off Ibaraki prefecture. Though the
majority of damage to life and property was caused by the
Sand
Soft
soil
Hard
soil
Bedrock
Figure 2.1 Concept of mechanism of liquefaction Figure 3.1 The 2011 East Japan Eq.
Urayasu
Iwate pref.
Miyagi pref.
Ibaraki pref.
Sendai
Fukushima pref.

Figure3.2 Depth of bed rock under
Kanto Plain
Urayasu Inage
Iwatsuki
Urayasu
Inage Ward
Figure3.3 Velocity waves at Urayasu and Inage Ward
Figure 3.4. Shear wave
velocities of each layers
Figure 3.5. Rigidity G/G0 and damping ratio ηfor γ
G/G0~γ
η~γ
G/G 0
η
γ 10-3 10-2
0.0
0.0
1.0
1.0
0 100 200 300
40
20
0
-20
-40
-60
Acc
.(gal)
Time (sec)
Figure 3.6. Input waves to bedrock 0 50 100 150 200 250 300
2.0
0
-2.0
Time (sec)
Acc
. (x10
2 g
al)
Figure 3.7. Acceleration waves at surface
At surface
At bedrock 200
100
40
20
10
5
700
300
200
100
(gal)
(gal)
0.1 1.0 10 (sec)
0.1 1.0 10 (sec)
Figure 3.8. Comparison of acc. waves spectra
Figure 3.9. Shear strain waves at surface and 150m below
Time (sec)
Shea
r st
rain
(x10
-2)
0.0 100 200
0.0
1.5
2.0
Time (sec)
Shea
r st
rain
(x10
-4)
0.0 100 200
0.0
1.5
2.0
Figure 3.10. Shear strains at surface
-50
-40
-30
-20
-10
0
0 0.005 0.01 0.015 0.02 0.025
せん断ひずみγxy
深度(m)
(m)
Point of 1.5m below
Clayey soil
tsunami, damage caused by liquefaction was dispersed across a wide stretch of East Japan and resulted in
uneven settlement and breakage of houses on alluvium ground.
Urayasu City is separated from Tokyo by the Edo River and encompasses newly extended reclaimed land in
the Tokyo Bay. Residential areas in the City without soil improvement experienced severe liquefaction as a
result of this earthquake. These areas had not experienced liquefaction caused by earthquake before this event.
It is necessary to investigate the reason why this occurred and to provide the countermeasures against
liquefaction for the future.
Urayasu is situated on the Kanto Plain, which has very deep sedimentary layers around 2,500 m in total
thickness from the bed rock (Figure 3.2). Therefore, the seismic waves (at Urayasu City and in Inage Ward of
Chiba City) moving up from the bedrock can continue for a long time (Figure 3.3), as they reflect and refract
through many layers in the case of a very large earthquake. The waves have longer periods than those at the
bedrock, although their accelerations are not large. This means that the shear strains caused by the seismic
waves become large and continuous, and the energy of the seismic waves moves upwards and concentrates in
the surface layers. To investigate the process of liquefaction at Urayasu City a series of seismic response
analyses were performed from the bedrock to the surface.
The depth of the bed rock (Vs=2,000~2,500m/sec) at Urayasu is estimated to be about 2,000 m from the
surface. The intermediate layers are made up of diluvium deposits and the surface layer is of alluvium deposits
of about 50 m in depth. The velocities of shear waves (Vs) in these geologies are shown in Figure 3.4. The
shear modulus at the strain of 10-6 is given from the shear wave velocity. Its value decreases and the damping
ratio increases until a strain (γ) of 10-2
(Figure 3.5).
The input waves to the bedrock use the records of the 2011 East Japan Earthquake (Figure 3.6) at a depth of
3,500 m from the Iwatsuki Observatory. A series of the response analyses conducted using SHAKE and
FLUSH on the geology at Urayasu were performed to ascertain the transformations of the acceleration,
velocity, shear strain, etc. The calculated waves and their acceleration spectra at the surface are shown in
Figure 3.7 and Figure 3.8 using SHAKE, and prove the amplification of the long-period waves and the
extended duration of the observed waves. The waves continue for a long time corresponding to the duration of
liquefaction.
The level of strain, which is more than 10-3, is enough to provoke liquefaction at the surface. Figure 3.9 shows
the shear strain waves at the surface calculated using FLUSH, which are amplified compared with those at the
intermediate layer 150 m below. Figure 3.10 shows the amplification of shear strain in clayey soil and loose
sand layers near the surface.
4. LIQUEFACTIONS AT OTHER PLACES BY THE PAST EARTHQUAKES
4.1. The 1994 Far-Off Sanriku Earthquake
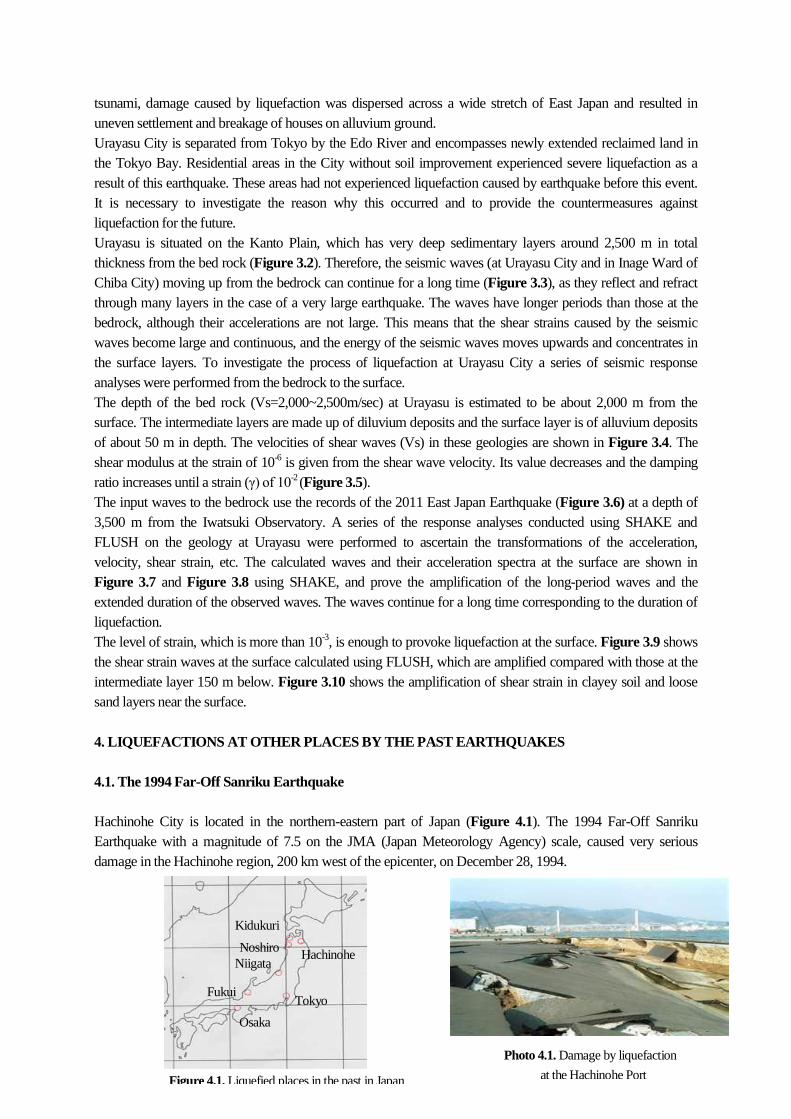
Hachinohe City is located in the northern-eastern part of Japan (Figure 4.1). The 1994 Far-Off Sanriku
Earthquake with a magnitude of 7.5 on the JMA (Japan Meteorology Agency) scale, caused very serious
damage in the Hachinohe region, 200 km west of the epicenter, on December 28, 1994.
Hachinohe
Kidukuri
Noshiro
Niigata
Fukui Tokyo
Osaka
Figure 4.1. Liquefied places in the past in Japan
Photo 4.1. Damage by liquefaction
at the Hachinohe Port

Liquefaction during this earthquake, which had a maximum acceleration of 675 gal, was concentrated
chiefly in the harbor area and significantly damaged harbor facilities (Photo 4.1).
Large and small sand boils, subsidence of reclaimed land, displacement of quays and other kinds of damage
were observed at the 2nd
Port, where the bedrock is estimated to lie about 400 m underground. The ground
consists of fill soil from the surface to 15 m down, alternating layers from the Pleistocene Period from 15 m to
45 m, and layers from the Tertiary Period below 45 m.
To confirm the mechanism of liquefaction at the saturated sand layer on the soft cohesive layers, SHAKE and
FLUSH analyses were performed using a soil profile at the 2nd
Port, as shown in Figure 4.2.In the response
calculations, seismic waves with a maximum acceleration of 147 gal (Figure 4.3), recorded in the hard
Paleozoic mudstone were injected into the bedrock, and the elastic shear coefficients of each layer were derived
from the shear wave velocity.
The calculated results for Figure 4.2 using SHAKE and FLUSH are shown in Figure 4.4 and Figure 4.5.
Figure 4.6 shows the waves of shear strain at several depths at the 2nd
Port and explain the tendency of shear
strain waves with a long period to amplify as they progress toward the surface. Figure 4.7 shows the transition
of seismic energy expressed in 1/2V2.
These results mean that ①The maximum acceleration is not so large. ②The periods of the waves are rather
long. ③The generation of liquefaction comes some time after the main shock. ④It continues for a long time.
Figure 4.6. Shear strain waves at the 2nd
port
Figure 4.4. Calculated acc. waves by SHAKE
200
-200
0
(gal
)
0
(gal
) 200
(gal
)
0 5 10 15 20
0m
-10m
-277m
200
-200 0
-200
(sec)
Acc
eler
atio
n
Time (sec)
Acc
eler
atio
n
Figure 4.5. Calculated acc. wave by FLUSH
Figure 4.7. Transition of seismic wave energy
Figure 4.2. Model of geology at the 2nd
port
500m
400m
Shear wave
velocity (m/s)
Maximum
1300
Acc
.(gal)
Time (sec)
Figure4.3. Input waves observed at H.I.T.

4.2. Other incidences of liquefaction caused by past earthquakes
The concept of the mentioned hypothesis was applied to analyze past incidences of liquefaction. The 1948
Fukui Earthquake, on the Fukui Plain in Japan (Figure 4.1) provoked the most severe liquefaction. It caused a
large amount of damage to Fukui City, which is sited on a relatively firm ground (Photo 4.2) and liquefied the
surface layers around the entire plain including the gravel surface along the Kuzuryu River (Photo 4.3).
Two response analyses of firm and loose surface layers of 10 m on the silt layer were performed using the
section in Figure 4.8 to evaluate the influence of rigidity at the surface. Regardless of the input waves (Figure
4.3) sent to the bedrock 248 m below, measured at Hachinohe, the calculated results reasonably explain the
influence of the rigidities of surface in Figure 4.9 and Figure 4.10. In the case of the firm layer, the
acceleration became about 300 gal with short periods, and the maximum response increased to more than 1,000
gal at 0.2~0.3 seconds. In the case of the loose layer, the small waves accelerated to a maximum of 36 gal,
Photo 4.4. Leaned apartments
Figure 4.10. Response spectra of acceleration
on the firm (left) and loose (right) surfaces
Photo 4.5. Fallen bridges
Figure 4.11. Accelerations and displacements on surface Photo 5.6. Collapsed bank
Figure 4.8. Section for FLUSH
248m
500m
Photo 4.2. Collapse of
building and houses
Photo 4.3. Fallen bridges caused by
liquefaction on the Kuzuryu R.
Figure 4.9. Acceleration and displacement waves on the firm (left) and loose (right) surfaces

Figure 4.12. Response spectra of accelerations on surfaces in 3 cities
with two long peak periods of 0.8 and 3seconds, and the maximum shear strain became 2.5 x 10⁻². These
results show that the possibility of liquefaction occurring depends on the rigidity of the surface.
The 1964 Niigata Earthquake with a magnitude of 7.5 (Figure4.1) was the first earthquake in Japan to provoke
notice of the serious damage caused by liquefaction (Photo4.4, Photo4.5). The 1983 Mid Japan Sea
Earthquake, with
a magnitude of 7.7, spread a large amount of damage over a wide area due to the effects of liquefaction and
tsunami. The low-lying areas of Niigata city suffered serious liquefaction. Land along the coastline near
Noshiro was damaged (Photo5.6) and Kizukuri was slightly affected by the amount of sand boils caused by the
1983 Mid Japan Sea Earthquake.
In Figure4.11 and Figure4.12 calculated with the same input waves from Hachinohe sent to the bedrock in the
modeled section at three places, the accelerations and the displacements, and their maximum response spectra
on the surface grounds are illustrated. Figure4.11 and Figure4.12 show the properties of the liquefied ground.
The seismic waves at the surface possessed small accelerations with long predominant periods. The shear
strains caused by each wave became 0.6 x 10⁻² in Niigata, 4 x 10⁻² in Noshiro and 0.1 x 10⁻² in Kizukuri,
which are all enough to generate liquefaction. From these calculations each place can be seen to show their
own unique reactions, even though the same input waves were sent to the bedrocks.
In the 1964 Alaska Earthquake with a magnitude of 9.2 and the 2011 Canterbury Earthquake with a magnitude
of 6.1, there occurred land slides without apparent sand boils (Photo4.7, Photo4.8 and Photo4.9). Even though
it is speculated that these phenomena are related to liquefaction, the casual mechanism is not yet proved.
In a geological survey for the 2012 East Japan Earthquake, Mr. Inasaki, a senior researcher at the Public Works
Research Institute, performed a very precise boring experiment at a liquefied area in Makuhari between
Urayasu and Inage. Photo 4.10 shows the partially liquefied sand layer on a clayey layer. It indicates a
possibility that this liquefied layer may carry out to slide the upper layer. This phenomenon may be proved by
the response analysis using SHAKE or FLUSH.
Photo 4.8. Land slide
at Christchurch
Photo 4.7. Damage
by land slide in Alaska Eq.
Photo 4.9. Crack on
the land slide at
Christchurch
Sand
layer
Liquefied
sand layer
Clayey
layer
Photo 4.10. Partially liquefied sand layer on clay

5. COUNTERMEASURES AGAINST LIQUEFACTION
To prevent the liquefaction of saturated sand in an earthquake, it is necessary to estimate the possibility of
liquefaction. In Japan an estimation method using the FL value (FL=R/L ---Factor of Liquefaction, R:
Resistance of Ground, L: Seismic Force) is popular. However, the main cause of liquefaction is not the
intensity of seismic force but the shear strain originating from seismic waves with relatively long periods of the
cohesive layer below. The Resistance of Ground also needs to adopt the value of the static shear strength, not
the dynamic tri-axial test, as mentioned above.
For estimation of the possibility of liquefaction, it is necessary to conduct a response analysis reaching the
sedimentary layers from the bedrock. Liquefaction is usually generated in cases of more than 10-3 level of shear
strain at the saturated sandy soil layer. It seldom occurs at the saturated gravel or bolder layers, depending on
the scale of earthquake and the thickness and the rigidity of the intermediate cohesive layers. The grade of
liquefaction of saturated sandy soil at each place can be estimated by response analysis using the soil profile, all
way to bedrock and the rigidities of all layers, which are given by geophysical exploration methods, and the
scale and the duration of the earthquake (seismic energy).
The countermeasures to prevent or to decrease the influences of liquefaction can be deduced from the above
mentioned mechanism as follows.
①(Mitigation of excess pore water pressure) As the measures to mitigate the excess pore water pressure caused
by the collapse of the effective stress in the sand layer, sand drain piles (Figure 5.1), sand compaction piles,
gravel drain piles (Photo 5.1), paper drain methods (Photo 5.2) and other methods are applicable. However, in
these cases a small settlement of the ground is inevitable caused by spout of ground water. Photo 5.3 shows the
settlement of a quay by paper drainage at Hachinohe Port. The screwed hollow steel pipe with strainers (Figure
5.2) is considerably effective as a measure to release the excess pore water pressure.
②(Ground improvement & consolidation of surface layer) To endure the shear strain caused by the seismic
waves, ground improvement (Figure 5.3) and the consolidation of surface layer (Figure 5.4, Figure 5.5) are
effective countermeasures as mentioned in the case of the 1948 Fukui Earthquake. (Figure 4.2). In case of
spread foundation, the consolidation of surface layer is required to a certain depth and width.
③(Deep rigid foundation & reinforcement of foundation) At the places where it is feared liquefaction may occur,
foundations of a proper rigidity (Figure 5.6, Figure 5.7) should be built into the bearing stratum. If necessary,
ground improvement may be executed for the reinforcement of foundation (Figure 5.8, Figure 5.9).
④(Restriction frame for soil shear strain) Sometimes, rigid frame walls (Figure 5.10) are adopted to restrict
the shear strain in the saturated sand and they have been proved to prevent liquefaction effectively. For oil
tank the method shown in Figure 5.11 is proposed. The method shown in Figure 5.12 is a seismic
reinforcement for an existing pile foundation.
Sand drain piles
Sand
mat
Figure 5.1. Sand drain piles Photo 5.2. Paper drain
method
Photo 5.1. Gravel
drain piles
Photo 5.3. Settled
quay by paper drain
method
Figure 5.2. Steel pipe pile with strainers
Pile head
Strainer Dia
met
er
Optional space

⑤(Ties between structures) During liquefaction, the acceleration is not large, but the displacement is large.
Therefore, it may be enough to stop the deformation of structures with ties. Photo5.4 is an example of a
high-raised belt conveyer which maintained functionality without damage on the severely liquefied ground.
⑥(Dewatering etc.) If the sand on the surface is not saturated, liquefaction will not occur. One proposal is to
lower the ground water table through wells (Figure5.13). However, the maintenance costs required by this
proposal are significant and there is a fear to settle the surrounding area.
Compaction
Piles
Sand piles
Figure 5.5. Shallow soil
improvement
Figure 5.6.
Caisson
foundation
Figure 5.8. Reinforced pile
foundation Figure 5.9. Reinforced
caisson foundation
Bearing stratum
Injection Injection
Improved Loose
sand
Tank
Figure 5.3. Ground improvement
under a tank foundation Figure 5.4. Surface
improvement
Surface
improve
ment
Original ground
Seismic
wave
Liquefied
Lattice type wall
Figure 5.10. Rigid frame wall
Tank
Rigid wall
Figure 5.11. Rigid
steel pipe wall
Bearing stratum
Liquefied layer
Original layer
Figure 5.7. Pile
foundation
Footing
Pile
New
footing
Sheet
pile
Soil
improve-m
ent
Figure 5.12. In-Cap Method
Firm layer Sheet
pile
Loose layer
Well
Figure 5.13. Dewatering method
Photo 5.4. Conveyer on ground
liquefied severely

6. CONCLUSIONS
A series of dynamic analyses applied to multiple layers above the bedrock, has verified the concept of the
mechanism of liquefaction of saturated sand layer during a large earthquake. The physical coefficients of each
layer used in the analysis can be estimated by elastic wave exploration. The results obtained using SHAKE and
FLUSH and based on the multi-reflection theory correspond with actual phenomena observed in the past large
earthquake as follows.
(1) Waves moving upwards from the bedrock amplify and pile up in soft layers such as clay or silt.
(2) Waves that reach the surface through soft layers tend to have elongated periods.
(3) Waves with a relatively long period continue for a long time after the main shock.
(4) The shear strain of such waves near the surface has the potential to reach a level high enough (more than
10-3) to liquefy the upper saturated sand layer.
(5) The seismic energy to generate liquefaction becomes large gradually through the intermediate layers
from the bedrock to the surface.
(6) Calculations using FLUSH are more realistic than those using SHAKE.
Furthermore, the concept of general applicability has been proved through several response calculations using
FLUSH for six sites that suffered severe liquefaction caused by large earthquakes in the past. From a series of
these calculations, it has been found that calculations based on this concept, can reproduce and predict actual
liquefaction in a quantitative fashion. Optimal countermeasures to prevent or to decrease the impact of
liquefaction can be selected by taking into consideration of the above mentioned mechanism. This conception
will contribute to the improvement of seismic design method for liquefaction.
ACKNOWLEDGEMENT
The authors would like to express their deep gratitude to Dr. Hisashi Fukada and Mr. Chunshan Liu for their cooperation in
conducting some of response analyses using SHAKE and FLUSH. Furthermore, the authors would also like to offer their
thanks to Prof. Miska Cubrinovski and Mr. Atsushi Inasaki, who provided some valuable materials that were important to
compose this paper. The data on the seismic waves of the 2011 East Japan Earthquake that are cited in this paper were
obtained from the records of K-net, which is operated by the National Research Institute for Earth Science and Disaster
Prevention in Japan.
REFERENCES
Shioi, Y.(1980), Experimental study on liquefaction of sandy soil. 7th World Conference for Earthquake
Engineering, Istanbul
Shioi, Y., Sakajiri, N.(1996), Seismic damage to civil engineering structures by the 1994 Far-Off Sanriku
Earthquake, 11th World Conference for Earthquake Engineering
Hashizmue, Y., Shioi, Y.(2000), Mechanism of liquefaction of sandy ground during a great earthquake and
countermeasures for highway bridges, UJNR 16th, US, 35-48
Shioi, Y., Hashizmue, Y.(2001), Mechanism of Liquefaction of Sandy Ground during Large Earthquakes, 10th
International Conference on Soil Dynamics and Earthquake Engineering, US
Shioi, Y., Fukada, H., Hashizmue, Y.(2004), Influence of rigidity of the surface layer on liquefaction during
earthquake, 3th International Conference for Continental Earthquake, China
Shioi, Y., Fukada, H., Hashizmue, Y.(2006), Liquefaction Mechanism of Sandy Ground and Influence of Surface
Layer Hardness, 8th National Conference on Earthquake Engineering, US
Shioi, Y., Fukada, H., Hashizmue, Y.(2008), Seismic design be based on response analyses from basement rock, 14th
World Conference for Earthquake Engineering