Measuring the Benefits of Pedestrian Improvements
12
Paper presented to Walk21-V Cities for People, The Fifth International Conference on Walking in the 21 st Century, June 9-11 2004, Copenhagen, Denmark www.citiesforpeople.dk ; www.walk21.com Measuring the benefits of pedestrian improvement s Paul Buchanan and Daniel Heuman Colin Buchanan and Partners Contact details: Paul Buchanan and Daniel Heuman Colin Buchanan & Partners Newcombe House 45 Notting Hill Gate London, W11 3PB Tel: 020-7309-7000 Email: [email protected] Abstract There are established methodologies applied in UK scheme appraisals, to measure the economic impact of rail, bus and highway infrastructure projects. However, there is no such appraisal method agreed for walking schemes. As part of the annual local transport funding process, Transport for London (TfL) urged practitioners to develop a system that was robust, measurable and allowed comparison with other modal schemes. The Corporation of London appointed Colin Buchanan & Partners to assess the economic benefits of improvements to a network of Strategic Walks around the Capital. This paper explains the approach that was developed and how it was applied. The evaluation of the Strategic Walks was carried out in two stages: quantifying the benefits and valuing those benefits. We started by determining the number of existing users and why they were using the Strategic Walks. To assess journey purpose, a distinction was drawn between striders (mostly commuters and people in work time) and strollers. Striders were assumed to prioritise time savings over the quality of the walk, strollers prefer a nice environment and are less concerned with the time it takes to reach a destination (there may not even be a destination). The second stage was to assign values to (a) facilities (such as improved surfacing, benches and signage), and (b) broader improvements to physical fitness and the environment. Assigning values to physical improvements was carried out on a willingness to pay basis and made use of existing techniques applied by TfL to bus and underground improvements. Although physical fitness and improvements to surfacing and the environment are not typically quantified in investment appraisal, techniques for assessing these were developed
-
Upload
skm-colin-buchanan -
Category
Documents
-
view
217 -
download
0
Transcript of Measuring the Benefits of Pedestrian Improvements
8/8/2019 Measuring the Benefits of Pedestrian Improvements
http://slidepdf.com/reader/full/measuring-the-benefits-of-pedestrian-improvements 1/12
Paper presented to Walk21-V Cities for People, The Fifth International Conference onWalking in the 21st Century, June 9-11 2004, Copenhagen, Denmark
www.citiesforpeople.dk ; www.walk21.com
Measuring the benefits of pedestrian improvements
Paul Buchanan and Daniel Heuman
Colin Buchanan and Partners
Contact details:
Paul Buchanan and Daniel Heuman
Colin Buchanan & PartnersNewcombe House
45 Notting Hill Gate
London, W11 3PB
Tel: 020-7309-7000Email: [email protected]
Abstract
There are established methodologies applied in UK scheme appraisals, to measure the
economic impact of rail, bus and highway infrastructure projects. However, there is no such
appraisal method agreed for walking schemes. As part of the annual local transport fundingprocess, Transport for London (TfL) urged practitioners to develop a system that was robust,
measurable and allowed comparison with other modal schemes. The Corporation of London
appointed Colin Buchanan & Partners to assess the economic benefits of improvements to anetwork of Strategic Walks around the Capital. This paper explains the approach that wasdeveloped and how it was applied.
The evaluation of the Strategic Walks was carried out in two stages: quantifying the benefitsand valuing those benefits. We started by determining the number of existing users and why
they were using the Strategic Walks. To assess journey purpose, a distinction was drawn
between striders (mostly commuters and people in work time) and strollers. Striders wereassumed to prioritise time savings over the quality of the walk, strollers prefer a nice
environment and are less concerned with the time it takes to reach a destination (there may not
even be a destination).
The second stage was to assign values to (a) facilities (such as improved surfacing, benches
and signage), and (b) broader improvements to physical fitness and the environment.
Assigning values to physical improvements was carried out on a willingness to pay basis andmade use of existing techniques applied by TfL to bus and underground improvements.
Although physical fitness and improvements to surfacing and the environment are not
typically quantified in investment appraisal, techniques for assessing these were developed

8/8/2019 Measuring the Benefits of Pedestrian Improvements
http://slidepdf.com/reader/full/measuring-the-benefits-of-pedestrian-improvements 2/12
and applied. These made use of medical research and values used in Department for Transportappraisals.
Assessing benefits in this way makes it possible to determine the benefit-cost ratio associatedwith each improvement in a walking scheme. This can then be used to compare expenditure
between walking schemes, enabling prioritisation of measures that offer the greatest economicreturns to investments. It can also be used to compare walking schemes to other modes.
The methodology has been well received within TfL and may yet be extended to cover otherschemes and proposals. The consultants would like to thank the support provided by Jim
Walker of the Corporation of London and Gary Cliffe the Strategic Walks manager whose
expertise and knowledge was invaluable. The opinions expressed remain those of the
consultants alone.

8/8/2019 Measuring the Benefits of Pedestrian Improvements
http://slidepdf.com/reader/full/measuring-the-benefits-of-pedestrian-improvements 3/12
Biography
Paul Buchanan is the director of economics at Colin Buchanan & Partners, London. He is an
economist with sixteen years experience in the planning, economic and financial evaluation of awide range of public and private sector transport investments. He has specific expertise in the
evaluation of public transport systems covering London, Europe, Asia and S. America.
8/8/2019 Measuring the Benefits of Pedestrian Improvements
http://slidepdf.com/reader/full/measuring-the-benefits-of-pedestrian-improvements 4/12
Measuring the benefits of pedestrian improvements
Paul Buchanan and Daniel Heuman
Colin Buchanan and Partners
Introduction
Almost all journeys include at least some walking, and walking is an important means of
travel in its own right, accounting for about a quarter of all journeys in London. Encouragingwalking is key to delivering sustainable transport solutions. Walking reduces traffic; improves
health; reduces crime; revitalises town centres and improves air quality. Over the past 20
years, vehicle use in London has risen, walking has declined and the number of prematuredeaths associated with inactive lifestyles has gone up.
In the recent allocation of expenditure by London Boroughs f or this financial year, ‘walking’
was allocated only £3 million out of a total budget of £147m1
. That is a slightly unfaircomparison as a range of walking improvements are hidden within other categories (Streets
for People, Local Safety Schemes, Station Access Improvements, etc) and some of the majorpedestrian improvements such as the Trafalgar Square pedestrianisation come under a separate
budget. Nonetheless that £147m is the budget for local street expenditure and does not include
operating subsidies to rail and bus modes, nor investment in new rail schemes. By contrast,
Barcelona spent over 7% of its total investment in transport (including rail, road and bus) onexisting and new pedestrian schemes2.
Despite the importance of walking as a means of transport and the need to encourage morewalking for environmental, health and socio-economic reasons, the funding received by
walking projects is dwarfed by expenditure on hard modes such as road and rail. This papersuggests that one reason why rail, bus and highway infrastructure projects receive so muchmore funding in the UK is that there are established scheme appraisals to measure their
economic impacts. Officials can see a summary of the project that gives a value for the
economic returns and how these compare to other projects. No such agreed, appraisal method
exists for walking schemes.
The only benefits of walking schemes in the UK that are regularly estimated are the effects of
improvements on accidents and the value of these. Appraisals of other modes typically focuson user benefits: time savings and improvements in quality (comfort, reliability, security) and
crucially monetary values are placed upon those measures. Other impacts on support for
policy objectives or environmental benefits may be quantified or at least identified, but rarelyhave a value placed upon them.
We argue that it would be much easier to justify funding for walking schemes if they wereable to demonstrate economic benefits that could be compared to other transport schemes.
This requires an agreed, quantitative evaluation of all of the benefits of walking.
1 Borough Spending Plan Submission Guidance 2005/6 – 2007/8, Transport for London 20042 Making London a Walkable City, TfL 2004

8/8/2019 Measuring the Benefits of Pedestrian Improvements
http://slidepdf.com/reader/full/measuring-the-benefits-of-pedestrian-improvements 5/12
In response to the 2002 annual local transport funding bid for London's Strategic Walk Network, Transport for London (TfL) requested a more rigorous economic evaluation of the
proposals. The Corporation of London appointed Colin Buchanan & Partners to assess the
economic benefits of improvements to a network of Strategic Walks around the Capital. Thispaper explains the approach that was developed and how it was applied.
The proposals
The Strategic Walk Network (SWN) comprises six core paths, totalling 533km and crossing
all 33 London boroughs. The routes are the London Loop, Capital Ring, Thames Path, Jubilee
Walkway, South East London Green Chain and the Lea Valley Walk. The paths range fromrural trails around the edge of London to teeming city streets that feature some of London's
most popular attractions. A great variety of journeys takes place on these walkways, with a
multitude of journey purposes, locations and uses, each of which poses questions forvaluation. This diversity of use, demand for and the environment around the walks makes
them ideal for forming and testing an economic evaluation of walking, one which could be
applied to improvements and new walkways alike.
The Strategic Walks have been designed and managed as flagship projects with the intention
of demonstrating best practice in footway management. The walks have been designed to
address traditional deterrents to walking through the provision of:
• good on site signage;
• interpretation and practical maps to key destinations;
• accessible footways and paths that are in good condition and well lit;
• resting places at appropriate intervals;
• road crossings; and
• promotion and events that entice and fulfil expectations of a quality experience.
Improving the walkways does not consist of one large scheme, but rather the combined output
of many small projects that address problems on pedestrian routes. Through consultation withlocal authorities, route managers for the Strategic Walks established seven categories of
scheme improvement for which funding was requested, namely: signage and way-marking,
on-site information, off-site information, surfacing improvements, road crossings, safety andsecurity, and resting places and benches. In total, the Strategic Walk Network applied for
£10.7 million of funding over three years and the proposed expenditure in each category is
shown in Table 1 below.
8/8/2019 Measuring the Benefits of Pedestrian Improvements
http://slidepdf.com/reader/full/measuring-the-benefits-of-pedestrian-improvements 6/12
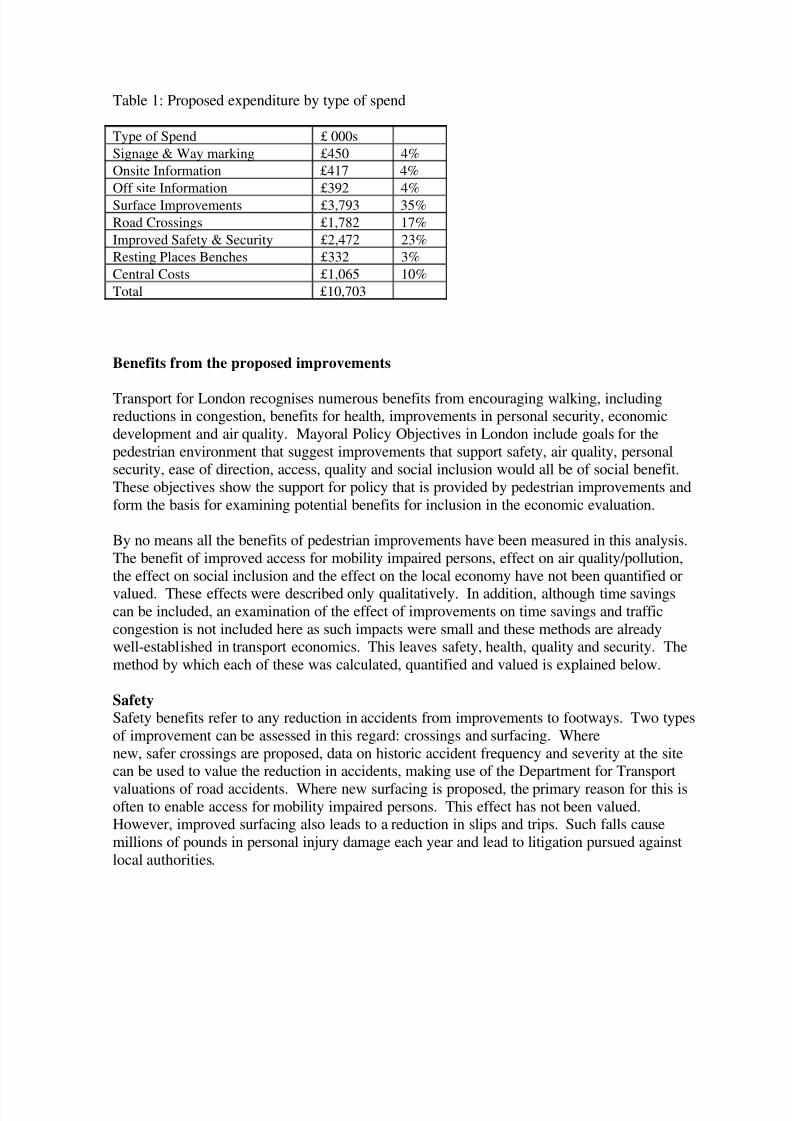
Table 1: Proposed expenditure by type of spend
Type of Spend £ 000s
Signage & Way marking £450 4%
Onsite Information £417 4%
Off site Information £392 4%
Surface Improvements £3,793 35%
Road Crossings £1,782 17%
Improved Safety & Security £2,472 23%
Resting Places Benches £332 3%
Central Costs £1,065 10%
Total £10,703
Benefits from the proposed improvements
Transport for London recognises numerous benefits from encouraging walking, includingreductions in congestion, benefits for health, improvements in personal security, economic
development and air quality. Mayoral Policy Objectives in London include goals for the
pedestrian environment that suggest improvements that support safety, air quality, personalsecurity, ease of direction, access, quality and social inclusion would all be of social benefit.
These objectives show the support for policy that is provided by pedestrian improvements and
form the basis for examining potential benefits for inclusion in the economic evaluation.
By no means all the benefits of pedestrian improvements have been measured in this analysis.
The benefit of improved access for mobility impaired persons, effect on air quality/pollution,
the effect on social inclusion and the effect on the local economy have not been quantified or
valued. These effects were described only qualitatively. In addition, although time savingscan be included, an examination of the effect of improvements on time savings and traffic
congestion is not included here as such impacts were small and these methods are alreadywell-established in transport economics. This leaves safety, health, quality and security. The
method by which each of these was calculated, quantified and valued is explained below.
Safety Safety benefits refer to any reduction in accidents from improvements to footways. Two types
of improvement can be assessed in this regard: crossings and surfacing. Where
new, safer crossings are proposed, data on historic accident frequency and severity at the sitecan be used to value the reduction in accidents, making use of the Department for Transport
valuations of road accidents. Where new surfacing is proposed, the primary reason for this isoften to enable access for mobility impaired persons. This effect has not been valued.However, improved surfacing also leads to a reduction in slips and trips. Such falls cause
millions of pounds in personal injury damage each year and lead to litigation pursued against
local authorities.

8/8/2019 Measuring the Benefits of Pedestrian Improvements
http://slidepdf.com/reader/full/measuring-the-benefits-of-pedestrian-improvements 7/12
Health Health benefits occur as a result of pedestrian improvements when the measures encourage
new or existing users who were previously inactive or only occasionally active to increase the
amount of physical activity that they regularly undertake. As shown in Figure 1 increasingphysical activity leads to reduction in mortality.
Figure 1: Physical activity and age-adjusted mortality in older men
Source: S Goya Wannamethee, A Gerald Shaper, Mary Walker , Changes in physical activity,mortality, and incidence of coronary heart disease in older men, Lancet, Volume 351 Issue
9116
Quality
Quality benefits refer to the welfare created by improving the experience of walking. Sincewalking is a public good, there is no fee for the quality of experience. However, users clearly
place a value on this. In order to efficiently allocate expenditure, it is important to take
account of how the value varies by type, location, use, etc. As a result, the effect of improvements on quality is extremely important.
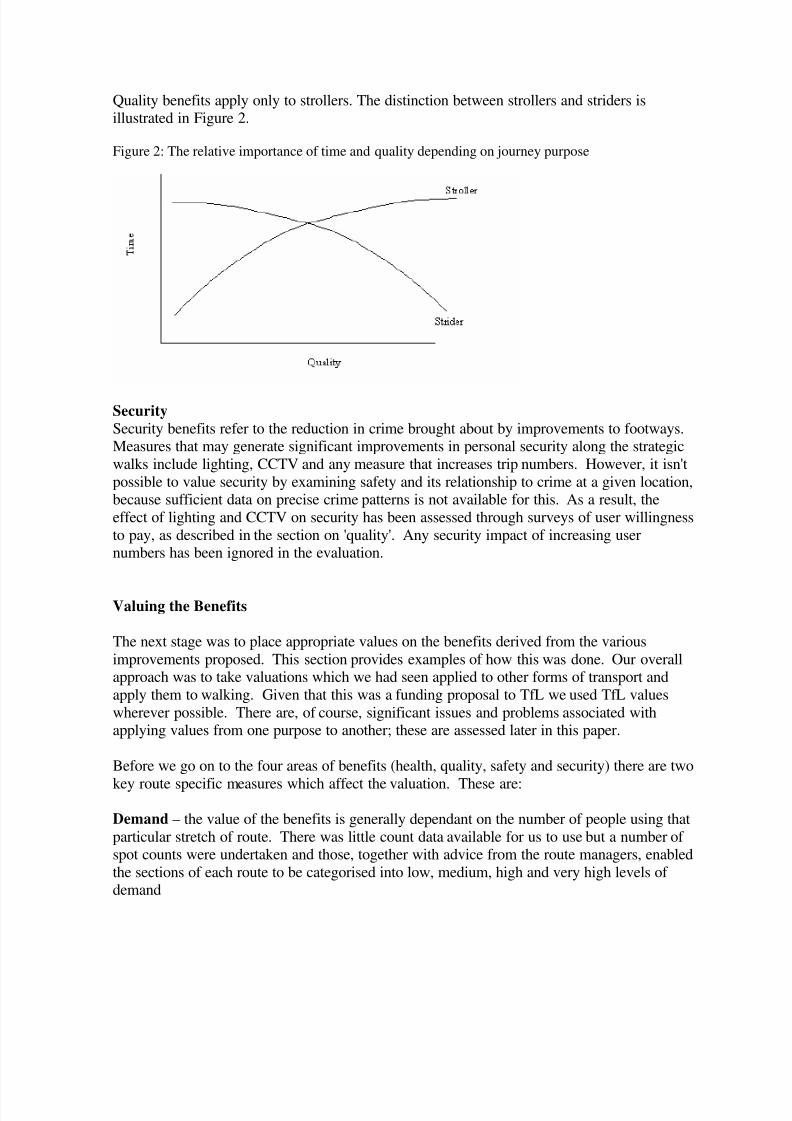
All pedestrians value the quality of the walking environment and the time it takes to completetheir journey but they vary in the weight they attach to each. The trade-off between these
depends upon journey purpose. Someone in a hurry to reach a destination is unlikely to take
‘the scenic route’, someone out for a Sunday stroll is less likely to take a short-cut. Hence, we
distinguish between two types of pedestrian, the strider and the stroller. The strider prioritisestime savings over the quality of the walk, the stroller prefers a nice environment and is
unconcerned with the time it takes to reach a destination (there may not even be a destination).
8/8/2019 Measuring the Benefits of Pedestrian Improvements
http://slidepdf.com/reader/full/measuring-the-benefits-of-pedestrian-improvements 8/12
Quality benefits apply only to strollers. The distinction between strollers and striders isillustrated in Figure 2.
Figure 2: The relative importance of time and quality depending on journey purpose
Security Security benefits refer to the reduction in crime brought about by improvements to footways.Measures that may generate significant improvements in personal security along the strategic
walks include lighting, CCTV and any measure that increases trip numbers. However, it isn't
possible to value security by examining safety and its relationship to crime at a given location,because sufficient data on precise crime patterns is not available for this. As a result, the
effect of lighting and CCTV on security has been assessed through surveys of user willingness
to pay, as described in the section on 'quality'. Any security impact of increasing usernumbers has been ignored in the evaluation.
Valuing the Benefits
The next stage was to place appropriate values on the benefits derived from the various
improvements proposed. This section provides examples of how this was done. Our overallapproach was to take valuations which we had seen applied to other forms of transport and
apply them to walking. Given that this was a funding proposal to TfL we used TfL values
wherever possible. There are, of course, significant issues and problems associated withapplying values from one purpose to another; these are assessed later in this paper.
Before we go on to the four areas of benefits (health, quality, safety and security) there are two
key route specific measures which affect the valuation. These are:
Demand – the value of the benefits is generally dependant on the number of people using that
particular stretch of route. There was little count data available for us to use but a number of spot counts were undertaken and those, together with advice from the route managers, enabled
the sections of each route to be categorised into low, medium, high and very high levels of demand
8/8/2019 Measuring the Benefits of Pedestrian Improvements
http://slidepdf.com/reader/full/measuring-the-benefits-of-pedestrian-improvements 9/12
Strider/stroller split – no information was available on the trip purpose of walkers but thesplit between striders and strollers was important for our approach to valuing benefits.
Estimates were made based largely on the density of the built environment and interviews with
the route managers. Thus the high demand central routes such as the Jubilee Walkway wereassumed to have a higher proportion of Striders than the low demand semi-rural routes such as
the London Loop.
Surveys have been agreed to overcome these data deficiencies and are about to be undertaken,but the evaluation had to be based on the somewhat limited information we had available atthe time. Given the demand and purpose assumptions above benefits were then determined as
follows.
Safety
These benefits were about the reduced likelihood of trips or falls following measures to
improve surfacing. Data from a single London borough on incidence of claims for pedestrian
injuries were used to determine the change in accident rates from surfacing improvements.These data were analysed and used to identify the impacts of changes from complete
resurfacing to removing specific ‘spot conditions’ (surveys of the SWN had already identified
the number of ‘spot conditions’ per km).
Valuation then depended largely on the number of users. The value of removing a ‘spot
condition’ was found to vary between £300 on a low demand rural section of route to £3,000
on a high demand central section.
Health
These were probably the most controversial benefits. Although governments are happy tomake pronouncements about the dangers of obesity and the health benefits of walking, placing
a value on additional walking seems more controversial. Given the uncertainties inherent in
any approach, we adopted what seemed very conservative assumptions:
• We assumed that health benefits only accrued to new regular users, not to existing.New users were generated by leaflets, marketing, off-site information and the
improvements themselves.
• Of forecast new users, we assumed that only those who were previously classified as
“inactive” (5% of the population) and “occasionally active” (27%) would benefit.
• As the data on health improvements were only for people aged 52-72 we then assumedthat only those ages would benefit.
• Each new regular user was assumed to move up one level of activity because of their
new walking activity (from “inactive” to “occasionally active” and from “occasionallyactive” to “lightly active”)
• That gave a change in mortality rates which was applied to the number of new users of
each category to determine the health benefits.
In fact these benefits were only the benefits of avoiding death; they took no account of
improved quality of life before death, nor of reduced medical expenses from increasedexercise.

8/8/2019 Measuring the Benefits of Pedestrian Improvements
http://slidepdf.com/reader/full/measuring-the-benefits-of-pedestrian-improvements 10/12
Nonetheless, the analysis suggested that measures to promote walking along the route through
signing, leafleting, websites etc generated a significant economic return. Even in the most
lightly used outlying areas there was a positive Benefit:Cost ratio (>1) and in the busiersections this increased to a ratio of 3 or 4.
Quality
This was an area where we saw a clear disparity between the treatment of investment inwalking and that in rail. TfL have agreed measures for valuing “quality” improvements to railservices and stations such as improvements to signing, lighting, seating, information provision
etc based on extensive interviews with passengers. For improvements to walk routes however
there seem to be no equivalent values.
Our approach was therefore to apply London Underground Limited (LUL) values to the
provision of similar facilities for walkers. The process was not simple however. Quality issues
covered waysigns, information panels, benches, cleanliness, graffiti and lighting. These areillustrated by the approach to just one – benches.
For benches we started with the LUL valuation of approximately £0.01 per passenger usingthat platform (the valuation varies according to the standard/existence of facilities prior to the
introduction of a new bench). We then adjusted that value to take account of:
• Longer sitting times for walkers than LUL passengers
• Applied the benefit to strollers only, not striders
• Capped to a realistic maximum number of users per day (on high demand sections)
• Assumed an average life for a bench of 10 years
A similar process was undertaken for each of the different “quality” improvements wherebywe adjusted the LUL valuation to try and make it more appropriate to the improvements
proposed for the SWN.
Security
Security benefits are derived from the introduction of lighting and CCTV along certainsections of the SWN using willingness to pay measures from LUL in the same way. This
approach misses the benefits derived from simply having more people using a specific stretch
of walkway.
Results
The results are fairly complex. Not only do the benefits vary according to location/demand
but so do the costs of particular measures. Thus surfacing improvements to heavily used
routes in the central area use stone paving, whereas improvements to some of the more ruralsections use hoggin (a sand/gravel mix).

8/8/2019 Measuring the Benefits of Pedestrian Improvements
http://slidepdf.com/reader/full/measuring-the-benefits-of-pedestrian-improvements 11/12
In our analysis presented to TfL we produced detailed evaluations of three case studies andthen extrapolated those results to all the proposed elements of expenditure across the whole
SWN. The results for those three case studies combined, split by type of measure, are shown
in Table 2.
Table 2: Average results from the three case studies
Measure SpendYears of
benefits
Benefit
(NPV)BCR
1. Signage/Way marking and links £10,300 5 £26,080 2.53
2. Onsite Information (panels/map
boards/interpretation panels)£11,100 10 £52,599 4.74
3. Offsite Information £4,000 10 £13,952 3.49
4. Improvements to the walked
surface (including accessibility
standards)
£166,125 10 £168,612 1.01
5. Improved Safety & Security £62,000 10 £68,072 1.106. Resting Places £8,500 10 £13,641 1.60
Table 2 shows that the information measures designed to encourage additional usage came out
top of this particular evaluation. Improvements to the walked surface provided the lowest
returns.
The results for all the proposed measures split by route are shown in Table 3.
Table 3: Results from all proposed expenditure by route
Spend (£m) BCR Benefit (£m)
Lea Valley £1.03 0.81 £0.84
Thames Path £2.81 1.14 £3.21
Green Chain £1.48 0.92 £1.36
Jubilee Walkway £0.34 2.96 £1.02
Capital Ring £0.74 1.19 £0.88
London Loop £0.79 0.92 £0.72
Total £7.20 1.12 £8.03
This shows the importance of demand to the results. The Jubilee Walkway comes out toplargely because improvements on that route are experienced by millions of trips per year
whereas the more rural routes may only affect 20,000 trips per year (50 people per day).
8/8/2019 Measuring the Benefits of Pedestrian Improvements
http://slidepdf.com/reader/full/measuring-the-benefits-of-pedestrian-improvements 12/12
Conclusions
Our objective when we started the work was to persuade government to allocate additional
money to walking. Our proposed approach to doing this was to try and quantify and value arange of user benefits derived from the proposed expenditure. Walking proposals typically
talk about improving quality but say little about user benefits. The only benefits that arecommonly valued are accident savings.
We are well aware that what we have prepared is at best a partial analysis, but we hope it isless partial than other approaches. Trying to value user benefits was a deliberate strategy
because it is user benefits that tend to form the justification for major investments in rail and
road schemes. The valuations that we have applied have been based on less data than we
would have liked and that has led us to make a number of conservative assumptions on howthe improvements are valued. The analysis has ignored many of the wider benefits that might
be expected to be derived from investment in walk routes such as environmental gains,
benefits to local economies, improvements to accessibility and social inclusion.
The lack of data available on demand, journey purpose and attitudes of users of what are
“flagship” walk routes within the UK is probably indicative of the attitude to walkinggenerally and certainly indicative of the lack of appraisal of investments in walking. It is
inconceivable that a bus or rail or highway route carrying similar numbers of users would not
be regularly surveyed and potential improvements assessed.
Our analysis was praised by TfL as being a significant step forward and the SWN was granted
a substantial share of total expenditure on walking, although given the nature of budget
allocations, that was at the expense of other walking projects rather than adding to the amountof money spent on walking as a whole.
Part of the money allocated to the SWN was assigned to undertake some user surveys both of numbers of users and attitudes of those users. Those surveys are currently underway and will
enable us to refine some of the assumptions that we have made. It is planned that those
surveys should be undertaken regularly which would then enable us to monitor the success of the proposed measures both in terms of generating additional usage and improving user
satisfaction with the routes themselves.
Acknowledgements
Our thanks go to the Corporation of London and especially to Jim Walker and Gary Cliffe fortheir involvement, enthusiasm and knowledge. The opinions expressed in this paper remain
those of the authors alone.


![BICYCLE AND PEDESTRIAN IMPROVEMENTS · 2019. 7. 29. · Additional improvements to bicycle-pedestrian connections on south side of Glenwood Bridge [See Detail Board] Hays Interchange](https://static.fdocuments.in/doc/165x107/6064909e287ff0278d527019/bicycle-and-pedestrian-improvements-2019-7-29-additional-improvements-to-bicycle-pedestrian.jpg)