Measurement & Scaling Dr. Surej P John. Comparative Scaling.
44
Measurement & Measurement & Scaling Scaling Dr. Surej P John
-
Upload
theodore-ball -
Category
Documents
-
view
248 -
download
5
Transcript of Measurement & Scaling Dr. Surej P John. Comparative Scaling.
Measurement & ScalingMeasurement & Scaling
Dr. Surej P John
Comparative ScalingComparative Scaling
• Scale– A quantifying measure – a combination of items that
is progressively arranged according to value or magnitude.
– Purpose is to quantitatively represent an item’s, person’s, or event’s place in the scaling continuum.
Some Key Concepts
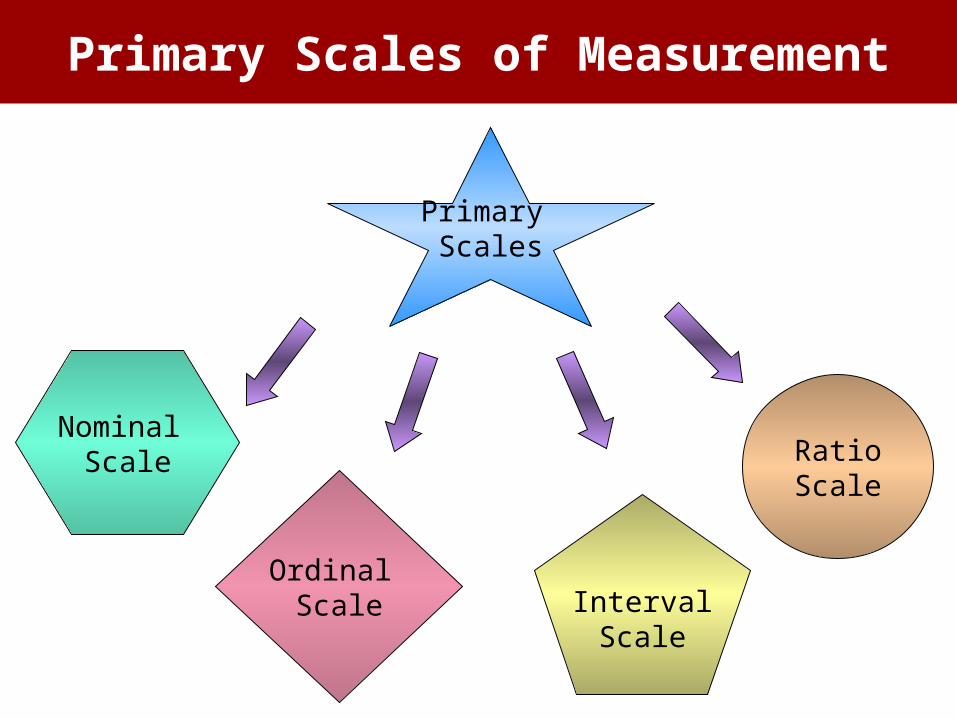
Primary Scales
Nominal Scale
Ordinal Scale
RatioScale
IntervalScale
Primary Scales of Measurement
• Nominal– A scale in which the numbers or letters
assigned to objects serve as labels for identification or classification.
• Ordinal– A scale that arranges objects or
alternatives according to their magnitude in an ordered relationship.
Primary Scales of Measurement
• Interval– A scale that both arranges objects
according to their magnitudes and
– Distinguishes the ordered arrangement in units of equal intervals
– I.e., indicate order and measure order (or distance) in units of equal intervals
Primary Scales of Measurement
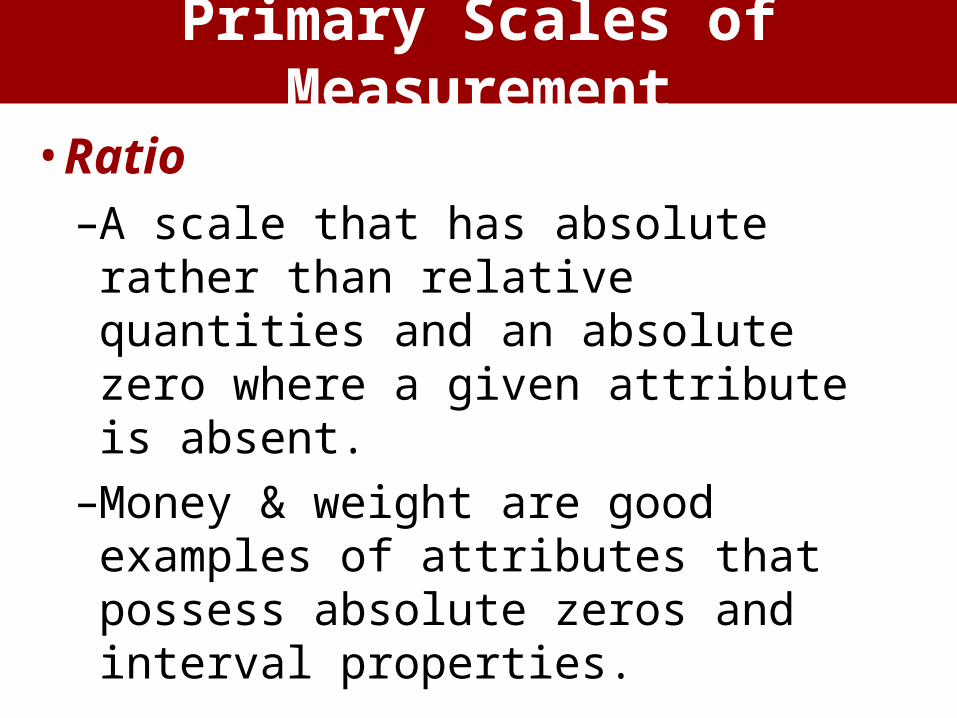
• Ratio–A scale that has absolute rather than
relative quantities and an absolute zero where a given attribute is absent.
–Money & weight are good examples of attributes that possess absolute zeros and interval properties.
Primary Scales of Measurement
Example:
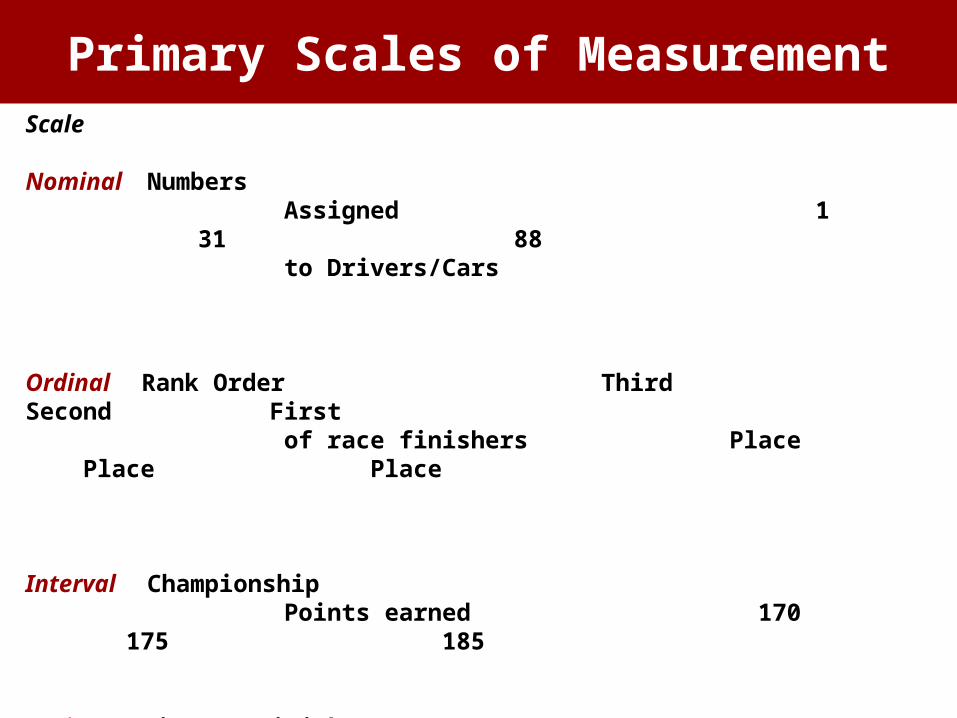
Scale
Nominal Numbers Assigned 1 31 88 to Drivers/Cars
Ordinal Rank Order Third Second First of race finishers Place Place Place
Interval Championship Points earned 170 175 185
Ratio Time to Finish, behind winner 5.1 2.3 0.0
Primary Scales of Measurement
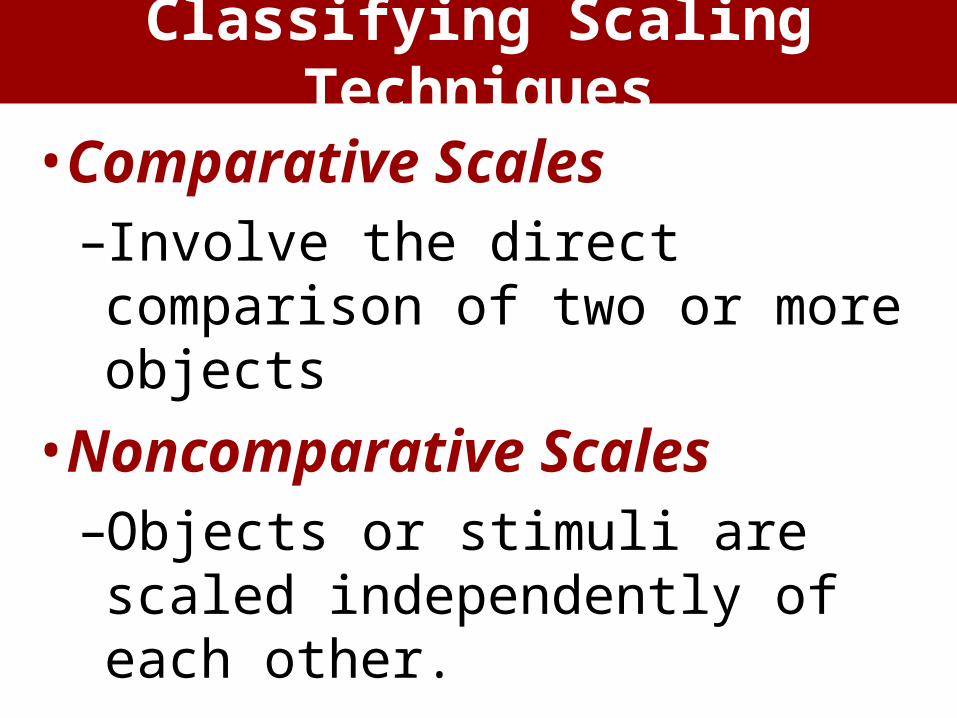
• Comparative Scales–Involve the direct comparison of
two or more objects
• Noncomparative Scales–Objects or stimuli are scaled
independently of each other.
Classifying Scaling Techniques
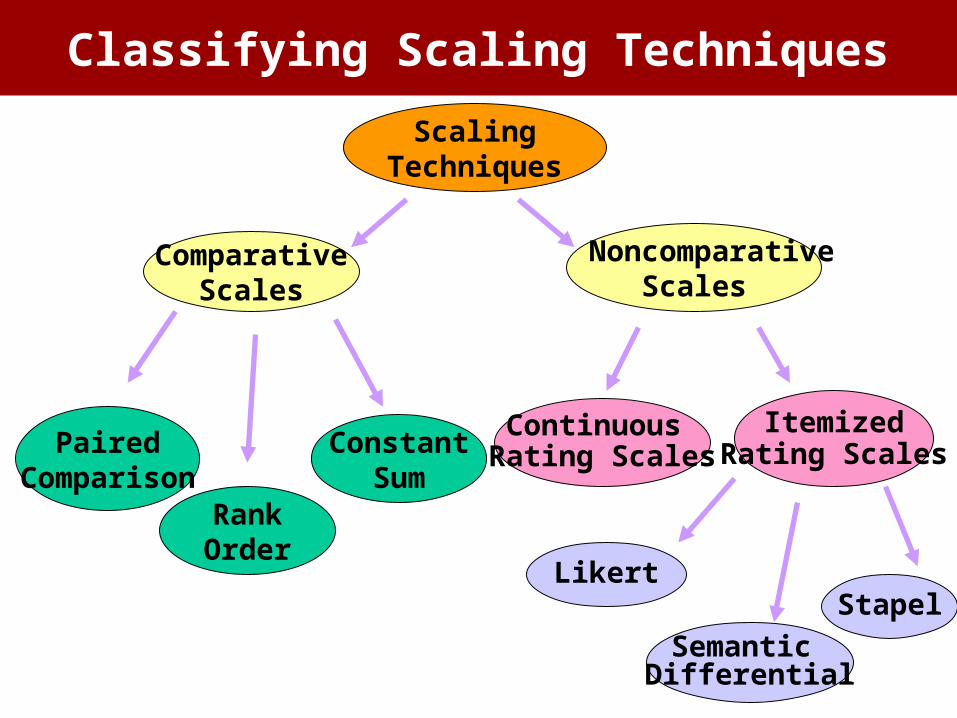
ScalingTechniques
ComparativeScales
PairedComparison
ConstantSum
RankOrder
NoncomparativeScales
ItemizedRating Scales
Continuous Rating Scales
Likert
Semantic Differential
Stapel
Classifying Scaling Techniques
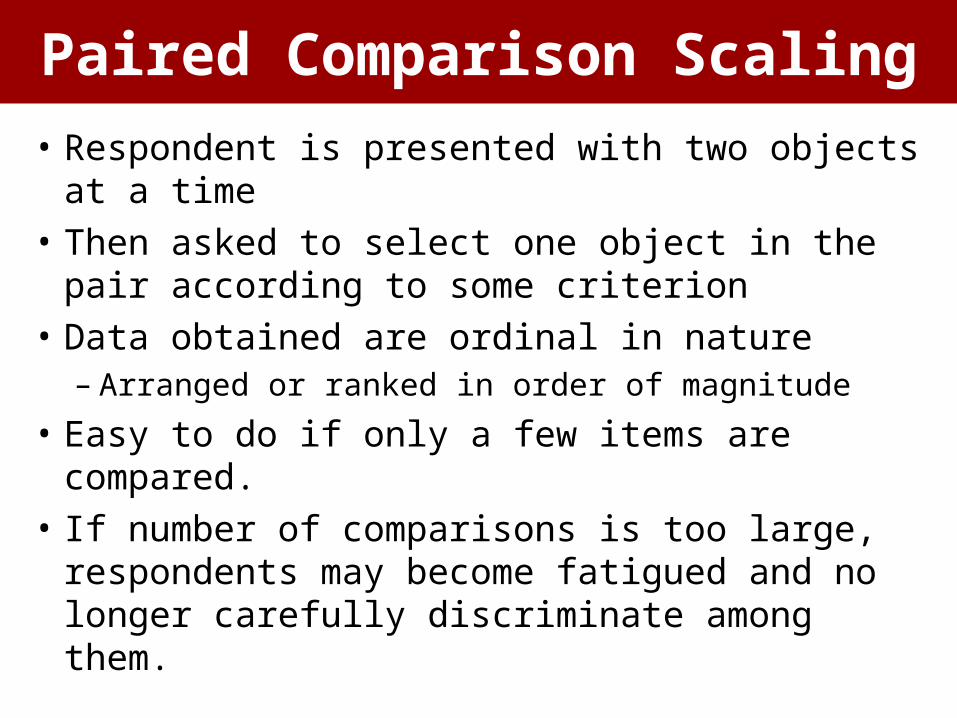
• Respondent is presented with two objects at a time
• Then asked to select one object in the pair according to some criterion
• Data obtained are ordinal in nature– Arranged or ranked in order of magnitude
• Easy to do if only a few items are compared.
• If number of comparisons is too large, respondents may become fatigued and no longer carefully discriminate among them.
Paired Comparison Scaling
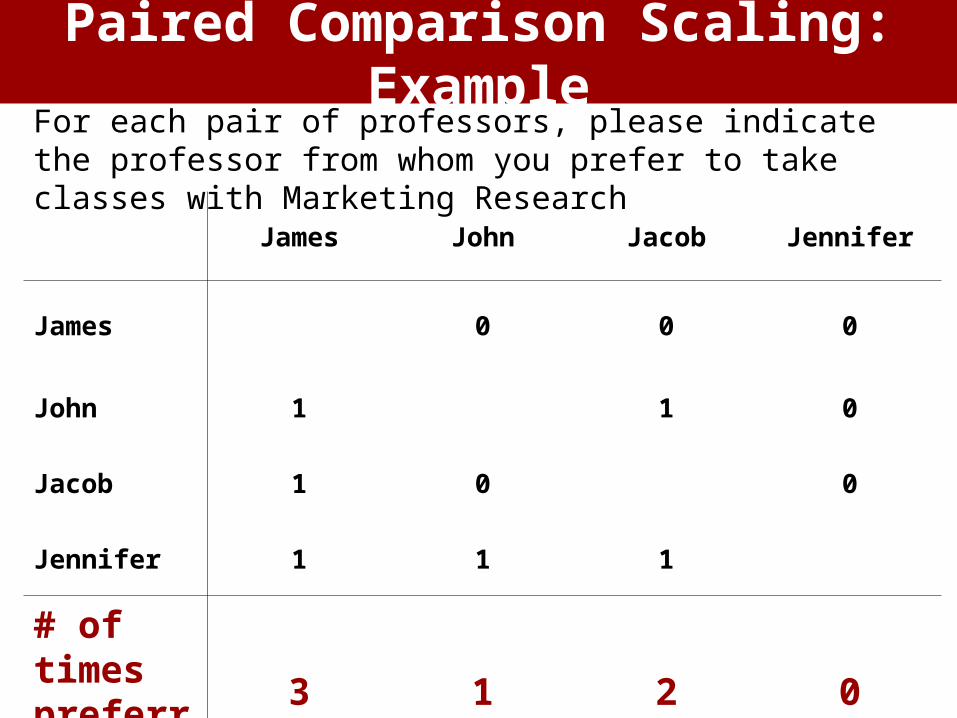
Paired Comparison Scaling: Example
James John Jacob Jennifer
James 0 0 0
John 1 1 0
Jacob 1 0 0
Jennifer 1 1 1
# of times preferred
3 1 2 0
For each pair of professors, please indicate the professor from whom you prefer to take classes with Marketing Research
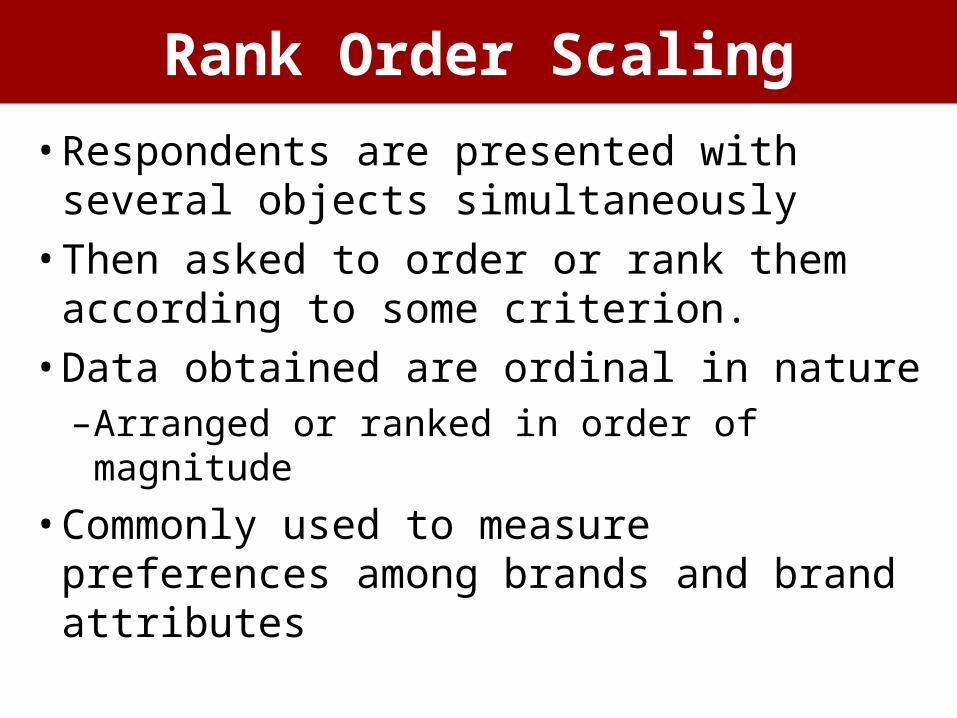
• Respondents are presented with several objects simultaneously
• Then asked to order or rank them according to some criterion.
• Data obtained are ordinal in nature– Arranged or ranked in order of magnitude
• Commonly used to measure preferences among brands and brand attributes
Rank Order Scaling
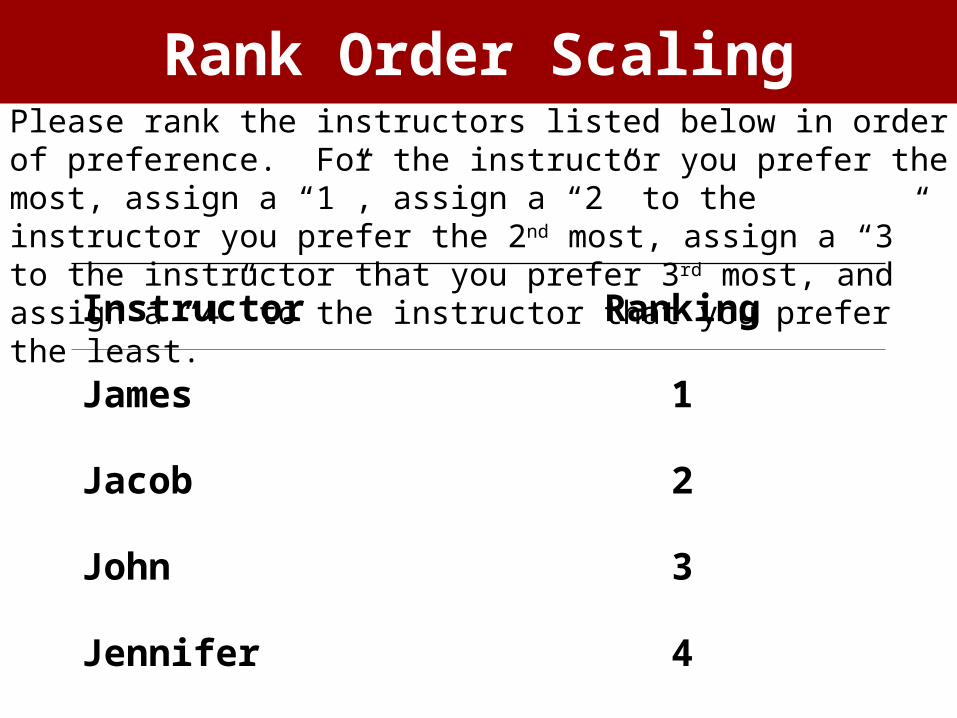
Rank Order Scaling
Instructor Ranking
James 1
Jacob 2
John 3
Jennifer 4
Please rank the instructors listed below in order of preference. For the instructor you prefer the most, assign a “1”, assign a “2” to the instructor you prefer the 2nd most, assign a “3” to the instructor that you prefer 3rd most, and assign a “4” to the instructor that you prefer the least.
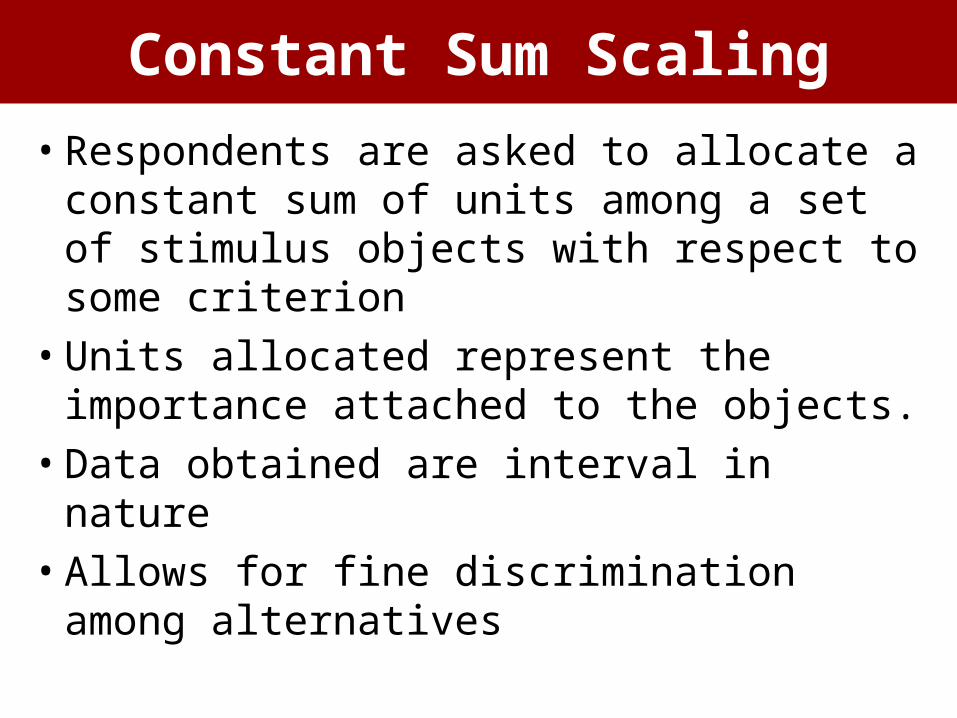
• Respondents are asked to allocate a constant sum of units among a set of stimulus objects with respect to some criterion
• Units allocated represent the importance attached to the objects.
• Data obtained are interval in nature
• Allows for fine discrimination among alternatives
Constant Sum Scaling
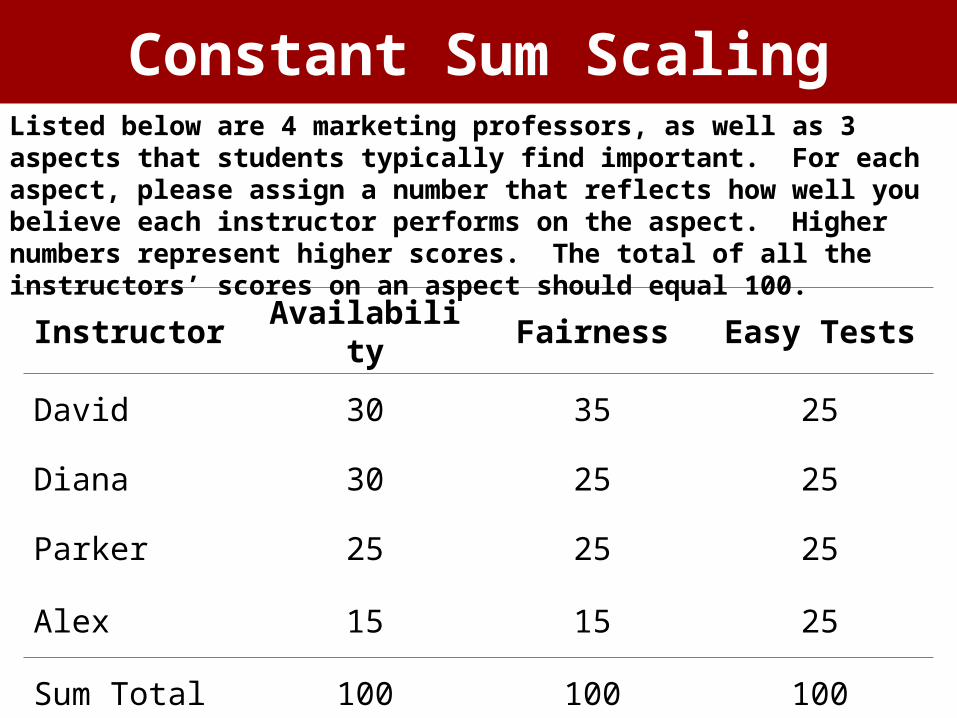
Constant Sum Scaling
Instructor Availability Fairness Easy Tests
David 30 35 25
Diana 30 25 25
Parker 25 25 25
Alex 15 15 25
Sum Total 100 100 100
Listed below are 4 marketing professors, as well as 3 aspects that students typically find important. For each aspect, please assign a number that reflects how well you believe each instructor performs on the aspect. Higher numbers represent higher scores. The total of all the instructors’ scores on an aspect should equal 100.
Non-Comparative ScalingNon-Comparative Scaling
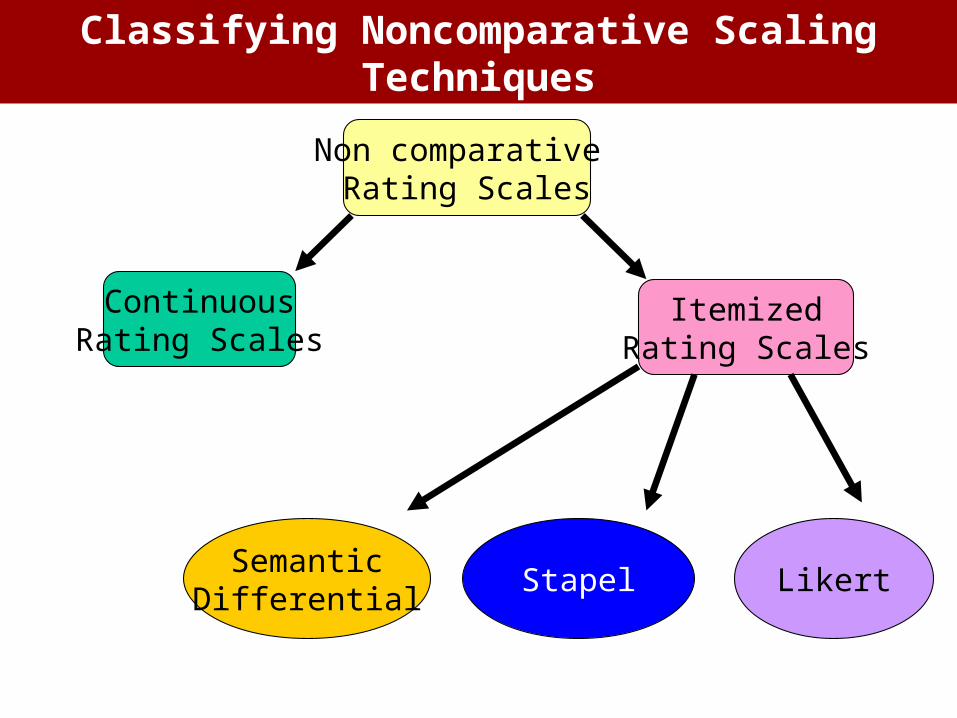
Likert
Non comparative Rating Scales
ContinuousRating Scales
ItemizedRating Scales
SemanticDifferential
Stapel
Classifying Noncomparative Scaling Techniques
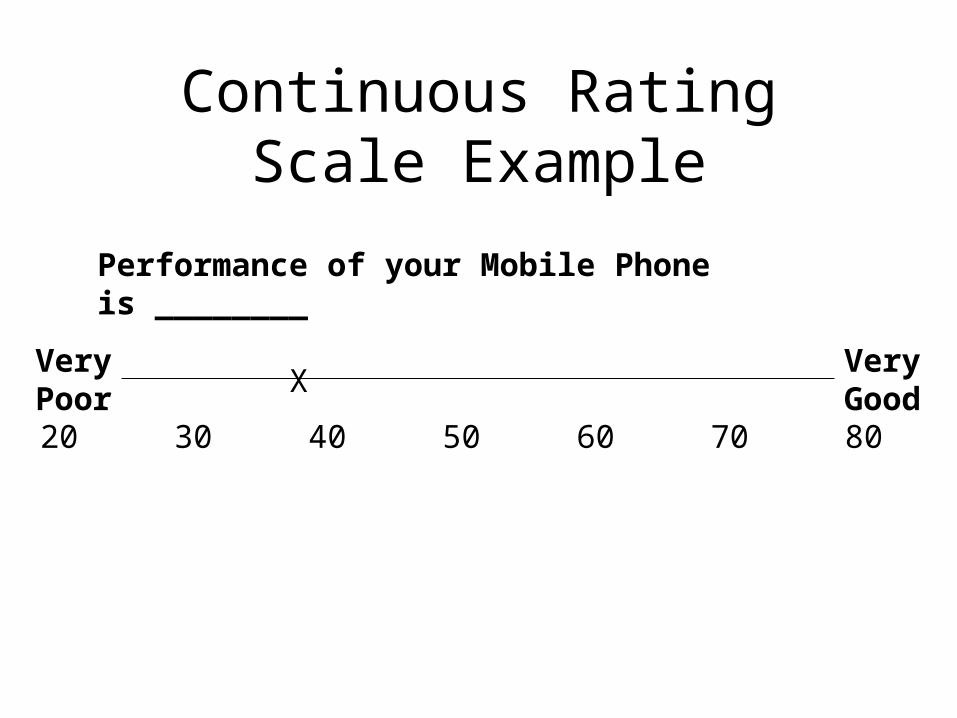
Continuous Rating Scale Example
VeryGood
VeryPoor
0 10 20 30 40 50 60 70 80 90 100
X
Performance of your Mobile Phone is ________
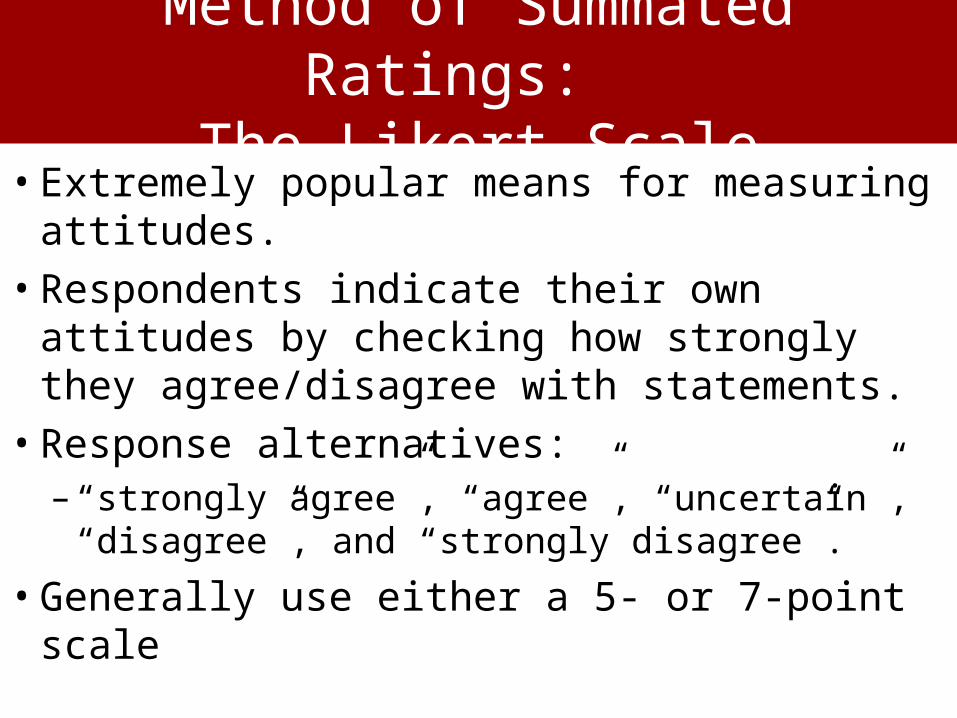
Method of Summated Ratings: The Likert Scale
• Extremely popular means for measuring attitudes.
• Respondents indicate their own attitudes by checking how strongly they agree/disagree with statements.
• Response alternatives: – “strongly agree”, “agree”, “uncertain”,
“disagree”, and “strongly disagree”.
• Generally use either a 5- or 7-point scale
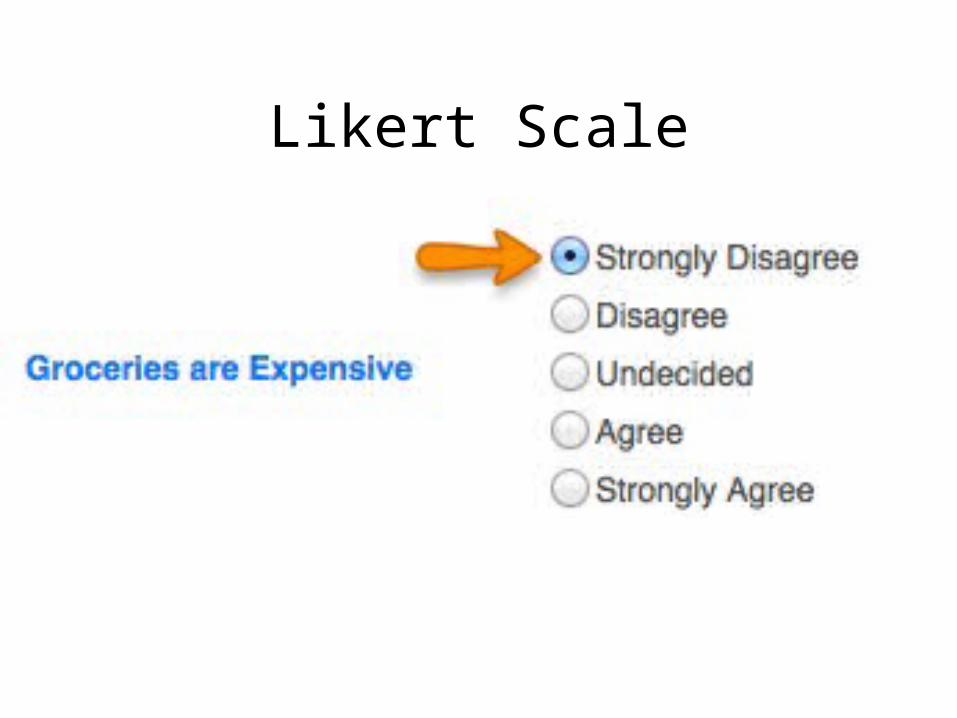
Likert Scale
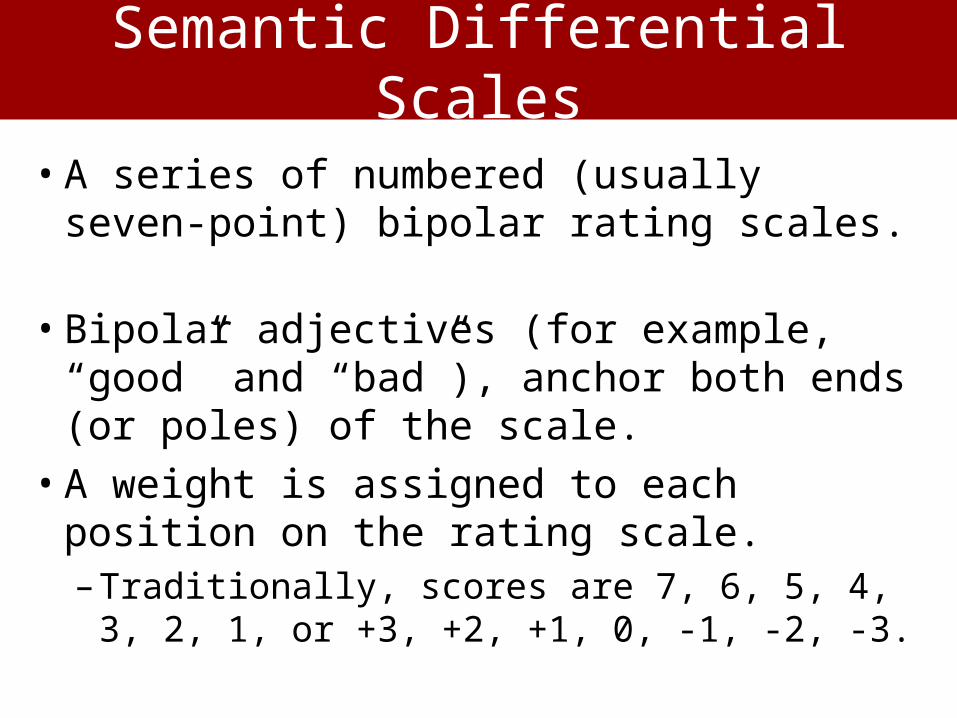
Semantic Differential Scales
• A series of numbered (usually seven-point) bipolar rating scales.
• Bipolar adjectives (for example, “good” and “bad”), anchor both ends (or poles) of the scale.
• A weight is assigned to each position on the rating scale. – Traditionally, scores are 7, 6, 5, 4, 3, 2, 1, or
+3, +2, +1, 0, -1, -2, -3.
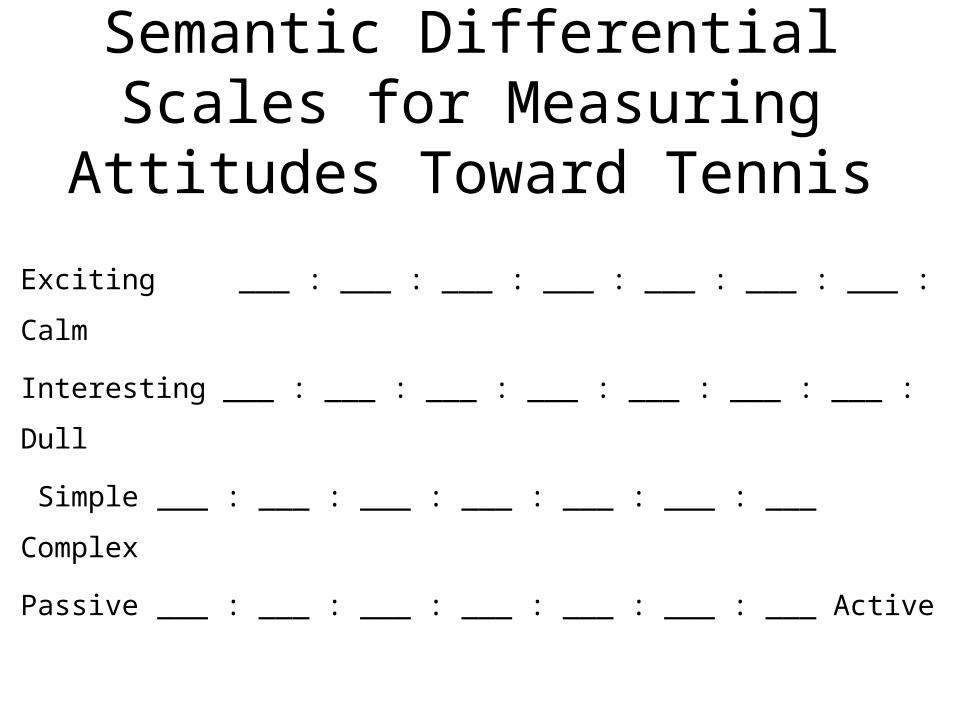
Semantic Differential Scales for Measuring Attitudes Toward Tennis
Exciting ___ : ___ : ___ : ___ : ___ : ___ : ___ : Calm
Interesting ___ : ___ : ___ : ___ : ___ : ___ : ___ : Dull
Simple___ : ___ : ___ : ___ : ___ : ___ : ___ Complex
Passive ___ : ___ : ___ : ___ : ___ : ___ : ___ Active
Stapel Scales
• Modern versions of the Stapel scale place a single adjective as a substitute for the semantic differential when it is difficult to create pairs of bipolar adjectives.
• The advantage and disadvantages of a Stapel scale, as well as the results, are very similar to those for a semantic differential.
• However, the Stapel scale tends to be easier to conduct and administer.
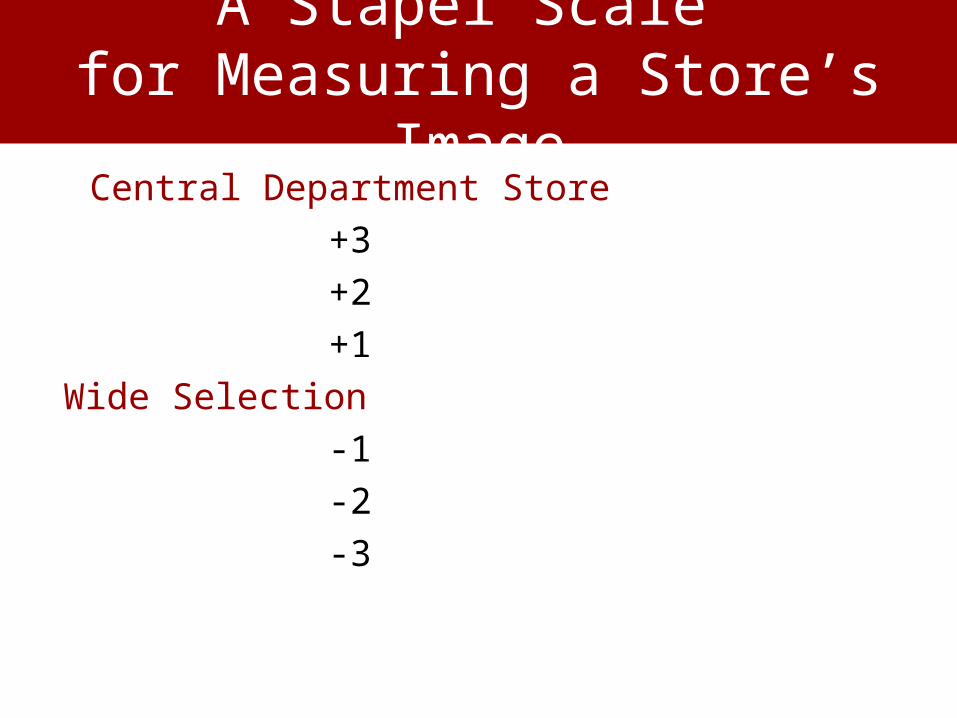
A Stapel Scale for Measuring a Store’s Image
Central Department Store
+3
+2
+1
Wide Selection
-1
-2
-3
Graphic Rating Scales
A graphic rating scale presents respondents with a graphic continuum.
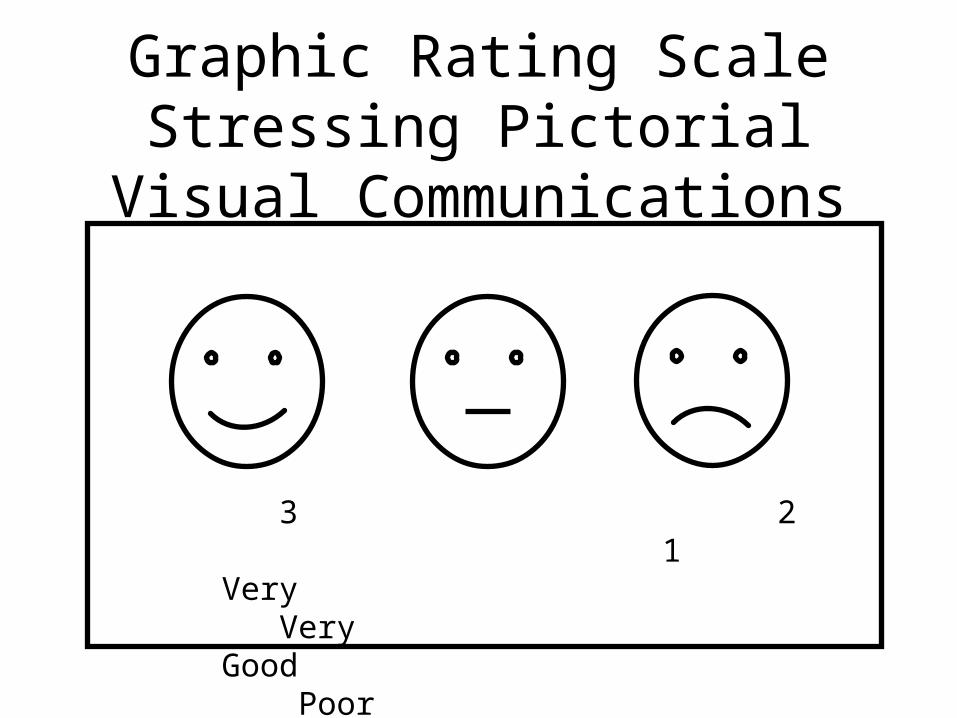
Graphic Rating Scale Stressing Pictorial Visual Communications
3 2 1Very VeryGood Poor
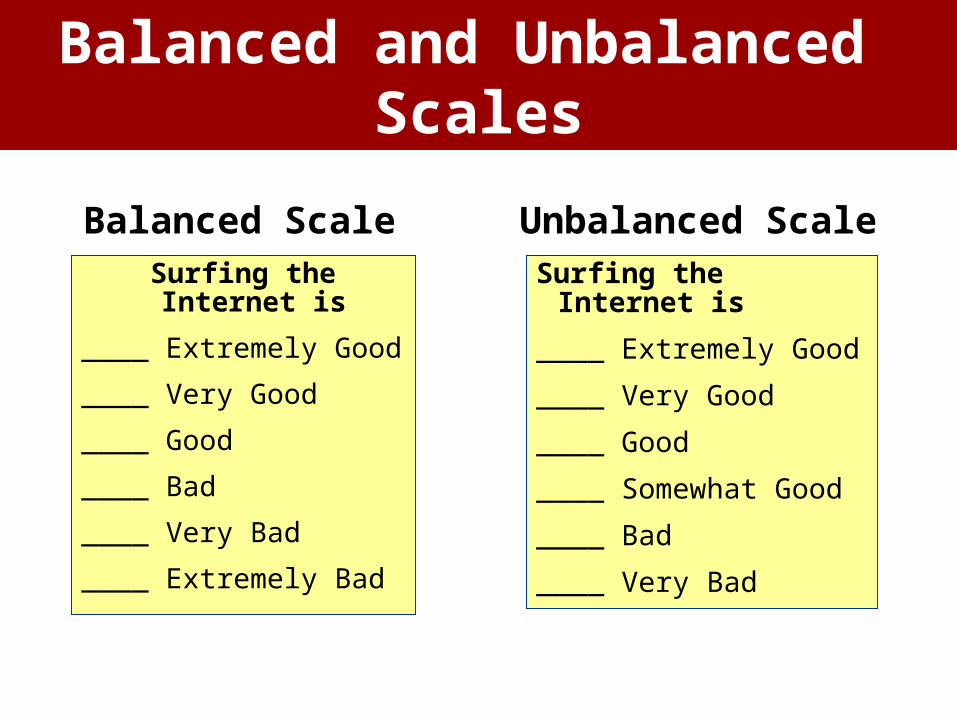
Surfing the Internet is
____ Extremely Good
____ Very Good
____ Good
____ Bad
____ Very Bad
____ Extremely Bad
Surfing the Internet is
____ Extremely Good
____ Very Good
____ Good
____ Somewhat Good
____ Bad
____ Very Bad
Balanced Scale Unbalanced Scale
Balanced and Unbalanced Scales

Questionnaire design
Questionnaire
• A questionnaire is a formalized set of questions for obtaining information from respondents.
• A formal framework consisting of a set of questions and scales designed to generate primary raw data
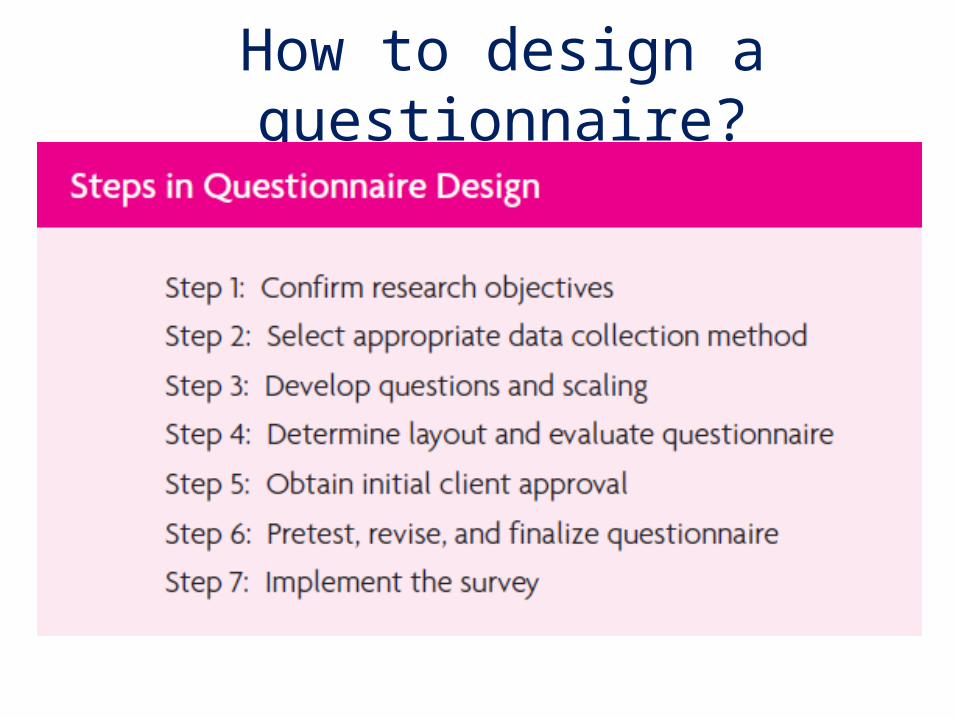
How to design a questionnaire?
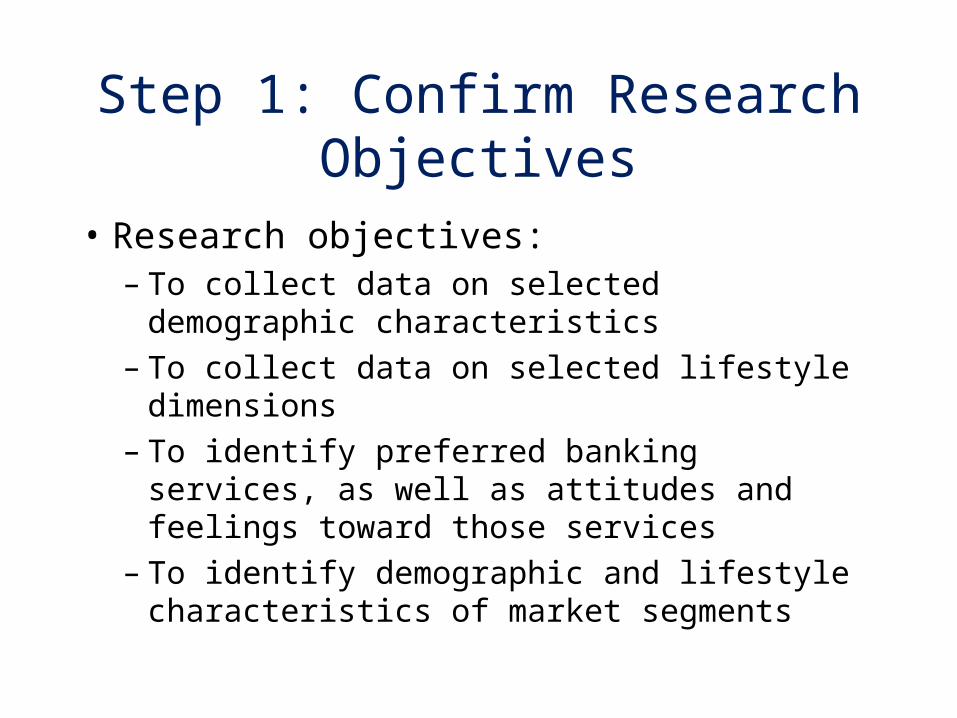
Step 1: Confirm Research Objectives
• Research objectives:– To collect data on selected demographic
characteristics – To collect data on selected lifestyle dimensions– To identify preferred banking services, as well
as attitudes and feelings toward those services– To identify demographic and lifestyle
characteristics of market segments
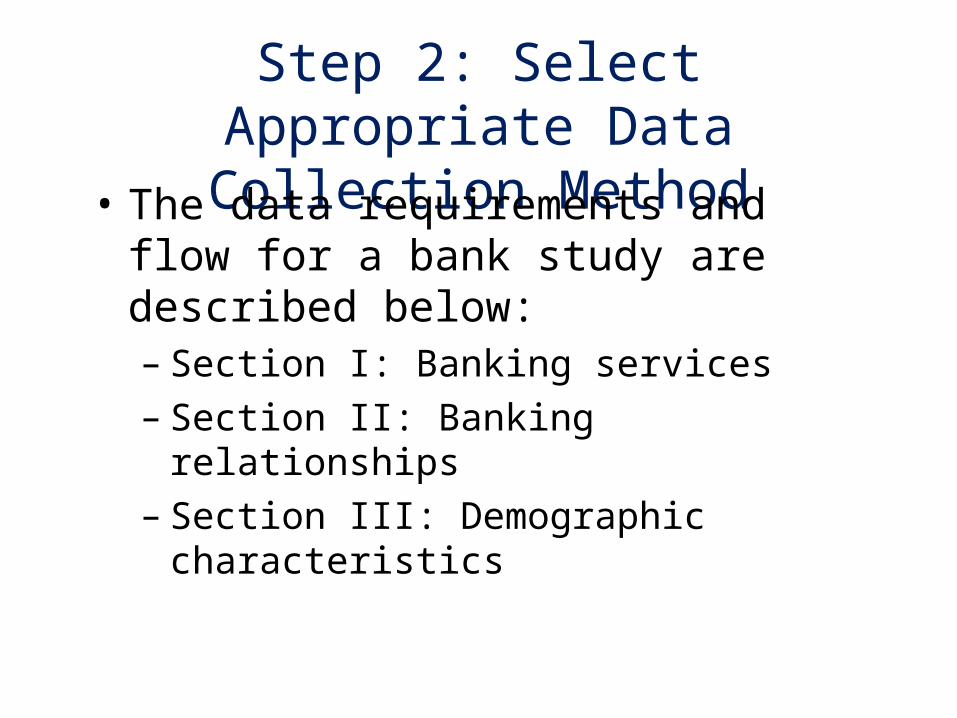
Step 2: Select Appropriate Data Collection Method
• The data requirements and flow for a bank study are described below:– Section I: Banking services– Section II: Banking relationships– Section III: Demographic characteristics
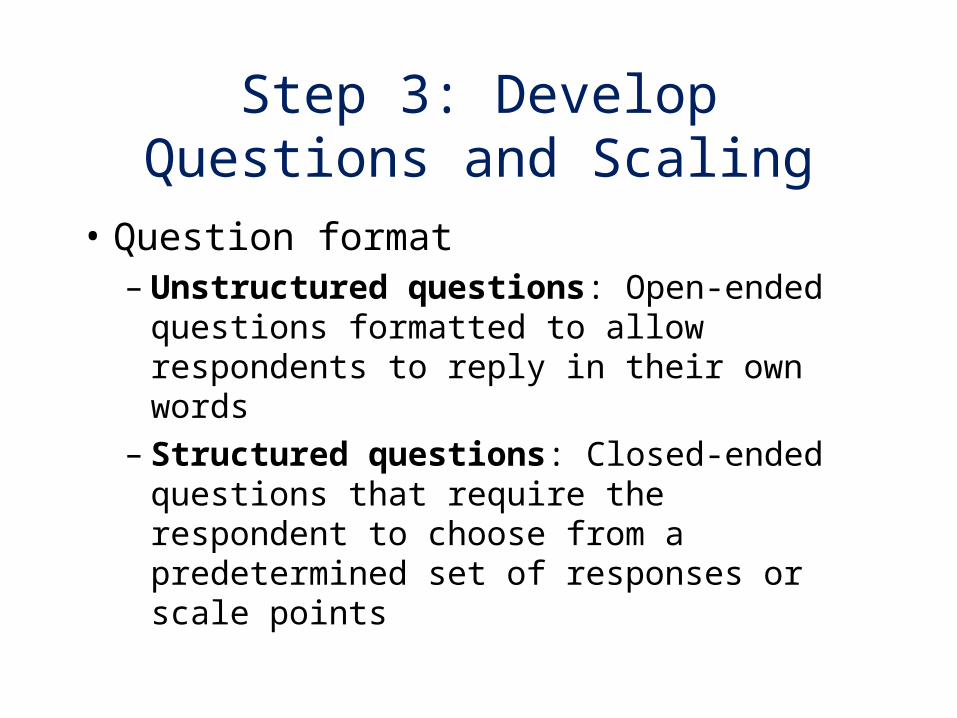
Step 3: Develop Questions and Scaling
• Question format– Unstructured questions: Open-ended
questions formatted to allow respondents to reply in their own words
– Structured questions: Closed-ended questions that require the respondent to choose from a predetermined set of responses or scale points
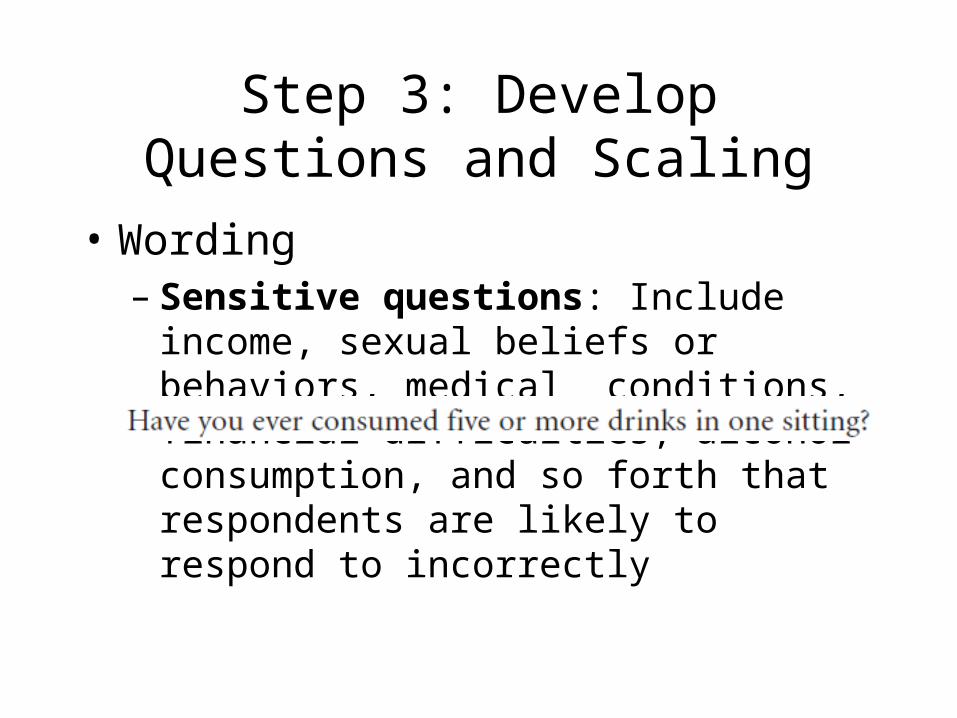
Step 3: Develop Questions and Scaling
• Wording– Sensitive questions: Include income, sexual
beliefs or behaviors, medical conditions, financial difficulties, alcohol consumption, and so forth that respondents are likely to respond to incorrectly
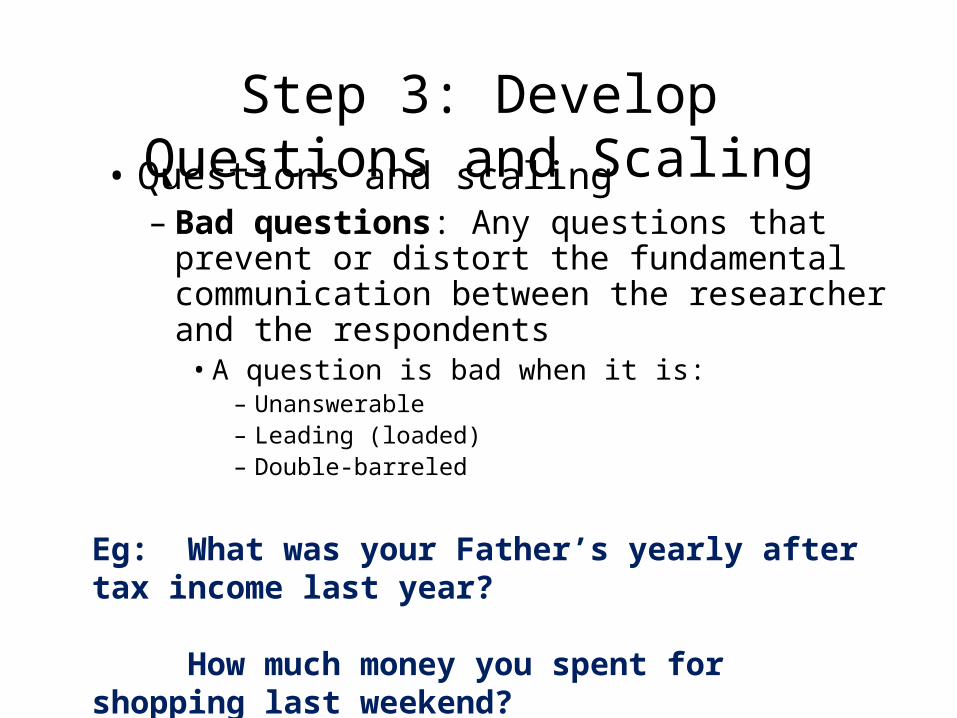
Step 3: Develop Questions and Scaling• Questions and scaling
– Bad questions: Any questions that prevent or distort the fundamental communication between the researcher and the respondents
• A question is bad when it is:– Unanswerable– Leading (loaded)– Double-barreled
Eg: What was your Father’s yearly after tax income last year?
How much money you spent for shopping last weekend?
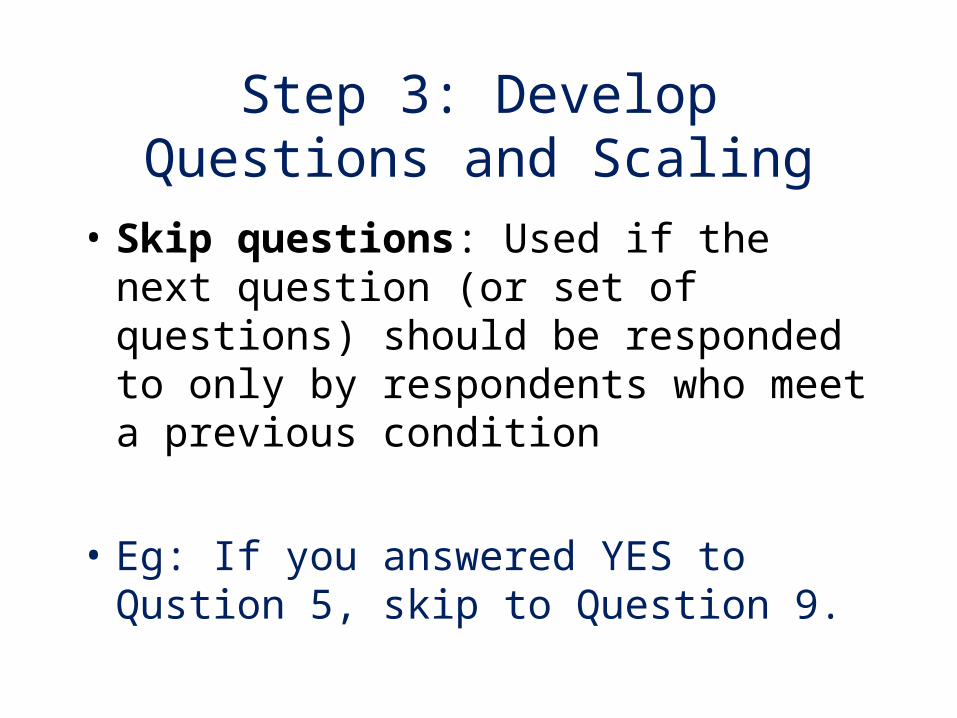
Step 3: Develop Questions and Scaling
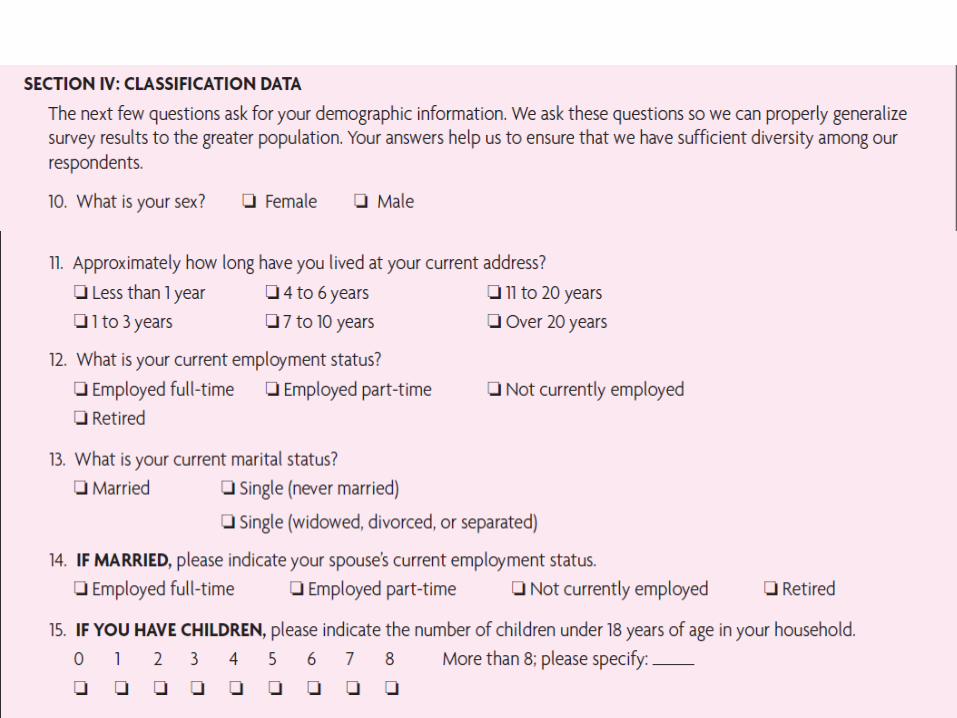
• Skip questions: Used if the next question (or set of questions) should be responded to only by respondents who meet a previous condition
• Eg: If you answered YES to Qustion 5, skip to Question 9.
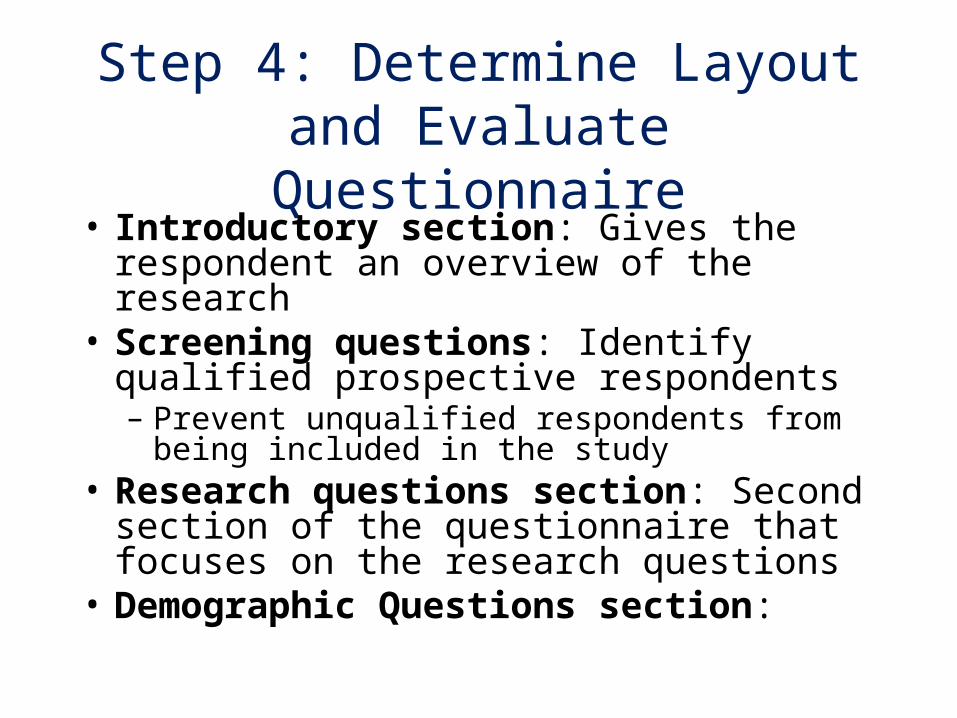
Step 4: Determine Layout and Evaluate Questionnaire
• Introductory section: Gives the respondent an overview of the research
• Screening questions: Identify qualified prospective respondents – Prevent unqualified respondents from being
included in the study• Research questions section: Second section of
the questionnaire that focuses on the research questions
• Demographic Questions section:
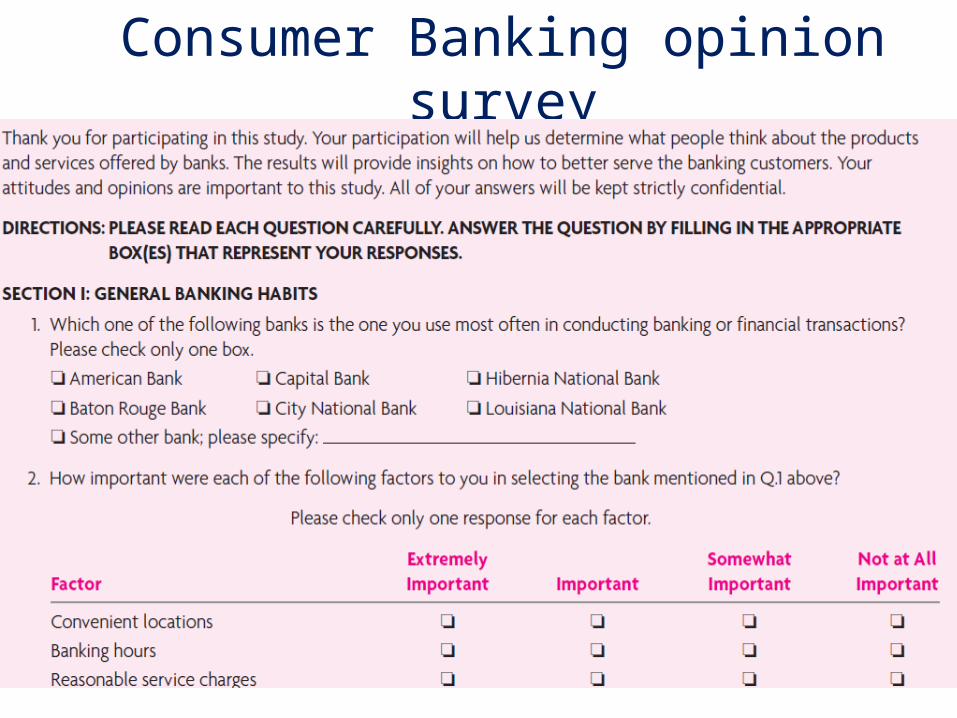
Consumer Banking opinion survey
Step 5: Obtain Initial Client Approval
• Copies of the questionnaire should be given to all parties involved in the project
• Client’s opportunity to provide suggestions of topics overlooked or to ask any questions
Step 6: Pretest, Revise, and Finalize the Questionnaire
• Final evaluation of the questionnaire is obtained from a pretest– Helps the researcher determine:
• How much time respondents will need to complete the survey
• Whether to add or revise instructions
• What to say in the cover letter
Step 7: Implement the Survey
• Focus is on the process followed to collect the data using the agreed-upon questionnaire
• Process varies depending on whether the survey is self-administered or interviewer-completed