Challenges and Opportunities with UGT Enzymes · • In vitro scaling methods • Simple allometric...
50
Challenges and Opportunities with UGT Enzymes Session: Reaction Phenotyping and Prediction of Human Clearance of Non CYP-Mediated Pathways (#214) AAPS Annual Meeting and Exposition 2015, Orlando, FL Monday, 26 th October 2015 Upendra Argikar Analytical Sciences and Imaging Novartis, Cambridge, MA
Transcript of Challenges and Opportunities with UGT Enzymes · • In vitro scaling methods • Simple allometric...
Challenges and Opportunities
with UGT Enzymes
Session: Reaction Phenotyping and Prediction of Human Clearance
of Non CYP-Mediated Pathways (#214)
AAPS Annual Meeting and Exposition 2015, Orlando, FL
Monday, 26th October 2015
Upendra Argikar
Analytical Sciences and Imaging
Novartis, Cambridge, MA
2 AAPS Annual Meeting 2015 / UGT / Upendra Argikar
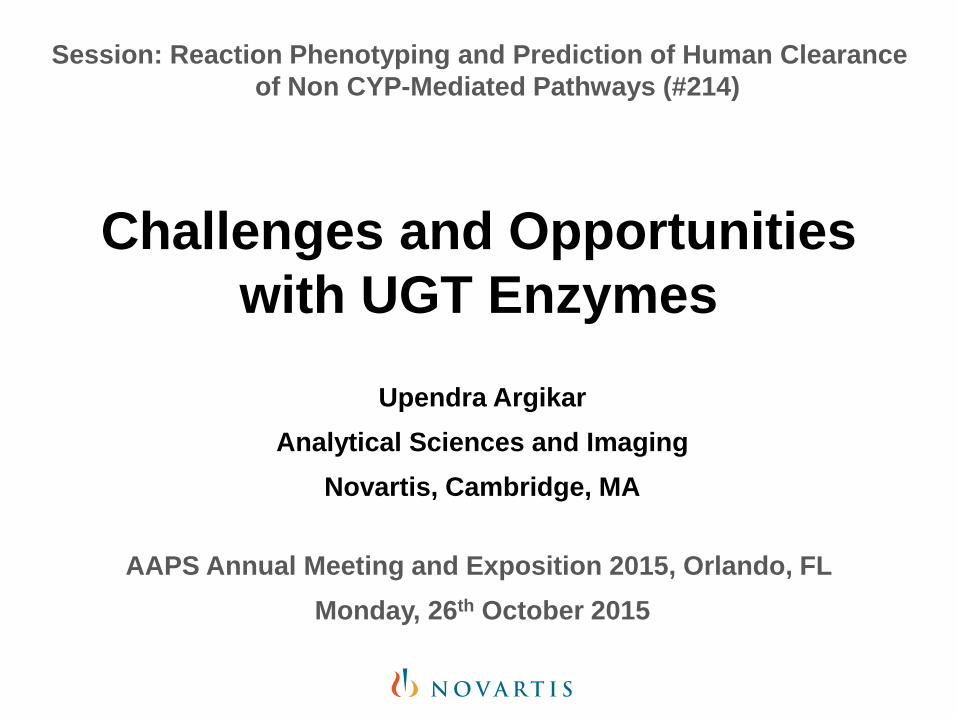
Outline
I. CL prediction in drug discovery and early development
II. Introduction to UGTs
III. Challenges in CL estimation with UGT substrates
IV. Opportunities in CL estimation with UGT substrates
V. Common misconceptions
VI. Summary
VII. Acknowledgements
3 AAPS Annual Meeting 2015 / UGT / Upendra Argikar
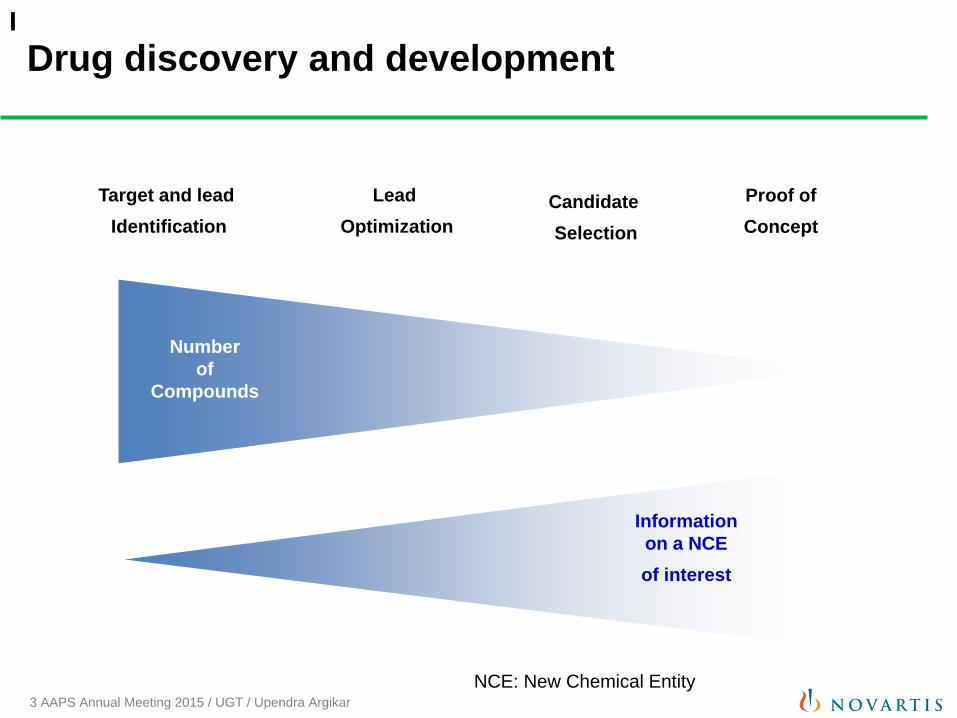
Drug discovery and development
Number
of
Compounds
Target and lead
Identification
Lead
Optimization
Candidate
Selection
Proof of
Concept
Information
on a NCE
of interest
NCE: New Chemical Entity
I
4 AAPS Annual Meeting 2015 / UGT / Upendra Argikar
Importance of Clearance prediction
In discovery and early development, CL prediction -
• Helps to differentiate between promising clinical candidates
• Facilitates first-in-human studies
• Helps to project efficacious human doses
• Enables anticipation dosing frequency, safety margin, etc.
I
5 AAPS Annual Meeting 2015 / UGT / Upendra Argikar
CL prediction methods: rodents, non-rodents to
human
• In vitro scaling methods
• Simple allometric scaling
• Interspecies scaling methods:
- single species scaling with and without correction of hepatic
blood flow
- single species proportionality
• Fraction (unbound) corrected intercept method (FCIM)
• Dedrick analysis
• Physiologically based PK modelling
• Micro-dosing in humans
Each with advantages, disadvantages and caveats
I
6 AAPS Annual Meeting 2015 / UGT / Upendra Argikar
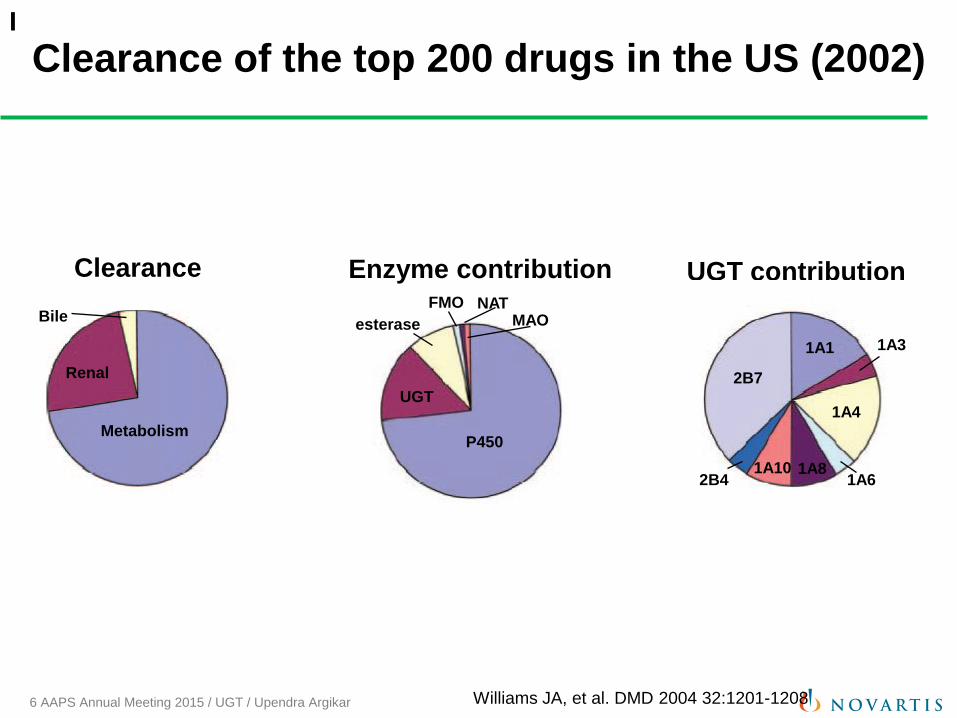
Metabolism
Renal
Bile
P450
UGT
esterase
FMO NAT MAO
Clearance Enzyme contribution UGT contribution
Williams JA, et al. DMD 2004 32:1201-1208
1A1
2B7
1A4
1A10
1A3
1A6 1A8
2B4
Clearance of the top 200 drugs in the US (2002) I
7 AAPS Annual Meeting 2015 / UGT / Upendra Argikar
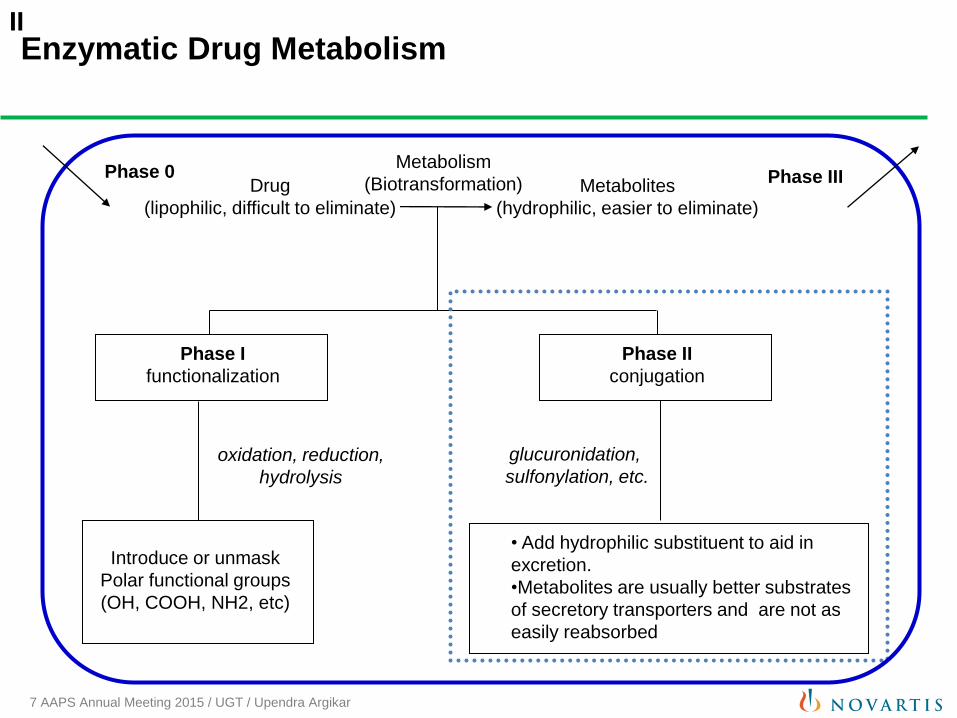
Enzymatic Drug Metabolism
Drug
(lipophilic, difficult to eliminate)
Metabolites
(hydrophilic, easier to eliminate)
Metabolism
(Biotransformation)
Phase I
functionalization
Phase II
conjugation
Introduce or unmask
Polar functional groups
(OH, COOH, NH2, etc)
• Add hydrophilic substituent to aid in
excretion.
•Metabolites are usually better substrates
of secretory transporters and are not as
easily reabsorbed
oxidation, reduction,
hydrolysis
glucuronidation,
sulfonylation, etc.
Phase 0 Phase III
II
8 AAPS Annual Meeting 2015 / UGT / Upendra Argikar
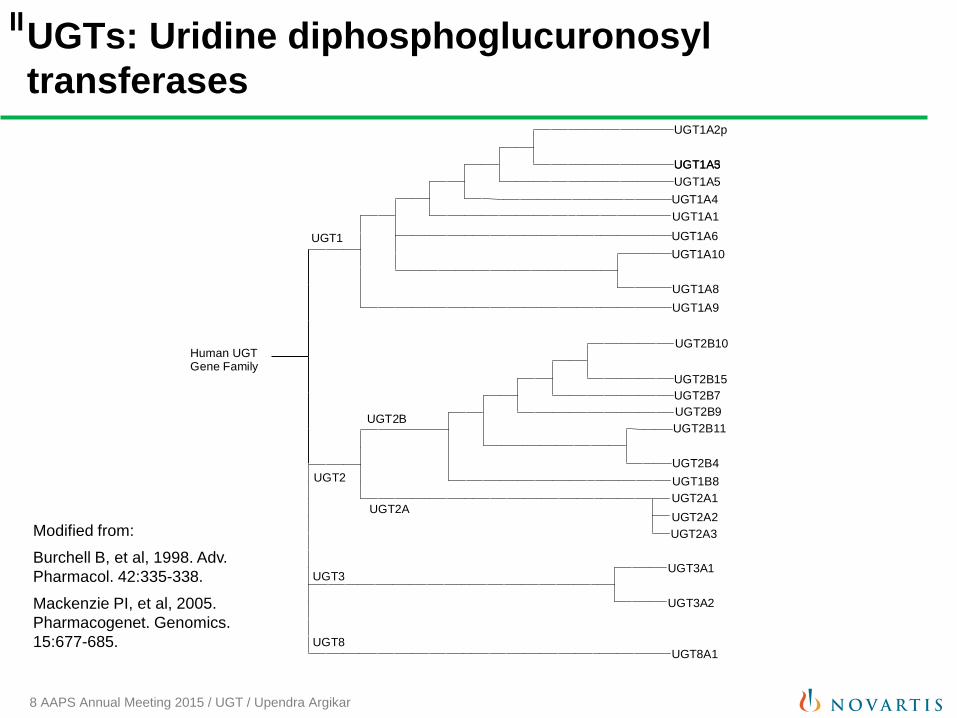
UGTs: Uridine diphosphoglucuronosyl
transferases
Human UGTGene Family
UGT1
UGT2
UGT2A1
UGT2A2
UGT2A3
UGT1A9
UGT1A6
UGT1A1
UGT1A4
UGT1B8
UGT2B9
UGT1A5UGT1A3
UGT1A2p
UGT1A5
UGT1A8
UGT1A10
UGT2B10
UGT2B15
UGT2B7
UGT2B4
UGT2B11
UGT3UGT3A1
UGT3A2
UGT8UGT8A1
UGT2A
UGT2B
Modified from:
Burchell B, et al, 1998. Adv.
Pharmacol. 42:335-338.
Mackenzie PI, et al, 2005.
Pharmacogenet. Genomics.
15:677-685.
II
9 AAPS Annual Meeting 2015 / UGT / Upendra Argikar
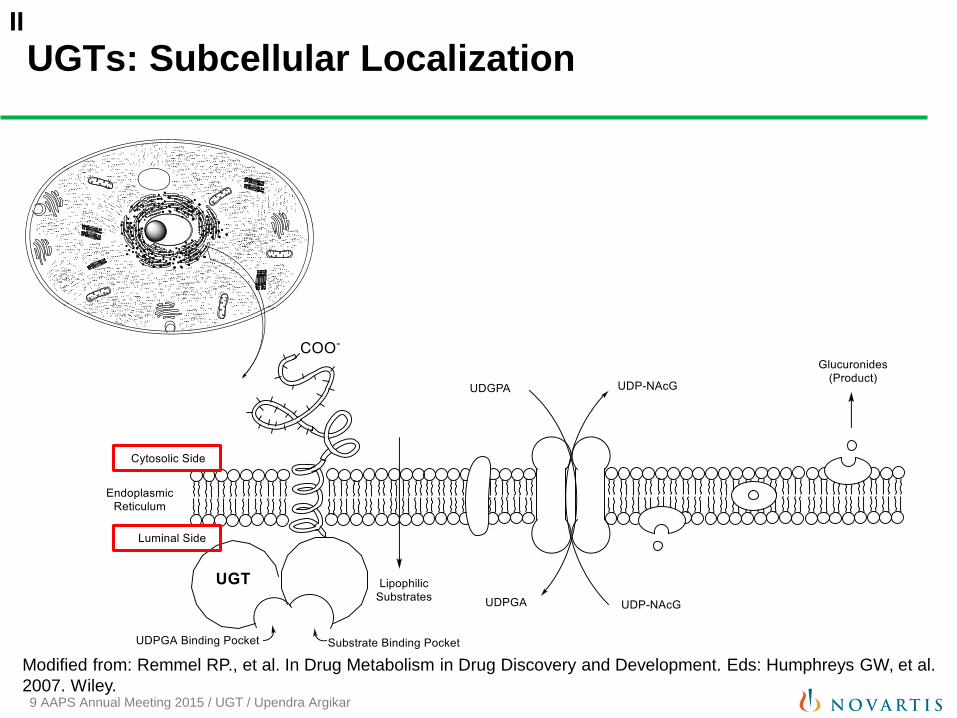
UGTs: Subcellular Localization
Modified from: Remmel RP., et al. In Drug Metabolism in Drug Discovery and Development. Eds: Humphreys GW, et al.
2007. Wiley.
II
10 AAPS Annual Meeting 2015 / UGT / Upendra Argikar
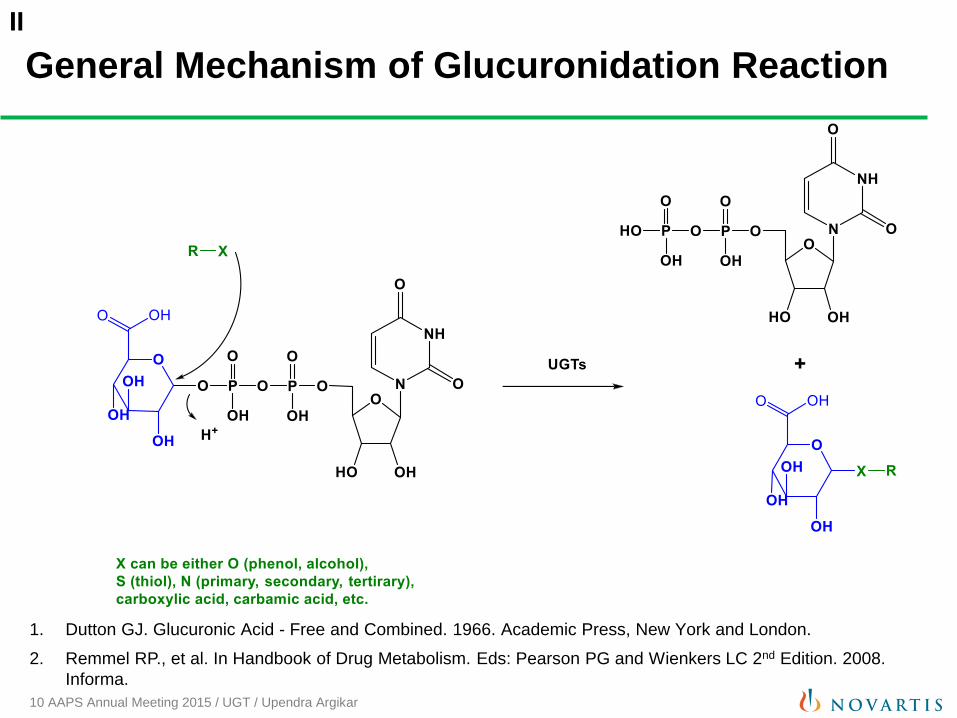
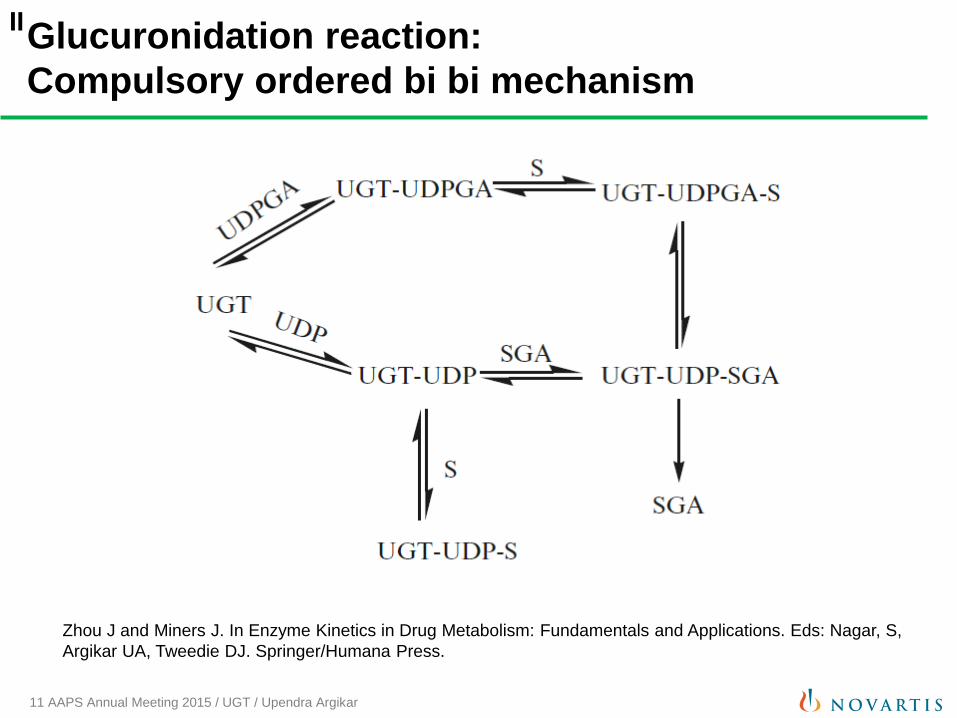
General Mechanism of Glucuronidation Reaction
1. Dutton GJ. Glucuronic Acid - Free and Combined. 1966. Academic Press, New York and London.
2. Remmel RP., et al. In Handbook of Drug Metabolism. Eds: Pearson PG and Wienkers LC 2nd Edition. 2008.
Informa.
II
11 AAPS Annual Meeting 2015 / UGT / Upendra Argikar
Glucuronidation reaction:
Compulsory ordered bi bi mechanism
Zhou J and Miners J. In Enzyme Kinetics in Drug Metabolism: Fundamentals and Applications. Eds: Nagar, S,
Argikar UA, Tweedie DJ. Springer/Humana Press.
II
12 AAPS Annual Meeting 2015 / UGT / Upendra Argikar
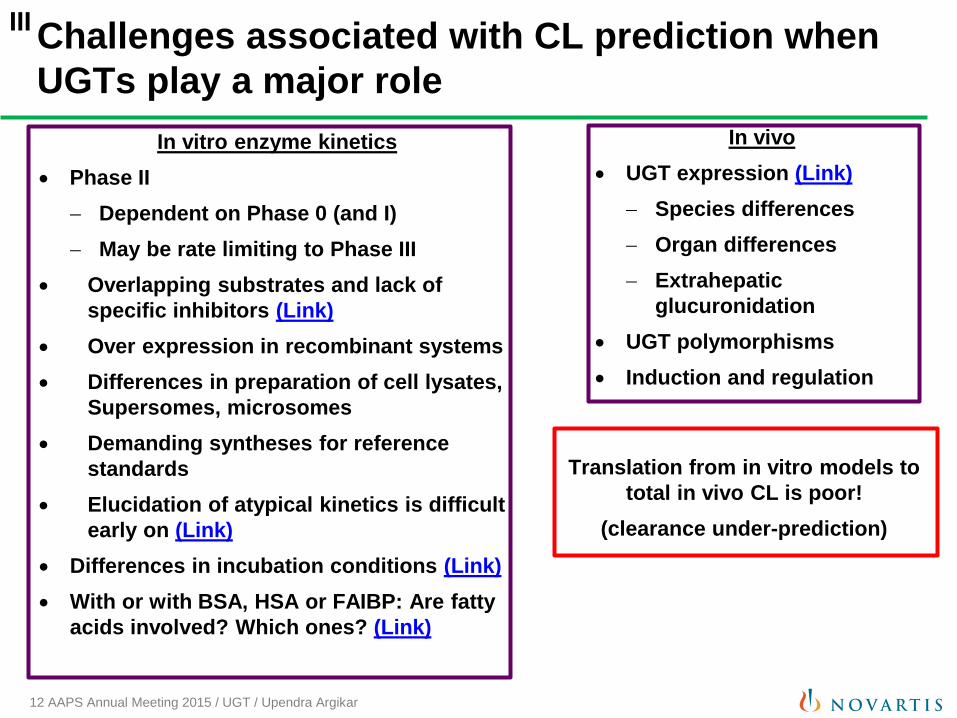
In vivo
UGT expression (Link)
Species differences
Organ differences
Extrahepatic
glucuronidation
UGT polymorphisms
Induction and regulation
Challenges associated with CL prediction when
UGTs play a major role
Translation from in vitro models to
total in vivo CL is poor!
(clearance under-prediction)
In vitro enzyme kinetics
Phase II
Dependent on Phase 0 (and I)
May be rate limiting to Phase III
Overlapping substrates and lack of
specific inhibitors (Link)
Over expression in recombinant systems
Differences in preparation of cell lysates,
Supersomes, microsomes
Demanding syntheses for reference
standards
Elucidation of atypical kinetics is difficult
early on (Link)
Differences in incubation conditions (Link)
With or with BSA, HSA or FAIBP: Are fatty
acids involved? Which ones? (Link)
III
13 AAPS Annual Meeting 2015 / UGT / Upendra Argikar
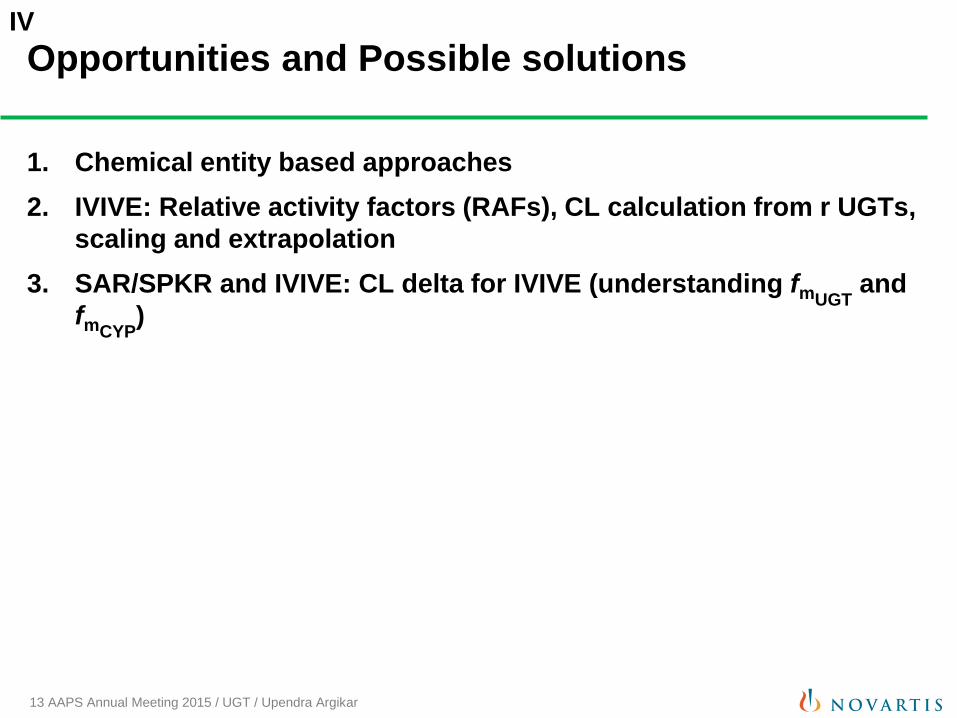
Opportunities and Possible solutions
1. Chemical entity based approaches
2. IVIVE: Relative activity factors (RAFs), CL calculation from r UGTs,
scaling and extrapolation
3. SAR/SPKR and IVIVE: CL delta for IVIVE (understanding fmUGT and
fmCYP)
IV
1. Chemical entity based
approaches
Example: Single Species Scaling Compound 1
IV
15 AAPS Annual Meeting 2015 / UGT / Upendra Argikar
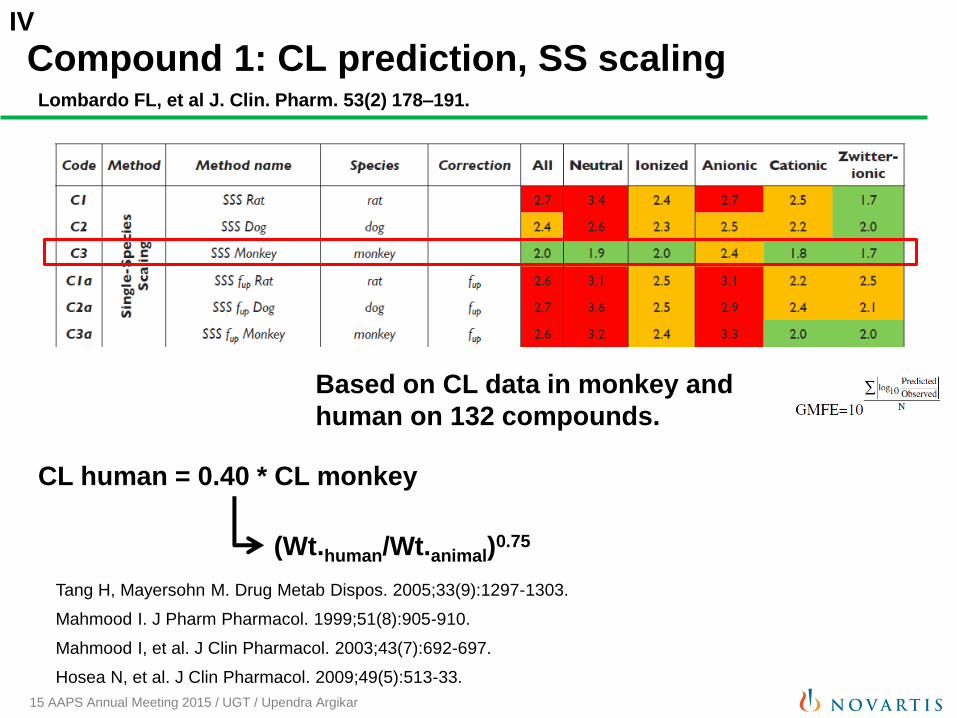
Compound 1: CL prediction, SS scaling
Based on CL data in monkey and
human on 132 compounds.
Lombardo FL, et al J. Clin. Pharm. 53(2) 178–191.
CL human = 0.40 * CL monkey
Tang H, Mayersohn M. Drug Metab Dispos. 2005;33(9):1297-1303.
Mahmood I. J Pharm Pharmacol. 1999;51(8):905-910.
Mahmood I, et al. J Clin Pharmacol. 2003;43(7):692-697.
Hosea N, et al. J Clin Pharmacol. 2009;49(5):513-33.
(Wt.human/Wt.animal)0.75
IV
16 AAPS Annual Meeting 2015 / UGT / Upendra Argikar
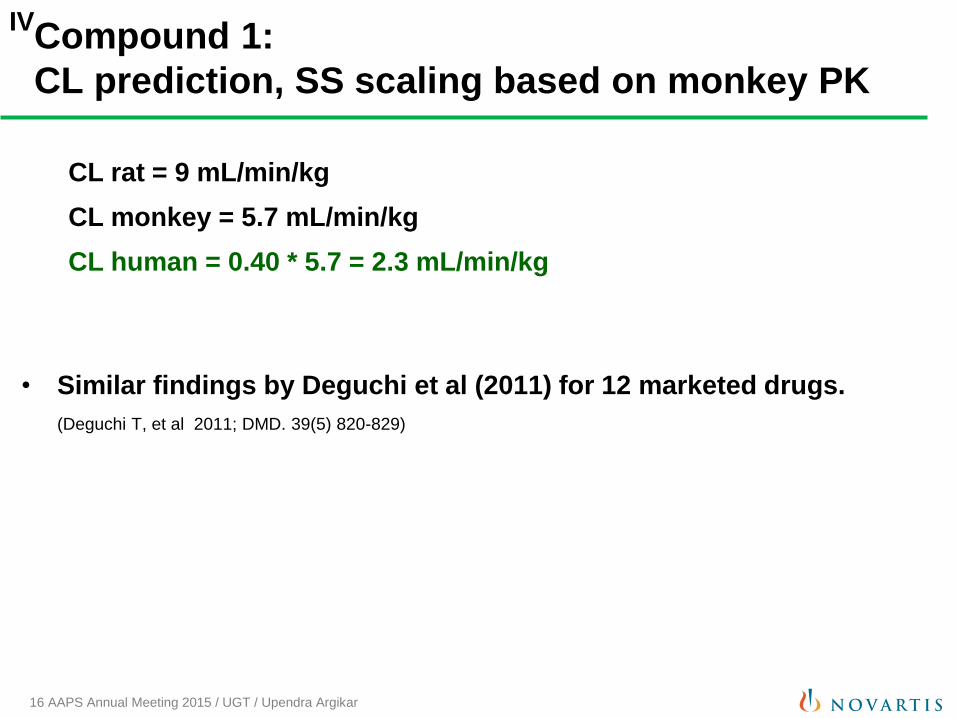
Compound 1:
CL prediction, SS scaling based on monkey PK
• Similar findings by Deguchi et al (2011) for 12 marketed drugs.
(Deguchi T, et al 2011; DMD. 39(5) 820-829)
CL rat = 9 mL/min/kg
CL monkey = 5.7 mL/min/kg
CL human = 0.40 * 5.7 = 2.3 mL/min/kg
IV
17 AAPS Annual Meeting 2015 / UGT / Upendra Argikar
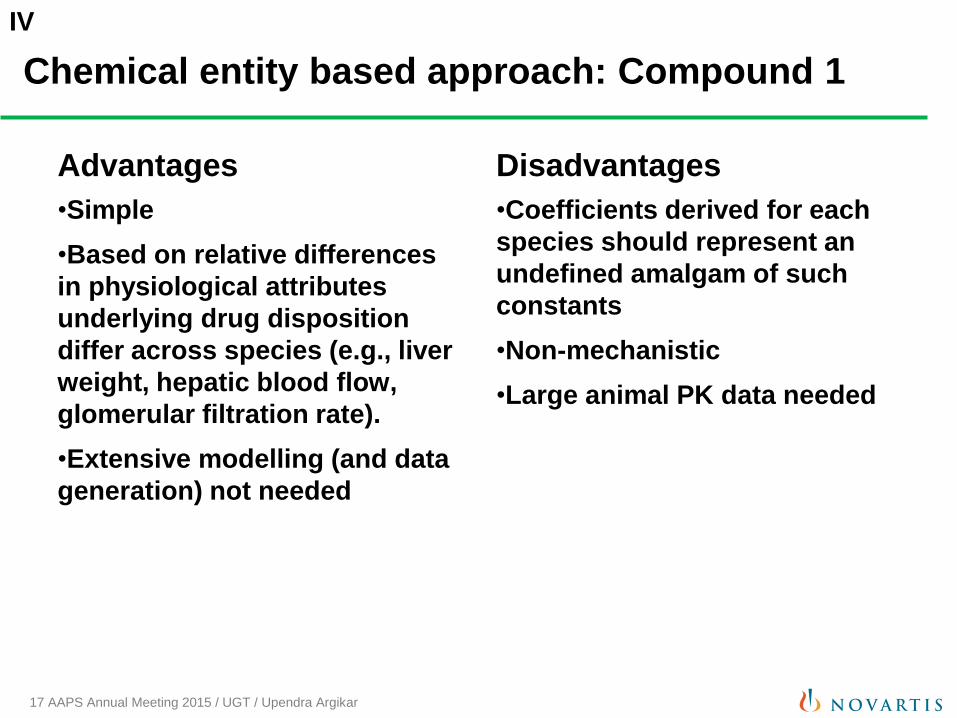
Chemical entity based approach: Compound 1
Advantages
•Simple
•Based on relative differences
in physiological attributes
underlying drug disposition
differ across species (e.g., liver
weight, hepatic blood flow,
glomerular filtration rate).
•Extensive modelling (and data
generation) not needed
Disadvantages
•Coefficients derived for each
species should represent an
undefined amalgam of such
constants
•Non-mechanistic
•Large animal PK data needed
IV
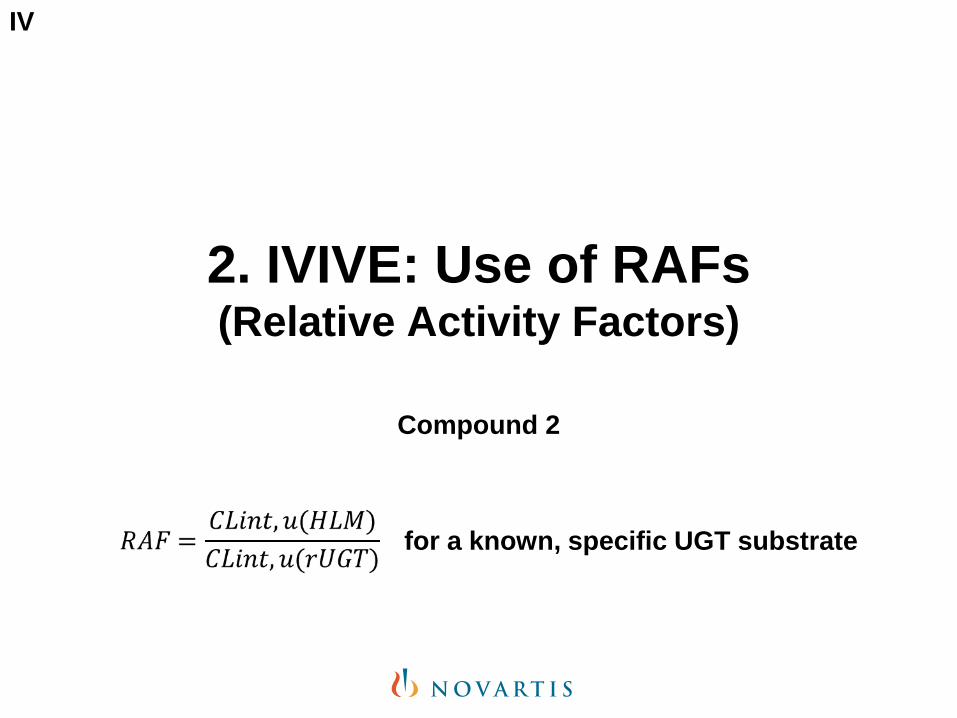
2. IVIVE: Use of RAFs (Relative Activity Factors)
Compound 2
IV
for a known, specific UGT substrate
19 AAPS Annual Meeting 2015 / UGT / Upendra Argikar
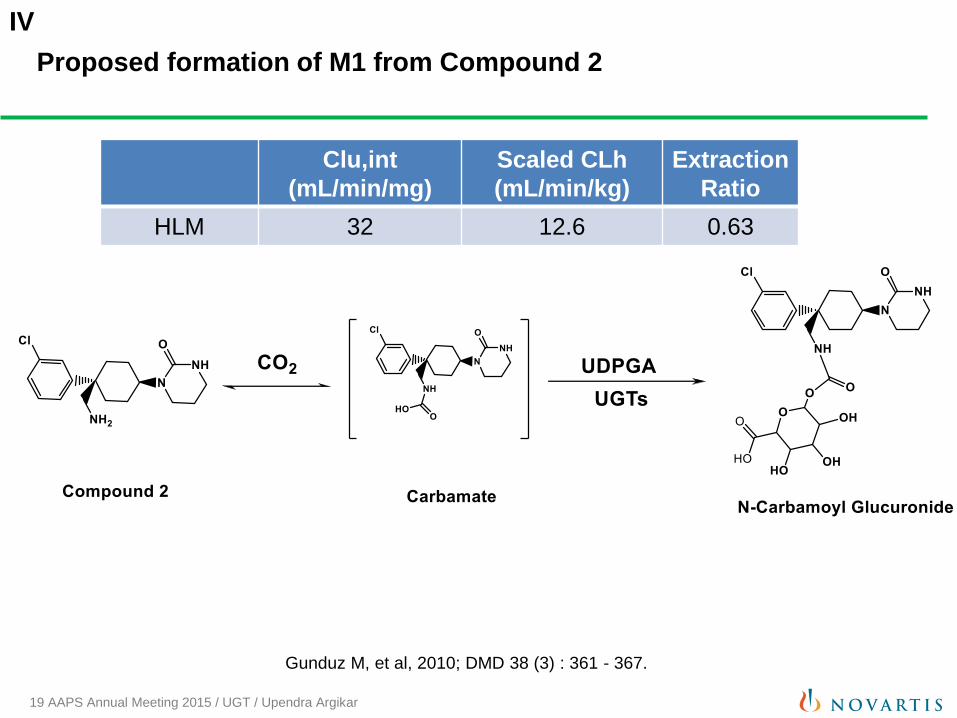
Proposed formation of M1 from Compound 2
Gunduz M, et al, 2010; DMD 38 (3) : 361 - 367.
Clu,int
(mL/min/mg)
Scaled CLh
(mL/min/kg)
Extraction
Ratio
HLM 32 12.6 0.63
IV
20 AAPS Annual Meeting 2015 / UGT / Upendra Argikar
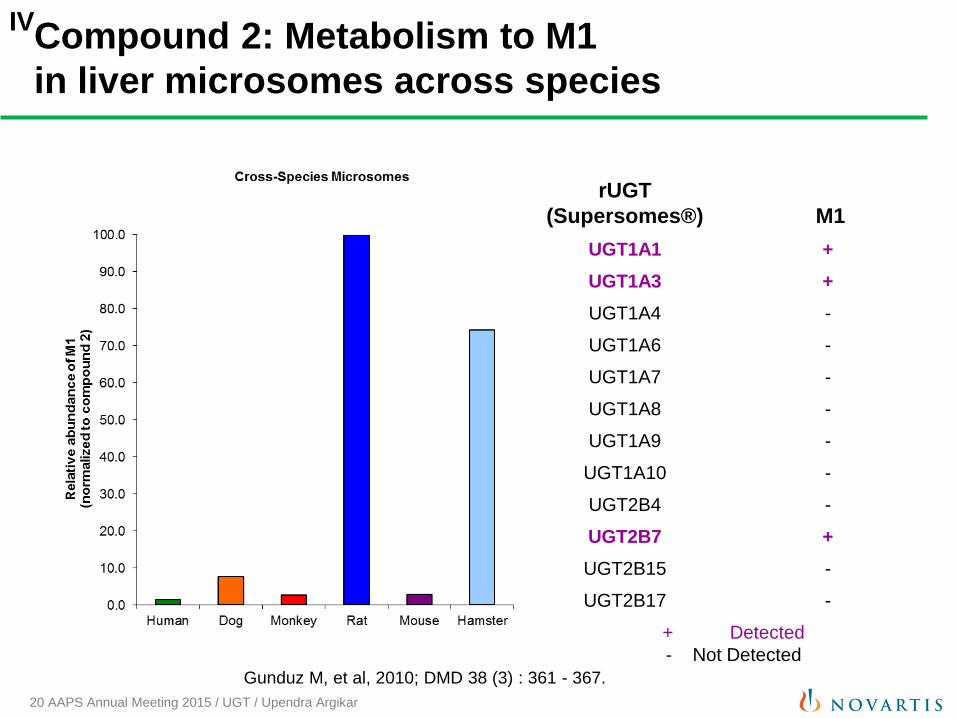
rUGT
(Supersomes®) M1
UGT1A1 +
UGT1A3 +
UGT1A4 -
UGT1A6 -
UGT1A7 -
UGT1A8 -
UGT1A9 -
UGT1A10 -
UGT2B4 -
UGT2B7 +
UGT2B15 -
UGT2B17 -
+ Detected
- Not Detected
Compound 2: Metabolism to M1
in liver microsomes across species
Gunduz M, et al, 2010; DMD 38 (3) : 361 - 367.
IV
21 AAPS Annual Meeting 2015 / UGT / Upendra Argikar
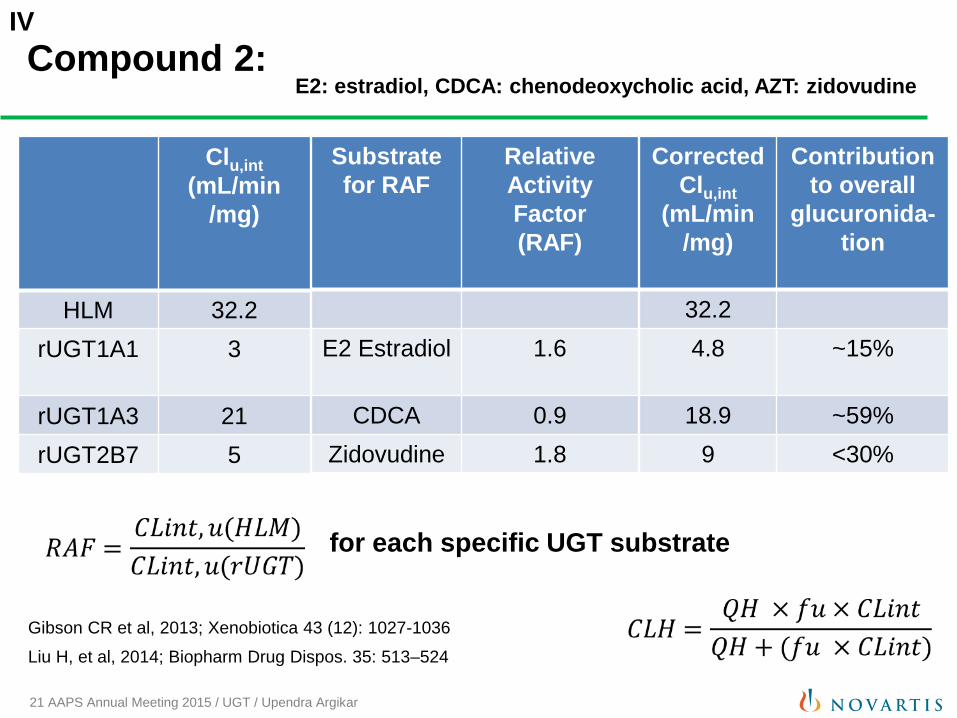
Compound 2:
Clu,int
(mL/min
/mg)
HLM 32.2
rUGT1A1 3
rUGT1A3 21
rUGT2B7 5
Gibson CR et al, 2013; Xenobiotica 43 (12): 1027-1036
Liu H, et al, 2014; Biopharm Drug Dispos. 35: 513–524
E2: estradiol, CDCA: chenodeoxycholic acid, AZT: zidovudine
IV
for each specific UGT substrate
Substrate
for RAF
Relative
Activity
Factor
(RAF)
E2 Estradiol 1.6
CDCA 0.9
Zidovudine 1.8
Corrected
Clu,int
(mL/min
/mg)
Contribution
to overall
glucuronida-
tion
32.2
4.8 ~15%
18.9 ~59%
9 <30%
22 AAPS Annual Meeting 2015 / UGT / Upendra Argikar
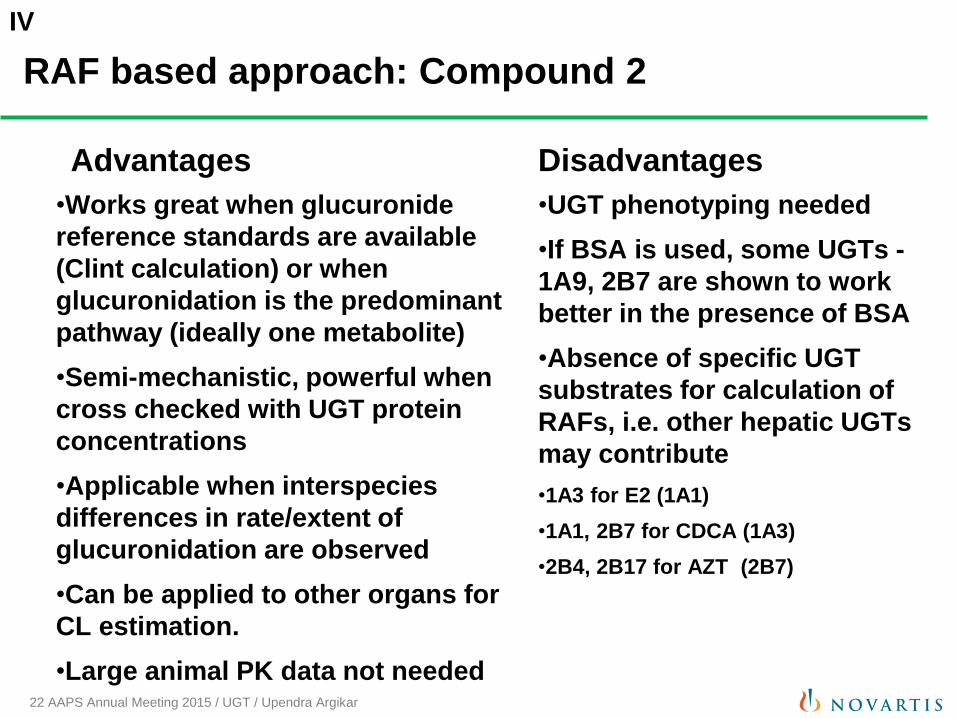
RAF based approach: Compound 2
Advantages
•Works great when glucuronide
reference standards are available
(Clint calculation) or when
glucuronidation is the predominant
pathway (ideally one metabolite)
•Semi-mechanistic, powerful when
cross checked with UGT protein
concentrations
•Applicable when interspecies
differences in rate/extent of
glucuronidation are observed
•Can be applied to other organs for
CL estimation.
•Large animal PK data not needed
Disadvantages
•UGT phenotyping needed
•If BSA is used, some UGTs -
1A9, 2B7 are shown to work
better in the presence of BSA
•Absence of specific UGT
substrates for calculation of
RAFs, i.e. other hepatic UGTs
may contribute
•1A3 for E2 (1A1)
•1A1, 2B7 for CDCA (1A3)
•2B4, 2B17 for AZT (2B7)
IV
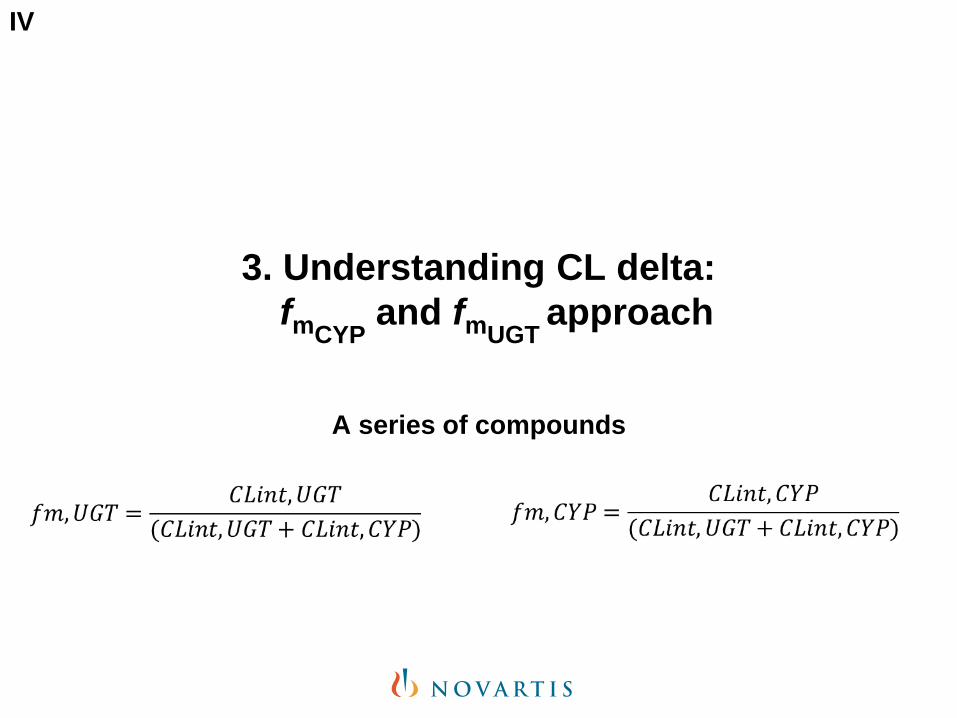
3. Understanding CL delta:
fmCYP and fmUGT
approach
A series of compounds
IV
24 AAPS Annual Meeting 2015 / UGT / Upendra Argikar
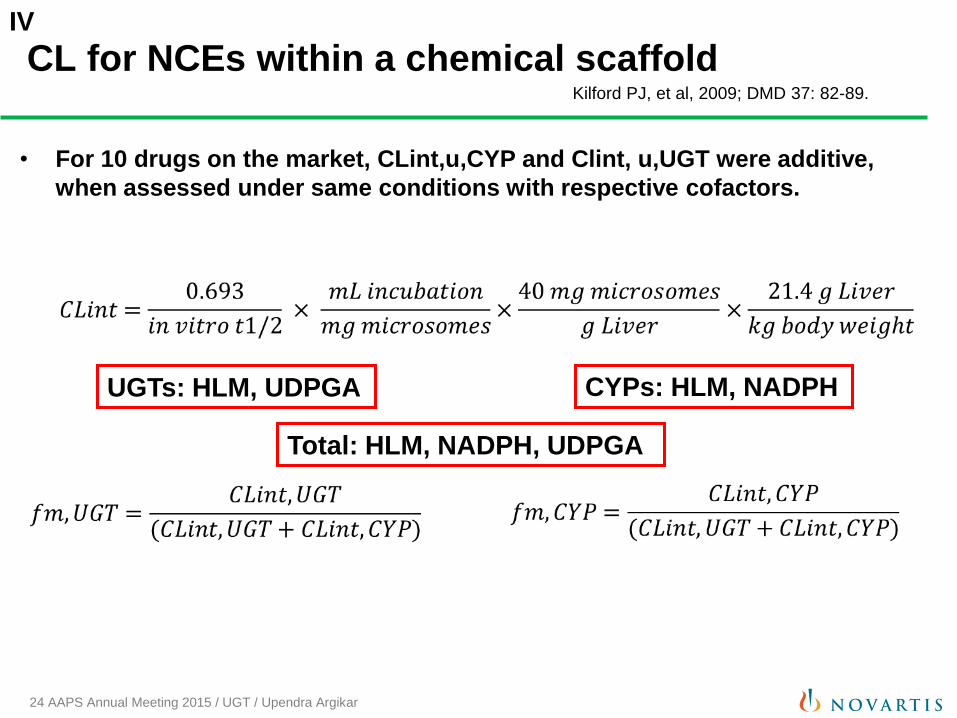
CL for NCEs within a chemical scaffold
• For 10 drugs on the market, CLint,u,CYP and Clint, u,UGT were additive,
when assessed under same conditions with respective cofactors.
Kilford PJ, et al, 2009; DMD 37: 82-89.
IV
UGTs: HLM, UDPGA CYPs: HLM, NADPH
Total: HLM, NADPH, UDPGA
25 AAPS Annual Meeting 2015 / UGT / Upendra Argikar
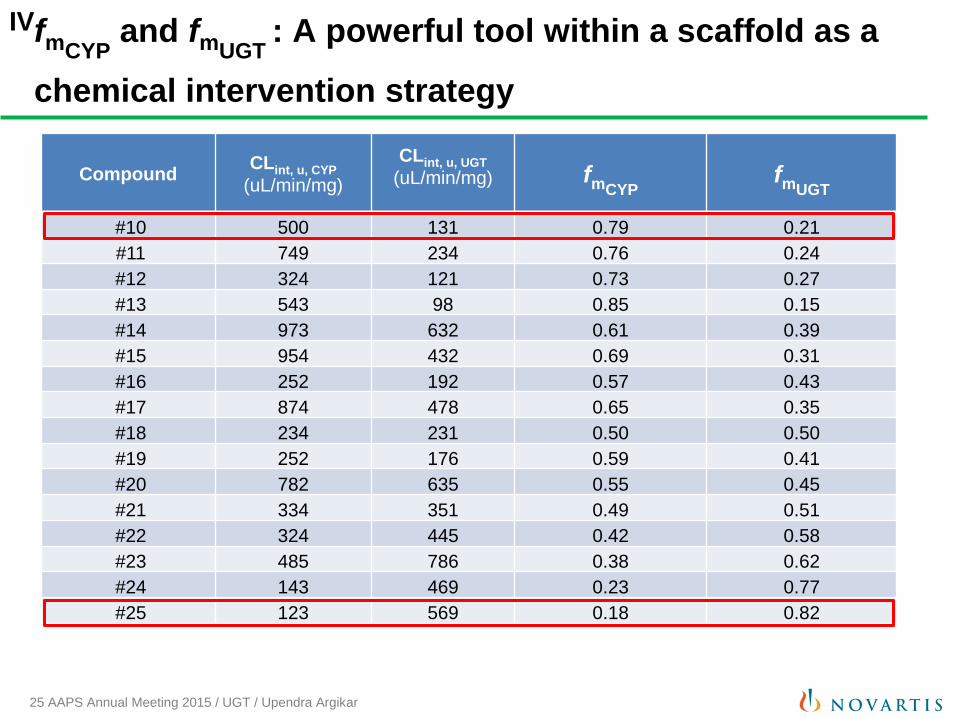
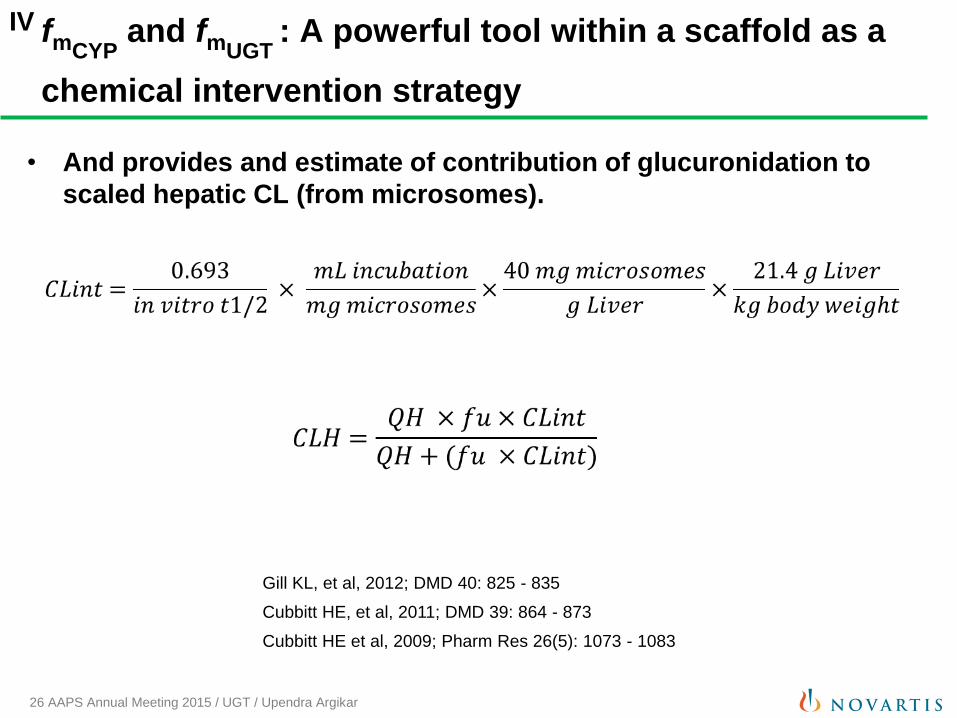
fmCYP and fmUGT
: A powerful tool within a scaffold as a
chemical intervention strategy
Compound CLint, u, CYP
(uL/min/mg)
CLint, u, UGT
(uL/min/mg)
fmCYP fmUGT
#10 500 131 0.79 0.21
#11 749 234 0.76 0.24
#12 324 121 0.73 0.27
#13 543 98 0.85 0.15
#14 973 632 0.61 0.39
#15 954 432 0.69 0.31
#16 252 192 0.57 0.43
#17 874 478 0.65 0.35
#18 234 231 0.50 0.50
#19 252 176 0.59 0.41
#20 782 635 0.55 0.45
#21 334 351 0.49 0.51
#22 324 445 0.42 0.58
#23 485 786 0.38 0.62
#24 143 469 0.23 0.77
#25 123 569 0.18 0.82
IV
26 AAPS Annual Meeting 2015 / UGT / Upendra Argikar
fmCYP and fmUGT
: A powerful tool within a scaffold as a
chemical intervention strategy
• And provides and estimate of contribution of glucuronidation to
scaled hepatic CL (from microsomes).
Gill KL, et al, 2012; DMD 40: 825 - 835
Cubbitt HE, et al, 2011; DMD 39: 864 - 873
Cubbitt HE et al, 2009; Pharm Res 26(5): 1073 - 1083
IV
27 AAPS Annual Meeting 2015 / UGT / Upendra Argikar
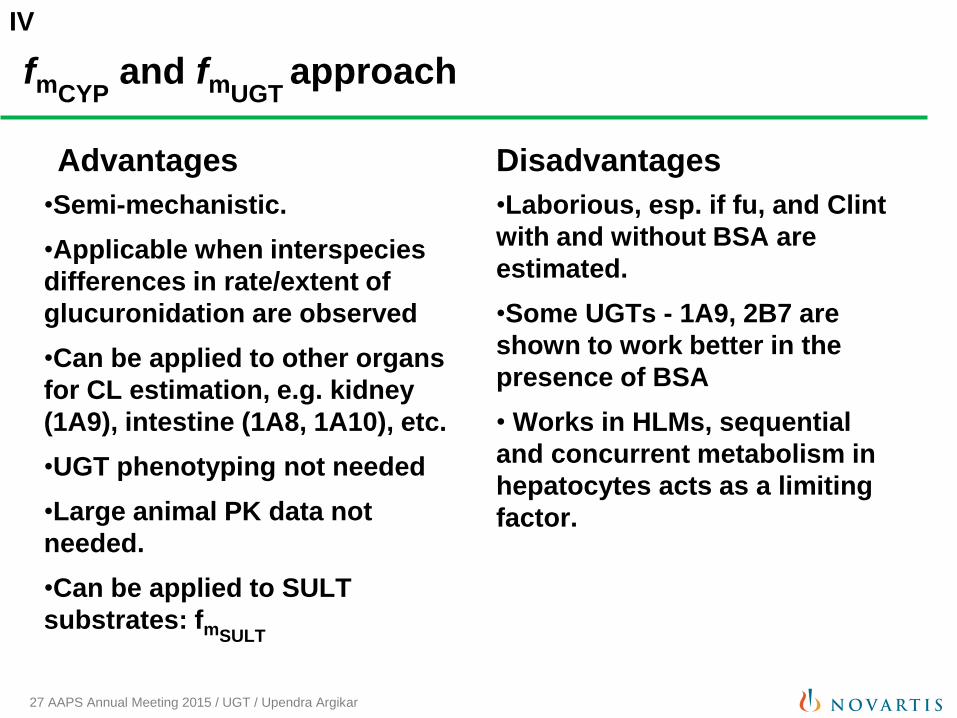
fmCYP and fmUGT
approach
Advantages
•Semi-mechanistic.
•Applicable when interspecies
differences in rate/extent of
glucuronidation are observed
•Can be applied to other organs
for CL estimation, e.g. kidney
(1A9), intestine (1A8, 1A10), etc.
•UGT phenotyping not needed
•Large animal PK data not
needed.
•Can be applied to SULT
substrates: fmSULT
Disadvantages
•Laborious, esp. if fu, and Clint
with and without BSA are
estimated.
•Some UGTs - 1A9, 2B7 are
shown to work better in the
presence of BSA
• Works in HLMs, sequential
and concurrent metabolism in
hepatocytes acts as a limiting
factor.
IV
28 AAPS Annual Meeting 2015 / UGT / Upendra Argikar
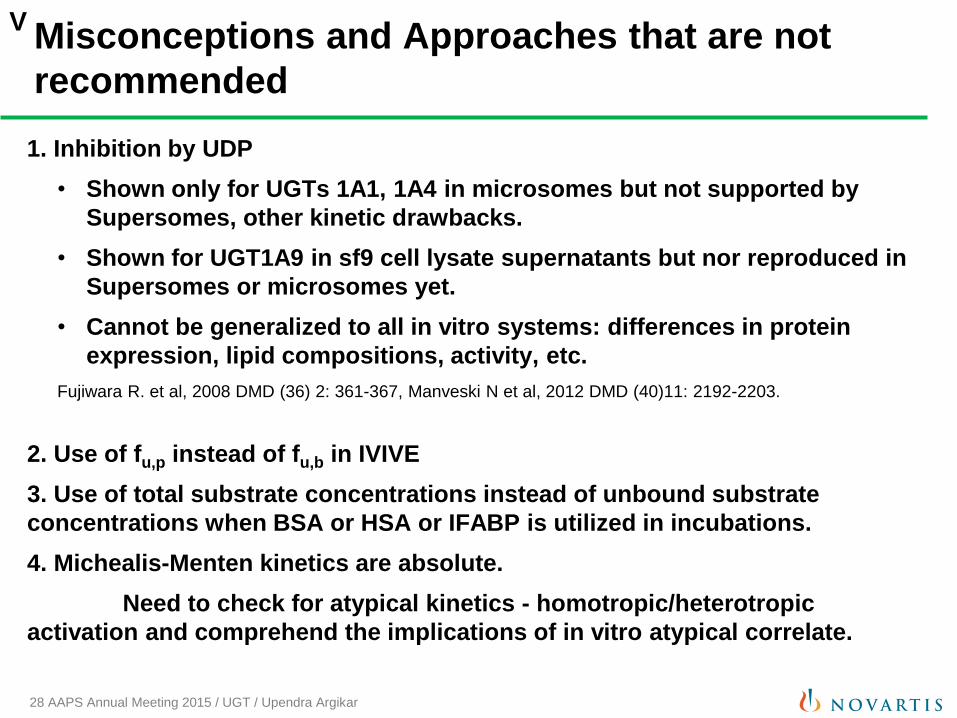
Misconceptions and Approaches that are not
recommended
1. Inhibition by UDP
• Shown only for UGTs 1A1, 1A4 in microsomes but not supported by
Supersomes, other kinetic drawbacks.
• Shown for UGT1A9 in sf9 cell lysate supernatants but nor reproduced in
Supersomes or microsomes yet.
• Cannot be generalized to all in vitro systems: differences in protein
expression, lipid compositions, activity, etc.
Fujiwara R. et al, 2008 DMD (36) 2: 361-367, Manveski N et al, 2012 DMD (40)11: 2192-2203.
2. Use of fu,p instead of fu,b in IVIVE
3. Use of total substrate concentrations instead of unbound substrate
concentrations when BSA or HSA or IFABP is utilized in incubations.
4. Michealis-Menten kinetics are absolute.
Need to check for atypical kinetics - homotropic/heterotropic
activation and comprehend the implications of in vitro atypical correlate.
V
29 AAPS Annual Meeting 2015 / UGT / Upendra Argikar
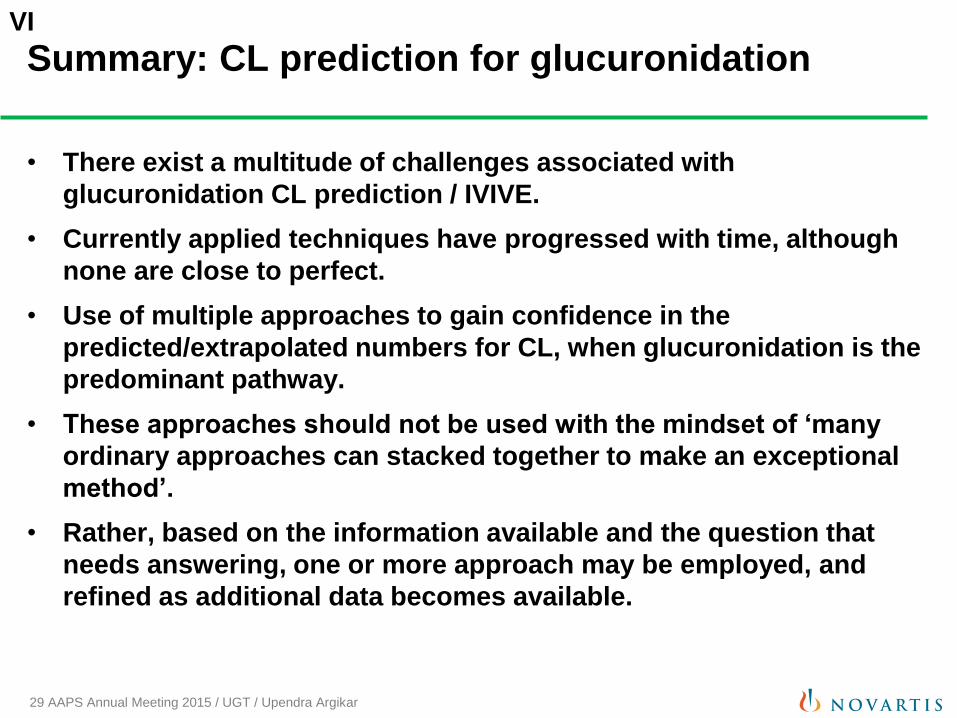
Summary: CL prediction for glucuronidation
• There exist a multitude of challenges associated with
glucuronidation CL prediction / IVIVE.
• Currently applied techniques have progressed with time, although
none are close to perfect.
• Use of multiple approaches to gain confidence in the
predicted/extrapolated numbers for CL, when glucuronidation is the
predominant pathway.
• These approaches should not be used with the mindset of „many
ordinary approaches can stacked together to make an exceptional
method‟.
• Rather, based on the information available and the question that
needs answering, one or more approach may be employed, and
refined as additional data becomes available.
VI
30 AAPS Annual Meeting 2015 / UGT / Upendra Argikar
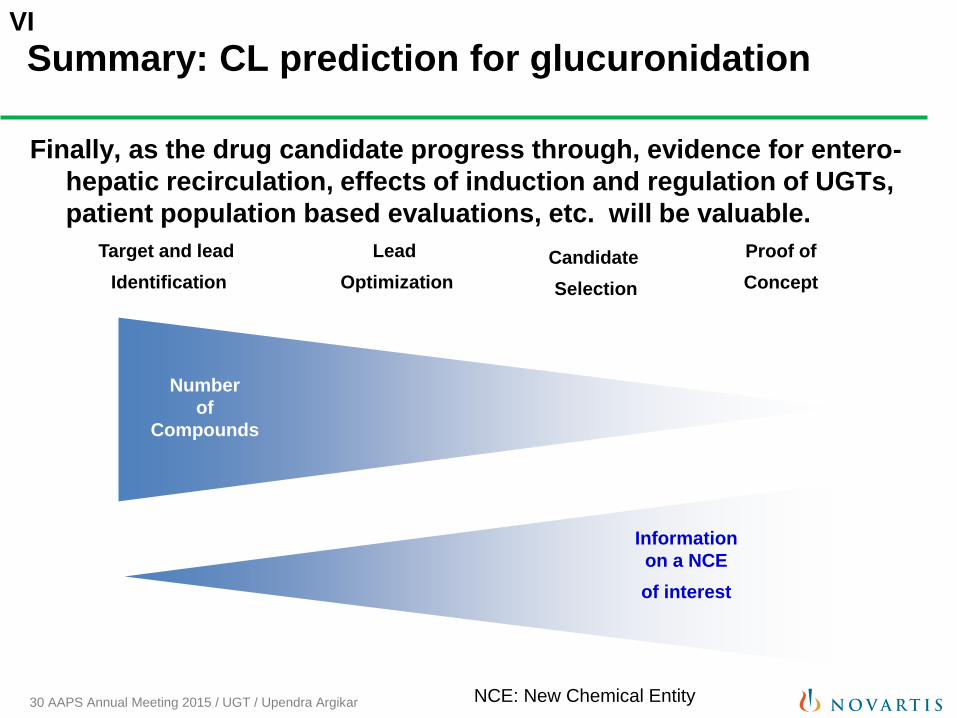
Summary: CL prediction for glucuronidation
Finally, as the drug candidate progress through, evidence for entero-
hepatic recirculation, effects of induction and regulation of UGTs,
patient population based evaluations, etc. will be valuable.
Number
of
Compounds
Target and lead
Identification
Lead
Optimization
Candidate
Selection
Proof of
Concept
Information
on a NCE
of interest
NCE: New Chemical Entity
VI
31 AAPS Annual Meeting 2015 / UGT / Upendra Argikar
Acknowledgements
Jennifer Bushee
Mithat Gunduz
Amanda Cirello
Bindi Sohal
James Mangold
Chitra Saran
Rutali Brahme
Project Team Members
Chemistry
Biology
Pharmacology
Metabolism and PK
DMPK
VII
32 AAPS Annual Meeting 2015 / UGT / Upendra Argikar
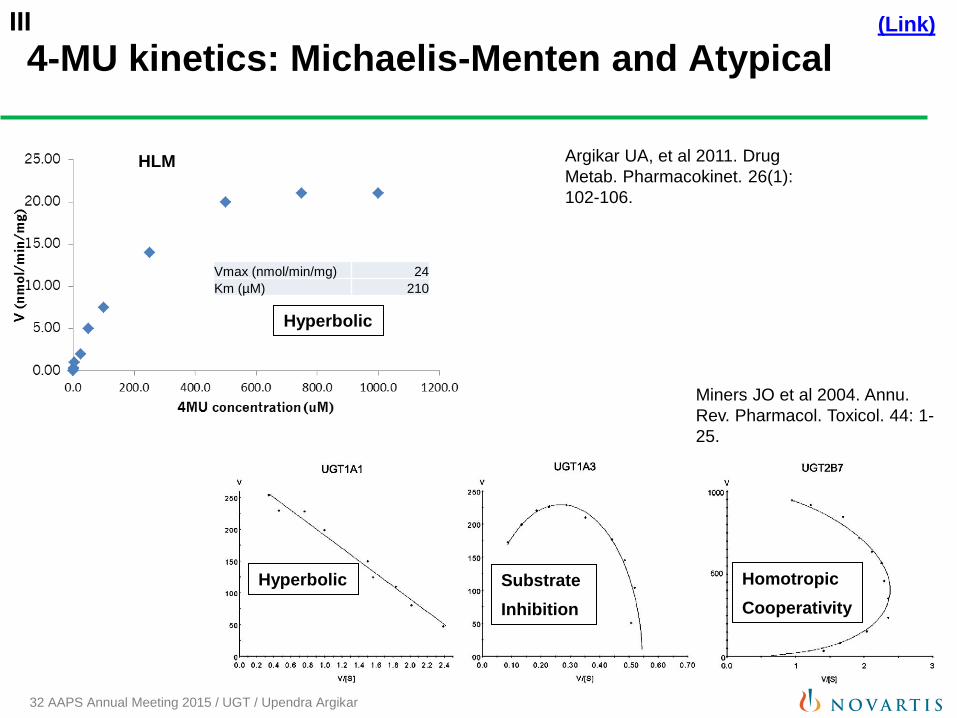
4-MU kinetics: Michaelis-Menten and Atypical
Argikar UA, et al 2011. Drug
Metab. Pharmacokinet. 26(1):
102-106.
Miners JO et al 2004. Annu.
Rev. Pharmacol. Toxicol. 44: 1-
25.
Vmax (nmol/min/mg) 24
Km (µM) 210
HLM
(Link)
Hyperbolic
Hyperbolic Substrate
Inhibition
Homotropic
Cooperativity
III
33 AAPS Annual Meeting 2015 / UGT / Upendra Argikar
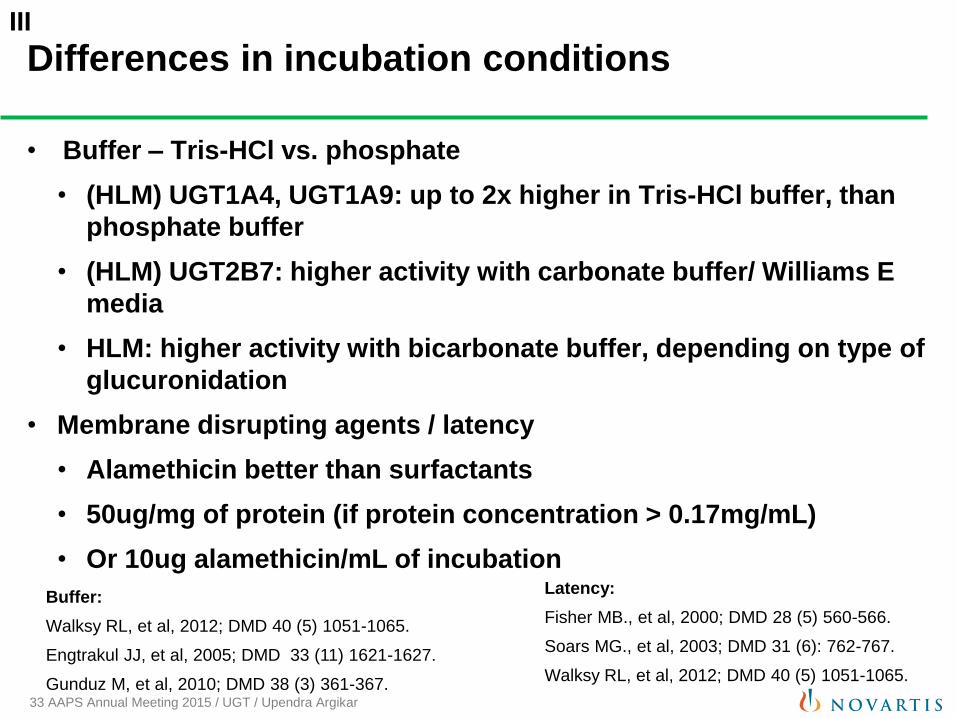
Differences in incubation conditions
• Buffer – Tris-HCl vs. phosphate
• (HLM) UGT1A4, UGT1A9: up to 2x higher in Tris-HCl buffer, than
phosphate buffer
• (HLM) UGT2B7: higher activity with carbonate buffer/ Williams E
media
• HLM: higher activity with bicarbonate buffer, depending on type of
glucuronidation
• Membrane disrupting agents / latency
• Alamethicin better than surfactants
• 50ug/mg of protein (if protein concentration > 0.17mg/mL)
• Or 10ug alamethicin/mL of incubation
Latency:
Fisher MB., et al, 2000; DMD 28 (5) 560-566.
Soars MG., et al, 2003; DMD 31 (6): 762-767.
Walksy RL, et al, 2012; DMD 40 (5) 1051-1065.
Buffer:
Walksy RL, et al, 2012; DMD 40 (5) 1051-1065.
Engtrakul JJ, et al, 2005; DMD 33 (11) 1621-1627.
Gunduz M, et al, 2010; DMD 38 (3) 361-367.
III
34 AAPS Annual Meeting 2015 / UGT / Upendra Argikar
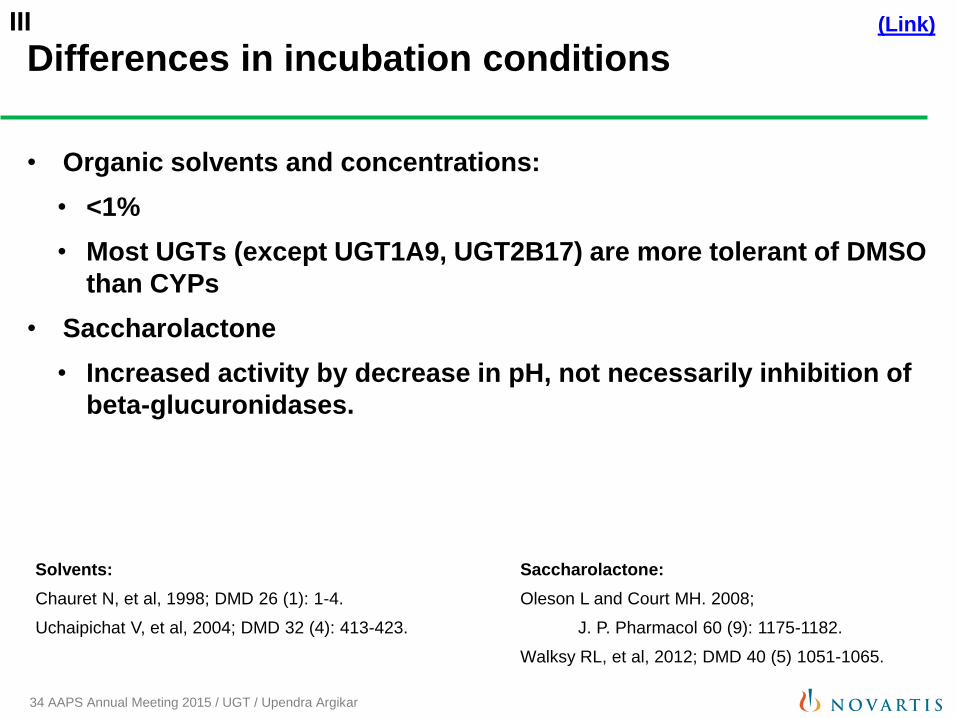
Differences in incubation conditions
• Organic solvents and concentrations:
• <1%
• Most UGTs (except UGT1A9, UGT2B17) are more tolerant of DMSO
than CYPs
• Saccharolactone
• Increased activity by decrease in pH, not necessarily inhibition of
beta-glucuronidases.
Solvents:
Chauret N, et al, 1998; DMD 26 (1): 1-4.
Uchaipichat V, et al, 2004; DMD 32 (4): 413-423.
Saccharolactone:
Oleson L and Court MH. 2008;
J. P. Pharmacol 60 (9): 1175-1182.
Walksy RL, et al, 2012; DMD 40 (5) 1051-1065.
(Link) III
35 AAPS Annual Meeting 2015 / UGT / Upendra Argikar
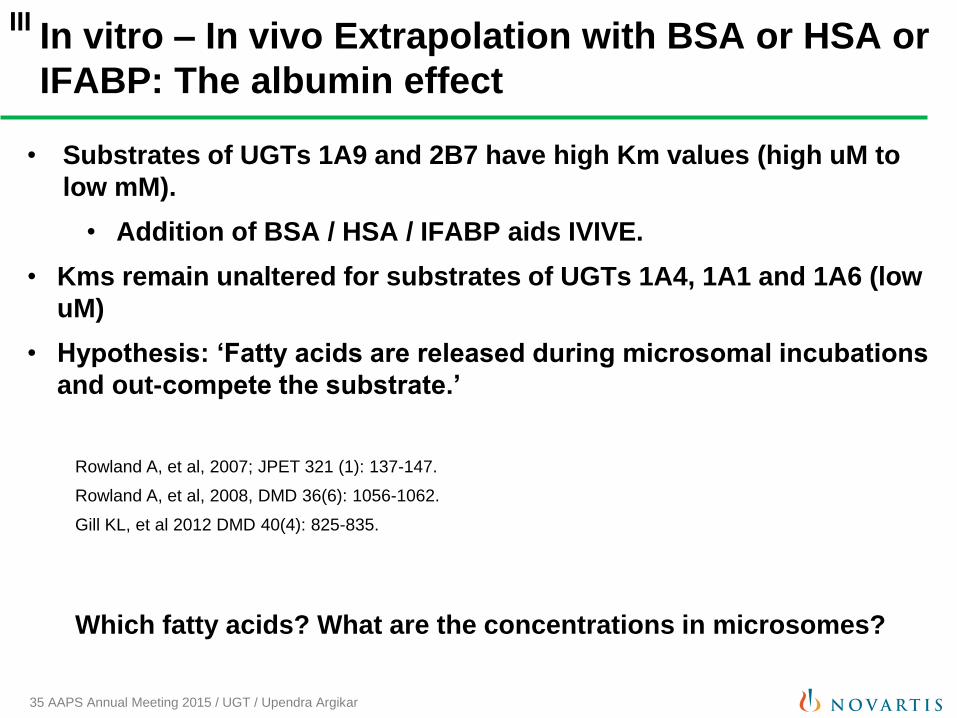
In vitro – In vivo Extrapolation with BSA or HSA or
IFABP: The albumin effect
• Substrates of UGTs 1A9 and 2B7 have high Km values (high uM to
low mM).
• Addition of BSA / HSA / IFABP aids IVIVE.
• Kms remain unaltered for substrates of UGTs 1A4, 1A1 and 1A6 (low
uM)
• Hypothesis: „Fatty acids are released during microsomal incubations
and out-compete the substrate.‟
Rowland A, et al, 2007; JPET 321 (1): 137-147.
Rowland A, et al, 2008, DMD 36(6): 1056-1062.
Gill KL, et al 2012 DMD 40(4): 825-835.
Which fatty acids? What are the concentrations in microsomes?
III

36 AAPS Annual Meeting 2015 / UGT / Upendra Argikar
Fatty acids are present in microsomes:
Microsomal fatty acid concentrations
Fatty Acid Concentration (M)
RLM MLM HLM
caprylic acid - - -
myristic acid 9.0 8.2 23.1
pentadecylic acid 2.2 2.9 4.5
palmitic acid 29.3 35.4 28.4
palmitoleic acid 2.4 2.9 4.7
margaric acid <0.1 <0.1 <0.1
stearic acid 1.3 1.1 0.6
oleic acid 0.1 0.1 0.1
linoleic acid 2.3 2.8 2.2
α-linolenic acid 19.4 23.9 24.8
γ-linolenic acid 1.3 1.5 1.4
nonadecylic acid 6.3 4.2 5.3
arachidic acid 21.5 27.6 1.5
gondoic acid 1.4 0.3 0.2
trans-11-
eicosenoic acid 1.1 0.6 0.5
arachidonic acid 0.2 0.1 0.1
timnodonic acid 5.3 3.8 2.1
behenic acid 0.7 0.6 0.6
nervonic acid 0.7 0.6 0.6
-
fatty acid not observed in liver microsomal
incubation
<0.6 fold change when compared with 0 min
0.7 to 1.3 fold change when compared with
0min
>1.4 fold change when compared with 0min
• Are the concentrations
altered
• Over time
• And with or without BSA
Bushee JL, et al, 2014; Xenobiotica 44 (8): 687-695.
37 AAPS Annual Meeting 2015 / UGT / Upendra Argikar
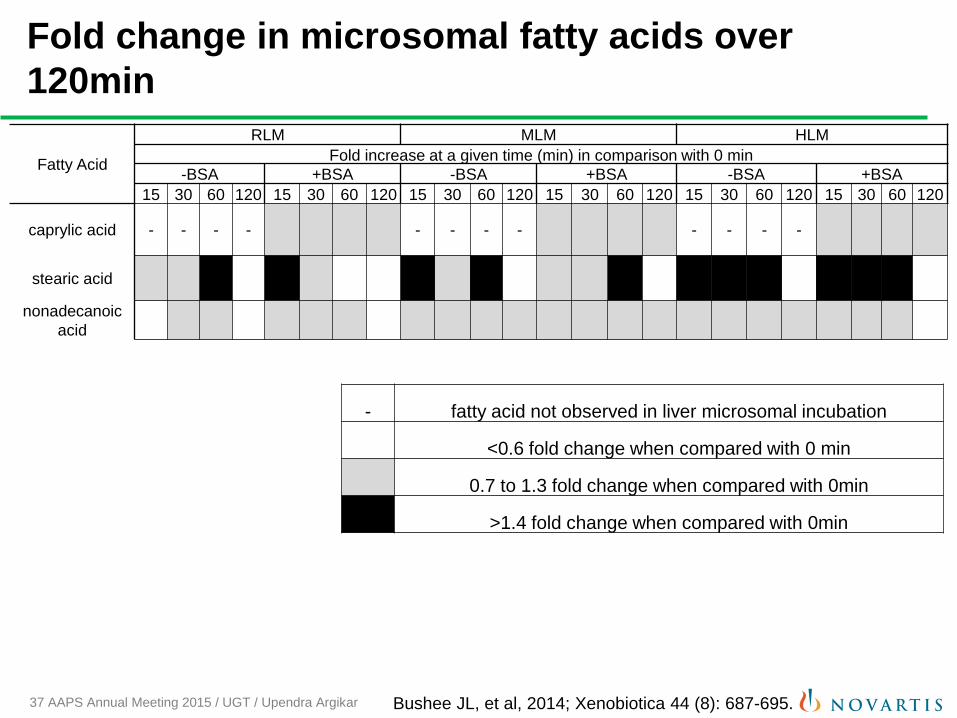
Fold change in microsomal fatty acids over
120min
Fatty Acid
RLM MLM HLM
Fold increase at a given time (min) in comparison with 0 min
-BSA +BSA -BSA +BSA -BSA +BSA
15 30 60 120 15 30 60 120 15 30 60 120 15 30 60 120 15 30 60 120 15 30 60 120
caprylic acid - - - -
- - - -
- - - -
stearic acid
nonadecanoic
acid
- fatty acid not observed in liver microsomal incubation
<0.6 fold change when compared with 0 min
0.7 to 1.3 fold change when compared with 0min
>1.4 fold change when compared with 0min
Bushee JL, et al, 2014; Xenobiotica 44 (8): 687-695.
38 AAPS Annual Meeting 2015 / UGT / Upendra Argikar
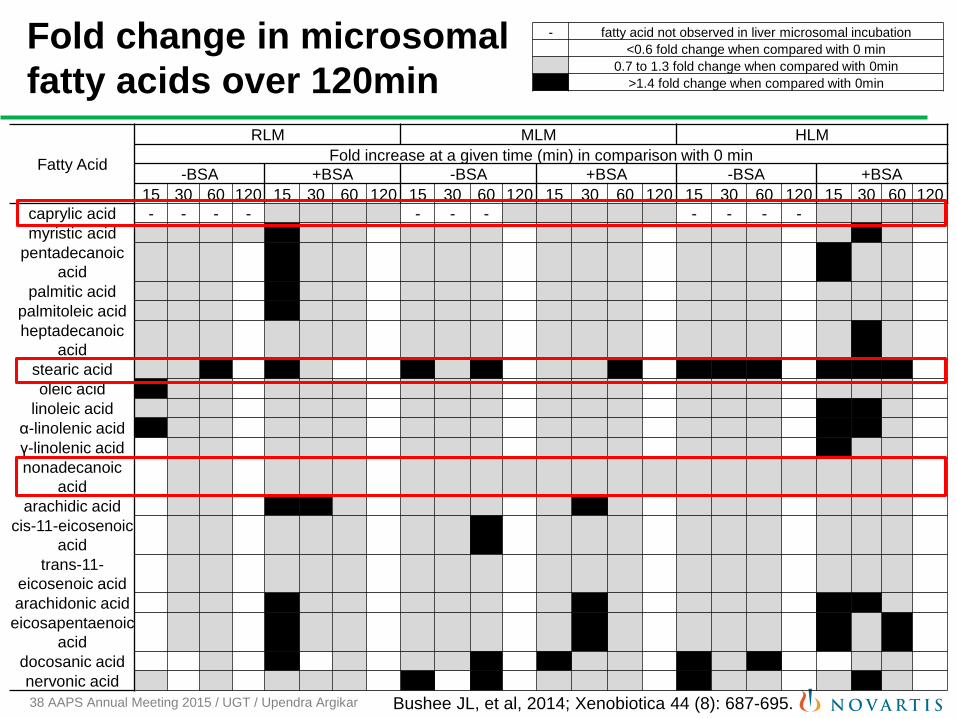
Fold change in microsomal
fatty acids over 120min
Fatty Acid
RLM MLM HLM
Fold increase at a given time (min) in comparison with 0 min
-BSA +BSA -BSA +BSA -BSA +BSA
15 30 60 120 15 30 60 120 15 30 60 120 15 30 60 120 15 30 60 120 15 30 60 120
caprylic acid - - - - - - - - - - -
myristic acid
pentadecanoic
acid
palmitic acid
palmitoleic acid
heptadecanoic
acid
stearic acid
oleic acid
linoleic acid
α-linolenic acid 2.4
γ-linolenic acid
nonadecanoic
acid
arachidic acid 1.6
cis-11-eicosenoic
acid
trans-11-
eicosenoic acid
arachidonic acid
eicosapentaenoic
acid
docosanic acid 1.4
nervonic acid 1.4
- fatty acid not observed in liver microsomal incubation
<0.6 fold change when compared with 0 min
0.7 to 1.3 fold change when compared with 0min
>1.4 fold change when compared with 0min
Bushee JL, et al, 2014; Xenobiotica 44 (8): 687-695.
39 AAPS Annual Meeting 2015 / UGT / Upendra Argikar
Microsomal Fatty acids
• Depending on the acid, concentrations remain the same or are
modulated.
• Observable species differences in liver microsomes.
• Next steps:
• Microsomes from other organs, hepatocytes, recombinant
enzymes
• Kinetics of release and inhibitory interactions
(Link) III
40 AAPS Annual Meeting 2015 / UGT / Upendra Argikar
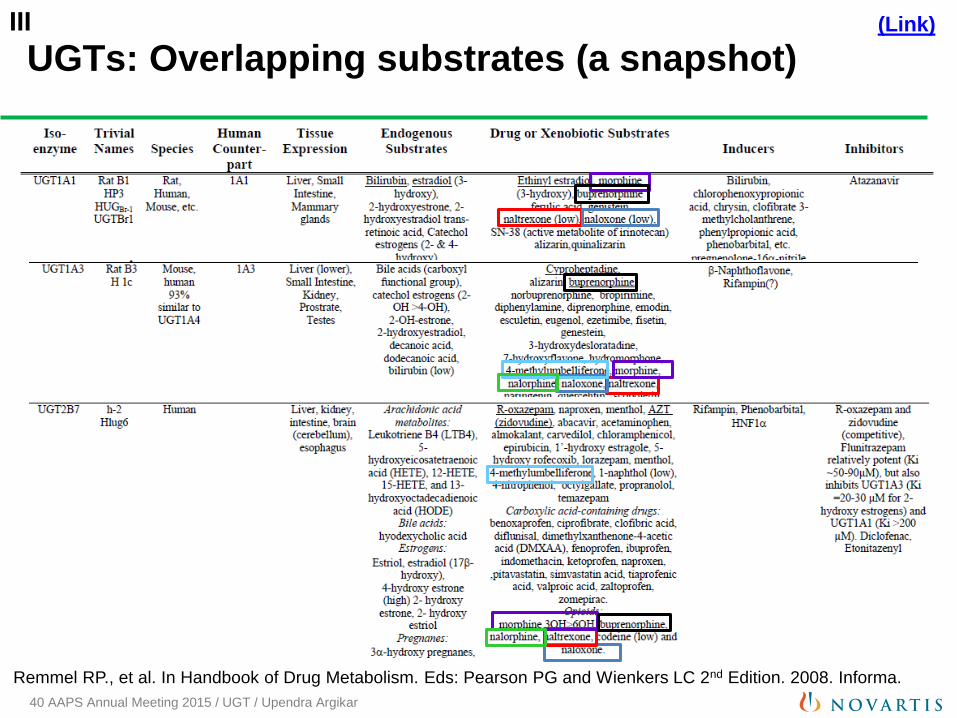
UGTs: Overlapping substrates (a snapshot)
Remmel RP., et al. In Handbook of Drug Metabolism. Eds: Pearson PG and Wienkers LC 2nd Edition. 2008. Informa.
(Link) III
41 AAPS Annual Meeting 2015 / UGT / Upendra Argikar
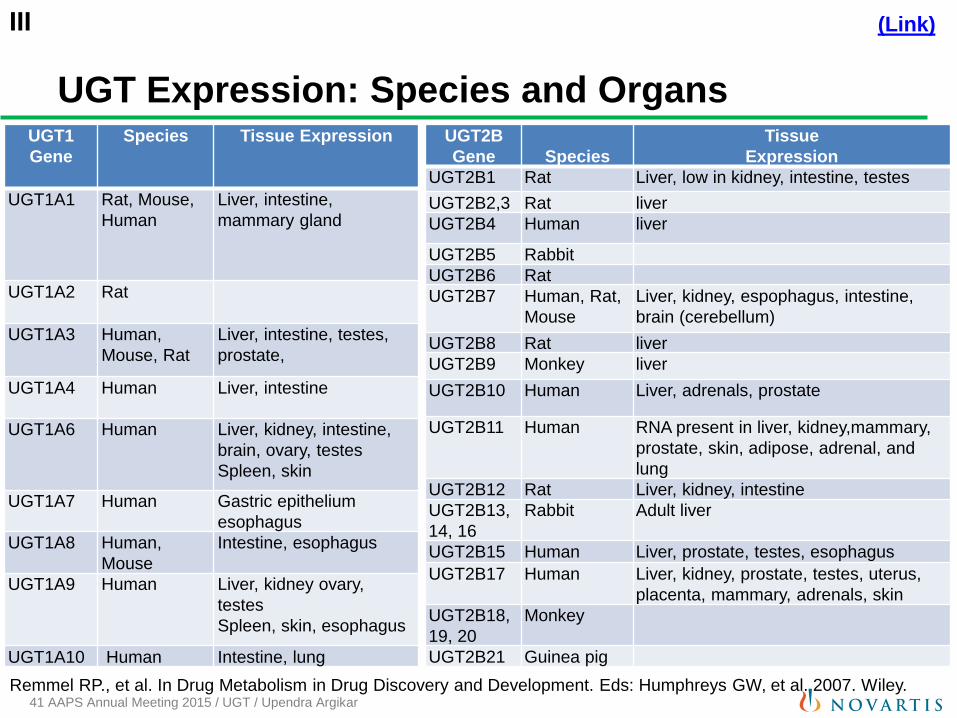
UGT Expression: Species and Organs UGT1
Gene
Species Tissue Expression
UGT1A1 Rat, Mouse,
Human
Liver, intestine,
mammary gland
UGT1A2 Rat
UGT1A3 Human,
Mouse, Rat
Liver, intestine, testes,
prostate,
UGT1A4 Human Liver, intestine
UGT1A6 Human Liver, kidney, intestine,
brain, ovary, testes
Spleen, skin
UGT1A7 Human Gastric epithelium
esophagus
UGT1A8 Human,
Mouse
Intestine, esophagus
UGT1A9 Human Liver, kidney ovary,
testes
Spleen, skin, esophagus
UGT1A10 Human Intestine, lung
UGT2B
Gene
Species
Tissue
Expression
UGT2B1 Rat Liver, low in kidney, intestine, testes
UGT2B2,3 Rat liver
UGT2B4 Human liver
UGT2B5 Rabbit
UGT2B6 Rat
UGT2B7 Human, Rat,
Mouse
Liver, kidney, espophagus, intestine,
brain (cerebellum)
UGT2B8 Rat liver
UGT2B9 Monkey liver
UGT2B10 Human Liver, adrenals, prostate
UGT2B11 Human RNA present in liver, kidney,mammary,
prostate, skin, adipose, adrenal, and
lung
UGT2B12 Rat Liver, kidney, intestine
UGT2B13,
14, 16
Rabbit Adult liver
UGT2B15 Human Liver, prostate, testes, esophagus
UGT2B17 Human Liver, kidney, prostate, testes, uterus,
placenta, mammary, adrenals, skin
UGT2B18,
19, 20
Monkey
UGT2B21 Guinea pig
Remmel RP., et al. In Drug Metabolism in Drug Discovery and Development. Eds: Humphreys GW, et al. 2007. Wiley.
(Link) III
42 AAPS Annual Meeting 2015 / UGT / Upendra Argikar
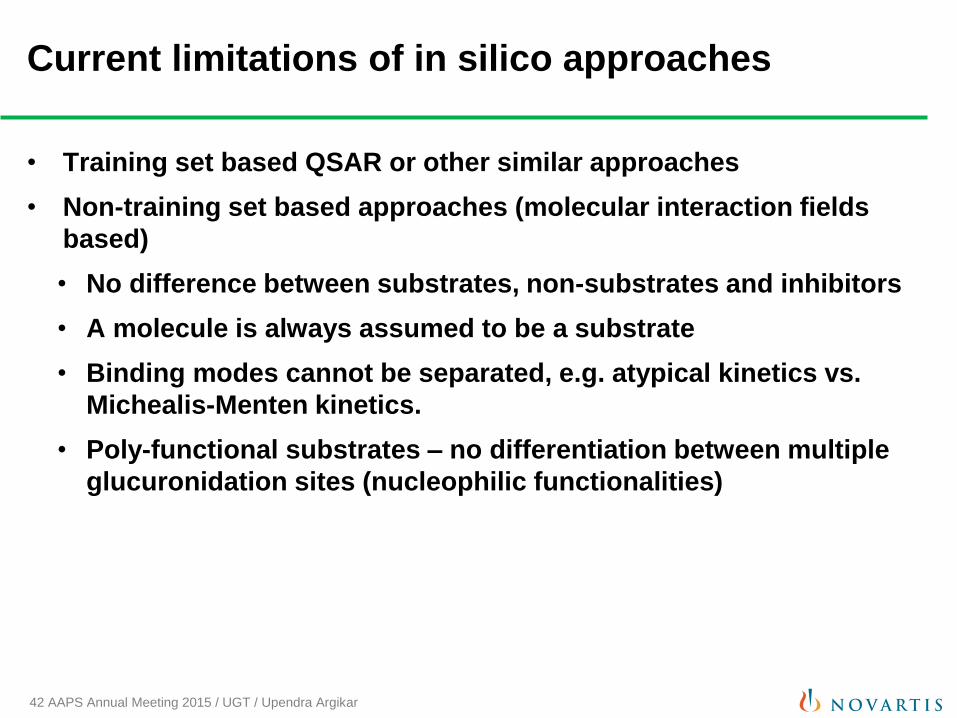
Current limitations of in silico approaches
• Training set based QSAR or other similar approaches
• Non-training set based approaches (molecular interaction fields
based)
• No difference between substrates, non-substrates and inhibitors
• A molecule is always assumed to be a substrate
• Binding modes cannot be separated, e.g. atypical kinetics vs.
Michealis-Menten kinetics.
• Poly-functional substrates – no differentiation between multiple
glucuronidation sites (nucleophilic functionalities)
43 AAPS Annual Meeting 2015 / UGT / Upendra Argikar
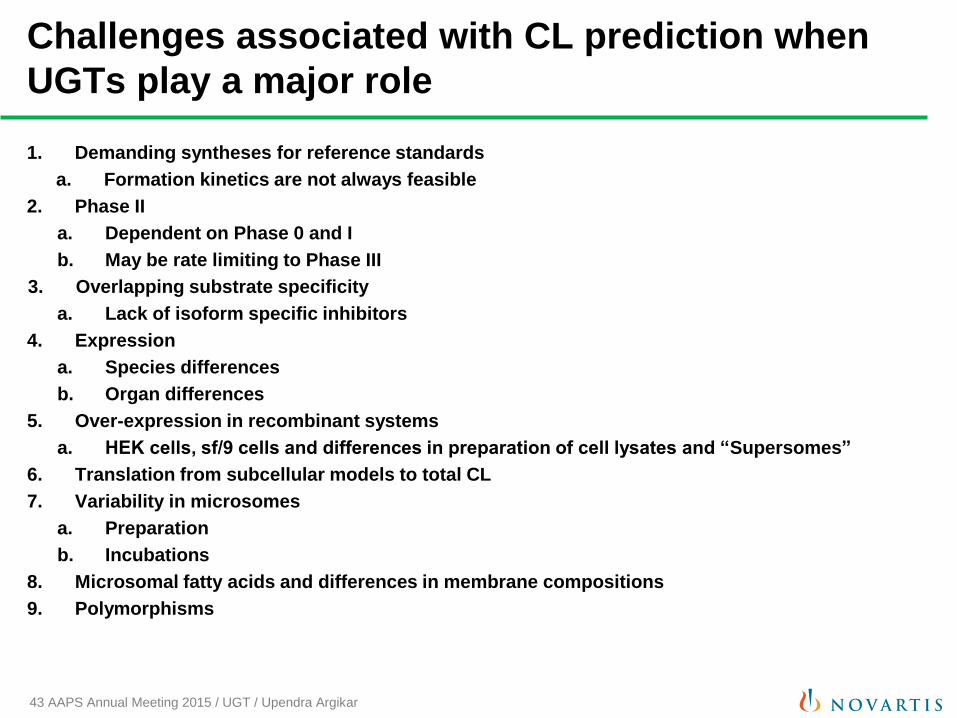
Challenges associated with CL prediction when
UGTs play a major role
1. Demanding syntheses for reference standards
a. Formation kinetics are not always feasible
2. Phase II
a. Dependent on Phase 0 and I
b. May be rate limiting to Phase III
3. Overlapping substrate specificity
a. Lack of isoform specific inhibitors
4. Expression
a. Species differences
b. Organ differences
5. Over-expression in recombinant systems
a. HEK cells, sf/9 cells and differences in preparation of cell lysates and “Supersomes”
6. Translation from subcellular models to total CL
7. Variability in microsomes
a. Preparation
b. Incubations
8. Microsomal fatty acids and differences in membrane compositions
9. Polymorphisms
44 AAPS Annual Meeting 2015 / UGT / Upendra Argikar
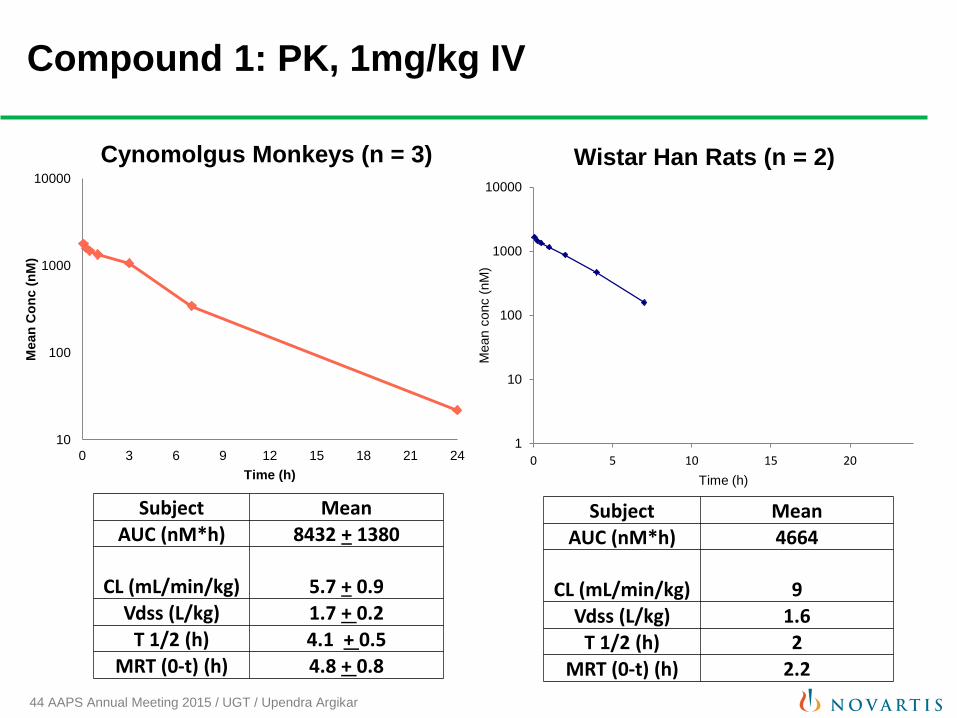
Compound 1: PK, 1mg/kg IV
10
100
1000
10000
0 3 6 9 12 15 18 21 24
Mean
Co
nc (
nM
)
Time (h)
Cynomolgus Monkeys (n = 3)
Subject Mean AUC (nM*h) 8432 + 1380
CL (mL/min/kg) 5.7 + 0.9 Vdss (L/kg) 1.7 + 0.2
T 1/2 (h) 4.1 + 0.5 MRT (0-t) (h) 4.8 + 0.8
1
10
100
1000
10000
0 5 10 15 20
Mean c
onc (
nM
) Time (h)
Wistar Han Rats (n = 2)
Subject Mean AUC (nM*h) 4664
CL (mL/min/kg) 9 Vdss (L/kg) 1.6
T 1/2 (h) 2 MRT (0-t) (h) 2.2
45 AAPS Annual Meeting 2015 / UGT / Upendra Argikar
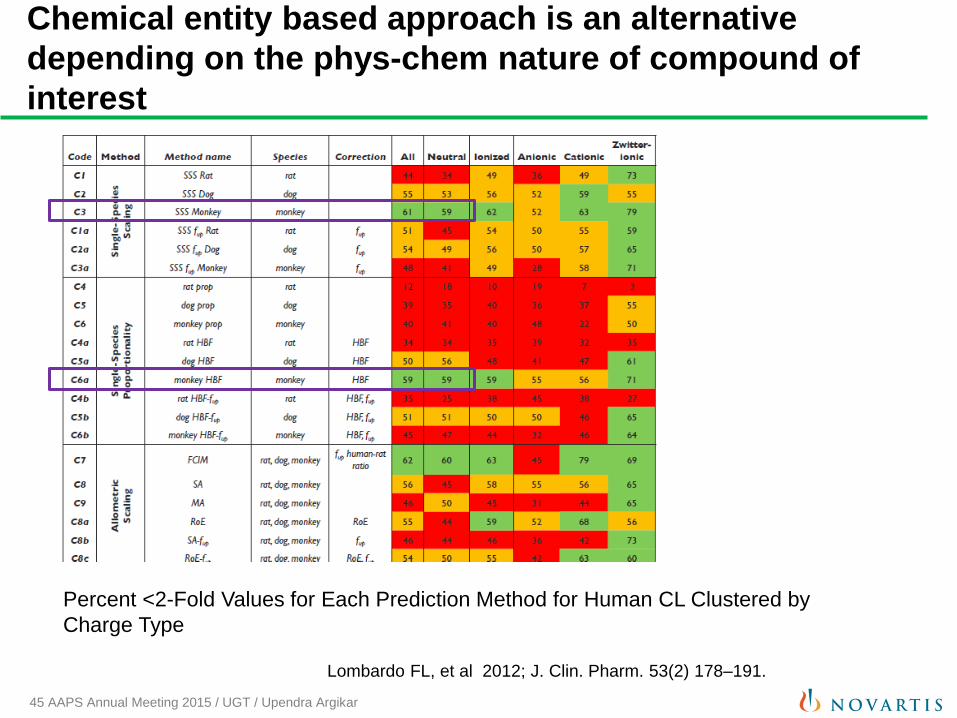
Chemical entity based approach is an alternative
depending on the phys-chem nature of compound of
interest
Lombardo FL, et al 2012; J. Clin. Pharm. 53(2) 178–191.
Percent <2-Fold Values for Each Prediction Method for Human CL Clustered by
Charge Type
46 AAPS Annual Meeting 2015 / UGT / Upendra Argikar
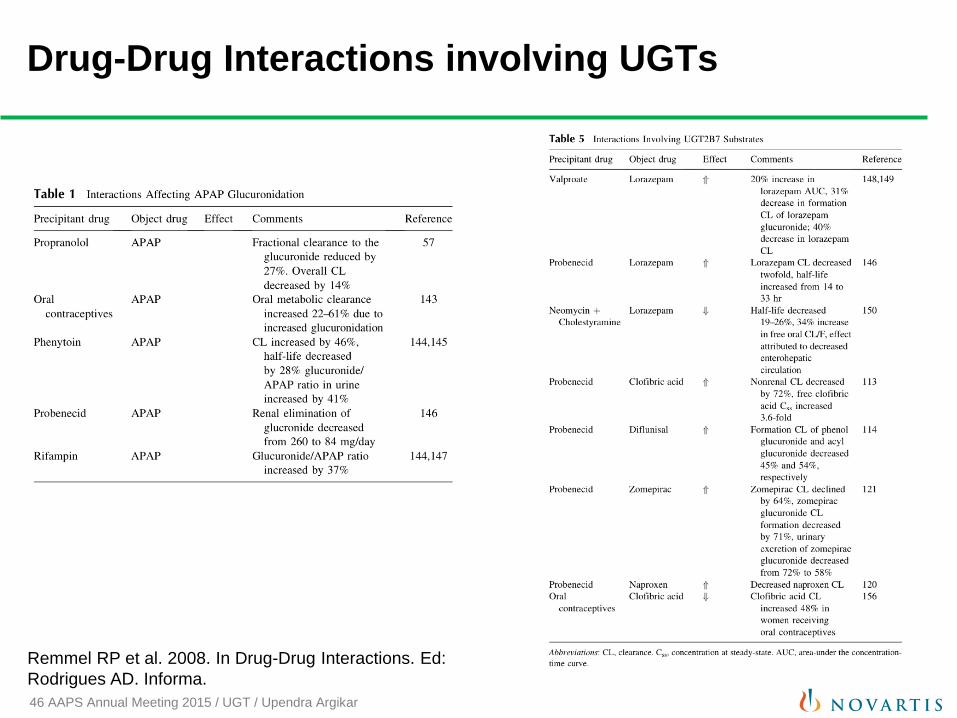
Drug-Drug Interactions involving UGTs
Remmel RP et al. 2008. In Drug-Drug Interactions. Ed:
Rodrigues AD. Informa.
47 AAPS Annual Meeting 2015 / UGT / Upendra Argikar
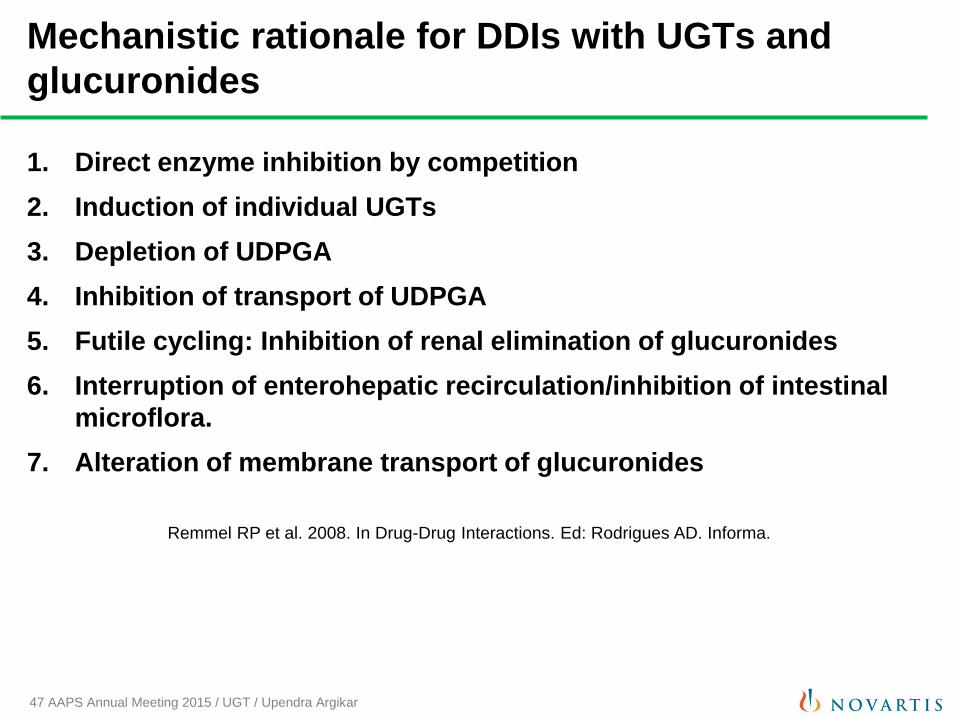
Mechanistic rationale for DDIs with UGTs and
glucuronides
1. Direct enzyme inhibition by competition
2. Induction of individual UGTs
3. Depletion of UDPGA
4. Inhibition of transport of UDPGA
5. Futile cycling: Inhibition of renal elimination of glucuronides
6. Interruption of enterohepatic recirculation/inhibition of intestinal
microflora.
7. Alteration of membrane transport of glucuronides
Remmel RP et al. 2008. In Drug-Drug Interactions. Ed: Rodrigues AD. Informa.
48 AAPS Annual Meeting 2015 / UGT / Upendra Argikar
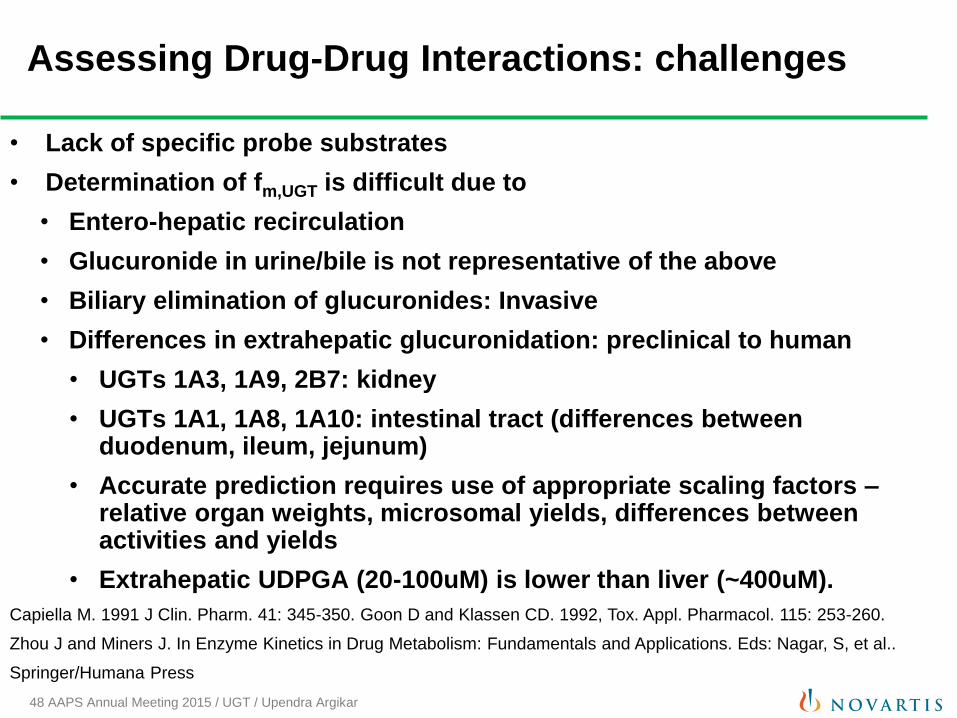
Assessing Drug-Drug Interactions: challenges
• Lack of specific probe substrates
• Determination of fm,UGT is difficult due to
• Entero-hepatic recirculation
• Glucuronide in urine/bile is not representative of the above
• Biliary elimination of glucuronides: Invasive
• Differences in extrahepatic glucuronidation: preclinical to human
• UGTs 1A3, 1A9, 2B7: kidney
• UGTs 1A1, 1A8, 1A10: intestinal tract (differences between duodenum, ileum, jejunum)
• Accurate prediction requires use of appropriate scaling factors – relative organ weights, microsomal yields, differences between activities and yields
• Extrahepatic UDPGA (20-100uM) is lower than liver (~400uM).
Capiella M. 1991 J Clin. Pharm. 41: 345-350. Goon D and Klassen CD. 1992, Tox. Appl. Pharmacol. 115: 253-260.
Zhou J and Miners J. In Enzyme Kinetics in Drug Metabolism: Fundamentals and Applications. Eds: Nagar, S, et al..
Springer/Humana Press
49 AAPS Annual Meeting 2015 / UGT / Upendra Argikar
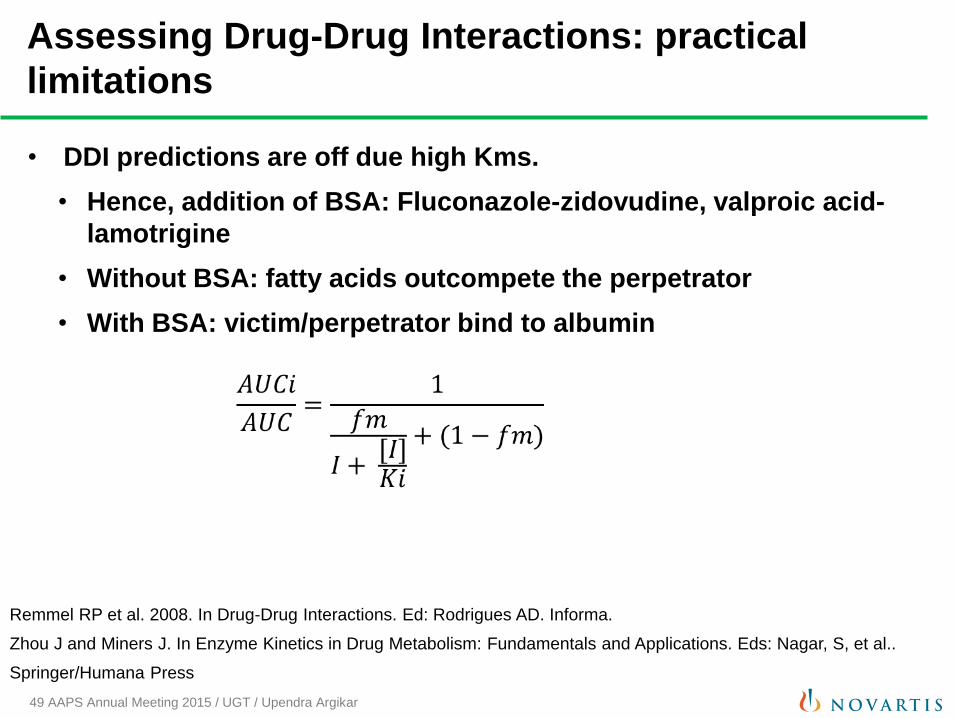
Assessing Drug-Drug Interactions: practical
limitations
• DDI predictions are off due high Kms.
• Hence, addition of BSA: Fluconazole-zidovudine, valproic acid-
lamotrigine
• Without BSA: fatty acids outcompete the perpetrator
• With BSA: victim/perpetrator bind to albumin
Remmel RP et al. 2008. In Drug-Drug Interactions. Ed: Rodrigues AD. Informa.
Zhou J and Miners J. In Enzyme Kinetics in Drug Metabolism: Fundamentals and Applications. Eds: Nagar, S, et al..
Springer/Humana Press
50 AAPS Annual Meeting 2015 / UGT / Upendra Argikar
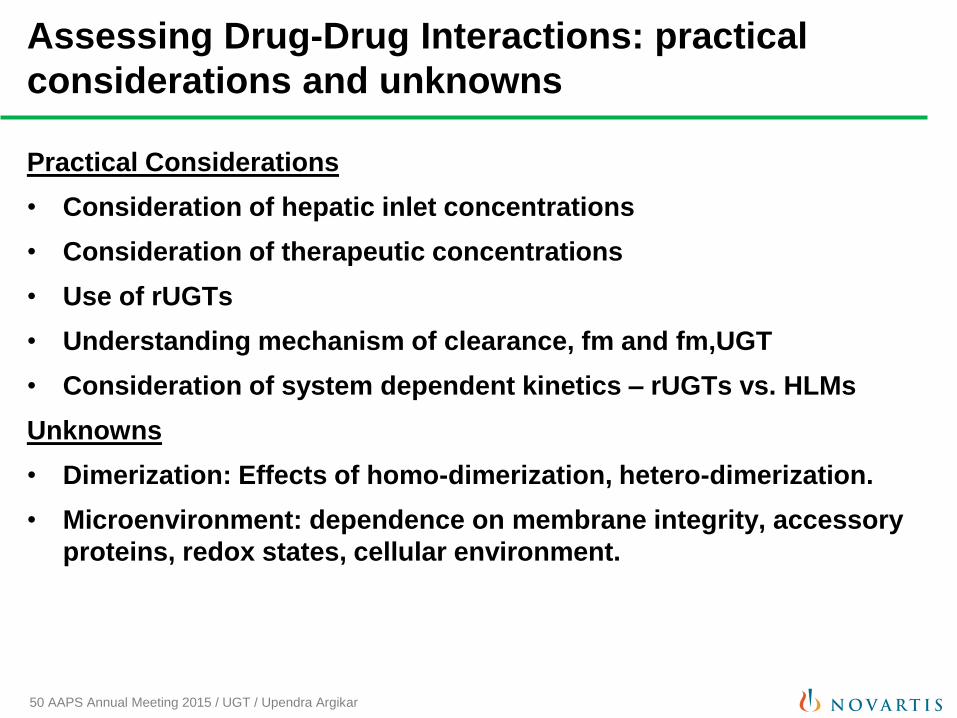
Assessing Drug-Drug Interactions: practical
considerations and unknowns
Practical Considerations
• Consideration of hepatic inlet concentrations
• Consideration of therapeutic concentrations
• Use of rUGTs
• Understanding mechanism of clearance, fm and fm,UGT
• Consideration of system dependent kinetics – rUGTs vs. HLMs
Unknowns
• Dimerization: Effects of homo-dimerization, hetero-dimerization.
• Microenvironment: dependence on membrane integrity, accessory
proteins, redox states, cellular environment.