
Measurement of local IgE in allergic rhinitis and chronic ...€¦ · Measurement of local IgE in...
55
Academic Year 2013 - 2014 Measurement of local IgE in allergic rhinitis and chronic rhinosinusitis with and without nasal polyposis Sander De Bruyne Eveline Van Mulders Promotor: Prof. Dr. Philippe Gevaert Mentor: Dr. Margot Berings Dissertation presented in the 2nd Master year in the programme of Master of Medicine in Medicine FACULTY OF MEDICINE AND HEALTH SCIENCES
Transcript of Measurement of local IgE in allergic rhinitis and chronic ...€¦ · Measurement of local IgE in...

Academic Year 2013 - 2014
Measurement of local IgE in allergic rhinitis and chronic rhinosinusitis with and without
nasal polyposis
Sander De Bruyne
Eveline Van Mulders
Promotor: Prof. Dr. Philippe Gevaert
Mentor: Dr. Margot Berings
Dissertation presented in the 2nd Master year in the programme of
Master of Medicine in Medicine
FACULTY OF MEDICINE AND
HEALTH SCIENCES

II
“The author and the promotor give the permission to use this thesis for consultation
and to copy parts of it for personal use. Every other use is subject to the copyright
laws, more specifically the source must be extensively specified when using results
from this thesis.”
14/04/2014
Sander De Bruyne Prof. Dr. Philippe Gevaert Eveline Van Mulders

III
FOREWORD
This thesis was written within the context of our Master degree in Medicine at Ghent
University. It is a composition of statistical analysis on datasets acquired at the
Department of Otorhinolaryngology of the University Hospital of Ghent and data we
collected in our own experiment.
We compare nasal measurement with different techniques and we discuss their role.
Literature research started in September 2012 and was continued until February 2014.
Statistical analysis was performed from June 2013 till March 2014.
In addition, experiments occurred from November 2013 until March 2014. Later on,
we performed the necessary statistical analyses in order to interpret the collected data.
We wish to thank those without whose help this work could not have been
accomplished: (1) the patients who participated in the experiments; (2) Prof. Dr.
Philippe Gevaert and Dr. Margot Berings for their guidance, assistance and
encouragements; last but not least our friends and family who supported us
throughout the course of this assignment.
Sander De Bruyne
Eveline Van Mulders
April 2014

IV
LIST OF ABBREVIATIONS
AR = Allergic rhinitis ARIA= Allergic Rhinitis and its Impact on Asthma BDL= Below detection level CRS= Chronic rhinosinusitis CRSsNP= Chronic rhinosinusitis without nasal polyposis CRSwNP= Chronic rhinosinusitis with nasal polyposis CSR= Class switch recombination CUAI= Chronic upper airway inflammation DF= Dilution factor EPOS= European Position paper on Rhinosinusitis and Nasal polyps ESS= Endoscopic sinus surgery FLC= Free light chains Gx3 IgE= Grass pollen specific IgE HDM= House dust mite IQR= Interquartile range NAPT= Nasal provocation test NCA= Neutrophil chemotactic activity NP= Nasal polyposis NSA= Nasal secretory activity RR= Receptor revision RSV= Respiratory syncytial virus SAE= Staphylococcus aureus enterotoxin SPA= Staphylococcal protein A SPT= Skin prick test RAST= Radio-Allergo-Sorbent-Test TSST= Toxic shock syndrome toxin VAS= Visual analogue scale WNS= Weight of nasal secretions collected

V
LIST OF FIGURES
Figure 1: SPT procedures. ............................................................................................ 18
Figure 2: Material and venipuncture. ........................................................................... 19
Figure 3: Material for sampling of nasal secretions. .................................................... 19
Figure 4: Sampling of nasal secretions. ....................................................................... 20
Figure 5: Processing of nasal secretions. ..................................................................... 21
Figure 6: Correlations between tissue, serum and Merocel nasal secretions. .............. 23
Figure 7: Comparison of the change in total IgE concentrations in placebo and
omalizumab treated groups in nasal secretions collected with Merocels...…………..24
Figure 8: Comparison of change in total IgE (A) and SAE-IgE concentrations (B) in
placebo and mepolizumab treated groups in nasal secretions collected with
Merocels. .............................................................................................................. 25
Figure 9: Total IgE in nasal secretions after treatment with methylprednisolone (solid
triangles), doxycycline (solid squares) or placebo (solid circles) in nasal
secretions collected with Merocels. ..................................................................... 26
Figure 10: Comparison of inflammatory measurements in nasal secretions collected
with filter discs. .................................................................................................... 29
Figure 11: Comparison of total IgE and HDM sIgE concentrations in serum (E and F)
and nasal secretions collected with Merocels (A and B) and filter discs (C and D)
in control patients and AR patients. ..................................................................... 31
Figure 12: Correlations between HDM sIgE concentrations in serum and in nasal
secretions collected with Merocels and filter discs.. ............................................ 32

VI
LIST OF TABLES
Table 1: Descriptives of total IgE measurement by means of Merocel, tissue and
serum .................................................................................................................... 24
Table 2: Descriptives of total IgE measurements at baseline and after treatment with
placebo or omalizumab in nasal secretions collected with Merocels. ................. 24
Table 3: Descriptives of total IgE and SAE-IgE measurements at baseline and after
placebo or mepolizumab treatment in nasal secretions collected with Merocels 25
Table 4: Descriptives of total IgE change from baseline in placebo, doxycycline and
methylprednisolone treated groups in nasal secretions collected with Merocels 26
Table 5: Inflammatory measurements in nasal secretions collected with filter discs in
control patients, grass pollen sensitive AR patients, CRSwNP patients and
CRSwNP with grass pollen allergy patients. ....................................................... 28
Table 6: Baseline demographic and clinical characteristics of control patients and
HDM sensitive AR patients. ................................................................................ 29
Table 7: Total IgE and HDM sIgE in nasal secretions (Merocel and filter disc) and
serum in control patients and HDM sensitive AR patients. ................................. 30
Table 8: Total IgE and HDM sIgE measurements in HDM sensitive AR patients in
serum and nasal secretions (filter disc and Merocel). .......................................... 33
Table 9: Summary strengths and weaknesses tissue, Merocels and filter discs……...38
LIST OF APPENDICES
Appendix 1: Overview of the ‘superantigen hypothesis’ of CRS. ................................ X
Appendix 2: Management scheme for adults with CRS with NP for ENT specialists
based on the EPOS guidelines. ............................................................................. X
Appendix 3: Position of a Merocel inside the nasal cavity between the inferior
turbinate and the septum. .................................................................................... XI
Appendix 4: Classification of allergic rhinitis according to ARIA ............................ XI

VII
TABLE OF CONTENTS
FOREWORD………………………………………………………………….…... III
LIST OF ABBREVATIONS………………………………………………...……. IV
LIST OF FIGURES…………………………………………………………………V
LIST OF TABLES………………………………………………………………….VI
LIST OF APPENDICES…………………………………………………………...VI
1 ABSTRACT ........................................................................................................... 1
2 INTRODUCTION ................................................................................................. 5
2.1 Chronic upper airway inflammation ........................................................................ 5 2.1.1 Allergic rhinitis ..................................................................................................... 6
2.1.1.1 Classification ............................................................................................................... 6 2.1.1.2 Epidemiology .............................................................................................................. 6 2.1.1.3 Comorbidity ................................................................................................................ 6
2.1.1.3.1 Asthma ................................................................................................................ 6 2.1.1.3.2 Allergy ................................................................................................................. 6 2.1.1.3.3 Chronic rhinosinusitis ......................................................................................... 7
2.1.1.4 Diagnosis ..................................................................................................................... 7 2.1.1.5 Pathophysiology .......................................................................................................... 7
2.1.1.5.1 IgE-dependent mechanisms ................................................................................ 7 2.1.1.5.2 Role of IgE and the inflammatory infiltrate ........................................................ 8
2.1.1.6 Treatment .................................................................................................................... 8 2.1.2 Chronic rhinosinusitis with nasal polyposis .......................................................... 9
2.1.2.1 Epidemiology .............................................................................................................. 9 2.1.2.2 Diagnosis ..................................................................................................................... 9
2.1.2.2.1 Symptoms ............................................................................................................ 9 2.1.2.2.2 Examination ........................................................................................................ 9
2.1.2.2.2.1 Anterior rhinoscopy and nasal endoscopy ................................................... 9 2.1.2.2.2.2 Imaging ........................................................................................................ 9
2.1.2.3 Pathophysiology ........................................................................................................ 10 2.1.2.3.1 Nasal polyps ...................................................................................................... 10 2.1.2.3.2 Local IgE ........................................................................................................... 10 2.1.2.3.3 Inflammatory triggers ........................................................................................ 10 2.1.2.3.4 Local receptor revision and class switch recombination ................................... 11
2.1.2.4 Comorbidity .............................................................................................................. 11 2.1.2.4.1 Allergy ............................................................................................................... 11 2.1.2.4.2 Asthma .............................................................................................................. 12

VIII
2.1.2.5 Medical treatment options ......................................................................................... 12 2.1.2.5.1 Corticosteroids .................................................................................................. 12 2.1.2.5.2 Antibiotics ......................................................................................................... 12 2.1.2.5.3 Anti-IgE ............................................................................................................. 12 2.1.2.5.4 Anti-IL-5 ........................................................................................................... 13
2.2 Measurement of local IgE ........................................................................................ 13 2.2.1 Merocels .............................................................................................................. 14 2.2.2 Filter discs ........................................................................................................... 14 2.2.3 Tissue .................................................................................................................. 15
2.3 Aims of the study ...................................................................................................... 15
3 MATERIALS AND METHODS ........................................................................ 16
3.1 Analyzed datasets ..................................................................................................... 16 3.2 Experiment ............................................................................................................... 17
3.2.1 Patient recruitment .............................................................................................. 17 3.2.2 Skin prick testing ................................................................................................ 17 3.2.3 Blood testing ....................................................................................................... 18 3.2.4 Procedure for collection of nasal secretions ........................................................ 19
3.2.4.1 Sampling of nasal secretions ..................................................................................... 19 3.2.4.2 Processing of nasal secretions ................................................................................... 20
3.3 Literature .................................................................................................................. 21 3.4 Statistical analysis .................................................................................................... 22
4 RESULTS ............................................................................................................. 23
4.1 Correlations between Merocel, tissue and serum total IgE measurements ........ 23 4.2 Dynamic local IgE measurements by means of Merocels .................................... 24
4.2.1 Comparison omalizumab versus placebo ............................................................ 24 4.2.2 Comparison mepolizumab versus placebo .......................................................... 25 4.2.3 Comparison doxycycline, methylprednisolone and placebo ............................... 26
4.3 Local measurements by means of filter discs ........................................................ 27 4.4 Comparison of Merocels and filter discs for the measurement of local IgE
(experiment) ........................................................................................................................ 29 4.4.1 Demographic and clinical features ...................................................................... 29 4.4.2 Total IgE and HDM sIgE are increased locally in nasal secretions in AR patients
with AR ............................................................................................................................ 30
5 DISCUSSION ....................................................................................................... 34
5.1 Merocels for local IgE measurement ...................................................................... 34 5.2 Filter discs for local IgE measurement .................................................................. 35

IX
5.3 Comparison Merocels versus filter discs ............................................................... 36
6 REFERENCES .................................................................................................... 39
APPENDICES…………………………………………………………………...…..X

1
1 ABSTRACT
Introduction: Local production of IgE in the respiratory mucosa has been
demonstrated in allergic rhinitis (allergen specific IgE) and in chronic rhinosinusitis
with nasal polyposis (polyclonal IgE), suggesting a role for local IgE in the
pathogenesis of these inflammatory diseases of the upper airway. It has been suggested
that the majority of allergen-specific IgE in the peripheral blood is not derived from
IgE-secreting cells in the blood, but is produced locally in target organs of allergy such
as the nasal mucosa. Considering the importance of local IgE production, it seems to
be essential to develop non-invasive, reproducible and easy to perform approaches for
measurement of local mucosal IgE production.
Methods: Different datasets with CRS patients (with and without nasal polyps) and
AR patients were analyzed to obtain more knowledge concerning local IgE and its
measurement techniques. Furthermore, a small experiment was performed: in AR
patients and non-allergic control patients, nasal secretions were collected by means of
filter discs and Merocels. The purpose of this experiment was to compare and optimize
both methods for collection of nasal secretions and measurement of local IgE.
Results: Measurement of IgE in serum, tissue homogenates and nasal secretions In a dataset of 112 patients with CRS (with and without NP) levels of total IgE in
serum, in tissue and in nasal secretions (collected with Merocels) were significantly
correlated (p<.0001).
Dynamic measurements of local IgE in nasal secretions collected by means of Merocels 24 patients with CRSwNP and comorbid asthma were treated with omalizumab or
placebo. With omalizumab treatment (n=16), a significant increase in total IgE in nasal
secretions was observed (p=.041). No significant change was found in the placebo
group (n=8). 30 patients with severe NP had a treatment with mepolizumab or placebo.
Mepolizumab treatment (n=20) did not result in a significant change in total IgE and
SAE-IgE in nasal secretions. In the placebo group (n=10) a significant increase in total
IgE (p=.028) and a non-significant increase in SAE-IgE were observed. 47 patients
with CRSwNP had a treatment with methylprednisolone, doxycycline or placebo. In
the placebo group (n=18), a significant change from baseline in total IgE was observed
at week 4 (p=.009). In the methylprednisolone group (n=14) an initial decrease in total
2
IgE was followed by an increase in total IgE, however, these changes were not
significant. In the doxycycline group (n=14) total IgE levels did not change during
treatment.
Local measurements in nasal secretions collected by means of filter discs Nasal secretions were collected by means of filter discs and different biomarkers of
inflammation were measured. The highest total IgE levels were seen in the AR patients
(n=12), followed by the allergic CRSwNP patients (n=12). Both in the AR and the
allergic CRSwNP group, total IgE levels were significantly higher (resp., p=.026 and
p=.017) compared to the control patients (n=12). In the AR patients and the allergic
CRSwNP patients, total IgE was BDL in resp. 3 and 2 subjects. In the CRSwNP
patients without allergy (n=12) and in the control patients, total IgE was BDL in resp.
7 and 8 subjects. Parallel with total IgE, gx3 IgE was the highest in the AR patients
followed by the allergic CRSwNP patients. Levels of Gx3 IgE were BDL in all of the
CRSwNP patients without allergy and the control patients. Gx3 IgE was significantly
higher in the AR patients in comparison with the control (p=.001) and the CRSwNP
patients without allergy (p=.001).
Comparison of Merocels and filter discs for the measurement of local IgE In nasal secretions collected with filter discs and with Merocels, total IgE and house
dust mite specific (HDM) IgE were significantly higher in AR patients (n=15)
compared to control patients (n=15). In the nasal secretions collected with Merocels
total IgE and HDM IgE were BDL in resp. 3 and 4 AR patients, with the filter discs in
resp. 2 and 6 AR patients. HDM sIgE levels in serum, in the nasal secretions collected
by means of Merocels and in nasal secretions collected by means of filter discs were
significantly correlated.
Conclusion: IgE levels in nasal secretions collected by means of Merocels seem to be
a good reflection of local IgE levels in nasal tissue. As collection of nasal secretions by
Merocels is a standardized and non-invasive method, it can be used for repeated
measurements of local IgE and other markers of mucosal inflammation, in order to
study nasal diseases and monitor their treatment. The use of filter discs seems to be a
feasible alternative for collection of nasal secretions and measurement of local IgE.

3
Inleiding: In allergische rhinitis (allergeen-specifiek IgE) en in chronische
rhinosinusitis met neuspoliepen (polyklonaal IgE) is lokale IgE productie in de
respiratoire mucosa aangetoond. Dit veronderstelt een rol voor lokaal IgE in de
pathogenese van deze inflammatoire aandoeningen van de bovenste luchtwegen. Er is
gesuggereerd dat de meerderheid van allergeen-specifiek IgE in perifeer bloed niet
afgeleid is van IgE-secreterende cellen in het bloed, maar afkomstig is van lokale
productie in doelorganen van allergie zoals het neusslijmvlies. Gezien het belang van
lokale IgE productie lijkt het essentieel om niet-invasieve, reproduceerbare en
eenvoudige benaderingen te ontwikkelen waarmee lokale IgE productie kan gemeten
worden.
Methodologie: Verschillende datasets van CRS patiënten (met en zonder
neuspoliepen) en AR patiënten werden geanalyseerd om meer inzicht te verwerven in
lokaal IgE en zijn meettechnieken. Verder werd ook een klein experiment uitgevoerd:
bij AR patiënten en niet-allergische controlepatiënten werden neussecreties verzameld
door middel van filter discs en Merocels. Het doel was om beide methodes met elkaar
te vergelijken en te optimaliseren voor de collectie van neussecreties en lokale IgE
meting.
Resultaten: Meting van IgE in serum, weefselhomogenaten en nasale secreties In een dataset van 112 patiënten met CRS (met en zonder NP) was er een significante
correlatie (p<.0001) tussen de concentraties van totaal IgE in serum, in weefsel en
nasale secreties (verzameld met Merocels).
Dynamische metingen van lokaal IgE in neussecreties verzameld met Merocels 24 patiënten met CRSwNP en comorbide astma ondergingen een omalizumab of een
placebo behandeling. Bij de behandeling met omalizumab (n=16) werd een
aanzienlijke toename van totaal IgE in nasale secreties waargenomen (p=.041). Geen
significante wijzigingen werden gevonden in de placebo groep (n=8). 30 patiënten met
ernstige NP ondergingen een behandeling met mepolizumab of placebo. Mepolizumab
behandeling (n=20) resulteerde niet in een significante verandering in totaal IgE en
SAE-IgE in nasale secreties. In de placebo groep (n=10) werd er een significante
stijging van totaal IgE (p=.028) en een niet significante toename in SAE-IgE
waargenomen. 47 patiënten met CRSwNP ondergingen een behandeling met
methylprednisolone, doxcycline of placebo. In de placebo groep (n=18) werd een

4
significante verandering in totaal IgE ten opzichte van de baseline waargenomen in
week 4 (p=.009). In de methylprednisolone groep (n=14) werd aanvankelijk een
afname van het totaal IgE gezien, gevolgd door een toename, maar dit was niet
significant. In de doxycyclinegroep (n=14) veranderden de totale IgE niveaus niet
tijdens de behandeling .
Lokale metingen in neussecreties verzameld door middel van filter discs Neussecreties werden verzameld door middel van filter discs en verschillende
ontstekingsparameters werden gemeten. De hoogste totale IgE niveaus werden
waargenomen bij AR patiënten (n=12), gevolgd door CRSwNP allergische patiënten
(n=12). Zowel in de AR groep als in de allergische CRSwNP groep waren de totale
IgE concentraties significant hoger (resp. p=.026 en p=.017) vergeleken met
controlepatiënten (n=12). In de AR groep en de allergische CRSwNP groep was totaal
IgE onder de detectielimiet (BDL) in resp. 3 en 2 patiënten. In CRSwNP patiënten
zonder allergie (n=12) en de controlepatiënten was totaal IgE BDL in resp. 7 en 8
patiënten . Parallel aan totaal IgE was Gx3 IgE het hoogst bij de AR patiënten, gevolgd
door de allergische CRSwNP patiënten. Gx3 IgE concentraties waren BDL bij alle
CRSwNP patiënten zonder allergie en bij alle controlepatiënten. Gx3 IgE was
significant hoger bij de AR patiënten in vergelijking met de controlegroep (p=.001) en
de CRSwNP patiënten zonder allergie (p=.001).
Vergelijking tussen Merocels en filter discs voor het meten van lokaal IgE In neussecreties verzameld door middel van filter discs en Merocels waren totaal IgE
en huisstofmijt specifiek IgE (HDM sIgE) significant hoger bij AR patiënten (n=15) in
vergelijking met controlepatiënten (n=15). In neussecreties verzameld met Merocels
waren totaal IgE en HDM sIgE BDL in resp. 3 en 4 AR patiënten, met de filter discs in
resp. 2 en 6 AR patiënten. Significante correlaties werden gevonden tussen HDM sIgE
concentraties in serum, in neussecreties verzameld met Merocels en in neussecreties
verzameld met filter discs.
Conclusie: IgE niveaus in neussecreties verzameld met Merocels lijken een goede
weerspiegeling te zijn van deze in nasaal weefsel. De collectie van nasale secreties met
Merocels is een gestandaardiseerde en niet invasieve methode die gebruikt kan worden
voor herhaaldelijke metingen van lokaal IgE en andere mucosale inflammatie
parameters om zo nasale ziektes te bestuderen en hun behandeling op te volgen. Het
gebruik van filter discs lijkt een haalbaar alternatief.

5
2 INTRODUCTION
2.1 Chronic upper airway inflammation
Chronic upper airway inflammation can be divided into two major clinical entities:
rhinitis and rhinosinusitis. Rhinitis and sinusitis usually coexist [1]. The Allergic
Rhinitis and its Impact on Asthma (ARIA) guidelines define rhinitis as an
‘inflammation of the lining of the nose which is characterized by nasal symptoms
including anterior or posterior rhinorrhoea, sneezing, nasal blockage and/or itching of
the nose being present during two or more consecutive days for more than 1 h on most
days’ [2]. Allergic rhinitis (AR) is an IgE-mediated inflammation of the nose after
allergen exposure such as house dust mite (HDM) and pollen from grass and trees
[2,3]. Many nonallergic conditions can cause nasal symptoms which mimic allergic
rhinitis: infections, physical agents, hormonal imbalance, the use of certain drugs and
anatomical anomalies [4]. According to the European Position Paper on Rhinosinusitis
and Nasal Polyps 2012 (EPOS 2012) [1], rhinosinusitis in adults is defined as an
‘inflammation of the nose and the paranasal sinuses, characterized by two or more
symptoms, one of which should be either nasal blockage/obstruction/congestion or
nasal discharge (anterior/posterior nasal drip), ± facial pain/pressure , ± reduction or
loss of smell and either endoscopic signs of: nasal polyps, and/or mucopurulent
discharge primarily from middle meatus and/or oedema/mucosal obstruction primarily
in middle meatus and/or CT changes: mucosal changes within the ostiomeatal complex
and/or sinuses.’ Acute rhinosinusitis (ARS) in adults is defined as a sudden onset of
two or more symptoms as mentioned above for less than 12 weeks. If the problem is
recurrent, there must be symptom free intervals to meet the definition. Chronic
rhinosinusitis (CRS) in adults is defined as a presence of two or more symptoms as
listed above for 12 or more weeks [1]. CRS can be divided into a group with and
without endoscopic evidence of nasal polyps [1,5,6]. Chronic rhinosinusitis with nasal
polyps (CRSwNP) is characterized by bilateral, endoscopically visualized nasal polyps
in the middle meatus. In chronic rhinosinusitis without nasal polyps (CRSsNP) no
visible polyps in the middle meatus can be visualized [1]. Nasal polyps are edematous
masses protruding from the nasal and paranasal mucosa which can lead to an
obstruction of the nasal cavities [7,8].

6
2.1.1 Allergic rhinitis
2.1.1.1 Classification AR can be divided into ‘intermittent’ and ‘persistent’. Intermittent means that the
symptoms are present less than 4 days a week or for less than 4 consecutive weeks.
Persistent means that the symptoms are present more than 4 days a week and for
more than 4 consecutive weeks. The severity of AR can be classified as mild or
moderate/severe [2,9]. The classification in severity involves the symptomatology,
but also includes the impairment on quality of life (appendix 4).
2.1.1.2 Epidemiology AR is a common condition affecting 10-20% of the adult population worldwide [10].
In some countries up to 50% of the adolescents register with symptoms of AR [2]. The
prevalence has increased during the past 50 years and is still increasing, especially in
those countries where there was a low or mediate prevalence. Recent increase in the
prevalence cannot be due to a change in gene pool [2]. Rhinitis and allergic diseases
are taken more seriously and the European Union has developed programs to
understand, manage and prevent allergic diseases in a better way [2,11].
2.1.1.3 Comorbidity
2.1.1.3.1 Asthma AR and asthma, both allergen allergic diseases, often coexist [12]. AR and asthma
have a corresponding etiology and show familial and intra-individual connection [2].
Rhinitis is a significant risk factor for adult-onset asthma in both atopic and nonatopic
subjects [2]. Over 80% of asthmatics have rhinitis and 10-40% of patients with rhinitis
have asthma [2]. So the majority of patients with asthma have rhinitis symptoms
suggesting the concept of one airway one disease [13,14]. How more severe the
rhinitis, the more severe the asthma will be [2]. However, not all the patients with
rhinitis have asthma and there are differences between the diseases [13,14]. The
prevalence of asthma in subjects without rhinitis is usually less than 2% [15-17].
2.1.1.3.2 Allergy Other allergic diseases are common for patients with AR. The complex indoor
environment may contribute to an increasing prevalence of atopic diseases. It is proven
that multiple indoor allergens have an additional effect on atopic comorbidities [18].

7
2.1.1.3.3 Chronic rhinosinusitis Inflammation of the nasal mucosal in AR predisposes the atopic individual to develop
CRS. Both diseases show an increasing prevalence and are frequently associated [2].
The association with asthma is stronger in those patients reporting both CRS and AR.
There is an increased prevalence of AR in patients with CRS, but the role of allergy in
CRS remains unclear [19-21]. IgE-mediated mechanisms, responsible for nasal
inflammation, are a main factor in the development of acute and/or chronic sinus
disease [22,23]. In acute and chronic rhinosinusitis a high prevalence of sensitization to
inhalant allergens is found and these patients seem to experience more sinus related
symptoms [2].
2.1.1.4 Diagnosis The diagnosis of AR is usually easy, but is still underdiagnosed. Many patients do
not perceive their symptoms as an impairment in daily life. Normally the diagnosis
of AR is based on a questionnaire, examination and skin tests to common
aeroallergens [2]. In most studies, the diagnosis of allergy was based on the
presence of a positive skin prick test and/or serum specific IgE determinations. This
indicates atopy but may not be sufficient to diagnose AR, particularly the persistent
form [2]. In a study from Tschopp et al. [24] the skin prick test had the best positive
predictive value for the epidemiologic diagnosis of AR compared to Phadiatop or
total serum IgE. AR can also be defined by a positive RAST (Radio-Allergo-
Sorbent-Test) [1].
2.1.1.5 Pathophysiology
2.1.1.5.1 IgE-dependent mechanisms Allergy is caused by a continuous overproduction of IgE to environmental antigens.
This involves different antigens such as indoor or outdoor allergens, foods and other
antigens [25]. Rhinitis is associated with increased levels of total serum IgE [26,27].
Allergen-specific IgE binds to receptors on the membranes of mast cells and basophils.
Mast cell accumulation in the airway mucosa is an important pathophysiologic event in
AR. Inhaled allergens are captured in the mucosa of nose and/or lungs. The
accumulation of receptor-bound IgE molecules on exposure to specific allergen results
in the production of inflammatory mediators (histamine, leukotriene and others)
responsible for the allergic response [28]. The link between this IgE-mediated reaction
and rhinitis has been confirmed by the effect of an anti-IgE monoclonal antibody [29-
8
31].
2.1.1.5.2 Role of IgE and the inflammatory infiltrate AR is characterized by an inflammatory infiltrate and the release of mediators is
responsible for the symptoms. Eosinophils, mast cells, T-cells, macrophages,
fibroblasts and other cells form the inflammatory infiltrate of the nasal mucosa in
patients with AR [32-34]. IgE has several pathophysiologic roles such as antigen
presentation, increased mast cell survival, defense against viruses, bacteria, fungi and
parasites and mucosal homeostasis. IgE interacts with B-cells, T-cells, mast cells,
eosinophils and basophils. Cross linking of IgE (bound to the surface of mast cells), the
subsequent degranulation and the release of Th2 cytokines lead to recruitment of
inflammatory cells [2]. Th2-cells drive the synthesis of IgE and the recruitment,
maturation, survival and effector function of accessory cells such as eosinophils,
basophils and mast cells [35].
2.1.1.6 Treatment Standard treatment for IgE-mediated allergic diseases such as AR are
antihistamines. Histamine, one of the major effector cells of allergic reaction, is
released by mast cells and basophils [2].

9
2.1.2 Chronic rhinosinusitis with nasal polyposis
2.1.2.1 Epidemiology There is a lack of valid epidemiological studies for CRSwNP. In a survey based on
endoscopy, Sködve et al. [36] reported a NP prevalence of 2,7% in Sweden. In Finland,
Hedman et al. [37] found in a postal questionnaire survey that 4.3% of the adult
population answered positively to the question as to whether polyps had been found in
their nose. Klossek et al. [38] reported a NP prevalence of 2,1% in France by using a
disease-specific questionnaire. NP can be found in all races and becomes more
prevalent with higher age [38-41]. The average age of onset is approximately 42 years.
NP is uncommon under the age of 20 and in general more frequently found in men
than in women [1].
2.1.2.2 Diagnosis
2.1.2.2.1 Symptoms Diagnostic tests are available to verify the clinical symptoms and signs of
rhinosinusitis. Nonetheless, for the majority of patients, the diagnosis is made in
primary care based on symptoms alone. Symptoms remain the mainstay of diagnosis in
primary care. Symptoms are mainly the same in acute and chronic rhinosinusitis with
and without nasal polyposis, but symptom pattern and intensity may vary. Acute forms
of infections have usually more distinct and often more severe symptoms. [1]
2.1.2.2.2 Examination
2.1.2.2.2.1 Anterior rhinoscopy and nasal endoscopy Anterior rhinoscopy is the first examination in a patient, but alone it has a limited value
[1]. The diagnosis of CRS is based on nasal endoscopy. Compared to anterior
rhinoscopy, nasal endoscopy provides significantly better illumination and
visualization. This allows to obtain detailed information of the nasal cavities [1].
2.1.2.2.2.2 Imaging The plain sinus x-ray features a low cost and availability, but its usefulness is limited
for diagnosing rhinosinusitis due to underestimation of bony and soft tissue pathology
compared to computed tomography (CT) and magnetic resonance imaging (MRI)
[1,42]. CT scanning is first choice for the paranasal sinuses due to optimal display of
air bone and soft tissue, but it should not be regarded as the primary step in the
diagnosis [1].

10
2.1.2.3 Pathophysiology
2.1.2.3.1 Nasal polyps Polyps are infiltrated with inflammatory cells, mainly eosinophils. The local Th2
polarization observed in these polyps is characterized by high levels of eosinophilic
markers, IL-5 and local polyclonal IgE [7]. IL-5 is the key driver of eosinophilic
differentiation and survival. It is assumed that, through release of toxic products,
eosinophils lead to tissue damage and growth of polyps. IL-5 inhibition is a potential
novel therapeutic approach in patients with severe eosinophilic nasal polyposis [43].
2.1.2.3.2 Local IgE In NP homogenates, the level of total or specific IgE is independent of the atopic status
of the patient [1,44-46]. Local IgE in NP is the result of two types of IgE production:
systemic allergic IgE formation and a local polyclonal IgE formation. The local
polyclonal IgE production is located in the stroma and the epithelium of nasal polyps
[7]. Local polyclonal IgE formation occurs mainly in the subgroup of polyps
containing Staphyloccous Aureus enterotoxin-specific IgE [46,47]. High total IgE
concentrations can also be associated with an increase of the soluble low affinity-IgE
receptor sCD23. Membrane-bound CD23 normally binds to IgE, which leads to a
downregulation of IgE production. sCD23 can capture IgE and prevents binding to his
receptor [46].
2.1.2.3.3 Inflammatory triggers Parasites, fungi, viruses and bacteria can stimulate polyclonal lymphocyte responses
and thereby obliterate the specific immune system, resulting in a deficiency of
specificity of antibodies. Two polyclonal stimuli can trigger B-lymphocyte
proliferation and differentiation in the absence of antigen: bacterial products and T-
cells activated by a third-party antigen. Activated T-cells stimulate B-cells in a non-
cognate fashion via CD40 ligand and cytokine production [44]. IgE correlates with the
presence of Staphylococcus aureus enterotoxins (SAE) [1,7,44,45]. Gevaert et al.
demonstrated in about half of the examined polyp specimens polyclonal IgE formation
specific to SAE and a high prevalence of asthma [45]. Stimulation of polyclonal IgE
synthesis could be a way for S.aureus to colonize the nasal mucosa and devoid the
allergic response [47]. Up to 73% of S.aureus strain isolates, produces one or more
enterotoxins [45]. These enterotoxins may act as superantigens [44,45,47,48]
(appendix 1). There are two prominent IgE positive areas in NP: the follicular

11
structures (CD20 B cells and CD3 T cells) and the diffuse lymphoid accumulations
(CD38 plasma cells and CD3 T cells) [44,47]. Biotinylated SAE superantigens bind to
these areas and directly affect the activation of B cells and plasma cells. This activation
leads to isotype switching and synthesis of IgE [45]. These superantigens can also
interact with the T cell receptor (TCR), resulting in a polyclonal T-cell activation with
a Th2 cytokine polarization. [1,45]. Key markers of Th2 inflammation are increased in
NP [47]. These cytokines favour IgE production indirectly by triggering B cell class
switching towards IgE production [1,45]. Each enterotoxin can only bind to a certain
subset of TCR Vβ-chains [45]. The T-cell receptor Vβ repertoire corresponds to the
specific IgE in the polyp tissue [45]. SAE can exert direct effects on eosinophil
proliferation and survival which possibly results in a severe eosinophilic inflammation
[44,45,48]. Beside the enterotoxins, Staphylococcal protein A (SPA) as well as the
toxic shock syndrome toxin (TSST-1) from Staphylococcus aureus, possess B-cell
superantigen moieties which induces polyclonal IgE synthesis [44].
2.1.2.3.4 Local receptor revision and class switch recombination Evidence has been found for local receptor revision (RR), class switch recombination
(CSR) and B-cell differentiation into IgE-secreting plasma cells in NP. NP is
associated with an increase of IL-4. IL-4 stimulates the synthesis of ε-germline gene
transcript (GLT), which has a significant role in the class switch recombination (CSR)
to IgE. Gevaert et al. [47] detected Iε-Cγ switch circle transcript in NP. B-cells and
plasma cells are enhanced in NP, as well as the ratio of plasma cells to B cells [47].
2.1.2.4 Comorbidity
2.1.2.4.1 Allergy To date, there is no clear evidence for a direct relationship between allergy and
rhinosinusitis [49,50]. Increased local IgE synthesis can reinforce allergic reactivity by
triggering mast cell degranulation. However, when the IgE formation is extreme it can
suppress specific reactivity by flooding the high affinity IgE receptors (Fcε receptors)
on mast cells in the tissue through polyclonal IgE. This polyclonal IgE would
neutralize any effect of specific IgEs to environmental allergens [47,48]. This could
explain why the IgE level is independent of the atopic status of the patient [44]. Some
studies show an increase of atopy markers in CRS patients [1]. Between 10 to 54% of
subjects with CRSwNP have allergy. On the other hand, the prevalence of NP in AR
patients has been reported between 0,5 to 4,5%, which is comparable with the normal

12
population [1].
2.1.2.4.2 Asthma CRSwNP is a multifactorial disease that is frequently associated with asthma [46,51].
The group that coexists with asthma is particularly characterized with tissue
eosinophilia and high local IgE levels. In mucosal tissues, mRNA for the ε-chain of
IgE was associated with a significant proportion of B cells [44,47]. This strengthens
the hypothesis of local IgE synthesis [44]. Asthma is described by 26% of patients
with CRSwNP, compared to 6% of controls [1,38,39]. There is a direct correlation
between NP, bronchial hyperreactivity and asthma [51]. Asthmatic patients with
CRSwNP have more nasal symptoms and are associated with high levels of local IL-5
and specific IgE against SAE [1,45,52].
2.1.2.5 Medical treatment options The figure in appendix 2 represents the management of CRSwNP for ENT-specialists
as proposed by EPOS 2012 [8].
2.1.2.5.1 Corticosteroids Treatment with methylprednisolone results in a reduction of systemic or local free light
chains concentrations and can be related to its potent systemic anti-inflammatory
action [43]. Methylprednisolone has a short but dramatic effect on polyp size and
symptoms [1].
2.1.2.5.2 Antibiotics Antibiotics are a therapeutic option because Staphylococcus aureus plays a role in the
pathophysiology of CRSwNP. Doxycycline is an anti-staphylococcal antibiotic that
can be used [1]. A RCT showed a significant effect of oral methylprednisolone and
doxycycline on size of nasal polyps, nasal symptoms and mucosal and systemic
markers of inflammation [53].
2.1.2.5.3 Anti-IgE The local production of IgE is functional and has a role in the regulation of chronic
inflammation. Antagonizing IgE antibodies is a relevant strategy. Omalizumab is a
recombinant DNA-derived humanized IgG1k monoclonal antibody. It reduces serum
and tissue IgE-levels and is a treatment option for patients with allergic and non-
allergic NP [1,48]. Omalizumab binds selectively free human circulating IgE and

13
inhibits the binding of IgE to the high-affinity IgE receptor, decreasing free IgE levels.
Omazilumab also leads to a decrease in IgE receptors on mast cells, basophils, and
dendritic cells [48].
2.1.2.5.4 Anti-IL-5 Mepolizumab is a humanized anti-IL-5 monoclonal antibody and forms a potential
novel therapeutic approach for patients with severe eosinophilic NP. Mepolizumab
achieved a statistically significant reduction in NP size for at least 1 month after dosing
in 12 of patients in a study of Gevaert et al. [43].
2.2 Measurement of local IgE
Local IgE can be measured in nasal tissue homogenates and secretions [44,48].
Different sorts of cells (expelled epithelial cells and immunocompetent cells), plasma
exudation and mucus can be found in nasal secretions. Interesting is the fact that nasal
fluid contains inflammatory mediators reflecting the activity within the nasal mucosa.
Therefore it is possible to detect specific inflammatory cells, inflammatory mediators
and cytokines with biochemical analyzes and to follow the evolution of nasal diseases
[54]. Earlier, blown secretions were the only techniques to investigate nasal secretion,
but the obtained quantities of secretions were extremely variable [55]. Several other
techniques like the brush method, nasal scraping [56], biopsies [57] and the imprint
technique are explored and described . The standardization for these techniques has
improved the quality of analysis, but they are painful for the patient and traumatizing
for the nasal mucosa [54]. Microsuction [58], aspiration [59] and nasal lavage were
designed to collect nasal secretion with the least discomfort and the best reproducibility
[54]. Aspiration and nasal lavage have been described as the most reliable methods for
nasal secretion sampling [60]. These techniques require the cooperation from the
patient, which may be a problem with children or comatose patients. Another
disadvantage is the fact that the collected quantity of material can fluctuate
significantly [54]. Alternative methods for sampling of nasal secretions are the use of
swabs and sponges [54,61]. The use of pre-humidified gauze [62], filter discs [63] and
sinus packs (Merocels) has been described. Measurement of local IgE in the collected
material (tissue and/or nasal secretions) can be done by means of the UniCAP system
[44,48].

14
2.2.1 Merocels Merocels have already been used for several different purposes. They are mostly used
in nasal surgery, epistaxis management, endoscopic sinus surgery (ESS), transseptal
suturing and septoplasty to control bleeding [54]. Merocels are also considered as a
non-invasive, atraumatic and reproducible technique for the collection of nasal
secretions in order to do biochemical analyses [54]. Examples of use of Merocels for
monitoring local inflammation, for monitoring medical and surgical treatment are the
following: In a study of Watelet et al. [64] Merocels were used to follow different
phases of wound repair by detecting changes in the secretion of growth factors. In
another study Merocel samples were collected to determine IgA titers to respiratory
syncytial virus (RSV) fusion and attachment glycoproteins [65]. Gevaert et al. [48]
measured ECP, IL-5, sCD23, sIL-5Rα, total IgE and tryptase in nasal secretions
collected with Merocels from one sample. Klimet et al. [61] used Merocels for
monitoring the therapeutic efficacy of immunotherapy in AR by detecting specific cell
activation markers like ECP or tryptase. In a twelve-year follow-up study after
endoscopic sinus surgery (ESS) in patients with CRSwNP, nasal secretions were
collected by placing Merocels in the nasal cavities to measure different proteins (IL-5,
IL-5Rα, TGF-β1, MPO, ECP, total IgE and specific IgE antibodies) [66]. In a study
from Cassona et al. [67] Merocels appeared to be well tolerated by patients and showed
the lowest percentage of cytological alteration of ciliated cells compared to Clauden,
two-fingered glove pack with gauzes inside and Lyofoam.
2.2.2 Filter discs A filter disc is a small round piece of paper, punched out from a commercially
available synthetic filter card, placed into the nose against the nasal septum. Filter discs
are the collection system the most comparable to Merocels. It is a non-invasive,
relatively simple, quantitative technique that can be removed atraumatically [68]. Filter
discs are smaller than Merocels and give less stimulation of the nasal mucosa. In a
study from Naclerio et al. [68] filter discs were used to observe the effects of
histamine, methacholine, ipratropium bromide and atropine on the nasal mucosa.
Baumann et al. [69] used the filter disc method to detect cytokine levels in AR patients.
In another study with AR patients, filter discs were used to investigate the role of IL-31
[70]. Filter discs have also been used to differentiate congestive hyperresponsiveness
in AR by applying nasal bradykinin unilateral [71]. The paper filter method was
15
already used in the context of HDM allergy to measure neutrophil chemotactic activity
(NCA) and histamine content in nasal secretions [72]. Howarth et al. used an allergen
solution on the surface of a small filter disc to induce local allergen provocation in
order to stimulate inflammatory cells such as eosinophils, mastcells and neutrophils
[73]. Lien calus et al. [66], collected nasal secretions before and 15 minutes after
NAPT, by placement of filter discs in the nose, to measure total IgE, total IgG, specific
IgG4 and tryptase concentrations.
2.2.3 Tissue Tissue extraction is the most reliable local measurement technique and thereby the
golden standard. It is an invasive procedure, but can inform directly about a range of
mucosal tissue cellular events [73]. Gevaert et al. [44] obtained fresh tissue strips from
nasal polyps during routine septal and sinus surgery to determine concentrations of
total IgE and IgE antibodies to inhalant allergens and S. aureus enterotoxins. In a study
from Lien Calus et al. [66] nasal tissue, namely NP tissue from CRSwNP patients, was
collected during endoscopic sinus surgery (ESS) to measure different proteins (IL-5,
IL-5Rα, TGF-β1, MPO, ECP, total IgE and specific IgE antibodies).
2.3 Aims of the study Several datasets were analyzed to obtain more knowledge concerning local IgE in AR
patients and CRSwNP patients. Further, we wanted to demonstrate the validity of local
IgE measurements on nasal secretions collected with Merocels and illustrate the role of
filter discs as a possible alternative. The experiment was performed in order to
optimize the process of collection of nasal secretions by using Merocels and filter discs
and to make a comparison between them.

16
3 MATERIALS AND METHODS
3.1 Analyzed datasets Data of 112 study subjects with CRS (with and without NP) collected at the
Department of Otorhinolaryngology of the University Hospital of Ghent were used to
compare IgE measurement by means of Merocel, tissue and serum [74]. Data of a
study with omalizumab [48] were used to analyze differences in total IgE
concentration when subjects underwent a placebo or an omalizumab treatment. A
randomized, double-blind, placebo-controlled study of allergic and nonallergic patients
with NP and comorbid asthma (n= 24) was conducted. Subjects received 4 to 8
(subcutaneous) doses of omalizumab (n= 16) or placebo (n= 8). The primary end point
was a reduction in total nasal endoscopic polyp scores after 16 weeks. The study was
conducted at the Department of Otorhinolaryngology of the University Hospitals of
Ghent (n= 20 patients) and Leuven (n= 4 patients), Belgium. A dataset of thirty
patients with severe NP (grade 3 or 4 or recurrent after surgery), refractory to
corticosteroid therapy, was used to measure the differences in total IgE after a placebo
or mepolizumab treatment. Patients were randomized in a double-blind fashion to
receive either 2 single intravenous injections (28 days apart) of 750 mg of
mepolizumab (n= 20) or placebo (n= 10). Change from baseline in NP score was
assessed monthly until 1 month after the last dose (week 8). Computed tomographic
scans were also performed at week 8. The objective of this study was to investigate the
therapeutic potential of inhibiting IL-5 with a humanized mAb as treatment for severe
NP. This study was also conducted at the Department of Otorhinolaryngology of the
University Hospital in Ghent. At last, data were used to analyze differences in total IgE
concentration over the time during 6 visits (at baseline, week 1, week 2, week 4, week
8, week 12), in placebo (n= 18), in doxycycline (n= 14) and in methylprednisolone (n=
14) treated groups. In a double-blind, placebo-controlled, multicenter trial, 47
participants with bilateral NP were randomly assigned to receive either
methylprednisolone in decreasing doses (32–8 mg once daily), doxycycline (200 mg
on the first day, followed by 100 mg once daily) or placebo for 20 days. Participants
were followed for 12 weeks. Patients were assessed for nasal peak inspiratory flow and
symptoms and by nasal endoscopy. Markers of inflammation such as eosinophilic
cationic protein (ECP), IL-5, myeloperoxidase, matrix metalloproteinase 9, and IgE

17
were measured in nasal secretions. Concentrations of eosinophils, ECP, and soluble IL-
5 receptor α were measured in peripheral blood samples. The original endpoint of this
study was to evaluate the effects of oral glucocorticoids and doxycycline on symptoms
and objective clinical and biological parameters in patients with CRSwNP. To
illustrate the role of filter discs for local measurements, different biomarkers (before
nasal allergen provocation) were analyzed (total IgE, gx3 IgE, IgG, IgG4 and tryptase)
based on a dataset [66] with 12 grass pollen allergic CRSwNP patients. The patients
underwent a nasal allergen provocation test (NAPT) with grass pollen and were
compared to 12 grass pollen AR patients and 12 control patients. Further, VAS scores
of different symptoms, serum and nasal secretions were collected before and after
NAPT. A skin prick test was performed on all the patients for different common
aeroallergens to diagnose grass pollen allergy. The primary endpoint of this study was
the NAPT. The study was conducted at the Department of Otorhinolaryngology of the
University Hospitals of Ghent.
3.2 Experiment
3.2.1 Patient recruitment 15 patients with AR to house dust mite (HDM) and 15 control patients were recruited
from the Department of Otorhinolaryngology at the Ghent University Hospital. All
patients submitted a skin prick test (SPT) for 8 different common aeroallergens.
Patients with HDM sensitive AR were selected based on symptoms and a positive SPT
for HDM (Derm. Pteronyssinus ± Derm. Farina). The control subjects had a negative
SPT and were free of acute nose or sinus disease at the moment of sampling, no
chronic nasal or sinus complaints were reported in their history. The local ethical
committee on human experimentation of the institution (Ghent University Hospital,
Belgium) had given its approval for this project, and each participant gave an informed
consent before enrolment.
3.2.2 Skin prick testing A skin prick test (SPT) was performed in control and patient groups to demonstrate an
allergic response to a specific allergen (figure 1). Controls were performed with
Histamindihydrochloride 0,1% (positive control) and NaCl 0.9% (negative control).
Eight allergens were selected: Grasses, Trees, Artemesia vulgaris, Dermatophagoides
pteronyssinus, Dermatophagoides farina, Cat, Dog and Alternaria alternate. The SPT

18
was carried out on the inner forearm 2-3 cm from the wrist and the antecubital fossae.
The location of each allergen was coded with a marker pen to identify the allergens to
be tested with a distance between two SPTs (≥ 2 cm) to avoid false-positive reactions
due to direct contamination of a nearby test or secondary to an axon reflex [75]. A drop
of the allergen solution was placed on the skin in identical order for each tested subject
and immediately pricked through the drop using the tip of a lancet. Positive and
negative controls were first measured. After 15 minutes the largest diameter of the
wheal of each particular test was measured. The result was considered as positive when
the wheal had a diameter of ≥ 3 mm.
Figure 1: SPT procedures. (A) Allergen solutions. (B) Lancets. (C) Prick testing with lancet through a drop of allergen extract. (D) Waiting for 15 minutes. (E) Measuring the largest diameter of the wheal of each particular test.
3.2.3 Blood testing All the control and AR patients had a blood test to measure the concentration of total
IgE and HDM sIgE. Blood was collected by performing a standard venipuncture
(Serum gel separator tubes Terumo Venosafe, Ref VF-109SDK, figure 2) and allowed
to clot for 15-30 minutes. After that the blood was centrifuged for 15 minutes at 1500g
at 4°C. Serum was stored in aliquots at -20°C until further analysis with the UniCAP
system (Pharmacia & Upjohn, Uppsala, Sweden).

19
Figure 2: Material and venipuncture. (A) From the left to the right: garrot, serum tube, needle, holder, cotton pad and adhesive plaster. (B) Standard venipuncture.
3.2.4 Procedure for collection of nasal secretions
3.2.4.1 Sampling of nasal secretions Filter paper discs (figure 3 C) were punched from filter cards (Shandon, Pittsburgh,
PA) using a 10-mm punch. The filter cards are made from a blend of 100% cotton and
cellulose fibers and have excellent absorbent properties. Before the experiments, the
Merocels and filter discs were placed separately in pairs in Falcon tubes (Blue Max Jr.
15-ml polypropylene conical tube, 17×120 mm style FALCON, Becton Dickinson
Lab- ware, Franklin Lakes, N.J., figure 3 A) and weighed (figure 4 A), coded and
registered. Filter discs were first placed in both nasal cavities under direct visualization
using a surgical headlight, a speculum and bayonet forceps (figure 3 A) in control and
patient groups for 5 minutes (figure 4 B) and afterwards placed back in the respective
Falcon tube. Secondly, Merocels went trough the same procedure, but for 10 minutes
(figure 4 D). The filter discs and Merocels were inserted on the floor of the cavity
between the septum and inferior turbinate (appendix 3, figure 4 C).
Figure 3: Material for sampling of nasal secretions. (A) From the left to the right: syringe, Falcon tube with two filter discs, nose speculum and bayonet forceps. (B) Falcon tube with two swollen Merocels after insertion in the nasal cavities. (C) Filter disc.

20
Figure 4: Sampling of nasal secretions. (A) Filter discs in Falcon tube weighed before insertion. (B) Placing filter discs in the nasal cavities for 5 minutes. (C) Position of the filter disc in the nasal cavity. (D) Merocels went trough the same procedure, but were placed in the nasal cavities for 10 minutes.
3.2.4.2 Processing of nasal secretions The quantity of secretions collected was determined by comparing the weight of
Merocels and filter discs with the Falcon tube before and after insertion using the same
balance (A&D Instruments Ltd., type HR-120, Japan) (figure 4 A and figure 5 A). The
difference corresponds to the weight of nasal secretion collected (WNS). The Merocels
and filter discs were washed with 0.9% NaCl solution (Merck Eurolab, Belgium, figure
5 B) and incubated for two hours at 4°C (figure 5 C). The volume of 0.9% added NaCl
solution was measured by a formula based on a dilution factor (DF) and the WNS:
volume (ml) = (DF x WNS) – WNS. In previous experiments [54] with fixed amount
of 0,9% NaCl solution for dilution (e.g. 3 ml), the amount of added NaCl was
sometimes very high in comparison with the amount of nasal secretion that was
collected (weight difference). Therefore, it is likely that some of the measurements
were BDL due to excessive dilution. We chose to use fixed DFs: 10 for the Merocels
and 20 for the filter discs. With this method it is unlikely that measurements are BDL
due to excessive dilution. The filter discs and Merocels were placed into the shaft of a
syringe (Plastipak 5 ml, Becton-Dickinson S.A., Cno. De Valdeoliva S/N, Madrid) and
all the fluid was pushed out of it by moving the piston of the syringe (figure 5 D). After
that, the falcon tubes, with syringe and Merocels or syringe and filter discs, were

21
placed in the centrifuge at 1500g/15 minutes at 4°C (figure 5 E). The supernatants
were divided in aliquots (500 µL) and stored at or below -20°C (figure 5 F). Total IgE
and HDM sIgE concentrations in nasal secretions were measured by the UniCAP
system.
Figure 5: Processing of nasal secretions. (A) Weighing filter discs in Falcon tubes after insertion in the nasal cavities. (B) Washing with 0.9% NaCl solution. (C) Incubating for two hours at 4°C. (D) Filter discs placed into the shaft of a syringe and pushing all the fluid out of it. (E) Centrifuging at 1500g/15 minutes at 4°C. (F) Dividing the supernatants in aliquots (500 µL) and storing at or below -20°C. The same procedure was applied for the Merocels.
3.3 Literature
Particularly PubMed was used to study literature. Other used search engines were Web
of Science and Google Scholar. Combinations of the following keywords were used:
allergic rhinitis, chronic rhinosinusitis, nasal polyps, IgE, nasal secretion, treatment,
nasal irrigations, corticosteroids, antibiotics, anti-IgE, anti-IL-5, surgery, skin prick
test, nasal swabs, Merocel, filter disc, filter paper, tissue, diagnosis, pathophysiology,
Staphylococcus aureus, superantigens, inflammation, immunology, cytokines, IL-5. A
selection of articles was made by evaluating their abstract.

22
3.4 Statistical analysis All statistics were performed using the SPSS 21.0 software. Data are presented as
median and interquartile range (IQR). Statistical significance was assessed using two-
tailed tests and was defined as p<0.05. Graphics were made by MedCalc 12.7.0.0
software. Non-parametric test were used because the populations were not normally
distributed as assessed by Shapiro-Wilk tests. Correlations between continuous data
were determined by the Spearman correlation coefficient (Rs). A Wilcoxon Signed-
Rank test was executed to determine changes from baseline in inflammatory
parameters in different treatment groups. A Friedman test was carried out to determine
differences in the concentration of inflammatory parameters over the time in different
treatment groups. Pairwise comparisons were performed with a Bonferroni correction
for multiple comparisons. A Kruskal-Wallis test was done to determine differences in
inflammatory parameters between more than two disease groups. Comparisons
between two disease groups were performed by the Mann-Whitney U test for
continuous data.

23
4 RESULTS
4.1 Correlations between Merocel, tissue and serum total IgE measurements
An assessment of the relationship between total IgE measured in nasal secretions
collected with Merocels, tissue and serum for 112 patients with CRS (with and without
NP) was made (table 1). Preliminary analysis showed the relationship to be monotonic,
as assessed by visual inspection of scatterplots. A positive correlation between total
IgE in tissue and serum (figure 6 A), Merocel nasal secretions and serum (figure 6 B),
Merocel nasal secretions and tissue (figure 6 C) has been found (resp. rs= .623,
p<.0001; rs=.645, p<.0001 and rs=.595, p<.0001). Total IgE in Merocel nasal
secretions had the lowest value (Mdn= 4.65 kU/L). Tissue and serum total IgE
measurements were comparable (resp. Mdn= 50.16 kU/L and 50.18 kU/L).
A B
C
Figure 6: Correlations between tissue, serum and Merocel nasal secretions. Scatterplots on a logarithmic scale showing a correlation in the measurement of total IgE between (A) tissue and serum (B) Merocel nasal secretions and serum and (C) Merocel nasal secretions and tissue. Rs: Spearman's rank correlation coefficient; p: significance level.

24
Table 1: Descriptives of total IgE measurement by means of Merocel, tissue and serum
Total IgE (kU/L) Merocel Tissue Serum
Subjects (n) 100 81 108
Median (IQR) 4.65 (2.23 – 13.69) 50.16 (10.34 – 240.76) 50.18 (17.40 – 141.75)
Legends: IQR= Interquartile range.
4.2 Dynamic local IgE measurements by means of Merocels
4.2.1 Comparison omalizumab versus placebo Differences in total IgE concentrations (at week 18), in nasal secretions collected with
Merocels (table 2), were analyzed in 24 subjects with CRSwNP and comorbid asthma
who had a placebo (n=8) or an omalizumab (n=16) treatment (figure 7). Total IgE
decreased not significantly after placebo treatment (p=.686). In contrary, there was a
significant increase after omalizumab treatment (p=.041).
Figure 7: Comparison of the change in total IgE concentrations in placebo and omalizumab treated groups in nasal secretions collected with Merocels. In the box-and-whisker plot, the central box represents the lower to upper quartiles (25th to 75th percentiles). The middle line represents the median. The vertical line extends from the minimum to the maximum values. All measurements are marked with a black open circle.
Table 2: Descriptives of total IgE measurements at baseline and after treatment with placebo or omalizumab in nasal secretions collected with Merocels.
Placebo (n= 8) Omalizumab (n= 16)
Total IgE (kU/L) Median (IQR)
baseline 88.98 (26.44 – 146.99) 20.17 (9.31 – 56.63)
Week 18 74.85 (13.72 – 205.18) 72.375 (15.24 – 165.27)
Legends: IQR= Interquartile range.
25
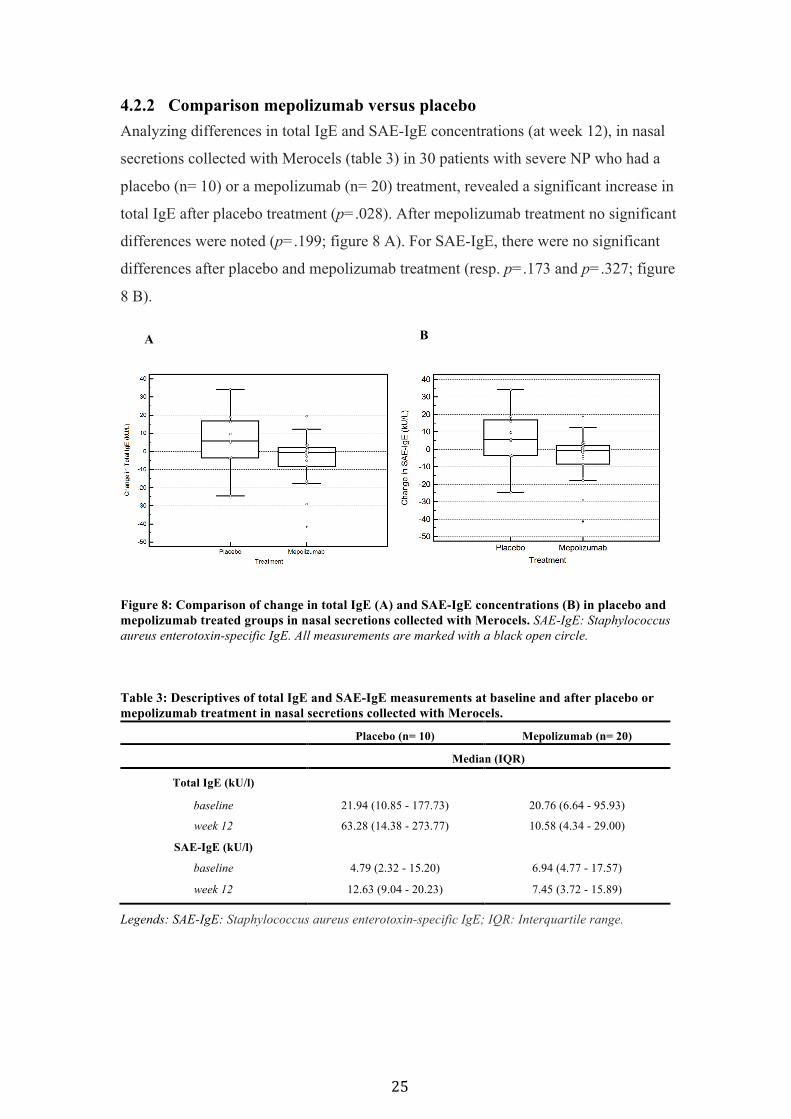
4.2.2 Comparison mepolizumab versus placebo Analyzing differences in total IgE and SAE-IgE concentrations (at week 12), in nasal
secretions collected with Merocels (table 3) in 30 patients with severe NP who had a
placebo (n= 10) or a mepolizumab (n= 20) treatment, revealed a significant increase in
total IgE after placebo treatment (p=.028). After mepolizumab treatment no significant
differences were noted (p=.199; figure 8 A). For SAE-IgE, there were no significant
differences after placebo and mepolizumab treatment (resp. p=.173 and p=.327; figure
8 B).
Figure 8: Comparison of change in total IgE (A) and SAE-IgE concentrations (B) in placebo and mepolizumab treated groups in nasal secretions collected with Merocels. SAE-IgE: Staphylococcus aureus enterotoxin-specific IgE. All measurements are marked with a black open circle.
Table 3: Descriptives of total IgE and SAE-IgE measurements at baseline and after placebo or mepolizumab treatment in nasal secretions collected with Merocels.
Placebo (n= 10) Mepolizumab (n= 20)
Median (IQR)
Total IgE (kU/l)
baseline 21.94 (10.85 - 177.73) 20.76 (6.64 - 95.93)
week 12 63.28 (14.38 - 273.77) 10.58 (4.34 - 29.00)
SAE-IgE (kU/l)
baseline 4.79 (2.32 - 15.20) 6.94 (4.77 - 17.57)
week 12 12.63 (9.04 - 20.23) 7.45 (3.72 - 15.89)
Legends: SAE-IgE: Staphylococcus aureus enterotoxin-specific IgE; IQR: Interquartile range.
A B

26
4.2.3 Comparison doxycycline, methylprednisolone and placebo Study of total IgE concentrations (change from baseline) during 6 visits (figure 9), in
nasal secretions collected with Merocels in 47 CRSwNP patients (table 4), showed
significant differences in the placebo group (n=18; p=.003). Post-hoc analysis revealed
significant differences at week 4 (p=.009). In the methylprednisolone group (n= 14) an
initial decrease in total IgE was followed by an increase in total IgE, however, these
changes were not significant (p=.130). In the doxycycline group (n=14) total IgE levels
did not change during treatment (p=.412).
Figure 9: Total IgE in nasal secretions after treatment with methylprednisolone (solid triangles), doxycycline (solid squares) or placebo (solid circles) in nasal secretions collected with Merocels. Table 4: Descriptives of total IgE change from baseline in placebo, doxycycline and methylprednisolone treated groups in nasal secretions collected with Merocels.
Placebo
(n=18)
Doxycycline
(n=14)
Methylprednisolone
(n=14)
Total IgE (kU/L) change from baseline Median (IQR)
week 1 0.62 (-2.98 - 23.88) -0.96 (-11.68 - 0.00) -0.25 (-27.32 - 12.62)
week 2 5.91 (-0.60 - 49.44) 0.00 (-8.01 - 27.37) -11.85 (-36.29 - 0.96)
week 4 29.81 (4.93 - 67.91) 0.00 (-8.01 - 1.28) -3.92 (-57.96 - 4.01)
week 8 6.98 (0.00 - 155.30) 0.00 (-4.14 - 0.00) 1.76 (-18.76 - 21.83)
week 12 29.74 (0.00 - 124.57) 0.00 (0.00 -11.52) 10.06 (0.00 - 34.63)
Legends: IQR= Interquartile range.
-30
-20
-10
0
10
20
30
40
50
0 1 2 4 8 12
Tota
l IgE
(ku/
L) c
hang
e fr
om
base
line
Time (weeks)
Total IgE (nasal secretions)
Placebo
Doxycycline
Methylprednisolone

27
4.3 Local measurements by means of filter discs Filter discs are an alternative option for the collection of nasal secretions. Analyzes on
a dataset with 12 control patients, 12 grass pollen allergic CRSwNP patients and 12
grass pollen AR patients (table 5) revealed that the group of patients with AR had the
highest value of total IgE (Mdn= 43.13 kU/l), followed by the patients with CRSwNP
with allergy (Mdn= 23.00 kU/l), those with CRSwNP without allergy (Mdn= BDL)
and the control group (Mdn= BDL) in nasal secretions collected with filter discs
(figure 10 A). Total IgE concentrations were significantly different between the disease
groups (p=.005). Post-hoc analysis revealed significant differences between the control
and AR group (p=.026) and the control and CRSwNP with allergy group (p=.017).
There were no significant differences between the AR group and CRSwNP with
allergy group (p=1.00). In the control group, the measurement of total IgE was BDL in
8 subjects (n=11). In the AR group and CRSwNP with allergy group, total IgE was
BDL in resp. 3 (n=12) and 2 (n=12) subjects. In the CRSwNP without allergy group, 7
subjects (n=12) were BDL. Parallel with total IgE, gx3 IgE was the highest in the AR
group (Mdn= 14.11 kU/l), followed by the patients with CRSwNP with allergy (Mdn=
3.53 kU/l), those with CRSwNP without allergy (Mdn= BDL) and the control group
(Mdn= BDL) (figure 10 B). Gx3 IgE (kU/l) was significantly different between the
disease groups (p<0.05). Post-hoc analysis revealed that gx3 IgE was significant higher
in the AR group in comparison with the control group (p=.001) and the CRSwNP
without allergy group (p=.001). Total IgG and IgG4 concentrations were the highest in
the control group (resp. Mdn= 256.17 mg/l and 16.75 mg/l), followed by the CRSwNP
group (resp. Mdn= 212.01 mg/l and 13.11 mg/l ), AR group (resp. Mdn= 182.62 mg/l
and 12.87 mg/l) and the CRSwNP with allergy to grass pollen group (resp. Mdn=
173.50 mg/l and 11.34 mg/l), but the differences were not significant (resp. p=.837 and
p=.994; figure 10 C and D). Finally, in the control group and CRSwNP with and
without allergy group, tryptase was not measurable in the majority of patients (Mdn=
BDL). In the AR group, tryptase was measurable in 7 out of 12 patients (Mdn= 33,67
µg/l), but the differences were not significant (p=.057; figure 10 E).

28
Table 5: Inflammatory measurements in nasal secretions collected with filter discs in control patients, grass pollen sensitive AR patients, CRSwNP patients and CRSwNP with grass pollen allergy patients.
Legends: Gx3 IgE: IgE to mix of grass pollen; IQR: Interquartile range; BDL: below detection level.
A B
C D
Controls AR CRSwNP CRSwNP with allergy
Median (IQR)
Total IgE
(kU/l) 8 BDL; 1.65 (1.65-2.82) 3 BDL; 43.13 (4.01-
72.26) 7 BDL; 1.65 (1.65-33.19) 2 BDL; 23.00 (7.11-111.67)
gx3 IgE (kU/l) All BDL 3 BDL; 14.11 (2.95 -
24.02) All BDL 5 BDL; 3.53 (1.66-7.26)
Total IgG
(mg/l) 256.17 (193.12-425.45) 182.62 (87.62-290.74) 1 BDL; 212.01 (60.22-
581.42) 2 BDL; 173.50 (36.96-
702.39)
IgG4 (mg/l) 16.75 (4.26-31.40) 12.87 (5.25-48.03) 13.11 (3.29-102.83) 11.34 (3.62-73.56)
Tryptase (µg/l) 10/12 BDL 5 BDL, 33.68 (8.28-
78.32) 8 BDL; 8.28 (8.28-13.04) 9 BDL; 8.28 (8.28-14.62)

29
E
Figure 10: Comparison of inflammatory measurements in nasal secretions collected with filter discs. Total IgE concentrations (A), gx3 IgE concentrations (B), total IgG concentrations (C), IgG4 concentrations (D) and tryptase concentrations (E) in control patients, grass pollen sensitive AR patients, chronic rhinosinusitis with NP without allergy patients (CRSwNP) and chronic rhinosinusitis with NP with allergy patients (CRSwNPwA). All measurements are marked with a black open circle and significant differences are marked with a line.
4.4 Comparison of Merocels and filter discs for the measurement of local IgE (experiment)
4.4.1 Demographic and clinical features 15 control patients and 15 HDM sensitive AR patients were recruited in order to
analyze total IgE and HDM sIgE concentrations in serum and nasal secretions
collected with both Merocels and filter discs. In the AR group, 13 patients were poly-
sensitized and had a positive SPT for one or more of the other tested allergens. Two
control patients had a SPT with a HDM wheal of 2 mm. Three patients had comorbid
asthma. Three AR patients used oral antihistamines during the days prior to sampling
of the nasal secretions (in these patients, SPT was performed on another occasion)
(table 6).
Table 6: Baseline demographic and clinical characteristics of control patients and HDM sensitive AR patients.
Control (n= 15) AR (n= 15)
Age (yr), median (IQR) 25.00 (23.25-33.00) 24.00 (23.00-25.00)
Men/Women, n/n 4/11 6/9
Asthma, n 0 3
HDM (SPT+), n 0 15
Other allergies (SPT+), n 0 13
Antihistaminica use (last 3 days), n 0 3
Legends: yr: years; IQR: Interquartile range; n: numbers; HDM: House dust mite; SPT: Skin prick test.

30
4.4.2 Total IgE and HDM sIgE are increased locally in nasal secretions in AR patients
Total IgE and HDM sIgE concentrations, in control patients and HDM sensitive AR
patients, in nasal secretions (Merocels and filter discs) and serum are shown in table 7
and illustrated in figure 11. For each AR patient, the individual weight of the collected
nasal secretions, the added NaCl volume, serum and nasal secretion measurements
(raw and final data) are pointed out in table 8. Three control patients had a slightly
increased concentration of HDM sIgE in serum. Total IgE and HDM sIgE in nasal
secretions collected with Merocels were BDL in resp. 3 and 4 AR patients, with filter
discs resp. 2 and 6 AR patients were BDL. Total IgE and HDM sIgE were significantly
increased in HDM sensitive AR patients in serum and nasal secretions collected with
both Merocels and filter discs (table 7). Significant positive correlations between HDM
sIgE measured in Merocel nasal secretions and filter disc nasal secretions (rs=.753,
p=.001, figure 12 A), Merocel nasal secretions and serum (rs=.569, p=.027, figure 12
B) and filter disc nasal secretions and serum (rs=.749, p=.001, figure 12 C) were found
in the AR patients.
Table 7: Total IgE and HDM sIgE in nasal secretions (Merocels and filter discs) and serum in control patients and HDM sensitive AR patients.
Control (n= 15) Control vs AR
AR (n= 15)
Nasal Secretions
Merocel
Total IgE (kU/L) 12 BDL <0.001 3 BDL; 10.50 (2.38-51.98)
HDM sIgE (kU/L) All BDL <0.001 4 BDL; 4.60 (1.25 - 12.15)
Filter disc
Total IgE (kU/L) 11 BDL; 2.00 (2.00 - 5.60) 0.002 2 BDL; 7.80 (4.45 - 30.90)
HDM sIgE (kU/L) All BDL 0.001 6 BDL; 4.00 (2.00 - 13.75)
Serum
Total IgE (kU/L) 11.75 (9.96 -66.00) 0.001 164.00 (57.50 - 233.75)
HDM sIgE (kU/L) 12 BDL <0.001 27.30 (8.62 - 35.18)
Legends: Differences between groups were analyzed for each parameter by a Mann-Whitney U Test. All numbers are represented as median (IQR). BDL= Below detection level.

31
A B
C D
E F
Figure 11: Comparison of total IgE and HDM sIgE concentrations in serum (E and F) and nasal secretions collected with Merocels (A and B) and filter discs (C and D) in control patients and AR patients. Total IgE and HDM sIgE are significant increased in HDM sensitive AR patients with all the different measurement techniques. All measurements are marked with a black open circle.
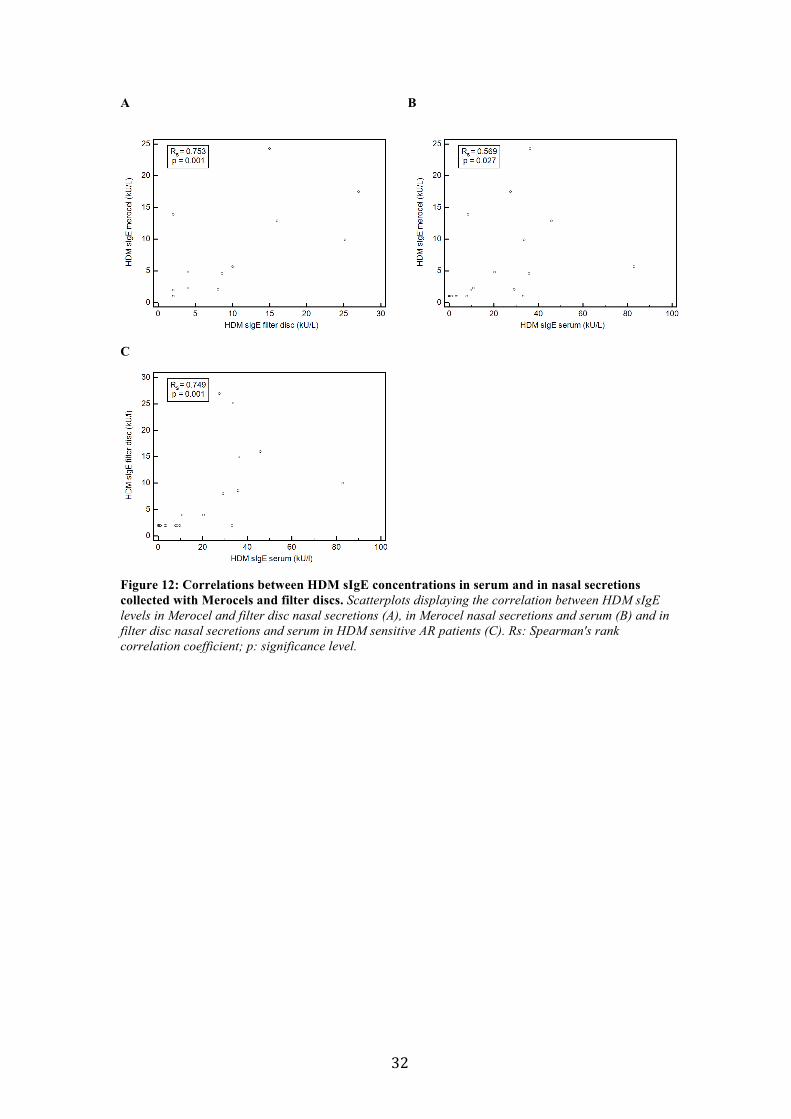
32
A B
C
Figure 12: Correlations between HDM sIgE concentrations in serum and in nasal secretions collected with Merocels and filter discs. Scatterplots displaying the correlation between HDM sIgE levels in Merocel and filter disc nasal secretions (A), in Merocel nasal secretions and serum (B) and in filter disc nasal secretions and serum in HDM sensitive AR patients (C). Rs: Spearman's rank correlation coefficient; p: significance level.

33
Legends: WNS: weight of nasal secretion collected, DF: dilution factor, /: below detection level, volume= (DF x WNS) – WNS.
Table 8: Total IgE and HDM sIgE measurements in HDM sensitive AR patients in serum and nasal secretions (filter disc and Merocel).
Serum Filter disc (DF 20) Merocel (DF 10)
RAW DATA FINAL DATA RAW DATA FINAL DATA
AR patients (n=15)
Total IgE
(kU/l)
HDM sIgE
(kU/l)
WNS (g)
Volume (ml)
Total IgE
(kU/l)
HDM sIgE
(kU/l)
Total IgE
(kU/l)
HDM sIgE
(kU/l)
WNS (g)
Volume (ml)
Total IgE
(kU/l)
HDM sIgE
(kU/l)
Total IgE
(kU/l)
HDM sIgE
(kU/l)
Patient 1 472.00 45.80 0.078 1.48 4.53 0.80 90.60 16.00 0.54 4.88 6.54 1.29 65.40 12.90
Patient 2 595.00 82.80 0.13 2.41 1.44 0.50 28.80 10.00 0.20 1.80 2.21 0.57 22.10 5.70
Patient 3 65.50 7.67 0.10 1.92 0.20 / 4.00 / 0.75 6.72 / / / /
Patient 4 307.00 33.60 0.081 1.54 5.25 1.26 105.00 25.20 1.14 10.28 2.97 0.99 29.70 9.90
Patient 5 134.00 36.10 0.11 2.07 1.58 0.75 31.60 15.00 0.42 3.77 5.94 2.43 59.40 24.30
Patient 6 26.65 10.70 0.11 2.01 0.25 0.20 5.00 4.00 0.28 2.48 0.35 0.23 3.50 2.30
Patient 7 166.50 33.00 0.076 1.44 0.22 / 4.40 / 2.05 16.42 / / / /
Patient 8 194.00 20.20 0.063 1.19 0.39 0.20 7.80 4.00 1.90 15.1 1.43 0.48 14.30 4.80
Patient 9 62.00 8.28 0.20 3.75 0.39 / 7.80 / 0.44 3.96 7.25 1.39 72.50 13.90
Patient 10 56.00 2.87 0.041 0.79 0.23 / 4.60 / 0.17 1.52 / / / /
Patient 11 164.00 29.10 0.037 0.70 1.03 0.40 20.60 8.00 1.63 13.02 0.50 0.21 5.00 2.10
Patient 12 197.00 35.70 0.056 1.07 1.14 0.43 22.80 8.60 1.13 9.04 1.05 0.46 10.50 4.60
Patient 13 28.40 3.42 0.16 3.08 / / / / 0.23 4.29 0.23 / 2.30 /
Patient 14 28.30 9.63 0.16 3.05 / / / / 0.59 5.32 0.26 0.20 2.60 2.00
Patient 15 246.00 27.30 0.028 0.53 4.49 1.35 89.80 27.00 0.14 1.29 6.40 1.75 64.00 17.50
Median 164.00 27.30 0.081 1.54 0.39 0.20 7.80 4.00 0.54 4.88 1.05 0.46 10.50 4.60

34
5 DISCUSSION
Local production of IgE in the respiratory mucosa has been demonstrated in AR
(allergen specific IgE) and in CRSwNP (polyclonal IgE), suggesting a role for local
IgE in the pathogenesis of these inflammatory diseases of the upper airway. It has
been suggested that the majority of allergen-specific IgE in the peripheral blood is not
derived from IgE-secreting cells in the blood, but is produced locally in target organs
of allergy such as the nasal mucosa. Considering the importance of local IgE
production, it seems to be essential to develop non-invasive, reproducible and easy to
perform approaches for measurement of local mucosal IgE production.
5.1 Merocels for local IgE measurement Tissue IgE is only partially related to IgE concentrations in serum [1,45]. We
identified a significant positive correlation between total IgE measured by means of
Merocels, serum and tissue in 112 patients with CRS (with and without NP).
Nevertheless, total IgE concentrations measured with Merocels were much lower than
those measured in serum or tissue. We already know that there is an initial increase in
total IgE concentration due to omalizumab. Omalizumab binds selectively free IgE
[48] and forms more slowly eliminating IgE complexes [76]. Besides free IgE,
complexed IgE is also included in the measurements, as a result total IgE
concentration increases shortly after commencing omalizumab therapy. This
phenomenon is also demonstrated in nasal secretions collected with Merocels. We
found a significant increase in total IgE after omalizumab treatment in patients with
CRSwNP and comorbid asthma at week 18. Patients with CRSwNP and comorbid
asthma are particularly characterized with high local IgE levels [48]. We also found
high baseline values of total IgE in this group. Recent research demonstrated that
omalizumab was equally efficacious in both allergic and non-allergic patients (SPT
negative) with NP and asthma [48]. This strengthens the hypothesis that blood tests
and skin prick tests are misleading us and that local IgE is more important. IL-5
seems to play a key role in the chemotaxis, activation, and survival of eosinophils
[77,78]. Bachert et al. [46] found an association between levels of both total and
specific IgE and eosinophilic infiltration in NP. These findings were unrelated to skin
prick test results. There is an increasing evidence that Staphylococcus aureus–derived
enterotoxins stimulate eosinophilic inflammation through production of TH2
35
cytokines and local IgE formation [79]. In vitro studies indicate that SAE induced
cytokine release tends to be pro-inflammatory and Th2 skewed, promoting IL-4 and
IL-5 [80,81]. In our results, no significant differences were found in total IgE and
SAE-IgE concentrations after mepolizumab (anti-IL5) treatment for patients with
severe NP.
5.2 Filter discs for local IgE measurement We found total IgE, measured in nasal secretions with filter discs, in 9 out of 12 grass
pollen sensitive AR patients and in 10 out of 12 grass pollen allergic CRSwNP
patients. Gx3 IgE was measurable in 9 out of 12 grass pollen sensitive AR patients
and 7 out of 12 grass pollen allergic CRSwNP patients. IgE in CRSwNP is polyclonal
and allergen-specific IgE forms only a small fraction of the total IgE concentration. In
contrast, a big fraction of total IgE in nasal secretions in AR patients is allergen-
specific, resulting in sensitization of resident mast cells for immediate
hypersensitivity on exposure to allergen [66]. Total IgE and Gx3 IgE were not
significantly different in the AR group compared to the CRSwNP with allergy group.
Although IgE antibodies characterize the response to allergens, it also includes other
parameters like total IgG, IgG4 and tryptase [82]. A model [82] suggests that a route
to IgE production is a switch from IgM to IgG to IgG4 inside germinal centers with
subsequent switch from IgG4 to IgE production in the periphery. Zhang et al. found
evidence that the switch to IgE could occur sequentially through IgG4 [83]. IgG can
inhibit histamine release and IgG4 antibodies can block IgE receptor-facilitated
allergen binding to B cells and diminishes activation of mast cells and basophils
[82,84]. Total IgG and IgG4 concentrations were measurable with the filter discs, but
there were no significant differences between the different disease groups. Mucosal
IgE in NP tissue is functional by activating mast cells [85]. Tryptase is a marker of
mast cell activation, but no significant differences were found.

36
5.3 Comparison Merocels versus filter discs The datasets mentioned above were collected for other primary endpoints than local
IgE measurements. In those studies, local IgE concentrations were mostly determined
to research trends and to function as a possible activity predictor. In our experiment,
data were collected to investigate the presence of total IgE and HDM sIgE in nasal
secretions collected with Merocels and filter discs in control patients and AR patients
and to analyze differences between those groups. Further, we wanted to make a
comparison between the Merocel and the filter disc technique.
AR patients had highly increased total IgE and HDM sIgE concentrations in serum
and in nasal secretions collected with both Merocels and filter discs. HDM sIgE levels
in serum and in nasal secretions collected by means of Merocels and filter discs were
significantly correlated. Together, these observations support the validity of Merocels
and filter discs for local IgE measurements. In contrast with our expectations, filter
discs showed relatively good results. Total IgE concentrations in nasal secretions
collected with Merocels and filter discs were BDL in resp. 3 and 2 out of 15 AR
patients. HDM sIgE was BDL in 6 out of 15 AR patients, in nasal secretions collected
with filter discs, whereas in nasal secretions collected with Merocels HDM sIgE was
BDL in 4 AR patients. At this point, we can conclude that we can be optimistic about
the use of filter discs in clinical trials.
The Merocel technique is highly reproducible, as shown in both in vitro models and
humans. Unlike with filter discs, sufficient amounts of secretions can be collected
with Merocels to measure several mediators from one sample [54]. However, there
are also limitations to be kept in mind. Merocels are larger and can cause local
irritation and stimulation of the nasal mucosa. Stimulation of the mucosa may vary
from time to time, which makes Merocels probably less reproducible in comparison
with filter discs. For these reasons, Merocels are not recommended for repeated
measurements on the same day and in nasal provocation tests. Insertion of the
Merocel into the nose may be difficult and uncomfortable in patients with an anterior
septal deviation, a narrow vestibulum nasi or severe NP [54]. Filter discs are easier to
manipulate and its placement in the nasal cavity is simple. In a study from Kristiansen
et al., filter discs were used to detect serum IgA, IgM and IgG antibody activity. The
secretory IgA concentrations of multiple samples from one person were stable, which
proved reproducibility [63]. Filter discs also have disadvantages. They are not
37
commercialized and thereby not medically approved. Another disadvantage is the fact
that filter discs require a higher dilution factor. As a result, total IgE and HDM sIgE
concentrations, which are BDL in nasal secretions collected with filter discs, are
sometimes just above the detection limit in nasal secretions collected with Merocels
(table 8, patient 13 and 14). With both Merocels and filter discs, a clear differentiation
and comparative analysis between nasal sides is possible. On the other hand, no clear
distinction can be made between nasal secretion coming from the septum, the
turbinates, the sinus cavities or local glands with both Merocels and filter discs [54].
The amount of nasal secretions depends on several factors. As an example, in upper
respiratory tract infections watery secretions are an early symptom [86]. As
mentioned before, Merocels can give a variable stimulation of the nasal mucosa and
thereby induce a natural dilution of the nasal secretion. Heikkinen et al. [87]
postulated that the interpretation of substances present in nasal specimens is difficult
because of the unknown dilution in these samples.
In summary, we can conclude that IgE levels in nasal secretions collected by means of
Merocels seem to be a good reflection of local IgE levels in nasal tissue. As collection
of nasal secretions by Merocels is a standardized and non-invasive method, it can be
used for repeated measurements of local IgE and other markers of mucosal
inflammation, in order to study nasal diseases and monitor their treatment. In the
experiment, Merocels performed slightly better than filter discs. The use of filter discs
seems to be a feasible alternative for collection of nasal secretions and measurement
of local IgE. Both Merocels and filter discs have advantages and disadvantages and
both methods will probably have their specific applications in future experiments and
clinical trials. Strengths and weaknesses of tissue, Merocels and filter discs are
summarized in table 9.

38
Table 9: Summary strengths and weaknesses tissue, Merocels and filter discs.
Strengths Weaknesses
Tissue Merocels Filter discs Tissue Merocels Filter discs
Golden standard
Highly reproducible
Probably more reproducible compared to
Merocels
Very invasive
Local irritation and stimulation
Not standardized and
commercialized
Superior local IgE
measurements
Sufficient amounts of secretions
Less discomforting
and local irritation
Can not be used several times on the
same day
Not recommended to use them several
times on the same day
Higher dilution factor needed
Clear differentiation between nasal
sides
Clear differentiation between nasal
sides
Clear differentiation between nasal
sides
No clear distinction
between different origins
No clear distinction
between different origins
Informs directly about a
range of mucosal tissue cellular events
Standardized and non-invasive Non-invasive Unknown
dilution Unknown dilution
Slightly better local IgE
measurements compared to filter discs
Easy to manipulate and
simple placement Expensive
Allow qualitative measurements
Allow qualitative measurements
Sometimes difficult and
uncomfortable insertion
Can be used for
follow-up in clinical trials
Can be used for follow-up in
clinical trials and in nasal
provocation tests
Good reflection of local IgE
levels in nasal tissue
Good reflection of local IgE
levels in nasal tissue
Lower dilution factor needed

39
6 REFERENCES
1. Fokkens WJ, Lund VJ, Mullol J, Bachert C, Alobid I, Baroody F, et al. European position paper on rhinosinusitis and nasal polyps 2012. Rhinology. 2012 Apr. 12;50:1–298.
2. Bousquet J, Khaltaev N, Cruz AA, Denburg J, Fokkens WJ, Togias A, et al. Allergic Rhinitis and its Impact on Asthma (ARIA) 2008 update (in collaboration with the World Health Organization, GA(2)LEN and AllerGen). Allergy. 2008. p. 8–160.
3. Blomme K, Tomassen P, Lapeere H, Huvenne W, Bonny M, Acke F, et al. Prevalence of Allergic Sensitization versus Allergic Rhinitis Symptoms in an Unselected Population. Int Arch Allergy Immunol. 2013;160(2):200–7.
4. Fokkens WJ. Thoughts on the pathophysiology of nonallergic rhinitis. Curr Allergy Asthma Rep. 2002 May;2(3):203–9.
5. Tomassen P, Zele TV, Zhang N, Perez-Novo C, Bruaene NV, Gevaert P, et al. Pathophysiology of Chronic Rhinosinusitis. Proceedings of the American Thoracic Society. 2011 Mar. 1;8(1):115–20.
6. Hellings PW, Fokkens WJ, Akdis C, Bachert C, Cingi C, de Loos DD, et al. Uncontrolled allergic rhinitis and chronic rhinosinusitis: where do we stand today? Allergy. 2012 Dec. 31;68(1):1–7.
7. Kormelink TG, Calus L, De Ruyck N, Holtappels G, Bachert C, Redegeld FA, et al. Local free light chain expression is increased in chronic rhinosinusitis with nasal polyps. Allergy. 2012 Aug. 31;67(9):1165–72.
8. Thomas M, Yawn BP, Price D, Lund V, Mullol J, Fokkens W, et al. EPOS Primary Care Guidelines: European Position Paper on the Primary Care Diagnosis and Management of Rhinosinusitis and Nasal Polyps 2007 – a summary. Prim Care Respir J. 2008 Jun.;17(2):79.
9. Van Hoecke H, Vastesaeger N, Dewulf L, Sys L, Van Cauwenberge P. Classification and management of allergic rhinitis patients in general practice during pollen season. Allergy. 2006 Jun.;61(6):705–11.
10. Brozek JL, Bousquet J, Baena-Cagnani CE, Bonini S, Canonica GW, Casale TB, et al. Allergic Rhinitis and its Impact on Asthma (ARIA) guidelines: 2010 revision. J. Allergy Clin. Immunol. 2010. p. 466–76.
11. Van Cauwenberge P, Watelet JB, Van Zele T, Bousquet J, Burney P, Zuberbier T, et al. Spreading excellence in allergy and asthma: the GA2LEN (Global Allergy and Asthma European Network) project. Allergy. 2005 Jul.;60(7):858–64.
12. Kurz T, Altmueller J, Strauch K, Rüschendorf F, Heinzmann A, Moffatt MF, et al. A genome-wide screen on the genetics of atopy in a multiethnic European population reveals a major atopy locus on chromosome 3q21.3. Allergy. 2005 Feb.;60(2):192–9.
13. Bousquet J, Jacquot W, Vignola AM, Bachert C, Van Cauwenberge P. Allergic rhinitis:A disease remodeling the upper airways? Journal of Allergy and Clinical Immunology. 2003 Dec. 31;113(1):43–9.
14. Bachert C, Vignola AM, Gevaert P, Leynaert B, Van Cauwenberge P, Bousquet J. Allergic rhinitis, rhinosinusitis, and asthma: one airway disease. Immunology and Allergy Clinics of North America. 2004 Feb.;24(1):19–43.
15. Bousquet J, Annesi-Maesano I, Carat F, Leger D, Rugina M, Pribil C, et al. Characteristics of intermittent and persistent allergic rhinitis: DREAMS study group. Clin Exp Allergy. 2005

40
Jun.;35(6):728–32.
16. Leynaert B, Neukirch C, Kony S, Guénégou A, Bousquet J, Aubier M, et al. Association between asthma and rhinitis according to atopic sensitization in a population-based study. Journal of Allergy and Clinical Immunology. 2004 Jan.;113(1):86–93.
17. Downie SR, Andersson M, Rimmer J, Leuppi JD, Xuan W, Akerlund A, et al. Association between nasal and bronchial symptoms in subjects with persistent allergic rhinitis. Allergy. 2004 Feb. 29;59(3):320–6.
18. Chen W. Synergistic effect of multiple indoor allergen sources on atopic symptoms in primary school children. Environmental Research. 2003 Sep.;93(1):1–8.
19. Hellings PW, Fokkens WJ. Allergic rhinitis and its impact on otorhinolaryngology. Allergy. 2006 Jun.;61(6):656–64.
20. Fokkens W, Lund V, Bachert C, Clement P, Helllings P, Holmstrom M, et al. EAACI Position Paper on Rhinosinusitis and Nasal Polyps Executive Summary. Allergy. 2005 May;60(5):583–601.
21. Baraniuk JN, Maibach H. Pathophysiological classification of chronic rhinosinusitis. Respir. Res. 2005;6:149.
22. Demoly P, Crampette L, Lebel B, Campbell AM, Mondain M, Bousquet J. Expression of cyclo-oxygenase 1 and 2 proteins in upper respiratory mucosa. Clin Exp Allergy. 1998 Feb. 28;28(3):278–83.
23. Demoly P, Crampette L, Mondain M, Campbell AM, Lequeux N, Enander I, et al. Assessment of inflammation in noninfectious chronic maxillary sinusitis. Journal of Allergy and Clinical Immunology. 1994 Jun. 30;94(1):95–108.
24. Tschopp JM, Sistek D, Schindler C, Leuenberger P, Perruchoud AP, Wüthrich B, et al. Current allergic asthma and rhinitis: diagnostic efficiency of three commonly used atopic markers (IgE, skin prick tests, and Phadiatop). Results from 8329 randomized adults from the SAPALDIA Study. Swiss Study on Air Pollution and Lung Diseases in Adults. Allergy. 1998 Jun.;53(6):608–13.
25. Poole JA, Rosenwasser LJ. The role of immunoglobulin E and immune inflammation: implications in allergic rhinitis. Curr Allergy Asthma Rep. 2005 May;5(3):252–8.
26. Sears MR, Burrows B, Flannery EM, Herbison GP, Hewitt CJ, Holdaway MD. Relation between airway responsiveness and serum IgE in children with asthma and in apparently normal children. N Engl J Med. 1991 Oct. 9;325(15):1067–71.
27. Beeh KM, Ksoll M, Buhl R. Elevation of total serum immunoglobulin E is associated with asthma in nonallergic individuals. Eur Respir J. 2000 Sep. 30;16(4):609–14.
28. Prussin C, Metcalfe DD. 5. IgE, mast cells, basophils, and eosinophils. Journal of Allergy and Clinical Immunology. 2005 Dec. 31;117(2):S450–6.
29. Casale TB, Condemi J, LaForce C, Nayak A, Rowe M, Watrous M, et al. Effect of omalizumab on symptoms of seasonal allergic rhinitis: a randomized controlled trial. Jama. American Medical Association; 2001 Dec. 10;286(23):2956–67.
30. Vignola AM, Humbert M, Bousquet J, Boulet L-P, Hedgecock S, Blogg M, et al. Efficacy and tolerability of anti-immunoglobulin E therapy with omalizumab in patients with concomitant allergic asthma and persistent allergic rhinitis: SOLAR. Allergy. 2004 Jun. 30;59(7):709–17.
31. Humbert M, Beasley R, Ayres J, Slavin R, Hébert J, Bousquet J, et al. Benefits of omalizumab as add-on therapy in patients with severe persistent asthma who are inadequately controlled

41
despite best available therapy (GINA 2002 step 4 treatment): INNOVATE. Allergy. 2005 Mar.;60(3):309–16.
32. Bentley AM, Jacobson MR, Cumberworth V, Barkans JR, Moqbel R, Schwartz LB, et al. Immunohistology of the nasal mucosa in seasonal allergic rhinitis: Increases in activated eosinophils and epithelial mast cells. Journal of Allergy and Clinical Immunology. 1991 Dec. 31;89(4):877–83.
33. Igarashi Y, Skoner DP, Doyle WJ, White MV, Fireman P, Kaliner MA. Analysis of nasal secretions during experimental rhinovirus upper respiratory infections. Journal of Allergy and Clinical Immunology. 1992 Dec. 31;92(5):722–31.
34. Otsuka H, Denburg J, Dolovich J, Hitch D, Lapp P, Rajan RS, et al. Heterogeneity of metachromatic cells in human nose: significance of mucosal mast cells. Journal of Allergy and Clinical Immunology. 1985 Nov.;76(5):695–702.
35. Romagnani S. Immunologic influences on allergy and the TH1/TH2 balance. Journal of Allergy and Clinical Immunology. 2004 Mar.;113(3):395–400.
36. Johansson L, Akerlund A, Holmberg K, Melén I, Bende M. Prevalence of nasal polyps in adults: the Skövde population-based study. Ann Otol Rhinol Laryngol. 2003 Jun. 30;112(7):625–9.
37. Hedman J, Kaprio J, Poussa T, Nieminen MM. Prevalence of asthma, aspirin intolerance, nasal polyposis and chronic obstructive pulmonary disease in a population-based study. Int J Epidemiol. 1999 Aug.;28(4):717–22.
38. Klossek JM, Neukirch F, Pribil C, Jankowski R, Serrano E, Chanal I, et al. Prevalence of nasal polyposis in France: a cross-sectional, case-control study. Allergy. 2005 Feb.;60(2):233–7.
39. Larsen K. The clinical relationship of nasal polyps to asthma. Allergy Asthma Proc. 1996 Sep.;17(5):243–9.
40. Larsen K, Tos M. A long-term follow-up study of nasal polyp patients after simple polypectomies. Eur Arch Otorhinolaryngol. 1997;254 Suppl 1:S85–8.
41. Collins MM, Pang Y-T, Loughran S, Wilson JA. Environmental risk factors and gender in nasal polyposis. Clin Otolaryngol Allied Sci. 2002 Oct.;27(5):314–7.
42. Scadding G, Hellings P, Alobid I, Bachert C, Fokkens W, van Wijk RG, et al. Diagnostic tools in Rhinology EAACI position paper. Clinical and Translational Allergy. BioMed Central Ltd; 2011 Jun. 10;1(1):2.
43. Gevaert P, Van Bruaene N, Cattaert T, Van Steen K, Van Zele T, Acke F, et al. Mepolizumab, a humanized anti-IL-5 mAb, as a treatment option for severe nasal polyposis. Journal of Allergy and Clinical Immunology. Elsevier Ltd; 2011 Nov. 1;128(5):989–995.e8.
44. Gevaert P, Holtappels G, Johansson SGO, Cuvelier C, Cauwenberge P, Bachert C. Organization of secondary lymphoid tissue and local IgE formation to Staphylococcus aureus enterotoxins in nasal polyp tissue. Allergy. 2004 Dec. 31;60(1):71–9.
45. Van Zele T, Gevaert P, Holtappels G, Van Cauwenberge P, Bachert C. Local immunoglobulin production in nasal polyposis is modulated by superantigens. Clin Exp Allergy. 2007 Dec.;37(12):1840–7.
46. Bachert C, Gevaert P, Holtappels G, Johansson SGO, Van Cauwenberge P. Total and specific IgE in nasal polyps is related to local eosinophilic inflammation. Journal of Allergy and Clinical Immunology. 2001 Apr.;107(4):607–14.
47. Gevaert P, Nouri-Aria KT, Wu H, Harper CE, Takhar P, Fear DJ, et al. Local receptor revision

42
and class switching to IgE in chronic rhinosinusitis with nasal polyps. Allergy. 2012 Dec. 31;68(1):55–63.
48. Gevaert P, Calus L, Van Zele T, Blomme K, De Ruyck N, Bauters W, et al. Omalizumab is effective in allergic and nonallergic patients with nasal polyps and asthma. J. Allergy Clin. Immunol. 2012 Sep. 24;131(1):110–1.
49. Emanuel IA, Shah SB. Chronic rhinosinusitis: Allergy and sinus computed tomography relationships. Otolaryngology - Head and Neck Surgery. 1999 Dec. 31;123(6):687–91.
50. Gevaert P, Langloidolt D, Lackner A, Stammberger H, Staudinger H, Van Zele T, et al. Nasal IL-5 levels determine the response to anti–IL-5 treatment in patients with nasal polyps. Journal of Allergy and Clinical Immunology. 2006 Nov.;118(5):1133–41.
51. Bousquet J, Schünemann HJ, Samolinski B, Demoly P, Baena-Cagnani CE, Bachert C, et al. Allergic Rhinitis and its Impact on Asthma (ARIA): achievements in 10 years and future needs. Journal of Allergy and Clinical Immunology. 2012 Oct. 31;130(5):1049–62.
52. Bachert C, Zhang N, Holtappels G, De Lobel L, Van Cauwenberge P, Liu S, et al. Presence of IL-5 protein and IgE antibodies to staphylococcal enterotoxins in nasal polyps is associated with comorbid asthma. Journal of Allergy and Clinical Immunology. 2009 Dec. 31;126(5):962–6.
53. Van Zele T, Gevaert P, Holtappels G, Beule A, Wormald PJ, Mayr S, et al. Oral steroids and doxycycline: two different approaches to treat nasal polyps. J. Allergy Clin. Immunol. 2010 May;125(5):1069–1076.e4.
54. Watelet J-B, Gevaert P, Holtappels G, Van Cauwenberge P, Bachert C. Collection of nasal secretions for immunological analysis. European Archives of Oto-Rhino-Laryngology. 2004 May 1;261(5):242–6.
55. Niehaus MD, Gwaltney JM, Hendley JO, Newman MJ, Heymann PW, Rakes GP, et al. Lactoferrin and eosinophilic cationic protein in nasal secretions of patients with experimental rhinovirus colds, natural colds, and presumed acute community-acquired bacterial sinusitis. J. Clin. Microbiol. 2000 Aug.;38(8):3100–2.
56. Kim SS, Kim KS, Lee JG, Park IY, Koo JS, Yoon JH. Levels of intracellular protein and messenger RNA of mucin and lysozyme in normal human nasal and polyp epithelium. Laryngoscope. 2000 Feb.;110(2 Pt 1):276–80.
57. Ingels K, Durdurez JP, Cuvelier C, Van Cauwenberge P. Nasal biopsy is superior to nasal smear for finding eosinophils in nonallergic rhinitis. Allergy. 1997 Mar.;52(3):338–41.
58. Wang D-Y, Clement P. Pathogenic mechanisms underlying the clinical symptoms of allergic rhinitis. Am J Rhinol. 2000 Sep.;14(5):325–33.
59. Yamazaki M, Kimura K, Watanabe S, Komiyama O, Mishiku Y, Yamamoto K, et al. Use of a rapid detection assay for influenza virus, on nasal aspirate specimens. Kansenshogaku Zasshi. 1999 Oct.;73(10):1064–8.
60. Klimek L, Rasp G. Norm values for eosinophil cationic protein in nasal secretions: influence of specimen collection. Clin Exp Allergy. 1999 Mar.;29(3):367–74.
61. Klimek L, Reske-Kunz AB, Malling HJ. Methods for monitoring of therapeutic efficacy in immunotherapy of allergic rhinitis. Wien Med Wochenschr. 1999;149(14-15):394–402.
62. Ruocco L, Fattori B, Romanelli A, Martelloni M, Casani A, Samolewska M, et al. A new collection method for the evaluation of nasal mucus proteins. Clin Exp Allergy. 1998 Jul.;28(7):881–8.
43
63. Kristiansen BE. Collection of mucosal secretion by synthetic discs for quantitation of secretory IgA and bacteria. Journal of Immunological Methods. 1984 Oct. 26;73(2):251–7.
64. Watelet J-B, Gevaert P, Bachert C, Holtappels G, Van Cauwenberge P. Secretion of TGF-βl, TGF-β2, EGF and PDGF into nasal fluid after sinus surgery. European Archives of Oto-Rhino-Laryngology. 2014 Feb. 7;259(5):234–8.
65. Walsh EE, Falsey AR. A simple and reproducible method for collecting nasal secretions in frail elderly adults, for measurement of virus-specific IgA. J. Infect. Dis. 1999 May;179(5):1268–73.
66. Calus L. Diagnostic and therapeutic consequences of mucosal lymphoid aggregates and local IgE in chronic rhinosinusitis with nasal polyposis [Doctoral thesis]. Belgium: Ghent University; 2013 Jul.
67. Cassano M, Di Taranto F, Russo GM, De Filippis C, Cassano P. Cytological alterations of nasal mucosa after nasal packing. Am J Otolaryngol. 2013 Dec. 23.
68. Naclerio RM, Baroody FM. Response of nasal mucosa to histamine or methacholine challenge: use of a quantitative method to examine the modulatory effects of atropine and ipratropium bromide. J. Allergy Clin. Immunol. Elsevier; 1992;90(6):1051–4.
69. Wagenmann M, Schumacher L, Bachert C. The time course of the bilateral release of cytokines and mediators after unilateral nasal allergen challenge. Allergy. 2005 Sep.;60(9):1132–8.
70. Okano M, Fujiwara T, Higaki T, Makihara S, Haruna T, Noda Y, et al. Characterization of pollen antigen-induced IL-31 production by PBMCs in patients with allergic rhinitis. J. Allergy Clin. Immunol. 2011 Jan.;127(1):277–9–279.e1–11.
71. Sheahan P, Walsh RM, Walsh MA, Costello RW. Hyperresponsiveness of congestive nasal reflexes in allergic rhinitis. Rhinology. 2006 Feb. 28;44(1):68–73.
72. Onda T, Nagakura T, Uekusa T, Masaki T, Iikura Y. Drug effects on antigen-induced release of high molecular weight-neutrophil chemotactic activity and histamine in nasal secretion from children with allergic rhinitis. Allergy Proc. 1990 Aug. 31;11(5):235–40.
73. Howarth PH, Persson CGA, Meltzer EO, Jacobson MR, Durham SR, Silkoff PE. Objective monitoring of nasal airway inflammation in rhinitis. J. Allergy Clin. Immunol. 2005 Mar.;115(3 Suppl 1):S414–41.
74. Bachert C, Van Bruaene N, Toskala E, Zhang N, Olze H, Scadding G, et al. Important research questions in allergy and related diseases: 3-chronic rhinosinusitis and nasal polyposis - a GA 2LEN study. Allergy. 2009 Apr.;64(4):520–33.
75. Heinzerling L, Mari A, Bergmann K-C, Bresciani M, Burbach G, Darsow U, et al. The skin prick test - European standards. Clinical and Translational Allergy. 2012 Dec. 31;3(1):3–3.
76. Lowe PJ, Renard D. Omalizumab decreases IgE production in patients with allergic (IgE-mediated) asthma; PKPD analysis of a biomarker, total IgE. Br J Clin Pharmacol. 2011 Aug.;72(2):306–20.
77. Tomassen P, Newson RB, Hoffmans R, Lötvall J, Cardell LO, Gunnbjörnsdóttir M, et al. Reliability of EP3OS symptom criteria and nasal endoscopy in the assessment of chronic rhinosinusitis - a GA2LEN study. Allergy. 2010 Nov. 17;66(4):556–61.
78. Hastan D, Fokkens WJ, Bachert C, Newson RB, Bislimovska J, Bockelbrink A, et al. Chronic rhinosinusitis in Europe - an underestimated disease. A GA2LEN study. Allergy. 2011 May 24;66(9):1216–23.
79. Jarvis D, Newson R, Lötvall J, Hastan D, Tomassen P, Keil T, et al. Asthma in adults and its

44
association with chronic rhinosinusitis: the GA2LEN survey in Europe. Allergy. 2011 Dec. 31;67(1):91–8.
80. Patou J, Gevaert P, Van Zele T, Holtappels G, Van Cauwenberge P, Bachert C. Staphylococcus aureus enterotoxin B, protein A, and lipoteichoic acid stimulations in nasal polyps. Journal of Allergy and Clinical Immunology. 2008 Jan.;121(1):110–5.
81. Pérez Novo CA, Jedrzejczak-Czechowicz M, Lewandowska-Polak A, Claeys C, Holtappels G, Van Cauwenberge P, et al. T cell inflammatory response, Foxp3 and TNFRS18-L regulation of peripheral blood mononuclear cells from patients with nasal polyps-asthma after staphylococcal superantigen stimulation. Clin Exp Allergy. 2010 Jun. 7;40(9):1323–32.
82. Platts-Mills TA, Woodfolk JA. Allergens and their role in the allergic immune response. Immunological Reviews. 2011 Jun. 14;242:51–68.
83. Zhang K, Mills FC, Saxon A. Switch circles from IL-4-directed epsilon class switching from human B lymphocytes. Evidence for direct, sequential, and multiple step sequential switch from mu to epsilon Ig heavy chain gene. J. Immunol. 1994 Apr. 1;152(7):3427–35.
84. Platts-Mills TA, Maur von RK, Ishizaka K, Norman PS, Lichtenstein LM. IgA and IgG anti-ragweed antibodies in nasal secretions. Quantitative measurements of antibodies and correlation with inhibition of histamine release. J. Clin. Invest. 1976 Apr.;57(4):1041–50.
85. Zhang N, Holtappels G, Gevaert P, Patou J, Dhaliwal B, Gould H, et al. Mucosal tissue polyclonal IgE is functional in response to allergen and SEB. Allergy. 2010 Dec. 3;66(1):141–8.
86. Eccles R. Understanding the symptoms of the common cold and influenza. Lancet Infect Dis. 2005 Nov.;5(11):718–25.
87. Heikkinen T, Shenoy M, Goldblum RM, Chonmaitree T. Quantification of cytokines and inflammatory mediators in samples of nasopharyngeal secretions with unknown dilution. Pediatr. Res. 1999 Feb.;45(2):230–4.

X
APPENDICES Appendix 1: Overview of the ‘superantigen hypothesis’ of CRS. Retrieved from [1].
Appendix 2: Management scheme for adults with CRS with NP for ENT specialists based on the EPOS guidelines. Retrieved from [8].
218
European Position Paper on Rhinosinusitis and Nasal Polyps 2012
8.5.3.2. Treatment For treatment evidence and recommendations for CRSsNP see
Table 8.3 and 8.4.
Treatment should be based on severity of symptoms
Decide on severity of symptomatology using VAS and
endoscope. See Figure 8.5.
Acute exacerbations of CRS should be treated like acute
rhinosinusitis.
8.5.4. Evidence based management for adults with CRS with NP for ENT specialists8.5.4.1. DiagnosisSymptoms present longer than 12 weeks
Two or more symptoms one of which should be either nasal
blockage/obstruction/congestion or nasal discharge (anterior/
posterior nasal drip):
± facial pain/pressure,
± reduction or loss of smell;
Signs
ENT examination, endoscopy;
review primary care physician’s diagnosis and treatment;
questionnaire for allergy and if positive, allergy testing if it
has not already been done.
Figure 8.6. Management scheme for adults with CRS with NP for ENT specialists.
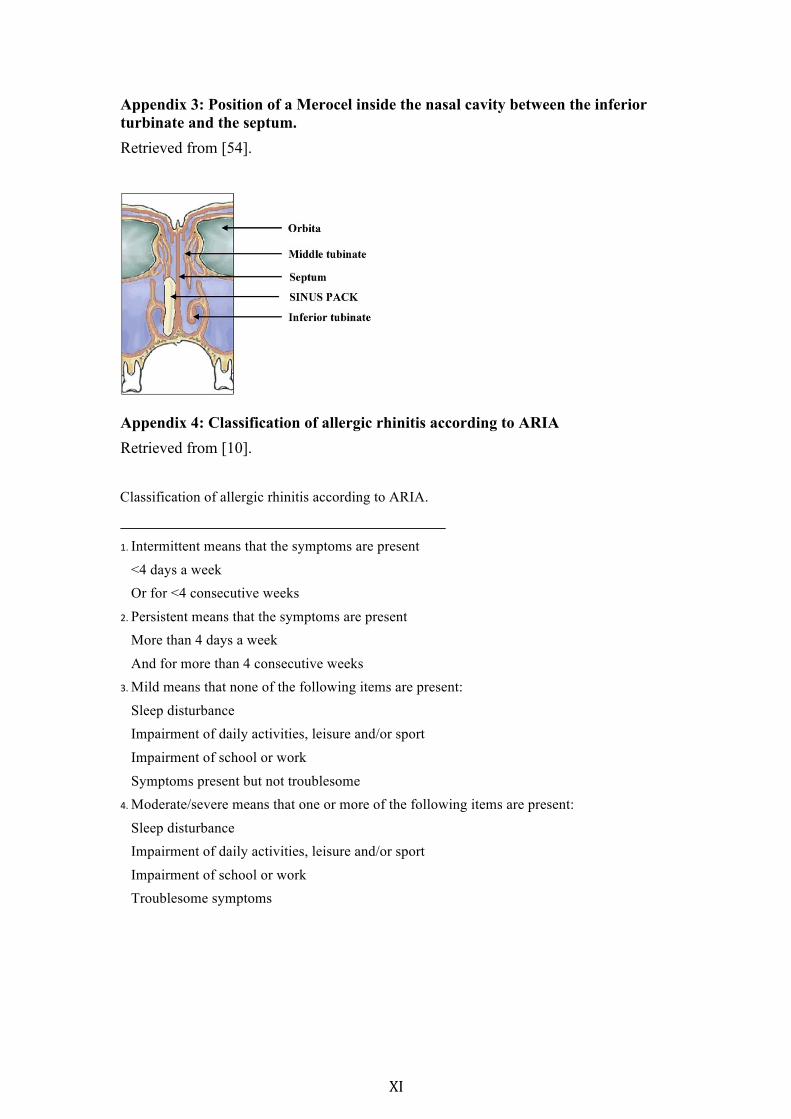
XI
Appendix 3: Position of a Merocel inside the nasal cavity between the inferior turbinate and the septum. Retrieved from [54].
Appendix 4: Classification of allergic rhinitis according to ARIA Retrieved from [10]. Classification of allergic rhinitis according to ARIA.
1. Intermittent means that the symptoms are present
<4 days a week Or for <4 consecutive weeks
2. Persistent means that the symptoms are present More than 4 days a week
And for more than 4 consecutive weeks 3. Mild means that none of the following items are present:
Sleep disturbance Impairment of daily activities, leisure and/or sport
Impairment of school or work
Symptoms present but not troublesome 4. Moderate/severe means that one or more of the following items are present:
Sleep disturbance Impairment of daily activities, leisure and/or sport
Impairment of school or work Troublesome symptoms