May 2017 The Price of Prisons expanding the state-operated prison system, some states also began to...
28
May 2017 e Price of Prisons: Examining State Spending Trends, 2010-2015 Chris Mai and Ram Subramanian
Transcript of May 2017 The Price of Prisons expanding the state-operated prison system, some states also began to...
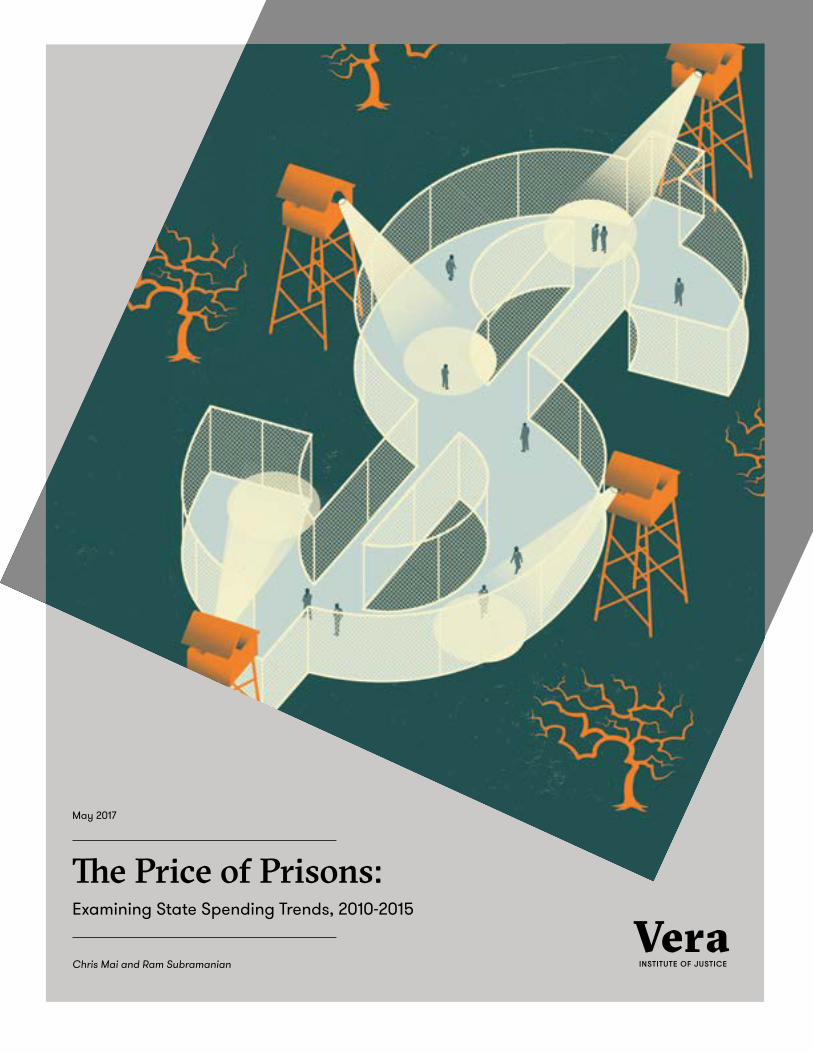
May 2017
The Price of Prisons:Examining State Spending Trends, 2010-2015
Chris Mai and Ram Subramanian
a
In 2012, Vera’s Center on Sentencing and Corrections published The Price of Prisons: What Incarceration Costs Taxpayers, to answer a simple, yet important, question: what is the cost of prison? This report provided critical information, because budgetary considerations are often central to public policy debate. But the landscape of corrections has changed considerably in recent years. After the collective state prison population peaked at 1,407,369 at the end of 2009, it has since declined by 5 percent. While this may not seem like a lot in relative terms, it amounts to more than 77,000 fewer people in prison — a number that exceeds the average daily population of the prison systems in New York (53,181), Georgia (46,145), and Ohio (50,452).
So this begs a new question: if prison populations are falling, are states consequently saving any money? It turns out that many are. Vera researchers found that while states have confronted rising costs for employee salaries and benefits, total prison costs declined by $232 million nationwide, which largely can be attributed to smaller prison populations.
Despite this aggregate trend, however, there is wide variation among states in both prison population and spending. In 2015, out of the 45 states who completed Vera’s survey, 20 spent less on prisons than in 2010, but
in the 25 other states spending increased. This was a result of higher prison populations in 15 states and an increase in spending — in many states — for expenses such as staffing costs and prison health care.
Although rising pension costs and political resistance to prison closures in some states prevented savings even when correctional populations declined, more than half of states with declining prison populations are making good on the promise of smaller prison budgets as well. Since 2010, 23 states have reduced the size of their prison populations. Vera’s research found that 13 of these states have saved considerably in taxpayer money — $1.6 billion — at the same time. While simultaneously downsizing prison populations and spending is easier said than done, these 13 states prove that it is indeed possible. For those who are up to the challenge, this report makes it plain that a large sum of money is on the table.
Christian Henrichson, Research DirectorCenter on Sentencing and CorrectionsVera Institute of Justice
Research Director’s Note
a
Contents
4 Introduction
6 Methodology
7 Prison spending in 2015
Employment is the primary driver of prison spending
10 Trends in prison population and spending: 2010 – 2015
How states saved money in prison spending
Why some states’ spending increased
21 Conclusion
22 Appendix
23 Endnotes
4 Vera Institute of Justice
Introduction
After decades of a stable rate of incarceration, the U.S. prison population experienced unprecedented growth from the early 1970s into the new millennium — with the number of people confined to
state prisons increasing by more than 600 percent, reaching just over 1.4 million people by the end of 2009.1 The engine driving this growth was the enactment and implementation over time of a broad array of tough-on-crime policies, including the rapid and continuous expansion of the criminal code; the adoption of zero-tolerance policing tactics, particularly around minor street-level drug and quality-of-life offenses; and the proliferation of harsh sentencing and release policies aimed at keeping people in prison for longer periods of time (such as mandatory minimum sentences, truth-in-sentencing statutes, and habitual offender laws).2
Unsurprisingly, this explosion in the use of incarceration had a direct financial influence on state budgets. Creating and sustaining such a sprawling penal system has been expensive. With more people under their care, state prison systems were compelled to build new prison facilities and expand existing ones.3 To staff these new and expanded facilities, they also had to hire, train, and retain ever more employees.4 In addition to expanding the state-operated prison system, some states also began to board out increasing numbers of people to county jails, privately-run facilities, and other states’ prison systems.5
After hitting a high of 1.4 million people in 2009, however, the overall state prison population has since declined by 5 percent, or 77,000 people.6 Lawmakers in nearly every state and from across the political spectrum — some prompted by the 2008 recession — have enacted new laws to reduce prison populations and spending, often guided by a now-large body of research supporting alternative, more effective responses to crime.7 In addition to fiscal pressures, the push for reform has been further bolstered by other factors, including low crime rates; shifting public opinion that now favors less incarceration and more rehabilitation; and dissatisfaction with past punitive policies that have
The Price of Prisons: Examining State Spending Trends, 2010-2015 5
failed to moderate persistently high recidivism rates among those sent to prison.8
With these various political, institutional, and economic forces at play, most states have adopted a variety of different policies, including those that increase opportunities to divert people away from the traditional criminal justice process; expand the use of community-based sanctions; reduce the length and severity of prison sentences for certain offenses, including the rollback of mandatory penalties; increase opportunities for people to gain early release; and better provide enhanced reentry support for those leaving prison or jail.9
In light of nearly a decade of broad-based criminal justice reform, this report seeks to determine where state prison spending stands today and how it has changed in recent years. In particular, if a goal of recent reforms has been to make deep and lasting cuts to prison spending by reducing the prison population, have states who have witnessed the desired downward shift in prison size also witnessed it in spending? To answer this question, researchers at the Vera Institute of Justice (Vera) developed a survey to measure changes in state prison population and expenditures between 2010 and 2015, and conducted follow-up interviews with state prison budget officials to better understand spending and population trends.
Vera’s study confirms that prisons remain an expensive enterprise, despite the success of many states — including Michigan, New Jersey, New York, and South Carolina —in simultaneously reducing their prison populations while achieving budget savings. The first part of this report describes 2015 prison expenditures, identifying the main driver of corrections spending across responding states. The second half of the report then discusses how changes in prison populations during the study period, and other trends largely outside the control of departments of corrections have affected prison spending. What is clear is that increased spending is not inevitable, since nearly half of states have cut their spending on prisons between 2010 and 2015. But while one might expect that states with shrinking prison populations are uniformly spending less on prisons, or conversely that states with growing populations are spending more, Vera’s findings paint a more complicated picture. Indeed, often there is no single reason that explains a rise or fall in spending, but a multitude of factors that push and pull expenditures in different directions.
6 Vera Institute of Justice
Methodology
In spring of 2016, Vera designed a survey of state prison expenditures that was modeled on the 2012 Price of Prisons survey. (Unlike the 2012 survey, this new survey did not collect data to estimate the future cost
of underfunded liabilities to employee retirement programs, because the research objective was to measure how states have changed what they spend on prison each year.)
The 2016 survey was pre-tested in three states and collected data on the number of prison facilities, prison employees, incarcerated people under state jurisdiction, and prison expenditures both paid for by the department of corrections and paid for by other state agencies in fiscal years 2000, 2005, 2010, and 2015, including expenditures funded by all revenue sources.10 This survey was distributed to every state’s department of corrections in May 2016. Corrections departments in 45 states completed and returned the survey. Maine, Mississippi, Nebraska, New Hampshire, and Wyoming did not complete a survey. Vera’s analysis focuses on 2010 and 2015 because many states could not provide comprehensive and comparable data for the years 2000 and 2005. Vera also conducted follow-up interviews with state prison budget officials in over half of the surveyed states to better understand state spending and population trends.
All tables in this report are adjusted to fiscal year 2015 dollars using the Bureau of Economic Analysis’ price deflator for gross domestic product.11
Previous Vera reports have examined prison and jail spending. Realigning Justice Resources, published in 2012 during the recovery to the Great Recession, compared spending and population size in state prisons and community corrections between 2006 and 2010, finding that there is not always a clear relationship between population and spending shifts from one part of a state’s criminal justice system to another. Vera’s The Price of Prisons, also published in 2012, sought to uncover the “true” cost of prisons, including state spending
on prisons from state agencies other than the department of corrections. That report found that those costs are usually undercounted in official reports and are often substantial. Vera’s Price of Jails, published in 2015, had similar findings regarding spending at the local level. This report builds on Vera’s prior efforts to evaluate trends in state prison expenditures and in particular to uncover what has changed since 2010.
Costs in context: Vera research on prison and jail costs
The Price of Prisons: Examining State Spending Trends, 2010-2015 7
Prison spending in 2015
Because prisons are institutions where all aspects of life are conducted and administered, they must provide everything deemed necessary for those who are confined there — some for very long
periods of time.12 This, as Vera’s survey results confirm, is an expensive endeavor. Prisons must at all times provide: adequate levels of security; program and administrative staff to run facilities and both supervise and provide services for incarcerated persons; food and programming for the people under their care, including sufficient recreational and educational opportunities; infrastructure maintenance and upkeep, including electricity and other operational costs; and, increasingly, higher levels of specialized health care for a growing population with significant levels of physical and mental health concerns. In 2015, among the 45 responding states, the total state expenditure on prisons was just under $43 billion. Because the size of states and state prison systems vary widely, there is likewise variation between each states’ total prison costs, ranging from $65 million in North Dakota, to more than $8 billion (a fifth of the total prison spending in the United States) in California — the largest state prison system in the country (see Table 1).
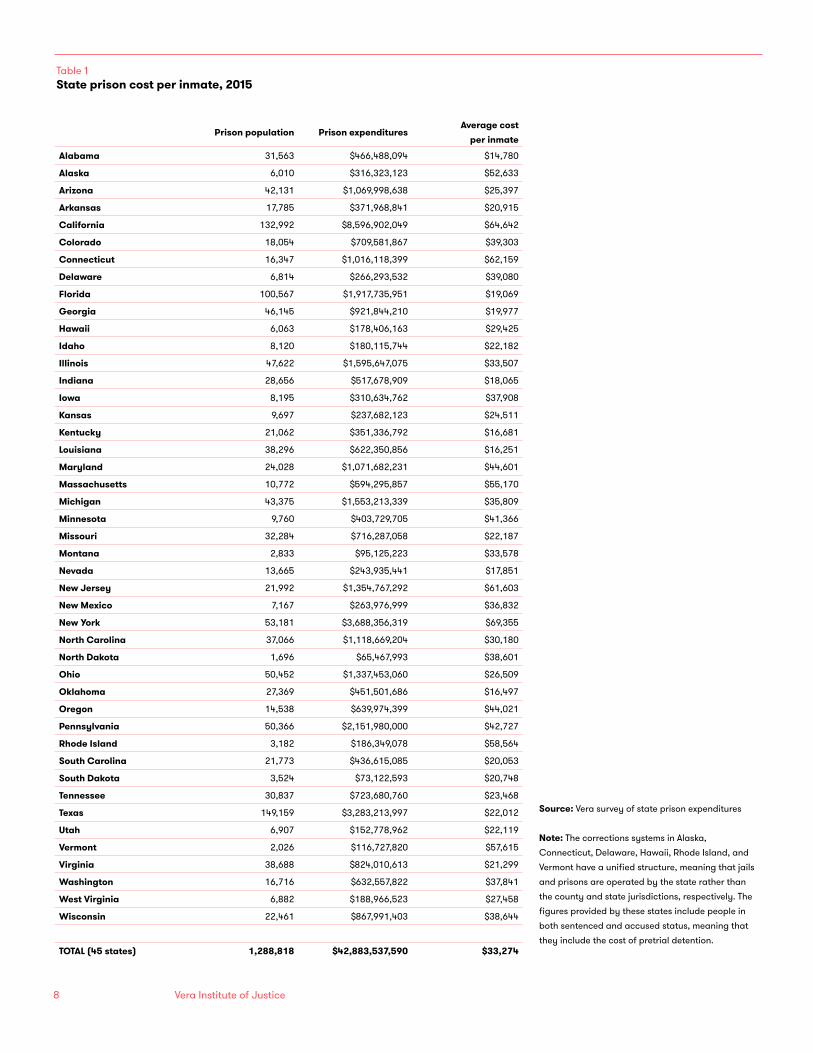
A common measure used by states to understand this cost is the “average cost per inmate,” calculated by taking the total state spending on prisons and dividing it by the average daily prison population.13 This figure represents the amount the state spends annually, on average, to staff and maintain the prisons and provide all prison services. Among the 45 states that provided data (representing 1.29 million of the 1.33 million total people incarcerated in all 50 state prison systems), the total cost per inmate averaged $33,274 and ranged from a low of $14,780 in Alabama to a high of $69,355 in New York. Eight states —Alaska, California, Connecticut, Massachusetts, New Jersey, New York, Rhode Island, and Vermont — had a cost per inmate above $50,000.14 Eighteen, mostly southern, states had costs less than $25,000, while 19 states had costs between $25,000 and $50,000 (see Table 1).
8 Vera Institute of Justice
Table 1State prison cost per inmate, 2015
Prison population Prison expendituresAverage cost
per inmate
Alabama 31,563 $466,488,094 $14,780
Alaska 6,010 $316,323,123 $52,633
Arizona 42,131 $1,069,998,638 $25,397
Arkansas 17,785 $371,968,841 $20,915
California 132,992 $8,596,902,049 $64,642
Colorado 18,054 $709,581,867 $39,303
Connecticut 16,347 $1,016,118,399 $62,159
Delaware 6,814 $266,293,532 $39,080
Florida 100,567 $1,917,735,951 $19,069
Georgia 46,145 $921,844,210 $19,977
Hawaii 6,063 $178,406,163 $29,425
Idaho 8,120 $180,115,744 $22,182
Illinois 47,622 $1,595,647,075 $33,507
Indiana 28,656 $517,678,909 $18,065
Iowa 8,195 $310,634,762 $37,908
Kansas 9,697 $237,682,123 $24,511
Kentucky 21,062 $351,336,792 $16,681
Louisiana 38,296 $622,350,856 $16,251
Maryland 24,028 $1,071,682,231 $44,601
Massachusetts 10,772 $594,295,857 $55,170
Michigan 43,375 $1,553,213,339 $35,809
Minnesota 9,760 $403,729,705 $41,366
Missouri 32,284 $716,287,058 $22,187
Montana 2,833 $95,125,223 $33,578
Nevada 13,665 $243,935,441 $17,851
New Jersey 21,992 $1,354,767,292 $61,603
New Mexico 7,167 $263,976,999 $36,832
New York 53,181 $3,688,356,319 $69,355
North Carolina 37,066 $1,118,669,204 $30,180
North Dakota 1,696 $65,467,993 $38,601
Ohio 50,452 $1,337,453,060 $26,509
Oklahoma 27,369 $451,501,686 $16,497
Oregon 14,538 $639,974,399 $44,021
Pennsylvania 50,366 $2,151,980,000 $42,727
Rhode Island 3,182 $186,349,078 $58,564
South Carolina 21,773 $436,615,085 $20,053
South Dakota 3,524 $73,122,593 $20,748
Tennessee 30,837 $723,680,760 $23,468
Texas 149,159 $3,283,213,997 $22,012
Utah 6,907 $152,778,962 $22,119
Vermont 2,026 $116,727,820 $57,615
Virginia 38,688 $824,010,613 $21,299
Washington 16,716 $632,557,822 $37,841
West Virginia 6,882 $188,966,523 $27,458
Wisconsin 22,461 $867,991,403 $38,644
TOTAL (45 states) 1,288,818 $42,883,537,590 $33,274
Source: Vera survey of state prison expenditures Note: The corrections systems in Alaska, Connecticut, Delaware, Hawaii, Rhode Island, and Vermont have a unified structure, meaning that jails and prisons are operated by the state rather than the county and state jurisdictions, respectively. The figures provided by these states include people in both sentenced and accused status, meaning that they include the cost of pretrial detention.
The Price of Prisons: Examining State Spending Trends, 2010-2015 9
Employment is the primary driver of prison spending
While state-to-state comparisons of average cost per inmate can be a tempting way for policymakers and the public to make conclusions on whether money is being spent wisely, such comparisons should be done with some caution. First, per-inmate costs do not measure the effectiveness of spending; they merely tally spending itself. Second, states’ per-inmate costs can be reduced by increasing the number of people held in the prison, which can invite unsafe conditions. Third, costs vary across states because of regional differences in wages.
One major finding in Vera’s analysis is that personnel costs — including salaries, overtime, and benefits —comprised the lion’s share of state prison expenditures, making up more than two-thirds (68 percent) of total spending in 2015 (see the appendix).15 States with higher average salaries for corrections employees — such as California and Connecticut — and more employees relative to the size of the prison population (for example a higher officer-to-inmate staffing ratio) — such as Massachusetts, New York, and Rhode Island — will generally have higher per-inmate costs. Vera’s calculation of personnel costs includes salaries, overtime, and benefits for uniform and non-uniform corrections employees.
By comparison, only 11 percent of prison spending nationally was spent on payments for prison health care, including payments to outside health care providers, pharmaceuticals, and hospital care.16 The cost can be much higher in individual states. In 2015, in six states (Alabama, Delaware, Georgia, Idaho, Missouri, and South Dakota), health care spending exceeded 20 percent of the state’s prison spending. This share depends partially on the extent to which the corrections department contracts out the provision of health care services. States that predominantly use contracted health care services will spend more on outside health care payments while states with a majority of health care services provided by state employees will spend less on outside health services. However, personnel costs in these states still made up the bulk of individual budgets.
Seventeen percent of spending nationally was devoted to a catch-all category that includes facility maintenance, programming costs for incarcerated people, debt service, and legal judgments. Thus, Vera’s finding reveals that the average cost per inmate is in fact principally driven by the number of corrections officers per incarcerated person, and their average salaries.
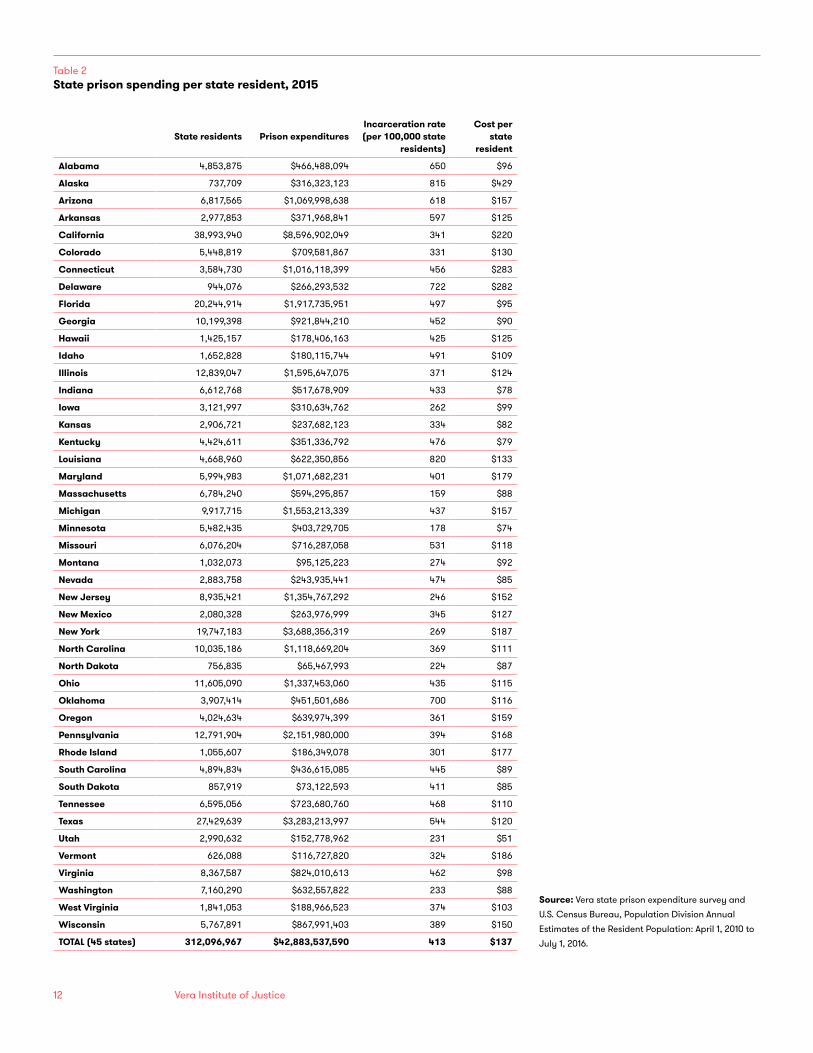
A more accurate way to compare how much states spend on their prisons is the cost per state resident. This is because examining the cost per
10 Vera Institute of Justice
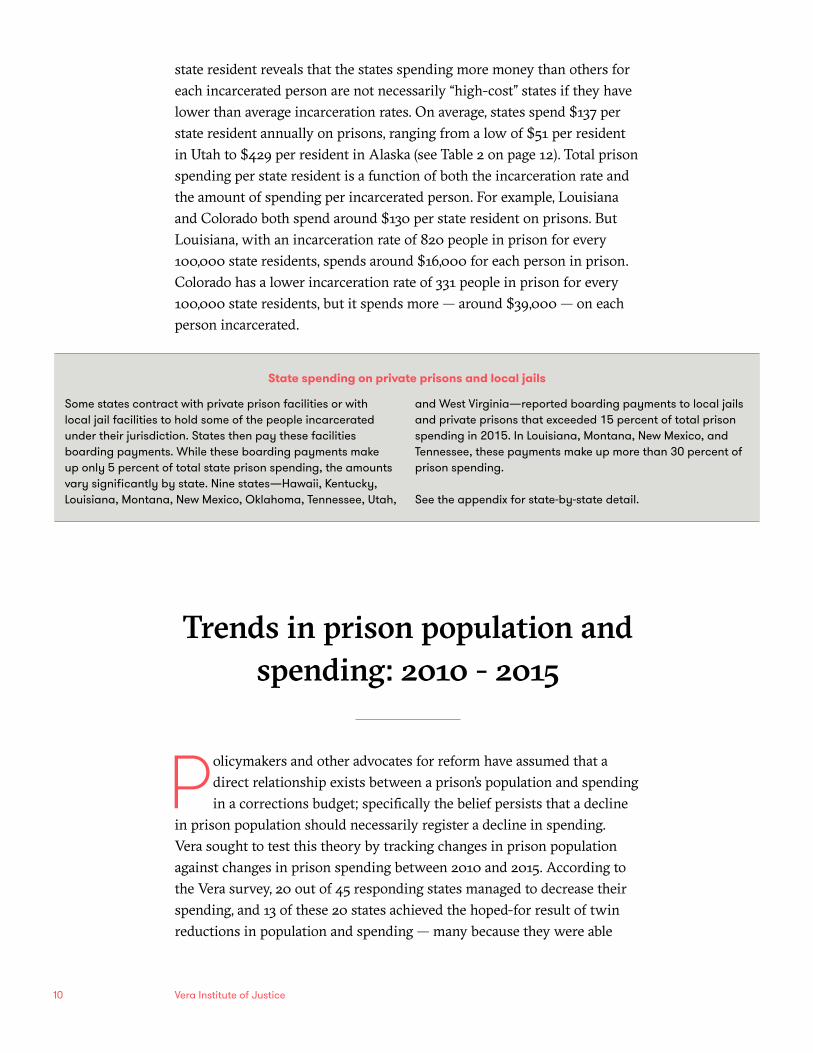
state resident reveals that the states spending more money than others for each incarcerated person are not necessarily “high-cost” states if they have lower than average incarceration rates. On average, states spend $137 per state resident annually on prisons, ranging from a low of $51 per resident in Utah to $429 per resident in Alaska (see Table 2 on page 12). Total prison spending per state resident is a function of both the incarceration rate and the amount of spending per incarcerated person. For example, Louisiana and Colorado both spend around $130 per state resident on prisons. But Louisiana, with an incarceration rate of 820 people in prison for every 100,000 state residents, spends around $16,000 for each person in prison. Colorado has a lower incarceration rate of 331 people in prison for every 100,000 state residents, but it spends more — around $39,000 — on each person incarcerated.
Trends in prison population and spending: 2010 - 2015
Policymakers and other advocates for reform have assumed that a direct relationship exists between a prison’s population and spending in a corrections budget; specifically the belief persists that a decline
in prison population should necessarily register a decline in spending. Vera sought to test this theory by tracking changes in prison population against changes in prison spending between 2010 and 2015. According to the Vera survey, 20 out of 45 responding states managed to decrease their spending, and 13 of these 20 states achieved the hoped-for result of twin reductions in population and spending — many because they were able
Some states contract with private prison facilities or with local jail facilities to hold some of the people incarcerated under their jurisdiction. States then pay these facilities boarding payments. While these boarding payments make up only 5 percent of total state prison spending, the amounts vary significantly by state. Nine states—Hawaii, Kentucky, Louisiana, Montana, New Mexico, Oklahoma, Tennessee, Utah,
and West Virginia—reported boarding payments to local jails and private prisons that exceeded 15 percent of total prison spending in 2015. In Louisiana, Montana, New Mexico, and Tennessee, these payments make up more than 30 percent of prison spending.
See the appendix for state-by-state detail.
State spending on private prisons and local jails
The Price of Prisons: Examining State Spending Trends, 2010-2015 11
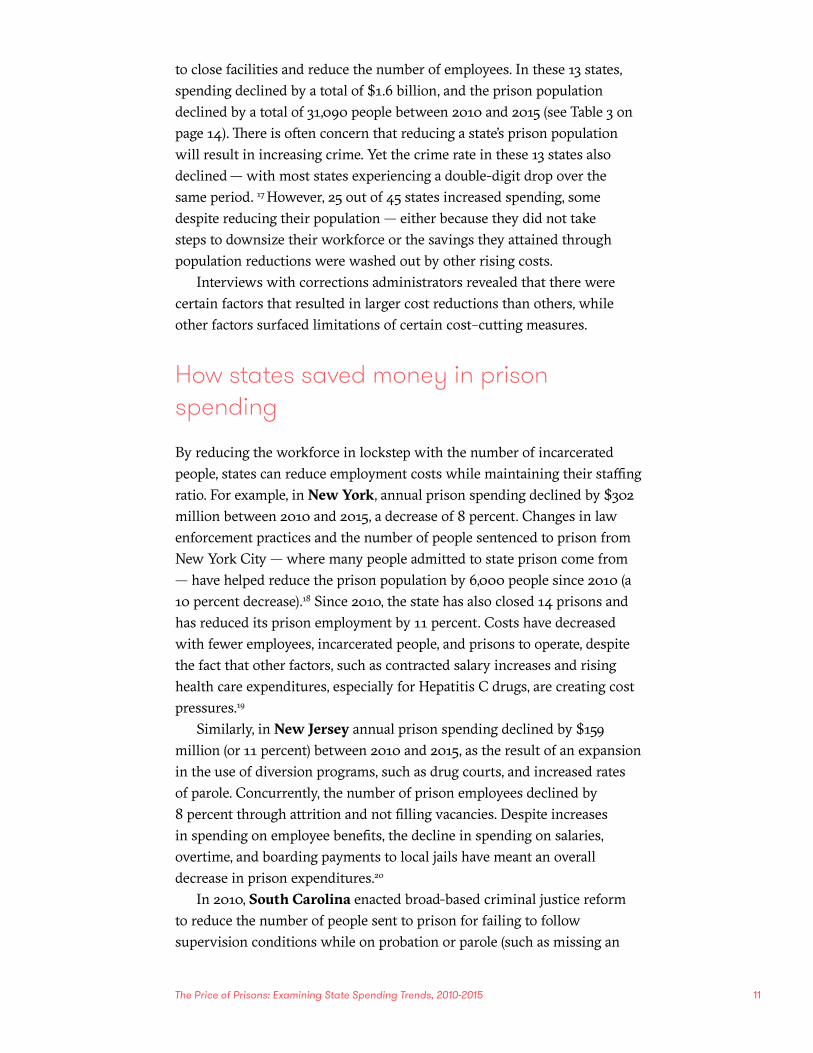
to close facilities and reduce the number of employees. In these 13 states, spending declined by a total of $1.6 billion, and the prison population declined by a total of 31,090 people between 2010 and 2015 (see Table 3 on page 14). There is often concern that reducing a state’s prison population will result in increasing crime. Yet the crime rate in these 13 states also declined — with most states experiencing a double-digit drop over the same period. 17 However, 25 out of 45 states increased spending, some despite reducing their population — either because they did not take steps to downsize their workforce or the savings they attained through population reductions were washed out by other rising costs.
Interviews with corrections administrators revealed that there were certain factors that resulted in larger cost reductions than others, while other factors surfaced limitations of certain cost–cutting measures.
How states saved money in prison spending
By reducing the workforce in lockstep with the number of incarcerated people, states can reduce employment costs while maintaining their staffing ratio. For example, in New York, annual prison spending declined by $302 million between 2010 and 2015, a decrease of 8 percent. Changes in law enforcement practices and the number of people sentenced to prison from New York City — where many people admitted to state prison come from — have helped reduce the prison population by 6,000 people since 2010 (a 10 percent decrease).18 Since 2010, the state has also closed 14 prisons and has reduced its prison employment by 11 percent. Costs have decreased with fewer employees, incarcerated people, and prisons to operate, despite the fact that other factors, such as contracted salary increases and rising health care expenditures, especially for Hepatitis C drugs, are creating cost pressures.19
Similarly, in New Jersey annual prison spending declined by $159 million (or 11 percent) between 2010 and 2015, as the result of an expansion in the use of diversion programs, such as drug courts, and increased rates of parole. Concurrently, the number of prison employees declined by 8 percent through attrition and not filling vacancies. Despite increases in spending on employee benefits, the decline in spending on salaries, overtime, and boarding payments to local jails have meant an overall decrease in prison expenditures.20
In 2010, South Carolina enacted broad-based criminal justice reform to reduce the number of people sent to prison for failing to follow supervision conditions while on probation or parole (such as missing an
12 Vera Institute of Justice
State residents Prison expenditures Incarceration rate (per 100,000 state
residents)
Cost per state
resident
Alabama 4,853,875 $466,488,094 650 $96
Alaska 737,709 $316,323,123 815 $429
Arizona 6,817,565 $1,069,998,638 618 $157
Arkansas 2,977,853 $371,968,841 597 $125
California 38,993,940 $8,596,902,049 341 $220
Colorado 5,448,819 $709,581,867 331 $130
Connecticut 3,584,730 $1,016,118,399 456 $283
Delaware 944,076 $266,293,532 722 $282
Florida 20,244,914 $1,917,735,951 497 $95
Georgia 10,199,398 $921,844,210 452 $90
Hawaii 1,425,157 $178,406,163 425 $125
Idaho 1,652,828 $180,115,744 491 $109
Illinois 12,839,047 $1,595,647,075 371 $124
Indiana 6,612,768 $517,678,909 433 $78
Iowa 3,121,997 $310,634,762 262 $99
Kansas 2,906,721 $237,682,123 334 $82
Kentucky 4,424,611 $351,336,792 476 $79
Louisiana 4,668,960 $622,350,856 820 $133
Maryland 5,994,983 $1,071,682,231 401 $179
Massachusetts 6,784,240 $594,295,857 159 $88
Michigan 9,917,715 $1,553,213,339 437 $157
Minnesota 5,482,435 $403,729,705 178 $74
Missouri 6,076,204 $716,287,058 531 $118
Montana 1,032,073 $95,125,223 274 $92
Nevada 2,883,758 $243,935,441 474 $85
New Jersey 8,935,421 $1,354,767,292 246 $152
New Mexico 2,080,328 $263,976,999 345 $127
New York 19,747,183 $3,688,356,319 269 $187
North Carolina 10,035,186 $1,118,669,204 369 $111
North Dakota 756,835 $65,467,993 224 $87
Ohio 11,605,090 $1,337,453,060 435 $115
Oklahoma 3,907,414 $451,501,686 700 $116
Oregon 4,024,634 $639,974,399 361 $159
Pennsylvania 12,791,904 $2,151,980,000 394 $168
Rhode Island 1,055,607 $186,349,078 301 $177
South Carolina 4,894,834 $436,615,085 445 $89
South Dakota 857,919 $73,122,593 411 $85
Tennessee 6,595,056 $723,680,760 468 $110
Texas 27,429,639 $3,283,213,997 544 $120
Utah 2,990,632 $152,778,962 231 $51
Vermont 626,088 $116,727,820 324 $186
Virginia 8,367,587 $824,010,613 462 $98
Washington 7,160,290 $632,557,822 233 $88
West Virginia 1,841,053 $188,966,523 374 $103
Wisconsin 5,767,891 $867,991,403 389 $150
TOTAL (45 states) 312,096,967 $42,883,537,590 413 $137
Table 2 State prison spending per state resident, 2015
Source: Vera state prison expenditure survey and U.S. Census Bureau, Population Division Annual Estimates of the Resident Population: April 1, 2010 to July 1, 2016.
The Price of Prisons: Examining State Spending Trends, 2010-2015 13
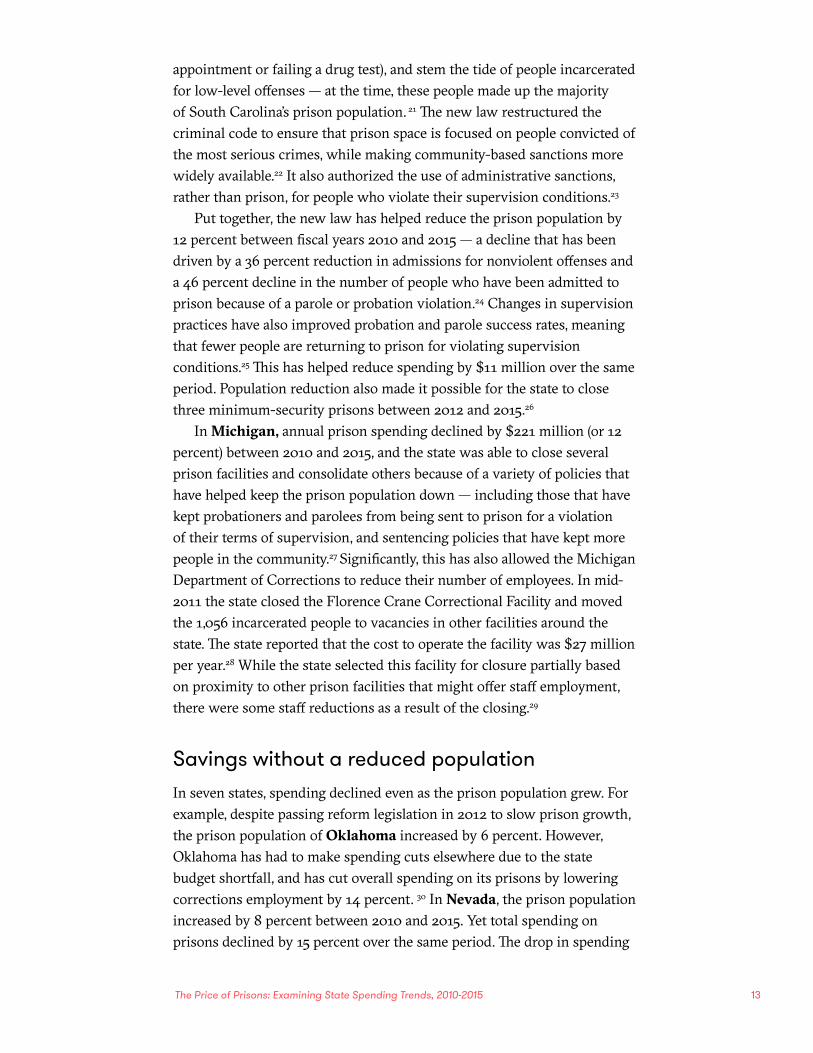
appointment or failing a drug test), and stem the tide of people incarcerated for low-level offenses — at the time, these people made up the majority of South Carolina’s prison population. 21 The new law restructured the criminal code to ensure that prison space is focused on people convicted of the most serious crimes, while making community-based sanctions more widely available.22 It also authorized the use of administrative sanctions, rather than prison, for people who violate their supervision conditions.23
Put together, the new law has helped reduce the prison population by 12 percent between fiscal years 2010 and 2015 — a decline that has been driven by a 36 percent reduction in admissions for nonviolent offenses and a 46 percent decline in the number of people who have been admitted to prison because of a parole or probation violation.24 Changes in supervision practices have also improved probation and parole success rates, meaning that fewer people are returning to prison for violating supervision conditions.25 This has helped reduce spending by $11 million over the same period. Population reduction also made it possible for the state to close three minimum-security prisons between 2012 and 2015.26
In Michigan, annual prison spending declined by $221 million (or 12 percent) between 2010 and 2015, and the state was able to close several prison facilities and consolidate others because of a variety of policies that have helped keep the prison population down — including those that have kept probationers and parolees from being sent to prison for a violation of their terms of supervision, and sentencing policies that have kept more people in the community.27 Significantly, this has also allowed the Michigan Department of Corrections to reduce their number of employees. In mid-2011 the state closed the Florence Crane Correctional Facility and moved the 1,056 incarcerated people to vacancies in other facilities around the state. The state reported that the cost to operate the facility was $27 million per year.28 While the state selected this facility for closure partially based on proximity to other prison facilities that might offer staff employment, there were some staff reductions as a result of the closing.29
Savings without a reduced populationIn seven states, spending declined even as the prison population grew. For example, despite passing reform legislation in 2012 to slow prison growth, the prison population of Oklahoma increased by 6 percent. However, Oklahoma has had to make spending cuts elsewhere due to the state budget shortfall, and has cut overall spending on its prisons by lowering corrections employment by 14 percent. 30 In Nevada, the prison population increased by 8 percent between 2010 and 2015. Yet total spending on prisons declined by 15 percent over the same period. The drop in spending
14 Vera Institute of Justice
Prison population,
2010
Prison population,
2015
Change in prison
population, 2010-2015
Prison expenditures,
2010 (inflation adjusted to 2015
dollars)
Prison expenditures,
2015
Change in prison
expenditures, 2010-2015
Alabama 31,873 31,563 -1.0% $482,710,817 $466,488,094 -3.4%
Alaska 5,461 6,010 10.1% $279,939,651 $316,323,123 13.0%
Arizona 40,458 42,131 4.1% $1,058,588,444 $1,069,998,638 1.1%
Arkansas 14,800 17,785 20.2% $346,075,666 $371,968,841 7.5%
California 168,044 132,992 -20.9% $8,036,681,801 $8,596,902,049 7.0%
Colorado 19,738 18,054 -8.5% $709,439,344 $709,581,867 0.0%*
Connecticut 18,492 16,347 -11.6% $939,046,471 $1,016,118,399 8.2%
Delaware 6,710 6,814 1.5% $250,180,697 $266,293,532 6.4%
Florida 101,324 100,567 -0.7% $2,175,001,882 $1,917,735,951 -11.8%
Georgia 49,250 46,145 -6.3% $937,934,701 $921,844,210 -1.7%
Hawaii 6,291 6,063 -3.6% $168,911,005 $178,406,163 5.6%
Idaho 7,495 8,120 8.3% $152,219,154 $180,115,744 18.3%
Illinois 44,979 47,622 5.9% $1,325,688,698 $1,595,647,075 20.4%
Indiana 28,332 28,656 1.1% $578,737,303 $517,678,909 -10.6%
Iowa 8,384 8,195 -2.3% $298,477,658 $310,634,762 4.1%
Kansas 8,689 9,697 11.6% $233,231,736 $237,682,123 1.9%
Kentucky 20,443 21,062 3.0% $369,125,775 $351,336,792 -4.8%
Louisiana 39,939 38,296 -4.1% $667,693,269 $622,350,856 -6.8%
Maryland 25,259 24,028 -4.9% $1,102,632,491 $1,071,682,231 -2.8%
Massachusetts 11,478 10,772 -6.2% $575,908,502 $594,295,857 3.2%
Michigan 45,241 43,375 -4.1% $1,773,912,932 $1,553,213,339 -12.4%
Minnesota 9,374 9,760 4.1% $391,387,179 $403,729,705 3.2%
Missouri 30,418 32,284 6.1% $727,452,301 $716,287,058 -1.5%
Montana 2,595 2,833 9.2% $84,262,869 $95,125,223 12.9%
Nevada 12,619 13,665 8.3% $285,827,951 $243,935,441 -14.7%
New Jersey 25,822 21,992 -14.8% $1,514,062,321 $1,354,767,292 -10.5%
New Mexico 6,538 7,167 9.6% $274,309,692 $263,976,999 -3.8%
New York 59,237 53,181 -10.2% $3,990,824,975 $3,688,356,319 -7.6%
North Carolina 40,203 37,066 -7.8% $1,194,046,296 $1,118,669,204 -6.3%
North Dakota 1,479 1,696 14.7% $61,217,368 $65,467,993 6.9%
Ohio 50,960 50,452 -1.0% $1,534,239,950 $1,337,453,060 -12.8%
Oklahoma 25,897 27,369 5.7% $502,586,473 $451,501,686 -10.2%
Oregon 13,819 14,538 5.2% $627,753,765 $639,974,399 1.9%
Pennsylvania 50,622 50,366 -0.5% $1,760,004,449 $2,151,980,000 22.3%
Rhode Island 3,351 3,182 -5.0% $175,536,150 $186,349,078 6.2%
South Carolina 24,710 21,773 -11.9% $447,565,286 $436,615,085 -2.4%
South Dakota 3,422 3,524 3.0% $66,177,862 $73,122,593 10.5%
Tennessee 28,102 30,837 9.7% $678,030,989 $723,680,760 6.7%
Texas 154,315 149,159 -3.3% $3,544,624,503 $3,283,213,997 -7.4%
Utah 6,578 6,907 5.0% $148,166,778 $152,778,962 3.1%
Vermont 2,247 2,026 -9.8% $113,853,297 $116,727,820 2.5%
Virginia 38,778 38,688 -0.2% $799,367,854 $824,010,613 3.1%
Washington 16,554 16,716 1.0% $693,643,913 $632,557,822 -8.8%
West Virginia 6,386 6,882 7.8% $170,268,248 $188,966,523 11.0%
Wisconsin 23,015 22,461 -2.4% $868,383,553 $867,991,403 0.0%*
TOTAL (45 states) 1,339,721 1,288,818 -3.8% $43,115,732,021 $42,883,537,590 -0.5%
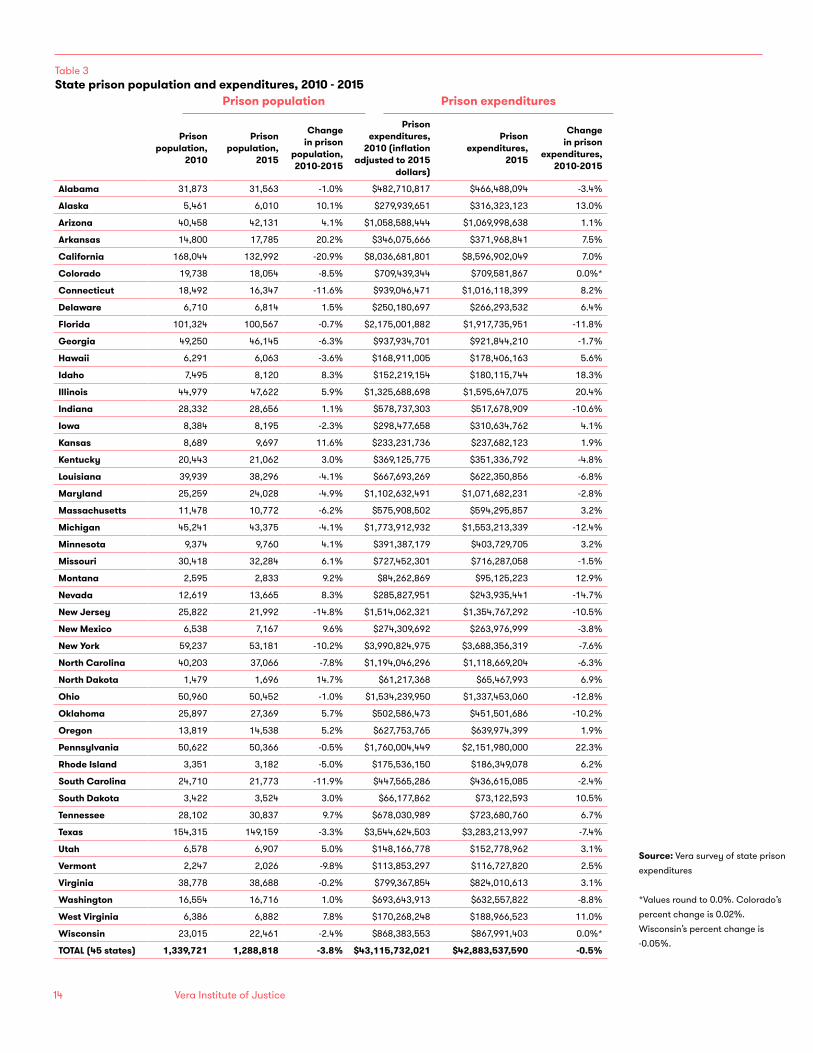
Table 3State prison population and expenditures, 2010 - 2015
Prison population Prison expenditures
Source: Vera survey of state prison expenditures
*Values round to 0.0%. Colorado’s percent change is 0.02%. Wisconsin’s percent change is -0.05%.
The Price of Prisons: Examining State Spending Trends, 2010-2015 15
The average annual cost per inmate was $33,274 in 2015. But as prison administrators are quick to note, reducing the prison population by one person does not result in $33,274 in savings. This is because the average cost includes many fixed costs such as administrative services and facility maintenance, which do not change when the population decreases. Instead, when the population decreases by one person, a state will save money on variable costs, which include things like food, clothing, laundry, and—in some states—a per-diem payment to the prison health care provider. If the state prison population drops by a sufficient threshold, the state may be able to close a housing unit or a prison facility. This means they can reduce step-fixed costs, which include the salaries and benefits attendant to the former employees of closed units and facilities.
Because the average cost cannot be used to estimate prison savings, many states calculate a prison marginal cost, the
change in costs when the prison population declines by one person. For example, South Carolina reports that the annual marginal cost is $3,747 per inmate (the average cost is $20,053) and New York reports that its annual marginal cost is $18,706 per inmate (the average cost is $69,355).a Importantly, the marginal cost is always smaller than the average cost and generally found to be less than half the value of the average cost.
See the Vera report A Guide to Calculating Justice-System Marginal Costs for more information.
a South Carolina Department of Probation, Parole and Pardon Services, Report to the Sentencing Reform Oversight Committee, November 2015. Marc Schabses, Cost Benefit Analysis for Criminal Justice Deployment and Initial Application of the Results First Cost Benefit Model (Albany, NY: New York Division of Criminal Justice Services, 2013).
How states estimate potential savings
was driven by a 4 percent decline in the number of prison employees, a state policy requiring state employees to take one unpaid furlough day per month, and a decline in spending on all employee fringe benefits.31 Because of these cuts, these states have fewer resources to meet the demands of facilities with growing populations. In particular, a lower inmate-to-officer staffing ratio can impact facility safety and effectiveness.
Why some states’ spending increased
More than half of responding states (25 of 45) registered an increase in their prison spending between 2010 and 2015. These increases were sometimes due to deliberate policy choices, such as a reduction in the use of parole. With more people held in prison, a state may decide to hire more employees, open new facilities or wings, and expand services like health care for incarcerated people. But not all of the states with rising spending also saw a growth in their prison population. For example, in 10 states, prison spending continued to rise despite a shrinking prison population because of rising employment and health care costs. Interviews also revealed other factors driving this increase in spending.
16 Vera Institute of Justice
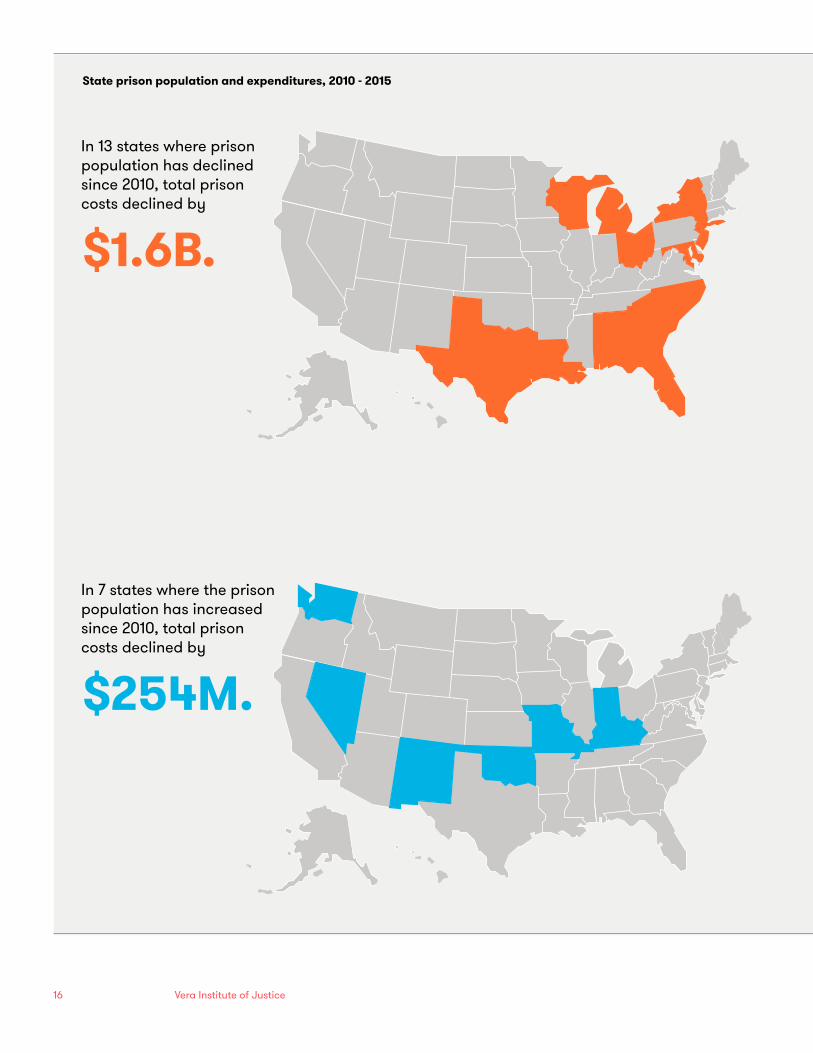
In 13 states where prison population has declined since 2010, total prison costs declined by
$1.6B.
State prison population and expenditures, 2010 - 2015
In 7 states where the prison population has increased since 2010, total prison costs declined by
$254M.
The Price of Prisons: Examining State Spending Trends, 2010-2015 17
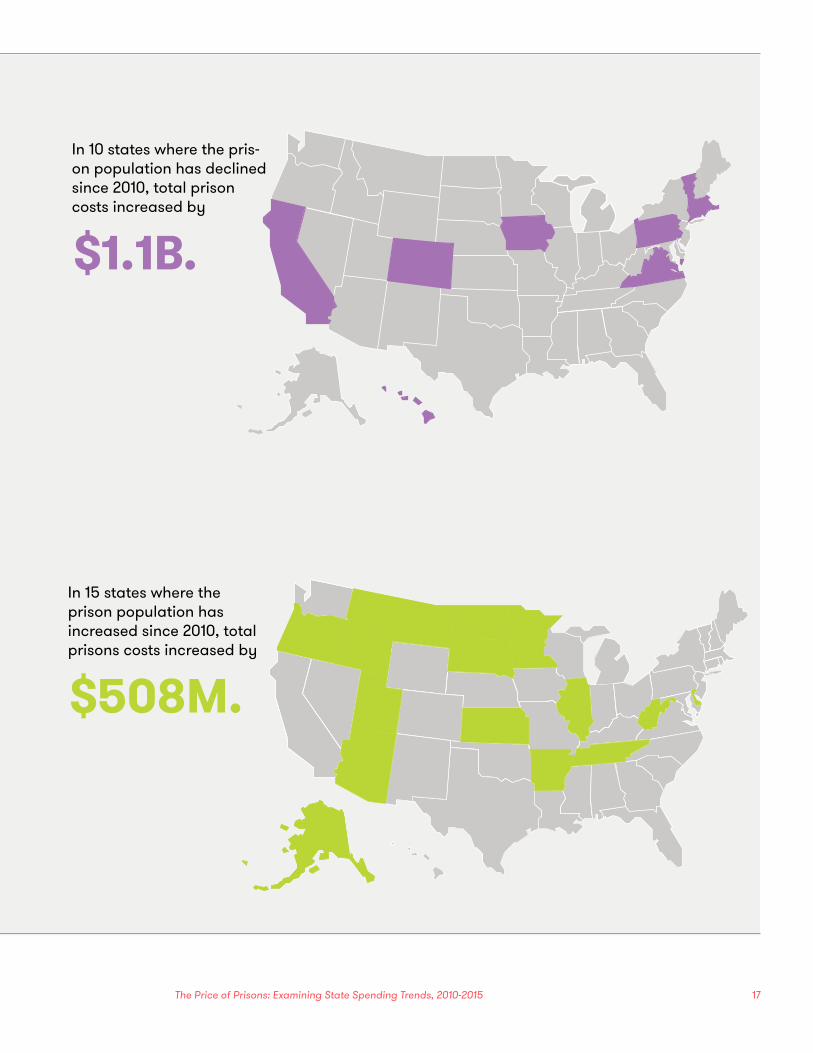
In 15 states where the prison population has increased since 2010, total prisons costs increased by
$508M.
In 10 states where the pris-on population has declined since 2010, total prison costs increased by
$1.1B.
18 Vera Institute of Justice
Public sentimentPolitical and public reaction to a well-publicized crime can sometimes sideline policy changes that aim to reduce prison spending. For example, despite enacting criminal justice reform in 2011, public outcry after a high-profile crime committed by an absconded parolee in 2013 led Arkansas to enact stringent parole policies that revoked more parolees back to prison.32 Because of these changes, the prison population soared, as did the number of people held in local jails. Between 2010 and 2015, the prison population increased by 20 percent, with much of this growth a result of Arkansas sending people on probation or parole back to prison for violating terms of their supervision in the community.33 The state had more prison employees in 2015 than in 2010 and spent more on salaries and employee benefits. The population held in local jails, meanwhile, increased by 66 percent between 2010 and 2015, and boarding payments to local jails to house overflow increased by $5.4 million over this period. By 2015, some counties began sending some of the people in their jurisdiction to be housed in Bowie County, Texas.34
Rising employment costsFifteen states (of the 40 that could offer comparable data) reported an increase in the number of prison employees between fiscal years 2010 and 2015 (including uniform staff, non-uniform staff, contract employees for medical services, contract employees at private prisons, and all other prison-related employees). Even in some states with relatively flat or shrinking workforces, the corrections departments face rising salary costs due to wage increases. On average, salary and overtime expenditures (exclusive of employee benefits) made up 44 percent of state prison spending in 2015 and employee benefits made up another 24 percent of state prison spending.
In Pennsylvania, the prison workforce decreased by 8 percent between 2010 and 2015, while the prison population remained largely flat. Despite the decline in the number of employees, prison spending increased by 22 percent between 2010 and 2015. Expenditures on employee benefits, including health care for current and former employees, increased by 51 percent between 2010 and 2015, largely due to a dramatic increase in the amount that state employers were required to contribute to employee pensions.35 Additionally, salary expenditures increased by 8 percent due to negotiated salary increases, while spending on overtime doubled, partially as a result of hiring freezes in the 2012-2013 and 2014-2015 budget years that left many positions vacant.36
The Price of Prisons: Examining State Spending Trends, 2010-2015 19
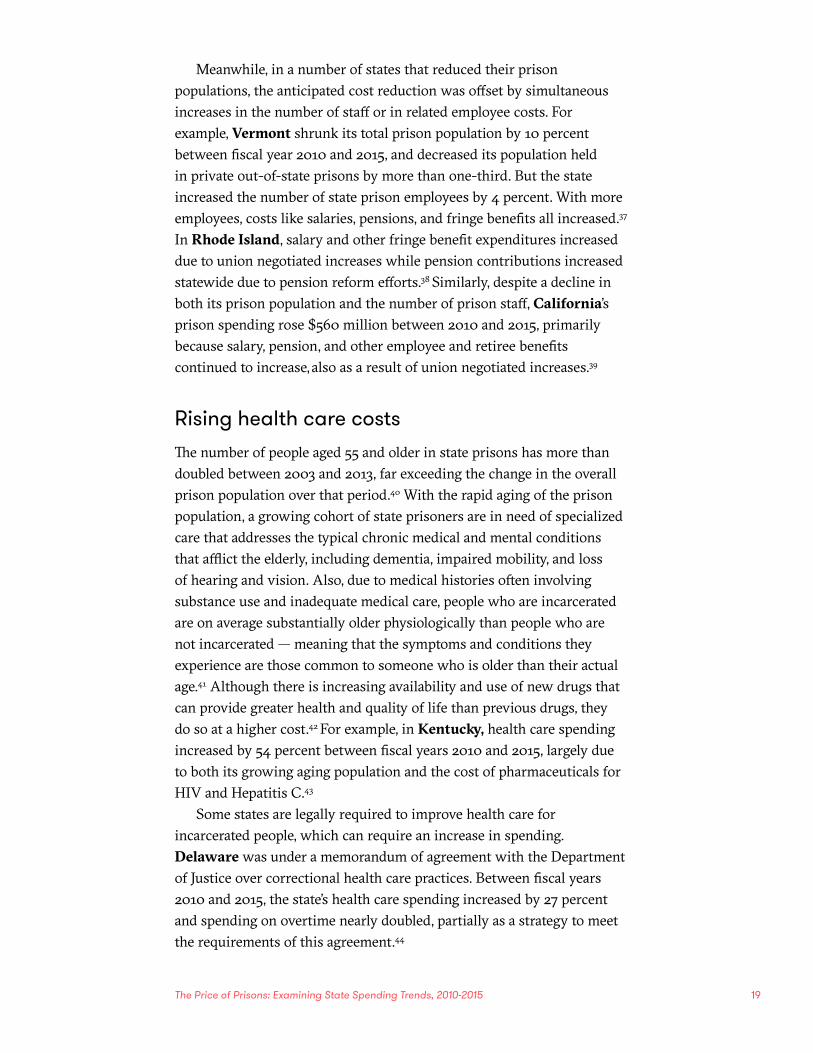
Meanwhile, in a number of states that reduced their prison populations, the anticipated cost reduction was offset by simultaneous increases in the number of staff or in related employee costs. For example, Vermont shrunk its total prison population by 10 percent between fiscal year 2010 and 2015, and decreased its population held in private out-of-state prisons by more than one-third. But the state increased the number of state prison employees by 4 percent. With more employees, costs like salaries, pensions, and fringe benefits all increased.37 In Rhode Island, salary and other fringe benefit expenditures increased due to union negotiated increases while pension contributions increased statewide due to pension reform efforts.38 Similarly, despite a decline in both its prison population and the number of prison staff, California’s prison spending rose $560 million between 2010 and 2015, primarily because salary, pension, and other employee and retiree benefits continued to increase, also as a result of union negotiated increases.39
Rising health care costs The number of people aged 55 and older in state prisons has more than doubled between 2003 and 2013, far exceeding the change in the overall prison population over that period.40 With the rapid aging of the prison population, a growing cohort of state prisoners are in need of specialized care that addresses the typical chronic medical and mental conditions that afflict the elderly, including dementia, impaired mobility, and loss of hearing and vision. Also, due to medical histories often involving substance use and inadequate medical care, people who are incarcerated are on average substantially older physiologically than people who are not incarcerated — meaning that the symptoms and conditions they experience are those common to someone who is older than their actual age.41 Although there is increasing availability and use of new drugs that can provide greater health and quality of life than previous drugs, they do so at a higher cost.42 For example, in Kentucky, health care spending increased by 54 percent between fiscal years 2010 and 2015, largely due to both its growing aging population and the cost of pharmaceuticals for HIV and Hepatitis C.43
Some states are legally required to improve health care for incarcerated people, which can require an increase in spending. Delaware was under a memorandum of agreement with the Department of Justice over correctional health care practices. Between fiscal years 2010 and 2015, the state’s health care spending increased by 27 percent and spending on overtime nearly doubled, partially as a strategy to meet the requirements of this agreement.44

20 Vera Institute of Justice
In some states, health care needs necessitate increased staffing levels, more officer training, and expanded treatment offerings, bringing costs up further. In Montana, health care costs have increased, partially as a result of the completion, in 2012, of a 25-bed facility for people with serious, chronic medical conditions.45 Montana’s prison population is aging and faces a mounting need for care for acute health conditions.46 The average cost per day at this facility is nearly three times higher than the cost of the state’s other prisons.47
The Price of Prisons: Examining State Spending Trends, 2010-2015 21
Conclusion
As this report demonstrates, state spending on prisons is influenced by a range of factors, and costs can vary widely from year to year. In 14 states, costs have swung up (seven states) or down (seven
states) by a substantial 10 percent in only five years. Some factors are largely outside of a corrections department’s control, such as rising health care costs, statewide policies to increase public employee salaries and benefits, and policy changes that affect sentencing, thus affecting the size of the prison population. Other factors are more within the corrections department’s control, such as inmate-to-officer staffing and the number of prison facilities the state operates.
Since 2010, nearly half of states have reduced their spending on prisons. Most of these states did so through deliberate choices to reduce the size of their prison populations and downsize their prison staff. These states have fewer people in state prisons, fewer state resources dedicated to incarceration, and can even boast lower crime rates than five years ago. They demonstrate that a growing prison system is not inevitable, and there are steps that states can take to downsize.
A separate group of states also reduced their prison spending, despite a growing number of people in state prisons. These states run the risk of lowering the office-to-inmate staffing ratio, which can increase the potential threats to both staff and incarcerated people. Spending that declines despite a growing population decreases the state’s ability to offer services, programs, or treatment, which may result in worse outcomes, including leaving mental, behavioral, and other health needs unaddressed and increasing recidivism if people are not properly prepared for reentry.
Thus, the surest — and safest — way to attain savings is to decrease prison operations by also decreasing prison populations. Surveys and follow-up interviews with states indicate that reducing the number of staff commensurate with the size of the prison population is often challenging, and all states face financial pressures from rising health care costs and rising employee salaries and benefits. But 13 states — Alabama, Florida, Georgia, Louisiana, Maryland, Michigan, New Jersey, New York, North Carolina, Ohio, South Carolina, Texas, and Wisconsin — show that it is possible to reduce prison populations and prison expenses.
22 Vera Institute of Justice
Salaries and
overtime
Other personnel
services
Boarding payments to local jails, private
prisons and prisons in other states
Payments to health
care providers
All other
Alabama 39% 15% 2% 22% 23%
Alaska 39% 23% 11% 6% 21%
Arizona 37% 19% 13% 13% 18%
Arkansas 45% 16% 6% 15% 18%
California 51% 23% 3% 6% 17%
Colorado 49% 15% 11% 6% 19%
Connecticut 39% 44% 0% 8% 8%
Delaware 33% 16% 0% 24% 26%
Florida 35% 19% 8% 18% 20%
Georgia 28% 22% 14% 20% 16%
Hawaii 58% 0% 20% 5% 17%
Idaho 30% 16% 13% 21% 19%
Illinois 49% 41% 0% 10% 0%
Indiana 39% 23% 2% 18% 18%
Kentucky 24% 14% 30% 15% 17%
Louisiana 29% 17% 33% 5% 15%
Maryland 44% 22% 0% 16% 18%
Massachusetts 68% 2% 0% 16% 14%
Michigan 41% 35% 1% 8% 15%
Minnesota 43% 22% 2% 7% 27%
Missouri 40% 21% 0% 21% 18%
Montana 26% 12% 33% 19% 10%
Nevada 51% 23% 0% 6% 21%
New Jersey 45% 25% 0% 12% 18%
New Mexico 27% 13% 32% 17% 11%
New York 50% 32% 0% 10% 7%
North Carolina 49% 25% 0% 11% 16%
Ohio 36% 27% 5% 9% 22%
Oklahoma 37% 19% 28% 11% 5%
Oregon 42% 25% 0% 6% 26%
Pennsylvania 44% 31% 1% 5% 19%
Rhode Island 61% 30% 0% 5% 4%
South Carolina 48% 20% 0% 10% 22%
South Dakota 33% 12% 0% 28% 26%
Tennessee 23% 6% 35% 15% 21%
Texas 39% 18% 3% 16% 24%
Utah 35% 37% 19% 8% 0%
Vermont 34% 17% 9% 19% 21%
Virginia 41% 25% 3% 16% 14%
Washington 54% 21% 0% 7% 19%
West Virginia 38% 15% 21% 11% 15%
Wisconsin 44% 22% 0% 7% 27%
TOTAL (42 states) 44% 24% 5% 11% 17%
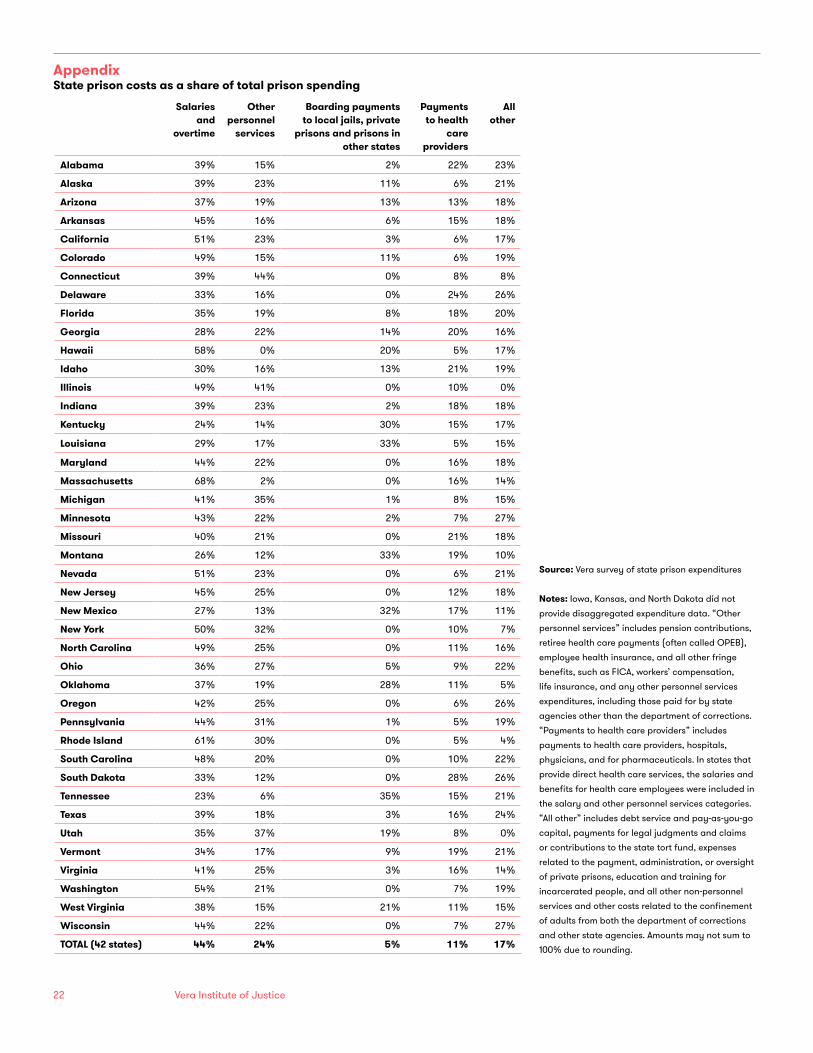
Appendix State prison costs as a share of total prison spending
Source: Vera survey of state prison expenditures
Notes: Iowa, Kansas, and North Dakota did not provide disaggregated expenditure data. “Other personnel services” includes pension contributions, retiree health care payments (often called OPEB), employee health insurance, and all other fringe benefits, such as FICA, workers’ compensation, life insurance, and any other personnel services expenditures, including those paid for by state agencies other than the department of corrections. “Payments to health care providers” includes payments to health care providers, hospitals, physicians, and for pharmaceuticals. In states that provide direct health care services, the salaries and benefits for health care employees were included in the salary and other personnel services categories. “All other” includes debt service and pay-as-you-go capital, payments for legal judgments and claims or contributions to the state tort fund, expenses related to the payment, administration, or oversight of private prisons, education and training for incarcerated people, and all other non-personnel services and other costs related to the confinement of adults from both the department of corrections and other state agencies. Amounts may not sum to 100% due to rounding.
The Price of Prisons: Examining State Spending Trends, 2010-2015 23
1 Between 1925 and 1975, the U.S. incarceration rate hovered around 100 per 100,000, with a minor spike between 1937 and 1941, when it reached between 120 and 140 per 100,000. See University at Albany, Hindelang Criminal Justice Research Center, Sourcebook of Criminal Justice Statistics, Table 6.28.2012: “Number and rate (per 100,000 resident population in each group) of sentenced prisoners under jurisdiction of State and Federal correctional authorities on December 31, by sex, United States 1925-2012” https://perma.cc/7GKM-8HTU. For the 2009 incarcerated population count, see E. Ann Carson and Elizabeth Anderson, Prisoners in 2015 (Washington, DC: Bureau of Justice Statistics, 2016), 3.
2 For an overview of the expanding penal code, see Douglas Husak, Overcriminalization: The Limits of The Criminal Law (Oxford, UK: Oxford University Press, 2009); also see Stephen F. Smith, “Overcoming Overcriminalization,” Journal Of Criminal Law & Criminology 102, no.3 (2012): 537-543; and Paul J. Larkin Jr., “Public Choice Theory and Overcriminalization,” Harvard Journal of Law & Public Policy 36, no.2 (2013): 715, 723-735. Quality-of-life offenses include loitering and disorderly conduct. For an example of zero-tolerance policing practices in New York City, see Jeffrey Fagan and Garth Davies, “Street Stops and Broken Windows: Terry, Race, and Disorder in New York City,” Fordham Urban Law Journal 28, (2000): 457, 470-2, and 475-8; also see Jeffrey Fagan, Valerie West, and Jan Holland, “Reciprocal Effects of Crime and Incarceration in New York City Neighborhoods,” Fordham Urban Law Journal 30, no.5 (2002): 1551 and 1563-1566, and K. Babe Howell, “Broken Lives from Broken Windows: The Hidden Costs of Aggressive Order-Maintenance Policing,” New York University Review of Law & Social Change 33 (2009): 271, 276. For information on the introduction of stiffer penalties, see Ram Subramanian and Ruth Delaney, Playbook for Change? States Reconsider Mandatory Sentences (New York: Vera Institute of Justice, 2014), 6.
3 In 1979, there were 568 state prisons. By 2005, that number reached 1,719—a 200 percent increase. See James Stephen, Census of State and Federal Correctional Facilities, 1990 (Washington, DC: Bureau of Justice Statistics, 1992), iv; and James Stephen, Census of State and Federal Correctional Facilities, 2005 (Washington, DC: Bureau of Justice Statistics, 2008), 2. Prison construction was in part encouraged by federal legislation. In 1994, the federal government passed the Violent Crime Control and Law Enforcement Act that established the Truth-in-Sentencing (TIS) Incentive Grants Program, which provided grants for prison construction and expansion to states that adopted policies requiring people sentenced to prison to serve a substantial portion—up to 85 percent—of their sentences. While Delaware, Minnesota, Tennessee, Utah, and Washington had already adopted TIS laws prior to 1994, 22 additional states adopted policies by 1998 to secure their eligibility for TIS grant money. See Paula M. Ditton and Doris James Wilson, Truth in Sentencing in State Prisons (Washington, DC: Bureau of Justice Statistics, 1999), 2-3.
4 Between 1990 and 2005, the number of staff working in state and federal confinement facilities grew from approximately 259,000 to 445,000 staff, a 72 percent increase. See James Stephen, Census of State and Federal Correctional Facilities, 1990, 1992, 15; and James Stephen, Census of State and Federal Correctional Facilities, 2005, 2008, 4.
5 From 2000 to 2005, the number of private facilities increased from 16 percent (264) to 23 percent (415) of all correctional institutions, two-thirds of which were under contract to state authorities. See James Stephen, Census of State and Federal Correctional Facilities, 2005 (Washington, DC: Bureau of Justice Statistics, 2008), 1. An example of a state department of correction sending population overflow to other systems is Pennsylvania. In 2010, Pennsylvania entered into two renewable two-year contracts with Michigan and Virginia to house approximately 2,000 people it had no room to house. See Corinne Reilly, “Pennsylvania to Reclaim Prisoners Housed in Virginia,” The Virginian-Pilot, September 30, 2011, https://perma.cc/F2JK-RKP4. The number of people under the jurisdiction of state prisons who were held in local jails grew from 59,250 in 1999, the first year the Bureau of Justice Statistics collected this data, to 80,426 in 2015, an increase of 36 percent. See E. Ann Carson and Joseph Mulako-Wangota, Bureau of Justice Statistics, Count of jurisdiction population - held in county facilities/local jails. Generated using the Corrections Statistical Analysis Tool (CSAT) - Prisoners at www.bjs.gov.
6 E. Ann Carson and Elizabeth Anderson, Prisoners in 2015 (Washington, DC: Bureau of Justice Statistics, 2016), 3.
7 For example, see Rebecca Silber, Ram Subramanian, and Maia Spotts, Justice in Review: New Trends in State Sentencing and Corrections 2014-2015 (New York: Vera Institute of Justice, 2016). For research about effective correctional strategies in the community, see Vera Institute of Justice, The Potential of Community Corrections to Improve Safety and Reduce Incarceration (New York: Vera Institute of Justice, 2013). Also see National Institute of Corrections and Crime and Justice Institute, Implementing Evidence-Based Practice in Community Corrections: The Principles of Effective Intervention (Washington, DC: Department of Justice, National Institute of Corrections, 2004); and Christopher T. Lowenkamp and Edward J. Latessa, “Understanding the Risk Principle: How and Why Correctional Interventions Can Harm Low-Risk Offenders” in Topics in Community Corrections (Washington, DC: National Institute of Corrections, 2004).
8 For declining rates of criminal victimization, see Jennifer L. Truman and Rachel E. Morgan, Criminal Victimization, 2015 (Washington, DC: Bureau of Justice Statistics, 2016), Figures 1-3. For an opinion poll on criminal justice issues, see Jill Mizell and Loren Siegel, An Overview of Public Opinion and Discourse on Criminal Justice Issues (New York: The Opportunity Agenda,
Endnotes
24 Vera Institute of Justice
2014), 19-24. For example, The Opportunity Agenda found that 69 percent of Americans felt that the criminal justice system “needed major improvements” or “a complete redesign,” and that nearly half of Americans believe society is better served by a greater effort to rehabilitate people convicted of crimes. The report also cites a Hindelang Criminal Justice Research Center study finding that, in 2010, 64 percent of respondents reported that their preferred approach to lowering crime was by adding “more money and effort” to “attacking the social and economic problems that lead to crime through better education and job training,” compared to only 32 percent who preferred “more money and effort” for “deterring crime by improving law enforcement with more prisons, police, and judges.” In 1994, only 51 percent of respondents favored the former approach. Also see Pew Center on the States, Public Opinion on Sentencing and Corrections Policy in America (Washington, DC: The Pew Charitable Trusts, 2012) for the result of a public opinion poll that demonstrates that most Americans support alternatives to incarceration for nonviolent offenses. For research on the recidivism rate, see Matthew R. Durose et al., Recidivism of Prisoners Released in 30 States in 2005: Patterns from 2005 to 2010 (Washington, DC: Bureau of Justice Statistics, 2014). According to that report, in 2005, 67.8 percent of the state prisoners released from 30 states were rearrested within three years, and 76.6 percent were rearrested within five years. Also see The Pew Center on the States, State of Recidivism: The Revolving Door of America’s Prisons (Washington, DC: Pew Charitable Trusts, 2011).
9 See, for example, Rebecca Silber, et al., Justice in Review, 2016; and Ram Subramanian, Rebecka Moreno, and Sharyn Broomhead, Recalibrating Justice: A Review of 2013 State Sentencing and Corrections Trends (New York: Vera Institute of Justice, 2014). See also Lauren Brooke Eisen and Juliene James, Reallocating Justice Resources: A Review of 2011 State Sentencing Trends (New York: Vera Institute of Justice, 2012); Alison Lawrence, Trends in Sentencing and Corrections: State Legislation (Washington, DC: National Conference of State Legislatures, 2013); and Alison Lawrence and Donna Lyons, Principles of Effective State Sentencing and Corrections Policy (Washington, DC: National Conference of State Legislatures, 2011).
10 While nearly all states were able to comprehensively tally the total cost of the prison system, three states—Hawaii, Massachusetts, and South Dakota—could not provide the amount of expenditures for pension contributions paid for by other state agencies. In addition, a number of states could not provide the amount of Other Post-Employment Benefits (OPEB) for prison employees, while other states did not provide other costs that support prisons, such as hospital care for incarcerated people or debt service. Thus, these estimates should be considered conservative.
11 Bureau of Economic Analysis, Table 1.1.9 “Implicit Price Deflators for Gross Domestic Product,” at https://www.bea.gov/national/index.htm.
12 See Erving Goffman, “On the characteristics of total institutions,” in Donald R. Cressey (ed), The Prison: Studies in Institutional Organiza-tion and Change (New York: Holt, Rinehart and Winston, 1961), 15-64.
Following Erving Goffman, social scientists have long viewed prisons as a primary example of a “total institution.” In such an institution, people who reside there must conduct different aspects of their life—such as sleeping, eating, and working—in the same place, under a singular authority, with other people they have not chosen, under a structured scheme of formal rules, and with limited contact with the outside world.
13 Vera’s writing generally uses “incarcerated person” in lieu of the term “inmate.” In this report, we use “inmate” when referencing the commonly used statistic “cost per inmate,” and “incarcerated person” when making reference to people held in prison.
14 The corrections systems in Alaska, Connecticut, Delaware, Hawaii, Rhode Island, and Vermont have a unified structure, meaning that jails and prisons are operated by the state rather than county and state jurisdictions, respectively. The figures provided by these states include people in both sentenced and accused status, meaning that they include the cost of pretrial detention.
15 Three states—Iowa, Kansas, and North Dakota—did not provide disaggregated expenditure data.
16 The health care category comprises payments to health care providers, hospitals, physicians, and for pharmaceuticals for incarcerated people. In states that provide direct health care services, the salaries and benefits for health care employees were included in the salary and benefit category. The health care estimate should be considered conservative. For more on state prison health care spending, see The Pew Charitable Trusts and the John D. and Catherine T. MacArthur Foundation, State Prison Health Care Spending (Washington, DC: The Pew Charitable Trusts and the John D. and Catherine T. MacArthur Foundation, 2014).
17 The Pew Charitable Trusts, National Imprisonment and Crime Rates Continue to Fall (Washington, DC: The Pew Charitable Trusts, 2016).
18 During this period in New York City, felony arrests declined, and judges and prosecutors increased the use of alternatives to incarceration such as adjournments in contemplation of dismissal, conditional and unconditional discharges, drug treatment, and fines, and decreased the use of prison, jail, and probation sentences. See Judith Greene and Vincent Schiraldi, “Better by Half: The New York City Story of Winning Large-Scale Decarceration while Increasing Public Safety,” Federal Sentencing Reporter 29, (Oakland, CA: University of California Press, 2016) 22-38.
19 Andrew Howland, chief budget analyst, New York State Department of Corrections and Community Supervision, interview by Vera Institute of Justice, August 18, 2016.
20 Gary Alpert, assistant commissioner of administration, Patricia Loreti, director, Office of Financial Management, and Donna Gies, supervising administrative analyst, New Jersey Department of Corrections, interview by Vera Institute of Justice, August 25, 2016.
21 John P. Morgan, director, Division of Budget and Planning, South
The Price of Prisons: Examining State Spending Trends, 2010-2015 25
Carolina Department of Corrections, e-mail correspondence with Vera Institute of Justice, August 16, 2016.
22 See Omnibus Crime Reduction and Sentencing Reform Act of 2010, South Carolina General Assembly, 118th Session, 2009-2010, https://perma.cc/Y3EL-KWRH.
23 Ibid.
24 Emma Dean and J. J. Gentry, State Expenditures Savings Report (Columbia, SC: The South Carolina Sentencing Reform Oversight Committee, 2015), 3 and 5.
25 Ibid, 3-6.
26 South Carolina Department of Corrections, Facility Openings and Closures at https://perma.cc/7XKN-QCMD. Two additional facilities were closed in 2016.
27 John Agar, “Michigan Prison to Close as Inmate Population Declines,” Mlive.com, May 31, 2016, https://perma.cc/6W9R-L5S7.
28 Michigan Department of Corrections, “Announcement of the Closing of Florence Crane Facility,” Press release, March 24, 2011.
29 Shannon Pike, budget, accounting and projections division administrator, Michigan Department of Corrections, interview by Vera Institute of Justice, August 24, 2016.
30 Tom James, chief financial officer, and Ashlee Clemmons, chief administrator, Business Services, Oklahoma Department of Corrections, interview by Vera Institute of Justice, August 24, 2016.
31 Scott Ewart, chief of fiscal services, and John Borrowman, deputy director, Support Services, Nevada Department of Corrections, interview by Vera Institute of Justice, September 21, 2016.
32 See Public Safety Improvement Act of 2011 (SB 750), http://www.arkleg.state.ar.us/assembly/2011/2011R/Bills/SB750.pdf. Also see Pew Center on the States, Arkansas’s 2011 Public Safety Reform Legislation to Reduce Recidivism and Curtail Prison Growth (Washington, DC: Pew Center on the States, 2011); and Council of State Governments (CSG) Justice Center, Justice Reinvestment in Arkansas (Lexington, KY: CSG, 2016).
33 Ibid. Council of State Governments, 2016.
34 Tiffanye Compton, research and planning administrator and Mike Carraway, assistant director of administrative services, Arkansas Department of Correction, interview by Vera Institute of Justice, August 23, 2016.
35 The employee contribution rate for the States Employees’ Retirement System increased from 4 percent in 2010 to 20.5 percent in 2015. See States Employees’ Retirement System, Commonwealth of Pennsylvania State Employees’ Retirement System 2008 Actuarial Report (Harrisburg, PA: SERS, 2008), 13; and State Employees’ Retirement System, Commonwealth of Pennsylvania State
Employees’ Retirement System 2013 Actuarial Report (Harrisburg, PA: SERS, 2013), 17.
36 Harry Jones, director of administration, Pennsylvania Department
of Corrections, interview by Vera Institute of Justice, August 15, 2016. See also Charles Thompson, “State Prison Overtime Debate is ‘Exhibit A’ in Pennsylvania’s Budget Stalemate,” PennLive.com, February 29, 2016, https://perma.cc/F23K-3BKJ.
37 Matt D’Agostino, financial director, Vermont Department of Corrections, interview by Vera Institute of Justice, August 25, 2016.
38 Joanne Hill, associate director, Financial Resources, Rhode Island Department of Corrections, interview by Vera Institute of Justice, August 15, 2016.
39 Carlos Quant, staff services manager, California Department of Corrections and Rehabilitation, interview by Vera Institute of Justice, August 31, 2016.
40 E. Ann Carson and William J. Sabol, Aging of the State Prison Population, 1993-2013 (Washington, DC: Bureau of Justice Statistics, 2016.
41 R.V. Rikard and Ed Rosenberg, “Aging Inmates: A Convergence of Trends in the American Criminal Justice System,” Journal of Correctional Health Care 13, no 3 (2007): 150-162.
42 See Kristin Gourlay, “Costly Hepatitis C Drugs Threaten to Bust Prison Budgets,” NPR, December 24, 2014, http://www.npr.org/sections/health-shots/2014/12/24/372721256/costly-hepatitis-c-drugs-threaten-to-bust-prison-budgets; and Beth Schwartzapfel, “Why Some Prisoners with HIV Get Better Treatment than Others,” The Marshall Project, March 29, 2016, https://perma.cc/YR6B-88Y4.
43 Hilarye Dailey, director of administrative services, Kentucky Department of Corrections, e-mail correspondence with Vera Institute of Justice, August 24, 2016.
44 Jodie Wedel, deputy bureau chief, administrative services, and Robert May, deputy bureau chief, Bureau of Prisons, Delaware Department of Correction, interview by Vera Institute of Justice, August 31, 2016.
45 Montana Department of Corrections memo, from Director Mike Ferriter to Department of Corrections employees, Re: Lewistown infirmary project, May 18, 2012, https://perma.cc/7WK6-G8EB.
46 April Grady, budget and contract management bureau chief, Montana Department of Corrections, interview by Vera Institute of Justice, September 12, 2016.
47 Montana Department of Corrections, 2015 Biennial Report (Helena, MT: Montana Department of Corrections, 2015), C-5.

26 Vera Institute of Justice
The Price of Prisons: Examining State Spending Trends, 2010-2015 27
Acknowledgements
The authors wish to thank the state departments of corrections who completed the survey and participated in interviews. We would also like to thank Mary Crowley, Christian Henrichson, Jim Parsons, and Fred Patrick for their review and comments; Erika Turner for editing the report and leading the publication process; and Gloria Mendoza for her help in designing the report. We are deeply grateful to the Robert W. Wilson Charitable Trust for supporting this report.
About Citations
As researchers and readers alike rely more and more on public knowledge made available through the Internet, “link rot” has become a widely-acknowledged problem with creating useful and sustainable citations. To address this issue, the Vera Institute of Justice is experimenting with the use of Perma.cc (https://perma.cc/), a service that helps scholars, journals, and courts create permanent links to the online sources cited in their work.
Credits
© Vera Institute of Justice 2017. All rights reserved. An electronic version of this report is posted on Vera’s website at www.vera.org/price-of-prisons-2015.
Image credits: ©2017 Neil Webb c/o theispot
The Vera Institute of Justice is a justice reform change agent. Vera produces ideas, analysis and research that inspire change in the systems people rely upon for safety and justice, and works in close partnerships with government and civic leaders to implement it. Vera is currently pursuing core priorities of ending the misuse of jails, transforming conditions of confinement, and ensuring that justice systems more effectively serve America’s increasingly diverse communities. For more information, visit www.vera.org.
For more information about this report, contact Ram Subramanian, editorial director, at [email protected]. For more information on Vera’s research on prison and jail spending, contact Christian Henrichson, research director, Center on Sentencing and Corrections, at [email protected].
Suggested Citation
Chris Mai and Ram Subramanian. Price of Prisons 2015: Examining State Spending Trends, 2010-2015. New York: Vera Institute of Justice, 2017.

Vera Institute of Justice233 Broadway, 12th FloorNew York, NY 10279T 212 334 1300F 212 941 9407
New Orleans Office546 Carondelet St.New Orleans, LA 70130T 504 593 0937
Los Angeles Office707 Wilshire Blvd., Ste 3850Los Angeles, CA 90017T 213 223 2442F 213 955 9250
Washington DC Office1100 First St. NE, Ste 950 Washington, DC 20002T 202 465 8900F 202 408 1972