Materials for Aircraft Structures
40
-
Upload
manoj-manoharan -
Category
Documents
-
view
134 -
download
19
description
Materials for Aircraft Structures
Transcript of Materials for Aircraft Structures


Comparison of Basic Properties at Room Temperature
FIGURE 3/1
Note : Fibre Only
0
400
800
1200
1600
2000
2400
2800
3200
IM7 XASFibre
Steel Al Alloy Titanium
Sp
ecifi
c T
ensi
le S
tren
gth
(N/m
m2 )
0
20000
40000
60000
80000
100000
120000
140000
160000
IM7 XAS Fibre Steel Al Alloy TitaniumS
pec
ific
Mo
du
lus
(N/m
m2 )

Effect of Reduction Factors on CFC Specific Strength & Modulus
FIGURE 3/2

Temperature Reduction Factors
FIGURE 3/3

Comparison of Materials
FIGURE 3/4
Note!NO REDUCTION FOR EFFECTS OF FATIGUE HAS BEEN MADE TOTHE METALLIC TENSION SPECIFIC STRENGTHS
0
10000
20000
30000
40000
50000
60000
CFC Steel Al Alloy Titanium
Sp
ecif
ic m
od
ulu
s (N
/mm
2 )
0
50
100
150
200
250
300
CFC Steel Al Alloy Titanium
Sp
ecif
ic s
tren
gth
(N
/mm
2 ) Tension
Compression
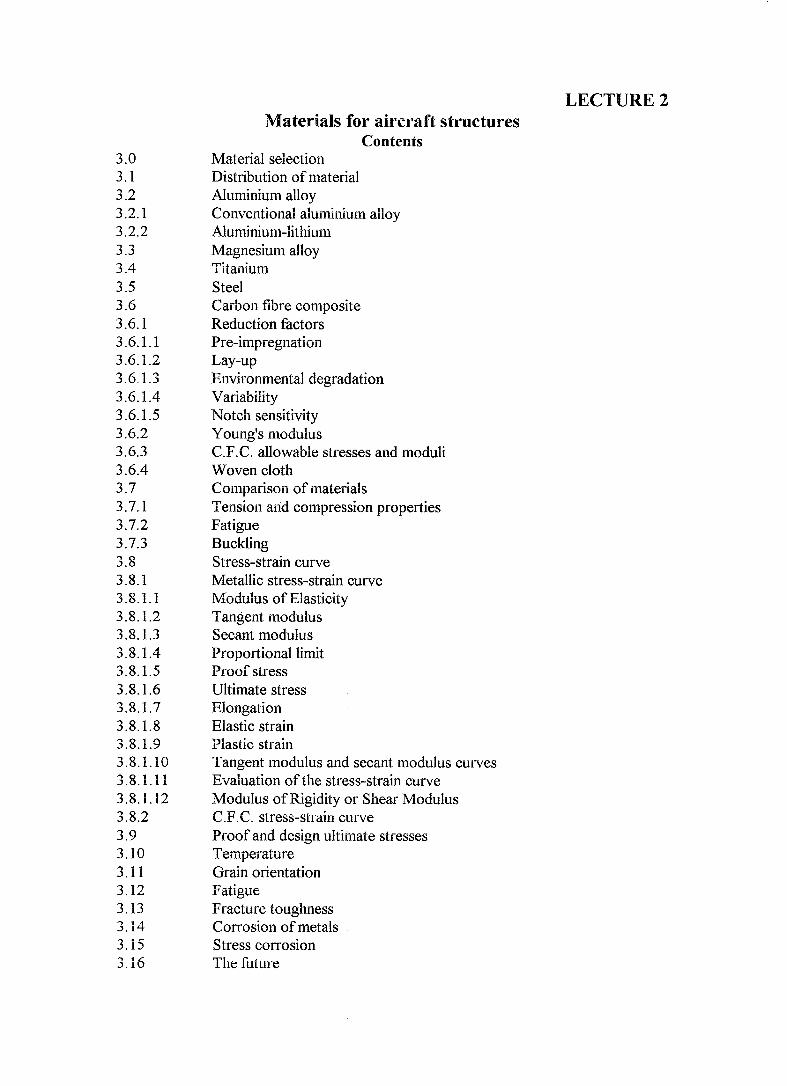
Idealisation of Compression Panel
FIGURE 3/5
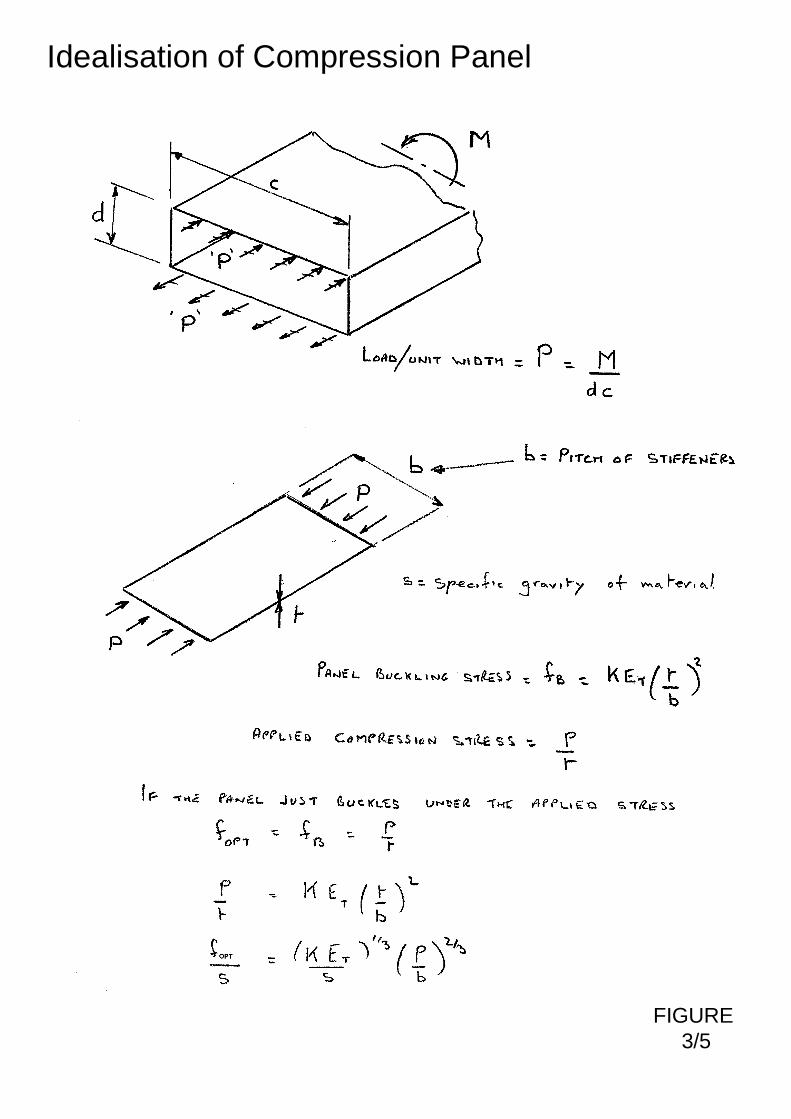
Comparison of Buckling Index
FIGURE 3/6

FIGURE 3/7
Stress - Strain Curve

FIGURE 3/8
Stress - Strain Curve - Clad Material

FIGURE 3/9
Stress - Strain Curve - ET / E and ES /E

Aluminium Alloy - f - ET / E Curves
FIGURE 3/9A

FIGURE 3/10
70% & 85% Young’s Modulus Secant Lines

Exponent n for Ramberg - Osgood
FIGURE 3/11
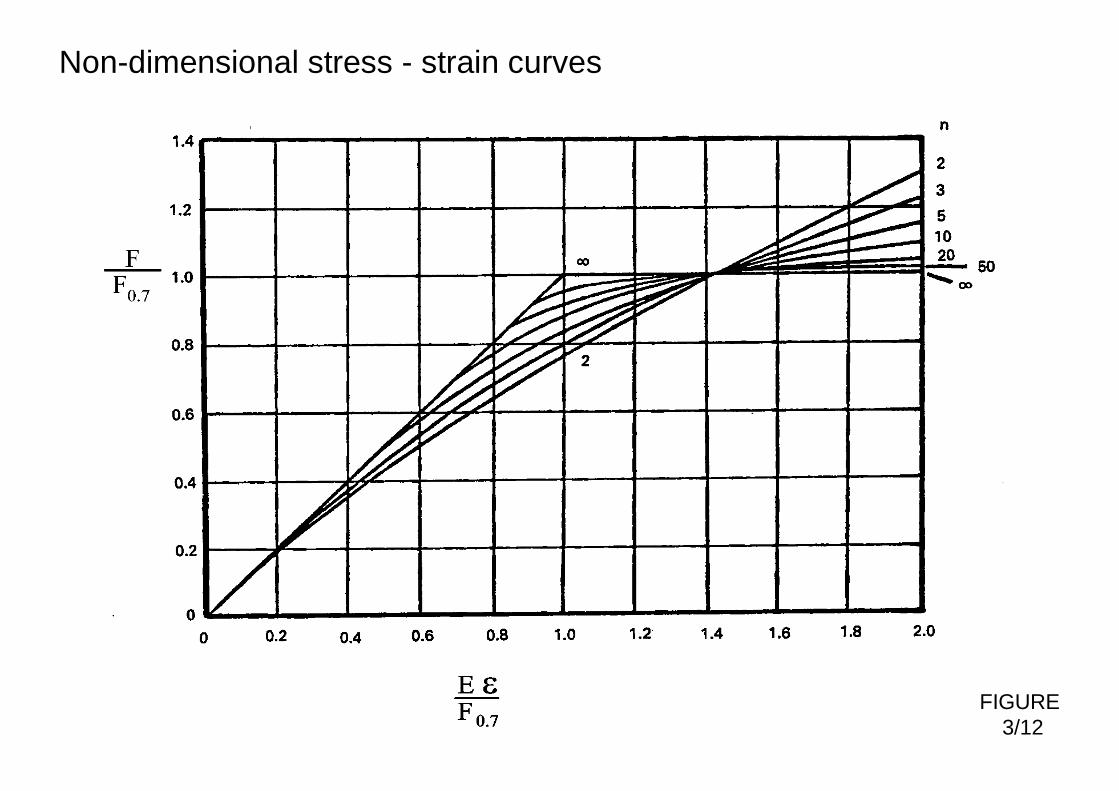
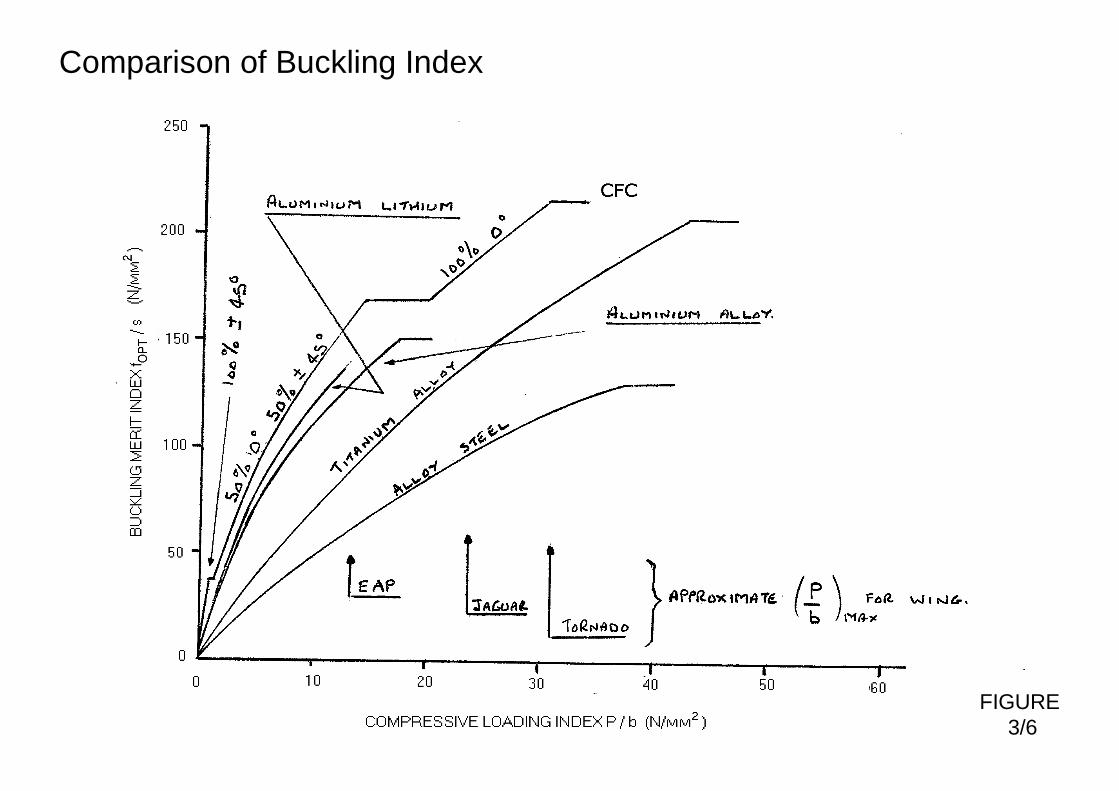
Non-dimensional stress - strain curves
FIGURE 3/12

Non-dimensional tangent modulus
FIGURE 3/13

Shear Modulus
FIGURE 3/13A

Comparison of Stress - Strain curves
FIGURE 3/14

Grain Flow Direction
FIGURE 3/15

Typical Fatigue Data
FIGURE 3/16
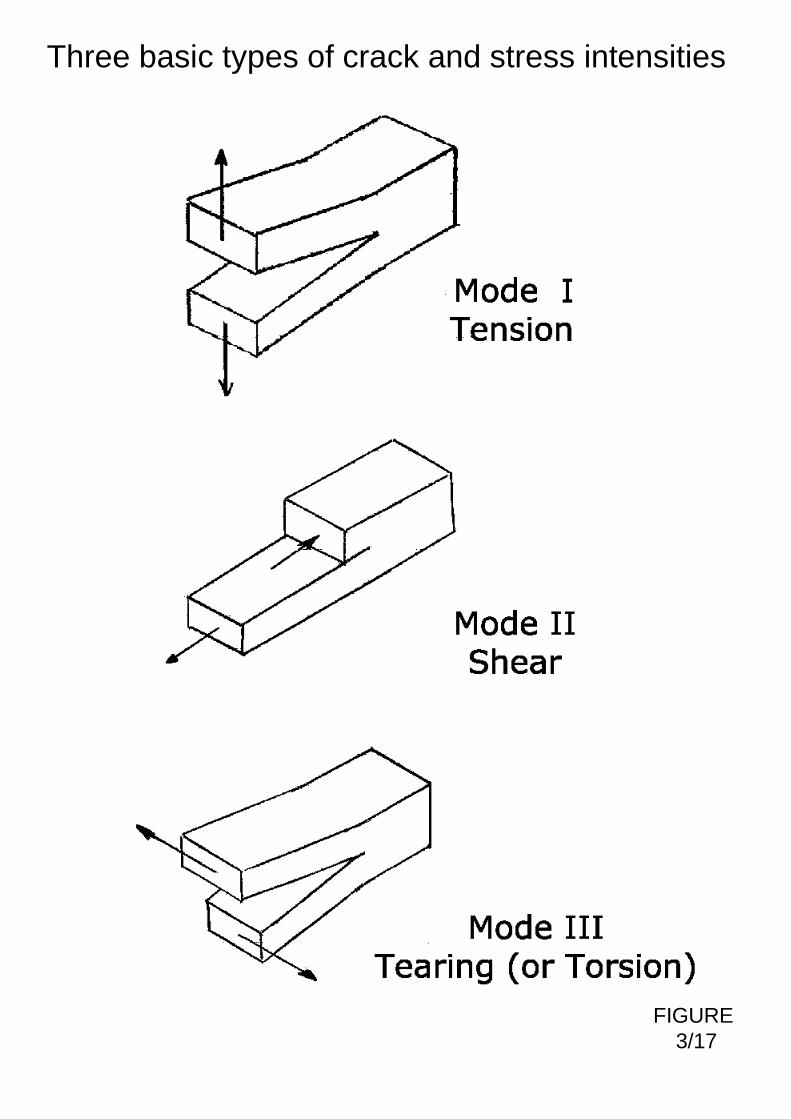
Three basic types of crack and stress intensities
FIGURE 3/17

Crack Intensity at Crack Tip
FIGURE 3/18

Fracture Toughness Orientation Specimens
FIGURE 3/19

FIGURE 3/20
Stress corrosion data on short transverse specimens exposed to industrial environments

FIGURE 3/21
Effect of Grain Direction on Stress - Corrosion Cracking

Distribution of Structural Material
Table3/1
MATERIAL Hawk T.Mk.1 T-45 Goshawk JAGUAR SEA HARRIER (I) HARRIER GR7 (II) TORNADO EAP EF2000
ALUMINIUM ALLOY 86 69 80 66 41 71 58.8 40
STEEL 9 22 12 10 11 6.4 3.9 2
TITANIUM 2 2 2 8 7 17.5 10.5 12
CFC 0 1 0 0 25 0 19.7 37
MISCELLANEOUS 3 6 6 17 16 5.1 7.1 9
DISTRIBUTION OF STRUCTURAL MATERIAL BY AIRCRAFT (%)

Comparison of Material Basic Properties at Room Temperature
Table3/2
Specific Tension Stress = Ultimate Tension StressSpecific Gravity
Specific Modulus = Young’s ModulusSpecific Gravity
ULTIMATE TENSION
STRESS N/mm2
YOUNG’S
MODULUS N/mm2SPECIFIC GRAVITY
SPECIFIC TENSION
STRESS N/mm2
SPECIFIC
MODULUS N/mm2
IM7 5379 276,000 1.77 3039 155,932
T300 3550 230,000 1.75 2029 131,429
XAS 3550 235,000 1.81 1960 129,800
STEEL S99 1230 200,000 7.833 157 25,530
ALUMINIUM ALLOY 7075 500 72,000 2.796 179 25,750
TITANIUM ALLOY TA 10 920 113,000 4.512 203 25,000
MATERIAL
CFC (Fibre Only)

Ratio of f 0.2 / f UTS for Metallic Materials
Table3/3
MATERIAL ALLOWABLESf 0.2 f UTS
L72 245 385 0.64 Al Cu sheet
L73 340 415 0.82 Al Cu sheet
2014 - T6 350 440 0.80 Al Cu sheet
7475 - T762 405 460 0.88 Al Zn sheet
2014 - T651 370 430 0.86 Al Cu Plate >80mm
7010 - T651 430 490 0.88 Al Cu Plate >120mm
A357 - T61 270 330 0.82 Designated area, Al casting
A357 - T61 240 305 0.79 Non-designated area, Al casting
8090 - T6/T62 300 410 0.73 Al Li sheet
6A1- 4V 870 920 0.95 Titanium alloy
S99 1050 1230 0.85 Steel
f 0.2 / f UTS REMARKSMATERIAL

Comparison of Mechanical Properties of Metal Matrix Compositeswith Current Alloys at Room Temperature
Table3/4
ULTIMATE TENSION STRESS
YOUNG’S MODULUS
SPECIFIC GRAVITY
SPECIFIC TENSION STRESS
SPECIFIC MODULUS
Al. ALLOY PLATE 2014 460 69,000 2.80 164 24,640
Si C PARTICULATE REINFORCED 2014 Al.ALLOY 30% VOL.
640 114,000 2.90 221 39,310
TITANIUM ALLOY 6A1-4V 920 113,000 4.51 203 25,000
Si C CONTINUOUS FIBRE REINFORCED 6A1-4V Ti 40% VOL.
904 195,000 4.05 223 48,150
N / mm2 N / mm2
MATERIAL