
Matanuska-Susitna Stormwater Assessment
77
Matanuska-Susitna Stormwater Assessment Jeffrey C. Davis and Gay A. Davis The Aquatic Restoration and Research Institute P.O. Box 923, Talkeetna AK, 99676 [email protected] 907.733.5432 April 2012
Transcript of Matanuska-Susitna Stormwater Assessment
Matanuska-Susitna Stormwater Assessment
Jeffrey C. Davis and Gay A. Davis
The Aquatic Restoration and Research Institute P.O. Box 923, Talkeetna AK, 99676
[email protected] 907.733.5432 April 2012

ARRI 11/11/2012 Mat-Su Stormwater Assessment
Acknowledgements: This project was conducted with support from the Alaska Clean Waters Action Plan, the National Fish Habitat Action Plan, Mat-Su Salmon Partnership, NOAA through the Alaska Sustainable Salmon Fund, and the Kenai Watershed Forum, Mat-Su wetland assessment project. A large portion of the field data collection and laboratory work was conducted by Leslie Jensen, Erin Miller, and Hannah Ramage.
ARRI 11/11/2012 Mat-Su Stormwater Assessment
3
Summary
Stream water physical and chemical characteristics and the biotic community were sampled from three streams in the Matanuska-Susitna (Mat-Su) Borough to assess potential impacts due to urban development and stormwater runoff. Sampling was conducted in Wasilla Creek, Cottonwood Creek, and Meadow Creek. Water samples were collected during spring runoff, summer base flow, and during two fall storm events. Water samples were analyzed for turbidity, specific conductivity, dissolved oxygen, pH; ammonia-N, nitrate + nitrite nitrogen, total and total dissolved phosphorus, dissolved organic carbon, settleable solids, total cadmium, copper, lead, and zinc. Alkalinity and hardness was measured at the farthest downstream site on each sampling date. Total aromatic and polycyclic aromatic hydrocarbons were measured at one site in each stream closest to the Parks Highway. Discharge was measured on each sampling date and discharge pressure rating curves were used to estimate daily discharge from water level/temperature loggers placed at the upper and lower sampling site in each stream. Water and sediment samples were collected from three outfalls during one of the fall storms. Macroinvertebrates were sampled from each site in the spring and juvenile and resident fish in July and September. Qualitative habitat assessments were conducted and sediment size distribution measured at each sampling site. Measures of impervious surface area and percent wetlands within the drainages were obtained from previous studies and used to evaluate relationships between water chemistry, biotic communities, and land use. An increase in total impervious surface area caused a decrease in specific conductivity during storm events and an increase in pH during spring runoff. Whereas, an increase in the percent of wetlands was associated with a decrease in pH during spring runoff. During the largest storm event, pH decreased, but the amount of decline relative to base flow conditions, was reduced by upstream wetlands. Turbidity increased during spring runoff and storm events but changes were not related to impervious surface area. Changes in turbidity were lower in the Cottonwood Creek and Meadow Creek drainages and were negatively correlated with the percentage of lake and kettle wetlands upstream. Concentrations of copper, lead, and zinc increased during storm events but remained below acute and chronic state water quality criteria. Imperviousness was correlated with increases in metals, but changes in metals during spring runoff and storms were not as great when lakes and kettle wetlands were present. Concentrations of metals in outfall discharges were much higher than in receiving waters and metals in sediments below discharge points exceeded the tolerance level of aquatic biota. Changes in nitrate + nitrite-N and total phosphorus concentrations during storms were negatively correlated with impervious surface areas. Wetland abundance was related to in an increase in ammonia-N and dissolved phosphorus. Dissolved organic carbon was much higher than base flow concentrations during spring runoff and the first storm event, but with little change during the second storm. Dissolved carbon increases were high in Meadow Creek and Cottonwood Creek, despite differences in the percent wetlands in these two drainages. Total salmonid catch per unit trap decreased with an increase in percent impervious surface area; however, differences also could be attributed to physical habitat conditions. Macroinvertebrate metrics scores have declined in Cottonwood Creek but there are no significant correlations between impervious surface area and macroinvertebrate metric scores.

ARRI 11/11/2012 Mat-Su Stormwater Assessment
4
Introduction
During storm events, sediments, oils and grease, salts, and metals are washed from parking areas, roads, yards, and fields into drainage ditches or storm drains that discharge into surface streams. These pollutants can reach concentrations in streams and rivers that can result in health problems from drinking or recreational exposure. Fine sediments flushed into streams can dominate stream beds blocking the flow of oxygen to developing salmon eggs, clog the gills of rearing juvenile salmon or resident fish, disrupt visual feeding activity, and eliminate the living space for aquatic insects. Pollutants can be toxic to fish and aquatic insects particularly during early incubation. Toxins can indirectly affect aquatic organisms by binding with oxygen or increasing the susceptibility to other diseases. Pollutants can alter the odor of streams affecting the ability of migrating salmon to locate spawning areas. The delivery of pollutants to receiving waters and the effect of stormwater on stream hydrology is controlled by the amount of water flowing on the surface compared to water that is filtered through the ground or vegetation. Water flows quickly off of compacted surfaces (i.e. roads, roofs, and parking areas) that are impervious to water flow (Paul and Meyer 2001). Tractive force, or the ability of water to suspend and transport sediments and other pollutants, increase with water velocity and depth. Alternatively, vegetation intercepts rainfall, decreasing the energy prior to reaching the ground, slows down surface flows, breaks apart soils and provides a pathway along roots into the soil. In addition, physically slowing down the delivery of pollutants, soil microbes and plants can metabolize or breakdown toxic chemicals. Diversion of storm water into the soil slows down the rate of delivery to surface streams and ameliorates flood flows. The effects of impervious surfaces to storm flow and the organisms in streams and rivers have been well documented. Common constituents of stormwater pollution include suspended sediments, nitrogen and phosphorus, pH, metals (Cu, Pb, Zn, Cd, Cr), polycyclic aromatic hydrocarbons, and fecal coliform bacteria (Al Bakri et al. 2008, Erikson et al. 2007, Brown and Peake 2006, Han 2006). The concentration and constituents in stormwater varies with land use within the drainage and often increase with impervious surface area and storm events (Mallin et al. 2009). Metals and hydrocarbons often are associated with precipitation events that collect road deposits and particles in the air from combustion of fossil fuels (Hwang and Foster 2005, Hoffman et al. 1985). Biotic indices using fish and aquatic invertebrates have been shown to be an important component of stormwater assessment projects (Walsh 2007, Gresens 2007). The Mat-Su Borough and core areas of Palmer and Wasilla have been the fastest growing regions in Alaska and among the fastest in the nation. As development increases, the concern for stormwater runoff pollution increases. Development within Wasilla is adjacent to Wasilla, Cottonwood, and Little Meadow Creeks. Cottonwood Creek, once a premier rainbow trout fishery, still supports coho salmon, sockeye salmon, and resident rainbow trout. Cottonwood Creek and Wasilla Lake also are important areas for water related recreation. Cottonwood Creek is currently listed by DEC as a Category 5, Impaired Waterbody for fecal coliform bacteria. Sources of fecal coliform microbial contamination in Cottonwood Creek have been linked to

ARRI 11/11/2012 Mat-Su Stormwater Assessment
5
surface flows during storm events (Davis and Davis 2010). Stormwater sampling conducted more than 20 years ago detected hydrocarbons and metals in stormwater discharging into Wasilla Lake (DEC 1990). However, since that time water sampling has not been conducted to assess potential hydrocarbon and metal pollution of Cottonwood Creek. Biotic assessment of water quality documented a decrease in water quality from 1998 to 2005 (Davis et al. 2006). Wasilla Creek and Little Meadow Creek have both been identified as high priority waters by the Alaska Clean Waters Action policy ranking for the assessment of potential water quality impacts (DEC 2010). Human settlement of the Palmer-Wasilla area and the Wasilla Creek drainage began with federal experimental farms in the 1930’s. Housing development was accelerated further with construction of the George Parks Highway in the early 1970’s. Wasilla Creek water quality was investigated in 2001 (Davis and Muhlberg 2002). At that time, most of the land use in the Wasilla Creek drainage was agriculture based. Water quality sampling showed an increase in nitrogen concentrations downstream, which may have been related to livestock grazing, and a decrease in pollution intolerant invertebrates. However, the number of housing subdivisions and commercial development are rapidly increasing within the drainage. In addition, four main roads linking Palmer and Wasilla cross Wasilla Creek. Little Meadow Creek is located north of Wasilla and residential development within the Meadow Lakes area has been increasing over recent years. Storm runoff from the commercial district of Wasilla discharges to Lucile Lake. Lucile Creek, the outlet stream from Lucile Lake, is a tributary to Little Meadow Creek. Little Meadow Creek supports a popular coho and sockeye salmon fishery. Little Meadow Creek flows into Big Lake, which is an important recreational area in the region for boating and fishing. Big Lake has been listed as a Category 5 Impaired Waterbody due to hydrocarbon pollution from boat use. Recent work has been done to document physical habitat conditions (Curran and Rice 2009); however, water quality sampling for common stormwater pollutants has not been conducted. Stormwater runoff can have significant and adverse effects to water quality and fish habitat and is related to the degree of impervious surfaces that occur with urban and rural development. Development is increasing in the Wasilla area surrounding streams that support important fisheries and recreation. However, little information is available regarding the concentration of common stormwater pollutants in streams draining the Palmer-Wasilla core area. This project was conducted to test for differences in water quality relative to urban development within the Wasilla, Cottonwood, and Little Meadow Creek drainages and to investigate the influence of urban development and stormwater runoff on water quality and the biotic community.
Methods
The assessment of water quality following stormwater runoff was evaluated in three urban streams: Wasilla Creek, Cottonwood Creek, and Meadow Creek. Water samples were collected at multiple locations that vary in the degree and type of upstream development. Samples were collected following spring runoff (April 26, 2011) and base-flow conditions (June 21, 2011), and following two storms events (August 1 and August 17, 2011). Samples were analyzed for metals, nutrients, settleable solids, and other pollutants common in stormwater runoff.
ARRI 11/11/2012 Mat-Su Stormwater Assessment
6
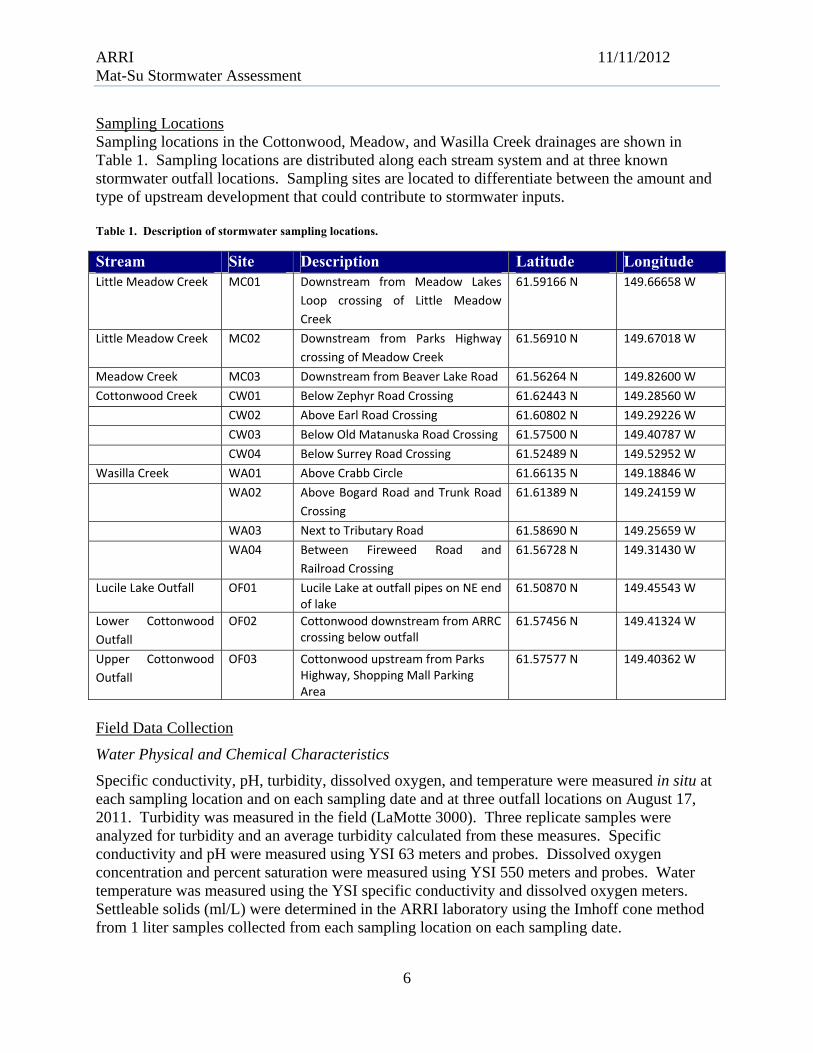
Sampling Locations Sampling locations in the Cottonwood, Meadow, and Wasilla Creek drainages are shown in Table 1. Sampling locations are distributed along each stream system and at three known stormwater outfall locations. Sampling sites are located to differentiate between the amount and type of upstream development that could contribute to stormwater inputs. Table 1. Description of stormwater sampling locations.
Stream Site Description Latitude Longitude Little Meadow Creek MC01 Downstream from Meadow Lakes
Loop crossing of Little Meadow
Creek
61.59166 N 149.66658 W
Little Meadow Creek
MC02 Downstream from Parks Highway
crossing of Meadow Creek
61.56910 N 149.67018 W
Meadow Creek MC03 Downstream from Beaver Lake Road 61.56264 N 149.82600 W
Cottonwood Creek CW01 Below Zephyr Road Crossing 61.62443 N 149.28560 W
CW02 Above Earl Road Crossing 61.60802 N 149.29226 W
CW03 Below Old Matanuska Road Crossing 61.57500 N 149.40787 W
CW04 Below Surrey Road Crossing 61.52489 N 149.52952 W
Wasilla Creek WA01 Above Crabb Circle 61.66135 N 149.18846 W
WA02 Above Bogard Road and Trunk Road
Crossing
61.61389 N 149.24159 W
WA03 Next to Tributary Road 61.58690 N 149.25659 W
WA04 Between Fireweed Road and
Railroad Crossing
61.56728 N 149.31430 W
Lucile Lake Outfall OF01 Lucile Lake at outfall pipes on NE end of lake
61.50870 N 149.45543 W
Lower Cottonwood
Outfall
OF02 Cottonwood downstream from ARRC crossing below outfall
61.57456 N 149.41324 W
Upper Cottonwood
Outfall
OF03 Cottonwood upstream from ParksHighway, Shopping Mall Parking Area
61.57577 N 149.40362 W
Field Data Collection
Water Physical and Chemical Characteristics
Specific conductivity, pH, turbidity, dissolved oxygen, and temperature were measured in situ at each sampling location and on each sampling date and at three outfall locations on August 17, 2011. Turbidity was measured in the field (LaMotte 3000). Three replicate samples were analyzed for turbidity and an average turbidity calculated from these measures. Specific conductivity and pH were measured using YSI 63 meters and probes. Dissolved oxygen concentration and percent saturation were measured using YSI 550 meters and probes. Water temperature was measured using the YSI specific conductivity and dissolved oxygen meters. Settleable solids (ml/L) were determined in the ARRI laboratory using the Imhoff cone method from 1 liter samples collected from each sampling location on each sampling date.

ARRI 11/11/2012 Mat-Su Stormwater Assessment
7
Discharge was measured using a Swoffer 3000 velocity meter. Discharge was measured at the upper and lowest sampling stations on all sampling dates, and at all sampling stations on June 21 and August 1, 2011. Water level (Onset Corp.) loggers were installed at the upper and lowest sampling location on each stream. The loggers recorded pressure (atmospheric and water) and temperature every 30 minutes. Stream water pressure was obtained by subtracting atmospheric pressure recorded at the ARRI laboratory. Mean daily pressure was calculated from values collected every 30 minutes. Regression was used to determine the relationship between water pressure and discharge and used to calculate daily discharge values. Daily precipitation was measured using rain gauges (Oregon Scientific Model RGR126). Rain gauges were installed on July 20 at the Palmer-Wasilla Highway near Cottonwood Lake in the Wasilla Creek drainage, the DEC Wasilla office on Bogard Road on the north shore of Wasilla Lake in the Cottonwood Creek drainage, and Vine Road near Lucile Creek in the Meadow Creek drainage. The concentration of cadmium, copper, lead, and zinc were determined from water samples collected from all sampling locations on all sampling dates in plastic containers (250 ml), acidified with nitric acid (below pH 2), and placed in a cooler to maintain sample temperature below 4°C. Metal concentrations were also determined from water and sediment samples collected at three outfall locations on August 17, 2011. Water samples (250 ml) for hardness and alkalinity were collected from the farthest downstream sampling location in each stream on each sampling date and placed within a cooler and shipped to AM Test for analyses. Dissolved organic carbon, ammonia-N, nitrate and nitrite-N, total phosphorus, and total dissolved phosphorus concentrations were determined from samples collected in two 250 ml plastic bottles, one bottle was preserved with sulfuric acid, and both bottles will be placed in a cooler with frozen gel-paks and kept at < 6°C. Total aromatic hydrocarbons (TAH) as the sum of benzene, toluene, ethyl-benzene, and xylene and PAH (polycyclic aromatic hydrocarbons) were determined from the analyses of water samples collected at one sampling location on each sampling date. On all three streams, these sites are located downstream from the Parks Highway (WA04, CW03, and MC02). TAH and PAH were also determined from water and sediment samples collected at three outfall locations on August 17, 2011. Water samples for TAH were preserved with HCL and held at temperatures < 6°C. Water samples were shipped overnight by FedEx to AM Test Incorporated in Kirkland, Washington, for chemical analyses. Macroinvertebrates
Macroinvertebrates were sampled within each sampling reach on June 1, 2011, using the Alaska Stream Condition Index (ASCI) methodology (Major et al. 2001). Twenty benthic samples were collected in a “D Net” (350 micron mesh). All available habitats were sampled (i.e. streambed, large woody debris, macrophytes) relative to their occurrence. The net was placed downstream from the habitat to be sampled and aquatic insects dislodged from the substrate by rubbing the surface. Dislodged insects were transported by stream flow into the net. The cod-end of the sampling net was removed and the insects rinsed into a 5 gallon bucket. This process was repeated until all twenty samples were collected. The sample was elutriated by stirring the bucket to separate macroinvertebrates from the inorganic substrate, transferred to a 500 ml

ARRI 11/11/2012 Mat-Su Stormwater Assessment
8
nalgene bottle and preserved with 80% alcohol. The sample bottles were labeled to indicate sample date, location, field samplers. Laboratory processing included sub-sampling, sorting, and species identification. A subsample of 350 invertebrates was collected from each sample. The total sample was subdivided into 12 equal sub-sections. A sub-section was selected randomly and all invertebrates within the sub-section were counted and rough sorted. Sub-sampling continued until all organisms from a sub-section result in 350 or more invertebrates being selected for identification. Invertebrates were identified to species level where possible. Macroinvertebrate metrics, richness, and diversity were calculated to determine the ASCI scores and Cook Inlet Biological Assessment Index (CIBI) scores (Rinella and Bogan 2007) for each site. Individual metrics, as well as ASCI and Cook Inlet Biological Assessment Index scores, will be used in regression analyses. ASCI metrics include Trichoptera taxa; percent Ephemeroptera, Plecoptera, and Trichoptera; percent Diptera, percent collectors, Hilsenhoff Biotic Index, and percent scrapers and predators. Cook Inlet Biological Assessment Index metrics include number of Ephemeroptera, Plecoptera, and Trichoptera taxa; number of Ephemeroptera taxa; Shannon’s diversity; percent Ephemeroptera; percent non-insects; and percent scrapers. Macroinvertebrate ASCI and CIBI scores were compared with previously collected samples. Macroinvertebrates were collected at the downstream Wasilla Creek sampling location (WA04) in May 1998, and at all four sampling locations in June 2000 (Major et al. 2001) and September 2001 (Davis and Muhlberg 2002). A CIBI score for June 2001 at WA04 is published in Rinella and Bogan (2007). Three of the Cottonwood Creek sites were sampled in May 1998 and June 2000 (CW02, CW03, and CW04, Major et al. 2001) and in September 2005 (CW01, CW03, and CW04; Davis et al. 2006). Rinella and Bogan (2007) provide a June 2001 CIBI score for CW04. The Meadow Creek sampling locations below the Parks Highway (MC02) and near Beaver Lake Road (MC03) were sampled in May 1998 and June 2000 (Major et al. 2001) and June 2001 (CIBI score only, Rinella and Bogan 2007). Juvenile Salmonids
Juvenile salmon and resident fish were sampled using baited minnow traps within the same sampling reaches as delineated for macroinvertebrates. Fish sampling was conducted on July 20 through July 27 and September 15 through September 22. Twenty minnow traps (1/4 inch mesh, 1 inch opening) were used within each sampling reach. Minnow traps were baited with salmon roe placed inside perforated whirl-pak bags suspended from the top of the trap. Traps are placed in eddies or pools at water depths cover the entire trap and under cover provided by overhanging banks or woody debris. The traps were left in place for 20 to 24 hours. All fish within each trap were identified to species. All salmonids are measured to fork length and the first 50 salmonids were weighed. All captured fish were released on site after being measured. Growth rates were calculated from the differences in the mode of the length-frequency distribution for age-0 fish between July and September samples divided by days between sampling. Instantaneous growth was calculated as the difference in the log of fork length divided by days between sampling. Average catch per trap for total salmonids, salmonid species, and ratios of anadromous to resident fish were calculated and used along with growth rates as dependent variables in correlation and regression analyses.

ARRI 11/11/2012 Mat-Su Stormwater Assessment
9
Habitat Assessment and Bed Sediments
Habitat assessment and substrate size distribution were determined at each sampling location. Habitat assessments were conducted using the ASCI qualitative assessment methodology (Major et al. 1999). This methodology ranks physical habitat characteristics including substrate, velocity-depth combinations, channel alteration, channel sinuosity, bank stability, and riparian vegetation. The habitat assessment score is calculated as the mean of the scores for the individual physical habitat characteristics. Sediment sampling was conducted using Wolman pebble counts as modified by Bevenger and King (1995). Sediment size distribution was determined through the measurement of the diameter of 100 randomly selected particles within each sampling reach. The investigator walks up the channel diagonally from bank to bank. Every second step a particle of substrate was collected from under the toe of the right foot. The median diameter of this particle was measured with a gravelometer and recorded. Land Use Indices
The percent of impervious surface area, and percent wetland were used as indicators of land use above sampling stations. Percent impervious surface area was obtained from analyses conducted by The Nature Conservancy using satellite data from 2008 (Geist and Smith 2011). The GIS data products were used to calculate the percent impervious surface area upstream of each sampling station and within ½ mile of the stream drainage. Geist and Smith (2011) provide impervious surface coverage in three categories, low, medium, and high. High imperviousness includes large contiguous areas of highways, buildings, parking lots, and compacted soils in gravel pits. Medium level of imperviousness include roads and large commercial and residential buildings. Low imperviousness is made up of smaller dirt and gravel roads, small buildings and houses, and some driveways. Percent impervious surface was calculated for the area between each sampling station and total cumulative upstream percent impervious for all three categories individually and cumulatively. The percent of wetland upstream from each sampling station was calculated from wetland maps by geomorphic classification type (Gracz 2011). Wetland surveys in these watersheds were conducted in 2009 and 2010. We used ArcView attributes tables and wetland maps to sum up the area of wetland by wetland type upstream of each sampling station and total upstream watershed area. Percent wetland between sampling sites and cumulative percent upstream wetland by wetland type, total wetland, and non-lake wetlands were calculated and used in the analyses. Data Analyses
The concentrations of water quality parameters were compared with Alaska Water Quality Standards (DEC 2006) and the Water Quality Criteria Manual for Toxic and other Deleterious Organic and Inorganic Substances (DEC 2003). Water quality criteria for metals are based upon dissolved concentrations. Total recoverable criteria are listed and a conversion factor is used to calculate dissolved criteria. Criteria for metals also are hardness dependent. As an initial screening, we report total recoverable metal concentrations and compare these with the total recoverable criteria. Criteria for freshwater sediments are based upon NOAA reference tables (SQuiRTs) (Buchman 2008). Toxic concentrations in the SQuiRTs are derived from evaluating biological effects. Concentrations causing a biological resonse are categorized as threshold

ARRI 11/11/2012 Mat-Su Stormwater Assessment
10
effects levels (TEL) and probable effects levels (PEL). TELs are the concentration below which biological effects rarely occur, and PELs are the concentration above which biological effects are likely to occur.
Correlation and simple linear regression were used to test for significant relationships land use indices and water quality changes between base flow and spring runoff and storm runoff. We tested for relationships with impervious surface areas between sites, and cumulative impervious surfaces and with the increase or decrease in a water quality parameter relative to summer base-flow concentrations. We tested for relationships between percent wetland by wetland category, total wetland, and non-lake wetlands and changes in water quality. Correlation and regression also was used to test for relationships between impervious surfaces, wetlands, and biotic metrics. An alpha of 0.05 was used for all comparisons.
Results
Stream Discharge and Precipitation
Water sampling was conducted during spring runoff on April 26, 2011; during summer base- flow conditions on June 21, 2011; and following precipitation events on August 1 and 17, 2011. During spring sampling, ice was still present within the stream channel at the sites farthest upstream on Wasilla Creek (WA01) and Little Meadow Creek (MC01). Ice cover prevented discharge measure during spring sampling at the upper Little Meadow Creek site, and the presence of anchor ice at the upper Wasilla Creek site likely affected the accuracy of early discharge measures. Stream discharge on sampling dates is shown in Figure 1. Water samples collected on June 21 on all three streams were obtained during the declining hydrograph following spring snowmelt and represented base flow conditions. Discharge during spring sampling on April 26 was 5 cfs higher than on June 21 in Cottonwood Creek, and 18 and 19 cfs higher in Wasilla and Meadow Creeks, respectively. Sampling on August 1 followed a small storm preceded by a period of up to 4 weeks with very little precipitation resulting in small increases in discharge at most sampling locations. On July 29, 0.4 inches of rain was recorded near Wasilla and Cottonwood Creeks, one day prior to the first stormwater sampling on August 1. Discharge on August 1 was slightly lower than on June 21 at all sites except for MC01 where discharge was the same, and MC02 where discharge was 4 cfs higher (Figure 1). In Wasilla Creek (WA04) discharge increased from 10.8 cfs on July 30 to 12 cfs on August 1. At the upper Cottonwood Creek site discharge increased from 6.9 cfs on July 30 to 7.5 cfs on August 1; however, at the lower Cottonwood Creek site (CW04) there was no measureable change in discharge during this storm. At Meadow Creek, discharge began to increase on August 1 and continued to increase until August 5. Sampling on August 17 was during by a large precipitation event. Three inches of rain had fallen during the 2 weeks before the storm causing an increase in stream flows over this same time. Over 1.1 inches (Cottonwood Creek) to 1.4 inches (Wasilla Creek) of rain was recorded on August 17. In Wasilla Creek, discharge was 15 to 18 cfs higher on August 1 compared to the base sampling date of June 21. Discharge in Wasilla Creek increased 1 cfs from August 16 to August 17, and 10 cfs from August 17 to August 18. Similarly, discharge in Little Meadow Creek increased by 2 cfs at the upper site, and 5 cfs at the lower Meadow Creek site from June 21 to August 17. Discharge at both sites continued to increase until August 20.

ARRI 11/11/2012 Mat-Su Stormwater Assessment
11
Figure 1. Point measures of stream discharge (left panel) and discharge estimates (right panel) for the Wasilla, Cottonwood, and Meadow Creek sampling locations.
Physical and Chemical Characteristics
Specific conductivity was generally lower in Wasilla Creek and more variable through the season (Figure 2). During spring runoff, specific conductivity was lower in Wasilla and Meadow Creeks however, in Cottonwood Creek there was little difference is specific conductivity during the spring with the exception of the lowest site, CW04 near Surrey Road (Figure 3). Following both storm events, specific conductivity increased in Wasilla Creek. However, in Cottonwood Creek and Meadow Creek, there was little difference between conductivity measured during base flow and following August storms. Specific conductivity in Meadow Creek was highest below the Parks Highway and the tributary from Herkimer and Blodgett Lakes. Similarly, specific conductivity in Cottonwood Creek was highest at site CW03, below the Parks Highway on most dates, but decreased at this location during the large August 17 storm.

ARRI 11/11/2012 Mat-Su Stormwater Assessment
12
Stream water pH was lower in Meadow Creek than Cottonwood and Wasilla Creeks and pH in all streams tended to be lower during spring runoff and during storm events. In Meadow Creek, pH during base flow averaged 7.5 among sites compared to 8.0 and 8.1 for Cottonwood and Wasilla Creeks, respectively. During base flow, pH in Wasilla Creek became more acidic between the lower 2 sites (WA03 and WA04) but there was little change in base-flow pH in the other two streams. Stream water pH ranged from 6.9 to 7.6 in Meadow Creek over all sampling dates, from 7.4 to 8.4 in Cottonwood Creek, and from 7.6 to 8.9 in Wasilla Creek. pH was generally lower in all streams during spring runoff and storm events. In Cottonwood Creek, pH was higher during spring runoff below the Parks Highway but lowest during the two storms. Similarly, pH in Meadow Creek increased at MC02, below the Parks Highway and tributary input during spring runoff, but became more acidic at this site during storms.
Figure 2. Specific conductivity (left panel) and pH (right panel) for the four sampling dates and sampling locations.

ARRI 11/11/2012 Mat-Su Stormwater Assessment
13
Dissolved oxygen and dissolved carbon are shown in Figure 3. Dissolved oxygen was at or above saturation in Wasilla Creek and Cottonwood Creek and the lower two Meadow Creek sites during base flow and was variable in Cottonwood and Meadow Creeks during spring runoff and storm events. Similar to observed changes in specific conductivity and pH, dissolved oxygen saturation increased during spring runoff and decreased during storms at CW03 and MC02. In Cottonwood Creek dissolved oxygen decreased only during the large August 17 storm, while in Meadow Creek the decrease in dissolved oxygen at MC02 occurred during both storm sampling events.
Figure 3. Percent saturation of dissolved oxygen (left) and dissolved organic carbon at sampling sites within the three streams during spring runoff, base flow, and two storm events.
Dissolved organic carbon (DOC) concentrations were similar in all three streams during base flow, were higher during spring runoff and the first storm event but did not increase during the second, larger, storm event. DOC was below 5 mg/L at all sites during base flow and during the second storm event. During spring runoff DOC increased up to 15 mg/L in Wasilla and Meadow Creeks, and up to 20 mg/L in the lower two Cottonwood Creek sites. During the first storm event DOC in Wasilla Creek increased consistently from 17 to 27 mg/L. DOC in Cottonwood

ARRI 11/11/2012 Mat-Su Stormwater Assessment
14
Creek increased to 26 mg/L at the upstream site and did not increase downstream. In Meadow Creek DOC increased to 17 mg/L at the upper site, then increased to 25 mg/L at MC02 and remained consistent downstream. The concentrations of nitrogen and phosphorus at sampling locations within the three streams are shown in Figures 4 and 5. Base flow concentrations of nitrogen and differences between base flow and storm event concentrations were not consistent among the three streams. In Wasilla Creek, ammonia-N was highest during spring flows with a maximum value of 0.19 mg/L at WA02, upstream of Bogard Road. A high value of 0.53 mg/L also was recorded during base flow at the lowest site, WA04, below the Parks Highway. Nitrate + nitrite-N concentrations in Wasilla Creek ranged from 0.3 to 0.6 mg/L. Highest concentrations occurred during spring sampling and lowest concentrations during the second, larger, storm event. In Cottonwood Creek ammonia-N concentrations were slightly higher during spring runoff and both storm events, with the largest increases at the upper CW01 site below Zephyr Road. Nitrate + nitrite concentrations at the upper Cottonwood Creek site were higher during spring runoff and both storms, but highest during the first storm event. Nitrate + nitrite-N concentrations during spring runoff and the two storm events decreased at CW03 and then increased at CW04. During base flow conditions, concentrations of nitrate + nitrite-N increased dramatically downstream from CW02 to CW03 and from CW03 to CW04. In Meadow Creek concentrations of ammonia and nitrate + nitrate-N increased at MC02 during storm events and spring runoff following a similar pattern observed form other water chemical and physical characteristics. For nitrate + nitrite-N concentrations in Meadow Creek were higher during base flow conditions, similar to what was observed at the lower two Cottonwood Creek sites. Concentrations of total and total dissolved phosphorus increased during storm events within all three streams. In Wasilla Creek total phosphorus concentrations were highest during spring runoff followed by the second, larger, storm event; however, concentrations also increased during the first storm relative to base-flow concentrations. Total dissolved phosphorus followed a similar pattern with highest concentrations in Wasilla Creek during spring runoff and the second storm event. In Cottonwood Creek, concentrations of total and total dissolved phosphorus increased during the large storm on August 17. Patterns of total and total dissolved phosphorus in Meadow Creek were similar to other measures with changes occurring at MC02, downstream from the Blodgett Lake tributary and the Parks Highway. Total phosphorus increased during the second storm, and total dissolved phosphorus during both storm events at this sampling site.

ARRI 11/11/2012 Mat-Su Stormwater Assessment
15
Figure 4. Ammonia and nitrate + nitrite nitrogen concentrations at sampling sites within the three streams during spring runoff, base flow, and two storm events.
ARRI 11/11/2012 Mat-Su Stormwater Assessment
16
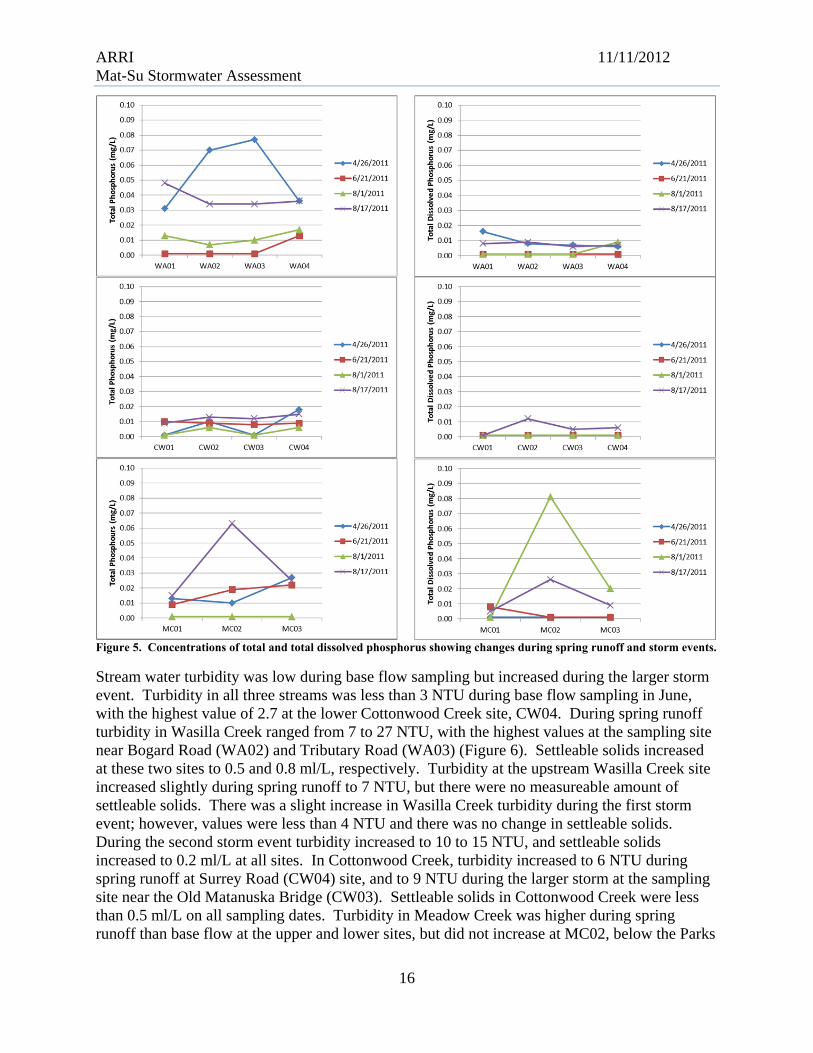
Figure 5. Concentrations of total and total dissolved phosphorus showing changes during spring runoff and storm events.
Stream water turbidity was low during base flow sampling but increased during the larger storm event. Turbidity in all three streams was less than 3 NTU during base flow sampling in June, with the highest value of 2.7 at the lower Cottonwood Creek site, CW04. During spring runoff turbidity in Wasilla Creek ranged from 7 to 27 NTU, with the highest values at the sampling site near Bogard Road (WA02) and Tributary Road (WA03) (Figure 6). Settleable solids increased at these two sites to 0.5 and 0.8 ml/L, respectively. Turbidity at the upstream Wasilla Creek site increased slightly during spring runoff to 7 NTU, but there were no measureable amount of settleable solids. There was a slight increase in Wasilla Creek turbidity during the first storm event; however, values were less than 4 NTU and there was no change in settleable solids. During the second storm event turbidity increased to 10 to 15 NTU, and settleable solids increased to 0.2 ml/L at all sites. In Cottonwood Creek, turbidity increased to 6 NTU during spring runoff at Surrey Road (CW04) site, and to 9 NTU during the larger storm at the sampling site near the Old Matanuska Bridge (CW03). Settleable solids in Cottonwood Creek were less than 0.5 ml/L on all sampling dates. Turbidity in Meadow Creek was higher during spring runoff than base flow at the upper and lower sites, but did not increase at MC02, below the Parks

ARRI 11/11/2012 Mat-Su Stormwater Assessment
17
Highway. However, during the two storm events, maximum Meadow Creek turbidity values were recorded at MC02. Settleable solids increased to 0.55 ml/L at MC02 during the first storm on August 1, which was the highest value recorded in this stream. Concentrations of copper, lead, and zinc were highest in Wasilla Creek and correlated with turbidity during storm events. Cadmium concentrations were below detection limits on all sampling dates and locations. Metal concentrations are shown in Figures 6 and 7. During base-flow sampling, copper concentrations were below 1 µg/L in all streams. During spring runoff concentrations increased to over 5 µg/L in Wasilla Creek, but remained less than 1 µg/L in Cottonwood and Meadow Creeks. Copper concentration in Wasilla Creek increased at WA03 (Tributary Road) during the first storm event, and all sites during the second. Copper increased at MC02 (Parks Highway) during both storms. Concentrations of copper increased at CW03 (Old Matanuska Road) only during the large storm event on August 17. Lead showed similar patterns in all three streams. Zinc was highest in Wasilla Creek at WA02 (Bogard Road) during the first storm event. Similarly, zinc increased in Cottonwood Creek during the first storm at the upper site, CW01. There were little differences in Meadow Creek zinc concentrations among sampling dates. Correlation coefficients were high between changes in turbidity during spring runoff and both storms and changes in copper concentrations (0.99 spring, 0.77 storm 1, and 0.97 storm 2). There were similar high correlation coefficients between changes in turbidity and lead and zinc, for spring runoff and the first storm event (0.99 and 0.97 for lead, and 0.89 and 0.64 for zinc). However, differences in turbidity during the first storm were not correlated with changes in lead or zinc (coefficients of 0.24 and 0.03, respectively). Concentrations of metals remained below WQS even during storm events. Stream water alkalinity and hardness are shown in Table 2. Alkalinity and hardness were lowest during spring runoff in Wasilla and Meadow Creeks, with little variability among sampling dates in Cottonwood Creek. The lowest seasonal hardness measured was near 65 mg/L CaCO3 for Wasilla and Meadow Creeks, and 94 mg/L CaCO3 for Cottonwood Creek. At these hardness levels total recoverable criteria for copper, lead, and zinc are 9, 46, and 80 µg/L, respectively, for Wasilla and Meadow Creeks, and 13, 76, and 112 µg/L for Cottonwood Creek, well above maximum stream concentrations. Stream water temperature characteristics are shown in Table 3. Water temperatures were warmest in Cottonwood Creek and coldest in Wasilla Creek. At the upper Cottonwood Creek site, temperatures often exceeded 20°C, whereas water temperatures exceeded 13°C once in Wasilla Creek. The daily range in water temperatures also was lowest in Wasilla Creek.

ARRI 11/11/2012 Mat-Su Stormwater Assessment
18
Figure 6. Stream water turbidity (left) and concentrations of copper in the three streams on all sampling dates showing the relationship between suspended sediment and copper concentrations.

ARRI 11/11/2012 Mat-Su Stormwater Assessment
19
Figure 7. Stream water lead (left) and zinc (right) concentrations on all four sampling dates for the three streams.
Table 2. Stream water alkalinity and hardness at the downstream sampling stations on each sampling date.
Alkalinity/Hardness (mg/L CaCO3) 4/26/11 6/21/11 8/1/11 8/17/11Wasilla Creek 48/64 86/90 90/110 82/87 Cottonwood Creek 90/110 100/110 96/100 84/87 Meadow Creek 48/66 80/86 76/100 70/83

ARRI 11/11/2012 Mat-Su Stormwater Assessment
20
Table 3. Water temperature characteristics at the upper and lower sampling site in each stream.
WA01 WA04 CW01 CW04 MC01 MC03
Start Date 6/2/2011 6/2/2011 5/26/2011 6/1/2011 5/27/2011 5/26/2011
End Date 10/6/2011 10/6/2011 10/6/2011 10/5/2011 9/30/2011 10/5/2011
Season Maximum 12.9 13.1 23.7 15.2 17.3 18.7
Max Daily Range 4.4 3.7 7.3 2.2 8.1 7.7
Total Days 120 120 127 121 127.0 127.0
Days Max>13 0.0 1.0 103.0 53.0 61.0 75.0
Percent of Total 0.0 0.8 81.1 43.8 48.0 59.1
Days Max>15 0.0 0.0 93.0 2.0 12.0 46.0
Percent of Total 0.0 0.0 73.2 1.7 9.4 36.2
Days Max>20 0.0 0.0 27.0 0.0 0.0 0.0
Percent of Total 0.0 0.0 21.3 0.0 0.0 0.0
June Degree Days 241 270 499 349 354 399
July Degree Days 305 319 561 419 399 454
August Degree Days 255 283 460 385 371 376
September Degree Days 181 197 299 275 256 254
Hydrocarbons were present in two samples. Polycyclic aromatic hydrocarbons concentrations were 1.11 µg/L in Cottonwood Creek during spring runoff at the sampling location below the Parks Highway and Wasilla Lake (CW03). A PAH concentration of 3.48 µg/L was measured in Meadow Creek during the first storm event at MC02. The more volatile aromatic hydrocarbons, benzene, toluene, ethyl-benzene, and xylene were below detection limits on all sampling dates. Outfall Sampling
The chemical and physical characteristics of the three outfalls and sediments in receiving waters are shown in Table 4. Stormwater pH at OF01 and OF02, discharging into Lake Lucile and Cottonwood Creek downstream from CW03 was more acidic than receiving waters. Stormwater pH from OF03 draining the commercial parking lot was slightly lower than in Cottonwood Creek. Specific conductivity in OF01 to Meadow Creek and OF03 draining the commercial parking lot, were very low and likely were diluting receiving waters. Turbidity in the outfall discharging into Lake Lucile and the lower Cottonwood Creek outfall were considerably higher than stream waters. The lowest outfall turbidity was 9.0 NTU discharging into Cottonwood Creek upstream from the Parks Highway. Turbidity in Cottonwood Creek was 2.3 NTU upstream and 8.5 NTU just downstream from this outfall. Ammonia nitrogen concentrations discharging from the outfall into Lake Lucile were similar to concentrations in Meadow Creek downstream from Lucile Creek. Nitrate + nitrite-N in OF01 and OF02 were well above Meadow Creek and Cottonwood Creek stream water concentrations on the same date. Total phosphorus in OF01 was higher, and total dissolved phosphorus was less than concentrations in Meadow Creek, while total and total dissolved phosphorus in OF02 draining into Cottonwood Creek was higher than stream water concentrations.
ARRI 11/11/2012 Mat-Su Stormwater Assessment
21
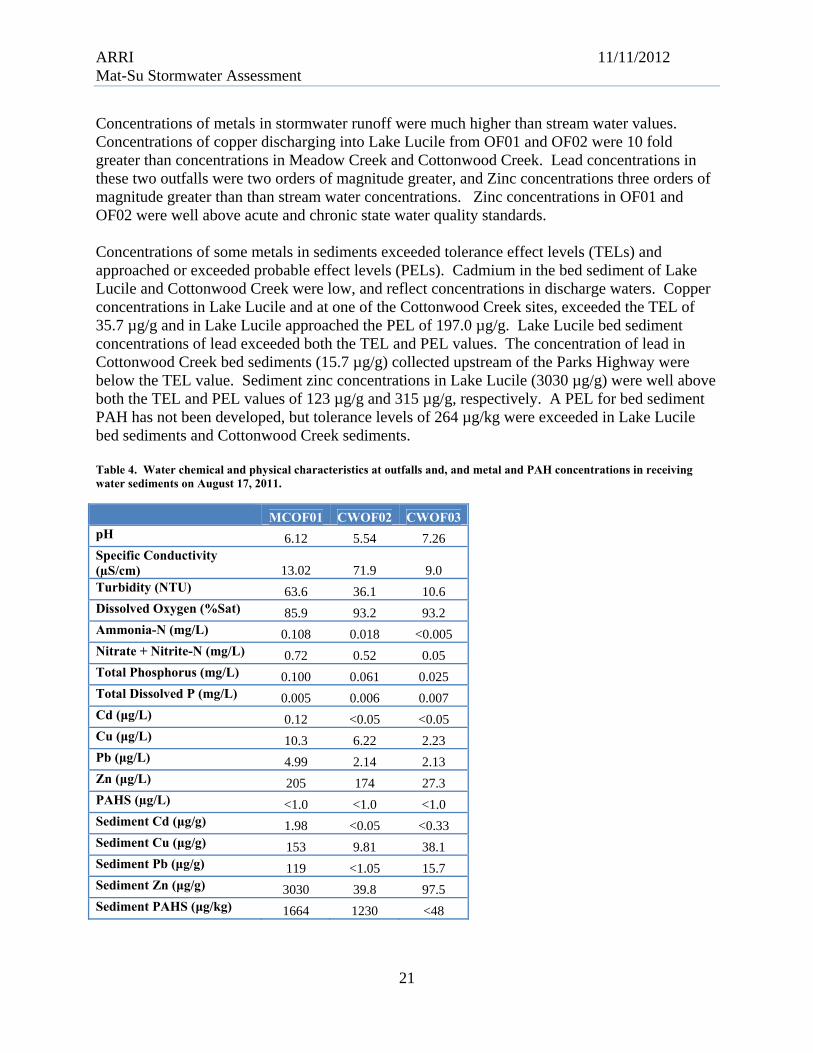
Concentrations of metals in stormwater runoff were much higher than stream water values. Concentrations of copper discharging into Lake Lucile from OF01 and OF02 were 10 fold greater than concentrations in Meadow Creek and Cottonwood Creek. Lead concentrations in these two outfalls were two orders of magnitude greater, and Zinc concentrations three orders of magnitude greater than than stream water concentrations. Zinc concentrations in OF01 and OF02 were well above acute and chronic state water quality standards. Concentrations of some metals in sediments exceeded tolerance effect levels (TELs) and approached or exceeded probable effect levels (PELs). Cadmium in the bed sediment of Lake Lucile and Cottonwood Creek were low, and reflect concentrations in discharge waters. Copper concentrations in Lake Lucile and at one of the Cottonwood Creek sites, exceeded the TEL of 35.7 µg/g and in Lake Lucile approached the PEL of 197.0 µg/g. Lake Lucile bed sediment concentrations of lead exceeded both the TEL and PEL values. The concentration of lead in Cottonwood Creek bed sediments (15.7 µg/g) collected upstream of the Parks Highway were below the TEL value. Sediment zinc concentrations in Lake Lucile (3030 µg/g) were well above both the TEL and PEL values of 123 µg/g and 315 µg/g, respectively. A PEL for bed sediment PAH has not been developed, but tolerance levels of 264 µg/kg were exceeded in Lake Lucile bed sediments and Cottonwood Creek sediments. Table 4. Water chemical and physical characteristics at outfalls and, and metal and PAH concentrations in receiving water sediments on August 17, 2011.
MCOF01 CWOF02 CWOF03pH 6.12 5.54 7.26 Specific Conductivity (µS/cm) 13.02 71.9 9.0 Turbidity (NTU) 63.6 36.1 10.6 Dissolved Oxygen (%Sat) 85.9 93.2 93.2 Ammonia-N (mg/L) 0.108 0.018 <0.005 Nitrate + Nitrite-N (mg/L) 0.72 0.52 0.05 Total Phosphorus (mg/L) 0.100 0.061 0.025 Total Dissolved P (mg/L) 0.005 0.006 0.007 Cd (μg/L) 0.12 <0.05 <0.05 Cu (μg/L) 10.3 6.22 2.23 Pb (μg/L) 4.99 2.14 2.13 Zn (μg/L) 205 174 27.3 PAHS (µg/L) <1.0 <1.0 <1.0 Sediment Cd (μg/g) 1.98 <0.05 <0.33 Sediment Cu (μg/g) 153 9.81 38.1 Sediment Pb (μg/g) 119 <1.05 15.7 Sediment Zn (μg/g) 3030 39.8 97.5 Sediment PAHS (μg/kg) 1664 1230 <48
ARRI 11/11/2012 Mat-Su Stormwater Assessment
22
Habitat Assessment and Sediment Size Distribution
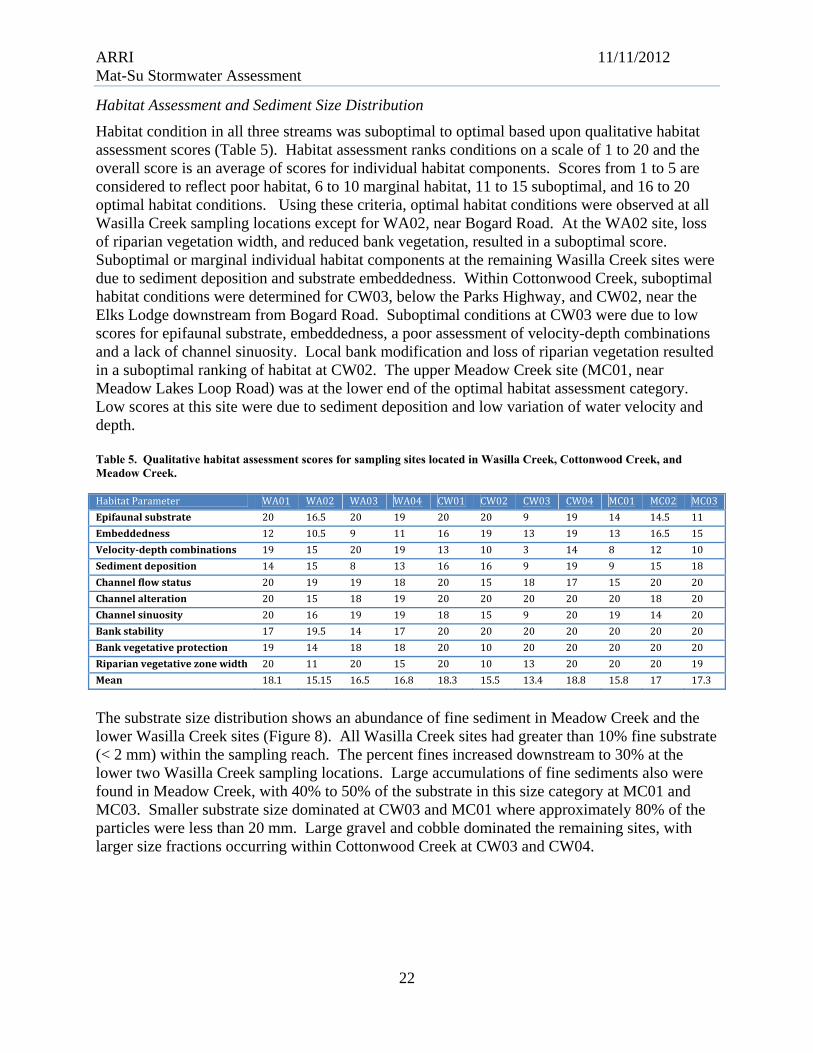
Habitat condition in all three streams was suboptimal to optimal based upon qualitative habitat assessment scores (Table 5). Habitat assessment ranks conditions on a scale of 1 to 20 and the overall score is an average of scores for individual habitat components. Scores from 1 to 5 are considered to reflect poor habitat, 6 to 10 marginal habitat, 11 to 15 suboptimal, and 16 to 20 optimal habitat conditions. Using these criteria, optimal habitat conditions were observed at all Wasilla Creek sampling locations except for WA02, near Bogard Road. At the WA02 site, loss of riparian vegetation width, and reduced bank vegetation, resulted in a suboptimal score. Suboptimal or marginal individual habitat components at the remaining Wasilla Creek sites were due to sediment deposition and substrate embeddedness. Within Cottonwood Creek, suboptimal habitat conditions were determined for CW03, below the Parks Highway, and CW02, near the Elks Lodge downstream from Bogard Road. Suboptimal conditions at CW03 were due to low scores for epifaunal substrate, embeddedness, a poor assessment of velocity-depth combinations and a lack of channel sinuosity. Local bank modification and loss of riparian vegetation resulted in a suboptimal ranking of habitat at CW02. The upper Meadow Creek site (MC01, near Meadow Lakes Loop Road) was at the lower end of the optimal habitat assessment category. Low scores at this site were due to sediment deposition and low variation of water velocity and depth. Table 5. Qualitative habitat assessment scores for sampling sites located in Wasilla Creek, Cottonwood Creek, and Meadow Creek.
The substrate size distribution shows an abundance of fine sediment in Meadow Creek and the lower Wasilla Creek sites (Figure 8). All Wasilla Creek sites had greater than 10% fine substrate (< 2 mm) within the sampling reach. The percent fines increased downstream to 30% at the lower two Wasilla Creek sampling locations. Large accumulations of fine sediments also were found in Meadow Creek, with 40% to 50% of the substrate in this size category at MC01 and MC03. Smaller substrate size dominated at CW03 and MC01 where approximately 80% of the particles were less than 20 mm. Large gravel and cobble dominated the remaining sites, with larger size fractions occurring within Cottonwood Creek at CW03 and CW04.
HabitatParameter WA01 WA02 WA03 WA04 CW01 CW02 CW03 CW04 MC01 MC02 MC03
Epifaunalsubstrate 20 16.5 20 19 20 20 9 19 14 14.5 11
Embeddedness 12 10.5 9 11 16 19 13 19 13 16.5 15
Velocity‐depthcombinations 19 15 20 19 13 10 3 14 8 12 10
Sedimentdeposition 14 15 8 13 16 16 9 19 9 15 18
Channelflowstatus 20 19 19 18 20 15 18 17 15 20 20
Channelalteration 20 15 18 19 20 20 20 20 20 18 20
Channelsinuosity 20 16 19 19 18 15 9 20 19 14 20
Bankstability 17 19.5 14 17 20 20 20 20 20 20 20
Bankvegetativeprotection 19 14 18 18 20 10 20 20 20 20 20
Riparianvegetativezonewidth 20 11 20 15 20 10 13 20 20 20 19
Mean 18.1 15.15 16.5 16.8 18.3 15.5 13.4 18.8 15.8 17 17.3

ARRI 11/11/2012 Mat-Su Stormwater Assessment
23
Figure 8. Substrate size distribution within the sampling reaches.
Macroinvertebrates and Fish
Water quality based on macroinvertebrate ASCI scores ranged from poor to good. Water quality assessment using the ASCI methodology ranks water quality into five ratings; “Very Poor, Poor, Fair, Good, and Excellent”. Scores for ranking vary with stream class: high gradient, low-gradient coarse substrate, and low-gradient fine substrate. The Wasilla Creek sampling reaches were all classified as low-slope coarse substrate reaches. Wasilla Creek water quality at sites WA01 and WA03 were ranked as “Fair”, and WA02 and WA04 were ranked as “Good”. In Cottonwood Creek all of the sites were low-sloped coarse substrate reaches, and water quality was ranked as “Fair” and “Good” at the upper two sites and “Poor” at the lower two sites. Meadow Creek sites MC01 and MC03 were classified as low-sloped fine substrate reaches, and MC02 was classified as a low-sloped coarse substrate reach. The upper and lower sites were assessed as “Fair” water quality, while the site downstream from the Parks Highway was determined as “Poor” water quality based on the macroinvertebrate community. Water quality
ARRI 11/11/2012 Mat-Su Stormwater Assessment
24
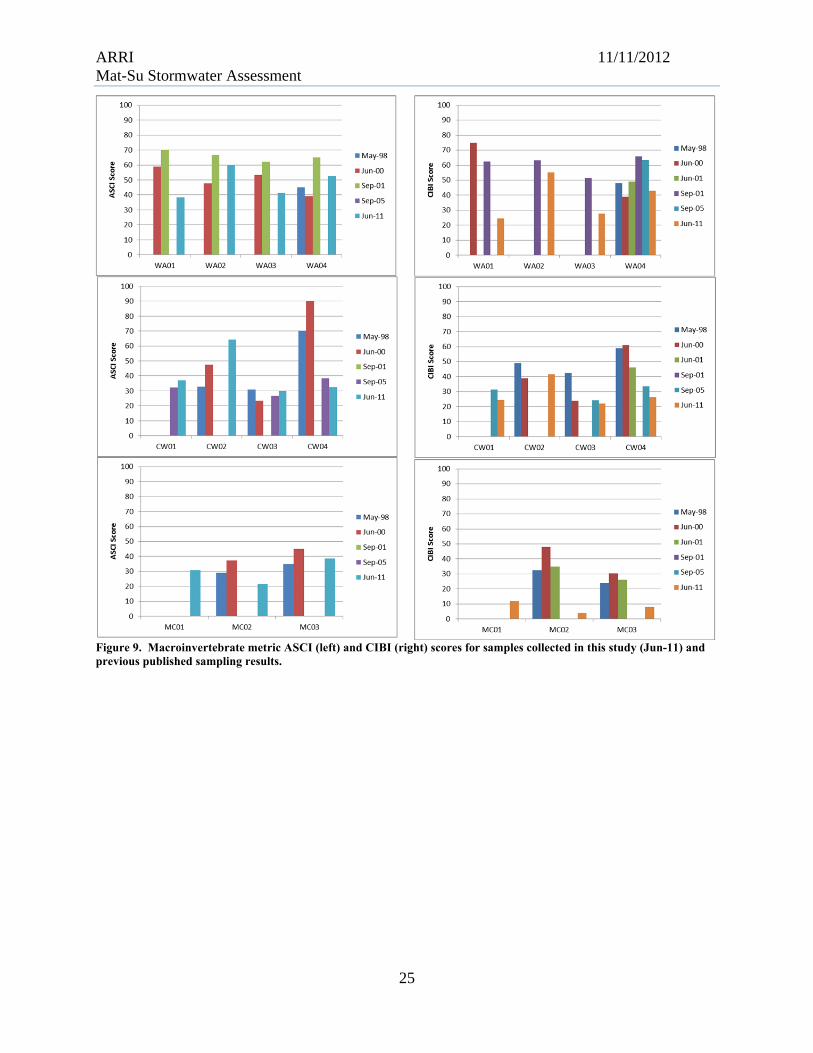
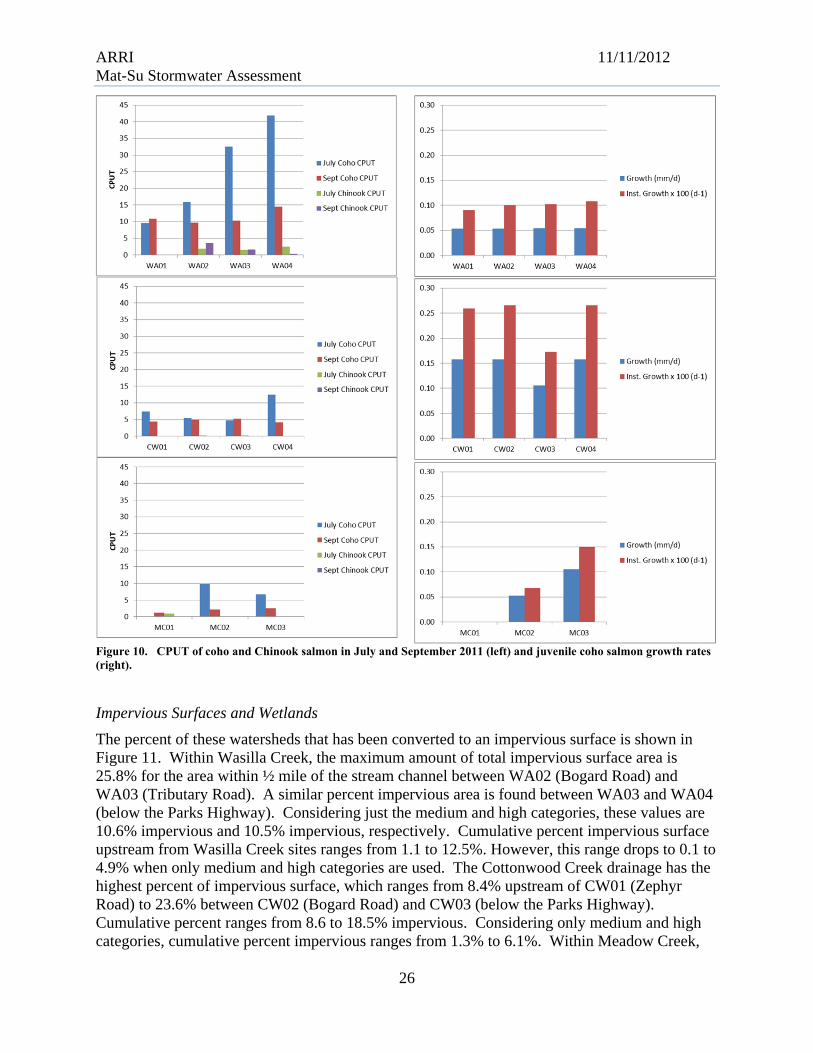
assessment using the revised CIBI scores provided similar results (correlation coefficient 0.78). Meadow Creek sites had very low CIBI scores. Low scores were due to the limited number of Ephemeroptera, Plecoptera, and Trichoptera taxa. There were no consistent longitudinal or temporal trends in ASCI or CIBI scores. ASCI scores in Wasilla Creek from samples collected in 2000 were similar among sites. Similarly in 2001, there was not a consistent downstream change in water quality based upon macroinvertebrate ASCI scores. ASCI scores 10 years later were lower at all sites compared to September 2001, samples. However, ASCI scores were higher at WA02 and WA04 in 2011 than they were in June of 2000. The CIBI scores for Wasilla Creek suggest decreasing water quality over time; however, at WA04 CIBI scores in 2011 were higher than in 2000. While 2011 CIBI scores at WA04 were the second lowest value since 2000, ASCI score in 2011 was the second highest. Similarly in Cottonwood Creek, ASCI and CIBI scores at CW04, the farthest downstream site, decrease over time with the lowest values in 2011. However, in 1998 and 2000, were the highest recorded for Cottonwood Creek. Therefore, 1998 and 2000 were either abnormally high, or conditions at CW04 were much better at that time, and water quality impacts have, over time, extended downstream to this site. Meadow Creek ASCI scores do not confirm declining water quality; however, CIBI scores reflect degenerating water quality conditions in this stream. The relative abundance and growth rates of juvenile salmon did not reflect declining water quality conditions in these three streams. Juvenile coho and Chinook salmon, Dolly Varden char, stickleback, and sculpin were captured in Wasilla Creek. July CPUT of coho salmon increase downstream with the highest catch rates of over 40 fish per trap at WA04 (Figure 10). Catch rates in September were lower at all Wasilla Creek sites, but still remained the highest at WA04. Chinook salmon were present at all sites with higher CPUT at the lower three sampling locations. Coho salmon growth rates were low at less than 0.1 mm/d, but did not decrease downstream. Coho condition factors averaged 0.12 in July and 0.10 in September. Ratios of anadromous to resident fish in Wasilla Creek were 23 in July and 13 in September. Chinook, coho, and sockeye salmon, Dolly Varden char, rainbow trout, stickleback, and sculpin were captured in Cottonwood Creek. Very few Chinook salmon were present in this stream. In Cottonwood Creek, CPUT of coho salmon was similar among sites, but growth rates were lowest at CW03. Average coho condition factor was 0.12 in July and 0.11 in September. Average ratios of anadromous to resident fish in Cottonwood Creek were 1.7 in July and 1.1 in September. Within Meadow Creek, coho salmon CPUT was lowest at MC01 and highest at MC03 for samples in July and August. Although CPUT was high at MC02, growth rates were lower than at MC03. Growth rates could not be calculated for MC01 due to the low numbers of captured fish. Meadow Creek coho condition factors were 0.11 for July and 0.10 for September. Anadromous to resident fish ratios were 0.79 in Meadow Creek in July and 0.09 in September.
ARRI 11/11/2012 Mat-Su Stormwater Assessment
25
Figure 9. Macroinvertebrate metric ASCI (left) and CIBI (right) scores for samples collected in this study (Jun-11) and previous published sampling results.
ARRI 11/11/2012 Mat-Su Stormwater Assessment
26
Figure 10. CPUT of coho and Chinook salmon in July and September 2011 (left) and juvenile coho salmon growth rates (right).
Impervious Surfaces and Wetlands
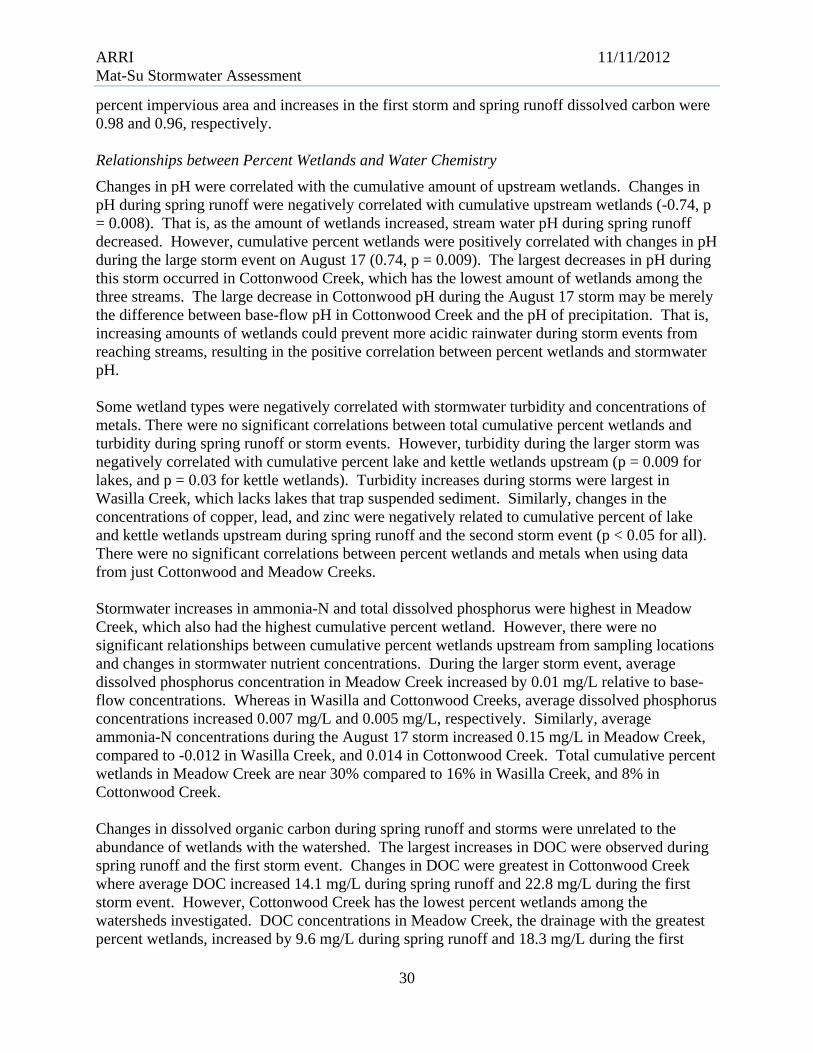
The percent of these watersheds that has been converted to an impervious surface is shown in Figure 11. Within Wasilla Creek, the maximum amount of total impervious surface area is 25.8% for the area within ½ mile of the stream channel between WA02 (Bogard Road) and WA03 (Tributary Road). A similar percent impervious area is found between WA03 and WA04 (below the Parks Highway). Considering just the medium and high categories, these values are 10.6% impervious and 10.5% impervious, respectively. Cumulative percent impervious surface upstream from Wasilla Creek sites ranges from 1.1 to 12.5%. However, this range drops to 0.1 to 4.9% when only medium and high categories are used. The Cottonwood Creek drainage has the highest percent of impervious surface, which ranges from 8.4% upstream of CW01 (Zephyr Road) to 23.6% between CW02 (Bogard Road) and CW03 (below the Parks Highway). Cumulative percent ranges from 8.6 to 18.5% impervious. Considering only medium and high categories, cumulative percent impervious ranges from 1.3% to 6.1%. Within Meadow Creek,

ARRI 11/11/2012 Mat-Su Stormwater Assessment
27
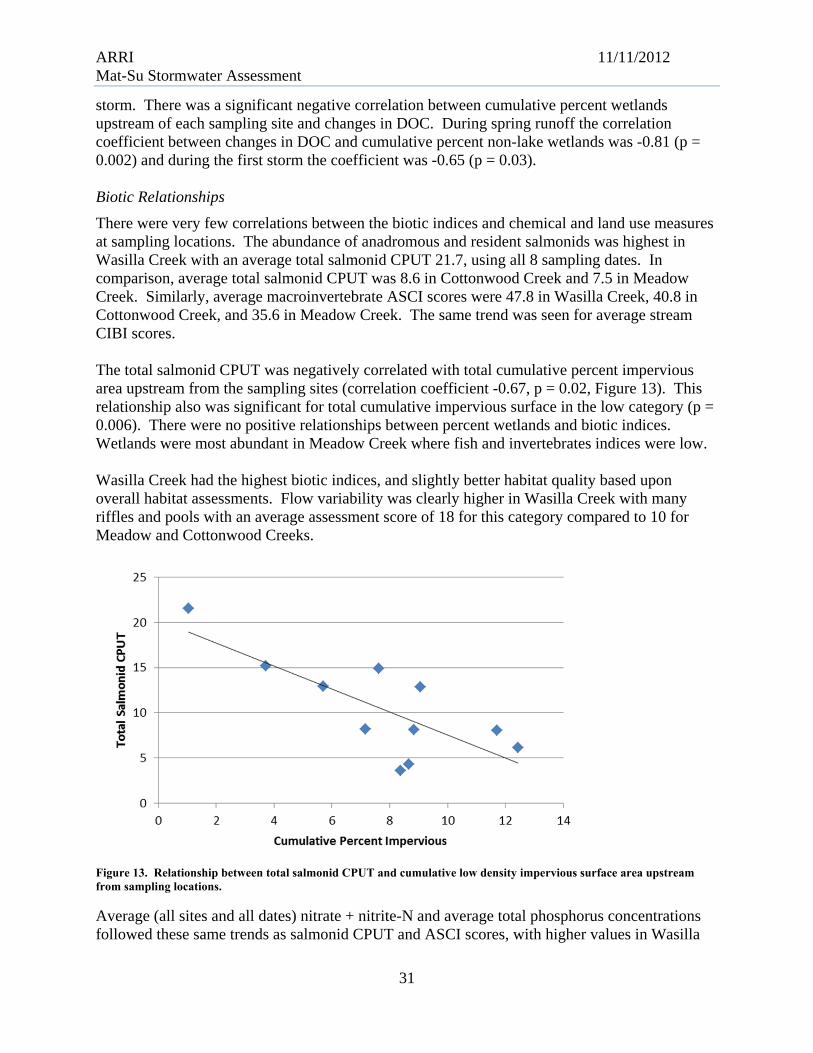
cumulative percent impervious between sites ranges from 10.7% to 12.4% or 1.6% to 4.1% when using medium and high categories. Cumulative percent impervious surface upstream of the Meadow Creek sampling sites rages from 10.7% to 11.8% or 1.6% to 3.5% when using the medium and high categories. There is a narrow range of variability in impervious surface area to evaluate relationships with changes in water quality. Total percent impervious surface within ½ mile of the stream systems between sampling sites ranges from 1.1% at WA01to 25.8% between WA02 and WA03. Using only the high and medium category values this ranged from 0.1% to 12.6%. Percent high category impervious area within ½ mile of the streams between sites does not exceed 1%. Total cumulative percent upstream of a site, the range of percent impervious is lower; 1.1% at WA01to 18.5% at CW04. Cumulative percent upstream of each site using the medium and high categories ranged from 0.1% to 6.6% or less than 1% using the high category alone. The percent of wetlands within each drainage between sites and cumulative upstream of each sampling site by geomorphic category is shown in Figure 12. The Meadow Creek drainage contained the largest percent wetland, 31%, and Cottonwood Creek the lowest, at 11.8% wetland upstream from CW01. Cumulative percent wetland upstream from each Wasilla Creek sampling site ranged from 16.7% to 24%. Discharge slope, drainage way, and wetland/upland complexes were the dominant geomorphic wetland types in the Wasilla Creek drainage. Within the Cottonwood Creek drainage cumulative percent wetland upstream from each sampling site ranged from 8.2% to 11.8%. Lakes were the dominant wetland type, and excluding these, cumulative wetlands accounted for 5.4% to 7.6% of the drainage area. Following lakes, spring fens were the dominant wetland type in the Cottonwood Creek drainage. In Meadow Creek, cumulative wetland area ranged from 27.6% to 31.2%. Lakes were also the dominant wetland type and excluding this category, cumulative percent wetland ranged from 20.8% to 23.8%. Considering all sampling sites, cumulative percent non-lake wetlands ranged from 5.4% at CW03 (below Parks Highway) to 23.8% at MC03 (below Beaver Lake Road). Relationships between Impervious Surface Area and Water Chemistry
Changes in pH and specific conductivity were correlated with impervious surface area. Changes in specific conductivity were negatively correlated with cumulative total percent impervious surface area, with correlation coefficients of -0.69 (p = 0.02) and- 0.80 (p <0.01) for the first and second storms, respectively. Similarly, pH increased relative to base flow during spring runoff (p = 0.01) as cumulative percent impervious area increased. Considering all sampling sites, changes in pH during storm events was not correlate d with impervious surface area. Correlation coefficients between cumulative impervious surface and pH changes during spring runoff are slightly higher when including only sites from Cottonwood and Meadow Creeks; however, relationships were not statistically significant. There were no significant correlations between impervious surface area and turbidity when considering all sites or sites within the two spring fed streams, Cottonwood and Meadow Creek. Correlation coefficients between impervious surfaces in Wasilla Creek and changes in turbidity during the second storm event were high (>0.80) but were not statistically significant (p > 0.05).

ARRI 11/11/2012 Mat-Su Stormwater Assessment
28
There were significant correlations between percent impervious surface area and changes in metal concentrations during storm events with combined data from Cottonwood and Meadow Creeks and with data from Wasilla Creek. Using data from the two wetland streams, total percent impervious area between sites was significantly correlated (p < 0.05) with changes in lead and zinc during the second storm event, and changes in zinc during spring runoff. There was no relationship between copper concentrations and impervious surface area concentrations within these two streams. However, in Wasilla Creek, there was a significant positive correlation between percent impervious surface area in the medium category and changes in copper concentrations during the second storm event. (p = 0.05).
Figure 11. Percent impervious surface area by category within 0.5 miles of the stream channel between sites (left) and cumulative percent upstream (right).

ARRI 11/11/2012 Mat-Su Stormwater Assessment
29
Figure 12. Percent of wetlands by wetland type between sampling sites (left) and cumulative percent upstream (right).
Among the nutrients, impervious surface was related to storm and spring runoff changes in nitrate + nitrite-N and total phosphorus. There was a negative and significant relationship between total cumulative impervious surface area and changes in nitrogen concentrations. That is, as percent impervious area upstream of a site increased, nitrate + nitrite-N concentrations decreased. This relationship was statistically significant for both storm events and spring runoff. Similarly, changes in total phosphorus concentrations during the second storm event were negatively and significantly (p = 0.04) correlated with total cumulative percent imperviousness. The increases in dissolved organic carbon during the first storm event and spring runoff were positively correlated with total cumulative percent impervious surfaces. Correlation coefficients with dissolved carbon during increases spring runoff and total cumulative percent impervious were 0.80 (p = 0.03) using all sampling sites. Focusing just on Cottonwood and Meadow Creeks, correlation coefficients are similar at 0.82 for total cumulative upstream and dissolved carbon during spring runoff. In Wasilla Creek, correlation coefficients between total cumulative
ARRI 11/11/2012 Mat-Su Stormwater Assessment
30
percent impervious area and increases in the first storm and spring runoff dissolved carbon were 0.98 and 0.96, respectively. Relationships between Percent Wetlands and Water Chemistry
Changes in pH were correlated with the cumulative amount of upstream wetlands. Changes in pH during spring runoff were negatively correlated with cumulative upstream wetlands (-0.74, p = 0.008). That is, as the amount of wetlands increased, stream water pH during spring runoff decreased. However, cumulative percent wetlands were positively correlated with changes in pH during the large storm event on August 17 (0.74, p = 0.009). The largest decreases in pH during this storm occurred in Cottonwood Creek, which has the lowest amount of wetlands among the three streams. The large decrease in Cottonwood pH during the August 17 storm may be merely the difference between base-flow pH in Cottonwood Creek and the pH of precipitation. That is, increasing amounts of wetlands could prevent more acidic rainwater during storm events from reaching streams, resulting in the positive correlation between percent wetlands and stormwater pH. Some wetland types were negatively correlated with stormwater turbidity and concentrations of metals. There were no significant correlations between total cumulative percent wetlands and turbidity during spring runoff or storm events. However, turbidity during the larger storm was negatively correlated with cumulative percent lake and kettle wetlands upstream (p = 0.009 for lakes, and p = 0.03 for kettle wetlands). Turbidity increases during storms were largest in Wasilla Creek, which lacks lakes that trap suspended sediment. Similarly, changes in the concentrations of copper, lead, and zinc were negatively related to cumulative percent of lake and kettle wetlands upstream during spring runoff and the second storm event (p < 0.05 for all). There were no significant correlations between percent wetlands and metals when using data from just Cottonwood and Meadow Creeks. Stormwater increases in ammonia-N and total dissolved phosphorus were highest in Meadow Creek, which also had the highest cumulative percent wetland. However, there were no significant relationships between cumulative percent wetlands upstream from sampling locations and changes in stormwater nutrient concentrations. During the larger storm event, average dissolved phosphorus concentration in Meadow Creek increased by 0.01 mg/L relative to base-flow concentrations. Whereas in Wasilla and Cottonwood Creeks, average dissolved phosphorus concentrations increased 0.007 mg/L and 0.005 mg/L, respectively. Similarly, average ammonia-N concentrations during the August 17 storm increased 0.15 mg/L in Meadow Creek, compared to -0.012 in Wasilla Creek, and 0.014 in Cottonwood Creek. Total cumulative percent wetlands in Meadow Creek are near 30% compared to 16% in Wasilla Creek, and 8% in Cottonwood Creek. Changes in dissolved organic carbon during spring runoff and storms were unrelated to the abundance of wetlands with the watershed. The largest increases in DOC were observed during spring runoff and the first storm event. Changes in DOC were greatest in Cottonwood Creek where average DOC increased 14.1 mg/L during spring runoff and 22.8 mg/L during the first storm event. However, Cottonwood Creek has the lowest percent wetlands among the watersheds investigated. DOC concentrations in Meadow Creek, the drainage with the greatest percent wetlands, increased by 9.6 mg/L during spring runoff and 18.3 mg/L during the first
ARRI 11/11/2012 Mat-Su Stormwater Assessment
31
storm. There was a significant negative correlation between cumulative percent wetlands upstream of each sampling site and changes in DOC. During spring runoff the correlation coefficient between changes in DOC and cumulative percent non-lake wetlands was -0.81 (p = 0.002) and during the first storm the coefficient was -0.65 (p = 0.03). Biotic Relationships
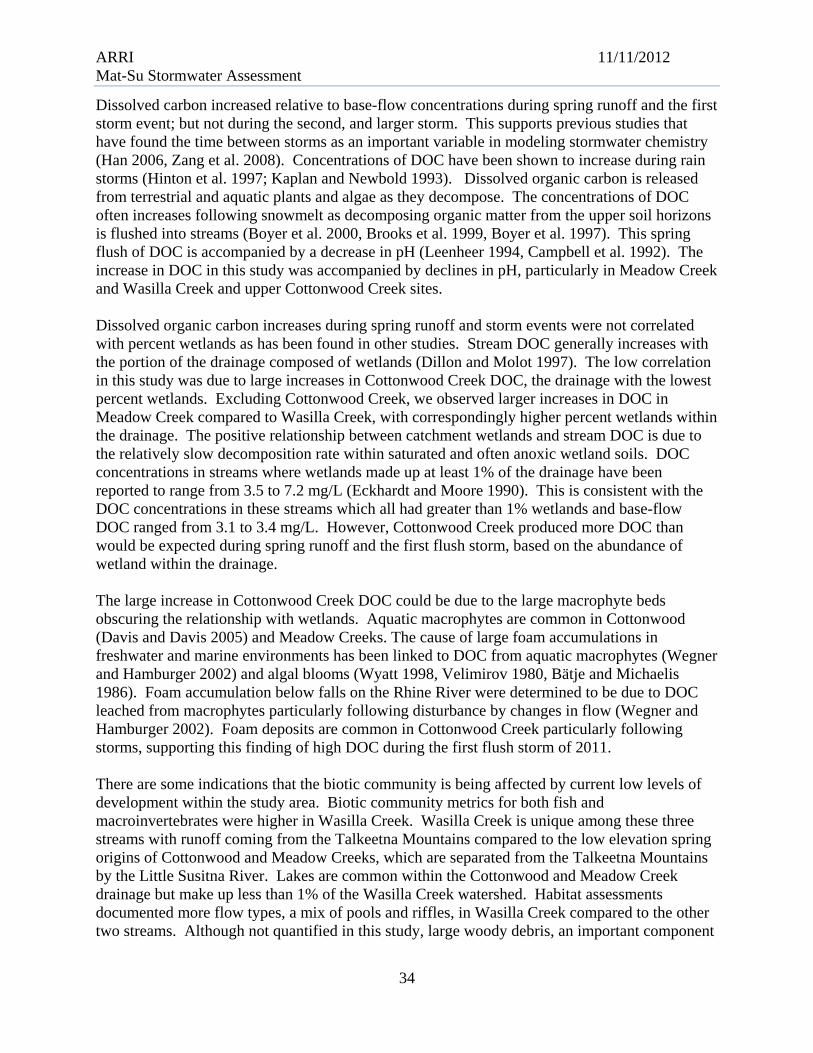
There were very few correlations between the biotic indices and chemical and land use measures at sampling locations. The abundance of anadromous and resident salmonids was highest in Wasilla Creek with an average total salmonid CPUT 21.7, using all 8 sampling dates. In comparison, average total salmonid CPUT was 8.6 in Cottonwood Creek and 7.5 in Meadow Creek. Similarly, average macroinvertebrate ASCI scores were 47.8 in Wasilla Creek, 40.8 in Cottonwood Creek, and 35.6 in Meadow Creek. The same trend was seen for average stream CIBI scores. The total salmonid CPUT was negatively correlated with total cumulative percent impervious area upstream from the sampling sites (correlation coefficient -0.67, p = 0.02, Figure 13). This relationship also was significant for total cumulative impervious surface in the low category (p = 0.006). There were no positive relationships between percent wetlands and biotic indices. Wetlands were most abundant in Meadow Creek where fish and invertebrates indices were low. Wasilla Creek had the highest biotic indices, and slightly better habitat quality based upon overall habitat assessments. Flow variability was clearly higher in Wasilla Creek with many riffles and pools with an average assessment score of 18 for this category compared to 10 for Meadow and Cottonwood Creeks.
Figure 13. Relationship between total salmonid CPUT and cumulative low density impervious surface area upstream from sampling locations.
Average (all sites and all dates) nitrate + nitrite-N and average total phosphorus concentrations followed these same trends as salmonid CPUT and ASCI scores, with higher values in Wasilla

ARRI 11/11/2012 Mat-Su Stormwater Assessment
32
Creek and lowest values in Meadow Creek. Average nitrate-N concentrations were 0.44 mg/L in Wasilla Creek, and 0.24 and 0.23 in Cottonwood and Meadow Creeks, respectively. Average total phosphorus concentrations were 0.027 mg/L in Wasilla Creek, 0.008 mg/L in Cottonwood Creek, and 0.017 mg/L in Meadow Creek. There was a significant correlation between changes in spring total and total dissolved phosphorus and Chinook CPUT (0.83 p = 0.002) and total salmonid CPUT (0.70, p = 0.015). Water temperatures in Wasilla Creek also were much cooler than those in Meadow Creek or Cottonwood Creek. Juvenile coho salmon growth rates, dissolved organic carbon, and stream temperatures were all highest in Cottonwood Creek. There was a positive correlation between increases in DOC during spring runoff and the first storm event and measures of juvenile coho growth rates. The correlation coefficient between juvenile salmon growth rates and DOC during spring runoff was 0.65 (p = 0.02) and during the first storm event, 0.69 (p = 0.03). Because salmonid growth rates were high in Cottonwood Creek, and percent wetlands were low, there was an overall negative correlation between salmonid growth rates and total cumulative percent upstream wetlands.
Discussion
Stream water chemistry was altered by spring runoff and runoff during storm events. These changes include increases in concentrations of metals. However, concentrations of water quality parameters remain below WQS criteria. The water chemistry of stormwater collected at outfall discharge points and correlations with impervious surface areas supports the conclusion that urban runoff is negatively effecting water quality in the streams investigated, even at the low levels of present development. The abundance of lakes and wetlands within these watersheds modifies the effects of some water chemistry changes. There is some indication that changes in water chemistry and impervious surface area are impacting the biotic communities within these streams. The specific conductivity in Cottonwood and Meadow Creeks during base-flow conditions was relatively high and generally decreased during spring runoff and storm events. Whereas in Wasilla Creek specific conductivity was fairly low, decreased during spring runoff, and increased during storm events. The decrease in specific conductivity during spring runoff likely reflects lower conductivity of snow and ice runoff relative to groundwater discharging into streams. The upper soil levels likely are still frozen, preventing spring runoff from flowing though soils. Other studies have found high specific conductivity during winter and spring, in northern climates, largely due to the application of deicers (Wheeler 2005, Eyles and Meriano 2010). However, differences in specific conductivity during spring runoff relative to base-flow conditions was not related to impervious surface area in these streams. Specific conductivity during storm events; however, was related to impervious surface area which tended to reduce the amount of ions in receiving streams. The low specific conductivity in stormwater outfalls supports this conclusion. Eyels and Meriano (2010) also found specific conductivity in streams to be diluted during stormwater runoff, whereas, Davies et al. (2010) found higher conductivity in urban streams. Stream water pH was relatively high in these three urban streams during base-flow conditions and became more acid during spring runoff and storm events. The pH of stormwater in outfalls

ARRI 11/11/2012 Mat-Su Stormwater Assessment
33
was very low (average of 6.3) suggesting acidification due to urban runoff; however, there was no significant correlation between changes in pH during storm events and impervious surface area. Changes in pH during spring runoff were positively correlated with impervious surface area and negatively correlated with wetlands. Organic acids from wetland soils have been found to reduce pH in spring runoff in other areas. Impervious surfaces would minimize decreases in pH during spring runoff by reducing interactions with acidic soils. Davies et al. (2010) also found higher pH in urban streams. However, the pH in rainwater, while not measured, likely was lower than stream water during storm events and could have caused lower pH. Suspended sediment and turbidity often increase in stormwater runoff (Morrison et al. 1993, Corsi et al. 2010, Hoffman et al. 1985). Turbidity and settleable solids increased in the study streams during spring runoff and the larger storm event. Turbidity was higher in stormwater samples collected at outfalls than in receiving streams. Turbidity increases during spring runoff and fall storms were greatest in Wasilla Creek at Tributary Road, a site of recent development and an active gravel pit, and in Cottonwood and Meadow Creeks below the Parks Highway and areas of commercial development. However, when considering all sites, changes in turbidity were not correlated with percent impervious surface area between adjacent sites and within ½ mile lateral to the stream. Changes in turbidity at these locations may be due to local sources. The presence of lakes and kettle wetlands, dominant within the Cottonwood and Meadow Creek watersheds, limited stormwater increases in turbidity in these streams. The strong relationship between suspended sediment or turbidity, and total metal concentrations that has been cited previously was observed in these streams. Differences in metal concentrations during the second storm event and spring runoff were strongly correlated with changes in turbidity. Because of the presence of lakes and kettle wetlands in the Cottonwood and Meadow Creek drainages, turbidity and metals, did not increase in these streams to the degree seen in Wasilla Creek. Therefore, correlations between impervious surface area and lead concentration increases during storms were only significant when analyses were limited to data from Cottonwood and Meadow Creeks or, in the case of copper, Wasilla Creek. The high concentrations of metals in stormwater outfalls and sediments metal concentrations below outfalls supports a conclusion that increasing metals are the result of runoff from urban and commercial development within these drainages. This also is consistent with results of studies conducted in 1990 (DEC 1990) that found high concentrations of lead in stormwater outfall and Wasilla Lake sediments. The stormwater outfall pipe that discharged into Wasilla Lake in 1990 currently is diverted into a drainage ditch to settling ponds and discharges into Cottonwood Creek, which we sampled as OF02. The relatively large amount of wetlands in the Meadow Creek drainage appear to be related to increases in ammonia-N and dissolved phosphorus in this drainage during storm events. Overall total and total dissolved phosphorus increased in these streams during storm events. Total and dissolved phosphorus were higher in stormwater outfalls compared to stream concentrations. However, there was a negative relationship between impervious surface area and phosphorus concentrations. That is, while concentrations may have increased, this increase was less at sites with more impervious surfaces. Similarly, Zang et al. 2008, showed a dilution of stream water nutrient concentrations during storm events.
ARRI 11/11/2012 Mat-Su Stormwater Assessment
34
Dissolved carbon increased relative to base-flow concentrations during spring runoff and the first storm event; but not during the second, and larger storm. This supports previous studies that have found the time between storms as an important variable in modeling stormwater chemistry (Han 2006, Zang et al. 2008). Concentrations of DOC have been shown to increase during rain storms (Hinton et al. 1997; Kaplan and Newbold 1993). Dissolved organic carbon is released from terrestrial and aquatic plants and algae as they decompose. The concentrations of DOC often increases following snowmelt as decomposing organic matter from the upper soil horizons is flushed into streams (Boyer et al. 2000, Brooks et al. 1999, Boyer et al. 1997). This spring flush of DOC is accompanied by a decrease in pH (Leenheer 1994, Campbell et al. 1992). The increase in DOC in this study was accompanied by declines in pH, particularly in Meadow Creek and Wasilla Creek and upper Cottonwood Creek sites. Dissolved organic carbon increases during spring runoff and storm events were not correlated with percent wetlands as has been found in other studies. Stream DOC generally increases with the portion of the drainage composed of wetlands (Dillon and Molot 1997). The low correlation in this study was due to large increases in Cottonwood Creek DOC, the drainage with the lowest percent wetlands. Excluding Cottonwood Creek, we observed larger increases in DOC in Meadow Creek compared to Wasilla Creek, with correspondingly higher percent wetlands within the drainage. The positive relationship between catchment wetlands and stream DOC is due to the relatively slow decomposition rate within saturated and often anoxic wetland soils. DOC concentrations in streams where wetlands made up at least 1% of the drainage have been reported to range from 3.5 to 7.2 mg/L (Eckhardt and Moore 1990). This is consistent with the DOC concentrations in these streams which all had greater than 1% wetlands and base-flow DOC ranged from 3.1 to 3.4 mg/L. However, Cottonwood Creek produced more DOC than would be expected during spring runoff and the first flush storm, based on the abundance of wetland within the drainage. The large increase in Cottonwood Creek DOC could be due to the large macrophyte beds obscuring the relationship with wetlands. Aquatic macrophytes are common in Cottonwood (Davis and Davis 2005) and Meadow Creeks. The cause of large foam accumulations in freshwater and marine environments has been linked to DOC from aquatic macrophytes (Wegner and Hamburger 2002) and algal blooms (Wyatt 1998, Velimirov 1980, Bätje and Michaelis 1986). Foam accumulation below falls on the Rhine River were determined to be due to DOC leached from macrophytes particularly following disturbance by changes in flow (Wegner and Hamburger 2002). Foam deposits are common in Cottonwood Creek particularly following storms, supporting this finding of high DOC during the first flush storm of 2011. There are some indications that the biotic community is being affected by current low levels of development within the study area. Biotic community metrics for both fish and macroinvertebrates were higher in Wasilla Creek. Wasilla Creek is unique among these three streams with runoff coming from the Talkeetna Mountains compared to the low elevation spring origins of Cottonwood and Meadow Creeks, which are separated from the Talkeetna Mountains by the Little Susitna River. Lakes are common within the Cottonwood and Meadow Creek drainage but make up less than 1% of the Wasilla Creek watershed. Habitat assessments documented more flow types, a mix of pools and riffles, in Wasilla Creek compared to the other two streams. Although not quantified in this study, large woody debris, an important component

ARRI 11/11/2012 Mat-Su Stormwater Assessment
35
of fish habitat appeared to be more abundant in Wasilla Creek. This observation is supported by previous studies that have documented a higher abundance of woody debris in Wasilla Creek than in Cottonwood Creek (Davis and Muhlberg 2002, Davis et al. 2006). Therefore, differences in the biotic community could be due to differences in physical habitat quality. Alternatively, there was a significant negative relationship between impervious surface area and total salmonid CPUT. This is consistent with previous studies that have documented rapid declines in fish community composition at impervious surface area less than 10% of the watershed (Paul and Meyer 2001). In addition, differences in large woody debris could be due to urban development. Large woody debris has been found to be lower in urban streams (Wenger et al. 2009). At least one land owner along Cottonwood Creek physically removed woody debris from the stream, ironically to improve fish habitat. Concentrations of macronutrients, nitrate + nitrite-N were higher in Wasilla Creek, and these nutrients were inversely correlated with percent impervious cover. Reduced nutrient concentrations could limit stream primary productivity, and the invertebrate and fish communities. Apparent negative trends in macroinvertebrates ASCI scores at the lowest Cottonwood Creek sites, with the highest cumulative percent impervious cover further support possible urban effects to the biotic community. Initial results support the conclusion that urban stormwater runoff is negatively affecting water quality. However, interpretation is based largely on correlations, which do not confirm causal relationships. Additional water quality data collection in 2012 will help to confirm initial findings. The study design could be improved with the inclusion of at least one additional spring-fed wetland stream with little or no development. This would provide a reference against which conditions in Meadow and Cottonwood Creeks could be compared in the current study, and over time. Additional sampling should include more measures of stream physical characteristics, like woody debris, to help identify factors that could alter the biotic community. Stream sediment sampling for metals should be expanded beyond outfall sites to determine if high metal concentrations are present in streams. Sediment bound metals along with abundant fine substrate in Meadow Creek could explain the absence of pollution intolerant EPT taxa and low salmonid CPUT.
Literature Cited
Al Bakri, D., S. Rahman, and L. Bowling. 2008. Sources and Management of Urban Stormwater Pollution in Rural Catchments, Australia. Journal of Hydrology. 356(3-4): 299-311.
Alaska Department of Environmental Conservation. 2006. 18 AAC 70, Water Quality Standards. Juneau, Alaska.
Alaska Department of Environmental Conservation. 2003. Alaska Water Quality Criteria Manual for Toxic and Other Deleterious Organic and Inorganic Substances, as amended through May 15, 2003. Juneau, Alaska.
Alaska Department of Environmental Conservation. 1990. Wasilla storm drains investigation, Wasilla, Alaska, Field work conducted September 1988 and May 1999. ADEC, Anchorage, AK.
Bätje, M., and H. Michaelis. 1986. Phaeocystis pouchetii blooms in the East Frisian coastal waters (German Bight, North Sea). Marine Biology 93:21-27.

ARRI 11/11/2012 Mat-Su Stormwater Assessment
36
Bevenger, G. S., and R. M. King. 1995. A pebble count procedure for assessing watershed cumulative effects. USDA Forest Service. Rockey Mountain Forest and Range Experiment Station. Fort Collins, CO. Research Paper RM-RP-319.
Boyer, E.W., G.M. Hornberger, K.E. Bencala and D.M. McKnight. 1997. Response characteristics of DOC flushing in an alpine catchment. Hydrological Processes 11:1635-1647.
Boyer, E.W., G.M. Hornberger, K.E. Bencala, and D.M. McKnight. 2000. Effects of asynchronous snowmelt on flushing of dissolved organic carbon: a mixing model approach. Hydrological Processes 14:3291-3308.
Brooks, P.D., D.M. McKnight, and K.E. Bencala. 1999. The relationship between soil heterotrophic activity, soil dissolved organic carbon (DOC) leachate, and catchment-scale DOC export in headwater catchments. Water Resources Research 35:1895-1902.
Brown, J., and Barrie Peake. 2006. Sources of heavy metals and polycyclic aromatic hydrocarbons in urban stormwater runoff. The Science of the Total Environment 359: 145-155.
Buchman, M.F. 2008. Screening Quick Reference Tables, NOAA OR&R Report 08-1, Seattle WA, Office of Response and Restoriation Division, National Oceanic and Atmospheric Administration, 34 pages.
Campbell, P.G.C., H.J. Hansen, B.Dubreuil, and W.O. Nelson. 1992. Geochemistry of Quebec North shore salmon rivers during snowmelt: organic acid pulse and aluminum mobilization. Can. J. Fish. Aquat. Sci. 49:1938-1952.
Corsi, S.R., D.J. Graczyk, S.W. Geis, N.L. Booth, and K.D. Richards. 2010. A fresh look at road salt: aquatic toxicity and water-quality impacts on local, regional, and national scales. Environmental Science and Technology 44(19): 7376-7382.
Curran, J., and W. Rice. 2009. Baseline channel geometry and aquatic habitat data for selected streams in the Matanuska-Susitna Valley, Alaska: U.S. Geological Survey Scientific Investigations Report 2009—5084, 24p.
Davies, P., I. Wright, S. Findlay, O. Jonasson, and S. Burgin. 2010. Impact of urban development on aquatic macroinvertebrates in south eastern Australia: degradation of in-stream habitats and comparison with non-urban streams. Aquatic Ecology 44(4): 685-700.
Davis, J. C., and G. A. Muhlberg. 2002. Wasilla Creek Stream Condition Evaluation. Alaska Department of Fish and Game, Habitat and Restoration Division, Technical Report No. 02-05. Anchorage, Alaska. 20p.
Davis, J.C. and G.A. Davis. 2005. Cottonwood Creek TMDL Development—Residue. Final Report for the Alaska Department of Environmental Conservation. ACWA 05-02. Aquatic Restoration and Research Institute. Talkeetna Alaska.
Davis, J.C. and G.A. Davis. 2010. Fecal coliform bacteria source assessment in the waters of Cottonwood Creek, Wasilla, and Little Campbell Creek, Anchorage. Final Report for the Alaska Department of Environmental Conservation. Contract No. 18-2011-21-7. Aquatic Restoration and Research Institute. Talkeetna, Alaska.
Davis, J.C., G.A. Davis, and L. Eldred. 2006. Cottonwood Creek Ecological Assessment. Aquatic Restoration and Research Institute. Final Report for the Alaska Department of Environmental Conservation. ACWA 06-02. Talkeetna, Alaska.
Dillon, P.J. and L.A. Molot. 1997. Dissolved organic and inorganic carbon mass balances in central Ontario lakes. Biogeochemistry 36:29-42.

ARRI 11/11/2012 Mat-Su Stormwater Assessment
37
Dosskey, M.G., and P.M. Bertsch. 1994. Forest sources and pathways of organic matter transport to a blackwater stream: a hydrologic approach. Biogeochemistry 24:1-19.
Eckhardt, B.W., and T.R. Moore. 1990. Controls on dissolved organic carbon concentrations in streams, southern Quebec. Can. J. Fish. Aquat. Sci. 47:1537-1544.
Eyles, N., and M. Meriano. 2010. Road-impacted sediment and water in a Lake Ontario watershed and lagoon, City of Pickering, Ontario, Canada: An example of urban basin analyses. Sedimentary Geology 22: 15-28.
Eriksson, E., A. Baun, L. Scholes, A. Ledin, S. Ahman, M. Revitt, C. Noutsopoulos, and P.S. Mikkelsen. 2007. Selected stormwater priority pollutants- a European perspective. Science of the Total Environment 383: 41-51.
Geist, M. and C. Smith. 2011. Mapping impervious surfaces in the Mat-Su—Measuring development at the sub-watershed scale. Report available from The Nature Conservancy, Anchorage Alaska.
Gratz, M. 2011. Downloaded from http://cookinletwetlands.info, accessed October 2011. Gresens, S. 2007. Temporal and spatial responses of chironomidae (diptera) and other benthic
invertebrates to urban stormwater runoff. Hydrobiologia 575(1):173-190. Han, Y. 2006. Characteristics of highway stormwater runoff. Water Environment Research
78(12): 2377-. Hinton, M.J., S.L. Schiff, and M.C. English. 1997. The significance of storms for the
concentration and export of dissolved organic carbon from two Precambrian Shield catchments. Biogeochemistry 36:67-88.
Hoffman, E.J., J.S. Latimer, C.D. Hunt, G.L. Mills,and J.G. Quinn. 1985. Stormwater runoff from highways. Water, Air & Soil Pollution 4(4): 431-442.
Hwang, H-M., and G.D. Foster. 2006. Characterization of polycyclic aromatic hydrocarbons in urban stormwater runoff flowing into the tidal Anacostia River, Washington, DC. Environmental Pollution 140(3): 416-426.
Kaplan, L. A., and J. D. Newbold. 1993. Sources and biogeochemistry of terrestrial dissolved organic carbon entering streams. pp. 139 - 165 in T. E. Ford, ed. Aquatic microbiology: an ecological approach. Blackwell Scientific.
Leenheer, J.A. 1994. Chemistry of dissolved organic matter in Rivers, Lakes, and Reservoirs. In, Leenheer, J.A. 1994. Chemistry of dissolved organic matter in Rivers, Lakes, and Reservoirs. In, Environmental Chemistry of Lakes and Reservoirs, L.A. Baker (ed.). American Chemical Society, Washington D.C.
Major et al. 1999. Major, E. B, B. K. Jessup, A. Prussian, and D. Rinella. 2001. Alaska Stream Condition Index:
Biological Index Development for Cook Inlet 1997-2000 Summary. Alaska Department of Environmental Conservation.
Makepeace D.K., D.W. Smith, S.J. Stanley. 1995. Urban storm water quality: summary of contaminant data. Critical Review Environmental Science Technology 25(2): 93–139.
Mallin, M.A., V.L. Johnson, and S.H. Ensign. 2009. Comparative impacts of stormwater runoff on water quality on an urban, a suburban, and a rural stream. Environmental Monitoring and Assessment 159: 475-491.
Morrison, G.M., C. Wei, and M. Engdahl. 1993. Variations of environmental parameters and ecological responses in an urban river. Water Science & Technology 27(12): 191-194.
Paul, M., and J. Meyer. 2001. Streams in the Urban Landscape. Annual Review of Ecology and Systematics 32: 333-365.
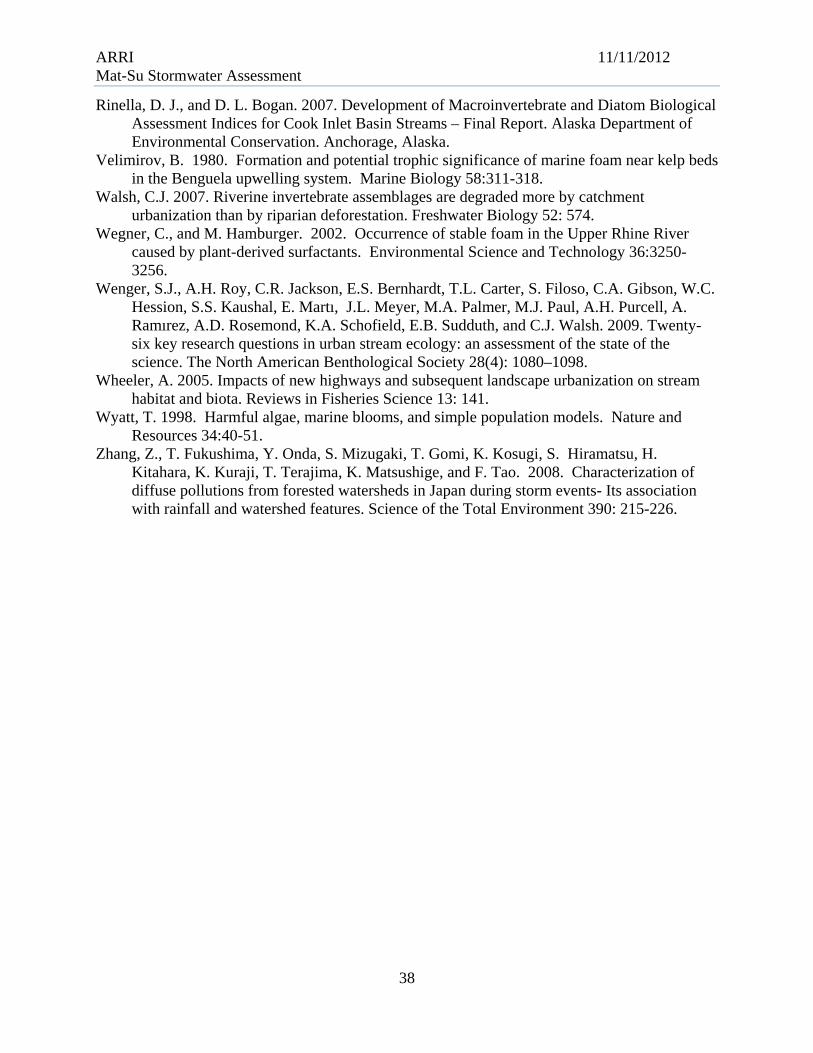
ARRI 11/11/2012 Mat-Su Stormwater Assessment
38
Rinella, D. J., and D. L. Bogan. 2007. Development of Macroinvertebrate and Diatom Biological Assessment Indices for Cook Inlet Basin Streams – Final Report. Alaska Department of Environmental Conservation. Anchorage, Alaska.
Velimirov, B. 1980. Formation and potential trophic significance of marine foam near kelp beds in the Benguela upwelling system. Marine Biology 58:311-318.
Walsh, C.J. 2007. Riverine invertebrate assemblages are degraded more by catchment urbanization than by riparian deforestation. Freshwater Biology 52: 574.
Wegner, C., and M. Hamburger. 2002. Occurrence of stable foam in the Upper Rhine River caused by plant-derived surfactants. Environmental Science and Technology 36:3250-3256.
Wenger, S.J., A.H. Roy, C.R. Jackson, E.S. Bernhardt, T.L. Carter, S. Filoso, C.A. Gibson, W.C. Hession, S.S. Kaushal, E. Martı, J.L. Meyer, M.A. Palmer, M.J. Paul, A.H. Purcell, A. Ramırez, A.D. Rosemond, K.A. Schofield, E.B. Sudduth, and C.J. Walsh. 2009. Twenty-six key research questions in urban stream ecology: an assessment of the state of the science. The North American Benthological Society 28(4): 1080–1098.
Wheeler, A. 2005. Impacts of new highways and subsequent landscape urbanization on stream habitat and biota. Reviews in Fisheries Science 13: 141.
Wyatt, T. 1998. Harmful algae, marine blooms, and simple population models. Nature and Resources 34:40-51.
Zhang, Z., T. Fukushima, Y. Onda, S. Mizugaki, T. Gomi, K. Kosugi, S. Hiramatsu, H. Kitahara, K. Kuraji, T. Terajima, K. Matsushige, and F. Tao. 2008. Characterization of diffuse pollutions from forested watersheds in Japan during storm events- Its association with rainfall and watershed features. Science of the Total Environment 390: 215-226.

ARRI 11/11/2012 Mat-Su Stormwater Assessment
39
Appendix A: Site Photographs
Photograph 1. Wasilla Creek at the upstream sampling location (6/2/11).
Photograph 2. Juvenile fish sampling at the upper Wasilla Creek site.
Photograph 3. Bank erosion and turbid water at the Wasilla Creek site at Bogard Road (7/19/11).
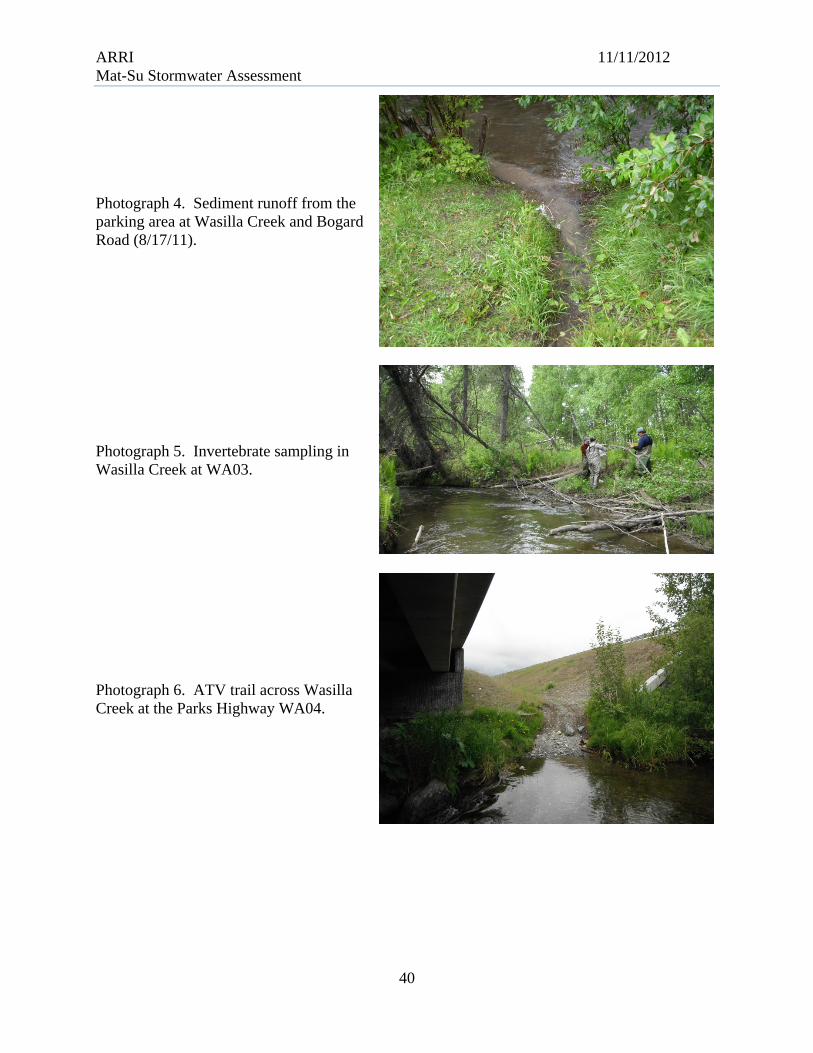
ARRI 11/11/2012 Mat-Su Stormwater Assessment
40
Photograph 4. Sediment runoff from the parking area at Wasilla Creek and Bogard Road (8/17/11).
Photograph 5. Invertebrate sampling in Wasilla Creek at WA03.
Photograph 6. ATV trail across Wasilla Creek at the Parks Highway WA04.
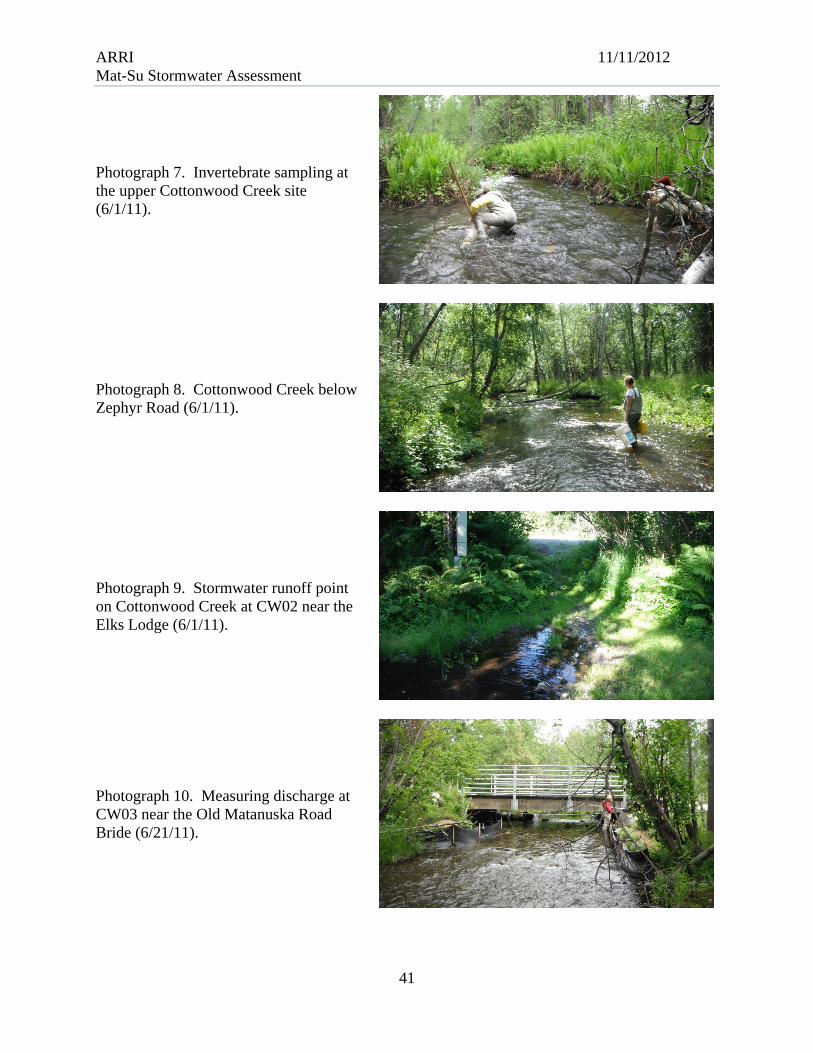
ARRI 11/11/2012 Mat-Su Stormwater Assessment
41
Photograph 7. Invertebrate sampling at the upper Cottonwood Creek site (6/1/11).
Photograph 8. Cottonwood Creek below Zephyr Road (6/1/11).
Photograph 9. Stormwater runoff point on Cottonwood Creek at CW02 near the Elks Lodge (6/1/11).
Photograph 10. Measuring discharge at CW03 near the Old Matanuska Road Bride (6/21/11).

ARRI 11/11/2012 Mat-Su Stormwater Assessment
42
Photograph 10. Data collection at CW04 below Surrey Road (6/21/11).
Photograph 11. Coho salmon in Cottonwood Creek at Surrey Road.
Photograph 12. ATV crossing and stormwater pollution point on Little Meadow Creek below Meadow Lakes Loop Road (6/1/11).

ARRI 11/11/2012 Mat-Su Stormwater Assessment
43
Photograph 13. Water sample collection at WA02 downstream from the Parks Highway (6/21/11).
Photograph 14. Discharge measurements in Meadow Creek below Beaver Lake Loop Road (6/1/11).

1
AnnotatedBibliographyoftheEffectsofLandUseandStormwaterRunoffonWaterQualityandStreamEcosystems
Jeffrey C. Davis, Gay A. Davis, and Hannah Ramage. Aquatic Restoration and Research Institute, P.O. Box
923, Talkeetna, AK 99676. [email protected]
SummaryNon‐point pollution sources are one of the primary reasons waters are identified as not meeting state
water quality standards. Stormwater runoff can alter stream water chemistry, physical characteristics,
and ultimately the biotic community. The degree of stormwater influence on stream systems varies
with land use within the drainage. Different types of land use including agriculture, livestock, urban, and
commercial development influence the sources, types, and transport routes of pollutants. Stormwater
quality in catchments with urban development varies with the portion of impervious land coverage,
road density, and traffic volume. Common stormwater pollutants include metals, hydrocarbons,
suspended sediment, macronutrients (nitrogen and phosphorus), dissolved organics and fecal bacteria.
Stormwater runoff can influence the physical properties of receiving waters including, chloride ions
(specific conductivity), pH, alkalinity, biological and chemical oxygen demand, and water temperatures.
Metals and hydrocarbons often are bound to sediment particles, so delivery to stream systems is often
associated with sediment transport. Sediment transport and pollutant delivery to streams can be
influenced by storm intensity, duration, and the time between storms. Stormwater runoff associated
with impervious surfaces increases the magnitude of stream discharge. High stream flows increase
erosion rates and sediment transport altering stream channel morphology. Changes in stream water
chemical and physical properties and channel physical characteristics, alters the biotic community
reducing macroinvertebrate diversity and abundance. Stormwater treatment measures include
maintaining stream buffers, reducing impervious surfaces, and reducing the transport of sediment‐
bound pollutants.
InfluenceofLandUseWhile most stormwater pollution is often associated with urban development, runoff from agricultural
land use also can affect water quality. Runoff from agricultural areas often contains high concentrations
of macronutrients, nitrogen and phosphorus, pesticides, dissolved organics and fecal coliform bacteria
(Al Bakri et al. 2008, Domagalski 1996, Tao et al. 2010). Urban development also can be a source of
pesticides (Tao et al. 2010). Agricultural lands can be sources high metal concentrations in streams
including Cu, Zn, Ni, Pb, and Cd (Xue et al 2000, Quinton and Catt 2007). Metals from agricultural sites
are predominately bound to sediment particles, and are at higher concentration in eroded soils (Quinton
and Catt 2007).

ARRI July 2011 Stormwater Annotated Bibliography
2
The portion of a drainage composed of impervious surfaces often is correlated with stormwater
pollution in urban steams (Brezonik and Stadelmann 2002, Robson et al. 2006, Sciera et al. 2008), loss of
biotic diversity (Davies et al. 2010, Riva‐Murray et al. 2010, Gresens 2007, Robson et al. 2006),
hydrologic changes (O’Driscoll et al. 2010), and loss of stream function (e.g. nutrient and organic matter
processing) (Booth and Jackson 1997, Brezonik and Stadelmann 2002). Water quality and stream
functional changes have been observed with only 10% of the watershed composed of impervious
surfaces (Booth and Jackson 1997). In some studies stronger relationships have been found when total
impervious areas directly in contact with stream systems (effective impervious area), and surface slopes
were used instead of total impervious area (Booth and Jackson 1997, Sciera et al. 2008). Roads and
parking areas have been shown to be a major source of hydrocarbons (Krein 2000, Brown and Peake
2006) sediment (Corsi et al. 2010, Hoffman et al. 1995), metals (Hoffman et al. 1995, Larkin and Hall
1998), and chloride ions (Eyles and Meriano 2010, Corsi et al. 2010) to stormwater runoff. Metals and
hydrocarbons are often found in association with organic or inorganic particles. The concentration of
pollutants in streams has been shown to increase with road density and traffic volume (Larkin and Hall
1998). Other sources of hydrocarbons are asphalt sealants (Watts et al. 2010) and roofing tars (Van
Metre and Mahler2003). Metal and asphalt roofs are also a source of Zn, Cd, and Pb (VanMetre and
Mahler 2003). Road salts applied to roads during winter have been identified as a source of high stream
water specific conductivity and toxic levels of chloride ions during the winter and spring in northern
streams (Wheeler 2010, Eyles and Meriano 2010).
InfluenceofStormDurationandIntensityThe delivery of pollutants varies with the intensity of storms and storm duration. Many studies have
shown that concentrations of pollutants often are highest during the “first flush” or rising limb of the
hydrograph (Lee et al. 2004, Eckley and Branfeun 2009). Storm duration and time since last storm were
found to be good predictors of storm water‐quality changes (Brezonik and Stadelmann 2002). Lee et al.
(2004) found that the time between storm events influenced water quality more that the intensity of
storms in southern California. The best predictors of stormwater runoff from forested watersheds are
total rainfall, duration, max intensity, average intensity, and days since last event (Zhang et al. 2008).
Within these forests, runoff volume was correlated most strongly with total rainfall amount, event
duration, rainfall intensity and watershed area. Runoff volume was not correlated with slope (Zhang et
al. 2008). The amount of precipitation also can influence the duration of storm influence on water
quality. Total storm precipitation was significantly related to the duration of water quality effects from
each storm due to overflow of sewage drainage systems (Alp and Melching 2009). Heavy metals and
petroleum hydrocarbons are often transported to streams bound to organic and inorganic particles. The
intensity of storm events likely effects water quality through the transport these particles.
StreamBiologicalResponseChanges in water quality due to stormwater runoff can have a biological effect influencing the
abundance and community composition of fish and aquatic insects (Paul and Meyer 2001). The biotic
community and aquatic insects can be used to assess pollutant toxicity. Multiple studies have
demonstrated the loss of invertebrate diversity and the abundance of pollution intolerant species as a
result of urban development and stormwater runoff (Robson et al. 2006, Riva‐Murray et al. 2010,

ARRI July 2011 Stormwater Annotated Bibliography
3
Wheeler 2005, Whiting and Clifford 1983). The most common correlate to biotic effects is some
measure of impervious surface area (Robson et al. 2006, Wheeler 2005, Waite et al. 2010, Wenger et al.
2009). The portion of the variability in the invertebrate community can be increased by adding
measures of slope (Waite et al. 2010) or riparian vegetation (Riva‐Murray et al. 2010) to impervious
surface area measurements. Studies have documented the loss of Ephemeroptera (Mayflies),
Plecoptera (Stoneflies), and Trichoptera (Caddisflies) species and an increase in Chironomidae (Midges)
and tubificid worms in streams affected by urban stormwater runoff (Waite et al. 2010, Whiting and
Clifford 1983, Gresens 2007, Miserendino 2008, Winter and Duthie 1998). Species specific responses
also have been demonstrated. Girgin and Dugel (2010) found that Trichopteran species and Odonates
(Dragonflies) responded differently to different metals. Davies et al. (2010) documented the loss of
Leptophlebiidae due to urban stormwater runoff.
While impervious surface area is related to changes in the invertebrate community, changes in water
quality are the ultimate cause of biological impacts. The concentrations of Cd, Cu, and Zn have been
found to be the primary cause of the loss of invertebrate diversity (Robson et al. 2006, Wheeler, 2005).
Other water quality changes include pulses of chloride from road deicers (Wheeler 2005, Corsi et al.
2010), increasing nutrients (Miserendino 2008), and increases in alkalinity, pH, and specific conductivity
(Davies et al. 2010). The concentrations of metals is higher in Odonate and mussels living in urban
stormwater treatment ponds that in the water column. Increases in copper (2.3 to3 µg/L) have been
shown to inhibit the olfactory response of juvenile coho salmon (Baldwin et al. 2003). Therefore,
increases in copper at concentrations that are not uncommon in stormwater runoff can affect the
response of coho salmon to predators and their ability to find their natal streams. Subsequent studies
have shown that copper inhibited the response of coho salmon to flight pheromones at concentrations
of 2 µg/L (Sandahl et al. 2007). Other studies have shown that common pesticides have a similar affect
the olfactory responses of rainbow trout (Tierney et al. 2008).
Measures of the macroinvertebrate community often are used to assess water quality (Yoder and
Rankin 1998), and macroinvertebrate and fish are used in whole effluent toxicity (WET) tests (Burton et
al. 2000). Stream bioassays also have been conducted to evaluate the differential effects of different
toxins (Custer et al. 2006).
Biotic communities can also affect the availability of metals and other pollutants. Metals can
concentrate in biofilms, which are the matrix of algae, sediments, and organic debris attached to stream
substrtes (Ancion et al. 2010). Metal concentrations in biofilms can be higher than on adjacent
sediments and in the water column and are more accessible to invertebrates and fish. Tubificid worms
increase the stream sediment oxygen concentration and microbial activity, which resulted in the release
of sediment ammonia‐N, organic carbon, and phosphorus, but not the release of sediment bound
metals or hydrocarbons (Mermeillod‐Blondin et al. 2005).
StreamPhysicalResponseUrbanization can alter stream hydrology, channel morphology, and substrate. (Wenger et al. 2009,
Booth and Jackson 1997). The increase in impervious surface area increases runoff during storm events
and decreases groundwater storage. This results in higher peak flows and lower low flows (O’Driscoll et

ARRI July 2011 Stormwater Annotated Bibliography
4
al. 2010). The amount of water during low flow conditions also can be affected water withdrawals
(Wenger et al. 2009) which could increase the pollutant concentrations. Higher flows can increase
nutrient and organic matter export, increase the scour of periphytic stream algae, and wash out biotic
organisms (Wenger et al. 2009). Urban development can cause a “heat island effect” altering local
storm patterns (O’Drisoll et al. 2010). Higher stream flows and decreased sediment input often leads to
larger and wider stream channels. The transport of fine sediment to urban streams can block sediment
pore spaces and reduce hyporheic zone volume (O’Driscoll et al. 2010). The hyporheic is an active zone
of nutrient and organic matter processing resulting favorable conditions for invertebrate production.
Blocking the pore spaces can reduce the transportation of oxygen and the removal of waste from
incubating salmon eggs.
StormwaterTreatmentStormwater treatment often includes structural and non‐structural components (Al Bakri et al. 2008).
Structural components include methods to reduce the amount of pollution reaching receiving waters
and non‐structural components include methods to reduce the amount of pollutants released into the
watershed. Structural methods take advantage of the binding of many pollutants to sediment particles
and treatment is through the retention or filtering of suspended sediments. Retention of sediments can
begin with reducing exposed soils during construction and land clearing (Sciera et al. 2008). Physical
treatment of stormwater is through the use of natural or constructed filters, settling basins, and ponds.
However, retention devices are less effective during large storm events, do not filter out nutrients and
other dissolved solutes, or address biotic impacts due to changes in flow and flow‐inducted habitat
modifications. The reduction of impervious surfaces and the retention of intact riparian areas can
augment physical retention of solutes and reduce impacts to urban streams (Booth and Jackson 1997,
Walsh 2007, Riva‐Murray et al. 2010). Non‐structural stormwater treatment is accomplished largely
through public education and reducing pollutant loads through behavior modification (Al Bakri et al.
2008). Education of local governments, including cost‐benefit analyses, can highlight the advantages of
retaining vegetated buffers along streams and undeveloped lands within the watershed. Public
education can alter behaviors (i.e. land clearing and the use of fertilizers or pesticides) that reduce
pollutant loads.

ARRI July 2011 Stormwater Annotated Bibliography
5
AnnotatedBibliography
Adamus, C.L., and M.J. Bergman. 1995. Estimating nonpoint source pollution loads with a GIS screening model. Water Resources Bulletin. 31(4): 647‐655.
This paper summarizes the use of GIS software to model storm water pollution within the Saint John's watershed. Model inputs consist of five spatial data layers, runoff coefficients, mean runoff concentrations, and storm water treatment efficiencies. The spatial data layers are: existing land use, future land use, soils, rainfall, and hydrologic boundaries. These data layers are processed using the analytical capabilities of a cell‐based GIS. Model output consists of seven spatial data layers: runoff, total nitrogen, total phosphorous, suspended solids, biochemical oxygen demand, lead, and zinc.
Al Bakri, D., S. Rahman, and L. Bowling. 2008. Sources and Management of Urban Stormwater
Pollution in Rural Catchments, Australia. Journal of Hydrology. 356(3‐4): 299‐311.
A comparative assessment between two catchments one rural, one urban. Both catchments experienced moderate to serious storm water pollution in terms of Total P, filterable reactive P, Total N, oxidized N, ammonium‐N, SS, fecal coli forms and heavy metals. They measured heavy metals using an atomic absorption spectrophotometer. Study suggests a short and long‐term implementation strategy of storm water management. Argues that storm water runoff is a larger source of concern than point source pollution and their assessment may suggest that the relative impact, per capita, of urban storm water pollution on the receiving water is more significant in the upland catchments than in the coastal catchments.
Alaska Department of Environmental Conservation. 1990. Wasilla storm drains investigation, Wasilla, Alaska, Field work conducted September 1988 and May 1999. ADEC, Anchorage, AK.
Evaluated hydrocarbons and heavy metals in storm water outfalls and shallow groundwater in Wasilla. Found hydrocarbons (PAH) Pb, and Cr, at the outfall near the Wasilla Lake swimming beach.
Alp, E., and C.S. Melching. 2009. Evaluation of the Duration of storm effects on instream water quality. Journal of Water Resources Planning and Management. 135(2): 107‐116.
Presents methodology to evaluate the duration of storm effects on water quality. First, calibration of an appropriate water quality model that is capable of a simulation of unsteady‐state conditions. Second, execution of the calibrated model with a number of storm loadings randomly sampled from a specific probability distribution that represents realistic ranges of pollutant concentrations. When the variations in the simulated water quality variables become negligible, it is assumed that the river system goes back to pre‐storm, dry‐weather conditions. The DUFLOW unsteady‐state water quality model and Latin hypercube sampling were applied to evaluate the duration of storm effects. The duration of the storm impacts on dissolved oxygen lasts 2 days–2 weeks. Found a strong relation between the precipitation depth and the duration of the storm effects on in‐stream water quality constituents. Outcomes of this research suggest that the duration of the storm effect on water quality can be reasonably predicted with the help of robust unsteady state water quality models.

ARRI July 2011 Stormwater Annotated Bibliography
6
Ancion, P‐Y., G. Lear, and G.D. Lewis. 2010. Three common metal contaminants of urban runoff (Zn, Cu
& Pb) accumulate in freshwater biofilm and modify embedded bacterial communities. Environmental Pollution 158(8): 2738‐2745.
Studied the accumulation of Zn, Cu and Pb in freshwater biofilms as well as the effect on microbial community structure and diversity. Biofilms can accumulate metals in higher concentrations than sediments and then transfer to inverts and fish. Conducted study in flow chamber microcosms, adding metals to mature communities for varying lengths of time and at various concentrations. Metal concentrations in water and in the product of biofilm digestions were assessed using Flame Atomic Adsorption Spectrophotometry. Changes in bacterial community structure were assessed by Automated Ribosomal Intergenic Spacer Analysis (ARISA). They found significant shifts in community populations after just 3 days which took as long as 21 days to recover after placement in non‐contaminated water. Found that the concentration of metals is not directly proportional to the amount of community structure alteration.
Arnold, C.L., and C.J. Gibbons. 1996. Impervious Surface Coverage. American Planning Association
Journal 62(2): 243‐258. Baldwin, D.H., J.F. Sandahl, J.S. Labenia, and N.L. Sholtz. 2003. Sublethal effects of copper on coho
salmon: impacts on nonoverlapping receptor pathways in the peripheral olfactory nervous system. Environmental Toxicology and Chemistry. 22(10):2266‐2274.
The response of coho salmon olfactory neurons to respond to other stimuli in the presence of
copper was investigated. Small increases in copper, from 2.3 to 3 µg/L, inhibited the olfactory response. Increases in copper of this magnitude are not uncommon due to stormwater runoff and other non‐point‐sources. The effects of copper were not diminished by the presence of calcium ions. While salmon have been shown to avoid high concentrations of copper, they may be unable to avoid copper from diffuse sources. The olfactory response of salmonids can recover from short‐term copper exposure but other studies suggest that a 4 hour exposure can result in the death of olfactory cells.
Booth, D.B., and C.R. Jackson. 1997. Urbanization of aquatic systems: Degradation thresholds, storm
water detection, and the limits of mitigation. Journal of the American Water Resources Association. 33(5): 1077‐1090.
This paper contains a lot of generalized morphological observations about urbanization's effects on streams. Using hydraulic field data and simulations this study evaluated degradation thresholds in lowland watersheds in King County Washington. It addresses the problem of quantifying urbanization; mainly that TIA (total impervious area) is incomplete due to its neglect of compacted, slightly pervious area and its inclusion of pavement that does not affect the watershed. This study used EIA (effective impervious area). They focus on channel size, flow quantity and riparian corridor finding that approximately 10 percent effective impervious area in a watershed typically yields demonstrable, and probably irreversible, loss of aquatic‐system function. It also claims that the proper use of detention ponds can reduce flow and therefore the consequences of high impervious area. It also suggests an area required for detention ponds based on the area of development.
ARRI July 2011 Stormwater Annotated Bibliography
7
Brezonik, P., and T. Stadelmann. 2002. Analysis and predictive models of storm water runoff volumes,
loads, and pollutant concentrations from watersheds in the twin cities metropolitan area, Minnesota, USA. Water Research 36: 1743‐1757.
Study looked at six Nitrogen and Phosphorus forms, TSS, VSS, COD, and Pb in storm water runoff loads. For rain events, they predicted runoff volume by calculating rainfall amount, drainage area, and percent impervious area. Donigian and Huber showed different modeling options and Driver and Tasker developed regional regression models. They used the Kruskal‐Wallis test to determine differences of seasonal groupings of concentration and load data. The data for snowmelt events and snowmelt rainfall events were combined. Rainfall duration and days since last rainfall event were the most useful variables to show runoff EMC's and group regression equations estimate EMC's the best.
Brown, J., and B. Peake. 2006. Sources of heavy metals and polycyclic aromatic hydrocarbons in urban
storm water runoff. The Science of the Total Environment 359: 145‐155.
Measured hydrocarbons (PAH) and heavy metals in Urban areas. Brown et al., 2003 suggested PAH and heavy metal concentrations were found in urban runoff. The sampling method used to collect storm water samples involved the underground Portobello Road storm water drain over seven storm events. An ISCO 6700 auto sampler took samples once the flow meter (sigma 950) was activated. The change in depth activated the flow meter. Suspended sediment bound heavy metals and PAH concentrations showed no differences between flow regimes. The sources of PAH were fossil fuels/wood and oil/petroleum products. Road debris was also a major contaminant source for both heavy metals and PAH. Metal roofs were a source of Zn.
Burton, G.A. Jr., R. Pitt, and S. Clark. 2000. The role of traditional and novel toxicity test methods in
assessing storm water and sediment contamination. Critical Reviews in Environmental Science and Technology 30: 413.
Explains how the whole effluent toxicity (WET) testing is used to measure the toxicity responses of species but can't always be predicted in receiving waters. The study brings a good point about how monitoring designs usually have a small amount of samples. For example, only 1 to 4 sites, taking samples only every hour, and one day per month might not show the true responses of species. Many invertebrates are affected by contamination of sediment. Biochemical oxygen demand (BOD), suspended solids, ammonia, metals, and organic chemicals are primary stressors that go with non‐point source runoff. Wet tests can predict the effects on benthic macroinvertebrates (e.g. Reviews in Grothe et al.) and are used for water quality. Some species (C. dubia, Diporeia, Lemna minor) are good indicators of sediment toxicity.
Cizek, A.R., G.W. Characklis, L‐A. Krometis, J.A. Hayes, O.D. Simmons III, S. DiLonardo, K.A. Alderisio,
and M.D. Sobsey. 2008. Comparing the partitioning behavior of Giardia and Cryptosporidium with that of indicator organisms in storm water runoff. Water Research 42(17): 4421‐4438.
This research analyzed the partitioning behavior of two pathogens (Cryptosporidium, Giardia) and several common indicator organisms (fecal coli form, Escherichia coli, Enterococci, Clostridium perfringens spores, and coliphage) in natural waters in the Kensico Reservoir under both dry and

ARRI July 2011 Stormwater Annotated Bibliography
8
wet weather conditions. Samples were taken from several streams in two distinct sampling phases: (i) single grab samples; and (ii) intrastorm samples obtained throughout the duration of four storms. From 15 to 30% of fecal bacteria associated with settleable sediments compared to 50% for spores. Settling velocities for all organisms was similar suggesting comparable transport velocities. Highest concentrations during the early phase of storms.
Clark, S.E., and Y.S. Siu. 2008. Measuring solids concentration in storm water runoff: comparison of
analytical methods. Environmental Science and Technology 42(2): 511‐516. Evaluates the differences in results from methods used to measure suspended solids. Methods compared were Total Suspended Solids (TSS) and Suspended Solids Concentration (SSC). The main differences between these two methods are that TSS takes a subsample using a pipette from a mixed sample, and SSC uses the entire sample. The methods also vary in the way the sample is mixed prior to pouring, or taking an aliquot. TSS methods underestimate suspended sediment concentrations because larger particles are not collected within the sample. The degree suspended sediment is underestimated depends upon the particle size distribution. When larger particles are present, then the error is larger.
Corsi, S.R., D.J. Graczyk, S.W. Geis, N.L. Booth, and K.D. Richards. 2010. A fresh look at road salt:
aquatic toxicity and water‐quality impacts on local, regional, and national scales. Environmental Science and Technology 44(19): 7376‐7382. Bioassays, chloride ion concentrations, and specific conductivity were used to evaluate impacts from road salts used as deicers during the winter. Water samples collected during the winter in Wisconsin had both acute and toxic effects in bioassays. Concentrations of chloride and conductivity increased during the winter months, and in watersheds with increased urban development. Seasonal changes in specific conductivity observed in northern streams were not observed in streams of the southern US.
Custer, K.W., G.A. Burton Jr., R.S. Coelho, and P.R. Smith. 2006. Determining stressor presence in
streams receiving urban and agricultural runoff: Development of a benthic in situ toxicity identification evaluation method. Environmental Toxicology and Chemistry 25(9): 2299‐2305.
Study used instream bioassays to assess differential effects of toxins. Chambers were constructed from tackle boxes that provided 4 separate channels for each box. Resins were used to absorb non‐polar hydrocarbons or ammonia‐N. Resins were placed at the upstream end of each channel. Rock substrates from the reference site or impacted site were used. Resins reduced water velocities within the chambers relative to natural stream flows. Rocks from the impaired site influenced insect survival. Both the reference and impaired site showed biological effects during storm flows.
Davies, P., I. Wright, S. Findlay, O. Jonasson, and S. Burgin. 2010. Impact of urban development on
aquatic macroinvertebrates in south eastern Australia: degradation of in‐stream habitats and comparison with non‐urban streams. Aquatic Ecology 44(4): 685‐700.
Compared macroinvertebrate communities between urban streams and reference sites. Samples

ARRI July 2011 Stormwater Annotated Bibliography
9
were collected from three habitats rock, riffle, and stream edges. Differences in macroinvertebrates were evaluated relative to percent impervious surfaces within the watershed and basic water chemistry. Macroinvertebrate abundance and diversity decreased in urban streams. Leptophlebiidae were absent from urban streams. Alkalinity, pH, and specific conductivity were all higher in the urban stream. Concrete may be a source of higher alkalinity. Invertebrate diversity was higher in the edge habitats.
Domagalski, J. 1996. Pesticides and pesticide degradation products in storm water runoff:
Sacramento river basin, California. Water Resources Bulletin 32(5): 953‐964.
Investigated the concentrations of pesticides within the Sacramento River drainage. Pesticides increased during storm flows and were related to the types of agriculture.
Duke, L.D., T.S. Lo, and M.W. Turner. 1999. Chemical constituents in storm flow vs. dry weather
discharges in California storm water conveyances. Journal of the American Water Resources Association 35(4): 821‐836.
Comparisons were made between the concentrations of pollutants in streams during storms and dry weather. Water quality parameters included BOD, COD, Kehldahl Nitrogen, oil and grease, total suspended solids, Cu, Pb, and Zn increased to the 99% confidence interval in 4 streams. Concentrations of these same metals increased in another 4 streams but not to as high a confidence interval. BOD and TSS also were found to be higher during storm flows relative to dry seasons.
Eckley, C.S, and B. Branfireun. 2009. Simulated rain events on an urban roadway to understand the
dynamics of mercury mobilization in storm water runoff. Water Research 43(15): 3635‐3646.
This study is an evaluation of Hg runoff to stream systems. Hg can originate from vehicles and dry and wet atmospheric deposition. Previous studies have shown Hg concentrations to be higher during the first of a rain event and then decrease. This study supported previous finding that Hg concentrations were highest during the initial flush, were greater when the time between rain events was greater, and were strongly associated with suspended sediment concentrations.
Eriksson, E., A. Baun, L. Scholes, A. Ledin, S. Ahman, M. Revitt, C. Noutsopoulos, and P.S. Mikkelsen.
2007. Selected storm water priority pollutants‐ a European perspective. Science of the Total Environment 383: 41‐51.
The paper reviews a European method to determine selected storm water priority pollutants (SSPP) to be used to evaluate the effectiveness of different treatment options. Of concern is the human risk associated with treatment. Pollutants include metals, suspended organic and inorganic sediment, PAH, and pesticides.
Eyles, N. and M. Meriano. 2010. Road‐impacted sediment and water in a Lake Ontario watershed and
lagoon, City of Pickering, Ontario, Canada: An example of urban basin analyses. Sedimentary Geology 22: 15‐28.
This paper describes groundwater movement through a large urban watershed. Stormwater

ARRI July 2011 Stormwater Annotated Bibliography
10
discharges result in extremely high specific conductivity values primarily due to road salts applied as deicing agents during the winter. High concentrations of salts in groundwater contribute to stream water concentrations of Cl over water quality standards. Roads are identified as the primary source of pollutants including most metals, sulfate nutrients, fecal coli forms, and both nitrogen and phosphorus (due to storm water overflow of sewage treatment). Chloride concentrations are highest during the winter, generally after snowfall events. Stream concentrations are then diluted during peak runoff or spring storms.
Girgin, S., N. Kazanci, and M. Dugel. 2010. Relationship between aquatic insects and heavy metals in
an urban stream using multivariate techniques. International Journal of Environmental Science & Technology 7(4): 653‐664.
The introduction provides a good review of toxic values of common heavy metals. Evaluates the differential effect of metals on species of aquatic insects in Turkey. Two tricopteran responded to specific metals and one Odanate to different metals.
Graham, M.C., S.I. Vinogradoff, A.J. Chipchase, S.M. Dunn, J.R. Bacon, and J.G. Farmer. 2006. Using
Size Fractionation and Pb Isotopes to Study Pb transport in the Waters of an Organic‐Rich Upland Catchment. Environmental Science and Technology 40(4): 1250‐1256.
Comparison of lead input and transport to streams during storm and base flow conditions. Total lead output in stream was less than the amount received through atmospheric deposition. Lead output was associated with storm flows. From 50 to 60% of the lead was associated with larger particles >25 um, and 30 to 40% with dissolved (<0.45um) organic matter. Isotope ratios suggested that lead associated with the larger particles was similar to lead found in soils and lead associated with organics was similar to lead found in through flow. Lead associated with organics would stay in the system longer and be more bioavailable.
Gresens, S. 2007. Temporal and spatial responses of chironomidae (diptera) and other benthic
invertebrates to urban storm water runoff. Hydrobiologia 575 (1): 173‐190.
Chironomidae populations did not decrease in urban stream reaches and their pollution tolerance scores were higher. However, Ephemeroptera, trichoptera, and Plecoptera (EPT) populations decreased in urban reaches. They define impervious as the area of the watershed that has parking lots, roads, roofs, and other urban development. This makes it hard for the land to absorb rainwater before it dumps into streams. Many stressors can affect populations of inverts, competition, predation, and recruitment. Used the EPT metrics in bio assessment to show human impacts and used biotic index (BI) scores to show the relationship of chironomids to water quality. Results showed that macroinvertebrate composition shifted because urban storm water runoff degraded the chemical quality of the habitat.
Han, Y. 2006. Characteristics of highway storm water runoff. Water Environment Research 78 (12):
2377‐.
Degradation of the water quality has been related to highways and contributes pollutants like heavy metals, hydrocarbons, and fuel additives. Some of the methods used during each storm event, include taking grab samples every 15 minutes for an hour. After that, samples were taken
ARRI July 2011 Stormwater Annotated Bibliography
11
every hour for seven hours. Usually when the water levels reach the same height. They used the US EPA methods. First storm of each rainy season was monitored. This is also known as the first flush. DOC, COD, TKN, oil and grease, and NH3‐N showed strong correlations with urban runoff.
Herngren, L., A. Goonetilleke, and G.A. Ayoko. 2005. Understanding heavy metal and suspended solids
relationships in urban storm water using simulated rainfall. Journal of Environmental Management 76 (2): 149‐158.
Used simulated rainfall by using a rainfall simulator that they designed to collect runoff samples. This method was used to compare heavy metal distribution among suspended solids. According to Wilber and Hunter, 1979, Pb, Zn, and many other metals are known to be traffic pollutants. Since they wanted to know the relationships between many variables, they used chemo metric multivariate approaches. Zn, Cu, and DOC were impacting the quality of urban storm water. Zn was correlated with DOC, and Pb, Fe, and Al with TSS.
Hoffman, E.J., J.S. Latimer, C.D. Hunt, G.L. Mills, and J.G. Quinn. 1985. Stormwater runoff from
highways. Water, Air & Soil Pollution 4(4): 431‐442.
This paper evaluated the runoff of sediment and hydrocarbons from a highway in Rhode Island. Road runoff accounted for up to 50% of the PAHs, sediment, Pb, and Zn entering and adjacent river. PAH responded differently to different storm events.
Hwang, H‐M., and G.D. Foster. 2006. Characterization of polycyclic aromatic hydrocarbons in urban
storm water runoff flowing into the tidal Anacostia River, Washington, DC. Environmental Pollution 140(3):416‐426.
Sediment increased with storm events. Sediment bound PAH accounted for 67 to 97% of the total. Heavy weight of PAHs suggests automobile originated pyrogenic PAHs.
Karouna‐Renier, N.K. and D.W. Sparling. 2001. Relationship between ambient geochemistry,
watershed land‐use and trace metal concentrations in aquatic invertebrates living in storm water treatment ponds. Environmental Pollution 112(2): 183‐192.
Study investigated the concentrations of Cu, Pb, and Zn in storm water treatment pond sediments, water, and invertebrate community. Concentrations of Cu and Zn were higher in Odanate in sediment ponds serving commercial watersheds. Cu and Zn in Mollusks and composite samples 2 times as high in commercial ponds compared with ponds in open spaces. Pb in invertebrates was 0.1 times the concentration in sediments, but invert Pb concentrations were positively correlated with concentrations in the water. Invertebrate Cu and Zn were positively correlated with concentrations in the water. Invertebrate metals were inversely related to Mg+ concentrations as this ion competes for cell membrane transport sites. Metal concentrations in invertebrates were highest following storm events. Concentrations of Cu and Zn were below levels believed to be toxic to fish.
Kim, J‐G.; Y. Park, D. Yoo, N‐W. Kim, B.A. Engel, S‐J. Kim, K‐S. Kim, and K.J. Lim. 2009. Development of
a swat patch for better estimation of sediment yield in steep sloping watersheds. Journal of the American Water Resources Association 45(4): 963‐972.

ARRI July 2011 Stormwater Annotated Bibliography
12
Describes modification and testing of a model used to predict sediment runoff from watersheds.
Kolpin, D.W., E.T. Furlong, M.T. Meyer, E.M. Thurman, S.D. Zaugg, L.B. Barber, and H.T. Buxton. 2002.
Pharmaceuticals, Hormones, and other Organic Wastewater Contaminants in U.S. Streams, 1999‐2000: A National Reconnaissance. Environmental Science and Technology 36(6): 1202‐1211.
Investigated the concentration of pharmaceuticals, hormones and other organic wastewater contaminants in streams below potential sources. Contaminants were present in 80% of the streams sampled. The most frequently found contaminants were steroids, caffeine disinfectants, fire retardant and a nonionic detergent metabolite. Concentrations were below drinking water standards; however, many of the compounds do not have established standards for different water uses. Little is known about direct, synergistic or antagonistic toxicity of most of the compounds detected.
Krein, A., and M. Schorer. 2000. Road runoff by polycyclic aromatic hydrocarbons and its
contribution to river sediments. Water Research 34(16): 4110‐4115.
PAH in runoff is evaluated relative to sediment particle size and storm events. PAH bind to different sized sediment based on molecular weight. Binding to organics occurs when PAH enter a stream system. Binding is related to the composition of the organics but not the overall volume.
Larkin, G.A., and K.J. Hall. 1998. Hydrocarbon pollution in the Brunette River watershed. Water Quality Research Journal of Canada 33(1):73‐94.
Hydrocarbons in lake sediments demonstrated as increase in hydrocarbon contaminated sediments with increasing development. Hydrocarbon concentrations in streambed sediments correlated with impermeable surfaces, and traffic density. Concentrations in stream runoff during storm events correlated with land use, while concentrations in street runoff were correlated with traffic volume. Concentrations of hydrocarbons in street surface sediment were consistent throughout the watershed suggesting the difference among locations was due to oil deposits not initially associated with particles in parking areas and on the center land of highways. Road wash off of non‐particulate oils is an important source of storm water solid contamination and ultimately lake and stream sediments.
Lee, H., L. Sim‐Lin, M. Kayhanian, and M.K. Stenstrom. 2004. Seasonal first flush phenomenon of
urban storm water discharges. Water Research 38 (19): 4153‐4163.
Suggests the initial storms in California winter season have higher pollutant concentrations most of the time and shows an accumulation of organics, minerals, and heavy metals. SC, TOC, and Zn concentrations were highest in the first storm and would decrease as the season goes on. The results show that the dry period affects the concentrations of (TOC, SC, Zn, and TSS) more than the amount of rainfall. http://www.ladpw.org/wmd/NPDES/report_directory.cfm is the website that has the records of the storm water quality data.
Lee, J., and K. Bang. 2000. Characterization of urban storm water runoff. Water Research 34(6): 1773‐
ARRI July 2011 Stormwater Annotated Bibliography
13
80.
A pollutograph was used to show the runoff quantity and quality data. In this study they used event mean concentrations (EMC) to calculate flow‐weighted average. They also used the load‐runoff relationship equation to predict mass flows. Mass loading rate order of high density equals residential watershed, > low density residential watershed, >industrial watershed, >undeveloped urban watershed.
Makepeace D.K., D.W. Smith, S.J. Stanley. 1995. Urban storm water quality: summary of contaminant
data. Critical Review Environmental Science Technology 25(2): 93–139.
Stormwater literature review of the past 15 years that focuses only on studies that presented specific chemical, physical and biological quantifiable parameters. A concentration range and generalized mean was calculated from the collection of studies for each contaminant and then compared to pertinent guidelines and regulations (as well as drinking water standards). Gives concentration ranges for PAH's, dissolved oxygen, pH, heavy metals, nutrients, alkalinity, fecal coli forms, as well as total, suspended and dissolved solids.
Mallin, M.A., V.L. Johnson, and S.H. Ensign. 2009. Comparative impacts of storm water runoff on
water quality on an urban, a suburban, and a rural stream. Environmental Monitoring and Assessment 159: 475‐491.
This project collected data for water temperature, conductivity, salinity, dissolved Oxygen, pH, and turbidity. Sites were on bridges and used YSI 6920 multiparameter water quality probe. Arcview was used for geospatial statistics of the area. Results showed rainfall impacting the quality of water in the stream. The wet‐period increased concentrations for most particulate matter. Increased urban development means increased concentrations of BOD, fecal coli form bacteria, orthophosphate. Urbanization and IA coverage affected water quality.
Mermillod‐Blondin, F., G. Nogaro, T. Datry, F. Malard, and J. Gibert. 2005. Do tubificid worms
influence the fate of organic matter and pollutants in storm water sediments? Environmental Pollution 134(1):57‐69.
Tubificid worms increased the release of ammonia and nitrate‐N, phosphate‐P, and dissolved carbon from stream sediments. The worms also increased oxygen uptake and microbial activity but also increased oxygen concentrations in the sediments. Worms did not promote the release of sediment bound hydrocarbons or metals.
Miserendino, M. 2008. Assessing urban impacts on water quality, benthic communities and fish in
streams of the Andes mountains, Patagonia (Argentina). Water, Air, and Soil Pollution 194: 91.
Macroinvertebrate samples were taken in three riffles and three pools at each site and showed a decrease in invert species richness, EPT richness the Shannon‐weaver diversity index, percent EPT density, and BMP's index. Showed the urbanized areas having some form of habitat degradation and Macroinvertebrate diversity usually decreased with increase nutrients. Sampling sites were visited in autumn, winter, spring, and summer and samples were taken under normal environmental conditions. Unlike other studies, this study did not base samples on rain fall. APHA
ARRI July 2011 Stormwater Annotated Bibliography
14
was used to analyze total suspended solids, soluble reactive phosphate, ammonia, and nitrate nitrogen. Paired Kruskal‐Wallis tests were used to compare values for physical and chemical variables at sites. Percent of collectors were higher at urban sites and could be a good indicator of impairment.
Morrison, G.M., C. Wei, and M. Engdahl. 1993. Variations of environmental parameters and
ecological responses in an urban river. Water Science & Technology 27(12): 191‐194.
Collected continuous water quality data as well as surface sediment samples on three occasions and analyzed for COD, heavy metals and dehydrogenase activity. They attempted to correlate the results with the influx of storm water runoff and combined sewer outflow. Found that higher runoff correlates with high turbidity and conductivity (mostly in the winter), that high N and P inputs in the summer correlate with oxygen sags at night, and found sever perturbation for copper and lead at two sites.
Morrison, G.M.P., and D.M. Revitt. 1987. Assessment of metal species bioavailability and geochemical
mobility in polluted waters. Environmental Technology Letters 8(8): 361‐372.
This paper presents a speciation scheme which separates the dissolved phase into three fractions depending on complexation strength and suspended solid phase into fractions according to ease of release. Discuss Chelex Removable Metal concentrations and compare them to EPA standards. Also discusses the Receiving Resins technique.
Mukundan, R., D. Radcliffe, J.C. Ritchie, L.M. Risse, and R.A. Mckinley. 2010. Sediment Fingerprinting
to Determine the Source of Suspended Sediment in a Southern Piedmont Stream. Journal of Environmental Quality 39(4): 1328‐1337. Study used nitrogen isotope ratios as sediment signatures from different sediment sources. Tracking revealed that 60% of the sediment in a Piedmont stream was from bank erosion, 30% from construction, and 10% from pastures.
Novotny, V., and J. Witte. 1997. Ascertaining aquatic ecological risks of urban storm water discharges.
Water Research (Oxford) 31: 2573‐85.
Monte Carlo modeling and the method developed by WERF by Parkhurst were the two methods used to find risk of storm water. Algae, benthic macroinvertebrates, and fish should be selected in order to figure site‐specific water quality criteria. According to Ramcheck and Crunkilton, their experiments suggest that the contaminants in storm water will possibly show days after first exposure.
O'Driscoll, M., S. Clinton, A. Jefferson, A. Manda, and S. McMillan. 2010. Urbanization effects on
watershed hydrology and in‐stream processes in the southern United States. Water 2(3): 605‐648.
Paper summarizes the effect of urbanization in the Southern US on hydrology, channel morphology, and stream ecology. Urbanization causes increase in peak flows due to impervious surfaces and decrease in base flows due to lack of water storage. Effective impervious area has
ARRI July 2011 Stormwater Annotated Bibliography
15
been found to have the greatest effect on streams. That is, impervious areas directly connected to streams. Channel effects are variable but urbanization often causes an increase in channel width and channel cross‐section. A summary of water quality effects due to urbanization is provided.
Opuene, K., E.C. Olkafor, and I.E. Agbozu. 2008. Partitioning characteristics of heavy metals in a non‐
tidal freshwater ecosystem. International Journal of Environmental Research 2(3): 285‐290.
Evaluation of the concentrations and correlations between metals in surface waters, suspended sediment, bed sediments. Correlations between metals were not the same in surface waters and suspended sediments. Partitioning coefficients were low, as found in similar studies, so most of the metals were attached to suspended sediments.
Paul, M., and J. Meyer. 2001. Streams in the Urban Landscape. Annual Review of Ecology and
Systematics 32: 333‐365. Synthesizes the research done on urban streams and the effects of development, from hydrology to pollutants (hydrocarbons, pesticides, heavy metals, nutrients etc...) to biological indicators (algae, microbes, macroinvertebrates and fish). Points out that ecological studies are far less common than chemical studies, and of much greater concern is the lack of research dealing with the urban effects on fish.
Quinton, J.N., and J.A. Catt. 2007. Enrichment of Heavy Metals in Sediment Resulting from Soil
Erosion on Agricultural Fields. Environmental Science and Technology 41(10): 3495‐3500.
Paper evaluated the concentration of metals (Cu, Pb, Ni, and Cr) from agricultural fields in the UK. Concentrations of metals were much higher in eroded soils compared to the parent soils. Metals were bonded to silts, clays, and organic material which were readily transported during erosion processes.
Riva‐Murray, K., R. Riemann, P. Murdoch, J. Fischer, and R. Brightbill. 2010. Landscape characteristics
affecting streams in urbanizing regions of the Delaware River Basin (New Jersey, New York, and Pennsylvania, U.S.). Landscape Ecology 25(10): 1489‐1503.
Study related multiple land use indicators, in addition to impervious area, to biotic indices. Land use variable in addition to impervious area were important in explaining the variability in biotic indices. Variables included the portion of riparian areas that were forested vs. grass (lawn), percent urban land with tree cover, indexes of aggradations.
Robson, M., K. Spence, and L. Beech. 2006. Stream quality on a small urbanized catchment. Science of
the Total Environment 357: 194‐207.
Demonstrated an adverse effect to aquatic macroinvertebrates from storm water runoff as a stream flowed into an urban area. Loss of biotic diversity correlated with impervious surface area. Sediment PAH and metals increased significantly downstream. Cd, Cu, and Pb identified as the primary causes of chronic toxicity.
ARRI July 2011 Stormwater Annotated Bibliography
16
Sandahl, J.F., D.H. Baldwin, J.J. Jenkins, and N.L. Scholz. 2007. A sensory system and the interface between urban storm water runoff and salmon survival. Environmental Science and Technology 41(8): 2998‐3004.
An investigation of the influence of Cu on the olfactory system of juvenile Coho salmon and their response to olfactory stimuli. Cu concentrations of 2 ug/L affected the ability of Coho juveniles to detect chemical signals (flight pheromones). This lack of response to chemical stimuli could affect survival from predation.
Sciera, K.L., J.A. Smink, J.C. Morse, C.J. Post, J.W. Pike, W.R. English, T. Karanfil, J.C. Hayes, M.A.
Schlautman, and S.J. Klaine. 2008. Impacts of land disturbance on aquatic ecosystem health: Quantifying the cascade of events. Integrated Environmental Assessment and Management 4(4): 431‐442. Authors developed a normalized disturbance index that characterized the degree of development on each lot from undisturbed through building construction and landscaping complete. The index of development was quantitatively linked to impervious surfaces, changes in storm flows, and total suspended sediment. The index was inversely correlated to measures of biological integrity, and total suspended sediment.
Simpson, J.M., J.W. Santo Domingo, and D.J. Reasoner. 2002. Microbial source tracking: state of the
science. Environmental Science and Technology 36(24): 5279‐5288.
Reviews the methods and limitations of identifying fecal bacteria sources through microbial source tracking. These methods use gene sequences that are unique to bacteria in host species to identify primary bacterial sources.
Slonecker, E.T., D.B. Jennings,and D. Garofalo. 2001. Remote sensing of impervious surfaces: A
review. Remote Sensing Reviews 20(3): 227‐255.
This paper reviews the past uses of remote sensing to calculate impervious surfaces, and discusses emerging new instruments that would improve this type of analysis. It gives a history of how aerial photographs and various techniques have been used and developed. Notes that the use of thermal infrared and radar imagery for impervious surfaces has been overlooked. These provide data under different weather and light conditions and will improve mapping accuracies.
Soulsby, C., and B. Reynolds. 1993. Influence of soil hydrological pathways on stream aluminum
chemistry at Llyn Brianne, mid‐Wales. Environmental Pollution 81(1): 51‐60.
Investigated how differences in flow pathways through soil affected stream aluminum concentrations. In some locations perched water tables forces water to flow near the sediment surface. This water became acidic and carried more aluminum. When water could flow into the subsoil, groundwater buffering reduced aluminum concentrations.
Surbeck, C.Q., S.C. Jiang, J.H. Ahn, and S.B. Grant. 2006. Flow fingerprinting fecal pollution and
suspended solids in storm water runoff from an urban coastal watershed. Environmental

ARRI July 2011 Stormwater Annotated Bibliography
17
Science and Technology 40(14): 4435‐4441.
Investigated fecal coli forms and suspended sediment in the Santa Anna river relative to stream flows. Fecal coli forms concentrations were unrelated to differences in stream flows. It is believe that these bacteria were ubiquitous on the soil surface and rapidly transported to the stream early in a precipitation event. Suspended sediment, however, depended on tractive forces associated with high flows to transport particles.
Tao, J., D. Huggins, G. Welker, J.R. Dias, C.G. Ingersoll, and J.B. Murowchick. 2010. Sediment
Contamination of Residential Streams in the Metropolitan Kansas City Area, USA: Part I. Distribution of Polycyclic Aromatic Hydrocarbon and Pesticide‐Related Compounds. Archives of Environmental Contamination & Toxicology 59(3): 352‐369.
This study collected surficial sediments in 5 streams in metro Kansas City to evaluate the influence of nonpoint‐source contaminants on sediment quality. Sediment was analyzed for 16 PAHs, 3 common Aroclors, and 25 pesticide related compounds of eight chemical classes. Historical‐use organochlorine insecticides chlordane and dieldrin were found revealing that past urban applications continue to be non‐point sources. There was no discernable trend in the concentration distributions of PAHs in any stream and they thus conclude that concentrations may be more affected by localized discharges than fluvial transport processes or equilibrium partitioning between the aqueous and the sedimentary phases. There was a correlation between historic‐use pesticides and TOC or clay content. The predominance of four‐ring component in PAH composition at most sites suggests that pyrolytic processes were the major sources of PAHs, as further confirmed by the PAH isomer ratios.
Tao, J., N.E. Kemble, C.G. Ingersoll, J.R. Dias, J.B. Murowchick, G. Welker, and D. Huggins. 2010.
Sediment Contamination of Residential Streams in the Metropolitan Kansas City Area, USA: Part II. Whole‐Sediment Toxicity to the Amphipod Hyalella azteca. Archives of Environmental Contamination & Toxicology 59(3): 370‐381.
The sediment samples from the Tao 2010 Part I study were evaluated for toxicity using a 28‐day whole sediment exposure with H. azteca (Amphipod). They measured survival and growth. A Spearman rank correlation was used to examine the relations between toxicity and the physical or chemical characteristics of the sediments. Survival of amphipods was significantly reduced in 5 of the 29 samples relative to the two control sediments and there was a significant correlation between mean amphipod survival and sum DDEs, chlordane, and dieldrin, and the mean PEC‐Q (probable effect concentration quotient) based on metals, PAHs, PCBs, and organochlorine pesticides. There was no correlation with pore‐water parameters, sediment grain size, oil and grease.
Tiefenthaler, L., E. Stein, and K. Schiff. 2008. Watershed and land use‐based sources of trace metals in
urban storm water. Environmental Toxicology and Chemistry 27: 277. Compared developed and undeveloped watersheds and looked at event mean concentration, flux, and mass loading of trace metals. Trace metals tends to be associated with urban storm water. This study is updating information on storm water trace metal mechanisms and processes.
ARRI July 2011 Stormwater Annotated Bibliography
18
20 storms were sampled and the rainfall was measured with a tipping bucket. The sampling started when the flow was more than 20% and ended when flow was less than 20% of base flow. Concentrations in undeveloped had a lower peak and both developed and undeveloped peaked later in the storm. Also, industrial land showed higher trace metal concentrations. Looked at the time between storms and found that the longer the time, the more trace metals can build up.
Tierney, K.B., J.L. Sampso, P.S. Ross, M.A. Sekela, and C.J. Kennedy. 2008. Salmon olfaction is impaired
by environmentally realistic pesticide mixture. Environmental Science and Technology 42(13): 4996‐5001.
Researchers exposed rainbow trout to an environmentally realistic concentration of a mixture made from ten of the most frequently occurring pesticides in British Columbia’s Nicomekl River in order to determine if trout can up regulate glutathione‐S‐transferases (GSTs) in order to help retain proper odorant responses. They used an electro‐olfactogram (EOG) to measure action potentials in the olfactory rosette after exposure to varying lengths and concentrations of pesticides. They exposed trout for 96 hours then detoxed. The trout were then re‐exposed for 5 minutes at 20X concentration resulting in olfactory impairment for the trout previously exposed to low and realistic concentrations of pesticides but not for trout previously exposed to high concentrations. This suggests prior mixture exposure (to low and realistic concentrations) may not prevent alteration from further exposures.
Usali, N., and M.H. Ismail. 2010. Use of remote sensing and GIS in monitoring water quality. Journal of
Sustainable Development 3(3): 228‐238.
Remote sensing can be used to estimate suspended sediments or turbidity. This paper discusses the application of remote sensing for measuring other water quality parameters such as dissolved organic matter and phytoplankton. Most remote sensing studies of chlorophyll in water are based on the empirical relationship between radiance in narrow bands or bands ratio and chlorophyll concentration. Hyperspectral sensors may be used to measure chlorophyll concentration in the future. Discusses the turbidity mapping study done by Liza (2007) at the Bering Glacier, AK which could possibly help predict hydrologic routing of the glacier in subsurface conduits. In general they are advocating remote sensing as a low‐cost way to monitor water quality spatially and temporally.
Van Buren, M.A., W.E. Watt, and J. Marselek. 1997. Application of the log‐normal and normal
distributions to storm water quality parameters. Water Research 31(1): 95‐104.
Among the distributions used in storm water quality assessment, the two‐parameter log‐normal distribution is particularly common (Chow 1954). Van Buren (1994) suggested that this distribution may not be appropriate for all storm water constituent concentrations and in‐line storage (such as an on‐stream storm water pond) may modify the form of the distribution. This paper addresses issues of the distributions of various water quality constituents (14 of them) in connection with the assessment of an on‐stream storm water pond. They compared the influent and effluent loads of the pond, which were calculated as products of the annual run‐off volume and mean concentration, whose determination was affected by the statistical distribution adopted. Results indicate that the log‐normal distribution is appropriate for many of the
ARRI July 2011 Stormwater Annotated Bibliography
19
constituents found in urban run‐off and this is consistent with findings of the U.S. EPA (1983) particularly base‐flow conditions. However, the normal distribution seemed to apply for many of the constituents in the pond outflow with the exception of total phosphorus.
Van Metre, P.C., and B.J. Mahler. 2003. The contribution of particles washed from rooftops to
contaminant loading to urban streams. Chemosphere 52: 1727‐1741.
Study determined if rooftops were playing a role in stream PAH stream loading. Found that concentrations of zinc, lead, pyrene, and chrysene on a mass per mass basis in a majority of rooftop samples exceeded established sediment quality guidelines for probable toxicity of bed sediments to benthic biota. Metal roofing was a source of cadmium and zinc and asphalt shingles a source of lead. The contribution of rooftop wash off to watershed loading was estimated to range from 6% for chromium and arsenic to 55% for zinc. Estimated contributions from roofing material to total watershed load were greatest for zinc and lead, contributing about 20 and 18%, respectively. The contribution from atmospheric deposition of particles onto rooftops to total watershed loads in storm water was estimated to be greatest for mercury, contributing about 46%.
Waite, I.R., L.R. Brown, J.G. Kennen, J.T. May, T.F. Cuffney, F. Thomas J.L Orlando, and K.A. Jones.
2010. Comparison of watershed disturbance predictive models for stream benthic macroinvertebrates for three distinct Eco regions in western US. Ecological Indicators 10(6): 1125‐1136.
The intent of this study was to determine if effective models could be developed using watershed characteristics of disturbance to predict macroinvertebrate metrics among disparate and widely separated Eco regions (Oregon and California). After compiling comparable data from Universities and state/federal agencies they found the best multiple linear regression models from each region required only two or three explanatory variables to model macroinvertebrate metrics and explained 41–74% of the variation. In each region the best model contained some measure of urban and/or agricultural land‐use, yet often the model was improved by including a natural explanatory variable such as mean annual precipitation or mean watershed slope. Two macroinvertebrate metrics were common among all three regions, the metric that summarizes the richness of tolerant macroinvertebrates (RICHTOL) and some form of EPT (Ephemeroptera, Plecoptera, and Trichoptera) richness.
Walsh, C.J. 2007. Riverine invertebrate assemblages are degraded more by catchment urbanization
than by riparian deforestation. Freshwater Biology 52: 574.
The results showed less invertebrates that are sensitive taxa in impervious areas. Riparian zones are important to streams because they act as buffers, can prevent pollutants from entering stream, and provide food or organic matter for biotic life. These zones have been tampered with in urban areas and can cause ecological problems. To sample macroinvertebrates, this study took samples from pools and LWD. To identify the total catchment of the impervious surfaces, Digital aerial orthophotography was used and VicMap topography map series was used to calculate the sub catchment area. GIS software was used at each site to show the local scale and use a 200 m buffer around the river. Saw a loss of macroinvertebrates continuing downstream of sensitive

ARRI July 2011 Stormwater Annotated Bibliography
20
taxa because of more disturbances and increased urbanization. Watts, A.W., T.P. Ballestero, R.M. Roseen, and J.P. Houle. 2010. Polycyclic Aromatic Hydrocarbons in
Stormwater runoff from Seal coated Pavements. Environmental Science and Technology 44(23): 8849‐8854.
Study measured the long‐term release of PAHs (polycyclic aromatic hydrocarbons) in parking lot runoff and found that the presence of coal tar sealant increased the mass of PAHs released in runoff by over an order of magnitude. PAH concentrations in storm water from two coal tar sealed parking lots and one unsealed parking lot (control) were monitored over a two‐year period. They also took sediment cores from a nearby wetland as well as dust collections from each lot. The mean total PAH concentrations measured in runoff from the two sealed lots were 77.6 μg/L after the first storm (which is consistent with similar studies). The concentrations of PAHs in the water samples decreased over time to near pre‐sealant levels. The concentrations in the sediment did likewise with the exception of the furthest downstream site retaining levels higher than the ambient conditions.
Wei, C., and G. Morrison. 1992. Bacterial enzyme activity and metal speciation in urban river
sediments. Hydrobiologia 235/236:597‐603. The effects of storm water and combined sewer overflows on receiving waters were investigated using measurements of bacterial enzyme activity and metal speciation in the sediments of five urban rivers. Free flowing urban rivers had high enzyme activity and low metal concentration in sediments. More stagnant urban rivers, which tended to trap sewer‐discharged sediments, were characterized by inhibited enzyme activity and high ammonium acetate and EDTA‐extractable metal concentrations. Deposited sewage, from combined sewer overflows, was indicated by highly elevated enzyme activity and metal concentrations. The results of this study demonstrate that the ecologically relevant enzyme activity measurement may be a useful complement to metal speciation analysis when investigating the effects of storm water discharges on urban rivers. The study was conducted in Sweden, in two of the rivers there are migratory Salmon.
Wei, C., and G. Morrison. 1993. Effect of storm water runoff on metal distribution in the sediment
and interstitial waters of an urban river. Environmental Technology 14(11): 1057‐1064.
Measured metals in the interstitial waters (IW) and sediments of an urban river in Sweden that receives storm water and sewage overflow. Core and peeper methods were used to investigate metal interactions at the sediment‐interstitial water interface. Concludes that total metal concentrations in the sediment do not necessarily regulate metal concentration in the interstitial waters. They found a negative relationship between COD (chemical oxygen demand) and IW metals both up and downstream of sewage input. They also found that Pb and Cu show a higher affinity for the sedimentary phase then Zn. In general they conclude that IW is a source for the re‐suspension of toxic metals.
Wenger, S.J., A.H. Roy, C.R. Jackson, E.S. Bernhardt, T.L. Carter, S. Filoso, C.A. Gibson, W.C. Hession,
S.S. Kaushal, E. Martı, J.L. Meyer, M.A. Palmer, M.J. Paul, A.H. Purcell, A. Ramırez, A.D. Rosemond, K.A. Schofield, E.B. Sudduth, and C.J. Walsh. 2009. Twenty‐six key research questions in urban stream ecology: an assessment of the state of the science. The North

ARRI July 2011 Stormwater Annotated Bibliography
21
American Benthological Society 28(4): 1080–1098.
Biological, chemical and physical impacts to urban streams are summarized. Focus is on the structural and functional changes to urban streams. Urban stream stressors and potential treatment alternatives are discussed. Authors develop a list of research questions related to urban stream quality and information necessary to manage urban streams.
Wheeler, A. 2005. Impacts of new highways and subsequent landscape urbanization on stream
habitat and biota. Reviews in Fisheries Science 13: 141.
This study suggests the presence of highways and urbanized development are major threats to the stream habitat. Lists sources that recognize the effects fine sediments have on the stream habitat. Also, highways can be a source of fine sediments and metals (Pb, Zn, Cd, and Cu) that may reduce the abundance of macroinvertebrates. The sediment can shade stream periphyton and damage respiratory structures (Lemly, 1982). Salt, from snow in the winter, can also come from highways and can be dumped right into stream. If in high enough doses during a short period of time, the concentrations can shock the stream and cause a decrease in macroinvertebrates. Urbanization can have biological impacts on macroinvertebrate communities. They can have reduced density(Garie and McIntosh) and lower IBI scores (Steedman, 1988).
Whiting, E.R., and H.F. Clifford. 1983. Invertebrates and urban runoff in a small northern stream,
Edmonton, Alberta, Canada. Hydrobiologia 102(1): 73‐80.
The invertebrate fauna of a small northern stream was examined within Edmonton, Alberta. Many invertebrates that were common upstream of the city were absent or rare within the city. In contrast, some tubificids and chironomids were very abundant within the city. Diversity and richness (number of taxa) of the fauna were much lower within Edmonton than upstream, while the total density was much higher within the city. These changes in the urban invertebrate fauna were apparently caused by the discharge of organic materials and silt from storm sewer runoff. Chemical analysis of routinely‐collected water samples did not show significant differences between urban and non‐urban sites. This was probably due to the sporadic nature of storm sewer runoff. Peak levels of contaminants in the stream were usually missed because of the routine nature of sampling. Macro benthos was sampled with a cylindrical Hess sampler, and Microinvertebrates were sampled with a core sampler. Diversity was calculated according to Simpson's formula. Because the level to which individuals could be identified varied (from species to family), a mixed diversity index, rather than a species index, was calculated.
Winter, J.G., and H.C. Duthie. 1998. Effects of urbanization on water quality, periphyton and
invertebrate communities in a southern Ontario stream. Canadian Water Resources Journal 23(3): 245‐258. Changes in periphyton and macroinvertebrate community structure along a stream system were used to assess the effects of urbanization on water quality. They conducted epilithic diatom sampling, periphyton Chlorophyll analysis, and macroinvertebrates sampling using modified Hess sampler (sorted to function feeding group). For macroinvertebrates in urban sites the relative proportion of deposit feeders (Oligochaeta) was higher than in rural sites, and the proportion of taxa classified as filtering collectors (Simuliidae and Bivalvia) was also slightly higher. Oligochaeta
ARRI July 2011 Stormwater Annotated Bibliography
22
(as well as Platyhelminthes) was the most important group for indicating site differences between urban and rural sites.
Withers, P.J.A., and H.P. Jarvie. 2008. Delivery and cycling of phosphorus in rivers: A review. Science
of the Total Environment 400: 379‐395. This review examines the role of in‐stream retention and cycling in regulating river P concentrations in order to better understand the links between P sources and their ecological impacts. It highlights the subsidy/stress theory. The sources of P are natural, runoff from impervious sources, runoff from pervious sources, wastewaters. Discusses the reason for variable stream uptake lengths, advection and diffusion, mineral precipitation, Sorption/desorption as well as the biological factors that influence P cycling. Many of the studies of nutrient retention have been conducted in clean/near‐pristine river systems in North America and comparative studies on polluted streams have indicated that the efficiency of net nutrient retention is greatly diminished in polluted urban systems.
Xue, H., L. Sigg, and R. Gachter. 2000. Transport of Cu, Zn a and in a small agricultural catchment. Wat.
Res. 34(9): 2558‐2568.
Study looked at agricultural contributions to dissolved and particulate Cu, Zn, and Cd during rain events in a first order stream in Switzerland. Also took soil cores from fertilized and non‐fertilized areas within the catchment, as well as samples from liquid manure. During events all metals were predominantly associated to particles. Metal concentrations of filtered samples were measured by inductive coupled plasma‐mass spectrometry. Dissolved Cu usually exceeded dissolved Zn. dissolved Cd and Zn concentrations seemed independent of discharge rate. Dissolved Cu decreased with increased discharge. Based on pooled results obtained from dry weather periods and rain events, the total metal concentrations seem to be linearly related to water discharge. Found that one single rain event can contribute more than half of the annual Cd load and almost one third of the yearly Cu and Zn loads. Zn and Cd reach the lake mainly as particle bound metals. Based on soil cores they found that copper complexed with organic matter seems to be retained and slowly released in the surface soil.
Yoder, C.O., and E.T. Rankin. 1998. The role of biological indicators in a state water quality
management process. Environmental Monitoring and Assessment 51: 61‐88.
Gives evidence for the practical use of biological indicators in conjunction with physical and chemical data to properly set water quality management goals. Gives the Ohio EPA as an example of an agency using this biocriteria‐based approach. Biological indicators more accurately reflect wider environmental disturbances. They detail Ohio's 6 levels administrative and environmental indicators used for monitoring program effectiveness.
Zhang, Z., T. Fukushima, Y. Onda, S. Mizugaki, T. Gomi, K. Kosugi, S. Hiramatsu, H. Kitahara, K. Kuraji,
T. Terajima, K. Matsushige, and F. Tao. 2008. Characterization of diffuse pollutions from forested watersheds in Japan during storm events‐ Its association with rainfall and watershed features. Science of the Total Environment 390: 215‐226.
Study looked at diffuse pollution from forested watersheds in 5 regions (23 sites) in Japan during

ARRI July 2011 Stormwater Annotated Bibliography
23
a total of 72 storm events. They characterized runoff loads and discharge weighted event concentrations (DWEC) of total suspended solids, DOC, PO4‐P, dissolved total Phosphorus, total P, NH4‐N, NO2‐N, NO3‐N, dissolved total N, and total N. To calculate Load they used instantaneous concentration and cumulative discharge. Discrete samples were collected every 0.5 h, sometimes every 1 or 2 h during the falling limb of a hydrograph. Forward stepwise multiple regressions were applied to relate runoff volumes, loads, and DWECs to storm characteristics, antecedent conditions, watershed area, slope, and sources. Their load/concentration models had a higher R2 value (0.26/0.10) than those of comprehensive urban models for the common constituents attributed to improvements in their use of 5 storm characteristic variables (total rainfall, duration, max intensity, average intensity, and days since last event). Runoff volume was correlated most strongly with total rainfall amount, event duration, rainfall intensity and watershed area. Runoff volume was not correlated with slope. All constituent concentrations except TSS and NH4‐N showed negative correlations with rainfall intensity, suggesting that storm events generated more dilute runoff for these constituents.
ARRI February 2011 Investigation Plan Biotic Stormwater Assessment
1
Title
Biotic Assessment of Stormwater Quality
Point of Contact
Jeffrey C. Davis, Aquatic Ecologist Aquatic Restoration and Research Institute [email protected] 907.733.5432 P.O. Box 923 Talkeetna, AK 99676
Project Objective
Test for significant regression relationships between indices of development and macroinvertebrate and fish community composition.
Justification
Stormwater runoff from urban centers can negatively affect the chemical and physical components of fish habitat. During storms, pollutants are flushed from roads and parking areas through collection systems into streams and lakes. Stormwater runoff often contains high concentrations of metals, hydrocarbons, and sediment (Brown et al. 2006, Mallin 2009). High concentrations of metals are acutely toxic to rearing juvenile salmon and their major food sources. Hydrocarbons can cause DNA mutations which can be particularly damaging to incubating salmon eggs. The concentrations of pollutants in stormwater runoff is related to urban development, such as the number of road crossings, types of land use, or areas of ground cover impervious to water infiltration. Contaminated stormwater is responsible for one third of the impaired listings of assessed waters throughout the United States. The influence of stormwater flows and pollutants on water quality and fish habitat can be avoided by implementing treatment options. These options include reducing the amount of impervious surfaces, using riparian or wetland vegetation to filter and uptake or breakdown pollutants, manufactured or biological filters and subsurface retention. Currently, little of the Mat-Su urban center contains a stormwater drainage system. Many roads are still unpaved and large areas are undeveloped. Identifying and documenting stormwater pollution effects can be used to promote local, state, and federal regulatory implementation of treatments that can effectively control or treat stormwater runoff.
Background
Due to rapidly changing concentrations during storm events, water sampling for chemical pollutants alone can underestimate stormwater impacts. Concentrations of pollutants are highest

ARRI February 2011 Investigation Plan Biotic Stormwater Assessment
2
during the early stages of runoff during the rising stream hydrograph (Han 2006). These concentrations can vary with the magnitude of the storm and the time since the previous storm event. Sampling the change in the concentration of pollutants during multiple storm events, in multiple streams and for multiple parameters can be cost prohibitive. However, limited sampling for chemical parameters can lead to the possible erroneous assumption that storm flows are not contaminated. Even when high concentrations are detected, some may argue that due to the short or unknown duration, pollutants are not affecting the human or biological community. Biotic indices using fish and aquatic invertebrates have been shown to be an important component of stormwater assessment projects (Walsh 2007, Gresens 2007). Biotic communities often respond to changes in water quality that may not be detected in grab samples for water chemical analyses. The macroinvertebrate stream community can be made up of 30 or more different species. These organisms vary in their response to pollutants. Pollutant intolerant species can be lost from the biotic community with only short term pulses of pollutants. The relative abundance of pollution tolerant to intolerant species can be used to monitor changes in water quality and can indicate pollution events that occurred weeks or months previously. Similarly, incubating salmon eggs can be lost due to high concentrations of metals of short duration. Juvenile salmon can show a response to increases in fine sediment and other habitat changes that can occur due to the cumulative effects of many small-scale pollution events. Small increases in fine sediment during storm events may not be measureable as statistically significant but can result in a measurable increase in streambed sediment. For these reasons, the majority of states use biocriteria as an integral part of their water quality assessment programs. Biotic indices are not used in Alaska for water quality assessment; however, the State of Alaska has worked with the Environment and Natural Resources Institute to develop biotic water quality assessment methods; the Alaska Stream Condition Index methodology (ASCI) (Major and Barbour 2001). These methods have been used for the past 10 years to assess water quality in all regions of the state. For a stormwater assessment project to be effective, it should include indices of development, and measures of the biotic community. Sampling water chemistry alone can lead to erroneous assumptions. However, changes to the biotic community relative to changes in land development strongly support the link between stormwater pollution and the resulting effects to juvenile salmon.
Procedures
Benthic macroinvertebrates will be sampled in the spring prior to emergence. Samples will be collected from 4 locations on Wasilla Creek, 4 locations on Cottonwood Creek, and 3 locations on Little Meadow/Meadow Creek (Table 1, and maps in Appendix A ).. Sample locations are distributed throughout each stream system relative to estimates of upstream development. The initial indicator of land use will be the number of upstream road crossings (see Paulsen and

ARRI February 2011 Investigation Plan Biotic Stormwater Assessment
3
Fisher 2001). Other indicators, including measures of impervious surface area are currently being evaluated by The Nature Conservancy (Corinne Smith, Personal Communication) and will be used if they become available. Table 1. Proposed macroinvertebrate and fish sampling locations.
Stream Site Description Latitude Longitude Meadow Cr. ML01 Downstream from Meadow
Lakes Loop crossing of Little Meadow Creek
61.59166 N 149.66658 W
ML02 Downstream from Kenlar Road crossing of Meadow Creek
61.56910 N 149.67018 W
ML03 Downstream from Beaver Lake Road
61.56264 N 149.82600 W
Cottonwood Cr. CW01 Below Zepher Road Crossing 61.37471 N 149.17043 W CW02 Above Earl Road Crossing 61.36476 N 149.17536 W CW03 Below Old Matanuska Road
Crossing 61.57500 N 149.40787 W
CW04 Below Surrey Road Crossing 61.52489 N 149.52952 W Wasilla Creek WA01 Above Crabb Circle 61.66135 N 149.18846 W WA02 Above Bogard Road and
Trunk Road Crossing 61.61389 N 149.24159 W
WA03 Next to Tributary Road 61.35257 N 149.15094 W WA03 Between Fireweed Road and
Railroad Crossing 61.34053 N 149.18881 W
Sampling reaches will be delineated at each location as 20 times stream width or 200 m, whichever is less. Reaches will be located a minimum of 100 m below road crossing to avoid measuring impacts due to local habitat modifications. Macroinvertebrates will be sampled using the ASCI methodology within each sampling reach (see AK SOP 001, Appendix B). Twenty benthic samples will be collected in a “D Net” (350 micron mesh). All available habitats will be sampled (i.e. stream bed, large woody debris, macrophytes) proportional to their occurrence. The net will be placed downstream from the habitat to be sampled and aquatic insects dislodged from the substrate by rubbing the surface. Dislodged insects will be transported by stream flow into the Net. The cod-end of the sampling net will be removed and the insects rinsed into a 5 gallon bucket. This process will be repeated until all twenty samples have been collected. The sample will be elutriated by stirring the bucket to separate macroinvertebrates from the inorganic substrate, transferred to a 500 ml nalgene bottle and preserved with 80% alcohol. The sample bottles are labeled to indicate sample date, location, field samplers.
ARRI February 2011 Investigation Plan Biotic Stormwater Assessment
4
Laboratory processing includes sub-sampling, sorting, and species identification. A subsample of 350 invertebrates will be obtained from each sample. The total sample is subdivided into 12 equal sub-sections. A Sub-section is selected randomly and all invertebrates within the sub-section is counted and rough sorted. Sub-sampling continues until all organisms from a sub-section result in 350 or more invertebrates being selected for identification. Invertebrates are identified to species level where possible. Macroinvertebrate metrics, richness, and diversity are calculated to determine the ASCI scores for each site. Individual metrics , as well as ASCI scores, will be used in regression analyses. ASCI metrics include Trichoptera tax; percent Ephemeroptera, Plecoptera, and Trichoptera; percent Diptera, percent collectors, Hilsenhoff Biotic Index, and percent scrapers and predators. Other metrics also may be investigated. Juvenile salmon and resident fish are sampled using baited minnow traps within the same sampling reaches as delineated for macroinvertebrates. Twenty minnow traps (1/4 inch mesh, 1 inch opening) are used at each sampling reach. . Traps are baited with salmon roe placed inside perforated whirl-pak bags suspended from the top of the trap. Traps are placed in eddies or pools at water depths cover the entire trap and with cover provided by an overhanging bank or woody debris. The traps are left in place for 18 to 24 hours. All fish within each trap are identified to species. All salmonids are measured to fork length and the first 50 salmonids are weighed. All captured fish will be released on site after being measured. Average catch per trap for total salmonids and each species and ratios of anadromous to resident fish are calculated and used as dependent variables in regression analyses. Habitat assessments and sediment sampling will be conducted concurrently. Habitat assessments will use the ASCI qualitative assessment methodology (see SOP 003, Appendix B). This methodology ranks physical habitat characteristics including riparian vegetation, undercut banks, percent fine sediment, pool/riffle ratio, and large woody debris. Sediment sampling will be conducted using Wolman pebble counts as modified by Bevenger and King (1995). Sediment size distribution is determined through the measurement of the diameter of 100 randomly selected particles within each sampling reach. The investigator walks up the channel diagonally from bank to bank. Every second step a particle of substrate is collected from under the toe of the right foot. The median diameter of this particle is measured and recorded. This process is continued as the investigator works his way through the sampling reach. The percentage of particles collected from pools and riffles is roughly the same percentage they occur as a function of the reach length. Data will be analyzed using simple regression with land use indices and compared with previous studies. Macroinvertebrate and fish sampling has been conducted approximately 6 to 10 years previously on Cottonwood Creek (Davis et al. 2006), and Wasilla Creek (Davis and Muhlberg 2002). Linear regression will be used to test for significant (alpha 0.05) relationships between the number of upstream road crossings (or impervious surface area if available) and ASCI scores

ARRI February 2011 Investigation Plan Biotic Stormwater Assessment
5
and fish independently. Macroinvertebrate density and individual metrics also will be used as dependent variables. Dependent variables for the fish community will be catch per unit trap (CPUT) for total salmonids, coho salmon, Chinook salmon, resident Dolly Varden and rainbow trout, and ratios of salmonids to stickleback and sculpin. Data from Cottonwood Creek and Meadow Creek will be combined due to similarities in stream physical characteristics (slope and substrate). Analyses will be run for all streams combined and for each stream individually. If there are significant relationships between land use and measures of the biotic community we will use data collected previously to determine changes over time. Similar regression equations will be developed using previous invertebrate and fish data and we will test for significant (alpha 0.05) differences in the slopes of the equations between current and previously collected data. Changes to the biotic community may be related to upstream development; however, the ultimate causes are potentially due to increased fine sediment, habitat modification, or changes in water chemistry. Correlation analyses will be used to identify the physical and chemical parameters that vary with differences in the biotic community. Stream chemical data will be obtained from an ongoing DEC funded project and will include measures of Cu, Pb, Zn, Cd, hydrocarbons, nutrients, pH, alkalinity, hardness, dissolved organics, and dissolved oxygen.
Schedule
March – May 2011. Complete investigation plan. Obtain fish sampling permit. Organize all field materials and supplies. May – June 2011. Conduct macroinvertebrate sampling. August – September, 2011. Conduct fish sampling. October – November 2011. Sort and identify macroinvertebrate samples; data entry and analyses. December, 2011 – January 2012. Final report.
References
Bevenger, G. S., and R. M. King. 1995. A pebble count procedure for assessing watershed cumulative effects. USDA Forest Service. Rocky Mountain Forest and Range Experiment Station. Fort Collins, CO. Research Paper RM-RP-319.

ARRI February 2011 Investigation Plan Biotic Stormwater Assessment
6
Brown, J., and B. Peake. 2006. Sources of heavy metals and polycyclic aromatic hydrocarbons in urban stormwater runoff. The Science of the Total Environment 359 (1-3) (-04-15): 145-55.
Davis, J. C., and G. A. Muhlberg. 2002. Wasilla Creek Stream Condition Evaluation. Alaska Department of Fish and Game, Habitat and Restoration Division, Technical Report No. 02-05. Anchorage, Alaska. 20p.
Davis, J.C., G.A. Davis, and L. Eldred. 2006. Cottonwood Creek Ecological Assessment. Aquatic Restoration and Research Institute. Final Report for the Alaska Department of Environmental Conservation. ACWA 06-02. Talkeetna, Alaska.
Gresens, S. 2007. Temporal and spatial responses of chironomidae (diptera) and other benthic invertebrates to urban stormwater runoff. Hydrobiologia 575 (1) (-01): 173-90
Han, Younghan. 2006. Characteristics of highway stormwater runoff. Water Environment Research 78 (12) (-11-01): 2377.
Major, E.B., and M.T. Barbour. 2001. Standard operating procedures for the Alaska Stream Contition Index: A modification of the U.S. EPA rapid bioassment protocols, 5th edition. Prepared for the Alaska Department of Environmental Conservation, Anchorage, Alaska.
Mallin, M. 2009. Comparative impacts of stormwater runoff on water quality of an urban, a suburban, and a rural stream. Environmental Monitoring and Assessment 159 (1-4) (-12-01): 475.
Paulsen, C.M., and T.R. Fisher. 2001. Statistical relationship between parr-to-smolt survival of Snake River spring-summer chinook salmon and indices of land use. Transactions of the American Fisheries Society 130:347-358.
Walsh, C. J. 2007. Riverine invertebrate assemblages are degraded more by catchment urbanization than by riparian deforestation. Freshwater Biology 52 (3) (-03): 574.
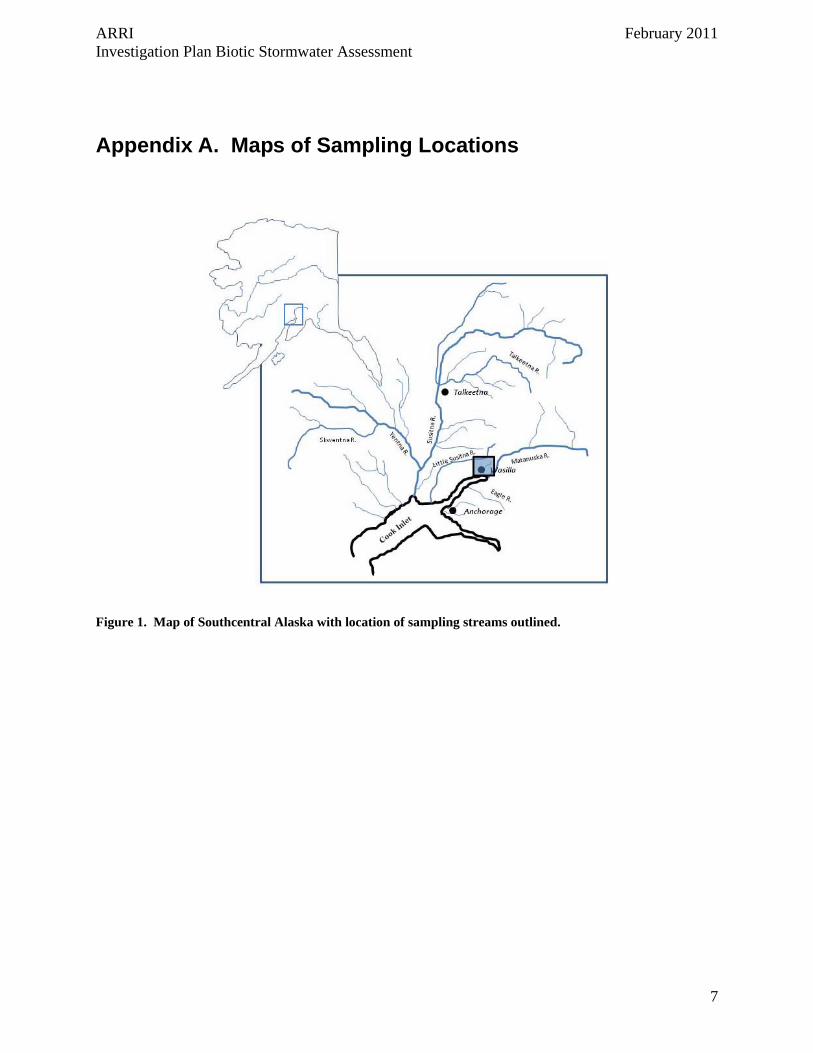
ARRI February 2011 Investigation Plan Biotic Stormwater Assessment
7
Appendix A. Maps of Sampling Locations
Figure 1. Map of Southcentral Alaska with location of sampling streams outlined.

ARRI February 2011 Investigation Plan Biotic Stormwater Assessment
8
Figure 2. Drawing of the Meadow Creek drainage showing proposed sampling locations.

ARRI February 2011 Investigation Plan Biotic Stormwater Assessment
9
Figure 3. Drawing of Cottonwood Creek drainage showing sampling locations.

ARRI February 2011 Investigation Plan Biotic Stormwater Assessment
10
Figure 4. Drawing of Wasilla Creek drainage showing locations of macroinvertebrate and fish sampling locations.

ARRI February 2011 Investigation Plan Biotic Stormwater Assessment
11
Appendix B. Alaska Standard Operating Procedures for ASCI