MATANUSKA-SUSITNA BOROUGH · A multi-mode questionnaire with both a mail and an online component...
68
Fish & Wildlife Commission Page 1 | February 21, 2019 MATANUSKA-SUSITNA BOROUGH 350 E Dahlia Ave., Palmer, Alaska 99645 FISH AND WILDLIFE COMMISSION AGENDA Lower Level Conference Room REGULAR MEETING 5 P.M. February 21, 2019 I. CALL TO ORDER; ROLL CALL II. APPROVAL OF AGENDA III. AUDIENCE INTRODUCTIONS IV. STAFF/AGENCY REPORTS & PRESENTATIONS a. Project Update: Economics of Sport Fishing – Lisa Bragg, Southwick & Associates b. Staff report V. ITEMS OF BUSINESS a. Presentation Opportunities i. Anchorage Municipality ii. Wasilla and Palmer Chambers of Commerce b. BOF Proposal Draft Review c. UCI Northern District King Salmon Management Proposals – Subcommittee Report d. BOF Mat-Su Field Trip VI. AUDIENCE PARTICIPATION (3 minutes per person at chair’s discretion) VII. MEMBER COMMENTS VIII. NEXT REGULAR MEETING – March 21 st IX. ADJOURNMENT CHAIRPERSON Mike Wood MSB STAFF Ted Eischeid BOARD MEMBERS Andy Couch Howard Delo Larry Engel Dan Mayfield Jim Sykes John Wood Exofficio: Bruce Knowles FWC Packet - February 21, 2019 1 of 68
Transcript of MATANUSKA-SUSITNA BOROUGH · A multi-mode questionnaire with both a mail and an online component...

Fish & Wildlife Commission Page 1 | February 21, 2019
MATANUSKA-SUSITNA BOROUGH 350 E Dahlia Ave., Palmer, Alaska 99645
FISH AND WILDLIFE COMMISSION
AGENDA
Lower Level Conference Room
REGULAR MEETING 5 P.M. February 21, 2019
I. CALL TO ORDER; ROLL CALL
II. APPROVAL OF AGENDA
III. AUDIENCE INTRODUCTIONS
IV. STAFF/AGENCY REPORTS & PRESENTATIONS
a. Project Update: Economics of Sport Fishing – Lisa Bragg, Southwick & Associates
b. Staff report
V. ITEMS OF BUSINESS
a. Presentation Opportunities
i. Anchorage Municipality
ii. Wasilla and Palmer Chambers of Commerce
b. BOF Proposal Draft Review
c. UCI Northern District King Salmon Management Proposals – Subcommittee Report
d. BOF Mat-Su Field Trip
VI. AUDIENCE PARTICIPATION (3 minutes per person at chair’s discretion)
VII. MEMBER COMMENTS
VIII. NEXT REGULAR MEETING – March 21st
IX. ADJOURNMENT
CHAIRPERSON Mike Wood MSB STAFF Ted Eischeid
BOARD MEMBERS Andy Couch
Howard Delo Larry Engel
Dan Mayfield Jim Sykes
John Wood Exofficio: Bruce Knowles
FWC Packet - February 21, 2019 1 of 68

FWC Packet - February 21, 2019 2 of 68

Staff Report 2.21.19
NPFMC-Cook Inlet Salmon Committee
Next meeting: March 6, 2019. 9 AM – 5 PM. Anchorage Hilton (tentative); agenda in development.
Dec 4th Committee Report and committee updates can be accessed here: https://www.npfmc.org/committees/cook-inlet-salmon-committee/
Southwick Project Update: Economic Contributions of Sportfishing on the Cook Inlet Region
Bri sent three documents out in the previous weeks for review. We will be receiving a presentation on this from Lisa Bragg, Southwick & Associates, today. Patty and Stefan have also been invited. I will need some direction on FWC on how to use these results moving forward.
FWC Packet - February 21, 2019 3 of 68

FWC Packet - February 21, 2019 4 of 68

Economic Contributions of Sportfishing on the Cook Inlet Region
PO Box 6435 ■ Fernandina Beach, FL 32035 ■ Office (904) 277-9765
FWC Packet - February 21, 2019 5 of 68

Executive Summary In 2017, anglers fished a total of 907,000 days in Alaska’s Cook Inlet region and spent $716.5 million on trip-related goods and services, pre-purchased packages, equipment and real estate used for fishing. An input-output model of the Cook Inlet region was used to estimate the total economic contributions that the spending created through the economic multiplier effect. As anglers’ dollars move from business to business in the Cook Inlet economy, the total effects of the spending generated $832.4 million in economic output and supported more than 6,300 jobs that provided $271.4 in household income. Although residents of Alaska spent roughly the same as non-residents ($358.5 million compared to $358.0 million), it was the resident spending that made a larger economic contribution (more jobs and income). This was the result of differences in the kinds of expenditures made by residents and non-residents. Resident anglers spent more of their money on equipment while non-residents spent most their money on trip-related purchases and pre-arranged packages that include services such as guides, lodging and meals produced by the region’s businesses.
Table E1. Summary of angler activity and economic contributions on the Cook Inlet region in 2017
Resident Anglers
Non-resident Anglers
All Anglers
Days fished*(thous.) 514.2 392.9 907.1
Angler purchases:
Trip-related (non-package) (millions) $46.2 $135.0 $181.2
Packages (millions) na $37.2 $37.2
Equipment (millions) $201.8 $54.0 $255.8
Real estate (millions) $110.6 $131.7 $242.3
Total retail sales (millions) $358.5 $358.0 $716.5
Total economic contributions, including multiplier effects:
Industry output (millions) $489.0 $343.4 $832.4
Labor income (millions) $158.8 $112.6 $271.4
Employment (thous.) 3.4 3.0 6.4
*Includes only those days reported fishing in the Cook Inlet region
FWC Packet - February 21, 2019 6 of 68
TABLE OF CONTENTS
Introduction ..................................................................................................................... 5
Methodology .................................................................................................................... 5
Research Objective ..................................................................................................... 5
Data Collection ............................................................................................................ 6
Angler Survey........................................................................................................... 6
Survey Method ......................................................................................................... 6
Seasonal Survey Waves .......................................................................................... 7
Questionnaire Design .................................................................................................. 7
Identifying the Cook Inlet region ............................................................................... 7
Online Questionnaire ............................................................................................. 10
Sampling Frame and Sample Sizes........................................................................... 10
Sample Frame........................................................................................................ 10
Sampling Procedures ............................................................................................. 10
Contact Protocol ..................................................................................................... 12
Data Analysis ................................................................................................................ 15
Trip Expenditures....................................................................................................... 15
Fishing Equipment Expenditures ............................................................................... 16
Real Estate Expenditures .......................................................................................... 17
Economic Modeling ................................................................................................... 17
Background and Metrics ........................................................................................ 17
Sportfishing Guides Survey .................................................................................... 20
Results .......................................................................................................................... 21
Angler Days ............................................................................................................... 21
Angler Spending ........................................................................................................ 22
Economic Contributions ............................................................................................. 26
Summary and Discussion .............................................................................................. 30
Detailed Results by Stratum ........................................ Error! Bookmark not defined.
Angler Survey Packages ............................................. Error! Bookmark not defined.
Sportfishing Guide Business Operation Survey ........... Error! Bookmark not defined.
FWC Packet - February 21, 2019 7 of 68

LIST OF TABLES Table 1. Expected proportion of responses by stratum ................................................ 11
Table 2. Sample distribution by survey mode (paper-based and email) and residency 12
Table 3. Angler survey timeline and highlights ............................................................. 13
Table 4. Angler survey respondents by demographics and license type ...................... 14
Table 5. Angler days by water type, guide usage, and residency (2017) ..................... 21
Table 6. Spending for sportfishing, by residency and expenditure category (2017) ..... 22
Table 7. Average sportfishing expenditures, by residency and category (2017) .......... 23
Table 8. Detailed sportfishing trip spending, by residency (2017) ................................ 24
Table 9. Detailed sportfishing equipment spending, by residency (2017) .................... 25
Table 10. Detailed sportfishing real estate spending, by residency (2017) .................. 26
Table 11. Economic contributions of all sportfishing spending by residency (2017) ..... 27
Table 12. Economic contributions of sportfishing trip and package spending by residency (2017) ......................................................................................... 27
Table 13. Economic contributions of sportfishing equipment and real estate spending by residency (2017) .................................................................................... 28
Table 14. Tax revenues generated from the economic contributions of sportfishing (2017) ......................................................................................................... 29
Table A 1. Number of survey respondents reporting fishing activity by strata ........ Error! Bookmark not defined.
Table A 2. Detailed sportfishing trip and package spending, by residency, guide use (2017) ........................................................... Error! Bookmark not defined.
Table A 3. Detailed sportfishing trip and package spending, by residency, guide use, and water type (2017) ................................... Error! Bookmark not defined.
Table A 4. IMPLAN sector assignments: Trip and guide spending Error! Bookmark not defined.
Table A 5. IMPLAN sector assignments: Equipment and real estate spending ..... Error! Bookmark not defined.
Table A 6. Sportfishing guide operations business survey results Error! Bookmark not defined.
Table A 7. Economic contributions of sportfishing trip and package spending by residency, guide usage (2017) ..................... Error! Bookmark not defined.
Table A 8. Economic contributions of sportfishing trip and package spending by residency, guide usage, and water type (2017) ........... Error! Bookmark not defined.
LIST OF FIGURES Figure 1. Detailed map of the Cook Inlet region provided in the survey .................................. 8
FWC Packet - February 21, 2019 8 of 68
Introduction The economic contributions of sportfishing to the economy of the Cook Inlet region is an important consideration for its natural resource managers. Earlier estimates of economic contributions associated with sportfishing are available for Alaska and for the region. For example, the U.S. Fish and Wildlife Service’s National Survey of Fishing, Hunting, and Wildlife-Associated Recreation (FHWAR) in 2011 provides estimates of angler spending at the state-level. These estimates, however, do not provide the level of detail to calculate the economic contributions at the regional level. A regional economic contribution study of sportfishing in Alaska was conducted by the Alaska Department of Fish & Game (ADF&G) and completed in 2008 with estimates for 2007 fishing activity. The Matanuska-Susitna Borough (MSB) used that study as a basis to do a more regionally specific study through the University of Alaska Anchorage, Institute of social and Economic Research (UAA-ISER) published in 2009. Estimates from these two regional projects are now roughly ten years old. In 2015, the Matanuska-Susitna Salmon Research, Monitoring & Evaluation Plan for Upper Cook Inlet (RM&E), identified current estimates of the economic contribution of sportfishing to the Cook Inlet region as a gap in available data. In 2017, the MSB contracted with Southwick Associates to develop updated estimates of the economic contribution of sportfishing to the regional economy using the same methods as the 2007 study. The project’s goal is to provide information to the MSB needed to develop, implement, and evaluate projects, policies and management strategies in ways that seek to optimize social and economic benefits to Alaskans. The project was designed to supplement traditional fisheries information on angler effort, catch, and harvest data collected by the ADF&G’s of Sport Fish Statewide Harvest Survey (SWHS). The ADF&G provided assistance to the project per a Memorandum of Agreement that included contact information for Alaska resident and non-resident anglers who purchased a sportfishing license, estimates from the Statewide Harvest Survey, contact information for sportfishing guides, and reviews of project plans and methodology.
Methodology
Research Objective
The primary purpose of this study is to quantify the economic contributions generated by resident and non-resident sportfishing activities in the Cook Inlet region of Alaska.1 Impacts are summarized for several strata: by residency (Alaska residents & non-resident visitors), chartered services (guided and unguided), and water type (freshwater and saltwater).
1 There is a distinction between the use of “on” versus “in” with respect to the economic contributions to the Cook Inlet region. Contributions from sportfishing “in” the Cook Inlet region includes only those anglers who fished within the region. Contributions from sportfishing “on” the Cook Inlet region included both those anglers who fished in the region as well as those anglers who did not fish in the region but did purchase items used for the purpose of sportfishing from businesses with the region.
FWC Packet - February 21, 2019 9 of 68

Additionally, a key requirement of the project was a set of results that can be directly compared the 2007 study. To that end, care was taken to ensure that the sampling procedures, survey approach, questionnaires and analysis used in this study were consistent with the 2007 study.
Data Collection
The study included two separate surveys. The first, and largest, survey was sent to anglers who purchased a 2017 Alaska fishing license. The purpose of this survey was to collect data for the Cook Inlet related to spending by anglers for fishing trips and equipment. A second survey of fishing charter boat operators was conducted as part of this project. The purpose of the business survey was to improve the accuracy of the economic models used to analyze spending on guided fishing trips.
Angler Survey
The data needed to produce economic contribution estimates of sportfishing on the Cook Inlet region include numbers of anglers, fishing effort and average expenditures. Number of anglers and days of fishing are available from the SWHS. Several sources are available that could provide angler expenditure profiles, such as the USFWS National Survey and previous economic studies of Alaska's sportfishing. They are, however, several years old, do not provide the requisite data at the regional level, and/or fail to capture the full range of expenditures made by Alaska’s anglers. To develop the necessary angler expenditure profiles, a detailed survey of Alaska resident and non-resident anglers was conducted.
Survey Method
The nature of the survey required survey participants to identify where they fished and where they spent money with respect to the Cook Inlet region. To achieve that, a detailed map was created to visually define the regional boundaries for respondents. This prevented the use of a telephone survey. A multi-mode questionnaire with both a mail and an online component was implemented for the angler survey. A portion of the anglers selected as part of the sample frame was contacted via mail and provided with a paper-based survey packet. These anglers were also given the option to the online questionnaire. The balance of the sample was sent an email message asking them to take part in the survey along with a clickable link to access the online questionnaire. The online questions, content and order of presentation was identical to the mail survey to ensure the data from both survey forms were compatible and could be combined prior to analysis. The detailed mail and online survey instruments are included in the Appendix.
FWC Packet - February 21, 2019 10 of 68

Seasonal Survey Waves
The angler expenditure survey was conducted in two waves. There are two major reasons to not use a single wave approach, such as an annual survey. First, seasonal variations in average trip expenditures, the amount spent by anglers, can vary depending on the time of year. For example, winter fisheries in many places are oriented towards ice fishing and a different mix of gear is required. Even during the summer fisheries, expenditures for early season Chinook fisheries are expected to differ from later season fisheries which range from river to lake fisheries for salmon, trout, grayling, and other species, to saltwater fishing for salmon, halibut and other groundfish. To capture these differences, anglers were asked to report their expenditures for a specific trip within defined time periods, which is expected to result in greater recall accuracy of the final expenditure estimates.
The second reason to conduct the survey in two waves was to reduce the influence of recall error in the reported spending values. An annual survey may force some anglers to report expenses for trips that occurred 12 or more months earlier. Research funded by the US Fish and Wildlife Service has shown that anglers can have significant difficulty recalling specific amounts spent a year earlier. This problem is more severe for items with lower prices and/or are purchased frequently such as terminal tackle, gasoline and other similar items. Sending two waves of surveys, each with recall periods shorter than annual recall, would help reduce recall error.
Wave I inquired about fishing activity and expenditures for trips taken January 1 through April 30, 2017 and May 1 through June 30, 2017. Only residents were included in the first wave as few non-residents typically fish in the winter months. The second survey wave inquired about fishing activity and expenditures for trips taken May 1 through October 31, 2017. Residents and non-residents were included. Separate resident and non-resident survey packets were produced. The detailed resident and non-resident survey instruments are included in the Appendix.
Questionnaire Design
Identifying the Cook Inlet region
The survey questionnaires mirrored those developed during the 2007 statewide research effort with revisions to focus activity and spending only on the Cook Inlet region. While there is probably some level of consensus among anglers of the general locations that make up the region, it is likely that some debate would occur about the specific boundaries of the region among a group of anglers. As a result, it was critical to clearly delineate the boundaries of the region and provide geographical detail to respondents in order to isolate activity and spending which occurred within the Cook Inlet region. Both the paper-based and online survey instrument provided a visual reference
FWC Packet - February 21, 2019 11 of 68
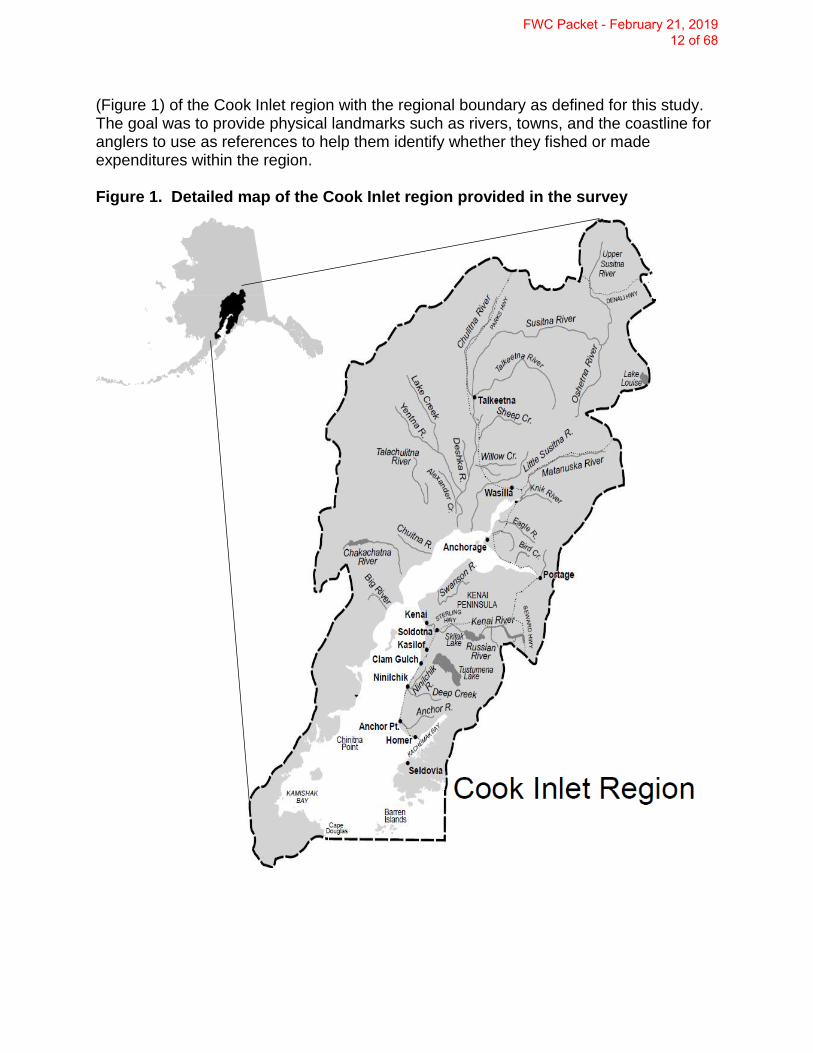
(Figure 1) of the Cook Inlet region with the regional boundary as defined for this study. The goal was to provide physical landmarks such as rivers, towns, and the coastline for anglers to use as references to help them identify whether they fished or made expenditures within the region.
Figure 1. Detailed map of the Cook Inlet region provided in the survey
FWC Packet - February 21, 2019 12 of 68

Survey Content
At the outset of the survey, each angler was asked several screening questions. Based on their responses to these questions, each angler was directed to a different section of the survey. The screener questions were used to identify anglers who a) actively fished in and purchased items used for sportfishing from the Cook Inlet region, b) actively purchased items used for sportfishing from but had not actively fish in the region, c) actively fished in but did not purchase items used for sportfishing from the region, and d) neither fished in nor purchased items used for sportfishing from the region. To estimate the economic contributions of sportfishing on the Cook Inlet region, it was important to capture spending by anglers who fit into the first three types (a, b, and c). The survey captured data from four main types of questions: a) the number of days fished in 2017, b) the type of sportfishing and expenditures made on the most recent trip within a 2017 season, c) equipment and real estate expenditures directly attributable to sportfishing made in 2017, and d) demographic information. A brief description of the question types is included below (the detailed surveys are available in the Appendix). Each angler was asked to reflect on their annual fishing activity in 2017 and report the total days for each survey time period (Jan 1-April 30, May 1-June 30, and July 1-October 31). These responses are critical to allocate total annual days from the SWHS to the season-specific spending profiles to develop annual expenditure profiles for each stratum. Anglers provided detailed travel-related expenditures made in the Cook Inlet region for their most recent trip within a specified time period and expenditures made for others in conjunction with items such as fuel, food, bait, and ice. Information specific to the type of trip was used to develop the trip-related spending profiles across the multiple strata (residency, guide usage, and water type) and to calculate the trip-related spending as a per fishing day metric.
Equipment used for sportfishing can be used in many trips and was not included in the ‘most recent trip’ questions. Equipment expenditures in the Cook Inlet region over the past 12 months was requested in both survey waves. For those items which can be used for other activities, respondents were asked about the percentage of time each equipment item was used for sportfishing, and only that percentage of the item’s cost was assigned to this project. Items such as rods & reels, tackle, camping equipment, and off-road vehicles were included in this section of the survey. Equipment and real estate spending profiles were developed on a ‘per-angler’ basis to match with the SWHS numbers of anglers.
Demographic information, such as age and gender, was collected and used to help ensure the results adequately represent the population of Alaska anglers. Where differences between the survey sample and the angler population exist, post-survey, proportional weights were created. Details about the representativeness of the sample is included in a later section.
FWC Packet - February 21, 2019 13 of 68

The survey instrument was also accompanied by a cover letter explaining the purpose of the survey and confidentiality steps. Southwick Associates letterhead was used for the cover letter and the MSB and ADF&G logos were included to reflect the collaborative effort. The use of the logos and the name recognition of the local agencies was expected to increase response rates to the survey.
Online Questionnaire
An online version of the survey instrument was developed and presented the same questions, wording, and order as the mail survey. In the cover letter to the mail group, survey recipients were offered the opportunity to take the survey online as a convenience that could potentially help boost response rates. The draft online survey was tested and made available for the MSB and ADF&G review prior to the mail survey’s first distribution. Each survey was assigned a code, used internally to track responses for the second and third round mailings. Survey respondents were asked to use this code to access the survey, preventing them from generating duplicate entries. This code also helped to prevent survey recipients from encouraging friends to take the survey which could bias the results.
Sampling Frame and Sample Sizes
Sample Frame
The 2017 ADF&G sportfishing license database was the sampling source. PIDs and DAVs were included in both survey waves.2 To prevent diluting the survey sample with individuals who may not have fished in 2017, only PIDS that applied for a license between 2013 and April 30, 2017 were included. According to the ADF&G, there were between 6,000 to 7,000 issued during any one year between 2013 and 2016. The angler survey was limited to licensed anglers only. Economic contributions are also generated from purchases made for and by unlicensed anglers (e.g., youth under 16 yrs. of age), however. To account for some youth-related purchases, licensed anglers were asked to include their expenditures made for themselves and others, which would include unlicensed youth anglers. As a result, a portion of expenditures made for youth travel and equipment are included in the final impact estimates. While this approach omits youth, who pay their own way, this step does capture a greater share of all sportfishing-related expenditures.
Sampling Procedures
A randomly selected stratified sample was drawn for each of the two survey waves. Only Alaskan residents were included in the sample for Wave I while both resident and
2 PID: Alaska residents 60 or older are not required to purchase sportfishing licenses but must apply for an ADF&G Permanent Identification Card (PID). These are lifetime hunting, fishing, and trapping licenses. These are valid for the remainder of the recipient’s life. It is assumed that those who apply for a PID in a given year are similar in terms of likelihood of going sportfishing as residents who purchase a license. DAV’s are Alaskan Disabled American Veteran permits.
FWC Packet - February 21, 2019 14 of 68
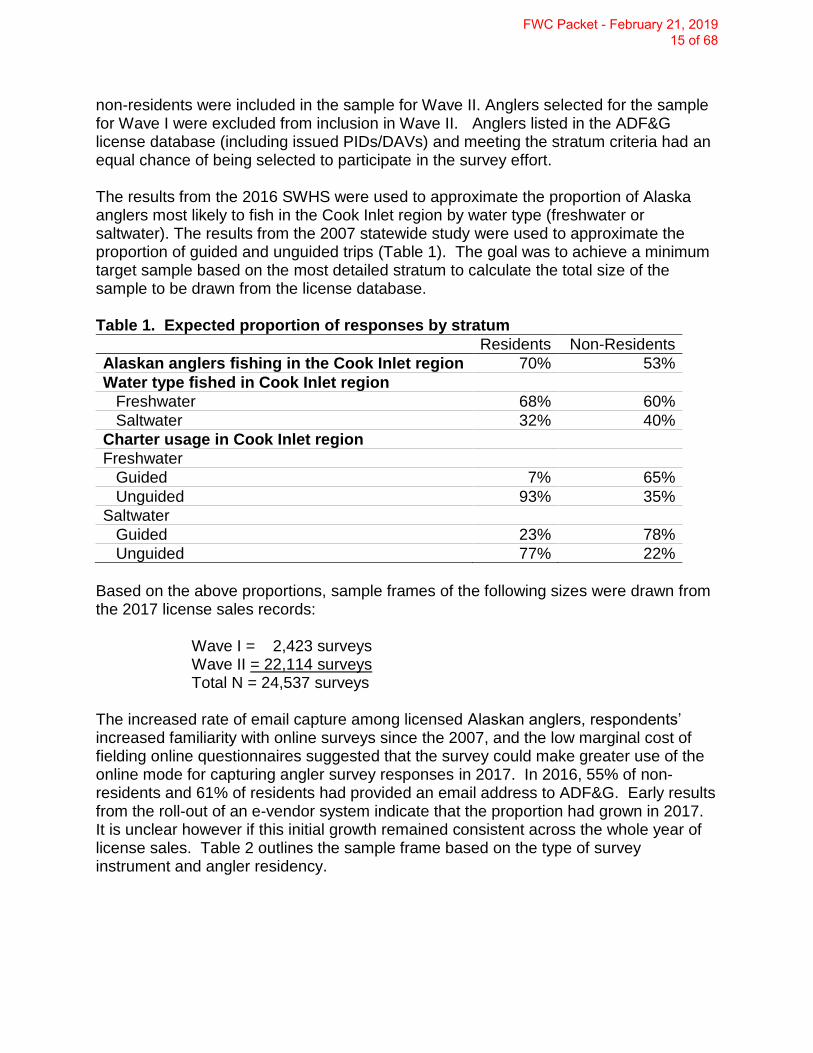
non-residents were included in the sample for Wave II. Anglers selected for the sample for Wave I were excluded from inclusion in Wave II. Anglers listed in the ADF&G license database (including issued PIDs/DAVs) and meeting the stratum criteria had an equal chance of being selected to participate in the survey effort. The results from the 2016 SWHS were used to approximate the proportion of Alaska anglers most likely to fish in the Cook Inlet region by water type (freshwater or saltwater). The results from the 2007 statewide study were used to approximate the proportion of guided and unguided trips (Table 1). The goal was to achieve a minimum target sample based on the most detailed stratum to calculate the total size of the sample to be drawn from the license database. Table 1. Expected proportion of responses by stratum
Residents Non-Residents
Alaskan anglers fishing in the Cook Inlet region 70% 53%
Water type fished in Cook Inlet region
Freshwater 68% 60%
Saltwater 32% 40%
Charter usage in Cook Inlet region
Freshwater
Guided 7% 65%
Unguided 93% 35%
Saltwater
Guided 23% 78%
Unguided 77% 22%
Based on the above proportions, sample frames of the following sizes were drawn from the 2017 license sales records:
Wave I = 2,423 surveys Wave II = 22,114 surveys Total N = 24,537 surveys The increased rate of email capture among licensed Alaskan anglers, respondents’ increased familiarity with online surveys since the 2007, and the low marginal cost of fielding online questionnaires suggested that the survey could make greater use of the online mode for capturing angler survey responses in 2017. In 2016, 55% of non-residents and 61% of residents had provided an email address to ADF&G. Early results from the roll-out of an e-vendor system indicate that the proportion had grown in 2017. It is unclear however if this initial growth remained consistent across the whole year of license sales. Table 2 outlines the sample frame based on the type of survey instrument and angler residency.
FWC Packet - February 21, 2019 15 of 68
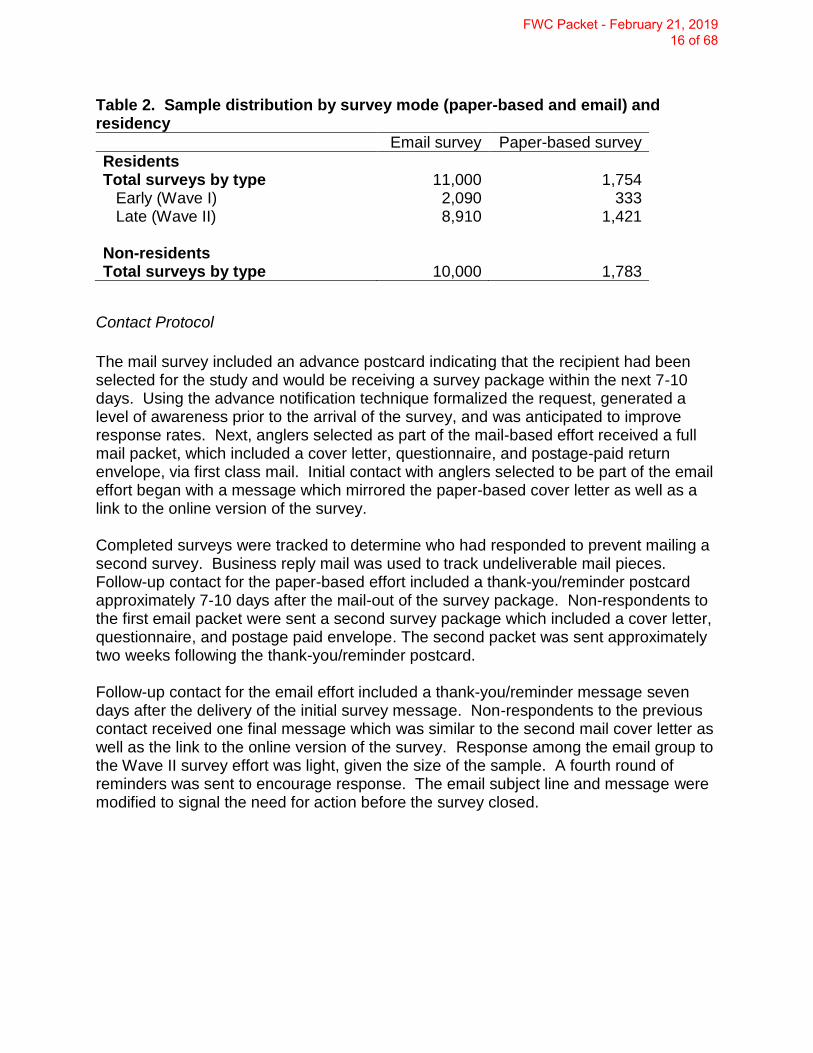
Table 2. Sample distribution by survey mode (paper-based and email) and residency
Email survey Paper-based survey
Residents Total surveys by type 11,000 1,754
Early (Wave I) 2,090 333 Late (Wave II) 8,910 1,421
Non-residents Total surveys by type 10,000 1,783
Contact Protocol
The mail survey included an advance postcard indicating that the recipient had been selected for the study and would be receiving a survey package within the next 7-10 days. Using the advance notification technique formalized the request, generated a level of awareness prior to the arrival of the survey, and was anticipated to improve response rates. Next, anglers selected as part of the mail-based effort received a full mail packet, which included a cover letter, questionnaire, and postage-paid return envelope, via first class mail. Initial contact with anglers selected to be part of the email effort began with a message which mirrored the paper-based cover letter as well as a link to the online version of the survey. Completed surveys were tracked to determine who had responded to prevent mailing a second survey. Business reply mail was used to track undeliverable mail pieces. Follow-up contact for the paper-based effort included a thank-you/reminder postcard approximately 7-10 days after the mail-out of the survey package. Non-respondents to the first email packet were sent a second survey package which included a cover letter, questionnaire, and postage paid envelope. The second packet was sent approximately two weeks following the thank-you/reminder postcard. Follow-up contact for the email effort included a thank-you/reminder message seven days after the delivery of the initial survey message. Non-respondents to the previous contact received one final message which was similar to the second mail cover letter as well as the link to the online version of the survey. Response among the email group to the Wave II survey effort was light, given the size of the sample. A fourth round of reminders was sent to encourage response. The email subject line and message were modified to signal the need for action before the survey closed.
FWC Packet - February 21, 2019 16 of 68
Table 3. Angler survey timeline and highlights WAVE I WAVE II
Dates that sample was pulled from ADF&G license database
June 2017 November 2017
Mailing mode Mail Email Mail Email
Sample size
334 2,029
3,204
17,780
Target sample Residents Residents & Non-residents
Time period covered by the survey
January 1 – June 30 May 1 – October 31
Advance message July 1,2017 na
December 15, 2017
na
First survey invitation August 4,
2017 August 16,
2017 December 29,
2017 January 10,
2018
Reminder message August 11,
2017 August 23,
2017 January 12,
2018 January 16,
2018
Second survey invitation August 25,
2018 August 30,
2017 January 30,
2018 January 29,
2018
Final survey invitation na na na February 5,
2018
Overall response rate 37% 15% 29% 8%
Note: Detailed response counts and proportions by stratum are reported in Appendix Table A1.
Sample Testing The survey generated complete responses from 2,763 resident and non-resident anglers who held an Alaska sportfishing license in 2017. The sample underwent rigorous testing in relation to the total population of Alaska’s licensed anglers. It was found to be representative of the population by residency. Within the non-resident group, the respondent sample has a higher proportion of males and older anglers relative to the non-resident angler population. Within the resident group, the respondent sample is older and proportionally more live in the Cook Inlet region.3
3 Region assignments are generated by linking the zip code of residency on file in the license database to the respective borough assignment using IMPLAN. Note that the Cook Inlet region is a sub-region of South Central.
FWC Packet - February 21, 2019 17 of 68

Table 4. Angler survey respondents by demographics and license type License database Survey panel
Residencya
Resident 49.3% 45.9%
Non-resident 50.7% 54.1%
Genderb
Residents
Male 62.6% 67.2%
Female 37.4% 32.8%
Non-residents
Male 75.1% 86.5%
Female 24.9% 13.5%
Age categoryc
Residents
35 years or younger 32.7% 16.7%
35-54 years 34.6% 33.7%
55-64 years 23.6% 37.4%
65 years or older 9.0% 12.3%
Non-residents
35 years or younger 24.2% 10.8%
35-54 years 32.5% 23.8%
55-64 years 23.3% 32.1%
65 years or older 20.0% 33.2%
License type group (Residents only)d
Sportfishing license 76.0% 75.5%
PID/DAV license holder 24.0% 24.5%
Region of residency (Residents only)e
Cook Inlet 65.9% 74.1%
Interior 17.1% 13.0%
South East 4.8% 9.6%
South Central (excluding Cook Inlet) 12.2% 3.2% aCalculated z-value = 3.1, p-value 0.002 bResident calculated z-value = 2.7, p-value = 0.007/Non-resident calculated z-value = 9.9, p-value = 0.00 cUsing the average ages: Resident calculated t-stat 12.7, p-value < 0.0001/Non-resident calculated t-stat = 16.5, p-value < 0.0001 dCalculated z-value = 0.4, p-value = 0.70 eCalculated z-value = 6.1, p-value = <0.0001
An imbalance in any of these characteristics has the potential to impact the average angler spending estimates. For example, older anglers might be more likely to have additional discretionary spending and time to fish. A post-stratification multivariate weighting adjustment was applied to balance our respondent sample with Alaska’s licensed angler population. Based on statistical tests (see notes below Table 4), the target variables included residency, gender, age, and region of home residence. An iterative rake weighting procedure available in SPSS was implemented to create proportional respondent weights. The weighted sample matches the angler populations in each of the demographic metrics.
FWC Packet - February 21, 2019 18 of 68

There is the possibility that the respondent sample are systematically different from the group of licensed anglers who opted to not respond (also known as nonresponse bias). Extrapolating data from a biased sample will not produce results that accurately reflect the population. Comparison of the responses provided by anglers who completed their surveys shortly after the earliest contact to responses provided by anglers who completed their surveys after the final contact was the approach used to test for the presence of nonresponse bias. Two metrics which have a direct effect on the spending estimates to be developed (per day trip spending and annual days by water type) were tested for nonresponse bias. Specifically, the calculated average of each metric among anglers reporting early relative to the later responders was tested for statistically significant differences for both residents and non-residents. The results suggest that there was no evidence of nonresponse bias in the survey.4
Data Analysis Sportfishing expenditures were split into three main categories: trip spending, equipment spending, and real estate spending. Trip spending was further broken apart into non-package and package (or pre-bundled expedition) spending.
Trip Expenditures
Development of the trip spending estimates was the most involved due to the application of adjustments for seasonality of spending as well as the likelihood of the trip to occur. Spending profiles were defined for three main seasons: winter (January through April), spring (May through June), and fall (July through October). The analysis assumes that trip spending among residents for trips taken in November through December is similar to spending for winter trips. Some fishing trips would have occurred even if there was not an opportunity to fish. To count only trip spending associated with fishing, respondents were asked to indicate the likelihood that a trip would have occurred if they were not able to fish. Ordinal response categories were then used to capture trip and expenditure expenditures on a proportional basis. Only spending on items directly related to fishing (i.e. bait, rentals, processing) were included in the trip spending profiles of anglers who indicated they definitely would have taken the trip even if they were not able to fish. An increasing proportion of ancillary spending was applied to the spending profile as their response shifted from “definitely yes, the trip would have occurred” to “definitely no, the trip would
4 T-tests for equality of average angler days (proxy for avidity) between early and late responders by stratum: Non-resident saltwater anglers t-value = 0.85, p-value = 0.39. Non-resident freshwater anglers t-value = 1.22, p-value = 0.22. Resident saltwater anglers t-value = 0.66, p-value = 0.52. Resident freshwater anglers t-value = 0.65, p-value = 0.52. T-tests for equality of average per fishing day spending by season between early and late responders by stratum: Non-resident early season trips t-value = -0.38, p-value = 0.70. Non-resident late season trips t-value = -0.75, p-value = 0.46. Resident early season trips t-value = 0.71, p-value = 0.48. Resident late season trips t-value = -0.94, p-value = 0.35.
FWC Packet - February 21, 2019 19 of 68

not have occurred”. Among anglers who indicated they definitely would not have taken the trip if they were not able to fish, all spending items were included in the trip spending profiles. Package spending refers specifically to pre-bundled spending made in advance of the fishing trip to the Cook Inlet region. As in the 2007 study, it was assumed that packages were purchased primarily by non-residents. Anglers were asked to report package spending as a lump sum and to indicate the types of goods and services included in the package. Using data from those anglers who did not purchase a package trip, the lump sum was apportion across the set of goods and services categories specific to each respondent’s package. Separate trip and package spending profiles were developed for residents and non-residents, guided and unguided trips, freshwater and saltwater and calculated as a per-fishing day measure. Trips were allocated to each stratum based on survey responses, defining the trip as either salt or fresh water and either guided or unguided. The per fishing day measure was multiplied by total days fished in the Cook Inlet region as reported in the SWHS to generate the regionwide total trip and package spending estimates.
Fishing Equipment Expenditures
Given the geographical focus, we asked anglers to only report spending on items purchased from within the Cook Inlet region. Two groups of equipment items were included within fishing equipment expenditures. First there are those items that are used exclusively for fishing (rods & reels, tackle, etc.). For this group of items, 100% of the reported spending was allocated to the equipment spending profile. The second group includes items that can be used for fishing as well as other activities (boats, coolers, apparel, etc.). For this group, responds were asked to report the percentage of the items use that was specifically for fishing. The reported spending was then adjusted by the percent the item was used for sportfishing. In the case where the stated percent was missing, the average percentage for that item was applied. The Cook Inlet Region is home to major retail outlets and there are likely many anglers who purchase equipment from businesses within the region but do no fish within the region. Spending for fishing and fishing-related equipment was calculated based on all observations, thereby generating an average per-angler spending measure across all Alaska anglers. Separate estimates were calculated for resident and non-resident anglers. Total fishing and fishing-related equipment spending in the Cook Inlet Region was estimated by multiplying the total number of licensed anglers by the average spending per angler, by residency.
FWC Packet - February 21, 2019 20 of 68

Real Estate Expenditures
The fishing-related real estate category captures spending in 2017 on the purchase or lease of existing structures, on-site construction or maintenance of structures, and purchases of structures constructed off-site, each used primarily for sportfishing. Similar to equipment spending, real estate expenditures were also calculated based on all observations, thereby generating an average amount spent per angler. Separate estimates were calculated for resident and non-resident anglers. Average real estate spending was multiplied by the total number of licensed anglers, by residency, to estimate total spending. For the purpose of this analysis, 100% of the reported real estate construction and maintenance spending was included in the angler spending profiles. Purchases of existing structures or land are mostly a transfer of assets and generate little economic contributions except for the fees paid to real estate agents, leasing agents and financial institutions. Appropriate adjustments were applied to total annual spending on real estate prior to the IMPLAN modeling to isolate only the portion of the spending that generates economic activity.
Economic Modeling
Background and Metrics
The economic contributions of fishing-related spending on the Cook Inlet region are measured with an input-output model of the regional economy and IMPLAN Pro© impact analysis software. Input-output models are driven by some change in economic activity, usually spending (also known as the direct effect). The direct effect refers to the initial stimulus to the economy. In this study, it refers specifically to the dollars spent by anglers for trip-related purchases, fishing equipment, and other spending that is immediately attributable to their fishing activity. In the strictest sense, the direct effect does not always equate with angler spending due to economic leakages. Because some of the equipment purchased by anglers is manufactured outside of the region, some of the dollars spent by anglers in the Cook Inlet leak immediately beyond the region’s borders and do not have a direct effect on the regional economy. In that case, angler spending may not equal direct effect in the language of input-output models. In other cases, the amount of angler spending is the direct effect. For example, spending for lodging and restaurant meals represents purchases of goods and services that are produced entirely where they are bought, and the entire purchase is captured in the direct effect on the regional economy. The average trip-related expenditures per fishing-day and total angler-days of fishing effort in the Cook Inlet region, as provided by ADF&G in the 2017 SWHS, formed the
FWC Packet - February 21, 2019 21 of 68

basis for the estimate of total trip and package sportfishing spending in Alaska’s Cook Inlet region by all anglers in 2017. The average equipment and real estate expenditures per angler and total licensed anglers as reported by the 2017 SHWS defined the balance of estimated total sportfishing spending in the region. The total estimated spending for trip-related and durable equipment items were organized into categories and mapped to specific industry sectors in the IMPLAN input-output model. The total economic contributions of sportfishing on the Cook Inlet region are based on the spending described above plus the multiplier effect of that spending. The input-output model produces estimates of the total multiplier effects (indirect and induced) that arise from the spending by anglers (the direct effect). Indirect effect refers to the economic activity (e.g., output, employment, income) in the businesses that supply the industries stimulated by the direct effect. Those indirectly affected industries, in turn, stimulate additional activity among their local suppliers, and so on. For example, if an angler spent $100 to purchase the services of a guide, the guide uses a portion of the $100 paid by the angler to purchase boat fuel, equipment, bait, utilities, etc. from local sources. In addition, a portion of the $100 pays for goods and services from out-of-state providers. In the next round, the in-state business that supplies bait to the guide (as well as all of the other in-state businesses that supply goods and services to the guide), in turn, must use part of the money that it receives from the guide to pay its own business expenses (e.g., fuel, gear, utilities). Their suppliers, in turn, also pay in-state and out-of-state suppliers to support their increased business activity. This indirect activity continues in this way until the effect becomes negligible as a portion of each round of payments for goods and services eventually leaks out of the local economy. The induced effect measures the economic activity that results from the household spending of salaries and wages that were generated from the business activity associated with the direct and indirect effects. The interpretation of the results of the economic models depends on the changes that drive the model. The term “economic impact” is normally reserved to describe some level of economic activity that would not occur except for the initial economic activity. In the case of recreational activities like sportfishing, it is generally agreed that economic impact comes from spending by visitors to the region. If not for their presence, their spending would never occur. If quality sportfishing was no longer available in the Cook Inlet, for example, non-resident anglers may choose to fish elsewhere, and their spending would not occur in the region and thus not generate additional economic effects in the regional economy. Most resident anglers, on the other hand, choose fishing as an activity on which to spend their recreational dollars locally. If quality sportfishing was no longer available some residents would likely choose some other local recreational activity on which to spend their money in place of fishing and their spending would remain in the regional economy.
FWC Packet - February 21, 2019 22 of 68

It is generally acknowledged that retained economic activity can also represent a real economic impact. For example, the quality of fishing opportunities in the Cook Inlet is such that some anglers choose to fish in Alaska rather than go elsewhere. If the quality of fishing were to decline, then some dedicated resident anglers may choose to travel outside of the region for sportfishing and their dollars would be lost to the Cook Inlet economy. It is unclear what portion of resident anglers would fall into that category. In another retention scenario, it may be the case in the Cook Inlet that there are few recreational alternatives to fishing, so that if the quality of fishing as a recreational activity declined, some portion of anglers may choose to travel outside of the state to pursue an alternative recreational activity (e.g., a Caribbean vacation). It was beyond the scope of this study to investigate either of those scenarios. The focus of this study was on the total economic activity associated with sportfishing as a measure of its overall contribution to the region’s economy. In that case, it was appropriate to include all spending for sportfishing, including both resident and non-resident anglers. That measure is alternately called “economic contribution” or “economic significance”, among others. This study was concerned with measuring the economic significance of sportfishing and therefore includes resident spending as part of the direct effect. To help understand the relative contributions that residents and non-residents make to the economy, results in this report were broken out separately by residency. Separate models, based on residency, guide usage, and water type, were created to estimate the associated contributions of sportfishing. The IMPLAN regional models were based on 2016 economic data. Deflators included within the modeling software were employed to account for inflation effects between the model year data (2016) and the year of reported angler expenditures (2017). IMPLAN economic Data are available for each of the boroughs in Alaska and can be combined to create custom analysis regions. The Cook Inlet economic model consists of the Anchorage, Kenai and Matanuska-Susitna boroughs. Economic activity can be measured in several different ways. The most common way to portray how expenditures on sportfishing affect the economy include the following metrics. These descriptions explicitly include the multiplier effects of angler spending.
Retail Sales – These include expenditures made by anglers for equipment, travel expenses and services related to their sportfishing activities over the course of the year. These combined initial retail sales are the stimulus that trigger the multiplier effects in the regional economy.
Output – This measure reports the volume of economic activity within the local economy that is related to sportfishing. Because it does not discount the value of raw materials as they move through the production of goods or services, this measure double-counts a portion of the output of the industries in the value chain.
Labor Income – This figure reports the total salaries and wages paid in all sectors of the regional economy as a result of sportfishing activities. These
FWC Packet - February 21, 2019 23 of 68
are not just the paychecks of those employees directly serving anglers or manufacturing their goods, it also includes portions of the paychecks of all employees affected by the direct, indirect and induced effects. For example, it would include a portion of the dollars earned by the truck driver who delivers food to the restaurants serving anglers and the accountants who manage the books for companies down the supply chain, etc.
Employment – Much like Labor Income, this figure reports the total jobs in all sectors of the economy as a result of the sportfishing activity and includes both full-time and part-time jobs. These are not just the employees directly serving anglers or manufacturing their goods but can also include employees of industries impacted by the direct, indirect and induced effects.
Federal, State, and Local Tax Revenues – Including all forms of personal, business and excise taxes, the IMPLAN model estimates the tax revenues collected by the local, state and federal governments as a result of the initial expenditures by anglers.5
Sportfishing Guides Survey
The base IMPLAN model includes 536 nationally classified economic sectors, or industries. To the extent that a local industry operates differently from the national model’s base assumptions, adjustments can be made to the IMPLAN models to reflect the unique local practices. A sportfishing guide operations survey was completed during the 2007 research effort in order to produce model results that more accurately reflected the nature of their industry. In the absence of any structural change within the industry signaling the need to update the economic models, it would be reasonable to rely on those models for this effort. Discussions with ADF&G in 2017 suggest some change within the structure of industry necessitated an updated business survey. Therefore, a business survey of guide businesses was repeated to determine how and where they receive and spend their business revenues in 2017. The survey instrument itself was built to mirror the survey implemented for the statewide research effort in 2007 and to capture current business practices. ADF&G provided the list of licensed sportfishing guides who operate in the Cook Inlet region’s fresh and salt water. Email capture among this sportfishing business group was 83%. The business survey was conducted via email and all guides with emails on record were asked to participate in the survey effort. Three rounds of email invitations were sent (Feb. 22nd, March 1st, and March 8th of 2018). The emails included a message
5 Tax revenue estimates from the IMPLAN model are based on actual total collections from industry but at a more aggregated sector level. These values are then apportioned to specific industries and local levels using Bureau of Economic Analysis and Annual Survey of Government Finances data. This approach can cause estimated collections realized at a more localized level to deviate from the model estimates.
FWC Packet - February 21, 2019 24 of 68

explaining the purpose of the survey and a promise of confidentiality along with a clickable link to the survey. A response rate of 26% was achieved. Two key vectors were utilized in the modification of the IMPLAN model: 1) the percent that each category of business expense represents of the respondent’s total business expenses (i.e., the production function); and, 2) the percent of each business expense category that the respondent purchased in the Cook Inlet region. Detailed results for the vectors are included in the Appendix Table A6. Summary data analysis checks were employed to check for errors. For the first response vector, the sum of responses should add to 100%. In several surveys, the sum of responses did not total 100% and the individual response categories were adjusted to force the sum to equal 100% under the following rule. If the sum of the response categories was less than 90% or more than 110% then the survey was discarded as unusable. If the sum fell within that range but was not equal to 100%, each category response was proportionally adjusted to force the sum to equal 100%. For the second response vector, no single response should exceed 100%.
Results
Angler Days
Anglers spent 907,000 days sportfishing in the Cook Inlet region in 2017 (Table 5). Alaska residents accounted for the majority of days fished (57% or 514,000) while non-residents fished 393,000 days (43%). Eighty-two percent of all sportfishing days were unguided. While there are more freshwater angler days, saltwater fishing days have a higher proportion of guided days (37.0%) relative to freshwater days (13.3%). Non-resident anglers are more likely to have taken a guided fishing trip (34.3%) relative to residents (6.0%), regardless of water types. Table 5. Angler days by water type, guide usage, and residency (2017) Resident Non-resident All Anglers
Angler-
Days (thous.)
% Angler-
Days (thous.)
% Angler-
Days (thous.)
%
Freshwater
Guided 18.1 4.4% 77.5 25.4% 95.6 13.3% Unguided 395.7 95.6% 227.1 74.6% 622.8 86.7%
Total 413.8 100.0% 304.6 100.0% 718.4 100.0% Saltwater
Guided 12.7 12.7% 57.2 64.7% 69.9 37.0%
Unguided 87.7 87.3% 31.1 35.3% 118.8 63.0%
Total 100.4 100.0% 88.3 100.0% 188.7 100.0% Total Guided 30.8 6.0% 134.7 34.3% 165.5 18.2% Total Unguided 483.4 94.0% 258.2 65.7% 741.6 81.8%
TOTAL 514.2 100.0% 392.9 100.0% 907.1 100.0% Source: 2017 Statewide Harvest Survey, Alaska Department of Fish and Game
FWC Packet - February 21, 2019 25 of 68
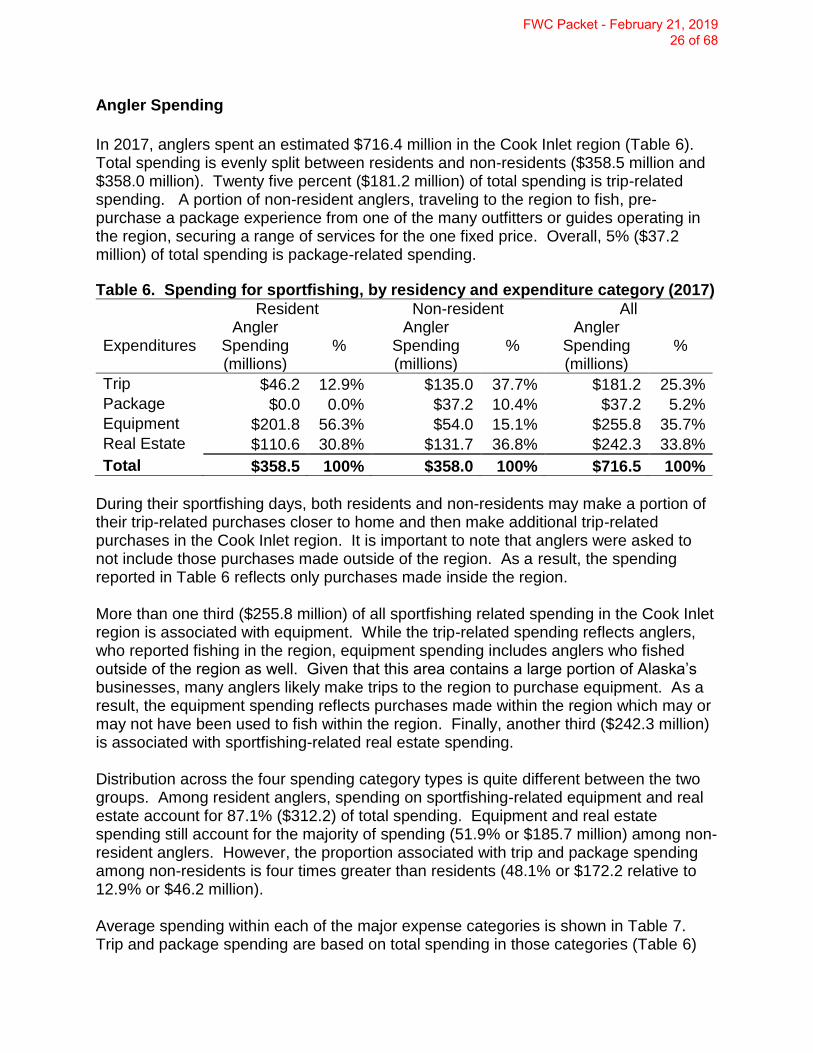
Angler Spending
In 2017, anglers spent an estimated $716.4 million in the Cook Inlet region (Table 6). Total spending is evenly split between residents and non-residents ($358.5 million and $358.0 million). Twenty five percent ($181.2 million) of total spending is trip-related spending. A portion of non-resident anglers, traveling to the region to fish, pre-purchase a package experience from one of the many outfitters or guides operating in the region, securing a range of services for the one fixed price. Overall, 5% ($37.2 million) of total spending is package-related spending.
Table 6. Spending for sportfishing, by residency and expenditure category (2017) Resident Non-resident All
Expenditures Angler
Spending (millions)
% Angler
Spending (millions)
% Angler
Spending (millions)
%
Trip $46.2 12.9% $135.0 37.7% $181.2 25.3%
Package $0.0 0.0% $37.2 10.4% $37.2 5.2%
Equipment $201.8 56.3% $54.0 15.1% $255.8 35.7%
Real Estate $110.6 30.8% $131.7 36.8% $242.3 33.8%
Total $358.5 100% $358.0 100% $716.5 100%
During their sportfishing days, both residents and non-residents may make a portion of their trip-related purchases closer to home and then make additional trip-related purchases in the Cook Inlet region. It is important to note that anglers were asked to not include those purchases made outside of the region. As a result, the spending reported in Table 6 reflects only purchases made inside the region. More than one third ($255.8 million) of all sportfishing related spending in the Cook Inlet region is associated with equipment. While the trip-related spending reflects anglers, who reported fishing in the region, equipment spending includes anglers who fished outside of the region as well. Given that this area contains a large portion of Alaska’s businesses, many anglers likely make trips to the region to purchase equipment. As a result, the equipment spending reflects purchases made within the region which may or may not have been used to fish within the region. Finally, another third ($242.3 million) is associated with sportfishing-related real estate spending. Distribution across the four spending category types is quite different between the two groups. Among resident anglers, spending on sportfishing-related equipment and real estate account for 87.1% ($312.2) of total spending. Equipment and real estate spending still account for the majority of spending (51.9% or $185.7 million) among non-resident anglers. However, the proportion associated with trip and package spending among non-residents is four times greater than residents (48.1% or $172.2 relative to 12.9% or $46.2 million). Average spending within each of the major expense categories is shown in Table 7. Trip and package spending are based on total spending in those categories (Table 6)
FWC Packet - February 21, 2019 26 of 68
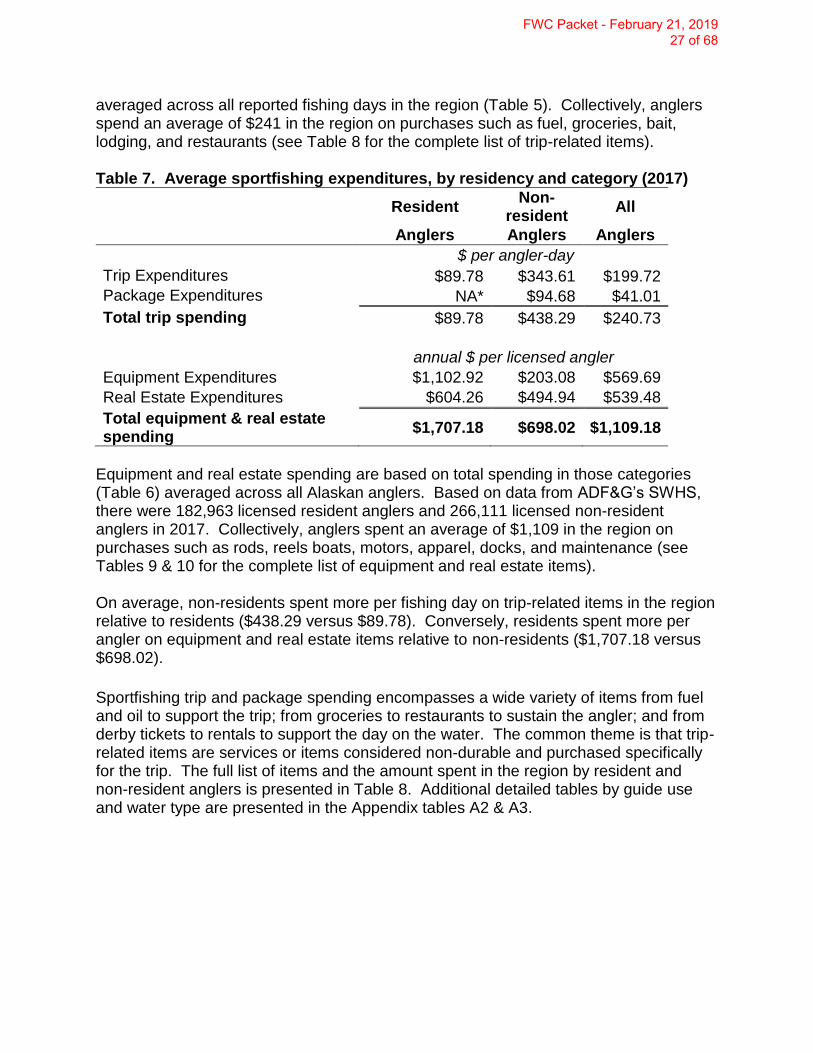
averaged across all reported fishing days in the region (Table 5). Collectively, anglers spend an average of $241 in the region on purchases such as fuel, groceries, bait, lodging, and restaurants (see Table 8 for the complete list of trip-related items). Table 7. Average sportfishing expenditures, by residency and category (2017)
Resident Non-
resident All
Anglers Anglers Anglers $ per angler-day
Trip Expenditures $89.78 $343.61 $199.72
Package Expenditures NA* $94.68 $41.01
Total trip spending $89.78 $438.29 $240.73
annual $ per licensed angler
Equipment Expenditures $1,102.92 $203.08 $569.69
Real Estate Expenditures $604.26 $494.94 $539.48
Total equipment & real estate spending
$1,707.18 $698.02 $1,109.18
Equipment and real estate spending are based on total spending in those categories (Table 6) averaged across all Alaskan anglers. Based on data from ADF&G’s SWHS, there were 182,963 licensed resident anglers and 266,111 licensed non-resident anglers in 2017. Collectively, anglers spent an average of $1,109 in the region on purchases such as rods, reels boats, motors, apparel, docks, and maintenance (see Tables 9 & 10 for the complete list of equipment and real estate items). On average, non-residents spent more per fishing day on trip-related items in the region relative to residents ($438.29 versus $89.78). Conversely, residents spent more per angler on equipment and real estate items relative to non-residents ($1,707.18 versus $698.02).
Sportfishing trip and package spending encompasses a wide variety of items from fuel and oil to support the trip; from groceries to restaurants to sustain the angler; and from derby tickets to rentals to support the day on the water. The common theme is that trip-related items are services or items considered non-durable and purchased specifically for the trip. The full list of items and the amount spent in the region by resident and non-resident anglers is presented in Table 8. Additional detailed tables by guide use and water type are presented in the Appendix tables A2 & A3.
FWC Packet - February 21, 2019 27 of 68

Table 8. Detailed sportfishing trip spending, by residency (2017)
Resident Anglers
Non-resident Anglers
All Anglers
Trip Expenditures (millions)
Fuel and oil for transportation $13.7 $7.8 $21.5
Guide and charter fees $6.1 $37.8 $43.9
Air travel $0.4 $28.0 $28.4
Transportation services $0.6 $3.1 $3.7
Boat launch & dockage fees $2.9 $0.8 $3.7
Ice $0.8 $0.5 $1.3
Bait $1.3 $0.9 $2.1
Groceries $8.1 $7.7 $15.8
Restaurants $5.2 $7.5 $12.7
Heating & cooking fuel $0.4 $0.2 $0.6
Fish processing $1.5 $11.0 $12.6
Rentals $0.7 $7.8 $8.5
Overnight accommodations $3.8 $17.2 $21.0
Derby $0.1 $0.2 $0.3
Souvenirs & gifts $0.3 $3.4 $3.7
Other entertainment expenses $0.2 $0.6 $0.9
Other $0.1 $0.5 $0.6
Sub-Total (millions) $46.2 $135.0 $181.2
Package Expenditures (millions) na $37.2 $37.2
Total Trip & Package (millions) $46.2 $172.2 $218.4
Sportfishing equipment spending encompasses a similarly diverse list of items from rods and tackle (specific to sportfishing) to boats and apparel (which can be used for multiple purposes). In contrast to trip or package related items, equipment items are durable in nature and typically used for more than one trip. Table 9 presents the full list of items and total spending in the region by resident and non-resident anglers.
FWC Packet - February 21, 2019 28 of 68

Table 9. Detailed sportfishing equipment spending, by residency (2017) Resident
Anglers Non-resident
Anglers All
Anglers
Equipment expenditures (millions)
License and stamps $3.8 $12.2 $16.0
Rods, reels, and components $11.6 $6.2 $17.8
Fishing tackle $6.7 $4.1 $10.8
Tackle boxes or cases $1.1 $0.5 $1.7
Electronics $3.9 $1.0 $5.0
Nets $2.3 $0.5 $2.9
Miscellaneous fishing equipment $2.6 $1.5 $4.1
Shellfish equipment $0.4 $0.1 $0.5
Taxidermy $1.5 $0.9 $2.4
Books and magazines $0.4 $0.3 $0.7
Items to store/preserve fish $4.0 $1.8 $5.9
Coolers, fish boxes $2.0 $2.1 $4.1
Clothing $3.7 $3.3 $7.0
Boots, shoes, waders $4.9 $2.4 $7.3
Life jackets $1.0 $0.1 $1.1
Boats, canoes, rafts, etc. $21.5 $0.8 $22.3
Boat motors $15.4 $0.1 $15.6
Trailers, hitches $2.5 $0.1 $2.7
Bear spray, bug spray, sun screen $0.7 $0.7 $1.4
Firearms $4.7 $1.2 $5.8
Cameras, binoculars, sunglasses $2.2 $0.9 $3.2
Tents, screen rooms, tarps, backpacks, sleeping bags $2.1 $0.5 $2.5
Camping trailer $9.6 $1.1 $10.7
Other camping equipment $2.1 $0.3 $2.4
Vehicles $65.6 $4.9 $70.4
Airplanes and related equipment $0.4 $1.1 $1.5
ATVs, snow machines $13.2 $1.1 $14.3
Boat/camper registrations and excise taxes $1.1 $0.1 $1.2
Vehicle, boat, or airplane repair/maintenance $10.1 $3.3 $13.4
Other $0.4 $0.9 $1.3
Total (millions) $201.8 $54.0 $255.8
The reported dollar figures reflect total spending on fishing equipment and only that portion of multi-use equipment items anglers report was used specifically for the purpose of sportfishing. Resident purchases amount to $201.8 million, accounting for 79% of total sportfishing equipment. Non-resident purchases amount to $54.0 million, accounting for 21% of equipment spending.
FWC Packet - February 21, 2019 29 of 68

Annual real estate spending estimates are presented in Table 10. The real estate category captures spending in 2017 on the purchase or lease of existing structures, on-site construction or maintenance of structures, and purchases of structures constructed off-site. Spending by non-residents sums to $131.7 million, the majority (54%) of the total spending in this category. Almost the entirety (98%) is associated with purchases or leases of land and existing houses. Despite the sizable amount of spending, only a portion generates economic activity primarily in the real estate and finance sectors. Residents spend $110.6 million, slightly less than non-residents. Sixty-eight percent of their spending is associated with on-site construction and repair as well as the purchase of structures built off-site. Table 10. Detailed sportfishing real estate spending, by residency (2017) Resident
Anglers Non-resident
Anglers All
Anglers
Real Estate Expenditures (millions)
Purchases of lots, existing houses and cabins, and/or land $34.1 $116.4 $150.5
Leases of land, cabins, boat slips, and storage $1.4 $12.0 $13.4
Construction of houses and cabins, and repair or maintenance expenses $69.4 $2.6 $72.0
Purchase or construction of boat docks, sheds, or outbuildings $5.7 $0.6 $6.4
Total (millions) $110.6 $131.7 $242.3
Economic Contributions
The angler spending discussed in the previous section, known as the direct effects, cycles through the regional economy generating additional rounds of economic activity. These extra rounds include indirect effects driven by businesses who provide supporting services and goods to anglers as well as induced effects resulting from household spending by employees of these businesses, known together as the multiplier effects. The three effects as a collective comprise the total economic contribution effects. The IMPLAN model is used to track the flow of these multiple rounds of spending.
Anglers spent an estimated $716.5 million across all expenditure categories (Table 6). After adjustments to isolate the portion of spending that actually generated economic activity within the region, the direct contribution to the region’s economic output is $491.6 million (Table 11). That activity supported more than 4,235 full and part-time jobs and $159.2 million in household income. Spurred by the initial spending of anglers, the economic output attributable to the supporting industries, or multiplier effect, is $340.8 million. The indirect and induced activity supported 2,143 jobs and $112.2 million in household income. Together, the
FWC Packet - February 21, 2019 30 of 68

total effects of the spending activity generated $832.4 million in economic output and supported more than 6,300 jobs that provided $271.4 in household income. Table 11. Economic contributions of all sportfishing spending by residency (2017) Resident Non-resident All
Anglers Anglers Anglers
Direct effect Output (millions) $299.7 $191.9 $491.6
Labor Income (millions) $96.2 $63.0 $159.2
Employment (thous.) 2.2 2.0 4.2
Multiplier effects
Output (millions) $189.3 $151.5 $340.8
Labor Income (millions) $62.6 $49.6 $112.2
Employment (thous.) 1.2 1.0 2.1
Total effect Output (millions) $489.0 $343.4 $832.4
Labor Income (millions) $158.8 $112.6 $271.4
Employment (thous.) 3.4 3.0 6.4
Table 12 presents the economic contributions from trip and package related spending by residency. Tables providing detail by residency, guide usage, and water type are provided in the Appendix tables A7 & A8. The total effects of trip and package spending activity generated $306.2 million in output, more than 2,800 jobs, and $100.3 million in household income. The majority of these effects come from non-resident spending. Table 12. Economic contributions of sportfishing trip and package spending by residency (2017) Resident Non-resident All
Anglers Anglers Anglers
Direct effects
Output (millions) $40.4 $130.6 $171.1
Labor Income (millions) $12.1 $45.0 $57.1
Employment (thous.) 0.4 1.6 2.0
Multiplier effects Output (millions) $27.6 $107.6 $135.2
Labor Income (millions) $8.6 $34.6 $43.2
Employment (thous.) 0.2 0.7 0.8
Total effects Output (millions) $68.0 $238.2 $306.2
Labor Income (millions) $20.6 $79.6 $100.3
Employment (thous.) 0.6 2.2 2.8
FWC Packet - February 21, 2019 31 of 68
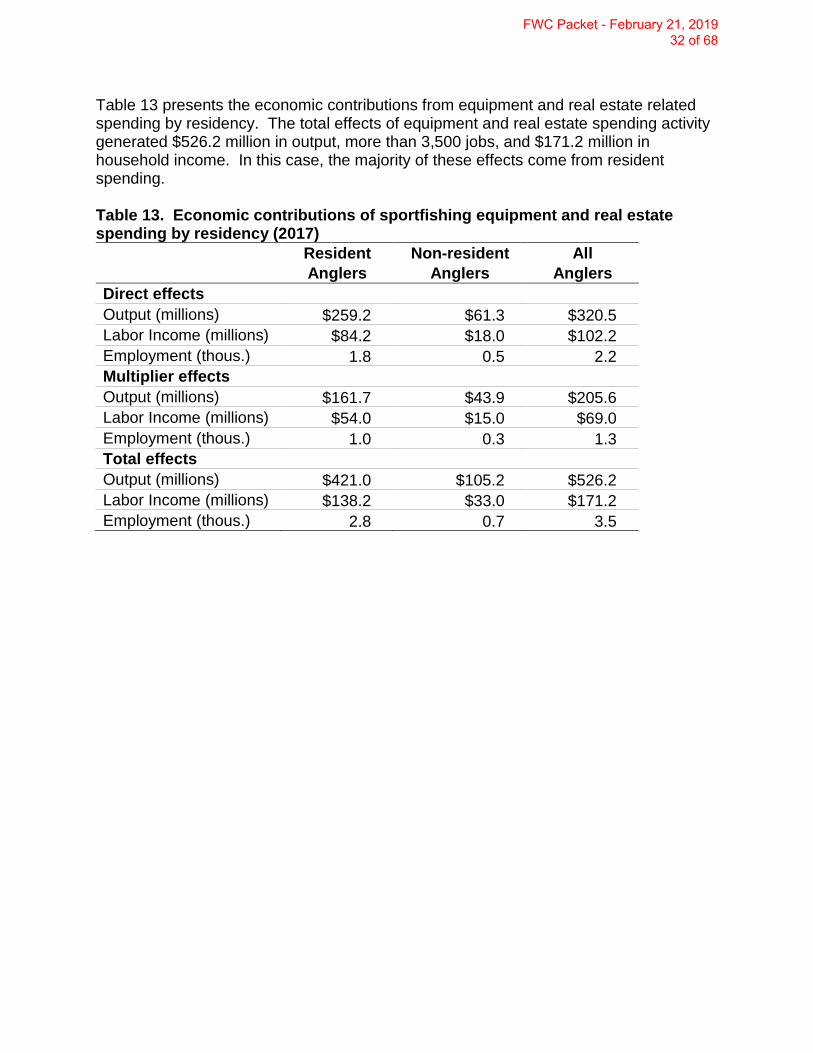
Table 13 presents the economic contributions from equipment and real estate related spending by residency. The total effects of equipment and real estate spending activity generated $526.2 million in output, more than 3,500 jobs, and $171.2 million in household income. In this case, the majority of these effects come from resident spending. Table 13. Economic contributions of sportfishing equipment and real estate spending by residency (2017) Resident Non-resident All
Anglers Anglers Anglers
Direct effects
Output (millions) $259.2 $61.3 $320.5
Labor Income (millions) $84.2 $18.0 $102.2
Employment (thous.) 1.8 0.5 2.2
Multiplier effects
Output (millions) $161.7 $43.9 $205.6
Labor Income (millions) $54.0 $15.0 $69.0
Employment (thous.) 1.0 0.3 1.3
Total effects
Output (millions) $421.0 $105.2 $526.2
Labor Income (millions) $138.2 $33.0 $171.2
Employment (thous.) 2.8 0.7 3.5
FWC Packet - February 21, 2019 32 of 68

The economic activity generated in the region also produced tax revenues at the local, state, and federal level. The IMPLAN modeling produced generalized region-specific estimates of tax revenues based on existing ratios of output, income, and employment to tax revenues. It is estimated that angler spending in the Cook Inlet region in 2017 generated $31.7 million and $63.2 million in state/local and federal tax revenue, respectively (Table 14). Forty-three percent of tax revenues were the result of non-resident angler spending. Table 14. Tax revenues generated from the economic contributions of sportfishing (2017)
State and Local Tax Revenues (millions)
Federal Tax Revenues (millions)
Total Tax Revenues (millions)
Resident anglers
Trip & Package Expenditures $4.2 $5.4 $9.6
Equipment Expenditures $10.0 $19.8 $29.8
Real Estate Expenditures $3.7 $11.5 $15.2
Subtotal $18.0 $36.7 $54.6
Non-resident anglers
Trip & Package Expenditures $10.7 $18.9 $29.6
Equipment Expenditures $2.3 $6.3 $8.6
Real Estate Expenditures $0.8 $1.3 $2.2
Subtotal $13.8 $26.6 $40.3
All anglers
Trip & Package Expenditures $14.9 $24.3 $39.2
Equipment Expenditures $12.3 $26.1 $38.4
Real Estate Expenditures $4.6 $12.8 $17.4
Total $31.7 $63.2 $95.0
FWC Packet - February 21, 2019 33 of 68

Summary and Discussion This study was conducted in order to provide current estimates of the economic contributions made by sportfishing activity on the Cook Inlet region. Prior to this research, the most recent study of sportfishing in Alaska that offers regional level analysis was completed roughly ten years ago. The updated information can contribute to the MSB’s policy discussions regarding fishery projects, land and water resource management and other relevant topics.
More than 907,000 days were spent fishing in the Cook Inlet region. Anglers who fished in the region and anglers who traveled to the region to purchase items used for sportfishing spent a total of $716.5 million. The majority of those retail dollars were retained in the local economy supporting more than 4,200 jobs and providing $159.2 in labor income. A regional level input-output model was used to track the collective economic contributions of the direct spending and the multiplier effects created as the angler dollars moved from business to business in the Cook Inlet economy. The total contributions generated by angler spending was estimated to be $832.4 million in economic output, which supported more than 6,300 jobs and $271.4 million in labor income. One of the main objectives of this study was to take collecting, analyzing and reporting estimates of economic contribution from sportfishing developed for the 2007 study and apply it here. Slight modifications to the methodological approach of this study were made to better capture spending, particularly in the real estate category. Outside of these improvements, every effort was made to mirror the earlier methodology. This was to ensure that the economic information produced by this study could be directly compared to the earlier results to examine changes in specific segments of sportfishing over the past ten years (resident/non-residents, freshwater/saltwater, guided/unguided). We remind readers who wish to make comparisons that adjustments should be made to the 2007 spending estimates to account for inflation over the ten-year period. We also encourage readers making comparisons between the two studies to explore the condition of the state economy between the two periods, as it may provide context for differences in participation, spending, and economic contributions.
FWC Packet - February 21, 2019 34 of 68

Economic Impact of Sportfishing in the Cook Inlet Region of Alaska
Review of angler spending profiles
11/26/2018
(companion file ‘AK_CookInlet_EconModelSummary 11 20 18.xls’)
PO Box 6435 ■ Fernandina Beach, FL 32035 ■ Office (904) 277-9765
FWC Packet - February 21, 2019 35 of 68
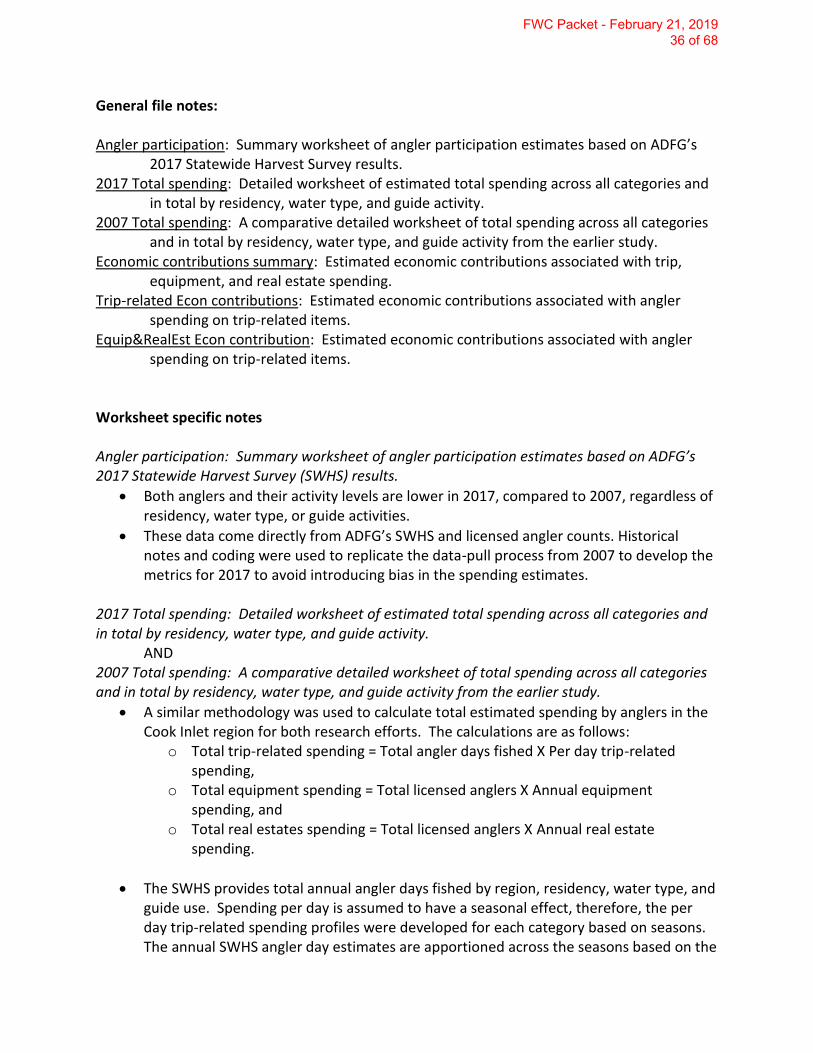
General file notes: Angler participation: Summary worksheet of angler participation estimates based on ADFG’s
2017 Statewide Harvest Survey results. 2017 Total spending: Detailed worksheet of estimated total spending across all categories and
in total by residency, water type, and guide activity. 2007 Total spending: A comparative detailed worksheet of total spending across all categories
and in total by residency, water type, and guide activity from the earlier study. Economic contributions summary: Estimated economic contributions associated with trip,
equipment, and real estate spending. Trip-related Econ contributions: Estimated economic contributions associated with angler
spending on trip-related items. Equip&RealEst Econ contribution: Estimated economic contributions associated with angler
spending on trip-related items. Worksheet specific notes Angler participation: Summary worksheet of angler participation estimates based on ADFG’s 2017 Statewide Harvest Survey (SWHS) results.
Both anglers and their activity levels are lower in 2017, compared to 2007, regardless of residency, water type, or guide activities.
These data come directly from ADFG’s SWHS and licensed angler counts. Historical notes and coding were used to replicate the data-pull process from 2007 to develop the metrics for 2017 to avoid introducing bias in the spending estimates.
2017 Total spending: Detailed worksheet of estimated total spending across all categories and in total by residency, water type, and guide activity.
AND 2007 Total spending: A comparative detailed worksheet of total spending across all categories and in total by residency, water type, and guide activity from the earlier study.
A similar methodology was used to calculate total estimated spending by anglers in the Cook Inlet region for both research efforts. The calculations are as follows:
o Total trip-related spending = Total angler days fished X Per day trip-related spending,
o Total equipment spending = Total licensed anglers X Annual equipment spending, and
o Total real estates spending = Total licensed anglers X Annual real estate spending.
The SWHS provides total annual angler days fished by region, residency, water type, and guide use. Spending per day is assumed to have a seasonal effect, therefore, the per day trip-related spending profiles were developed for each category based on seasons. The annual SWHS angler day estimates are apportioned across the seasons based on the
FWC Packet - February 21, 2019 36 of 68
reported activity level of respondents to our Cook Inlet survey. Total annual spending is then the sum of spending across all seasons.
We share the same detailed total spending estimates from the 2007 study which are inflated to reflect 2017 dollars to investigate the impact of the differences in spending profiles we explored in September when combined with the lower levels of participation.
Total estimated spending by all anglers in the Cook inlet over 2007 is $864.9 million. Total estimated spending by all anglers in the Cook inlet over 2017 is down to $716.5 million. In general, spending across all breakouts is down in 2017.
We see similar patterns in dominate spending categories by residency across the two time periods. Excluding real estate spending, the overwhelming majority of spending by resident anglers centers around fishing and other fishing related equipment purchases. Conversely, non-resident anglers spend more on trip-related purchases, relative to equipment.
In 2017, we implemented a different set of questions capturing real estate spending to reduce the potential for misinterpretation of the question. In those questions, we capture spending associated with:
o Purchases of lots, existing houses and cabins, and/or land
o Leases of land, cabins, boat slips, and storage (not included are any short-term rentals already reported as a trip-related expense)
o Construction of houses and cabins, and repair or maintenance expenses (not including boat docks, sheds, or outbuildings)
o Purchase or construction of boat docks, sheds, or outbuildings
Purchases or construction of houses or cabins are the largest of these four categories. Only a portion of that spending generates economic contributions to the region.
We provide real estate spending for the 2007 study because it does provide insights when discussing the estimated economic contributions but caution direct comparison between the two years.
Economic contributions summary: Estimated economic contributions associated with trip, equipment, and real estate spending.
Briefly reviewing the contributions included in this summary worksheet: Economic Multipliers: the response of a regional economy to some economic stimulus, such as spending by anglers.
Direct effect: the changes in the businesses that are directly affected by angler spending. In the case of consumer purchases, some products are supplied by businesses and industries from outside of the region and the direct effect does not necessarily equal total consumer spending. These direct expenditures initiate other rounds of activity within the economy. Indirect effect: the changes in inter-industry purchases as suppliers respond to the new demands of those businesses that are directly affected by the angler spending. Induced effect: the economic activity that results from household spending of labor income associated with the economic activity generated by the direct and indirect effects.
FWC Packet - February 21, 2019 37 of 68

Total effect: the collective changes from the direct effect as well as indirect effect and induced effect
Economic Activity: the various metrics that are used to represent the ways in which angler expenditures affect a regional economy. Each of the metrics can be used as measures of the direct, indirect or induced effects.
Output: the total value of an industry’s production. Included in output is the value of an industry’s inputs plus value added by the industry (payroll, profits, and indirect business taxes). Income: total payroll, including salaries and wages, as well as benefits such as insurances, retirement benefits paid to employees and business proprietors. Employment; the total number of both full-time and part-time jobs. Tax revenues: estimates of all local, state and federal taxes paid by individuals and business (e.g., income taxes, excise taxes, business profits taxes, payroll taxes).
Contributions associated with sportfishing-related spending are sizable but lower in 2017, relative to 2007.
o Sportfishing activity on the Cook Inlet contributes $832.4 million in industry output, supports $271.4 million in labor income across 6,378 full- and part-time jobs, and generates $95.0 million in tax revenue.
Trip-related Econ contributions: Estimated economic contributions associated with angler spending on trip-related items.
o Trip-related spending on the Cook Inlet contributes $306.2 million in industry output, supports $100.3 million in labor income across 2,828 full- and part-time jobs, and generates $39.2 million in tax revenue.
o Further break-outs for residency, water type, and guide usage are included in this worksheet.
Equip&RealEst Econ contribution: Estimated economic contributions associated with angler spending on trip-related items.
o Trip-related spending on the Cook Inlet contributes $526.2 million in industry output, supports $171.2 million in labor income across 3,550 full- and part-time jobs, and generates $55.8 million in tax revenue.
o Further breakouts for residency, water type, and guide usage are included in this worksheet.
o Economic contributions appear to be buoyed by equipment spending. As we mentioned previously, we approached real estates spending slightly differently in 2017. Estimated real estate spending is higher in 2017 and as a result, the contributions associated with that spending are higher, relative to 2007. We breakout the contributions for each category independently to provide additional detail and insights.
FWC Packet - February 21, 2019 38 of 68

FWC Packet - February 21, 2019 39 of 68
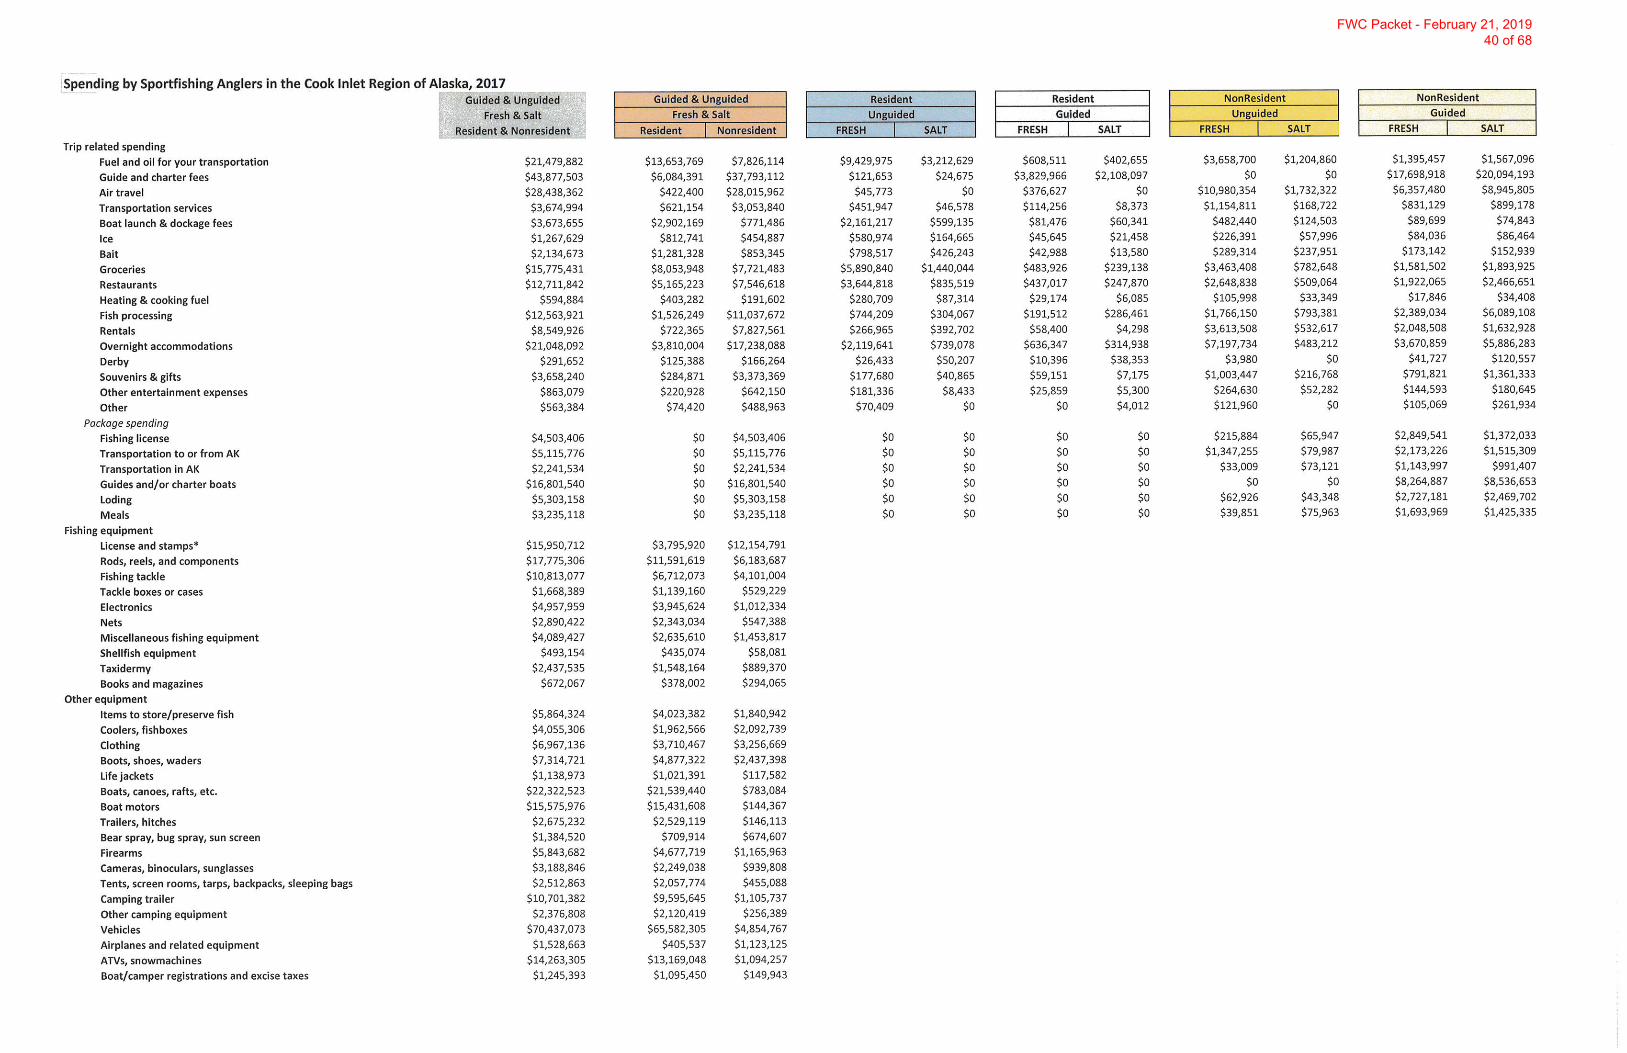
FWC Packet - February 21, 2019 40 of 68

FWC Packet - February 21, 2019 41 of 68
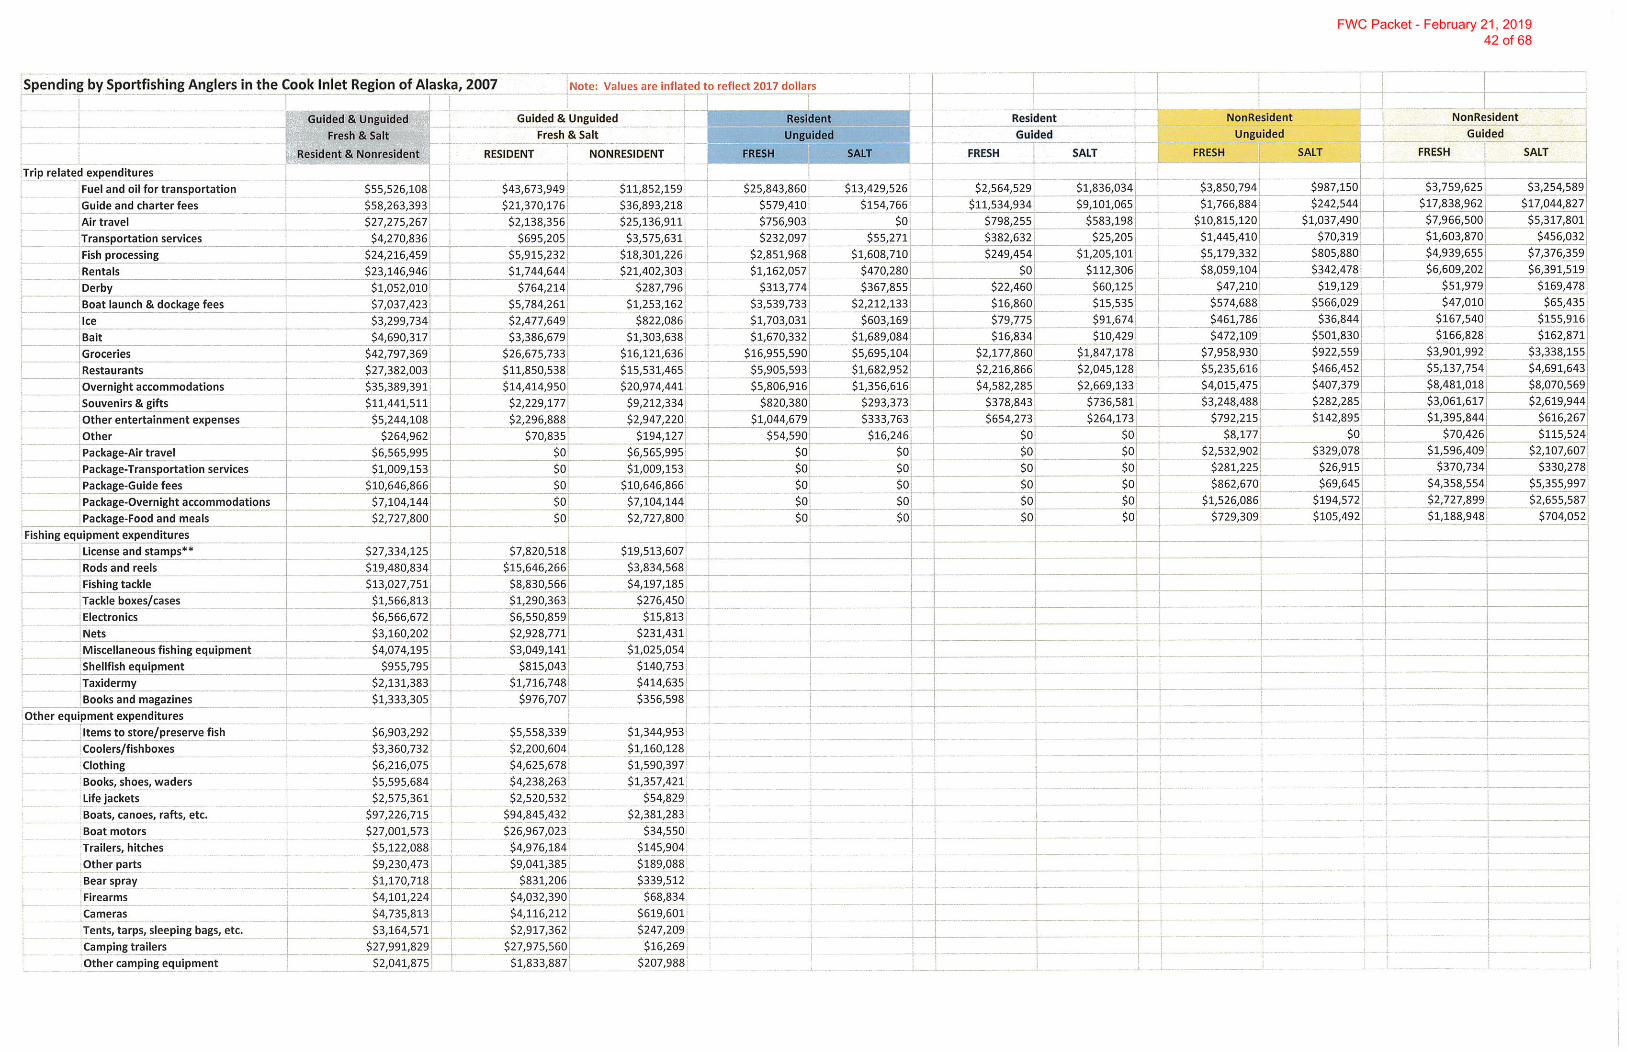
FWC Packet - February 21, 2019 42 of 68

FWC Packet - February 21, 2019 43 of 68

FWC Packet - February 21, 2019 44 of 68

FWC Packet - February 21, 2019 45 of 68

FWC Packet - February 21, 2019 46 of 68

5 AAC 21.353. Central District Drift Gillnet Fishery Management Plan. (a) The purpose of this
management plan is to ensure adequate escapement of salmon into the Northern District drainages
and to provide management guidelines to the department. The depart-ment shall manage the
commercial drift gillnet fishery to minimize the harvest of Northern District and Kenai River coho
salmon in order to provide sport and guided sport fishermen a reasonable opportunity to harvest these
salmon stocks over the entire run, as measured by the frequency of inriver restrictions. The
department shall manage the Central District commercial drift gillnet fishery as described in this
section.
(b) The regular weekly fishing periods are as described in 5 AAC 21.320(b). The fishing
season will open the third Monday in June or June 19, whichever is later.
(c) From July 9 through July 15,
(1) fishing during the first regular fishing period and second regular fishing period is
restricted to the Expanded Kenai and Expanded Kasilof Sections of the Upper
Subdistict and Drift Gillnet Area 1;
(2) at run strengths greater than 2,300,000 sockeye salmon to the Kenai River, the
commissioner may, by emergency order, open one additional 12-hour fishing period
in the Expanded Kenai and Expanded Kasilof Sections of the Upper Subdistrict and
Drift Gillnet Area 1; (3) additional fishing time under this subsection is allowed only
in the Expanded Kenai and Expanded Kasilof Sections of the Upper Subdistrict.
(d) From July 16 through July 31,
(1) at run strengths of less than 2,300,000 sockeye salmon to the Kenai River, fish-
ing during all regular 12-hour fishing periods will be restricted to the Expanded
Kenai and Expanded Kasilof Sections of the Upper Subdistrict;
(2) at run strengths of 2,300,000 – 4,600,000 sockeye salmon to the Kenai River,
(A) fishing during one regular 12-hour fishing period per week will be
restricted to one or more of the following sections and areas:
(i) Expanded Kenai Section of the Upper Subdistrict;
(ii) Expanded Kasilof Section of the Upper Subdistrict;
(iii) Anchor Point Section of the Lower Subdistrict;
(iv) Drift Gillnet Area 1; notwithstanding the provisions of
subparagraph (d)
(2)(A) of this section, one regular 12-hour fishing period from July 16 through July 31 may occur in
the Central District instead of in Drift Gillnet Area 1;
(B) the remaining weekly 12-hour regular fishing period will be restricted to one or more of
the following sections:
(i) Expanded Kenai Section;
(ii) Expanded Kasilof Section;
(iii) Anchor Point Section;
(3) at run strengths greater than 4,600,000 sockeye salmon to the Kenai River, one regular
12-hour fishing period per week will be restricted to the Expanded Kenai, Expanded Kasilof,
and Anchor Point Sections;
(4) additional fishing time under this subsection is allowed only in one or more of the
following sections:
(A) Expanded Kenai Section;
FWC Packet - February 21, 2019 47 of 68

(B) Expanded Kasilof Section;
(C) Anchor Point Section.
(d) From July 16 through July 31,
(1) at run strengths of less than 2,300,000 sockeye salmon to the Kenai River. Fishing during
all regular 12-hour fishing periods will be restricted to the Expanded Kenai and Expanded Kasilof
Sections of the Upper Subdistrict;
(2) at run strengths of 2,300,000 – 4,600,00 sockeye salmon to the Kenai River.
(A) fishing during one regular 12-hour fishing period per week will be restricted to one or
more of the following sections and areas:
(i) Expanded Kenai Section of the Upper Subdistrict;
(ii) Expanded Kasilof Section of the Upper Subdistrict;
(iii) Anchor Point Section of the Lower Subdistrict;
(iv) Drift Gillnet Area 1;
(B) the remaining weekly 12-hour regular fishing periods will be restricted to one or more of
the following sections:
(i) Expanded Kenai Section;
(ii) Expanded Kasilof Section;
(iii) Anchor Point Section;
(3) at run strengths greater than 4,600,000 sockeye salmon to the Kenai River one regular 12-
hour fishing period per week will be restricted to the Kenai, Expanded Kasilof and Anchor Point
Sections;
(4) additional fishing time under this subsection is allowed only in one or more of the following
sections:
(A) Expanded Kenai Section;
(B) Expanded Kasilof Section;
(C) Anchor Point Section;
(e) From August 1 through August 15, there are no mandatory area restrictions to regular fishing
periods, except that if the Upper Subdistrict set gillnet fishery is closed under 5 AAC
21.310(b)(2)(C)(iii), or the department determines that less than one percent of the season's total drift
gillnet sockeye salmon harvest has been taken per fishing period for two consecu-tive fishing periods
in the drift gillnet fishery, regular fishing periods will be restricted to Drift Gillnet Areas 3 and 4. In
this subsection, "fishing period" means a time period open to commercial fishing as measured by a
24-hour calendar day from 12:01 a.m. until 11:59 p.m.
FWC Packet - February 21, 2019 48 of 68

(e) From August 1 through August 15,
(1) fishing during both regular 12 hour fishing periods per week will be restricted to one or
more of the following sections and areas: (A) Expanded Kenai Section; (B) Expanded Kasilof
Section; (C) Anchor Point Section; (D) Drift Gillnet Area, except that if the Upper Subdistrict set
gillnet fishery is closed under 5AAC 21.310(b)(2)(C)9iii), or the department determines that less than
one percent of the season’s total drift gillnet sockeye salmon harvest has been taken per fishing
period for two consecutive fishing periods in the drift gillnet fishery, regular fishing periods will be
restricted to Drift Gillnet Areas 3 and 4. In this subsection “fishing period” means a time period
open to commercial fishing as measured by a 24-hour calendar day from 12:01 a.m. until 11:59 p.m.
(2)additional fishing time under this subsection is allowed only in one or more of the following
sections: (A) Expanded Kenai Section; (B) Expanded Kasilof Section; (C) Anchor Point Section.
From August 16 until closed by emergency order, Drift Gillnet Areas 3 and 4 are open for fishing
during regular fishing periods
(f) From August 16 until closed by emergency order, Drift Gillnet Areas 3 and 4 are open for fishing
during regular fishing periods.
(g) For the purposes of this section,
(1) "Drift Gillnet Area 1" means those waters of the Central District south of Kalgin Island at
60° 20.43' N. lat.;
(2) "Drift Gillnet Area 2" means those waters of the Central District enclosed by a line from
60° 20.43' N. lat., 151° 54.83' W. long. to a point at 60° 41.08' N. lat., 151° 39.00' W. long. to
a point at 60° 41.08' N. lat., 151° 24.00' W. long. to a point at 60° 27.10' N. lat., 151° 25.70'
W. long. to a point at 60° 20.43' N. lat., 151° 28.55' W. long.;
(3) "Drift Gillnet Area 3" means those waters of the Central District within one mile of mean
lower low water (zero tide) south of a point on the West Foreland at 60° 42.70' N. lat., 151°
42.30' W. long.;
(4) "Drift Gillnet Area 4" means those waters of the Central District enclosed by a line from
60° 04.70' N. lat., 152° 34.74' W. long. to the Kalgin Buoy at 60° 04.70' N. lat., 152° 09.90'
W. long. to a point at 59° 46.15' N. lat., 152° 18.62' W. long. to a point on the western shore
at 59° 46.15' N. lat., 153° 00.20' W. long., not including the waters of the Chinitna Bay
Subdistrict.
(h) The commissioner may depart from the provisions of the management plan under this section as
provided in 5 AAC 21.363(e)
FWC Packet - February 21, 2019 49 of 68
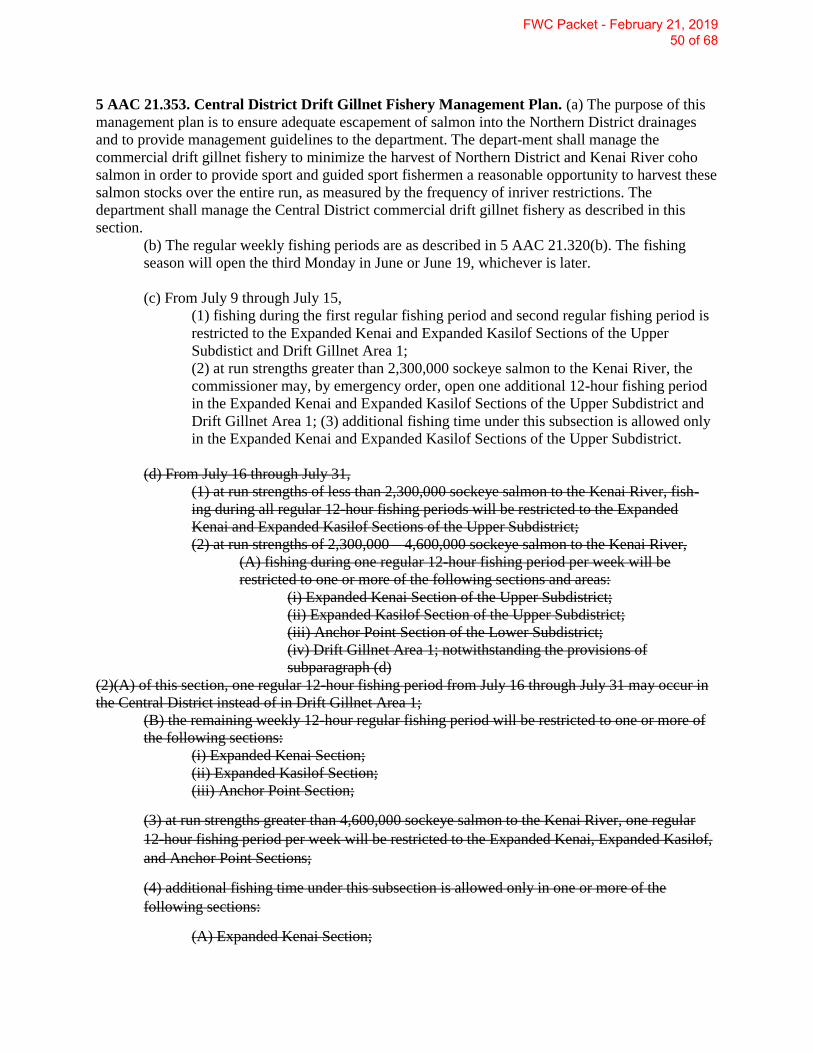
5 AAC 21.353. Central District Drift Gillnet Fishery Management Plan. (a) The purpose of this
management plan is to ensure adequate escapement of salmon into the Northern District drainages
and to provide management guidelines to the department. The depart-ment shall manage the
commercial drift gillnet fishery to minimize the harvest of Northern District and Kenai River coho
salmon in order to provide sport and guided sport fishermen a reasonable opportunity to harvest these
salmon stocks over the entire run, as measured by the frequency of inriver restrictions. The
department shall manage the Central District commercial drift gillnet fishery as described in this
section.
(b) The regular weekly fishing periods are as described in 5 AAC 21.320(b). The fishing
season will open the third Monday in June or June 19, whichever is later.
(c) From July 9 through July 15,
(1) fishing during the first regular fishing period and second regular fishing period is
restricted to the Expanded Kenai and Expanded Kasilof Sections of the Upper
Subdistict and Drift Gillnet Area 1;
(2) at run strengths greater than 2,300,000 sockeye salmon to the Kenai River, the
commissioner may, by emergency order, open one additional 12-hour fishing period
in the Expanded Kenai and Expanded Kasilof Sections of the Upper Subdistrict and
Drift Gillnet Area 1; (3) additional fishing time under this subsection is allowed only
in the Expanded Kenai and Expanded Kasilof Sections of the Upper Subdistrict.
(d) From July 16 through July 31,
(1) at run strengths of less than 2,300,000 sockeye salmon to the Kenai River, fish-
ing during all regular 12-hour fishing periods will be restricted to the Expanded
Kenai and Expanded Kasilof Sections of the Upper Subdistrict;
(2) at run strengths of 2,300,000 – 4,600,000 sockeye salmon to the Kenai River,
(A) fishing during one regular 12-hour fishing period per week will be
restricted to one or more of the following sections and areas:
(i) Expanded Kenai Section of the Upper Subdistrict;
(ii) Expanded Kasilof Section of the Upper Subdistrict;
(iii) Anchor Point Section of the Lower Subdistrict;
(iv) Drift Gillnet Area 1; notwithstanding the provisions of
subparagraph (d)
(2)(A) of this section, one regular 12-hour fishing period from July 16 through July 31 may occur in
the Central District instead of in Drift Gillnet Area 1;
(B) the remaining weekly 12-hour regular fishing period will be restricted to one or more of
the following sections:
(i) Expanded Kenai Section;
(ii) Expanded Kasilof Section;
(iii) Anchor Point Section;
(3) at run strengths greater than 4,600,000 sockeye salmon to the Kenai River, one regular
12-hour fishing period per week will be restricted to the Expanded Kenai, Expanded Kasilof,
and Anchor Point Sections;
(4) additional fishing time under this subsection is allowed only in one or more of the
following sections:
(A) Expanded Kenai Section;
FWC Packet - February 21, 2019 50 of 68
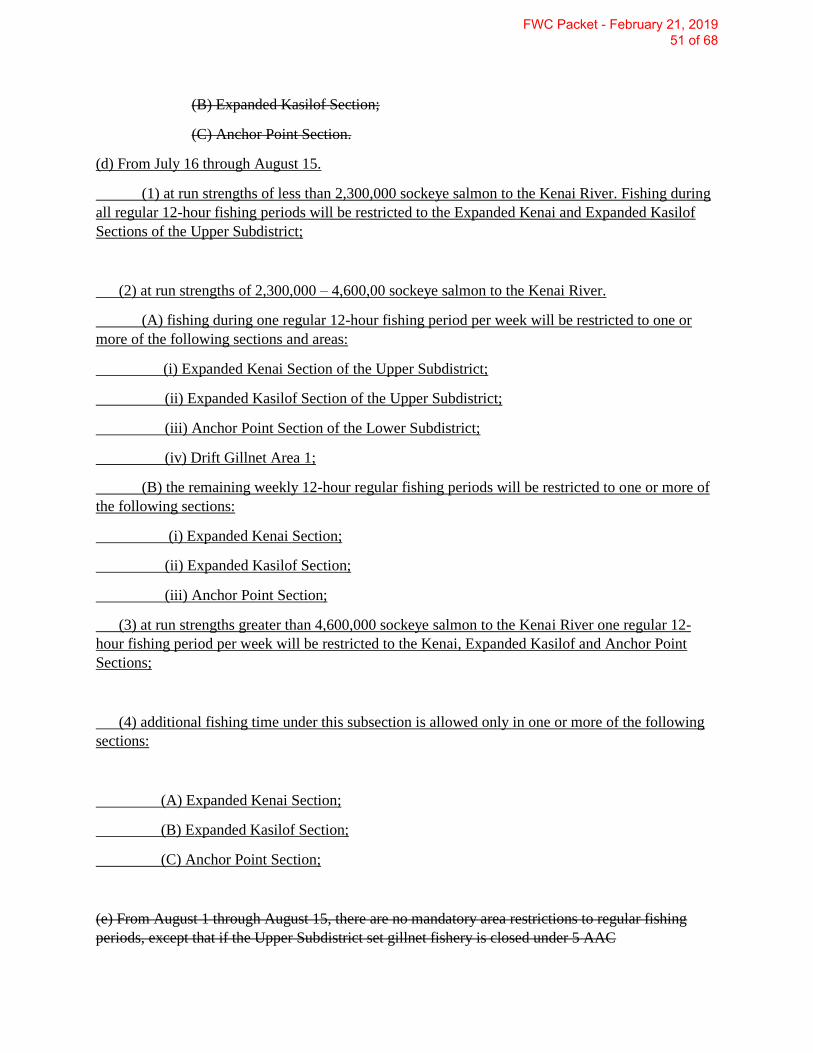
(B) Expanded Kasilof Section;
(C) Anchor Point Section.
(d) From July 16 through August 15.
(1) at run strengths of less than 2,300,000 sockeye salmon to the Kenai River. Fishing during
all regular 12-hour fishing periods will be restricted to the Expanded Kenai and Expanded Kasilof
Sections of the Upper Subdistrict;
(2) at run strengths of 2,300,000 – 4,600,00 sockeye salmon to the Kenai River.
(A) fishing during one regular 12-hour fishing period per week will be restricted to one or
more of the following sections and areas:
(i) Expanded Kenai Section of the Upper Subdistrict;
(ii) Expanded Kasilof Section of the Upper Subdistrict;
(iii) Anchor Point Section of the Lower Subdistrict;
(iv) Drift Gillnet Area 1;
(B) the remaining weekly 12-hour regular fishing periods will be restricted to one or more of
the following sections:
(i) Expanded Kenai Section;
(ii) Expanded Kasilof Section;
(iii) Anchor Point Section;
(3) at run strengths greater than 4,600,000 sockeye salmon to the Kenai River one regular 12-
hour fishing period per week will be restricted to the Kenai, Expanded Kasilof and Anchor Point
Sections;
(4) additional fishing time under this subsection is allowed only in one or more of the following
sections:
(A) Expanded Kenai Section;
(B) Expanded Kasilof Section;
(C) Anchor Point Section;
(e) From August 1 through August 15, there are no mandatory area restrictions to regular fishing
periods, except that if the Upper Subdistrict set gillnet fishery is closed under 5 AAC
FWC Packet - February 21, 2019 51 of 68

21.310(b)(2)(C)(iii), or the department determines that less than one percent of the season's total drift
gillnet sockeye salmon harvest has been taken per fishing period for two consecu-tive fishing periods
in the drift gillnet fishery, regular fishing periods will be restricted to Drift Gillnet Areas 3 and 4. In
this subsection, "fishing period" means a time period open to commercial fishing as measured by a
24-hour calendar day from 12:01 a.m. until 11:59 p.m.
(e) From August 1 through August 15, if the Upper Subdistrict set gillnet fishery is closed under
5AAC 21.310(b)(2)(C)9iii), or the department determines that less than one percent of the season’s
total drift gillnet sockeye salmon harvest has been taken per fishing period for two consecutive
fishing periods in the drift gillnet fishery, regular fishing periods will be restricted to Drift Gillnet
Areas 3 and 4. In this subsection “fishing period” means a time period open to commercial fishing as
measured by a 24-hour calendar day from 12:01 a.m. until 11:59 p.m.
From August 16 until closed by emergency order, Drift Gillnet Areas 3 and 4 are open for fishing
during regular fishing periods
(f) From August 16 until closed by emergency order, Drift Gillnet Areas 3 and 4 are open for fishing
during regular fishing periods.
(g) For the purposes of this section,
(1) "Drift Gillnet Area 1" means those waters of the Central District south of Kalgin Island at
60° 20.43' N. lat.;
(2) "Drift Gillnet Area 2" means those waters of the Central District enclosed by a line from
60° 20.43' N. lat., 151° 54.83' W. long. to a point at 60° 41.08' N. lat., 151° 39.00' W. long. to
a point at 60° 41.08' N. lat., 151° 24.00' W. long. to a point at 60° 27.10' N. lat., 151° 25.70'
W. long. to a point at 60° 20.43' N. lat., 151° 28.55' W. long.;
(3) "Drift Gillnet Area 3" means those waters of the Central District within one mile of mean
lower low water (zero tide) south of a point on the West Foreland at 60° 42.70' N. lat., 151°
42.30' W. long.;
(4) "Drift Gillnet Area 4" means those waters of the Central District enclosed by a line from
60° 04.70' N. lat., 152° 34.74' W. long. to the Kalgin Buoy at 60° 04.70' N. lat., 152° 09.90'
W. long. to a point at 59° 46.15' N. lat., 152° 18.62' W. long. to a point on the western shore
at 59° 46.15' N. lat., 153° 00.20' W. long., not including the waters of the Chinitna Bay
Subdistrict.
(h) The commissioner may depart from the provisions of the management plan under this section as
provided in 5 AAC 21.363(e)
FWC Packet - February 21, 2019 52 of 68
UCI NORTHERN DISTRICT KING SALMON MANAGEMENT PROPOSALS
Revisions and additions are needed in management plans for King Salmon in
northern Cook Inlet to address challenges identified during the recent extended
period of low abundance.
Proposal Purposes
1. Ensure that escapement goals are met.
2. Expand the toolbox of actions available to sport fishery management.
3. Provide predictable and orderly management of fisheries to the extent that
is possible with variable and uncertain run sizes.
4. Provide guidance to Sport Fishery Managers for area-specific management
which reflects the needs and desires of their fishing community.
5. Share the conservation burden for King Salmon during periods of low
abundance.
Note: The commission should
discuss if the intent in these
plans is for proposed actions to
be instead of, or in addition to,
actions currently allowed by
the commissioner’s emergency
order authority under 5AAC
75.003. If that intent is not
clearly articulated in the plan
actions listed in the
management plans could be
interpreted as supplanting
ADF&G’s general authority
under 75.003 to modify bag
limits and methods and means,
leaving only the authority
under 16.05.060 to modify
time and area.
One option is keeping the plans
more skeletal, listing new
management tools and
including language that they
are in “addition” to 75.003.
Another option could be
adding the common
liberalizations and restrictions
for each area, Little Su, Deshka,
Eastside, Talkeetna, Yentna.
That way someone unfamiliar
with the Matsu would be clued
in on what to expect. In the
second option, it would still be
good to include the intent
language by referencing
75.003, just to cover any loose
ends. We added the common
restrictions and liberalizations
for each area to help inform
your decision which style to
adopt.
ADF&G appreciates the
opportunity to view and
comment on proposed
management plans. ADF&G
will remain neutral on all
allocative aspects of proposed
management plans.
FWC Packet - February 21, 2019 53 of 68
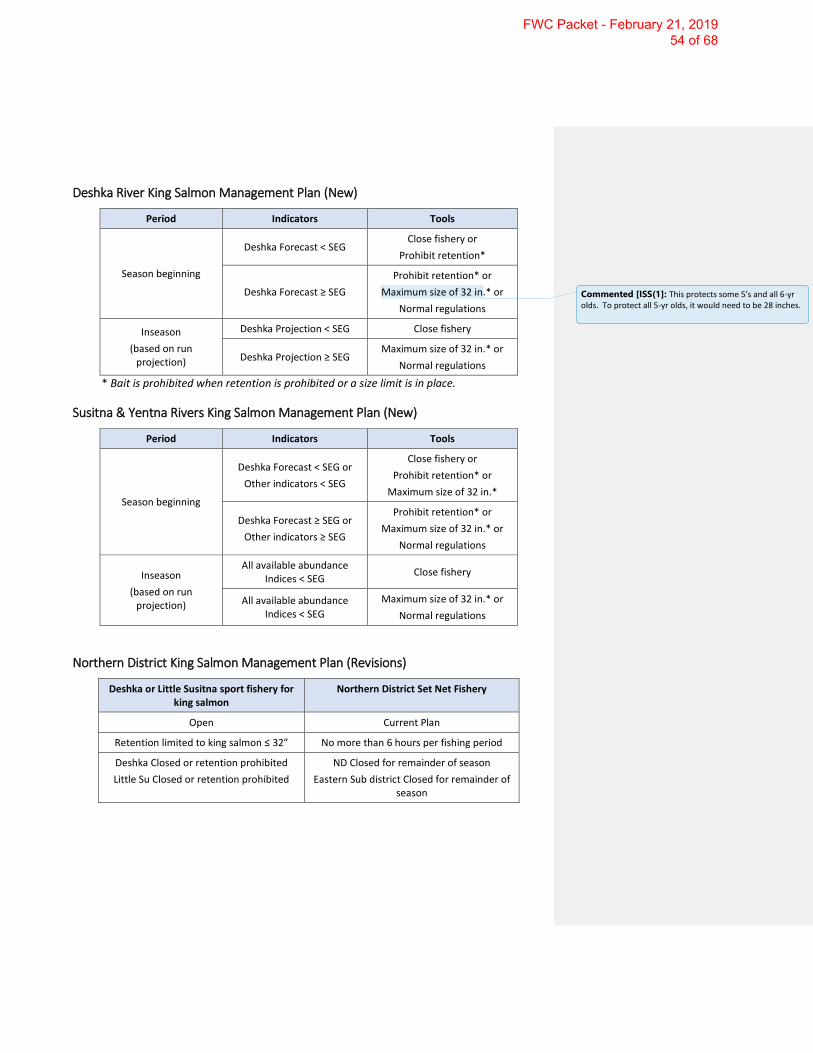
Deshka River King Salmon Management Plan (New)
Period Indicators Tools
Season beginning
Deshka Forecast < SEG Close fishery or
Prohibit retention*
Deshka Forecast ≥ SEG
Prohibit retention* or
Maximum size of 32 in.* or
Normal regulations
Inseason
(based on run projection)
Deshka Projection < SEG Close fishery
Deshka Projection ≥ SEG Maximum size of 32 in.* or
Normal regulations
* Bait is prohibited when retention is prohibited or a size limit is in place.
Susitna & Yentna Rivers King Salmon Management Plan (New)
Period Indicators Tools
Season beginning
Deshka Forecast < SEG or
Other indicators < SEG
Close fishery or
Prohibit retention* or
Maximum size of 32 in.*
Deshka Forecast ≥ SEG or
Other indicators ≥ SEG
Prohibit retention* or
Maximum size of 32 in.* or
Normal regulations
Inseason
(based on run projection)
All available abundance Indices < SEG
Close fishery
All available abundance Indices < SEG
Maximum size of 32 in.* or
Normal regulations
Northern District King Salmon Management Plan (Revisions)
Deshka or Little Susitna sport fishery for king salmon
Northern District Set Net Fishery
Open Current Plan
Retention limited to king salmon ≤ 32” No more than 6 hours per fishing period
Deshka Closed or retention prohibited
Little Su Closed or retention prohibited
ND Closed for remainder of season
Eastern Sub district Closed for remainder of season
Commented [ISS(1]: This protects some 5’s and all 6-yr olds. To protect all 5-yr olds, it would need to be 28 inches.
FWC Packet - February 21, 2019 54 of 68

Example Scenario #1
Little Susitna R
Willow Cr
L ittle W illo w C r
Talkeetna R
Yen
tna R
Kashwitna R
Cas
wel
l Cr
Sheep Cr
Sheep RK
ah
ilt na R
Johnson Cr
Clear C
r
Lake C
r
Talachulitna R
Skwentna R
Gra
ni t
e C
r
Pe
ters
Cr
Des
hka
R
Ra
bid
eu
x C
r
Sunshi
ne C
r
Prairie CrChulit
na R
Goose Cr
Sus
itna
R
Montana Cr
Kro
to C
r Mo
os
e C
r
W Fk Yentna R
E F
k Y
en
tna R
Kichatna R
Susitna R
25 mi
Fis
h C
r
Ale
xan
der C
r
Tra
ppe
r C
r
Preseason Info
Deshka forecast at low end of SEG
Roadside streams (including Prairie &
Clear) failed to meet SEG in 2 of last 3
years
Lake Creek & Talachulitna met SEG in
2 of last 3 years
Entire
Susitna
closed to
retention
Deshka opens
season with
32” max size
limit
Yentna at no
retention
except Lake &
Talachulitna
open with 32”
max size limit
Alexander
Creek
Closed
FWC Packet - February 21, 2019 55 of 68

Example Scenario #2
Little Susitna R
Willow Cr
L ittle W illo w C r
Talkeetna R
Yen
tna R
Kashwitna R
Cas
wel
l Cr
Sheep Cr
Sheep RK
ah
ilt na R
Johnson Cr
Clear C
r
Lake C
r
Talachulitna R
Skwentna R
Gra
ni t
e C
r
Pe
ters
Cr
Des
hka
R
Ra
bid
eu
x C
r
Sunshi
ne C
r
Prairie CrChulit
na R
Goose Cr
Sus
itna
R
Montana Cr
Kro
to C
r Mo
os
e C
r
W Fk Yentna R
E F
k Y
en
tna R
Kichatna R
Susitna R
25 mi
Fis
h C
r
Ale
xan
der C
r
Tra
ppe
r C
r
Preseason Info
Deshka forecast at low end of SEG
Roadside streams (including Prairie &
Clear) met SEG in 2 of last 3 years
In Yentna, only Lake Creek met SEG in
2 of last 3 years. Talachulitna made
SEG only in 1 of 3 years
Susitna
opens with
32” max
size limit
Deshka opens
season with
32” max size
limit
Yentna no
retention
except Lake
Creek opens
with 32” max
size limit
Alexander
Creek
Closed
FWC Packet - February 21, 2019 56 of 68

5 AAC 61.XXX. Deshka River King Salmon Management Plan.
(a) The purpose of this management plan is to ensure an adequate escapement of king
salmon into the Deshka River and to provide management guidelines to the department.
(b) The Department shall manage the Deshka River king salmon sport and guided sport
fisheries to achieve the sustainable escapement goal of 13,000 – 28,000 king salmon and,
to provide reasonable harvest opportunities over the entire run.
(c) In the Deshka River,
(1) The seasons, bag, possession, and size limits, and other special provisions for king
salmon are set out in 5 AAC 61.110 -5 AAC 61.112;
(2) From January 1 – July 13, from its mouth upstream to ADF&G regulatory markers
near Chijuk Creek (river mile 17), and in all waters within a one-half mile radius of
its confluence with the Susitna River,
(A) If the pre-season forecast projects the run to be below the sustainable
escapement goal, the commissioner may, by emergency order,
(i) Close the sport fishery to the taking of king salmon; or
(ii) Prohibit the retention of king salmon;
(B) If the pre-season forecast projects the run to be within or above the
sustainable escapement goal the commissioner may, by emergency order,
(i) Prohibit the retention of king salmon;
(ii) Establish a maximum size limit of 32 inches as measured from
tip of snout to tip of tail;
(iii) Restrict the use of bait;
(iv) Reduce the annual limit;
(v) Start the fishery as described in 5 AAC 61.112;
(v)(vi) allow the use of bait prior to June 1;
(vi)(vii) Increase hours to 24 hours per day.
(3) If the inseason escapement projection is below the sustainable escapement goal,
the commissioner may close, by emergency order, the sport fishery to the taking
of king salmon;
(4) If the inseason escapement projection is within or greater than the sustainable
escapement goal, the commissioner may, by emergency order,
(A) Prohibit the retention of king salmon;
(B) Reduce the annual limit;
(C) Conduct the season as described in 5 AAC 61.112;
(D) Modify the maximum size limit allowed for retention.
Commented [ISS(2]: Plusses and minuses to having the value of the goal listed. Leaving in requires additional board process every time the goal changes
Commented [ISS(3]: Reworded (A) and (B) taking out “inriver”
Commented [ISS(4]: Reworded (3) taking out “inriver” and replacing “shall” with “may”
Commented [ISS(5]: Note that this is an assessment made by the manager that is dependent on an evaluation of run timing.
FWC Packet - February 21, 2019 57 of 68

(E) Increase hours to 24 hours per day;
(F) Increase bag and possession limit to 2 per day and 4 in possession;
(5) At any such time that the retention of king salmon is prohibited or a maximum size
limit is established the use of bait and multiple hooks are prohibited.
5 AAC 60.XXX. Little Susitna River King Salmon Management Plan.
(a) The purpose of this management plan is to ensure an adequate escapement of king
salmon into the Little Susitna River and to provide management guidelines to the
department.
(b) The Department shall manage the Little Susitna River king salmon sport and guided sport
fisheries to achieve the sustainable escapement goal of 2,300-3,900 king salmon and, to
provide reasonable harvest opportunities over the entire run. The department shall
initiate management of the sport fishery for king salmon in the Little Susitna River based
on run sizes of immediate past years and other available abundance indices.
(c) In the Little Susitna River,
(1) The seasons, bag, possession, and size limits, and other special provisions for king
salmon are set out in 5 AAC 60.120 -5 AAC 60.122;
(2) From January 1 – July 13, from its mouth upstream to the Parks Highway,
(A) If the pre-season forecast projects the run to be below the sustainable
escapement goal, the commissioner may, by emergency order,
(i) Close the sport fishery to the taking of king salmon; or
(ii) Prohibit the retention of king salmon;
(B) If the pre-season forecast projects the inriver run to be within or above the
sustainable escapement goal the commissioner may, by emergency order,
(i) Prohibit the retention of king salmon;
(ii) Establish a maximum size limit of 32 inches as measured from
tip of snout to tip of tail;
(iii) Reduce the annual limit;
(iv) Allow retention Fridays – Mondays; nonretention Tuesdays –
Thursdays;
(v) Start the fishery as described in 5 AAC 61.112;
(3) If the inseason escapement projection is below of the sustainable escapement
goal, the commissioner shall close, by emergency order, the sport fishery to the
taking of king salmon;
(4) If the inseason escapement projection is within or greater than the sustainable
escapement goal, the commissioner may, by emergency order,
(A) Conduct the season as described in 5 AAC 61.112;
Commented [ISS(6]: added
Commented [ISS(7]: We don’t forecast runs to the Little Susitna and there is a poor relationship between Little Su and Deshka. There appears to be a good relationship between Little Su and Eastside Su. If we gain ability to forecast Eastside mgt area, which is a possibility in the future, then that may lead to a workable trigger. Management on the Little Su in recent years has been largely based on run sizes experienced in the immediate past and success in achieving the goal. See added language to (b).
Commented [ISS(8]: We had a discussion about whether we’d ever start the season liberalized like we could on the Deshka. We have less forecasting ability. Also, Little Su is our highest fishing power fishery. Inriver exploitation averages 46% even during high abundance yrs 2000-2006. Only 2 yrs (05-06) when the goal was exceeded. Unlikely we’d liberalize preseason.
FWC Packet - February 21, 2019 58 of 68

(B) Modify the maximum size limit allowed for retention.
(C) Allow use of bait
(5) At any such time that the retention of king salmon is prohibited or a maximum size
limit is established the use of multiple-hooks is prohibited. Commented [ISS(9]: Took out bait as it is already restricted in regulation. Added multiple hooks.
FWC Packet - February 21, 2019 59 of 68
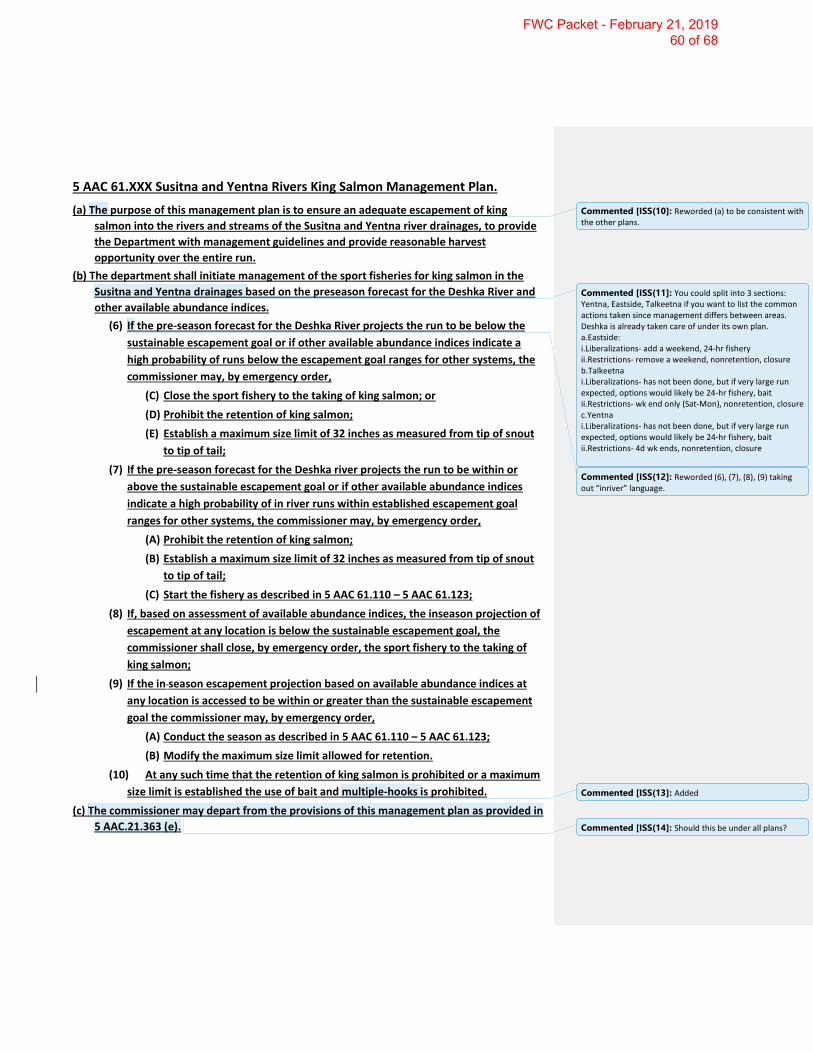
5 AAC 61.XXX Susitna and Yentna Rivers King Salmon Management Plan.
(a) The purpose of this management plan is to ensure an adequate escapement of king
salmon into the rivers and streams of the Susitna and Yentna river drainages, to provide
the Department with management guidelines and provide reasonable harvest
opportunity over the entire run.
(b) The department shall initiate management of the sport fisheries for king salmon in the
Susitna and Yentna drainages based on the preseason forecast for the Deshka River and
other available abundance indices.
(6) If the pre-season forecast for the Deshka River projects the run to be below the
sustainable escapement goal or if other available abundance indices indicate a
high probability of runs below the escapement goal ranges for other systems, the
commissioner may, by emergency order,
(C) Close the sport fishery to the taking of king salmon; or
(D) Prohibit the retention of king salmon;
(E) Establish a maximum size limit of 32 inches as measured from tip of snout
to tip of tail;
(7) If the pre-season forecast for the Deshka river projects the run to be within or
above the sustainable escapement goal or if other available abundance indices
indicate a high probability of in river runs within established escapement goal
ranges for other systems, the commissioner may, by emergency order,
(A) Prohibit the retention of king salmon;
(B) Establish a maximum size limit of 32 inches as measured from tip of snout
to tip of tail;
(C) Start the fishery as described in 5 AAC 61.110 – 5 AAC 61.123;
(8) If, based on assessment of available abundance indices, the inseason projection of
escapement at any location is below the sustainable escapement goal, the
commissioner shall close, by emergency order, the sport fishery to the taking of
king salmon;
(9) If the in season escapement projection based on available abundance indices at
any location is accessed to be within or greater than the sustainable escapement
goal the commissioner may, by emergency order,
(A) Conduct the season as described in 5 AAC 61.110 – 5 AAC 61.123;
(B) Modify the maximum size limit allowed for retention.
(10) At any such time that the retention of king salmon is prohibited or a maximum
size limit is established the use of bait and multiple-hooks is prohibited.
(c) The commissioner may depart from the provisions of this management plan as provided in
5 AAC.21.363 (e).
Commented [ISS(10]: Reworded (a) to be consistent with the other plans.
Commented [ISS(11]: You could split into 3 sections: Yentna, Eastside, Talkeetna if you want to list the common actions taken since management differs between areas. Deshka is already taken care of under its own plan. a.Eastside: i.Liberalizations- add a weekend, 24-hr fishery ii.Restrictions- remove a weekend, nonretention, closure b.Talkeetna i.Liberalizations- has not been done, but if very large run expected, options would likely be 24-hr fishery, bait ii.Restrictions- wk end only (Sat-Mon), nonretention, closure c.Yentna i.Liberalizations- has not been done, but if very large run expected, options would likely be 24-hr fishery, bait ii.Restrictions- 4d wk ends, nonretention, closure
Commented [ISS(12]: Reworded (6), (7), (8), (9) taking out “inriver” language.
Commented [ISS(13]: Added
Commented [ISS(14]: Should this be under all plans?
FWC Packet - February 21, 2019 60 of 68

5 AAC 21.366. Northern District King Salmon Management Plan.
(a) The purpose of this management plan is to ensure an adequate escapement of king salmon
into the Northern District drainages and to provide management guidelines to the department.
The department shall manage the Northern District king salmon stocks primarily for sport and
guided sport uses in order to provide sport and guided sport fishermen with a reasonable
opportunity to harvest these salmon over the entire run as measured by the frequency of
inriver restrictions. The department shall manage the Northern District for the commercial
harvest of king salmon as follows:
[(10) IF THE DESHKA RIVER IS CLOSED TO SPORT FISHING, THE COMMISSIONER SHALL
CLOSE, BY EMERGENCY ORDER, THE COMMERCIAL KING SALMON FISHERY THROUGHOUT
THE NORTHERN DISTRICT FOR THE REMAINDER OF THE FISHING PERIODS PROVIDED FOR
UNDER THIS SECTION;]
(10) If the sport fishery on the Deshka River,
(A) is closed or if retention of king salmon is prohibited then, the commissioner shall
close, by emergency order, the commercial king salmon fishery throughout the
Northern District for the remainder of the fishing periods provided for under this
section; or
(B) is restricted to retention of king salmon under 32 inches or less in length as
measured from the tip of snout to tip of tail then the commissioner shall, by
emergency order, reduce the time allowed per fishing period provided for in this
section to no more than six hours in duration.
(11) If the sport fishery on the Little Susitna River,
(A) is closed or if retention of king salmon is prohibited then, the commissioner shall
close, by emergency order, the commercial king salmon fishery in the Eastern Sub
district of the Northern District for the remainder of the fishing periods provided for
under this section;
(B) is restricted to retention of king salmon under 32 inches or less in length as
measured from the tip of snout to tip of tail then the commissioner shall, by
emergency order, reduce the time allowed per fishing period provided for in this
section to no more than six hours in duration.
(10) If the Deshka River pre-season forecast projects the run to be below the sustainable
escapement goal, the commissioner may, by emergency order,
(A) close the commercial king salmon fishery throughout the Northern District for
the remainder of the fishing periods provided for under this section; or
(B) reduce the time allowed per fishing period provided for in this section to no more
than six hours in duration.
Commented [ISS(15]: Fix both (9), which deals with reducing fishing area if the Theodore, Lewis, or Ivan rivers are closed to sport fishing and (11), which deals with reducing area if sport fishing in the Chuitna River is closed so DCF doesn’t have to EO the area closed every year. The whole area down to the wood chip dock should be closed in regulation to commercial fishing during the king season since sport fisheries are closed by regulation. See example in (13) below for the Chuitna.
Commented [ISS(16]: King salmon GSI sampling 2014-2016 shows more Knik-Turnigan kings harvested in the General Subdistrict (north; stat areas 41,32,43) than on the Eastside. 283 vs 90 in 2014, 611 vs 202 in 2015, and 404 vs 365 in 2016
Commented [ISS(17]: An alternate way to write this plan would be to base commercial management directly off run projections. In this way both divisions would restrict or liberalize on the same abundance assessments. Here are some examples.
FWC Packet - February 21, 2019 61 of 68

(11) If the inseason Deshka River run projection is below the sustainable escapement
goal, the commissioner may, by emergency order, close the commercial king salmon
fishery throughout the Northern District for the remainder of the fishing periods
provided for under this section;
(12) If the inseason Little Susitna River run projection is below the sustainable
escapement goal, the commissioner may, by emergency order, close the commercial king
salmon fishery in the General subdistrict east of the Susitna River and in all of the Eastern
subdistrict for the remainder of the fishing periods provided for under this section; or
(12) If the inseason Little Susitna River run projection is below the sustainable
escapement goal the commissioner may, by emergency order, reduce the time allowed
per fishing period provided for in this section to no more than six hours in duration
throughout the Northern District
(13) if the Chuitna River is closed to sport fishing, [THE COMMISSIONER SHALL CLOSE,
BY EMERGENCY ORDER,] the area from a point at the wood chip dock located
approximately at 61° 02.77′ N. lat., 151° 10.04′ W. long., to the Susitna River is closed to
commercial king salmon fishing for the remainder of the directed king salmon fishery.
FWC Packet - February 21, 2019 62 of 68
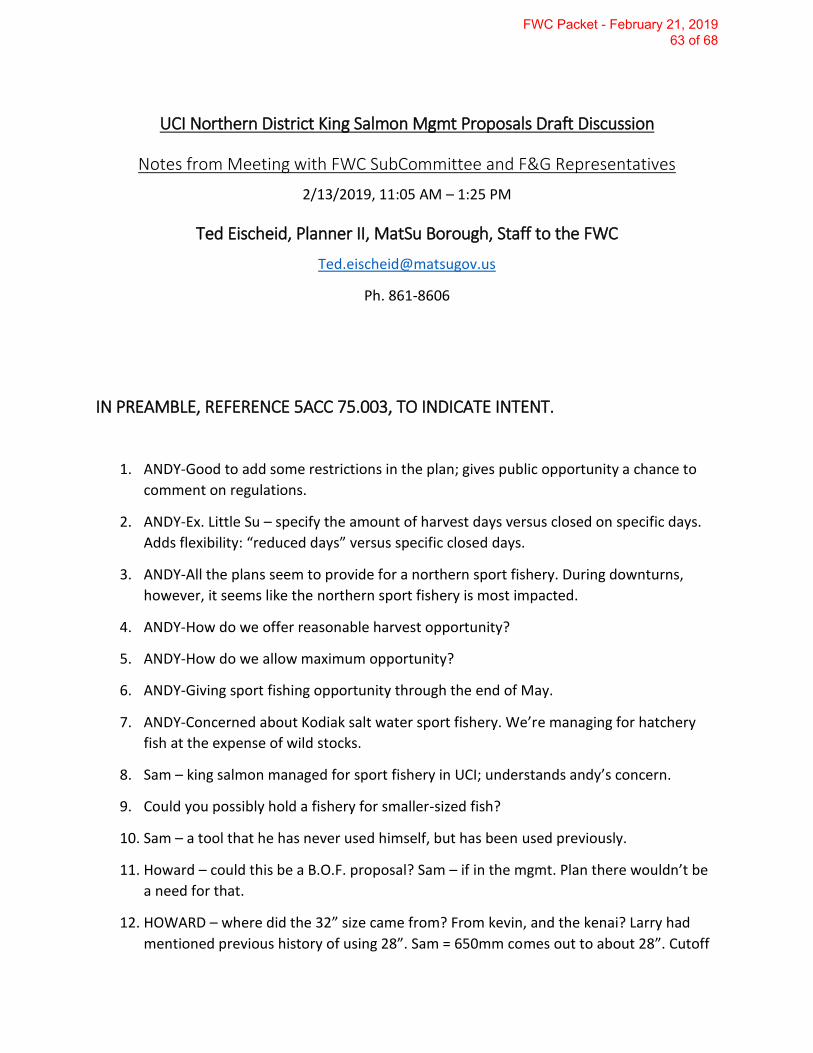
UCI Northern District King Salmon Mgmt Proposals Draft Discussion
Notes from Meeting with FWC SubCommittee and F&G Representatives
2/13/2019, 11:05 AM – 1:25 PM
Ted Eischeid, Planner II, MatSu Borough, Staff to the FWC
Ph. 861-8606
IN PREAMBLE, REFERENCE 5ACC 75.003, TO INDICATE INTENT.
1. ANDY-Good to add some restrictions in the plan; gives public opportunity a chance to
comment on regulations.
2. ANDY-Ex. Little Su – specify the amount of harvest days versus closed on specific days.
Adds flexibility: “reduced days” versus specific closed days.
3. ANDY-All the plans seem to provide for a northern sport fishery. During downturns,
however, it seems like the northern sport fishery is most impacted.
4. ANDY-How do we offer reasonable harvest opportunity?
5. ANDY-How do we allow maximum opportunity?
6. ANDY-Giving sport fishing opportunity through the end of May.
7. ANDY-Concerned about Kodiak salt water sport fishery. We’re managing for hatchery
fish at the expense of wild stocks.
8. Sam – king salmon managed for sport fishery in UCI; understands andy’s concern.
9. Could you possibly hold a fishery for smaller-sized fish?
10. Sam – a tool that he has never used himself, but has been used previously.
11. Howard – could this be a B.O.F. proposal? Sam – if in the mgmt. Plan there wouldn’t be
a need for that.
12. HOWARD – where did the 32” size came from? From kevin, and the kenai? Larry had
mentioned previous history of using 28”. Sam = 650mm comes out to about 28”. Cutoff
FWC Packet - February 21, 2019 63 of 68

between 4 and 5 year old is 28”. Older fish >28” are the most productive/females. FWC
subcommittee okay with 28” – need to bring to FWC.
13. Mike – Are we trying to introduce three mgmt. plans, or one inclusive mgmt.. plan?
Andy – there are no inclusive plans. Mike likes that F/G writing down what they are
doing; desire to have a mgmt. plan for Susitna, and making sure sport fishery knows F/G
intentions for regs in November prior to next angling year. Ultimate goal? Our priorities?
Write down what we are doing, but don’t make it complicated (Kevin).
a. Sam-want purpose to reflect desire to be transparent, and to provide clear
proposal purpose.
14. Howard – p. 5 – do you foresee escapement range changing over time? Howard prefers
to leave goal in plan.
a. Sam – it has been done both ways, both a number and a reference to a number.
Goals change, need to be flexible to making change. Once changed, goal will
probably stay viable for a couple board cycles.
b. Howard – how can we make this clearer to someone reading this.
c. Andy agrees. But goal should be revised to an older age class since F/G
projections are based on older age classes. Projection vs. goal.
d. Sam – forecast does include all age classes, but jacks previously weren’t a very
big component.
e. Andy – your projections aren’t looking at all the fish (like the smaller fish).
f. Sam – when goal is revised it will be based on all the fish.
g. Andy – managing by size, protecting the larger females, might minimize impact
of low return years since the most productive segment is protected.
h. Sam – all fish goal is more simplistic, as is all fish forecast. Likely to see future
forecast by age class. Doing a local experiment this year to determine size class
via video going through weir.
15. Howard – why did you take “in river” out so often?
a. Sam- “in river” more applicable to the Kenai where you have a specific goal for a
specific point in the river; or it can mean what hits the mouth of a river. “Pre-
season forecast” better than “in river”. Eliminated “in river” for clearer language.
b. There were alot of tracked changes for grammatical changes; be sure to cross
reference with the original plan to be sure there are no issues in the editing.
16. Howard – replacing shall with may?
FWC Packet - February 21, 2019 64 of 68
a. Andy – Kevin suggested shall on some items.
b. Sam – “may” gives flexibility more so than “shall”.
17. Howard: Item 4 on page 5: why all these prohibitions if you are falling within the SEG?
a. Sam – you might be at the bottom of SEG, and missed it last couple years, so you
might want to err on the conservative side.
18. Howard – like “multiple hooks” addition on p. 6.
19. Mike – some advantages to retention of smaller fish. Hard to differentiate between
species when they are fresh and similar sized.
20. Andy – Deska:
a. we are managing through a season, but not an entire run in reality – consider
changing;
b. single hook item on p. 6, item 5: we’ve been going to single hook as a standard
restriction – SAM: we go to single hook when we go to non-retention. Andy – we
are going to single hook here for a different reason. SAM – I can see what you
are saying. Andy – what you’ve been doing is when you take bait away you are
going to single hook. SAM – add prohibit retention of kings -add prohibit
multiple hooks. Andy – same goes with ‘b’. SAM – whenever you prohibit
retention you go “prohibit multiple hooks”.
c. “F” on top of page 6: strike the numbers, just keep “increase bag and possession
limit.”
d. P. 5 b. 3i. Restrict use of bait. Change to “prohibit use of bait.”
21. Little Su plan:
a. C2B4 – Sam will fix.
b. “B” language on how to start a season? Can use language similar to what is used
on the Yentna (“b”).
c. C2 – Howard – add “(see …) or take out some language, but reference “b”. Take
out “forecast”. Andy – interest in not prohibiting forecasts sometime in the
future. Sam – okay to put forecast in for the Deshka plan.
d. C2B – Howard: drop forecast and in river/in river run. Change 32 to 28.
e. C3 – change shall to may.
f. Sam – down the road if we develop forecasting tools for the east side group we
might want to expand/use this.
FWC Packet - February 21, 2019 65 of 68

g. Andy-c2A: do we want to add the allowance for harvest of small kings?
i. Sam – would be hard to justify.
ii. Andy – once Little Su went to catch and release, it got very little
pressure. Under this scenario everyone went to the Deshka. If you had a
take of smaller fish, people will take the small fish, males, and they will
be done fishing. Opportunity for sport fishery without a lot of impact on
the fishery itself because of the component of the population being
taken.
iii. Sam – I’d opt to keep it out.
iv. Howard – first priority to get mgmt. plan out, then tweak later.
1. Andy is good with that.
h. Howard – p. 7 multiple hooks?
i. Andy B4c2b4 – discusses reduced days harvest; might want another scenario….
Sam has a note on that. If powerboat restrictions came about.
22. Yentna and Susitna
a. Sam – comment 11 – those are the usual restrictions – do you want me to split
out the Susitna/Yentna plan section out into east side… or leave it as it is now?
Might be easier for people to write down what we are doing for each section?
i. Howard/Andy – makes sense to split it out.
b. Page 8, c – Sam will wordsmith the language to include intent.
i. Andy could provide a draft on this; put intent language into the purpose;
Andy willing to draft language to email to Sam for consideration.
23. Andy – if there are any deal breakers, his main interest is getting the plan developed and
is flexible on getting to the end result. Sam = same. Plan shows how we are managing,
gives F/G more tools for mgmt..
24. Howard – do you think the Dept. will support this tentative plan before the BOF?
a. Sam – problems with previous plans was that they were too specific, too robotic.
Using general language makes the plan more workable and acceptable. This plan
gives guidance on regulations.
25. Mike - Whatever gives you freedom to open up northern regions fisheries would be
helpful. If the plan gives you this flexibility to provide fishing opportunity in northern
regions that would be good.
FWC Packet - February 21, 2019 66 of 68

26. Andy – Does the Yentna portion give you enough flexibility?
a. P. 8b – Sam likes that language.
27. Andy – Little Su – should we have something here adding shifts effort? Sam will add
language.
28. Northern District
a. Sam – fix request from Tom – item 13 proposed.
i. Mike – some question about this. Writing an EO, etc. Some clarification
ensues. Mike suggests taking the step out; Howard suggest keeping it the
way it is – removing the bracketed part [the commissioner shall close, by
EO].
ii. Sam – Kevin perhaps left the added parts out to focus on other parts.
b. Sam – as written commercial actions are tied to sport actions… see added
portions 10 – do you want to be sure a specific CF action when a SF occurs, or do
you want to preserve flexibility to both divisions.
i. Andy: B would be a significant change. B is not a reasonable sharing
conservation burden proposal.
c. Sam – because of the allocative nature of this part, how do you want to pair CF
and SF actions?
i. Andy – part of the CF/SF actions haven’t been consistent. Wants both to
share the conservation burden.
1. Sam – FWC should brainstorm how to best share the conservation
burden… Add or delete what you want in this section.
2. Mike – we need to explore this section when we are fresher. Need
consistency here in regs/ this paired restriction business is messy.
3. Howard – item B – add phrase: if SF opportunity is allowed but
restricted, with limits on SF, then 6 hour restriction to CF kicks in.
If SF is shut down, CF is shut down. Thinks public appreciates
paired restrictions.
4. Andy – FWC SC needs to discuss this internally further. Sam
concurs.
5. Sam – CF has been managing under …; … Deshka is key.
FWC Packet - February 21, 2019 67 of 68
6. Mike – 6 hour restriction, because of the 12 hour tide cycle, has
impacts on CF set netting.
d. Sam – see comment 16 – be aware of this.
e. Sam – can offer any data needed.
I had to leave at 1:25 PM before the meeting had formally ended. Any further discussion after
my departure isn’t captured here. TE
FWC Packet - February 21, 2019 68 of 68